Embed Size (px)
Citation preview
Plant Physiol. (1990) 93, 1083-10880032-0889/90/93/1 083/06/$01 .00/0
Received for publication October 19, 1989Accepted March 15, 1990
Patterns of Chlorophyll Fluorescence Kinetics in Relation toGrowth and Expansion in Cucumber Leaves1
Judith G. Croxdale* and Kenji Omasa
Department of Botany, University of Wisconsin, Madison, Wisconsin 53706 (J.G.C.), and National Institute forEnvironmental Studies, Japan Environment Agency, Onogawa, Tsukuba, Ibaraki 305, Japan (K.O.)
ABSTRACT MATERIALS AND METHODS
Photochemical development was studied in developing cucum-ber (Cucumis sativus L. cv Hokushin) leaves to determine if thespatial pattern coincided with relative growth rates of expandingleaves, intercalary cell division, or position relative to the vasculartissue. Both leaf surfaces undergo a series of similar changes inchlorophyll a fluorescence kinetics, but the upper surface morequickly achieved the characteristic response. Imaging of fluores-cence showed an individual developing leaf has four regionsdiffering in kinetics, but these regions do not coincide with areasof increasing relative growth rate. Two of these regions lie at theleaf edge and their divergent kinetics may be related to structuraland physiological features present at this position. A third areawith different kinetics, in the basal region of the leaf, is spatiallyconsistent with primordial regions that are clonal during devel-opment. The correspondence between areas of clonal growthand specific fluorescence kinetics indicates that cells of commonancestry show functional uniformity. No evidence was found thatthe proximity of the vascular tissue influenced development ofphotochemical function.
The attainment of photosynthetic competency in angio-sperm leaves is regulated by light and by developmentalfactors. Unlike monocots such as wheat (2), cucumber leavesare not photochemically competent when first exposed tolight, but acquire competency over an extended time period,6 d or more in the light (5). Within these leaves photochemicalactivity is not homogeneous, but develops basipetally as
shown by Chl a fluorescence transients. These data indicatethat the primary regulation ofthe development ofphotochem-ical activity lies with developmental factors, not light (5).Although the attainment of characteristic fluorescence tran-
sients progresses in a basipetal direction, mirroring the generaldirection ofexpansion and growth ofthe leaf (5), the influenceof developmental factors from cells and tissues within theleaves has not been studied. The objective of the presentresearch was to determine ifthe spatial pattern ofphotochem-ical development coincided with leaf expansion and relativegrowth rates, intercalary cell division, or position relative tothe vascular tissue. With the availability of dynamic imagingof Chl a fluorescence (10), a precise, nondestructive means ofstudying these influences exists.
'Supported by a National Science Foundation grant (JGC).
Plant Materials and Leaf Area Measurements
Cucumber (Cucumis sativus L. cv Hokushin) plants weregrown as previously described (10) for up to 5 weeks. Forfluorescence and gas exchange measurements, plants werebrought from the controlled-environment greenhouse to thelaboratory and allowed to acclimate for about 2 h. Plants weredark-incubated for at least 30 min before fluorescence induc-tion. No appreciable differences in induction kinetics wereobserved with longer dark periods. Leaves monitored forfluorescence and assimilation were intact and remained at-tached until all measurements on the plant were completed.Leaf area was measured with a LI 3100 area meter (LI-COR,Lincoln, NE).
Chi a Fluorescence Measurements
A portable Kautsky apparatus (Richard Branker ResearchLtd., Plant Productivity Meter, SF-20) was used to monitorfluorescence on both leaf surfaces at a position midway be-tween the margin and midvein. Light of 670 nm at 40 ,umolphotons m-2 s-' was used for excitation and fluorescence wasmeasured at >710 nm. Data were collected at 30 ms intervalsover a period of 400 s, stored, and analyzed by computer.
Imaging System for Measuring Chl FluorescenceInduction
As previously described in detail (10), this system consistsof a video camera with a charge coupled device imager andappropriate filters interfaced to a time code generator andvideo tape recorder. Images of the entire leaf were collectedat intervals of 17 ms, digitized by an analog to digital conver-tor, stored on an optical disc, and then analyzed by computer.Two xenon lamps (380-620 nm) were used to illuminateevenly (±10%) the entire upper leaf surface at a flux densityof 150 ,umol photons m-2 s-'; fluorescence was measured at683 nm. Five data points from each measured area wereanalyzed and the data averaged. The kinetics of each datapoint were examined prior to averaging in order that spatialdeviations in kinetics were not overlooked.
Fluorescence Data
The kinetic data are displayed as single curves on a log timescale. While this time basis changes the overall appearance of
1083
CROXDALE AND OMASA
Leaf 5 fluorescence curves, the presentation gives good resolution of150 K7.5 CM2 the fast phases of fluorescence and compresses the slow phases
of the signal, but without loss of important characteristics offluorescence induction. The terminology of Lavorel and Et-
100 tienne (10) is used to identify the consecutive phases of thefluorescence induction signals (I, D, P, S, M, T2) and theirinterpretation is based on established criteria (4, 7, 8, 11, 19,
50 ..27).
Assimilation Measurements0 .
Measurements were made by an apparatus previously de--
scribed (17). Briefly, air was mixed from N2, 02, and 3% v/vfLeaf
CO2 in air using mass flow controllers. Some of this synthetic
\83cmr? air passed through an aluminum leaf chamber. The air flow
100 - nf .. . - _ through the chamber was controlled by a mass flow controller...0 : ASome of the synthetic air and air from the leaf chamber wascompared for water content and C02 content with an IR gasanalyzer. Cross-sensitivity of the CO2 measuring section to
50 water was eliminated by condensing the water out of the airas the air passed from the water measuring tube to the CO2measuring tube. Leaf temperature was measured with a cop-
0-------per-constantan thermocouple probe. Calculations of assimi-..lllation were made according to von Caemmerer and Farquhar
150 (26). Light was provided by a quartz halogen lamp and flux(1) 210cm2e density was the same as that used for fluorescence measure-
ments. Water content was measured with a Dew 10 (Generala)100 Eastern) dew point hygrometer.
RESULTSa) 50C.) The development of photochemical activity in the Hoku-C
shin cultivar of cucumber (Cucumis sativus L.) was estab-a) 0-lished by measuring fluorescence transients on the upper andU)O __________------------------------------- lower leaf surfaces of 3-week-old plants (Fig. 1, upper tracesa) are from the upper leaf surfaces). Three-week-old plants have
150 Leaf2 5 leaves expanded away from the main bud. Only the first0 e196cm2 leaf produced, leaf 1, has completed its expansion; the re-00 ^-\_
maining leaves still growing. Only on the oldest leaf (Fig.U 10. 1, leafl) did both leaf surfaces show characteristic fluores
cence transients. The slow and fast phases of fluorescencekinetics appeared more quickly on the lower surface of this
50 leaf than on the upper surface; however, the initial level offluorescence and its peak value were greater on the upper sideof the leaf.
0-----In developing leaves (Fig. 1, leaves 5 to 2), characteristic
2Abbreviations: I, D, P, S, M, T, inflection points of Chl a150 Leaf 1 fluorescence kinetics where I is intermediary level, D is dip, P is peak,9>34cm2
S is quasi-stationary level, M is second maximum, and T is terminal
100 * *~~~~~~~~~~~~-~~~~level.100 . . f
50 Figure 1. Fluorescence induction transients on the upper and lowersurfaces in the five leaves of a 21-d-old cucumber plant. Plants wereCucumis sativus L. dark-incubated for at least 30 min before measurement 40 Jmol
cv. Hokushin photonsm -2S-1; upper traces are from the upper leaf surfaces. An
0----- outline of each measured leaf appears with its leaf number and area
to the left of its fluorescence induction traces; the outlined images0.001 0.01 0.1 1.0 10 100 are reductions, but not to scale.
Time [SI
1 084 Plant Physiol. Vol. 93,1990
PATTERNS OF FLUORESCENCE AND GROWTH IN DEVELOPING LEAVES
200
C D
10 -0-....-.-..-......-.-..-.. -I . . .A-~~~~~~~~~~~~~~~~~~~~~~~~~~~~~~~~~..
..-.-....-.. .:.::..:... ..:... ::......A!:. ...................... .
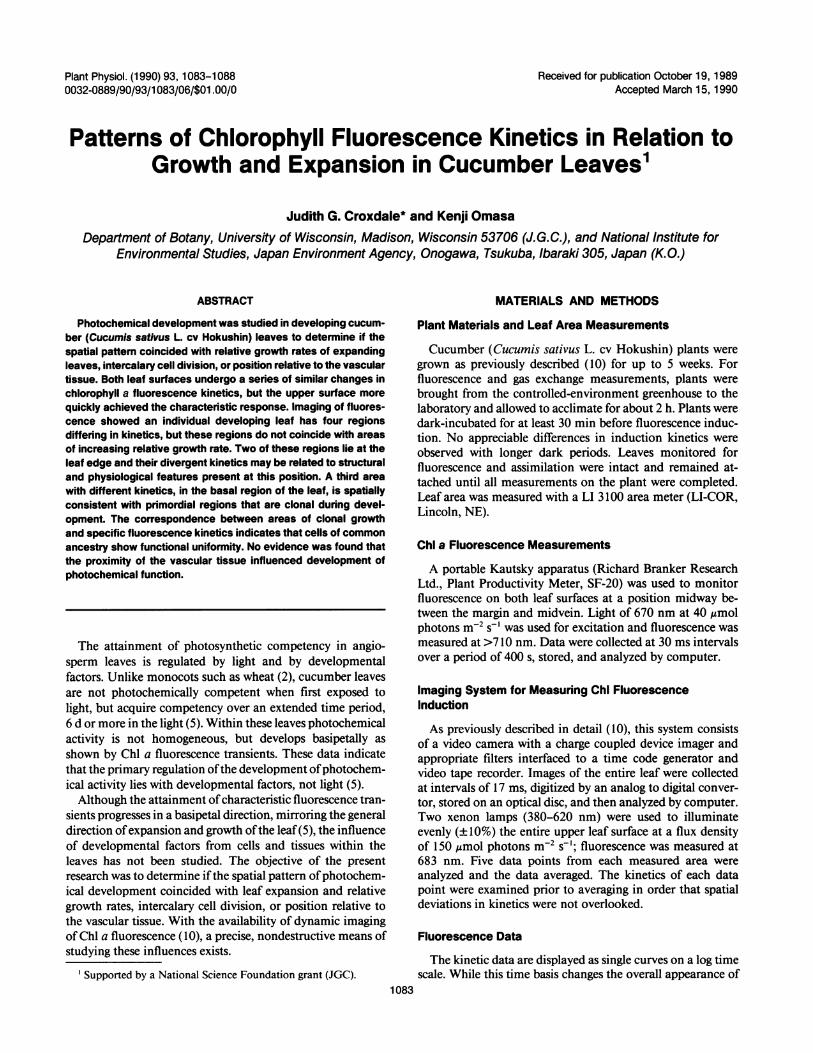
' " ' ' ' ~~. '~~~~~~~~~............................................ Figure 2. Diagram of a developing leaf (theeighth leaf from the bottom of a 31 -d-old cucum-ber plant) in which Chi a fluorescence was dy-namically imaged; the sample points within areasare marked with solid circles on the diagram.The regions with areas of common kinetics (A,B, C, and D) are differentially shaded on thediagram. A curve representative of each regionappears below the leaf diagram; the area undereach curve has been shaded for ease in distin-guishing the kinetics among regions. The cuc-umber plant was dark-incubated for 30 min priorto measurement at 150 Mmol photons m-2 S-1.
0.01 0.1 1.0 10.0 100 1000 0.01 O.1 1.0 10.0 100 1and
Time [S]
fluorescence transients developed slowly on each surface withthe upper side achieving typical fluorescence kinetics sooner
than the lower surface. On the upper surface the kinetics firstconsisted of I, D, and a broad P on the smallest leaf and were
then followed by the presence of an extended S region and an
expanded M peak on leaf 4. In the next older leaf, P was
quenched more rapidly, but M remained broad. The twooldest foliage leaves showed an increase in the time to P anda slight decrease in the rate of rise; the S to M to T transientswere typical of mature leaves. On the lower surface, P was
broad in the beginning and showed slow quenching through-out development. Typical transients includingM were presentonly on the oldest leaf. Variable fluorescence was greater onthe upper surface throughout leaf development (Fig. 1) withleaf 3 showing the largest difference between the two leafsurfaces.The regional differences in fluorescence response of devel-
oping leaves known in the Natsusairaku cultivar ofcucumber(5) were studied in this variety by dynamic imaging. A singleleaf (similar to leaf 4 in Fig. 1) was used to determine theexact locations of variation in fluorescence kinetics. Analysisof approximately 150 points within representative areas ofthe upper side of the leaf showed four areas with differentkinetics (Fig. 2). The different transients occurred at the tips(Fig. 2A), in a submarginal position (Fig. 2B), in the distaltwo-thirds of the blade (Fig. 2C), and in the basal one-thirdof the blade (Fig. 2D).
In the tip areas, at the terminus and along the leaf margin(Fig. 2A), the fluorescence response consisted of a single,
broad P peak. These extreme tip regions may never becomephotochemically competent because equivalent areas of older,mature leaves showed the same kinetics (data not shown). Inthe submarginal position (Fig. 2B), the I, D, P, and M tran-sients were present, but the initial level of fluorescence wasreduced relative to the tip areas, although peak fluorescencewas approximately the same. The interveinal areas in thedistal portion ofthe leaf (Fig. 2C) showed typical fluorescencekinetics, with all transients present. However, the proximalregion of the leaf (Fig. 2D) was characterized by kineticswithout a well-defined M peak; I and D were also absent.To examine the development of the spatial and temporal
patterns of fluorescence in greater detail, a single area of a
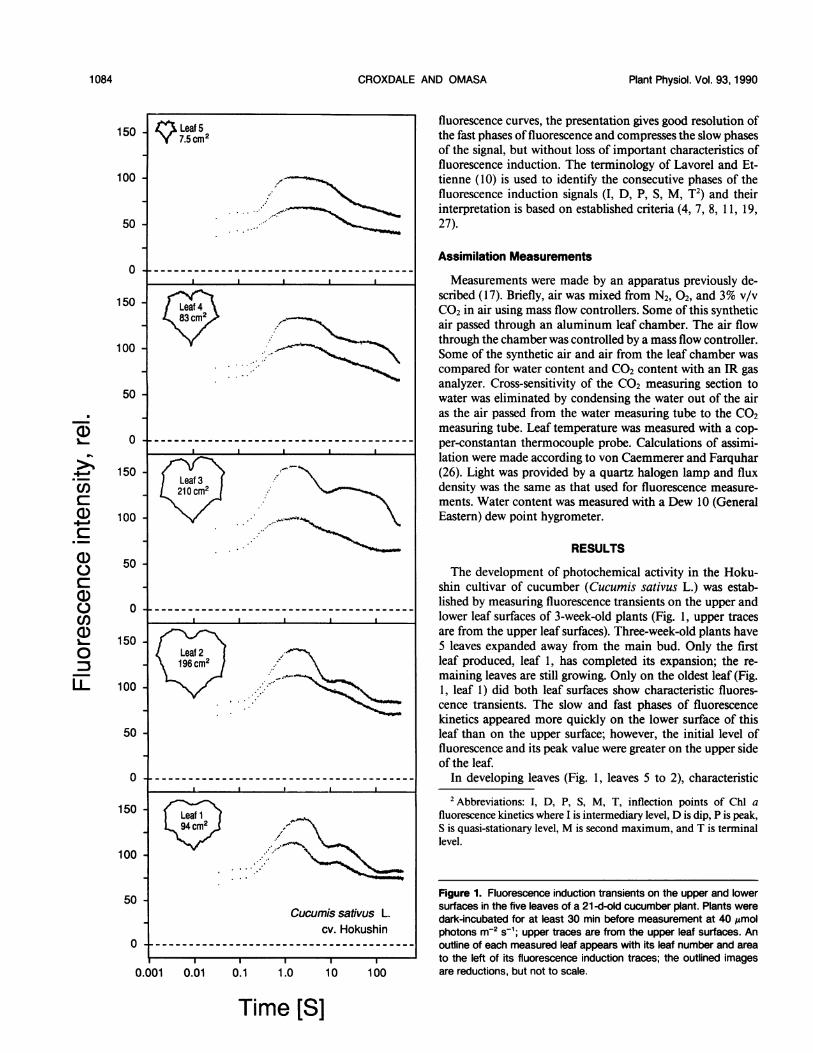
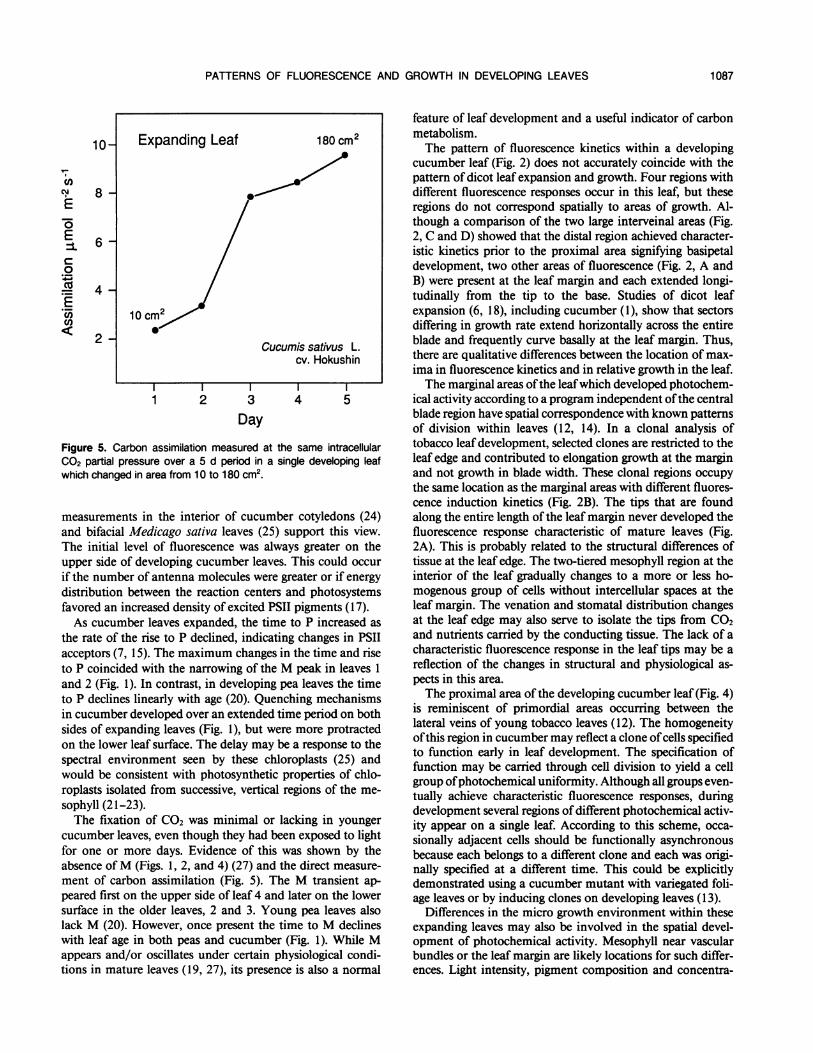
young leaf from a plant 33 d old was imaged on 3 consecutived (Fig. 3). The leaf was the tenth from the base and appearedat the edge of the main bud when the plant was between 28and 31 d old. The leaf area measured was 20% of fullexpansion on the first day it was imaged and 35% expandedon the third day of imaging. Thirteen sampling regions wereselected for analysis and the sample points were relocatedeach day on the digitized images (Fig. 3). Within the areaimaged, data are presented from three of the thirteen regionsbased on their position with respect to the leaf tip, the mid-vein, and the margin. Data from the other ten regions showedthe same pattern of changing fluorescence kinetics. Therewere no discernible changes in kinetics that were positiondependent.The three regions showed similar kinetics on each day and
similar changes from day to day. On the 1st d, the transients
AB~~~~~~~~~~~~~~~~~~~~~~
0
>~ 1 0UnC),
C)o 2C0 2
coa) iC0
1 085
A
CROXDALE AND OMASA
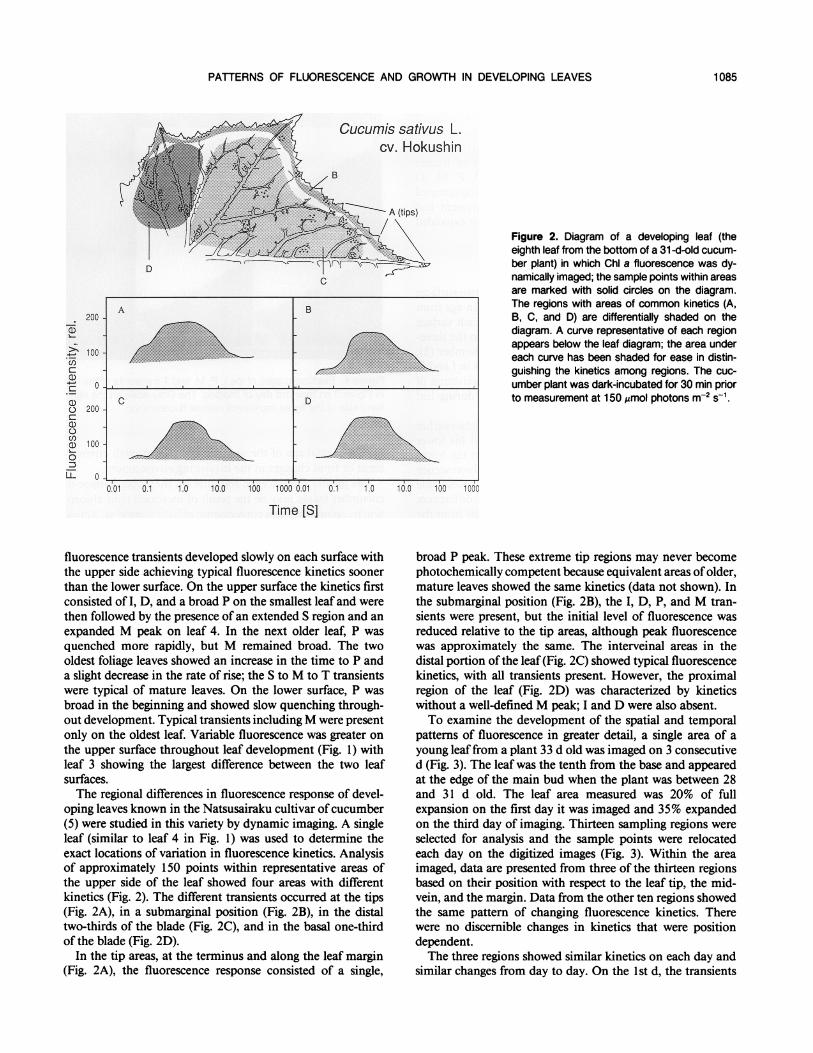
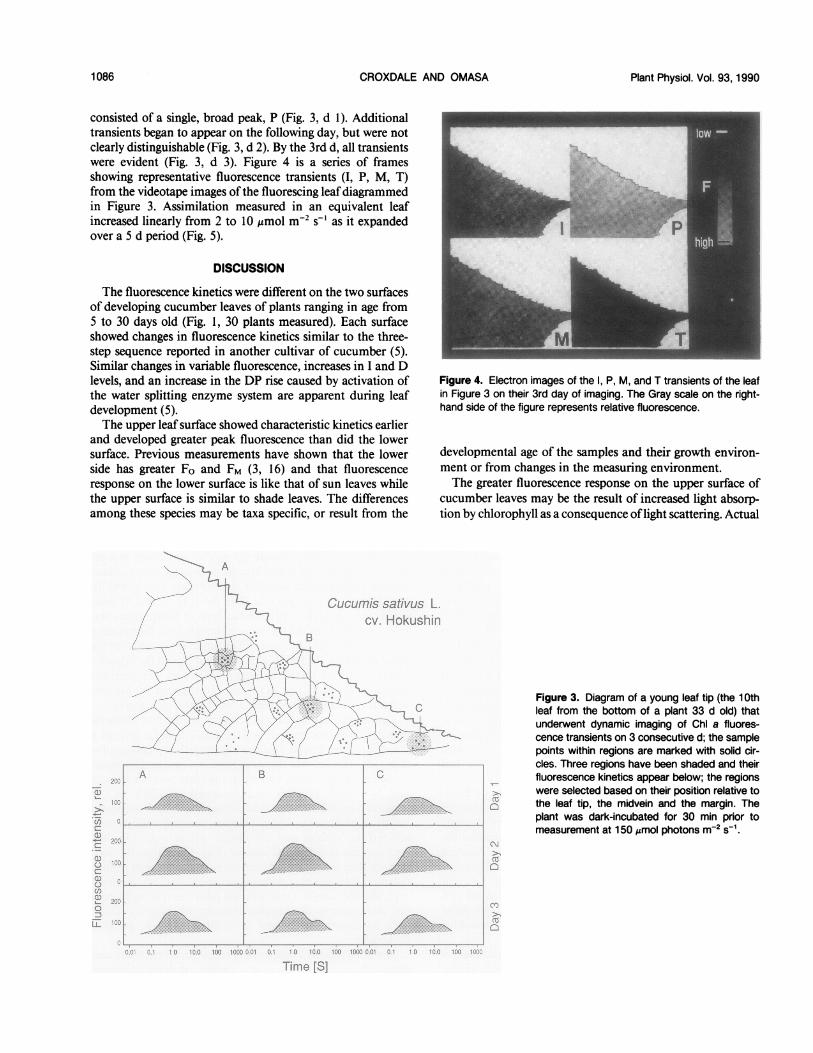
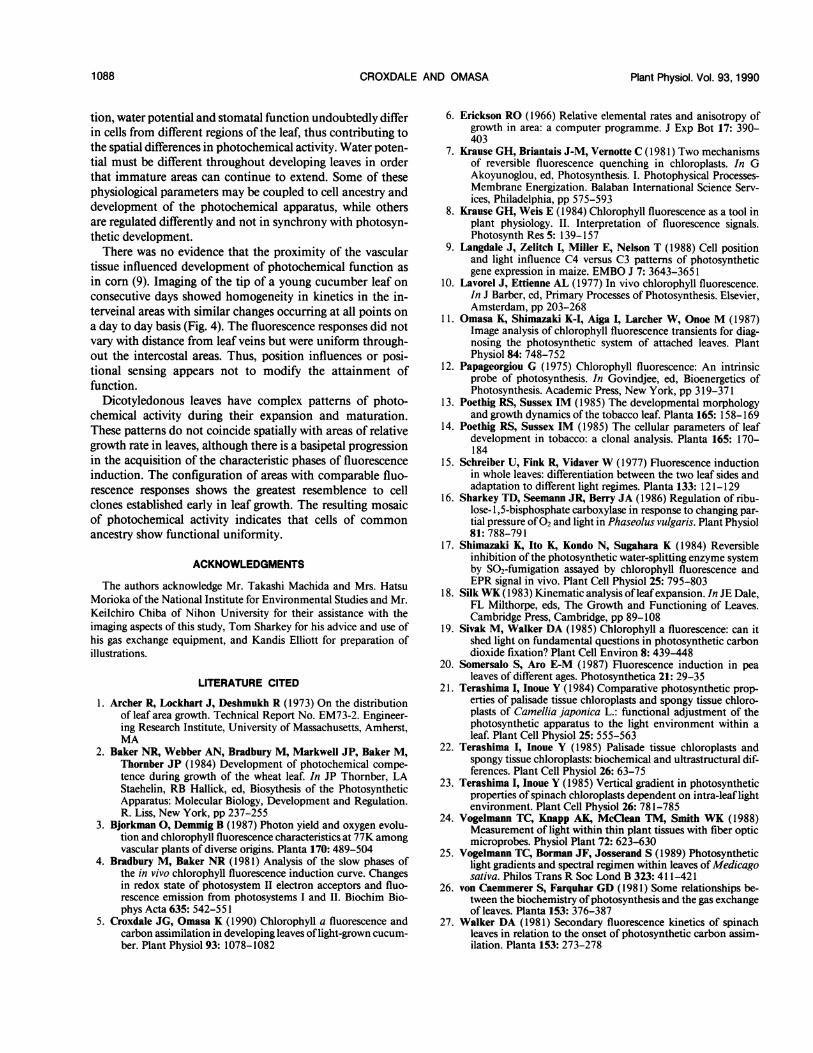
consisted of a single, broad peak, P (Fig. 3, d 1). Additionaltransients began to appear on the following day, but were notclearly distinguishable (Fig. 3, d 2). By the 3rd d, all transientswere evident (Fig. 3, d 3). Figure 4 is a series of framesshowing representative fluorescence transients (I, P, M, T)from the videotape images ofthe fluorescing leafdiagrammedin Figure 3. Assimilation measured in an equivalent leafincreased linearly from 2 to 10 ,umol m-2 s-' as it expandedover a 5 d period (Fig. 5).
DISCUSSION
The fluorescence kinetics were different on the two surfacesof developing cucumber leaves of plants ranging in age from5 to 30 days old (Fig. 1, 30 plants measured). Each surfaceshowed changes in fluorescence kinetics similar to the three-step sequence reported in another cultivar of cucumber (5).Similar changes in variable fluorescence, increases in I and Dlevels, and an increase in the DP rise caused by activation ofthe water splitting enzyme system are apparent during leafdevelopment (5).The upper leaf surface showed characteristic kinetics earlier
and developed greater peak fluorescence than did the lowersurface. Previous measurements have shown that the lowerside has greater Fo and FM (3, 16) and that fluorescenceresponse on the lower surface is like that of sun leaves whilethe upper surface is similar to shade leaves. The differencesamong these species may be taxa specific, or result from the
Figure 4. Electron images of the 1, P, M, and T transients of the leafin Figure 3 on their 3rd day of imaging. The Gray scale on the right-hand side of the figure represents relative fluorescence.
developmental age of the samples and their growth environ-ment or from changes in the measuring environment.The greater fluorescence response on the upper surface of
cucumber leaves may be the result of increased light absorp-tion by chlorophyll as a consequence oflight scattering. Actual
7s'z sativulity-.loku sr
I/
Figure 3. Diagram of a young leaf tip (the 10thleaf from the bottom of a plant 33 d old) thatunderwent dynamic imaging of Chl a fluores-cence transients on 3 consecutive d; the samplepoints within regions are marked with solid cir-cles. Three regions have been shaded and theirfluorescence kinetics appear below; the regionswere selected based on their position relative tothe leaf tip, the midvein and the margin. Theplant was dark-incubated for 30 min prior tomeasurement at 150 /smol photons m-2 Si1.
I/--
1 086 Plant Physiol. Vol. 93,1990
111.
PATTERNS OF FLUORESCENCE AND GROWTH IN DEVELOPING LEAVES
10-
8 -
6 -
4 -
2 -
Expanding Leaf
10 cm2
180 cm2
Cucumis sativus L.cv. Hokushin
1 2 3 4 5Day
Figure 5. Carbon assimilation measured at the same intracellularC02 partial pressure over a 5 d period in a single developing leafwhich changed in area from 10 to 180 cm2.
measurements in the interior of cucumber cotyledons (24)and bifacial Medicago sativa leaves (25) support this view.The initial level of fluorescence was always greater on theupper side of developing cucumber leaves. This could occurif the number of antenna molecules were greater or if energydistribution between the reaction centers and photosystemsfavored an increased density of excited PSII pigments (17).As cucumber leaves expanded, the time to P increased as
the rate of the rise to P declined, indicating changes in PSIIacceptors (7, 15). The maximum changes in the time and riseto P coincided with the narrowing of the M peak in leaves 1and 2 (Fig. 1). In contrast, in developing pea leaves the timeto P declines linearly with age (20). Quenching mechanismsin cucumber developed over an extended time period on bothsides of expanding leaves (Fig. 1), but were more protractedon the lower leaf surface. The delay may be a response to thespectral environment seen by these chloroplasts (25) andwould be consistent with photosynthetic properties of chlo-roplasts isolated from successive, vertical regions of the me-sophyll (2 1-23).The fixation of CO2 was minimal or lacking in younger
cucumber leaves, even though they had been exposed to lightfor one or more days. Evidence of this was shown by theabsence ofM (Figs. 1, 2, and 4) (27) and the direct measure-ment of carbon assimilation (Fig. 5). The M transient ap-peared first on the upper side of leaf 4 and later on the lowersurface in the older leaves, 2 and 3. Young pea leaves alsolack M (20). However, once present the time to M declineswith leaf age in both peas and cucumber (Fig. 1). While Mappears and/or oscillates under certain physiological condi-tions in mature leaves (19, 27), its presence is also a normal
feature of leaf development and a useful indicator of carbonmetabolism.The pattern of fluorescence kinetics within a developing
cucumber leaf (Fig. 2) does not accurately coincide with thepattern of dicot leaf expansion and growth. Four regions withdifferent fluorescence responses occur in this leaf, but theseregions do not correspond spatially to areas of growth. Al-though a comparison of the two large interveinal areas (Fig.2, C and D) showed that the distal region achieved character-istic kinetics prior to the proximal area signifying basipetaldevelopment, two other areas of fluorescence (Fig. 2, A andB) were present at the leaf margin and each extended longi-tudinally from the tip to the base. Studies of dicot leafexpansion (6, 18), including cucumber (1), show that sectorsdiffering in growth rate extend horizontally across the entireblade and frequently curve basally at the leaf margin. Thus,there are qualitative differences between the location of max-ima in fluorescence kinetics and in relative growth in the leaf.The marginal areas ofthe leafwhich developed photochem-
ical activity according to a program independent ofthe centralblade region have spatial correspondence with known patternsof division within leaves (12, 14). In a clonal analysis oftobacco leaf development, selected clones are restricted to theleaf edge and contributed to elongation growth at the marginand not growth in blade width. These clonal regions occupythe same location as the marginal areas with different fluores-cence induction kinetics (Fig. 2B). The tips that are foundalong the entire length of the leaf margin never developed thefluorescence response characteristic of mature leaves (Fig.2A). This is probably related to the structural differences oftissue at the leaf edge. The two-tiered mesophyll region at theinterior of the leaf gradually changes to a more or less ho-mogenous group of cells without intercellular spaces at theleaf margin. The venation and stomatal distribution changesat the leaf edge may also serve to isolate the tips from CO2and nutrients carried by the conducting tissue. The lack of acharacteristic fluorescence response in the leaf tips may be areflection of the changes in structural and physiological as-pects in this area.The proximal area of the developing cucumber leaf (Fig. 4)
is reminiscent of primordial areas occurring between thelateral veins of young tobacco leaves (12). The homogeneityofthis region in cucumber may reflect a clone ofcells specifiedto function early in leaf development. The specification offunction may be carried through cell division to yield a cellgroup ofphotochemical uniformity. Although all groups even-tually achieve characteristic fluorescence responses, duringdevelopment several regions of different photochemical activ-ity appear on a single leaf. According to this scheme, occa-sionally adjacent cells should be functionally asynchronousbecause each belongs to a different clone and each was origi-nally specified at a different time. This could be explicitlydemonstrated using a cucumber mutant with variegated foli-age leaves or by inducing clones on developing leaves (13).
Differences in the micro growth environment within theseexpanding leaves may also be involved in the spatial devel-opment of photochemical activity. Mesophyll near vascularbundles or the leaf margin are likely locations for such differ-ences. Light intensity, pigment composition and concentra-
(I)
EEN
C:0co
cn
1 087
CROXDALE AND OMASA
tion, water potential and stomatal function undoubtedly differin cells from different regions of the leaf, thus contributing tothe spatial differences in photochemical activity. Water poten-tial must be different throughout developing leaves in orderthat immature areas can continue to extend. Some of thesephysiological parameters may be coupled to cell ancestry anddevelopment of the photochemical apparatus, while othersare regulated differently and not in synchrony with photosyn-thetic development.
There was no evidence that the proximity of the vasculartissue influenced development of photochemical function as
in corn (9). Imaging of the tip of a young cucumber leaf onconsecutive days showed homogeneity in kinetics in the in-terveinal areas with similar changes occurring at all points on
a day to day basis (Fig. 4). The fluorescence responses did notvary with distance from leaf veins but were uniform through-out the intercostal areas. Thus, position influences or posi-tional sensing appears not to modify the attainment offunction.
Dicotyledonous leaves have complex patterns of photo-chemical activity during their expansion and maturation.These patterns do not coincide spatially with areas of relativegrowth rate in leaves, although there is a basipetal progressionin the acquisition of the characteristic phases of fluorescenceinduction. The configuration of areas with comparable fluo-rescence responses shows the greatest resemblence to cellclones established early in leaf growth. The resulting mosaicof photochemical activity indicates that cells of commonancestry show functional uniformity.
ACKNOWLEDGMENTS
The authors acknowledge Mr. Takashi Machida and Mrs. HatsuMorioka of the National Institute for Environmental Studies and Mr.Keilchiro Chiba of Nihon University for their assistance with theimaging aspects of this study, Tom Sharkey for his advice and use ofhis gas exchange equipment, and Kandis Elliott for preparation ofillustrations.
LITERATURE CITED
1. Archer R, Lockhart J, Deshmukh R (1973) On the distributionof leaf area growth. Technical Report No. EM73-2. Engineer-ing Research Institute, University of Massachusetts, Amherst,MA
2. Baker NR, Webber AN, Bradbury M, Markwell JP, Baker M,Thornber JP (1984) Development of photochemical compe-
tence during growth of the wheat leaf. In JP Thornber, LAStaehelin, RB Hallick, ed, Biosythesis of the PhotosyntheticApparatus: Molecular Biology, Development and Regulation.R. Liss, New York, pp 237-255
3. Bjorkman 0, Demmig B (1987) Photon yield and oxygen evolu-tion and chlorophyll fluorescence characteristics at 77K amongvascular plants of diverse origins. Planta 170: 489-504
4. Bradbury M, Baker NR (1981) Analysis of the slow phases ofthe in vivo chlorophyll fluorescence induction curve. Changesin redox state of photosystemII electron acceptors and fluo-rescence emission from photosystems I and II. Biochim Bio-phys Acta 635: 542-551
5. Croxdale JG, Omasa K (1990) Chlorophyll a fluorescence andcarbon assimilation in developing leaves of light-grown cucum-ber. Plant Physiol 93: 1078-1082
6. Erickson RO (1966) Relative elemental rates and anisotropy ofgrowth in area: a computer programme. J Exp Bot 17: 390-403
7. Krause GH, Briantais J-M, Vernotte C (1981) Two mechanismsof reversible fluorescence quenching in chloroplasts. In GAkoyunoglou, ed, Photosynthesis. I. Photophysical Processes-Membrane Energization. Balaban International Science Serv-ices, Philadelphia, pp 575-593
8. Krause GH, Weis E (1984) Chlorophyll fluorescence as a tool inplant physiology. II. Interpretation of fluorescence signals.Photosynth Res 5: 139-157
9. Langdale J, Zelitch I, Miller E, Nelson T (1988) Cell positionand light influence C4 versus C3 patterns of photosyntheticgene expression in maize. EMBO J 7: 3643-3651
10. Lavorel J, Ettienne AL (1977) In vivo chlorophyll fluorescence.In J Barber, ed, Primary Processes of Photosynthesis. Elsevier,Amsterdam, pp 203-268
11. Omasa K, Shimazaki K-I, Aiga I, Larcher W, Onoe M (1987)Image analysis of chlorophyll fluorescence transients for diag-nosing the photosynthetic system of attached leaves. PlantPhysiol 84: 748-752
12. Papageorgiou G (1975) Chlorophyll fluorescence: An intrinsicprobe of photosynthesis. In Govindjee, ed, Bioenergetics ofPhotosynthesis. Academic Press, New York, pp 319-371
13. Poethig RS, Sussex IM (1985) The developmental morphologyand growth dynamics of the tobacco leaf. Planta 165: 158-169
14. Poethig RS, Sussex IM (1985) The cellular parameters of leafdevelopment in tobacco: a clonal analysis. Planta 165: 170-184
15. Schreiber U, Fink R, Vidaver W (1977) Fluorescence inductionin whole leaves: differentiation between the two leaf sides andadaptation to different light regimes. Planta 133: 121-129
16. Sharkey TD, Seemann JR, Berry JA (1986) Regulation of ribu-lose-1,5-bisphosphate carboxylase in response to changing par-tial pressureof 02 and light in Phaseolus vulgaris. Plant Physiol81: 788-791
17. Shimazaki K, Ito K, Kondo N, Sugahara K (1984) Reversibleinhibition of the photosynthetic water-splitting enzyme systemby S02-fumigation assayed by chlorophyll fluorescence andEPR signal in vivo. Plant Cell Physiol 25: 795-803
18. Silk WK (1983) Kinematic analysis of leaf expansion. In JE Dale,FL Milthorpe, eds, The Growth and Functioning of Leaves.Cambridge Press, Cambridge, pp 89-108
19. Sivak M, Walker DA (1985) Chlorophyll a fluorescence: can itshed light on fundamental questions in photosynthetic carbondioxide fixation? Plant Cell Environ 8: 439-448
20. SomersaloS, Aro E-M (1987) Fluorescence induction in pealeaves of different ages. Photosynthetica 21: 29-35
21. TerashimaI, InoueY (1984) Comparative photosynthetic prop-erties of palisade tissue chloroplasts and spongy tissue chloro-plasts of Camellia japonica L.: functional adjustment of thephotosynthetic apparatus to the light environment within aleaf. Plant Cell Physiol 25: 555-563
22. TerashimaI, InoueY (1985) Palisade tissue chloroplasts andspongy tissue chloroplasts: biochemical and ultrastructural dif-ferences. Plant Cell Physiol 26: 63-75
23. TerashimaI, InoueY (1985) Vertical gradient in photosyntheticproperties of spinach chloroplasts dependent on intra-leaf lightenvironment. Plant Cell Physiol 26: 781-785
24. Vogelmann TC, Knapp AK, McClean TM, Smith WK (1988)Measurement of light within thin plant tissues with fiber opticmicroprobes. Physiol Plant 72: 623-630
25. Vogelmann TC, Borman JF, Josserand S (1989) Photosyntheticlight gradients and spectral regimen within leaves of Medicagosativa. Philos Trans R Soc Lond B 323: 411-421
26. von CaemmererS, Farquhar GD (1981) Some relationships be-tween the biochemistry of photosynthesis and the gas exchangeof leaves. Planta 153: 376-387
27. Walker DA (1981) Secondary fluorescence kinetics of spinachleaves in relation to the onset of photosynthetic carbon assim-ilation. Planta 153: 273-278
1 088 Plant Physiol. Vol. 93,1990