Embed Size (px)
Citation preview
1
Far-red sun-induced chlorophyll fluorescence shows ecosystem-specific relationships to 1
gross primary production An assessment based on observational and modeling 2
approaches 3
4
1Damm A 2Guanter L 3Paul-Limoges E 4van der Tol C 1Hueni A 3Buchmann N5
3Eugster W 5Ammann C 1Schaepman ME 6
1 Remote Sensing Laboratories University of Zurich Winterthurerstrasse 190 8057 Zurich 7
Switzerland 8
2 German Research Centre for Geosciences (GFZ) Remote Sensing Section Telegrafenberg 9
14473 Potsdam Germany 10
3 Institute of Agricultural Sciences ETH Zurich Universitaetsstrasse 2 8092 Zurich 11
Switzerland 12
4 University of Twente Faculty of Geo-Information Science and Earth Observation (ITC) 13
PO Box 217 7500 AE Enschede The Netherlands 14
5 Research Station Agroscope Reckenholz-Taumlnikon ART Reckenholzstrasse 191 8046 15
Zurich Switzerland 16
17
Corresponding author Tel +41 44 635 5251 E-mail alexanderdammgeouzhch 18
19
Abstract 20
Sun-induced chlorophyll fluorescence (SIF) is a radiation flux emitted from 21
chlorophyll molecules and is considered an indicator of the actual functional state of plant 22
photosynthesis The remote measurement of SIF opens a new perspective to assess actual 23
2
photosynthesis at ecologically relevant larger scales and provides an alternative approach to 24
study the terrestrial carbon cycle Recent studies demonstrated the reliability of measured SIF 25
signals and showed significant relationships between SIF and gross primary production (GPP) 26
at ecosystem and global scales Despite these encouraging results understanding the complex 27
mechanisms between SIF and GPP remains challenging before SIF can be finally utilized to 28
constrain estimates of GPP In this study we present a comprehensive assessment of the 29
relationship between far red SIF retrieved at 760 nm (SIF760) and GPP and its transferability 30
across three structurally and physiologically contrasting ecosystems perennial grassland 31
cropland and mixed temperate forest We use multi-temporal imaging spectroscopy (IS) data 32
acquired with the Airborne Prism Experiment (APEX) sensor as well as eddy covariance (EC) 33
flux tower data to evaluate the relationship between SIF760 and GPPEC We use simulations 34
performed with the coupled photosynthesis-fluorescence model SCOPE to prove trends 35
obtained from our observational data and assess apparent confounding factors such as 36
physiological and structural interferences or temporal scaling effects Observed relationships 37
between SIF760 and GPPEC were asymptotic and ecosystem-specific ie perennial grassland 38
(R2 = 059 rRMSE = 271) cropland (R2 = 088 rRMSE = 35) and mixed temperate 39
forest (R2 = 048 rRMSE = 1588) We demonstrate that asymptotic leaf level relationships 40
between SIF760-GPPEC became more linear at canopy level and scaled with temporal 41
aggregation We conclude that remote sensing of SIF provides a new observational approach 42
to decrease uncertainties in estimating GPP across ecosystems but requires dedicated 43
strategies to compensate for the various confounding factors impacting SIF-GPP 44
relationships Our findings help in bridging the gap between mechanistic understanding at leaf 45
level and ecosystem-specific observations of the relationships between SIF and GPP 46
47
Keywords Sun-induced chlorophyll fluorescence gross primary production airborne-based 48
spectroscopy APEX Fraunhofer line depth (FLD) eddy-covariance SCOPE 49
3
1 Introduction 50
Plant photosynthesis is a key process in terrestrial ecosystems mediating gas and 51
energy exchanges in the atmosphere-biosphere system (Baldocchi et al 2001 Ozanne et al 52
2003) Products of photosynthesis provide a wealth of ecosystem services that are essential 53
for human well-being including food fiber energy and oxygen (Imhoff et al 2004 54
Krausmann et al 2013 Schroter et al 2005) Photosynthesis as the underlying process for 55
plant growth is a particularly interesting indicator of crop efficiency and agricultural 56
management practices (Falloon and Betts 2010 Guanter et al 2014 Trnka et al 2004) both 57
of which having important implications for yield forecasts and for the implementation of 58
climate change adaptation strategies (IPCC 2013) 59
Observing the highly dynamic process of photosynthesis beyond the individual leaf or 60
plant levels in-situ is based on measuring the carbon dioxide (CO2) exchange between 61
vegetation and atmosphere with eddy-covariance (EC) flux towers and partitioning it into 62
gross primary production (GPP) and ecosystem respiration (Baldocchi et al 2001) 63
Measurements of plant - light interactions using spectrometers installed on for example EC 64
towers allow deriving information about the pigment status and provide an alternative 65
approach to estimate GPP (Balzarolo et al 2011 Gamon et al 2010 Hilker et al 2011) At 66
landscape scale photosynthesis can be assessed using process-based models (Sitch et al 67
2003) greenness-based satellite observations (Running et al 2004) or hybrid approaches 68
combining in-situ observations and statistical modeling (Jung et al 2011) All these 69
approaches provide important insights to study photosynthesis but usually do not allow 70
assessing photosynthesis at larger scales while preserving the high spatial variability present 71
in ecosystems EC flux tower measurements represent only smaller areas in preselected 72
ecosystems (Drolet et al 2008 Turner et al 2005) are not spatially distributed according to 73
carbon stocks (Schimel et al 2014) and do not allow spatial differentiations within the 74
4
measured footprint (Barcza et al 2009 Kljun et al 2002) Combined large scale modeling 75
and observational approaches based on vegetation greenness are spatially contiguous but face 76
the complexity of naturally varying systems including diverse interactions and complex 77
feedbacks which limit their predictive capabilities (Beer et al 2010 Goetz and Prince 1999 78
Turner et al 2005) 79
Over the last decade significant progress has been made in measuring plant-light 80
interactions and the process of photosynthesis Remote measurements of sun-induced 81
chlorophyll fluorescence (SIF) in particular open a new perspective to assess photosynthesis 82
at ecosystem scale SIF is a radiation flux emitted from plant chlorophyll molecules a few 83
nanoseconds after light absorption in the wavelength range from 600-800 nm and is 84
considered an indicator for the functional status of actual plant photosynthesis (Baker 2008) 85
Various studies demonstrated the possibility to measure SIF at certain wavelengths on ground 86
(Guanter et al 2013 Rascher et al 2009) from airborne platforms (Damm et al 2014 87
Guanter et al 2007 Zarco-Tejada et al 2012) and from satellites (Frankenberg et al 2011 88
Guanter et al 2014 Joiner et al 2013) Recent research demonstrated SIF being sensitive to 89
changes in photosynthesis showing strong links to GPP at the level of leaves (Meroni et al 90
2008 Middleton et al 2002) plants (Damm et al 2010 Rossini et al 2010) canopies (Zarco-91
Tejada et al 2013) and ecosystems (Frankenberg et al 2011 Guanter et al 2012) 92
Observed relationships between SIF and GPP are conceptually explained using an 93
approximation of GPP based on Monteithrsquos light use efficiency concept (Monteith 1972) 94
∙ (1) 95
where APAR is the absorbed photosynthetically active radiation expressed in radiance units 96
and LUEp is the efficiency of light utilization for photosynthesis and allows converting 97
measured radiances into the number of fixed CO2 molecules SIF is expressed by expanding 98
the GPP notation in Eq (1) following Guanter et al (2014) 99
13 ∙ ∙ (2) 100
5
where LUEf is the light use efficiency of SIF (fluorescence yield) and fesc accounts for a 101
structural interference determining the fraction of SIF photons escaping the canopy 102
Relationships between SIF and GPP are mostly driven by the common APAR term In 103
addition a covariance between both light use efficiencies LUEp and LUEf is expected to 104
occur in absence of the confounding impact of other protective mechanisms (Damm et al 105
2010 Guanter et al 2014) 106
The above outlined concept relating SIF and GPP simplifies a complex set of 107
underlying mechanisms and violation of any assumptions made will directly confound the 108
SIF-GPP relationship In particular the competition of three processes for de-exciting 109
absorbed light energy ie photochemistry radiative energy loss (SIF) and non-radiative 110
energy dissipation (commonly approximated as non-photochemical quenching NPQ) causes 111
complex and changing sensitivities of emitted SIF to actual rates of photosynthesis (Porcar-112
Castell et al 2014 van der Tol et al 2014 van der Tol et al 2009a) This directly implies that 113
the functional link between SIF and GPP depends on the rate of NPQ and consequently on 114
ambient stress levels At canopy scale the three-dimensional structure causes gradients in 115
light interception and light quality within canopies (Nobel et al 1993 Stewart et al 2003) 116
additionally altering the rate of NPQ (Demmig-Adams 1998 Niinemets et al 2003) and thus 117
impacting the SIF-GPP relationship Canopy structure also increases the probability for the 118
emitted SIF photons either to be re-absorbed by chlorophyll or to escape the canopy (Fournier 119
et al 2012 Knyazikhin et al 2013) to some extent violating the assumption of fesc to be 120
constant In addition to these structural and physiological effects variations in SIF signals 121
caused by for example instrumental (Damm et al 2011) or atmospheric effects (Damm et al 122
2014 Guanter et al 2010) and retrieval uncertainties related to the estimation of surface 123
irradiance (Damm et al 2015) can potentially affect the apparent relationship between SIF 124
and GPP Proper understanding of confounding factors remains crucial to use SIF to constrain 125
6
estimates for GPP at ecosystem or continental scales (Garbulsky et al 2014 Guanter et al 126
2012 Parazoo et al 2014) 127
Considering the above listed mechanisms several aspects need to be addressed to 128
further exploit SIF as a robust constraint for estimating GPP We therefore aim at 129
investigating the functional information content of SIF and its link to GPP considering three 130
structurally and physiologically contrasting ecosystems ie cropland perennial grassland 131
and mixed temperate forest We use an innovative combination of multi-temporal imaging 132
spectroscopy (IS) data EC flux tower observations and modeling approaches at the leaf and 133
canopy levels i) to assess the relationship between far red SIF retrieved in the O2-A band at 134
760 nm (SIF760) and GPP across ecosystems and ii) to investigate the impact of confounding 135
factors on the SIF760-GPP relationship ie temporal scaling effects and structural and 136
physiological interferences using a photosynthesis model Our findings contribute to a better 137
understanding of the information inherent in remotely measured SIF760 and its functional 138
relationship to GPP Aspects discussed will help bridging the gap between small scale studies 139
and observational attempts to estimate GPP globally 140
141
2 Methods 142
21 Study sites 143
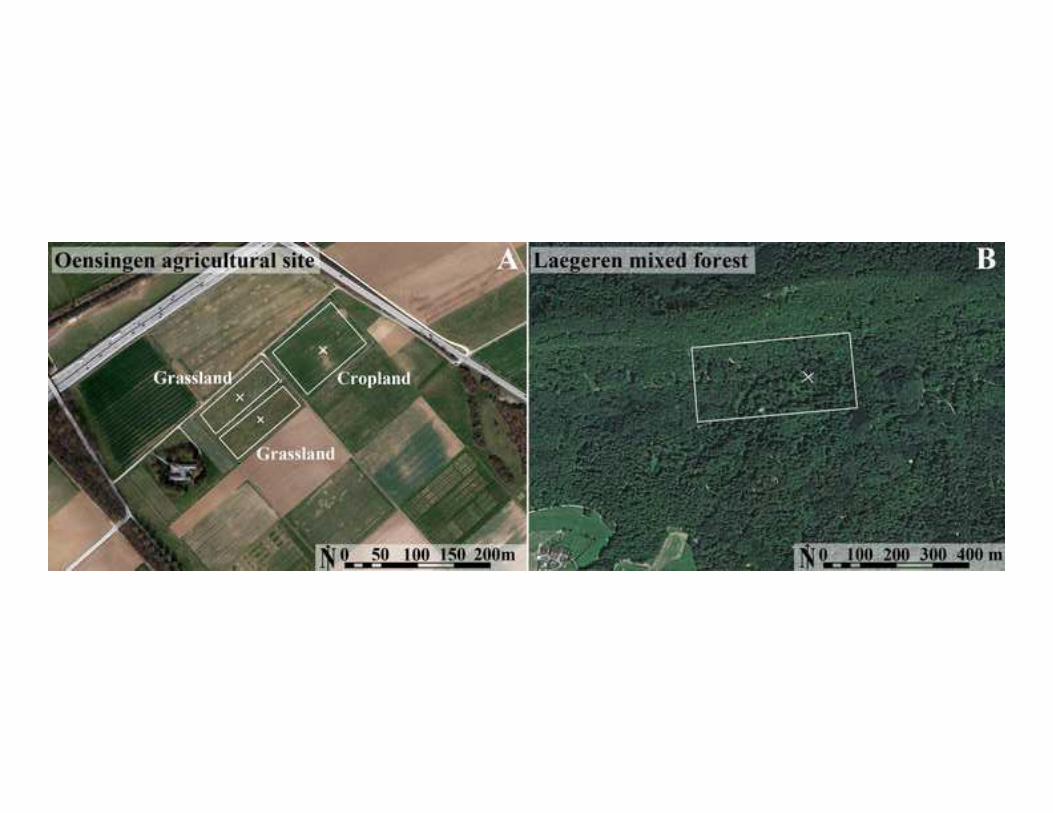
We investigated three contrasting ecosystems located on the Central Swiss Plateau in 144
terms of structure heterogeneity species composition and annual productivity Two of these 145
ecosystems were collocated in the agricultural area near the town of Oensingen (47deg1711rdquo N 146
7deg4401rdquo E 452 masl Figure 1A) This area is characterized by relatively small agricultural 147
parcels with grassland clover fallow cropping bean maize rapeseed pea sugar beet winter 148
barley and winter wheat rotating as dominant crops Two grassland fields differently 149
managed in terms of species composition fertilization and harvesting activities (Ammann et 150
7
al 2007) were investigated as representatives of the ecosystem type perennial grassland as 151
well as a cropland (one field with arable crop rotation) for the ecosystem type cropland The 152
forest area (47deg2842rdquo N 8deg2152rdquo E Figure 1B) is located on the south-facing slope of the 153
Laegeren mountain northwest of the city of Zurich The temperate mixed forest is 154
characterized by a relatively high species diversity and a complex canopy structure with 155
beech ash sycamore and spruce being the dominant species (Eugster et al 2007 Schneider 156
et al 2014) 157
158
lt Figure 1 gt 159
160
Both test sites are well instrumented (ie with eddy-covariance flux towers 161
micrometeorological stations) and were extensively sampled during several airborne 162
campaigns between 2009 and 2013 (Table 1) 163
164
lt Table 1 gt 165
166
22 Airborne spectroscopy 167
All three study sites were measured with the Airborne Prism EXperiment (APEX) 168
sensor on several days between 2009 and 2013 (Table 1) APEX is an airborne dispersive 169
pushbroom imaging spectrometer covering the 400-2500 nm spectral region in 313 narrow 170
continuous spectral bands APEX allows capturing the O2-A atmospheric absorption feature 171
and thus retrieving SIF760 with a spectral sampling interval of 45 nm a full width at half 172
maximum (FWHM) of 57 nm and a signal to noise ratio of approximately 450 in and 800 173
outside of the O2-A feature for a 50 reflective target and a sun zenith angle of 30deg (Jehle et 174
al 2010 Schaepman et al 2015) 175
8
Radiance calibration of APEX images is performed using the approach of Hueni et al 176
(2009) Multitemporal comparison of images is secured by using consistent calibration and 177
processing versions Precise retrievals of SIF typically require data measured in sub-178
nanometer spectral resolution However the feasibility of using APEX like instruments (ie 179
FWHM ~5nm) for SIF760 retrievals was theoretically assessed in Damm et al (2011) and 180
experimentally demonstrated in recent work (Zarco-Tejada et al 2009 Zarco-Tejada et al 181
2013) The use of calibrated APEX radiance data for the fluorescence retrieval is described in 182
Section 24 and Appendix-B Vegetation indices (see Section 25) were calculated using 183
Hemispherical-Conical-Reflectance-Factor data obtained after atmospheric correction using 184
ATCOR-4 (Richter and Schlaumlpfer 2002) Resulting SIF760 and vegetation indices were 185
projected in the same map projection using parametric geocoding (Schlaumlpfer and Richter 186
2002) Details about APEX data calibration are listed in Appendix-A 187
188
23 Field spectroscopy 189
ASD (PANalytics Boulder US) field spectrometer data were acquired for validation 190
purposes within one hour of the APEX overflight during four campaigns In total 23 191
agricultural fields covering various crops including carrot maize pea rye sugar beet wheat 192
white clover were systematically sampled by measuring reflected and emitted radiances in 193
four homogeneous 3 m2 plots per field (Table 2) Incident light was quantified before and 194
after measuring each plot using a Spectralon reference panel 195
196
lt Table 2 gt 197
198
24 SIF760 retrieval 199
Emitted SIF was analytically separated from the reflected radiance flux measured with 200
ground and airborne-based spectrometers (see Appendix-B) We applied the Fraunhofer Line 201
9
Depth (FLD) approach (Plascyk 1975) which serves as a standard for SIF retrievals using 202
medium resolution instruments (Meroni et al 2009) The FLD method uses atmospheric 203
absorption bands characterized by lower incident light compared to wavelength regions 204
outside of these bands This configuration allows evaluating the in-filling of the absorption 205
bands by SIF (Damm et al 2014) In this study we used the broad O2-A oxygen absorption 206
band around 760 nm for the SIF760 retrieval For the ground data surface irradiance was 207
estimated from white reference measurements while perturbing atmospheric absorption and 208
scattering effects were assumed to be negligible on the 1 m pathway between canopy and 209
sensor (cf Damm et al (2014) for details on the set-up for SIF760 retrieval on the ground) 210
For the airborne measurements we compensated atmospheric absorption and scattering using 211
the atmospheric radiative transfer model MODTRAN5 (Berk et al 2005) Details of the 212
SIF760 retrievals using airborne data are provided in Appendix-B 213
214
25 Derivation of additional spectral indices 215
The relationship between two vegetation indices and GPP was investigated in parallel 216
to judge the performance of the new remote observation of SIF compared to commonly used 217
remote sensing approaches The photochemical reflectance index (PRI) (Gamon et al 1992) 218
was found to be sensitive to pigment changes related to the xanthophyll cycle and is 219
frequently used to quantify LUEp and GPP (Cheng et al 2013 Drolet et al 2008 Hilker et al 220
2009) The PRI was calculated as 221
(3) 222
while Rλ accounts for the surface reflectance at the wavelength λ 223
We further tested the soil adjusted Modified Chlorophyll Absorption Ratio Index 2 224
(MCARI2) (Haboudane et al 2004) that was found to be strongly related to green LAI thus 225
potential photosynthesis and is calculated as 226
10
2 $amp($)$+-amp0 (4) 227
228
26 Eddy-covariance measurements 229
Continuous turbulent fluxes of CO2 were measured at the agricultural and forest sites 230
between 2009 and 2013 using the EC technique (Baldocchi 2003) At each site the EC 231
instrumentation consisted of an open-path infrared gas analyzer (IRGA) (model LI-7500 LI-232
COR Inc Lincoln NE USA) and a three-dimensional sonic anemometer-thermometer 233
(models HS R3 and R2 Gill Instruments Lymington UK) EC measurements were made at a 234
frequency of 20 Hz and processed to half-hourly averages using the eth-flux EC software for 235
the forest and cropland (Mauder et al 2008) or a comparable custom-made EC software for 236
the grassland (Ammann et al 2007) Post-processing included corrections for damping losses 237
(Eugster and Senn 1995) air density fluctuations (Webb et al 1980) data screening for 238
optical sensor contamination stationary or low turbulence conditions (Foken and Wichura 239
1996) and statistical outliers Standardized gap filling and partitioning of CO2 fluxes was 240
performed using the methodology from Lasslop et al (2010) for the forest and cropland and 241
using the methodology from Falge et al (2001) for the grassland Measurements of 242
photosynthetic photon flux density (PPFD) quantified in micromol m-2 s-1 were converted to 243
radiance units (mW m-2 sr-1 nm-1) representing the photosynthetic active radiation (PAR) to 244
be consistent with Monteithrsquos LUE concept and the SIF radiance units 245
246
27 Leaf area index measurements 247
The Leaf Area Index (LAI) of the grassland and cropland was measured at the time of 248
APEX flights using an optical non-destructive approach based on LAI-2000 leaf area meter 249
observations (Li-Cor Lincoln USA) The LAI of the forest was estimated using digital 250
11
hemispherical photographs at two subplots following the VALERIE sampling scheme while 251
subsequent analysis were applied to obtain the LAI (Schneider et al 2014) 252
253
28 Statistical analysis of SIF760 - GPP relationship 254
SIF760 values were manually extracted from APEX-SIF760 maps for areas representing 255
the footprint of eddy-flux measurements (Figure 1) For the perennial grassland and cropland 256
we selected all pixels with SIF760 values ge 0 mW m-2 sr-1 nm-1 in respective fields although the 257
EC tower footprint can be slightly smaller than the entire field The increased number of 258
resulting pixels allows reducing data noise and covering small spatial variations within the 259
footprint Using the pixels of the entire field is justified by the large homogeneity of the 260
underlying fields (Figure 1A) For the forest site Laegeren all pixels representing an area that 261
covered 70 of all footprint occurrences were selected irrespective of spatial footprint 262
changes due to changing wind conditions Using the same area for all years reduces variations 263
in SIF due to changes in biomass and canopy structure but also reduces the representativeness 264
of selected pixels for actual spatial EC footprints 265
We used a hyperbolic model to relate GPP to SIF760 and to both vegetation indices 266
Although the hyperbolic model only empirically approximates the data behavior it is 267
supported by theoretical arguments for the SIF760-GPP relationship that are outlined hereafter 268
The photosynthetic efficiency LUEp is often described as a hyperbolic function of APAR 269
following the Michaelis-Menten theory (Michaelis and Menten 1913) 270
∙123467899 (5) 271
where c is a coefficient in radiance units and LUEpmax c represents GPPmax Following Eqs 272
(1) and (5) GPP rises asymptotically with APAR to GPPmax This equation is used in many 273
models for partitioning GPP eg Falge et al (2001) Substituting LUEp from Eq (5) and 274
APAR = SIF760 (LUEf fesc) from Eq (2) into Eq (1) results in 275
12
lt= gtampABCampD (6) 276
where the coefficient b represents cLUEffesc accounting for the difference between LUEp 277
and LUEf GPPmax is a value that is asymptotically reached representing the photosynthetic 278
capacity or GPP of the canopy at light saturation It must be noted that Eq (6) is a 279
simplification of the complex relationships between GPP and SIF760 and thus performs best if 280
c LUEf fesc remains constant or SIF760 corresponds to APAR A constant LUEf is a 281
reasonable first approximation for vegetation that is only moderately stressed meaning that 282
variations in LUEf are substantially smaller than variations in LUEp (van der Tol et al 2014) 283
Moderate stress relates to any kind of environmental conditions (warm temperature strong 284
irradiance reduced water availability) that cause only short term and slight changes in 285
photochemical and non-photochemical protections However c and fesc are known to vary 286
across ecosystems and LUEf changes under environmental stress In order to evaluate their 287
impacts on the SIF-GPP relationships as expressed in Eq (6) we carried out simulations with 288
the Soil-Canopy Observations of Photosynthesis and Energy balance model SCOPE version 289
153 (van der Tol et al 2009b) (see Section 29) The goodness of fit for the hyperbolic model 290
was quantified using non-linear regression analysis and was quantitatively described using the 291
root mean square error normalized by the mean of measured data (rRMSE) and the coefficient 292
of determination R2 defined as the correlation between data and the best fit-curve determined 293
by non-linear regression 294
295
29 SCOPE simulations 296
SCOPE uses semi-empirical models for LUEp (Collatz et al 1991) and LUEf (van der 297
Tol et al 2014) embedded in a radiative transfer scheme for the canopy (van der Tol et al 298
2009b) The radiative transfer model at leaf level (Fluspect) is an extension of PROSPECT 299
(Jacquemoud and Baret 1990) and includes a fluorescence component The radiative transfer 300
13
within the canopy is calculated following Verhoef (1984) in the optical domain (SAIL) 301
following Verhoef et al (2007) in the thermal domain and Miller et al (2005) for the 302
fluorescence emissions (FluorSAIL) SCOPE requires a number of vegetation structural and 303
physiological parameters as well as weather information as input The model simulates GPP 304
and spectrally distributes SIF with a spectral resolution and a spectral sampling interval of 10 305
nm each Simulated PPFD values (micromol m-2 s-1) were also converted to radiance units (PAR) 306
We carried out three simulations using SCOPE In the first simulation we calculated 307
leaf level LUEf and LUEp of a typical C3 cropland as function of varying APAR For the 308
second simulation at canopy level we calculated LUEf and LUEp as function of varying 309
APAR for differently structured canopies We took the standard SCOPE parameters for a 310
typical C3 cropland and varied APAR and the structural parameters LAI leaf inclination 311
angle (LIDF) and the fraction of brown pigments (Cs) Both simulation experiments provide 312
theoretical evidence on the relationships between LUEf and LUEp between SIF760 and GPP 313
and their respective relationships to APAR For the third canopy level simulation SCOPE 314
was initialized using time series of mid-day (solar noon) meteorological data (PAR air 315
temperature) a seasonal cycle of LAI and the modelrsquos default soil and vegetation parameters 316
for a C3 cropland (cf the SCOPE user manual) The purpose of this simulation was to 317
evaluate seasonal SIF760-GPP relationships at various temporal aggregation levels For better 318
readability we use the following notation through the manuscript SIF760 O for APEX-SIF 319
SIF760 L and SIF760 C for SCOPE simulated leaf and canopy SIF GPPEC for flux tower GPP 320
and GPPL GPPC to relate to simulated GPP at leaf and canopy level 321
322
3 Results 323
31 SIF760 maps 324
14
Two examples of SIF760 O maps obtained from APEX are shown in Figures 2 and 3 325
The appearance of SIF760 O emissions in vegetated areas demonstrates that measured SIF760 O 326
signals originated solely from vegetation and were not contaminated by non-fluorescent non-327
vegetation surfaces Retrieved SIF760 O values range between 0 and 3 mW m-2 sr-1 nm-1 and 328
showed a high agreement (r2 = 07 rRMSE = 289) with in-situ measured reference data 329
Details of the SIF760 O validation are discussed in Appendix-C 330
331
lt Figure 2 gt 332
lt Figure 3gt 333
334
32 Relationships of GPPEC with SIF760 O PRI and MCARI2 335
Relating instantaneous measurements of SIF760 O and GPPEC from several years 336
revealed an asymptotic relationship with saturating GPPEC in presence of moderate to high 337
SIF760 O (Figure 4A Table 3) This general behavior was consistent for all investigated 338
vegetation types The fitted hyperbolic model shows a moderate to high goodness of fit for the 339
grassland (R2 = 059 rRMSE = 271) cropland (R2 = 088 rRMSE = 35) and forest (R2 = 340
048 rRMSE = 1588) The saturation of GPPEC appeared earlier for the cropland (SIF760 O 341
~05 mW m-2 sr-1 nm-1) than for the grassland and forest (SIF760 O gt 10 mW m-2 sr-1 nm-1) An 342
independent assessment considering a linear model to describe the relationship between 343
SIF760 O and GPPEC revealed a consistently lower goodness of fit justifying the use of a 344
hyperbolic model (data not shown) 345
Statistical analysis showed that a hyperbolic model represents well the relationship 346
between both vegetation indices (PRI and MCARI2) and GPPEC for the grassland with a 347
notable variation in LAI (range between 05 and 48 m2 m-2) However a hyperbolic model 348
does not allow well representing the relationship between PRI and MCARI2 with GPPEC for 349
the forest and cropland both showing only a small variation in LAI (less than plusmn03 m2 m-2) 350
15
(Figure 4B-C Table 3) The goodness of fit for the hyperbolic model describing the PRI and 351
GPPEC data for grassland (R2 = 095 rRMSE = 86) was even higher compared to SIF760 O 352
but lower for forest (R2 = 009 rRMSE = 2179) and cropland (R2 = 0008 rRMSE = 353
1176) With MCARI2 the goodness of fit for the hyperbolic model for grassland was high 354
(R2 = 098 rRMSE = 55) but low for cropland (R2 = 0005 rRMSE = 1029) and forest 355
(R2 = 034 rRMSE = 1798) Again considering a linear relationship between both 356
vegetation indices and GPPEC revealed no consistent improvement compared to the use of a 357
hyperbolic model (data not shown) 358
359
lt Figure 4 gt 360
lt Table 3 gt 361
362
33 Assessment of factors determining SIF760 GPPEC relationships 363
The asymptotic relationship between SIF760 O and GPPEC (Figure 4A) represented 364
instantaneous measurements of different canopies at different times and days over several 365
years covering a range of different light conditions phenological stages of the forest and 366
various amounts of green biomass for both investigated grasslands (crosses in Figure 5A-C 367
that indicate EC measurements during APEX overpasses) Relationships between SIF760 O and 368
GPPEC are consequently a complex function of light absorption in the canopy (APAR) of the 369
efficiency of light utilization (ie expressed as photosynthetic capacity and quantum 370
efficiency of photosynthesis) and of structural effects including fractions of non-371
photosynthetic vegetation components Both grass canopies were measured before and after 372
mowing resulting in a large range in LAI (05-48 m2 m-2) and GPPEC (4-27 micromol m-2 s-1) for 373
similar PAR values The forest LAI of 50 m2 m-2 was more constant over the years due to the 374
consistent timing of flights however senescence (eg lower canopy chlorophyll content and 375
light absorption) might explain the decrease in GPPEC of 15 micromol m-2 s-1 in September for 376
16
comparable irradiance conditions (Figure 5C) Investigated crops (winter wheat barley and 377
pea) were characterized by small variations in LAI (22-25 m2 m-2) and chlorophyll contents 378
corresponding to small variations in GPPEC (5 micromol m-2 s-1) while observed under comparable 379
irradiance conditions During the time of observation the barley and wheat canopies were in 380
the ripening phase with a pronounced ear layer 381
382
lt Figure 5 gt 383
384
The validity of the asymptotic relationship between SIF760 O and GPPEC was tested 385
using simulations made with the SCOPE model We emphasize that the regression coefficient 386
b in Eq (6) includes terms that vary in the model (b= cmiddotLUEfmiddotfesc) the fluorescence efficiency 387
LUEf varies with irradiance conditions (predominantly APAR) the fraction fesc depends on 388
vegetation structure while c=GPPmaxLUEpmax varies between sites and over time during the 389
season We first analysed how LUEf and LUEp and consequently SIF760 and GPP vary at 390
leaf (ie SIF760 L and GPPL) and canopy levels (ie SIF760 C and GPPC) using the model of 391
van der Tol et al (2014) that is embedded in SCOPE For the leaf level Figure 6A shows a 392
decrease of LUEp with increasing APAR consistent with Eq (5) The relation between APAR 393
and LUEf appears more complex LUEf first increases with increasing APAR under low light 394
conditions reaches a climax at intermediate light and then decreases with increasing APAR 395
under higher APAR values (gt 50 mW m-2 sr-1 nm-1) (Figure 6B) The initial increase in LUEf 396
is caused by the decline in photochemical quenching of the excitons whereas the decrease of 397
LUEf is caused by the growing number of non-photochemical quenching traps that dissipate 398
light energy before it can be emitted as fluorescence light (van der Tol et al 2009a) It is 399
important to note that the range of LUEp is nearly an order of magnitude greater compared to 400
the range of LUEf (Figure 6C) Although LUEf is not constant we can still conclude that the 401
difference in both LUE terms causes an earlier saturation of leaf-level GPPL (Figure 6D) 402
17
compared to leaf-level SIF760 L (Figure 6E) with APAR leading to an asymptotic relationship 403
between SIF760 L and GPPL (Figure 6F) Our canopy level simulations confirm these trends 404
(Figure 7A-D) The in-field measured asymptotic relationships between SIF760 O and GPPEC 405
are consequently caused by the covariance of GPPEC and SIF760 O with APAR the 406
photosynthetic capacity with APAR and the different value ranges of LUEf and LUEp 407
Additionally our canopy level simulations suggest that structure impacts the SIF760 O - GPPEC 408
relationship Figure 7D shows an example that changing LAI leaf inclination angles or the 409
fraction of senescent plant material determine the curvature of the hyperbolic SIF760 C - GPPC 410
relationships 411
412
lt Figure 6 gt 413
lt Figure 7 gt 414
415
The modelled SIF760 LC - GPPLC curves (Figures 6D and 7D) also indicate that under 416
reduced light intensity GPP and SIF760 are almost linearly related while GPP tends to saturate 417
under higher light intensities Changes in APAR at canopy level are caused by either sun 418
elevation or in the case of a constant solar angle by canopy structure (ie shading fractional 419
vegetation cover) In complex structured canopies with many foliage layers the saturation of 420
GPP with APAR may not be observable because variations of APAR are less related to PAR 421
falling on the leaves but rather to the variation of leaf area exposed to light Model 422
simulations suggest that in complex canopies SIF760 saturates with APAR before GPP due to 423
fesc being lower with high APAR (data not shown) This structural effect reduces the curvature 424
of the hyperbolic leaf level GPPL- SIF760 L relationship at canopy level (compare Figures 6F 425
and 7F) Furthermore the effect of structure and APAR covary in time since canopy structure 426
(ie LAI) varies in concert with APAR during a seasonal cycle especially for crops We 427
18
expect that this covariance makes the relationship between GPP and SIF760 more linear at the 428
canopy level especially if observations are aggregated over time 429
To evaluate the structure related alleviation of the hyperbolic relationship between 430
SIF760 and GPP at canopy level in response to temporal aggregation we modelled an annual 431
course of GPPC and SIF760 C considering varying environmental conditions (Figure 8A-B) 432
ie PAR ranging from 0-500 mW m-2 sr-1 nm-1 air temperature ranging from 0-32degC using 433
data collected during 2009 at a Nitro-Europe flux tower site (Speulderbos The Netherlands) 434
and canopy properties ie LAI ranging from 15-30 m2 m-2 (Figure 8C) The LAI data are 435
synthetic but have a realistic seasonal cycle For daily noon values of modelled SIF760 C and 436
GPPC an asymptotic behaviour can be observed while GPPC tends to saturate compared to 437
SIF760 C The SIF760C-GPPC relationship tends to become linear when monthly or quarterly 438
averages are considered (Figure 8D) 439
440
lt Figure 8 gt 441
442
This visual trend can be confirmed by statistical measures for daily aggregated values 443
the hyperbolic model (rRMSE = 174 R2 = 070) performed slightly better than the linear 444
model (rRMSE = 185 r2 = 068) In case of monthly aggregated data both the hyperbolic 445
and linear models performed similarly while the linear model gave better results (RMSE = 446
90 r2 = 090) than the hyperbolic model (rRMSE = 94 R2 = 088) for quarterly aggregated 447
data 448
449
4 Discussion 450
Significant relationships between remotely measured SIF and ecosystem GPP have 451
been reported in the past (Frankenberg et al 2011 Guanter et al 2014) however sufficient 452
19
process understanding for using SIF as proxy for GPP across ecosystems is still limited 453
(Porcar-Castell et al 2014) Below we discuss how our observational and modeling 454
approaches help bridging the gap between mechanistic understanding at the leaf level and 455
ecosystem-specific observations and thus provide insights on mechanisms determining the 456
complex relationship between SIF and GPP 457
458
41 Insights from the observational approach 459
Our results showed ecosystem-specific asymptotic relationships between SIF760 O and 460
GPPEC for the three investigated ecosystems mixed temperate forest cropland and perennial 461
grassland The varying SIF-GPP relationships across ecosystems were consistent with results 462
recently reported from combined satellite observations and model predictions (Guanter et al 463
2012) Our results showed that the relationships of both tested vegetation indices PRI and 464
MCARI2 to GPPEC experienced a higher variability across ecosystems compared to SIF760 O 465
SIF760 O showed an ecosystem-specific and overall moderate to good relationship (R2 between 466
048 and 088) to GPPEC for the three ecosystems Both vegetation indices showed only strong 467
relationships for the grassland (R2 = 095 and 098) that notably changed in LAI during the 468
various observations It is important to note that we do not further elaborate on the underlying 469
mechanisms relating vegetation indices and GPPEC and that it is unclear if hyperbolic models 470
best describe their relationships to GPPEC based on mechanistic principles The intention of 471
evaluating the relationships between GPPEC and both vegetation indices was to provide a base 472
to judge the performance of SIF760 O in relation to these commonly used remote observations 473
The diversity of sampled conditions and used data sources provide further evidence on 474
the robustness of observed SIF760 O-GPPEC relationships Our measurements represent various 475
canopies characterized by different biomasses sampled over several years Although most 476
observations were acquired under similar light condition and physiological states a few 477
measurements represented lower light conditions and other physiological states This suggests 478
20
that observed relationships are rather robust across different representations of APAR LUEp 479
and LUEf Furthermore we use data from different sources ie four EC flux towers the 480
APEX imaging spectrometer and modeling at leaf and canopy levels to reduce the 481
uncertainties associated with each method of measurements and to get a better understanding 482
of the SIF760 O-GPPEC relationship at ecosystem level 483
Flux tower measurements are representative of a certain source area (footprint) from 484
the ecosystem which changes constantly based on wind direction and turbulent state of the 485
atmosphere Depending on the heterogeneity of the ecosystem GPPEC signals can vary in 486
response to changing footprints (Barcza et al 2009 Kljun et al 2004) although this variation 487
should be rather small if the vegetation is homogeneous Remote measurements of SIF760 are 488
likely representative of the upper layer of the ecosystem thus vertical canopy heterogeneity 489
potentially leads to a mismatch when compared to GPPEC which integrates over the different 490
layers of the ecosystems This is expected to be especially the case in structurally complex 491
ecosystems such as forests Although the upper layer in forest ecosystems substantially 492
contributes to the total rate of GPPEC there are still many layers of leaves or needles within 493
the canopy photosynthesizing at different rates depending on their sunshade exposure In 494
addition understory vegetation in forest ecosystems can significantly contribute to GPPEC at 495
different rates depending on the ecosystem and time of year Even homogeneous vegetation 496
canopies like crops or grasslands can show vertical heterogeneity This is especially the case 497
at peak biomass during ripening or senescence During such phenological stages the top layer 498
of cereal crops consists of less fluorescing components (ie ears) and cereal crops or 499
grasslands can contain a higher fraction of brown pigments resulting in low SIF760 O values 500
while the entire canopy can still produce high photosynthetic rates and thus GPPEC (Damm et 501
al 2010) Indeed most of the crops investigated in our study were in the ripening phase with a 502
pronounced ear layer 503
21
This resulted in relatively low SIF760 O values and in high GPPEC and thus in a more 504
pronounced asymptotic relationship (cf Figure 4A Figure 7F) compared to results reported 505
for other crops (Guanter et al 2013 Guanter et al 2014) Further research is needed to better 506
understand the impact of vertical heterogeneity on GPPEC and SIF760 observations and their 507
respective relationships 508
Despite the technical aspects causing variations in retrieved SIF760 O (refer to 509
Appendix-D for a detailed discussion) canopy structure causes inherent variations in 510
measured SIF760 values and thus impacts SIF760-GPP relationships The combination of 511
complex canopy architecture and the distribution of absorbing and scattering elements 512
determine vegetation canopies to act as photon traps (Knyazikhin et al 2013 Lewis and 513
Disney 2007) Parts of emitted SIF760 photons from inner-canopy leaves are re-absorbed 514
while others escape the canopy in direction of the sensor The probability of photons escaping 515
the canopy is a function of canopy structure which implies sensitivity to measured SIF760 516
intensities for canopy structure In Eq (2) this sensitivity was approximated with the term 517
fesc In our analysis we minimized the impact of fesc by observing always the same forest area 518
representative for the EC tower footprint In less complex structured crop and grass canopies 519
we expect fesc to be less important However future research is required to quantify the impact 520
of fesc and to propose strategies to compensate its influence on SIF760 retrievals 521
522
42 Insights from the modeling approach 523
From a theoretical point of view radiative energy loss competes with photochemistry 524
and non-radiative energy dissipation for absorbed photons Considering that GPP and SIF760 525
can be conceptualized according to Eqs (1) and (2) SIF760 must show under certain 526
environmental conditions a sensitivity to photochemistry (Porcar-Castell et al 2014 van der 527
Tol et al 2009a van der Tol et al 2009b) This relationship is confirmed by our observational 528
data and other studies at leaf (Amoros-Lopez et al 2008) and canopy levels (Damm et al 529
22
2010) Our modeling results however indicated that the relationship between LUEf and LUEp 530
is subject to change hence impacting the sensitivity of SIF760 to track changes in GPP 531
(Figures 6C and 7C) 532
The asymptotic relationship between SIF760 and GPP theoretically predicted and 533
observed at leaf and canopy levels can be related in particular to the different value ranges of 534
both efficiency terms (LUEp and LUEf) (Figures 6C and 7C) while a complex set of 535
mechanisms causes an ecosystem dependency for SIF760-GPP relationships The 536
photosynthetic capacity of the entire ecosystem in combination with its vertical heterogeneity 537
determines differences in GPP and SIF760 and thus the slope and curvature of their respective 538
relationships Furthermore the initial slope of the asymptotic SIF760 - GPP relationship which 539
has a value of LUEpmax(LUEfmiddotfesc) is determined by a combination of the photosynthetic 540
efficiency and canopy structure Canopy structure and related shadowing effects alter the 541
average light interception and quality at leaf level (Nobel et al 1993 Stewart et al 2003) and 542
consequently the overall productivity of the canopy In the case of reduced APAR caused by 543
canopy shadowing the overall apparent stress level in the canopy and consequently the rate 544
of certain photoprotective mechanisms such as non-radiative energy dissipation is reduced 545
(Cheng et al 2015 Demmig-Adams 1998 Niinemets et al 2003) and observed GPP and 546
SIF760 fall in a range where they are more linearly related (cf Figure 6F and 7F) In addition 547
canopy level simulations show that the fraction of senescent plant material impacts the 548
curvature of the hyperbolic relationship 549
Recent literature reports linear relationships between satellite-based SIF and modeled 550
GPP (Frankenberg et al 2011 Guanter et al 2012 Guanter et al 2014) while we found 551
asymptotic relationships Both results are not contradicting if one considers the temporal 552
aggregation applied to the data Our results are based on instantaneous measurements while 553
monthly averages were calculated for the satellite data to minimize noise effects (Frankenberg 554
et al 2011 Guanter et al 2014) It is known from previous research that temporal averaging 555
23
tends to linearize the response between GPP and APAR (Ruimy et al 1995) as saturating 556
light conditions tend to be only a small fraction of averaged diurnalmonthly data 557
Aggregating GPPEC and APAR over different time scales also showed this effect (data not 558
shown) Because of the rather linear relationship between SIF760 and APAR we expect that 559
temporal aggregation tends to linearize the SIF760-GPP relationship as well A recent study 560
presenting continuous measurements of GPP and SIF760 over a temperate deciduous forest 561
support this hypothesis (Yang et al 2015) The increasing number of experiments using 562
autonomous spectrometer systems in combination with flux towers (Balzarolo et al 2011) 563
will likely provide more experimental results that supports this finding Our simulations 564
provide further evidence that the covariance of structure and APAR during a seasonal cycle 565
additionally tends to linearize the relationship between GPP and SIF760 if observations are 566
aggregated over time 567
The dependency of SIF760-GPP relationships on temporal aggregation requires special 568
attention since it has implications on the usage of SIF to constrain GPP In principle 569
conclusions and results obtained from temporally aggregated and instantaneous measurements 570
are valid if consistently related to the underlying temporal aggregation level Generalizing 571
conclusions obtained at various aggregation levels bears the risk for mis-interpretations eg 572
when vegetation models are refined or empirically re-calibrated using observations or for 573
projections of GPP using observational SIF data 574
575
43 Requirements for the use of SIF to assess GPP across ecosystems 576
The changing relationship between SIF760 and GPPEC with vegetation type challenges 577
the usage of SIF760 as a robust constraint to estimate GPP Specific strategies are required to 578
account for ecosystem (or species) specific sensitivities of SIF in general and SIF760 in 579
particular This includes i) integration platforms to combine observations and process 580
24
understanding and ii) accurate observations of additional vegetation and environmental 581
variables 582
Process-based models as data integration platform in combination with comprehensive 583
observations to sufficiently measure important environmental factors and vegetation 584
properties are considered as flexible and powerful framework Parazoo et al (2014) for 585
example proposed the combination of ensemble dynamic global vegetation models (DGVMs) 586
in combination with SIF as observational constraint Lee et al (2015) suggest incorporating 587
SIF in a climate model to utilize SIF as observational constraint of photosynthesis simulations 588
and subsequent calculations of carbon water and energy cycle information Yet other studies 589
propose using SIF to obtain physiological vegetation parameters ie Vcmax for improved 590
parameterizations of photosynthesis models to eventually model GPP (Zhang et al 2014) The 591
European space agencys (ESA) Earth Explorer 8 opportunity mission Fluorescence Explorer 592
(FLEX) suggests a combination of comprehensive observations (ie SIF over the full 593
emission spectrum vegetation ecosystems and actual environmental conditions) and process-594
based models (Guanter et al 2012) 595
Additional information is required to use SIF in process-based models as one has to 596
account for varying photosynthetic efficiencies of plants and prevailing stress responses 597
According to the conceptualization of GPP and SIF as given in Eqs (1) and (2) extracting 598
and evaluating the exact relationship between LUEp and LUEf is essential but requires 599
normalizing APAR and calculating both yields (Damm et al 2010 Govindjee 2004 Louis et 600
al 2005) Retrievals of APAR can be considered challenging (Garbulsky et al 2010 Gitelson 601
and Gamon 2015 Hanan et al 2002) as available approaches often utilize a-priori knowledge 602
of prevailing land cover or plant distribution functions and rely on the inversion of physical-603
based models or simple band ratios (Hilker et al 2008) Research is required to provide high 604
quality information on APAR not perturbed by light absorption of non-photosynthetic active 605
25
canopy elements (stems branches twigs) cf Zhang et al (2013 2012) that demonstrate 606
attempts to improve estimates of APAR 607
Observed SIF760 O - GPPEC relationships are additionally confounded by non-radiative 608
energy dissipation The PRI was designed to monitor pigment changes related to the 609
xanthophyll cycle (Gamon et al 1992) and provides access to this superimposing process 610
However reported sensitivities of PRI for other effects ie structure (Barton and North 611
2001) pigment pool sizes (Gamon and Berry 2012) illumination effects (Damm et al 2015) 612
and the results obtained in this study question the applicability of the PRI at canopy level 613
Alternative approaches such as the development of a canopy PRI as suggested by several 614
groups (Hernandez-Clemente et al 2011 Kovac et al 2013 Wu et al 2010) or the usage of 615
pigment compositions and other functional plant traits might represent interesting strategies 616
and should be elaborated in future research 617
Structural sensitivities of canopy leaving SIF signals are critical and require further 618
research The application of spectrally invariant correction factors eg the directional area 619
scattering factor (Knyazikhin et al 2013) or more advanced physically-based retrieval 620
schemes using combined atmosphere-canopy models (Damm et al 2015 Laurent et al 2013) 621
might provide potential strategies to compensate for canopy structural effects on retrieved 622
SIF760 623
Another important source of information that allows improving the usage of SIF as 624
constraint of GPP is to consider SIF emissions over the entire emission spectrum between 625
approximately 600 and 800 nm Recent research successfully demonstrated the 626
complementary information content of red-fluorescence retrieved in the O2-B band at 688 nm 627
(SIF688) compared to SIF760 because of the different contributions from photosystem I and II 628
(Rossini et al 2015) Yet other studies highlighted the potential to improve predictions of 629
LUEp and GPP using both SIF688 and SIF760 (Cheng et al 2013) 630
631
26
5 Conclusions 632
Remote sensing of SIF provides a new observational approach to assess terrestrial 633
GPP Compared to traditional greenness-based remote sensing parameters we found SIF760 to 634
be more consistently related to GPPEC These results in combination with the more direct 635
mechanistic link between SIF760 and photosynthesis suggest that using SIF760 provides a 636
strategy to decrease uncertainty in estimating GPP across ecosystems 637
Our observational and modeling approaches revealed asymptotic and ecosystem-638
specific relationships for SIF760 and GPPEC We identified a set of interlinked mechanisms 639
determining SIF760-GPPEC relationships to be ecosystem specific ie the photosynthetic 640
capacity and efficiency of ecosystems the confounding impact of non-radiative energy 641
dissipation (NPQ) as well as ecosystem structure and the fraction of non-photosynthetic 642
vegetation components We demonstrated that SIF760-GPPEC relationships scale with temporal 643
aggregation due to a covariance of canopy structure and APAR over the seasonal cycle 644
We suggest going beyond empirical and ecosystem-specific relationships instead 645
using instantaneous observations comprehensively providing information on the full SIF 646
emission vegetation status and functioning as well as environmental conditions in 647
combination with process-based models Such approaches eg suggested for ESArsquos potential 648
ldquoFluorescence Explorerrdquo (FLEX) Earth Explorer mission provide a flexible framework to 649
account for the various influencing factors identified and to successfully apply SIF as 650
constraint of unbiased global GPP estimates 651
Furthermore research is required to improve the comparison between observations of 652
GPPEC and SIF Both observations stem from conceptually contrasting technologies ie 653
measurements of gas exchange vs plant-light interactions and provide independent and 654
complementary access to study ecosystem photosynthesis Despite the need to harmonize 655
horizontally differing footprints the vertical heterogeneity of ecosystems including the 656
27
varying contributions from different ecosystem layers must be better understood to harmonize 657
and successfully integrate both measurements 658
659
Acknowledgements 660
This work was supported by a grant of the Swiss University Conference and ETH-661
Board in frame of the Swiss Earth Observatory Network (SEON) project and by a grant of the 662
European Space Agency (ESA) in frame of the FLEX-PARCS E Paul-Limoges was 663
supported in part by the Natural Sciences and Engineering Research Council of Canada 664
through a postgraduate scholarship We would like to thank the APEX team for acquiring the 665
APEX data Authors sequence is listed following the FLAE approach (doi 666
101371journalpbio0050018) 667
28
References 668
Ammann C Flechard CR Leifeld J Neftel A amp Fuhrer J (2007) The carbon budget of 669
newly established temperate grassland depends on management intensity Agriculture 670
Ecosystems amp Environment 121 5-20 671
Amoros-Lopez J Gomez-Chova L Vila-Frances J Alonso L Calpe J Moreno J amp 672
del Valle-Tascon S (2008) Evaluation of remote sensing of vegetation fluorescence by 673
the analysis of diurnal cycles International Journal of Remote Sensing 29 5423-5436 674
Baker NR (2008) Chlorophyll Fluorescence A probe of photosynthesis in vivo Annual 675
Review of Plant Physiology and Plant Molecular Biology 59 89-113 676
Baldocchi D Falge E Gu LH Olson R Hollinger D Running S Anthoni P 677
Bernhofer C Davis K Evans R Fuentes J Goldstein A Katul G Law B Lee 678
XH Malhi Y Meyers T Munger W Oechel W U KTP Pilegaard K Schmid 679
HP Valentini R Verma S Vesala T Wilson K amp Wofsy S (2001) FLUXNET A 680
new tool to study the temporal and spatial variability of ecosystem-scale carbon dioxide 681
water vapor and energy flux densities Bulletin of the American Meteorological Society 682
82 2415-2434 683
Baldocchi DD (2003) Assessing the eddy covariance technique for evaluating carbon 684
dioxide exchange rates of ecosystems past present and future Global Change Biology 9 685
479-492 686
Balzarolo M Anderson K Nichol C Rossini M Vescovo L Arriga N Wohlfahrt G 687
Calvet J-C Carrara A Cerasoli S Cogliati S Daumard F Eklundh L Elbers JA 688
Evrendilek F Handcock RN Kaduk J Klumpp K Longdoz B Matteucci G 689
Meroni M Montagnani L Ourcival J-M Sanchez-Canete EP Pontailler J-Y 690
Juszczak R Scholes B amp Pilar Martin M (2011) Ground-Based Optical Measurements 691
at European Flux Sites A Review of Methods Instruments and Current Controversies 692
Sensors 11 7954-7981 693
Barcza Z Kern A Haszpra L amp Kljun N (2009) Spatial representativeness of tall tower 694
eddy covariance measurements using remote sensing and footprint analysis Agricultural 695
and Forest Meteorology 149 795-807 696
Barton CVM amp North PRJ (2001) Remote sensing of canopy light use efficiency using 697
the photochemical reflectance index - Model and sensitivity analysis Remote Sensing of 698
Environment 78 264-273 699
Beer C Reichstein M Tomelleri E Ciais P Jung M Carvalhais N Roedenbeck C 700
Arain MA Baldocchi D Bonan GB Bondeau A Cescatti A Lasslop G Lindroth 701
29
A Lomas M Luyssaert S Margolis H Oleson KW Roupsard O Veenendaal E 702
Viovy N Williams C Woodward FI amp Papale D (2010) Terrestrial Gross Carbon 703
Dioxide Uptake Global Distribution and Covariation with Climate Science 329 834-838 704
Berk A Anderson GP Acharya PK Bernstein LS Muratov L Lee J Fox M 705
Adler-Golden SM Chetwynd JH Hoke ML Lockwood RB Gardner JA Cooley 706
TW Borel CC amp Lewis PE (2005) MODTRAN5 A reformulated atmospheric band 707
model with auxiliary species and practical multiple scattering options Proceedings of the 708
Society of Photo-Optical Instrumentation Engineer 5655 662-667 709
Cheng SJ Bohrer G Steiner AL Hollinger DY Suyker A Phillips RP amp 710
Nadelhoffer KJ (2015) Variations in the influence of diffuse light on gross primary 711
productivity in temperate ecosystems Agricultural and Forest Meteorology 201 98-110 712
Cheng Y-B Middleton EM Zhang Q Huemmrich KF Campbell PKE Corp LA 713
Cook BD Kustas WP amp Daughtry CS (2013) Integrating Solar Induced 714
Fluorescence and the Photochemical Reflectance Index for Estimating Gross Primary 715
Production in a Cornfield Remote Sensing 5 6857-6879 716
Collatz GJ Ball JT Grivet C amp Berry JA (1991) Physiological and environmental-717
regulation of stomatal conductance photosynthesis and transpiration - a model that 718
includes a laminar boundary-layer Agricultural and Forest Meteorology 54 107-136 719
DOdorico P Alberti E amp Schaepman ME (2010) In-flight spectral performance 720
monitoring of the Airborne Prism Experiment Applied Optics 49 3082-3091 721
DOdorico P Guanter L Schaepman ME amp Schlaumlpfer D (2011) Performance 722
assessment of onboard and scene-based methods for Airborne Prism Experiment spectral 723
characterization Applied Optics 50 4755-4764 724
Damm A Erler A Gioli B Hamdi K Hutjes R Kosvancova M Meroni M 725
Miglietta F Moersch A Moreno J Schickling A Sonnenschein R Udelhoven T 726
Van der Linden S Hostert P amp Rascher U (2010) Remote sensing of sun induced 727
fluorescence yield to improve modelling of diurnal courses of Gross Primary Production 728
(GPP) Global Change Biology 16 171-186 729
Damm A Erler A Hillen W Meroni M Schaepman ME Verhoef W amp Rascher U 730
(2011) Modeling the impact of spectral sensor configurations on the FLD retrieval 731
accuracy of sun-induced chlorophyll fluorescence Remote Sensing of Environment 115 732
1882-1892 733
Damm A Guanter L Laurent VCE Schaepman ME Schickling A amp Rascher U 734
(2014) FLD-based retrieval of sun-induced chlorophyll fluorescence from medium 735
30
spectral resolution airborne spectroscopy data Remote Sensing of Environment 147 256-736
266 737
Damm A Guanter L Verhoef W Schlaumlpfer D Garbari S amp Schaepman ME (2015) 738
Impact of varying irradiance on vegetation indices and chlorophyll fluorescence derived 739
from spectroscopy data Remote Sensing of Environment 156 202-215 740
Demmig-Adams B (1998) Survey of thermal energy dissipation and pigment composition in 741
sun and shade leaves Plant and Cell Physiology 39 474-482 742
Drolet GG Middleton EM Huemmrich KF Hall FG Amiro BD Barr AG Black 743
TA McCaughey JH amp Margolis HA (2008) Regional mapping of gross light-use 744
efficiency using MODIS spectral indices Remote Sensing of Environment 112 3064-3078 745
Eugster W amp Senn W (1995) A cospectral correction model for measurement of turbulent 746
NO2 fluxes Boundary-Layer Meteorology 74 321-340 747
Eugster W Zeyer K Zeeman M Michna P Zingg A Buchmann N amp Emmenegger 748
L (2007) Methodical study of nitrous oxide eddy covariance measurements using 749
quantum cascade laser spectrometery over a Swiss forest Biogeosciences 4 927-939 750
Falge E Baldocchi D Olson R Anthoni P Aubinet M Bernhofer C Burba G 751
Ceulemans R Clement R Dolman H Granier A Gross P Grunwald T Hollinger 752
D Jensen NO Katul G Keronen P Kowalski A Lai CT Law BE Meyers T 753
Moncrieff H Moors E Munger JW Pilegaard K Rannik U Rebmann C Suyker 754
A Tenhunen J Tu K Verma S Vesala T Wilson K amp Wofsy S (2001) Gap 755
filling strategies for defensible annual sums of net ecosystem exchange Agricultural and 756
Forest Meteorology 107 43-69 757
Falloon P amp Betts R (2010) Climate impacts on European agriculture and water 758
management in the context of adaptation and mitigation-The importance of an integrated 759
approach Science of the Total Environment 408 5667-5687 760
Foken T amp Wichura B (1996) Tools for quality assessment of surface-based flux 761
measurements Agricultural and Forest Meteorology 78 83-105 762
Fournier A Daumard F Champagne S Ounis A Goulas Y amp Moya I (2012) Effect 763
of canopy structure on sun-induced chlorophyll fluorescence Isprs Journal of 764
Photogrammetry and Remote Sensing 68 112-120 765
Frankenberg C Fisher JB Worden J Badgley G Saatchi SS Lee JE Toon GC 766
Butz A Jung M Kuze A amp Yokota T (2011) New global observations of the 767
terrestrial carbon cycle from GOSAT Patterns of plant fluorescence with gross primary 768
productivity Geophysical Research Letters 38 769
31
Gamon JA amp Berry JA (2012) Facultative and constitutive pigment effects on the 770
Photochemical Reflectance Index (PRI) in sun and shade conifer needles Israel Journal of 771
Plant Sciences 60 85-95 772
Gamon JA Coburn C Flanagan LB Huemmrich KF Kiddle C Sanchez-Azofeifa 773
GA Thayer DR Vescovo L Gianelle D Sims DA Rahman AF amp Pastorello 774
GZ (2010) SpecNet revisited bridging flux and remote sensing communities Canadian 775
Journal of Remote Sensing 36 S376-S390 776
Gamon JA Penuelas J amp Field CB (1992) A narrow-waveband spectral index that 777
tracks diurnal changes in photosynthetic efficiency Remote Sensing of Environment 41 778
35-44 779
Garbulsky MF Filella I Verger A amp Penuelas J (2014) Photosynthetic light use 780
efficiency from satellite sensors From global to Mediterranean vegetation Environmental 781
and Experimental Botany 103 3-11 782
Garbulsky MF Penuelas J Papale D Ardo J Goulden ML Kiely G Richardson 783
AD Rotenberg E Veenendaal EM amp Filella I (2010) Patterns and controls of the 784
variability of radiation use efficiency and primary productivity across terrestrial 785
ecosystems Global Ecology and Biogeography 19 253-267 786
Gege P Fries J Haschberger P Schoumltz P Schwarzer H Strobl P Suhr B Ulbrich 787
G amp Vreeling WJ (2009) Calibration facility for airborne imaging spectrometers 788
ISPRS Journal of Photogrammetry amp Remote Sensing 64 387ndash397 789
Gitelson AA amp Gamon JA (2015) The need for a common basis for defining light-use 790
efficiency Implications for productivity estimation Remote Sensing of Environment 156 791
196-201 792
Goetz SJ amp Prince SD (1999) Modelling terrestrial carbon exchange and storage 793
Evidence and implications of functional convergence in light-use efficiency Advances in 794
Ecological Research Vol 28 (pp 57-92) 795
Govindjee (2004) Chlorophyll a fluorescence A bit of basics and history In GC 796
Papageorgiou amp Govindjee (Eds) Chlorophyll a Fluorescence A Signature of 797
Photosynthesis Advances in Photosynthesis and Respiration (pp 1-42) Dordrecht 798
Springer 799
Guanter L Alonso L Gomez-Chova L Amoros-Lopez J Vila J amp Moreno J (2007) 800
Estimation of solar-induced vegetation fluorescence from space measurements 801
Geophysical Research Letters 34 doi 1010292007GL029289 802
32
Guanter L Alonso L Gomez-Chova L Meroni M Preusker R Fischer J amp Moreno 803
J (2010) Developments for vegetation fluorescence retrieval from spaceborne high-804
resolution spectrometry in the O2-A and O2-B absorption bands Journal of Geophysical 805
Research-Atmospheres 115 806
Guanter L Frankenberg C Dudhia A Lewis PE Goacutemez-Dans J Kuze A Suto H amp 807
Grainger R (2012) Retrieval and global assessment of terrestrial chlorophyll fluorescence 808
from GOSAT space measurements Remote Sensing of Environment 121 236-251 809
Guanter L Rossini M Colombo R Meroni M Frankenberg C Lee J-E amp Joiner J 810
(2013) Using field spectroscopy to assess the potential of statistical approaches for the 811
retrieval of sun-induced chlorophyll fluorescence from ground and space Remote Sensing 812
of Environment 133 52-61 813
Guanter L Zhang Y Jung M Joiner J Voigt M Berry JA Frankenberg C Huete 814
AR Zarco-Tejada P Lee J-E Moran MS Ponce-Campos G Beer C Camps-815
Valls G Buchmann N Gianelle D Klumpp K Cescatti A Baker JM amp Griffis 816
TJ (2014) Global and time-resolved monitoring of crop photosynthesis with chlorophyll 817
fluorescence Proceedings of the National Academy of Sciences of the United States of 818
America 111 E1327-E1333 819
Haboudane D Miller JR Pattey E Zarco-Tejada PJ amp Strachan IB (2004) 820
Hyperspectral vegetation indices and novel algorithms for predicting green LAI of crop 821
canopies Modeling and validation in the context of precision agriculture Remote Sensing 822
of Environment 90 337-352 823
Hanan NP Burba G Verma SB Berry JA Suyker A amp Walter-Shea EA (2002) 824
Inversion of net ecosystem CO2 flux measurements for estimation of canopy PAR 825
absorption Global Change Biology 8 563-574 826
Hernandez-Clemente R Navarro-Cerrillo RM Suarez L Morales F amp Zarco-Tejada 827
PJ (2011) Assessing structural effects on PRI for stress detection in conifer forests 828
Remote Sensing of Environment 115 2360-2375 829
Hilker T Coops NC Wulder MA Black TA amp Guy RD (2008) The use of remote 830
sensing in light use efficiency based models of gross primary production A review of 831
current status and future requirements Science of the Total Environment 404 411-423 832
Hilker T Gitelson A Coops NC Hall FG amp Black TA (2011) Tracking plant 833
physiological properties from multi-angular tower-based remote sensing Oecologia 165 834
865-876 835
33
Hilker T Lyapustin A Hall FG Wang Y Coops NC Drolet G amp Black TA 836
(2009) An assessment of photosynthetic light use efficiency from space Modeling the 837
atmospheric and directional impacts on PRI reflectance Remote Sensing of Environment 838
113 2463-2475 839
Hueni A Biesemans J Meuleman K DellEndice F Schlaumlpfer D Adriaensen S 840
Kempenaers S Odermatt D Kneubuehler M Nieke J amp Itten K (2009) Structure 841
Components and Interfaces of the Airborne Prism Experiment (APEX) Processing and 842
Archiving Facility IEEE Transactions on Geoscience and Remote Sensing 47 29-43 843
Hueni A Lenhard K Baumgartner A amp Schaepman M (2013) The APEX (Airborne 844
Prism Experiment - Imaging Spectrometer) Calibration Information System IEEE 845
Transactions on Geoscience and Remote Sensing 51 5169-5180 846
Hueni A Schlaepfer D Jehle M amp Schaepman M (2015) Impacts of Dichroic Prism 847
Coatings on Radiometry of the Airborne Imaging Spectrometer APEX Applied Optics 53 848
5344-5352 849
Imhoff ML Bounoua L Ricketts T Loucks C Harriss R amp Lawrence WT (2004) 850
Global patterns in human consumption of net primary production Nature 429 870-873 851
IPCC (2013) Summary for policymakers Climate change 2013 the physical science basis 852
Cambridge University Press Cambridge United Kingdom and New York NY USA 853
Jacquemoud S amp Baret F (1990) PROSPECT A model of leaf optical properties spectra 854
Remote Sensing of Environment 34 75-91 855
Jehle M Hueni A Damm A DOdorico P Kneubuumlhler M Meuleman K Schlapfer 856
D Schaepman ME amp Weyermann J (2010) APEX - current status performance and 857
validation concept IEEE Sensors 2010 Conference 533-537 858
Joiner J Guanter L Lindstrot R Voigt M Vasilkov AP Middleton EM Huemmrich 859
KF Yoshida Y amp Frankenberg C (2013) Global monitoring of terrestrial chlorophyll 860
fluorescence from moderate spectral resolution near-infrared satellite measurements 861
methodology simulations and application to GOME-2 Atmos Meas Tech Discuss 6 862
3883-3930 863
Jung M Reichstein M Margolis HA Cescatti A Richardson AD Arain MA 864
Arneth A Bernhofer C Bonal D Chen J Gianelle D Gobron N Kiely G Kutsch 865
W Lasslop G Law BE Lindroth A Merbold L Montagnani L Moors EJ 866
Papale D Sottocornola M Vaccari F amp Williams C (2011) Global patterns of land-867
atmosphere fluxes of carbon dioxide latent heat and sensible heat derived from eddy 868
34
covariance satellite and meteorological observations Journal of Geophysical Research-869
Biogeosciences 116 870
Kljun N Kastner-Klein P Fedorovich E amp Rotach MW (2004) Evaluation of 871
Lagrangian footprint model using data from wind tunnel convective boundary layer 872
Agricultural and Forest Meteorology 127 189-201 873
Kljun N Rotach MW amp Schmid HP (2002) A three-dimensional backward lagrangian 874
footprint model for a wide range of boundary-layer stratifications Boundary-Layer 875
Meteorology 103 205-226 876
Knyazikhin Y Schull MA Stenberg P Mottus M Rautiainen M Yang Y Marshak 877
A Latorre Carmona P Kaufmann RK Lewis P Disney MI Vanderbilt V Davis 878
AB Baret F Jacquemoud S Lyapustin A amp Myneni RB (2013) Hyperspectral 879
remote sensing of foliar nitrogen content Proceedings of the National Academy of 880
Sciences of the United States of America 110 E185-E192 881
Kovac D Malenovsky Z Urban O Spunda V Kalina J Ac A Kaplan V amp Hanus 882
J (2013) Response of green reflectance continuum removal index to the xanthophyll de-883
epoxidation cycle in Norway spruce needles Journal of Experimental Botany 64 1817-884
1827 885
Krausmann F Erb K-H Gingrich S Haberl H Bondeau A Gaube V Lauk C 886
Plutzar C amp Searchinger TD (2013) Global human appropriation of net primary 887
production doubled in the 20th century Proceedings of the National Academy of Sciences 888
of the United States of America 110 10324-10329 889
Lasslop G Reichstein M Papale D Richardson AD Arneth A Barr A Stoy P amp 890
Wohlfahrt G (2010) Separation of net ecosystem exchange into assimilation and 891
respiration using a light response curve approach critical issues and global evaluation 892
Global Change Biology 16 187-208 893
Laurent VCE Verhoef W Damm A Schaepman ME amp Clevers JGPW (2013) A 894
Bayesian object-based approach for estimating vegetation biophysical variables from at-895
sensor APEX radiance data Remote Sensing of Environment 139 6-17 896
Lee JE Berry JA Van der Tol C Yang X Guanter L Damm A Baker I amp 897
Frankenberg C (2015) Simulations of chlorophyll fluorescence in corporated into the 898
Community Land Model version 4 Global Change Biology in print 899
Lewis P amp Disney M (2007) Spectral invariants and scattering across multiple scales from 900
within-leaf to canopy Remote Sensing of Environment 109 196-206 901
35
Liu LY amp Cheng ZH (2010) Detection of Vegetation Light-Use Efficiency Based on 902
Solar-Induced Chlorophyll Fluorescence Separated From Canopy Radiance Spectrum Ieee 903
Journal of Selected Topics in Applied Earth Observations and Remote Sensing 3 306-312 904
Louis J Ounis A Ducruet JM Evain S Laurila T Thum T Aurela M Wingsle G 905
Alonso L Pedros R amp Moya I (2005) Remote sensing of sunlight-induced chlorophyll 906
fluorescence and reflectance of Scots pine in the boreal forest during spring recovery 907
Remote Sensing of Environment 96 37-48 908
Maier SW Guumlnther KP amp Stellmes M (2003) Sun-Induced Fluorescence A New Tool 909
for Precision Farming In M McDonald J Schepers L Tartly T van Toai amp D Major 910
(Eds) Digital Imaging and Spectral Techniques Applications to Precision Agriculture 911
and Crop Physiology (pp 209-222) ASA Special Publication 912
Mauder M Foken T Clement R Elbers JA Eugster W Gruenwald T Heusinkveld 913
B amp Kolle O (2008) Quality control of CarboEurope flux data - Part 2 Inter-914
comparison of eddy-covariance software Biogeosciences 5 451-462 915
Meroni M Busetto L Guanter L Cogliati S Crosta GF Migliavacca M Panigada 916
C Rossini M amp Colombo R (2010) Characterization of fine resolution field 917
spectrometers using solar Fraunhofer lines and atmospheric absorption features Applied 918
Optics 49 2858-2871 919
Meroni M Picchi V Rossini M Cogliati S Panigada C Nali C Lorenzini G amp 920
Colombo R (2008) Leaf level early assessment of ozone injuries by passive fluorescence 921
and photochemical reflectance index International Journal of Remote Sensing 29 5409-922
5422 923
Meroni M Rossini M Guanter L Alonso L Rascher U Colombo R amp Moreno J 924
(2009) Remote sensing of solar induced chlorophyll fluorescence review of methods and 925
applications Remote Sensing of Environment doi101016jrse200905003 926
Michaelis L amp Menten ML (1913) The kenetics of the inversion effect Biochemische 927
Zeitschrift 49 333-369 928
Middleton E McMurtney JE Campbell PK Corp LA Butcher LM amp Chappelle 929
EW (2002) Optical and fluorescence properties of corn leaves from different nitrogen 930
regimes In M Owe G Durso amp L Toulios (Eds) Conference on Remote Sensing for 931
Agriculture Ecosystems and Hydrology IV (pp 72-83) Agia Pelagia Greece 932
Miller JR Berger M Goulas Y Jacquemoud S Louis J Moise N Mohammed G 933
Moreno J Moya I Pedroacutes R Verhoef W amp Zarco-Tejada PJ (2005) Development 934
36
of a vegetation fluorescence canopy model Final Report May 2005 In European Space 935
Research and Technology Centre (ESTEC) 936
Monteith JL (1972) Solar-radiation and productivity in tropical ecosystems Journal of 937
Applied Ecology 9 747-766 938
Niinemets U Kollist H Garcia-Plazaola JI Hernandez A amp Becerril JM (2003) Do 939
the capacity and kinetics for modification of xanthophyll cycle pool size depend on growth 940
irradiance in temperate trees Plant Cell and Environment 26 1787-1801 941
Nobel PS Forseth IN amp Long SP (1993) Canopy structure and light interception 942
Ozanne CMP Anhuf D Boulter SL Keller M Kitching RL Korner C Meinzer 943
FC Mitchell AW Nakashizuka T Dias PLS Stork NE Wright SJ amp 944
Yoshimura M (2003) Biodiversity meets the atmosphere A global view of forest 945
canopies Science 301 183-186 946
Parazoo NC Bowman K Fisher JB Frankenberg C Jones DBA Cescatti A Peacuterez-947
Priego Oacute Wohlfahrt G amp Montagnani L (2014) Terrestrial gross primary production 948
inferred from satellite fluorescence and vegetation models Global Change Biology na-na 949
Plascyk JA (1975) MK II Fraunhofer Line Dicsriminator (FLD-II) for airborne and orbital 950
remote-sensing of solar-stimulated luminescence Optical Engineering 14 339-346 951
Porcar-Castell A Tyystjaumlrvi E Atherton J Van der Tol C Flexas J EE P Moreno 952
J Frankenberg C amp Berry JA (2014) Linking chlorophyll a fluorescence to 953
photosynthesis for remote sensing applications mechanisms and challenges Journal of 954
Experimental Botany 65 4065-4095 955
Rascher U Agati G Alonso L Cecci G Champagne S Colombo R Damm A 956
Daumard F De Miguel E Fernandez G Franch B Franke J Gerbig C Gioli B 957
Gomez JA Goulas Y Guanter L Gutierrez-De-La-Camara O Hamdi K Hostert 958
P Jimenez M Kosvancova M Lognoli D Meroni M Miglietta F Moersch A 959
Moreno J Moya I Neininger B Okujeni A Ounis A Palombi L Raimondi V 960
Schickling A Sobrino JA Stellmes M Toci G Toscano P Udelhoven T Van der 961
Linden S amp Zaldei A (2009) CEFLES2 The remote sensing component to quantify 962
photosynthetic efficiency from the leaf to the region by measuring sun-induced 963
fluorescence in the oxygen absorption bands Biogeosciences 6 1181-1198 964
Richter R amp Schlaumlpfer D (2002) Geo-atmospheric processing of airborne imaging 965
spectrometry data Part 2 Atmospherictopographic correction International Journal of 966
Remote Sensing 23 2631-2649 967
37
Rossini M Meroni M Migliavacca M Manca G Cogliati S Busetto L Picchi V 968
Cescatti A Seufert G amp Colombo R (2010) High resolution field spectroscopy 969
measurements for estimating gross ecosystem production in a rice field Agricultural and 970
Forest Meteorology 150 1283-1296 971
Rossini M Nedbal L Guanter L Ač A Alonso L Burkart A Cogliati S Colombo 972
R Damm A Drusch M Hanus J Julitta T Kokkalis P Moreno J Panigada C 973
Pinto F Schickling A Schuumlttemeyer D Zemek F amp Rascher U (2015) Red and far-974
red sun-induced chlorophyll fluorescence as a measure of plant photosynthesis 975
Geophysical Research Letters (accepted for publication) 976
Ruimy A Jarvis PG Baldocchi DD amp B S (1995) CO2 Fluxes over Plant Canopies 977
and Solar Radiation A Review Advances in Ecological Research 26 1-68 978
Running SW Nemani RR Heinsch FA Zhao MS Reeves M amp Hashimoto H 979
(2004) A continuous satellite-derived measure of global terrestrial primary production 980
Bioscience 54 547-560 981
Schaepman ME M J Hueni A DrsquoOdorico P Damm A Weyermann J Schneider F 982
Laurent VCE C P Seidel F Lenhard K Gege P Kuechler C Brazile J Kohler 983
P De Vos L Meuleman K Meynart R Schlaepfer D Kneubuumlhler M amp Itten K 984
(2015) Advanced radiometry measurements and Earth science applications with the 985
Airborne Prism Experiment (APEX) Remote Sensing of Environment 158 207-219 986
Schimel D Pavlick R Fisher JB Asner GP Saatchi S Townsend P Miller C 987
Frankenberg C Hibbard K amp Cox P (2014) Observing terrestrial ecosystems and the 988
carbon cycle from space Global Change Biology na-na 989
Schlaumlpfer D amp Richter R (2002) Geo-atmospheric processing of airborne imaging 990
spectrometry data Part 1 Parametric orthorectification International Journal of Remote 991
Sensing 23 2609-2630 992
Schneider FD Leiterer R Morsdorf F Gastellu-Etchegorry J-P Lauret N Pfeifer N 993
amp Schaepman ME (2014) Simulating imaging spectrometer data 3D forest modeling 994
based on LiDAR and in situ data Remote Sensing of Environment 152 235-250 995
Schroter D Cramer W Leemans R Prentice IC Araujo MB Arnell NW Bondeau 996
A Bugmann H Carter TR Gracia CA de la Vega-Leinert AC Erhard M Ewert 997
F Glendining M House JI Kankaanpaa S Klein RJT Lavorel S Lindner M 998
Metzger MJ Meyer J Mitchell TD Reginster I Rounsevell M Sabate S Sitch 999
S Smith B Smith J Smith P Sykes MT Thonicke K Thuiller W Tuck G 1000
38
Zaehle S amp Zierl B (2005) Ecosystem service supply and vulnerability to global change 1001
in Europe Science 310 1333-1337 1002
Sitch S Smith B Prentice IC Arneth A Bondeau A Cramer W Kaplan JO Levis 1003
S Lucht W Sykes MT Thonicke K amp Venevsky S (2003) Evaluation of ecosystem 1004
dynamics plant geography and terrestrial carbon cycling in the LPJ dynamic global 1005
vegetation model Global Change Biology 9 161-185 1006
Stewart DW Costa C Dwyer LM Smith DL Hamilton RI amp Ma BL (2003) 1007
Canopy structure light interception and photosynthesis in maize Agronomy Journal 95 1008
1465-1474 1009
Trnka M Dubrovsky M amp Zalud Z (2004) Climate change impacts and adaptation 1010
strategies in spring barley production in the Czech Republic Climatic Change 64 227-1011
255 1012
Turner DP Ritts WD Cohen WB Maeirsperger TK Gower ST Kirschbaum AA 1013
Running SW Zhao MS Wofsy SC Dunn AL Law BE Campbell JL Oechel 1014
WC Kwon HJ Meyers TP Small EE Kurc SA amp Gamon JA (2005) Site-level 1015
evaluation of satellite-based global terrestrial gross primary production and net primary 1016
production monitoring Global Change Biology 11 666-684 1017
van der Tol C Berry J Campbell PKE amp Rascher U (2014) Models of fluorescence 1018
and photosynthesis for interpreting measurements of solar-induced chlorophyll 1019
fluorescence Journal of Geophysical Research Biogeosciences IN PRESS 1020
van der Tol C Verhoef W amp Rosema A (2009a) A model for chlorophyll fluorescence 1021
and photosynthesis at leaf scale Agricultural and Forest Meteorology 149 96-105 1022
van der Tol C Verhoef W Timmermans A Verhoef A amp Su Z (2009b) An integrated 1023
model of soil-canopy spectral radiances photosynthesis fluorescence temperature and 1024
energy balance Biogeosciences 6 3109-3129 1025
Verhoef W (1984) Light scattering by leaf layers with application to canopy reflectance 1026
modeling The SAIL model Remote Sensing of Environment 16 125-141 1027
Verhoef W amp Bach H (2003a) Remote sensing data assimilation using coupled radiative 1028
transfer models Physics and Chemistry of the Earth 28 3-13 1029
Verhoef W amp Bach H (2003b) Simulation of hyperspectral and directional radiance 1030
images using coupled biophysical and atmospheric radiative transfer models Remote 1031
Sensing of Environment 87 23-41 1032
39
Verhoef W amp Bach H (2007) Coupled soil-leaf-canopy and atmosphere radiative transfer 1033
modeling to simulate hyperspectral multi-angular surface reflectance and TOA radiance 1034
data Remote Sensing of Environment 109 166-182 1035
Verhoef W Jia L Xiao Q amp Su Z (2007) Unified optical-thermal four-stream radiative 1036
transfer theory for homogeneous vegetation canopies Ieee Transactions on Geoscience 1037
and Remote Sensing 45 1808-1822 1038
Webb EK Pearman GI amp Leuning R (1980) Correction of flux measurements for 1039
density effects due to heat and water-vapour transfer Quarterly Journal of the Royal 1040
Meteorological Society 106 85-100 1041
Wu C Niu Z Tang Q amp Huang W (2010) Revised photochemical reflectance index 1042
(PRI) for predicting light use efficiency of wheat in a growth cycle validation and 1043
comparison International Journal of Remote Sensing 31 2911-2924 1044
Yang X Tang J Mustard JF Lee JE Rossini M Joiner J Munger JW Kornfeld 1045
A amp Richardson AD (2015) Solar-induced chlorophyll fluorescence that correlates with 1046
canopy photosynthesis on diurnal and seasonal scales in a temperate deciduous forest 1047
Geophysical Research Letters 1048
Zarco-Tejada PJ Berni JAJ Suarez L Sepulcre-Canto G Morales F amp Miller JR 1049
(2009) Imaging chlorophyll fluorescence with an airborne narrow-band multispectral 1050
camera for vegetation stress detection Remote Sensing of Environment 113 1262-1275 1051
Zarco-Tejada PJ Gonzalez-Dugo V amp Berni JAJ (2012) Fluorescence temperature and 1052
narrow-band indices acquired from a UAV platform for water stress detection using a 1053
micro-hyperspectral imager and a thermal camera Remote Sensing of Environment 117 1054
322-337 1055
Zarco-Tejada PJ Morales A Testi L amp Villalobos FJ (2013) Spatio-temporal patterns 1056
of chlorophyll fluorescence and physiological and structural indices acquired from 1057
hyperspectral imagery as compared with carbon fluxes measured with eddy covariance 1058
Remote Sensing of Environment 133 102-115 1059
Zhang Q Middleton EM Cheng YB amp Landis DR (2013) Variations of foliage 1060
chlorophyll fAPAR and foliage non-chlorophyll fAPAR (fAPARchl fAPARnonchl) at the 1061
Harvard Forest Ieee Journal of Selected Topics in Applied Earth Observations and Remote 1062
Sensing 6 2254-2264 1063
Zhang Q Middleton EM Gao BC amp Cheng YB (2012) Using EO-1 hyperion to 1064
simulate HyspIRI products for a coniferous forest The fraction of par absorbed by 1065
40
chlorophyll (fAPAR chl) and leaf water content (LWC) Ieee Transactions on Geoscience 1066
and Remote Sensing 50 1844-1852 1067
Zhang Y Guanter L Berry JA Joiner J van der Tol C Huete A Gitelson A Voigt 1068
M amp Koumlhler P (2014) Estimation of vegetation photosynthetic capacity from space-1069
based measurements of chlorophyll fluorescence for terrestrial biosphere models Global 1070
Change Biology 20 3727-3742 1071
1072
41
Appendix-A APEX data calibration 1073
The calibration of APEX images is based on the APEX Processing and Archiving Facility 1074
(PAF) which is the combined software and hardware designed to generate calibrated level 1 1075
at-sensor radiances from APEX raw image streams (Hueni et al 2009) Calibration 1076
coefficients for the radiometric geometric and spectral calibrations are generated from system 1077
calibrations at the APEX Calibration Home Base (CHB) at DLR Oberpfaffenhofen (Gege et 1078
al 2009) These CHB data are stored and processed within the APEX Calibration Information 1079
System (CAL IS) producing the so-called calibration cubes holding coefficients for each 1080
spatio-spectral pixel (Hueni et al 2013) 1081
For the multi-temporal dataset employed within this study all flight lines were 1082
reprocessed from the original raw image streams to ensure that the same version of the 1083
processor was applied The APEX PAF and CAL IS have significantly evolved over the 1084
timeframe of the dataset with calibrations getting more accurate over the years To ensure 1085
consistency all data were calibrated using coefficients obtained in May 2013 1086
The processor was specifically configured to retain the highest information content in 1087
the VNIR channel including i) no spectral resampling to compensate for spectral shifts and 1088
misregistrations (DOdorico et al 2010 DOdorico et al 2011) ii) no compensation of 1089
spectral shift related changes in radiometry (Hueni et al 2015) and iii) no spatial 1090
misregistration correction The calibration was thus effectively reduced to a linear dark 1091
current correction over time a de-smearing of the visible-NIR channel to compensate for 1092
sensor smear effects the application of radiometric gains and offsets followed by a destriping 1093
routine working in the spatial dimension only to remove pushbroom related along track 1094
striping Calibrated radiance data were directly used for the fluorescence retrieval (see Section 1095
24) while the feasibility to use APEX for SIF760 retrievals was theoretically demonstrated in 1096
42
a study of Damm et al (2011) Resulting SIF760 maps were afterwards geo-rectified using a 1097
parametric geocoding approach (Schlaumlpfer and Richter 2002) 1098
43
Appendix-B Retrieval of SIF760 from airborne data 1099
The quantification of SIF measured with ground or airborne-based spectrometers 1100
requires separating emitted SIF from the reflected radiance flux The Fraunhofer Line Depth 1101
(FLD) approach introduced by Plascyk (1975) serves as a de facto standard for medium 1102
resolution instruments such as APEX (Meroni et al 2009) and was applied in our study The 1103
FLD method uses atmospheric absorption bands characterized by lower incident light 1104
compared to wavelength regions outside of these bands This configuration increases the 1105
spectral information and allows the separation of SIF from reflected radiation In this study 1106
we used the broad O2-A oxygen absorption band around 760 nm and quantified the infilling of 1107
SIF760 using radiance measurements inside (subscript i) and outside (subscript o) of the O2-A 1108
band 1109
For the airborne case only atmospheric components can be simulated with 1110
MODTRAN-5 assuming perfect knowledge of the acquisition conditions The reflectance 1111
terms for diffuse and direct irradiance as well as the SIF760 contribution are usually unknown 1112
Assuming Lambertian surface reflectance behavior which introduces some inaccuracies but 1113
allows formulating the radiative transfer (RT) for radiance measurements at sensor level (LAtS) 1114
to obtain SIF760 both measurements inside and outside of the absorption band can be 1115
expressed as 1116
E9FA lang3H IJK LMNrangP QlangRSE rang T UlangVWWH VXWH rang∙langVYYH VYXH rangZH
Hlang[XXH rang T ABCHUlangVWWH ranglangVXWH rangZHlang[XXH rang ] ^ _ (B1) 1117
where E0 is the top-of-atmosphere irradiance including diffuse and direct irradiance 1118
components θil is the illumination zenith angle ρso is the path scattered radiance τss is the 1119
direct transmittance for sunlight τoo is the direct transmittance in view direction τsd is the 1120
diffuse transmittance of the atmosphere for sunlight τdo is the hemispherical-directional 1121
transmittance in view direction and ρdd is the spherical albedo If these atmospheric 1122
44
components are obtained from MODTRAN-5 simulations (Damm et al 2015 Verhoef and 1123
Bach 2003a b 2007) the radiative transfer equation (Eq B1) only contains four unknowns 1124
namely Ri Ro SIFi and SIFo The 3FLD method (Maier et al 2003) which is an adaptation of 1125
the original FLD method proposed by (Plascyk 1975) was used to linearly relate R and SIF 1126
inside and outside of the O2-A absorption band SIF can be finally retrieved with 1127
13 -0 abcMUdWecWlangRff_ rangZghcWUdMecMlangRff^ rangZiUdWecWlangRff_ rangZghUdMecMlangRff^ rangZ j
langVWWM ranglangVXWM rang (B2) 1128
kE lE9FA m lang3HW IJK LMNrangP langRSE rangn ] ^ _ (B3) 1129
E lang3HW IJK LMNrangP langoSSE TopSE rang ∙ langoE opE rang qEprs T Eprt] ^ _ (B4) 1130
r S13rlangoSSr rang T langopSr rang v13S$langoSSS rang T langopSS rangw (B5) 1131
where B is the factor relating SIFi and SIFo and was fixed to a value of 08 justified by 1132
simulations and experiments (Rascher et al 2009 Alonso et al 2008) Xj equals the at-1133
sensor radiance (reflected plus emitted radiation) without path radiance contribution and Ej 1134
expresses surface irradiance as measured at the sensor level A is the factor relating Ri and Ro 1135
and was derived from linear interpolation of R of the left (758 nm) and right (771 nm) O2-A 1136
band shoulder with 1137
xx+ (B6) 1138
y ```-0```z and y `-0`z
```z (B7) 1139
1140
Because APEX suffered from slight spectral smile effects (DOdorico et al 2010) 1141
updated center wavelength positions were involved in the convolution approach The spectral 1142
shift quantification for each pixel across track was based on the Cr method as described in 1143
45
Meroni et al (2010) The method assumes a high correlation between a measured and a 1144
convolved spectrum and iteratively minimizes a cost function which is 1 minus the Pearson 1145
correlation coefficient (r) calculated for both signals Remaining artifacts of the spectral shift 1146
correction and slightly inaccurate estimates of atmospheric properties cause SIF760 retrieval 1147
uncertainties We therefore applied a semi-empirical correction as described in Damm et al 1148
(2014) for each scan line across the track This technique employs reference surfaces which 1149
are free of any SIF760 emission (eg bare soil) to adjust the upward transmittance term inside 1150
the absorption feature oSSr The retrieval of SIF760 from top-of-canopy radiance data measured 1151
on ground follows the same approach as described in Eqs B2-B7 under the assumption that 1152
the surface irradiance can be approximated with the measurement of a reference panel and 1153
that ρso τdo and τdo can be set to 0 Furthermore the spectral resolution of APEX can be 1154
considered suboptimal for SIF760 retrievals although Damm et al (2011) demonstrate that 1155
APEX with its spectral resolution of 54 nm at 760 nm is sensitive for SIF760 However 1156
retrieved SIF760 values are too high and in an absolute sense incorrect We used reference 1157
SIF760 data obtained in parallel to the airborne acquisitions using the ASD field spectrometers 1158
(Section 23) to estimate the actual offset The observed scaling factor of 193 was afterwards 1159
applied to the retrieved SIF760 values to transfer them to a realistic value range 1160
46
Appendix-C SIF retrieval accuracy 1161
We applied a quantitative accuracy evaluation of resulting SIF760 maps using ground 1162
measured SIF760 values (Figure C1) Considering all reference data acquired during five 1163
campaigns a good linear relationship was achieved between ground and airborne-based 1164
SIF760 values (r2 = 071) but with a proportionality factor much higher than 1 (Figure C1-A) 1165
This experimentally obtained systematic overestimation of APEX SIF760 is comparable to 1166
simulation results documented in Damm et al (2011) Further we found slightly changing 1167
correlations between the different years (several linear models in Figure C1-A) which are 1168
likely caused by canopy structural effects spectral and radiometric performances of used 1169
ground instruments or slight deviations of the performance of APEX over time 1170
To compensate for the overestimation of APEX SIF760 we applied an empirical correction 1171
factor of 193 derived from the comparison of reference data and APEX which resulted in a 1172
rRMSE of 289 (Figure C1-B) 1173
1174
lt Figure C1 gt 1175
1176
The Laegeren site was covered with three adjacent flight lines having an overlap of 1177
approximately 10 (cf Figure 3) This configuration provides the opportunity to 1178
quantitatively evaluate the consistency of SIF retrievals obtained from different measurements 1179
and view zenith angles (ie plusmn 135deg) The comparison of SIF760 retrievals obtained from flight 1180
lines 1 and 2 reveals a moderate linear relationship for homogeneous agricultural surfaces (r2 1181
= 081 rRMSE = 57) We observed a systematic underestimation of flight line 1 compared 1182
to flight line 2 (factor 06) for a view zenith angle difference of ~26deg for SIF760 indicating 1183
either a directionality of SIF760 emissions or an insufficient decoupling of surface HCRF 1184
affected by reflectance anisotropy With increasing surface heterogeneity scattering increases 1185
47
and the agreement of retrieved SIF from both flight lines slightly decreases (ie for forested 1186
areas r2 of 05 and rRMSE of 88) This lower correlation can be mainly associated to slight 1187
geometric mis-registrations (ie max 2 pixel ~ 40 m) in combination with surface 1188
heterogeneity (eg shaded and sunlit tree crowns) and emission anisotropy of SIF760 Also 1189
negative SIF760 values are present in the SIF760 maps and caused by sensor noise and 1190
especially for forests due to shadowing effects (Damm et al 2015) 1191
48
Appendix-D Technical aspects determining the SIF760 retrieval accuracy 1192
A rigorous evaluation of the SIF760 retrieval accuracy is crucial to judge the reliability 1193
of our assessment on the relationship between SIF760 and GPPEC across ecosystems 1194
Furthermore additional factors imposing variations on SIF760 retrieved from airborne 1195
spectroscopy data that cannot be related to the physiological origin of SIF760 needs to be 1196
critically discussed to justify the proposed approach 1197
Ground-based measurements of SIF760 were made using field spectrometers to validate 1198
the airborne retrievals Field spectroscopy provides a good reference for validating airborne 1199
retrievals as it is likely not affected by biases resulting from atmospheric composition 1200
estimates (eg aerosol load) due to the simultaneous measurement of irradiance fluxes at 1201
canopy level using a reference panel The reliability of the applied field spectroscopic 1202
approach to measure SIF760 was previously demonstrated using field studies (Damm et al 1203
2010 Liu and Cheng 2010 Meroni et al 2009 Rascher et al 2009) and theoretical 1204
assessments (Damm et al 2011) It must be noted that field spectroscopic approaches are 1205
subject to uncertainties particularly for heterogeneous vegetation canopies Damm et al 1206
(2015) discussed retrieval errors caused by illumination effects likely introducing slight 1207
errors in reference SIF760 This source of uncertainty must be considered when judging the 1208
accuracy of APEX SIF760 The nevertheless good agreement between ground and airborne 1209
observations indicated that atmospheric absorption and scattering effects could be sufficiently 1210
compensated and thus demonstrated the reliability of retrieved SIF760 measurements In 1211
particular the empirical correction applied making use of high spatial resolution airborne IS 1212
data in combination with reference surfaces not emitting SIF760 allowed to bypass retrieval 1213
uncertainties caused by atmospheric effects (Damm et al 2014) 1214
Instrumental effects in combination with retrieval methods were found to cause 1215
systematic differences in SIF760 retrievals (Damm et al 2011) the comparatively low 1216
49
resolution of APEX around the O2-A band used to retrieve SIF760 (ie ~54 nm) resulted in an 1217
overestimation of APEX SIF760 compared to retrievals from high resolution instruments 1218
Indeed maximum APEX SIF760 values are 6 mW m-2 sr-1 nm-1 while typical SIF760 values 1219
obtained from high resolution instruments range between 0 and 3 mW m-2 sr-1 nm-1 (Guanter 1220
et al 2013) Considering SIF760 values retrieved from ASD data in original resolution (3 nm) 1221
APEX showed an overestimation of 1102 which confirmed that low spectral resolution 1222
resulted in an overestimation of SIF760 The reasoning for this absolute error is given by the 1223
sub-optimal spectral resolution of APEX with 54 nm at 760 nm causing a reduced sensitivity 1224
for SIF760 on the one hand and a wider distance of the O2-A shoulder values used to 1225
parameterize the 3FLD approach on the other hand The bias was corrected using the ASD 1226
reference data and does not impact the results of our analysis Further the relative variation of 1227
SIF760 is unaffected by the bias 1228
Surface heterogeneity complicates the retrieval of SIF760 According to Damm et al 1229
(2015) SIF760 retrievals for forest sites are especially subject to uncertainties due to 1230
assumptions on surface irradiance Crown shapes and associated surface orientations 1231
determine the intensity and quality of irradiance including fractional amounts of diffuse and 1232
direct irradiance To account for pixel wise changes in surface irradiance high resolution 1233
digital object models (DOM) (eg derived from LiDAR observations) are required In 1234
absence of such a high resolution DOMrsquos crowns are assumed to be flat which results in 1235
uncertainties of up to 58 in case of cast shadows (Damm et al 2015) Since we used 1236
averaged observations over larger areas representing flux tower footprints and most of our 1237
data were flown under comparable illumination conditions (ie around solar noon) we 1238
expect these potential biases to be less influential in this analysis 1239
1
Tables 1
Table 1 Date and time of APEX flights and corresponding eddy covariance flux tower 2
measurements for the three investigated ecosystems (ie grassland cropland mixed 3
temperate forest) 4
Date Time [UTC] Location Ecosystem Flux tower
17062009 950 Laegeren forest 1 tower
17062009 1030 Oensingen cropland 1 tower
17062009 1030 Oensingen grassland 2 tower
25062010 1030 Oensingen cropland 1 tower
25062010 1030 Oensingen grassland 2 tower
26062010 1500 Laegeren forest 1 tower
26062010 1030 Oensingen cropland 1 tower
26062010 1030 Oensingen grassland 2 tower
29062010 1030 Laegeren forest 1 tower
26062011 1030 Laegeren forest 1 tower
28062011 1030 Oensingen cropland 1 tower
28062011 1030 Oensingen grassland 1 tower
16062012 1025 Laegeren forest 1 tower
16062012 900 Oensingen cropland 1 tower
16062012 1100 Oensingen cropland 1 tower
12072013 730 Laegeren forest 1 tower
03092013 1050 Laegeren forest 1 tower
5
2
Table 2 Availability of reference SIF760 data obtained from field spectroscopy measurements 6
to validate APEX based SIF760 retrievals 7
Date time [UTC] Location Measured crops Nr points
17062009 1030 Oensingen maize rye pea sugar beet wheat white clover 29 points
25062010 1030 Oensingen maize pea sugar beet wheat white clover 15 points
16062012 900 Oensingen carrot maize winter wheat 11 points
16062012 1100 Oensingen carrot maize winter wheat 10 points
8
3
Table 3 Goodness of fit for the hyperbolic model describing the relationship between GPPEC 9
and SIF760 O PRI and MCARI2 for the three ecosystem types perennial grassland cropland 10
and mixed temperate forest Calculated statistics are based on all data acquired from 2009-11
2013 as described in Table 1 12
Optical variable Ecosystem Regression coefficient Relative RMSE []
SIF crops 088 355
grass 059 2708
forest 048 1588
PRI crops 0008 1176
grass 095 860
forest 009 2179
MCARI2 crops 0005 1029
grass 098 550
forest 034 1798
13
1
Figures 1
2
Figure 1 Study sites A Oensingen agricultural site B Laegeren forest site The white 3
rectangles represent in A the boundary of investigated fields that comprise most of the flux-4
tower footprints and in B a coarse outline of the footprint area of the flux-tower The white 5
crosses show the locations of the flux-towers Background RGB images from Google-Earth 6
2
7
Figure 2 APEX reflectance and SIF760 image for the Oensingen site acquired on the 2606 8
2010 1030 UTC A top-of-canopy hemispherical-conical reflectance data as true color 9
composite B SIF760 map The white boxes indicate the approximate position of the flux 10
tower 11
3
12
Figure 3 APEX reflectance and SIF760 image for the Laegeren site acquired on the 2606 13
2010 1510 UTC A top-of-canopy hemispherical-conical reflectance data as true color 14
composite B SIF760 map The black arrows indicate the flight direction of flight line 1 to 3 15
(FL1-FL3) The white line marks a transect along the overlapping region of FL1 and FL2 The 16
white boxes indicate the approximate position of the flux tower 17
4
18
Figure 4 Relationships between GPPEC from the eddy-covariance measurements and SIF760 O 19
instantaneously measured between 2009 and 2013 (see Table 1) with the airborne 20
spectrometer APEX (A) PRI index (B) and MCARI2 index (C) for three vegetation types 21
(black dots perennial grassland dark grey rectangles cropland including winter wheat pea 22
and barley grey triangles mixed temperate forest) The solid curves correspond to a 23
hyperbolic model fitted to the measured data The dashed curves show the extrapolated 24
behavior 25
5
26
Figure 5 Daily light response curves from eddy flux measurements for A cropland B 27
perennial grassland and C mixed temperate forest Data were acquired between 2009 and 28
2013 (see Table 1) Grey curves represent a fitted hyperbolic model to approximate the 29
behavior of measured PAR-GPP values Crosses show GPPEC measurements that were used 30
for the SIF760 O - GPPEC comparison based on the time of APEX flights PAR values are 31
binned in 20 mW m-2
sr-1
nm-1
increments 32
6
33
Figure 6 Leaf level relationships between photosynthetic (LUEp) and fluorescence yield 34
(LUEf) for a typical C3 crop Dependency of LUEp (A) and LUEf (B) on APAR C 35
Relationship between LUEp and LUEf D Relationship between APAR and GPPL GPPL was 36
calculated as APARLUEp E Relationship between APAR and SIF760 SIF760 was calculated 37
as APARLUEf assuming a constant relationship between the SCOPE output SIFtotalL 38
(integral between 640-850nm) and SIF760L F Relationship between SIF760 L and GPPL All 39
data were simulated using SCOPE The grey areas indicate illumination conditions 40
comparable to APEX flights 41
7
42
Figure 7 Canopy level relationships between photosynthetic (LUEp) and fluorescence yield 43
(LUEf) for different canopy representations of a C3 cropland in SCOPE Dependency of 44
LUEp (A) and LUEf (B) on APAR LUEp was calculate as GPPCAPAR and LUEf was 45
directly obtained from SCOPE C Relationship between LUEp and LUEf D Relationship 46
between APAR and GPPC GPPC was directly obtained from SCOPE E Relationship 47
between APAR and SIF760C SIF760C was directly obtained from SCOPE F Relationship 48
between SIF760C and GPPC The black dashed line corresponds to a C3 cropland with LAI = 49
30 fraction of brown pigments (Cs) = 00 and a spherical (sp) leaf inclination distribution 50
function (LIDF) For the grey line Cs was changed to 20 for the black dashed line the LAI 51
was changed to 10 and for the grey dasheddotted line the LIDF was changed to plagiophile 52
(pg) The grey areas indicate illumination conditions comparable to APEX flights 53
8
54
Figure 8 Impact of temporal scaling on the SIF760C-GPPC relationship SIF760C and GPPC 55
data were simulated using SCOPE Model input parameters air temperature (A) PAR (B) and 56
LAI (C) were measured within the NitroEurope project (httpwwwnitroeuropeeu) at the 57
Speulderbos forest site Netherlands D Relationship between SIF760C and GPPC including a 58
fitted hyperbolic model for daily averages (grey dots and grey line) monthly averages (dark 59
grey triangles and line) and quarterly data (black dots and black dashed line) 60
9
61
Figure C1 Comparison of ground and airborne-based SIF760 retrievals from various crops 62
Data were acquired during four campaigns between 2009 and 2012 in the agricultural site 63
Oensingen (see Table 2) Left Fitted linear regression lines for the four considered campaigns 64
are overlaid in black The dashed line corresponds to the 11 line Right SIF retrievals from 65
APEX after applying an empirical correction factor (193) The black line represents the fitted 66
linear model the dashed line corresponds to the 11 line 67
2
photosynthesis at ecologically relevant larger scales and provides an alternative approach to 24
study the terrestrial carbon cycle Recent studies demonstrated the reliability of measured SIF 25
signals and showed significant relationships between SIF and gross primary production (GPP) 26
at ecosystem and global scales Despite these encouraging results understanding the complex 27
mechanisms between SIF and GPP remains challenging before SIF can be finally utilized to 28
constrain estimates of GPP In this study we present a comprehensive assessment of the 29
relationship between far red SIF retrieved at 760 nm (SIF760) and GPP and its transferability 30
across three structurally and physiologically contrasting ecosystems perennial grassland 31
cropland and mixed temperate forest We use multi-temporal imaging spectroscopy (IS) data 32
acquired with the Airborne Prism Experiment (APEX) sensor as well as eddy covariance (EC) 33
flux tower data to evaluate the relationship between SIF760 and GPPEC We use simulations 34
performed with the coupled photosynthesis-fluorescence model SCOPE to prove trends 35
obtained from our observational data and assess apparent confounding factors such as 36
physiological and structural interferences or temporal scaling effects Observed relationships 37
between SIF760 and GPPEC were asymptotic and ecosystem-specific ie perennial grassland 38
(R2 = 059 rRMSE = 271) cropland (R2 = 088 rRMSE = 35) and mixed temperate 39
forest (R2 = 048 rRMSE = 1588) We demonstrate that asymptotic leaf level relationships 40
between SIF760-GPPEC became more linear at canopy level and scaled with temporal 41
aggregation We conclude that remote sensing of SIF provides a new observational approach 42
to decrease uncertainties in estimating GPP across ecosystems but requires dedicated 43
strategies to compensate for the various confounding factors impacting SIF-GPP 44
relationships Our findings help in bridging the gap between mechanistic understanding at leaf 45
level and ecosystem-specific observations of the relationships between SIF and GPP 46
47
Keywords Sun-induced chlorophyll fluorescence gross primary production airborne-based 48
spectroscopy APEX Fraunhofer line depth (FLD) eddy-covariance SCOPE 49
3
1 Introduction 50
Plant photosynthesis is a key process in terrestrial ecosystems mediating gas and 51
energy exchanges in the atmosphere-biosphere system (Baldocchi et al 2001 Ozanne et al 52
2003) Products of photosynthesis provide a wealth of ecosystem services that are essential 53
for human well-being including food fiber energy and oxygen (Imhoff et al 2004 54
Krausmann et al 2013 Schroter et al 2005) Photosynthesis as the underlying process for 55
plant growth is a particularly interesting indicator of crop efficiency and agricultural 56
management practices (Falloon and Betts 2010 Guanter et al 2014 Trnka et al 2004) both 57
of which having important implications for yield forecasts and for the implementation of 58
climate change adaptation strategies (IPCC 2013) 59
Observing the highly dynamic process of photosynthesis beyond the individual leaf or 60
plant levels in-situ is based on measuring the carbon dioxide (CO2) exchange between 61
vegetation and atmosphere with eddy-covariance (EC) flux towers and partitioning it into 62
gross primary production (GPP) and ecosystem respiration (Baldocchi et al 2001) 63
Measurements of plant - light interactions using spectrometers installed on for example EC 64
towers allow deriving information about the pigment status and provide an alternative 65
approach to estimate GPP (Balzarolo et al 2011 Gamon et al 2010 Hilker et al 2011) At 66
landscape scale photosynthesis can be assessed using process-based models (Sitch et al 67
2003) greenness-based satellite observations (Running et al 2004) or hybrid approaches 68
combining in-situ observations and statistical modeling (Jung et al 2011) All these 69
approaches provide important insights to study photosynthesis but usually do not allow 70
assessing photosynthesis at larger scales while preserving the high spatial variability present 71
in ecosystems EC flux tower measurements represent only smaller areas in preselected 72
ecosystems (Drolet et al 2008 Turner et al 2005) are not spatially distributed according to 73
carbon stocks (Schimel et al 2014) and do not allow spatial differentiations within the 74
4
measured footprint (Barcza et al 2009 Kljun et al 2002) Combined large scale modeling 75
and observational approaches based on vegetation greenness are spatially contiguous but face 76
the complexity of naturally varying systems including diverse interactions and complex 77
feedbacks which limit their predictive capabilities (Beer et al 2010 Goetz and Prince 1999 78
Turner et al 2005) 79
Over the last decade significant progress has been made in measuring plant-light 80
interactions and the process of photosynthesis Remote measurements of sun-induced 81
chlorophyll fluorescence (SIF) in particular open a new perspective to assess photosynthesis 82
at ecosystem scale SIF is a radiation flux emitted from plant chlorophyll molecules a few 83
nanoseconds after light absorption in the wavelength range from 600-800 nm and is 84
considered an indicator for the functional status of actual plant photosynthesis (Baker 2008) 85
Various studies demonstrated the possibility to measure SIF at certain wavelengths on ground 86
(Guanter et al 2013 Rascher et al 2009) from airborne platforms (Damm et al 2014 87
Guanter et al 2007 Zarco-Tejada et al 2012) and from satellites (Frankenberg et al 2011 88
Guanter et al 2014 Joiner et al 2013) Recent research demonstrated SIF being sensitive to 89
changes in photosynthesis showing strong links to GPP at the level of leaves (Meroni et al 90
2008 Middleton et al 2002) plants (Damm et al 2010 Rossini et al 2010) canopies (Zarco-91
Tejada et al 2013) and ecosystems (Frankenberg et al 2011 Guanter et al 2012) 92
Observed relationships between SIF and GPP are conceptually explained using an 93
approximation of GPP based on Monteithrsquos light use efficiency concept (Monteith 1972) 94
∙ (1) 95
where APAR is the absorbed photosynthetically active radiation expressed in radiance units 96
and LUEp is the efficiency of light utilization for photosynthesis and allows converting 97
measured radiances into the number of fixed CO2 molecules SIF is expressed by expanding 98
the GPP notation in Eq (1) following Guanter et al (2014) 99
13 ∙ ∙ (2) 100
5
where LUEf is the light use efficiency of SIF (fluorescence yield) and fesc accounts for a 101
structural interference determining the fraction of SIF photons escaping the canopy 102
Relationships between SIF and GPP are mostly driven by the common APAR term In 103
addition a covariance between both light use efficiencies LUEp and LUEf is expected to 104
occur in absence of the confounding impact of other protective mechanisms (Damm et al 105
2010 Guanter et al 2014) 106
The above outlined concept relating SIF and GPP simplifies a complex set of 107
underlying mechanisms and violation of any assumptions made will directly confound the 108
SIF-GPP relationship In particular the competition of three processes for de-exciting 109
absorbed light energy ie photochemistry radiative energy loss (SIF) and non-radiative 110
energy dissipation (commonly approximated as non-photochemical quenching NPQ) causes 111
complex and changing sensitivities of emitted SIF to actual rates of photosynthesis (Porcar-112
Castell et al 2014 van der Tol et al 2014 van der Tol et al 2009a) This directly implies that 113
the functional link between SIF and GPP depends on the rate of NPQ and consequently on 114
ambient stress levels At canopy scale the three-dimensional structure causes gradients in 115
light interception and light quality within canopies (Nobel et al 1993 Stewart et al 2003) 116
additionally altering the rate of NPQ (Demmig-Adams 1998 Niinemets et al 2003) and thus 117
impacting the SIF-GPP relationship Canopy structure also increases the probability for the 118
emitted SIF photons either to be re-absorbed by chlorophyll or to escape the canopy (Fournier 119
et al 2012 Knyazikhin et al 2013) to some extent violating the assumption of fesc to be 120
constant In addition to these structural and physiological effects variations in SIF signals 121
caused by for example instrumental (Damm et al 2011) or atmospheric effects (Damm et al 122
2014 Guanter et al 2010) and retrieval uncertainties related to the estimation of surface 123
irradiance (Damm et al 2015) can potentially affect the apparent relationship between SIF 124
and GPP Proper understanding of confounding factors remains crucial to use SIF to constrain 125
6
estimates for GPP at ecosystem or continental scales (Garbulsky et al 2014 Guanter et al 126
2012 Parazoo et al 2014) 127
Considering the above listed mechanisms several aspects need to be addressed to 128
further exploit SIF as a robust constraint for estimating GPP We therefore aim at 129
investigating the functional information content of SIF and its link to GPP considering three 130
structurally and physiologically contrasting ecosystems ie cropland perennial grassland 131
and mixed temperate forest We use an innovative combination of multi-temporal imaging 132
spectroscopy (IS) data EC flux tower observations and modeling approaches at the leaf and 133
canopy levels i) to assess the relationship between far red SIF retrieved in the O2-A band at 134
760 nm (SIF760) and GPP across ecosystems and ii) to investigate the impact of confounding 135
factors on the SIF760-GPP relationship ie temporal scaling effects and structural and 136
physiological interferences using a photosynthesis model Our findings contribute to a better 137
understanding of the information inherent in remotely measured SIF760 and its functional 138
relationship to GPP Aspects discussed will help bridging the gap between small scale studies 139
and observational attempts to estimate GPP globally 140
141
2 Methods 142
21 Study sites 143
We investigated three contrasting ecosystems located on the Central Swiss Plateau in 144
terms of structure heterogeneity species composition and annual productivity Two of these 145
ecosystems were collocated in the agricultural area near the town of Oensingen (47deg1711rdquo N 146
7deg4401rdquo E 452 masl Figure 1A) This area is characterized by relatively small agricultural 147
parcels with grassland clover fallow cropping bean maize rapeseed pea sugar beet winter 148
barley and winter wheat rotating as dominant crops Two grassland fields differently 149
managed in terms of species composition fertilization and harvesting activities (Ammann et 150
7
al 2007) were investigated as representatives of the ecosystem type perennial grassland as 151
well as a cropland (one field with arable crop rotation) for the ecosystem type cropland The 152
forest area (47deg2842rdquo N 8deg2152rdquo E Figure 1B) is located on the south-facing slope of the 153
Laegeren mountain northwest of the city of Zurich The temperate mixed forest is 154
characterized by a relatively high species diversity and a complex canopy structure with 155
beech ash sycamore and spruce being the dominant species (Eugster et al 2007 Schneider 156
et al 2014) 157
158
lt Figure 1 gt 159
160
Both test sites are well instrumented (ie with eddy-covariance flux towers 161
micrometeorological stations) and were extensively sampled during several airborne 162
campaigns between 2009 and 2013 (Table 1) 163
164
lt Table 1 gt 165
166
22 Airborne spectroscopy 167
All three study sites were measured with the Airborne Prism EXperiment (APEX) 168
sensor on several days between 2009 and 2013 (Table 1) APEX is an airborne dispersive 169
pushbroom imaging spectrometer covering the 400-2500 nm spectral region in 313 narrow 170
continuous spectral bands APEX allows capturing the O2-A atmospheric absorption feature 171
and thus retrieving SIF760 with a spectral sampling interval of 45 nm a full width at half 172
maximum (FWHM) of 57 nm and a signal to noise ratio of approximately 450 in and 800 173
outside of the O2-A feature for a 50 reflective target and a sun zenith angle of 30deg (Jehle et 174
al 2010 Schaepman et al 2015) 175
8
Radiance calibration of APEX images is performed using the approach of Hueni et al 176
(2009) Multitemporal comparison of images is secured by using consistent calibration and 177
processing versions Precise retrievals of SIF typically require data measured in sub-178
nanometer spectral resolution However the feasibility of using APEX like instruments (ie 179
FWHM ~5nm) for SIF760 retrievals was theoretically assessed in Damm et al (2011) and 180
experimentally demonstrated in recent work (Zarco-Tejada et al 2009 Zarco-Tejada et al 181
2013) The use of calibrated APEX radiance data for the fluorescence retrieval is described in 182
Section 24 and Appendix-B Vegetation indices (see Section 25) were calculated using 183
Hemispherical-Conical-Reflectance-Factor data obtained after atmospheric correction using 184
ATCOR-4 (Richter and Schlaumlpfer 2002) Resulting SIF760 and vegetation indices were 185
projected in the same map projection using parametric geocoding (Schlaumlpfer and Richter 186
2002) Details about APEX data calibration are listed in Appendix-A 187
188
23 Field spectroscopy 189
ASD (PANalytics Boulder US) field spectrometer data were acquired for validation 190
purposes within one hour of the APEX overflight during four campaigns In total 23 191
agricultural fields covering various crops including carrot maize pea rye sugar beet wheat 192
white clover were systematically sampled by measuring reflected and emitted radiances in 193
four homogeneous 3 m2 plots per field (Table 2) Incident light was quantified before and 194
after measuring each plot using a Spectralon reference panel 195
196
lt Table 2 gt 197
198
24 SIF760 retrieval 199
Emitted SIF was analytically separated from the reflected radiance flux measured with 200
ground and airborne-based spectrometers (see Appendix-B) We applied the Fraunhofer Line 201
9
Depth (FLD) approach (Plascyk 1975) which serves as a standard for SIF retrievals using 202
medium resolution instruments (Meroni et al 2009) The FLD method uses atmospheric 203
absorption bands characterized by lower incident light compared to wavelength regions 204
outside of these bands This configuration allows evaluating the in-filling of the absorption 205
bands by SIF (Damm et al 2014) In this study we used the broad O2-A oxygen absorption 206
band around 760 nm for the SIF760 retrieval For the ground data surface irradiance was 207
estimated from white reference measurements while perturbing atmospheric absorption and 208
scattering effects were assumed to be negligible on the 1 m pathway between canopy and 209
sensor (cf Damm et al (2014) for details on the set-up for SIF760 retrieval on the ground) 210
For the airborne measurements we compensated atmospheric absorption and scattering using 211
the atmospheric radiative transfer model MODTRAN5 (Berk et al 2005) Details of the 212
SIF760 retrievals using airborne data are provided in Appendix-B 213
214
25 Derivation of additional spectral indices 215
The relationship between two vegetation indices and GPP was investigated in parallel 216
to judge the performance of the new remote observation of SIF compared to commonly used 217
remote sensing approaches The photochemical reflectance index (PRI) (Gamon et al 1992) 218
was found to be sensitive to pigment changes related to the xanthophyll cycle and is 219
frequently used to quantify LUEp and GPP (Cheng et al 2013 Drolet et al 2008 Hilker et al 220
2009) The PRI was calculated as 221
(3) 222
while Rλ accounts for the surface reflectance at the wavelength λ 223
We further tested the soil adjusted Modified Chlorophyll Absorption Ratio Index 2 224
(MCARI2) (Haboudane et al 2004) that was found to be strongly related to green LAI thus 225
potential photosynthesis and is calculated as 226
10
2 $amp($)$+-amp0 (4) 227
228
26 Eddy-covariance measurements 229
Continuous turbulent fluxes of CO2 were measured at the agricultural and forest sites 230
between 2009 and 2013 using the EC technique (Baldocchi 2003) At each site the EC 231
instrumentation consisted of an open-path infrared gas analyzer (IRGA) (model LI-7500 LI-232
COR Inc Lincoln NE USA) and a three-dimensional sonic anemometer-thermometer 233
(models HS R3 and R2 Gill Instruments Lymington UK) EC measurements were made at a 234
frequency of 20 Hz and processed to half-hourly averages using the eth-flux EC software for 235
the forest and cropland (Mauder et al 2008) or a comparable custom-made EC software for 236
the grassland (Ammann et al 2007) Post-processing included corrections for damping losses 237
(Eugster and Senn 1995) air density fluctuations (Webb et al 1980) data screening for 238
optical sensor contamination stationary or low turbulence conditions (Foken and Wichura 239
1996) and statistical outliers Standardized gap filling and partitioning of CO2 fluxes was 240
performed using the methodology from Lasslop et al (2010) for the forest and cropland and 241
using the methodology from Falge et al (2001) for the grassland Measurements of 242
photosynthetic photon flux density (PPFD) quantified in micromol m-2 s-1 were converted to 243
radiance units (mW m-2 sr-1 nm-1) representing the photosynthetic active radiation (PAR) to 244
be consistent with Monteithrsquos LUE concept and the SIF radiance units 245
246
27 Leaf area index measurements 247
The Leaf Area Index (LAI) of the grassland and cropland was measured at the time of 248
APEX flights using an optical non-destructive approach based on LAI-2000 leaf area meter 249
observations (Li-Cor Lincoln USA) The LAI of the forest was estimated using digital 250
11
hemispherical photographs at two subplots following the VALERIE sampling scheme while 251
subsequent analysis were applied to obtain the LAI (Schneider et al 2014) 252
253
28 Statistical analysis of SIF760 - GPP relationship 254
SIF760 values were manually extracted from APEX-SIF760 maps for areas representing 255
the footprint of eddy-flux measurements (Figure 1) For the perennial grassland and cropland 256
we selected all pixels with SIF760 values ge 0 mW m-2 sr-1 nm-1 in respective fields although the 257
EC tower footprint can be slightly smaller than the entire field The increased number of 258
resulting pixels allows reducing data noise and covering small spatial variations within the 259
footprint Using the pixels of the entire field is justified by the large homogeneity of the 260
underlying fields (Figure 1A) For the forest site Laegeren all pixels representing an area that 261
covered 70 of all footprint occurrences were selected irrespective of spatial footprint 262
changes due to changing wind conditions Using the same area for all years reduces variations 263
in SIF due to changes in biomass and canopy structure but also reduces the representativeness 264
of selected pixels for actual spatial EC footprints 265
We used a hyperbolic model to relate GPP to SIF760 and to both vegetation indices 266
Although the hyperbolic model only empirically approximates the data behavior it is 267
supported by theoretical arguments for the SIF760-GPP relationship that are outlined hereafter 268
The photosynthetic efficiency LUEp is often described as a hyperbolic function of APAR 269
following the Michaelis-Menten theory (Michaelis and Menten 1913) 270
∙123467899 (5) 271
where c is a coefficient in radiance units and LUEpmax c represents GPPmax Following Eqs 272
(1) and (5) GPP rises asymptotically with APAR to GPPmax This equation is used in many 273
models for partitioning GPP eg Falge et al (2001) Substituting LUEp from Eq (5) and 274
APAR = SIF760 (LUEf fesc) from Eq (2) into Eq (1) results in 275
12
lt= gtampABCampD (6) 276
where the coefficient b represents cLUEffesc accounting for the difference between LUEp 277
and LUEf GPPmax is a value that is asymptotically reached representing the photosynthetic 278
capacity or GPP of the canopy at light saturation It must be noted that Eq (6) is a 279
simplification of the complex relationships between GPP and SIF760 and thus performs best if 280
c LUEf fesc remains constant or SIF760 corresponds to APAR A constant LUEf is a 281
reasonable first approximation for vegetation that is only moderately stressed meaning that 282
variations in LUEf are substantially smaller than variations in LUEp (van der Tol et al 2014) 283
Moderate stress relates to any kind of environmental conditions (warm temperature strong 284
irradiance reduced water availability) that cause only short term and slight changes in 285
photochemical and non-photochemical protections However c and fesc are known to vary 286
across ecosystems and LUEf changes under environmental stress In order to evaluate their 287
impacts on the SIF-GPP relationships as expressed in Eq (6) we carried out simulations with 288
the Soil-Canopy Observations of Photosynthesis and Energy balance model SCOPE version 289
153 (van der Tol et al 2009b) (see Section 29) The goodness of fit for the hyperbolic model 290
was quantified using non-linear regression analysis and was quantitatively described using the 291
root mean square error normalized by the mean of measured data (rRMSE) and the coefficient 292
of determination R2 defined as the correlation between data and the best fit-curve determined 293
by non-linear regression 294
295
29 SCOPE simulations 296
SCOPE uses semi-empirical models for LUEp (Collatz et al 1991) and LUEf (van der 297
Tol et al 2014) embedded in a radiative transfer scheme for the canopy (van der Tol et al 298
2009b) The radiative transfer model at leaf level (Fluspect) is an extension of PROSPECT 299
(Jacquemoud and Baret 1990) and includes a fluorescence component The radiative transfer 300
13
within the canopy is calculated following Verhoef (1984) in the optical domain (SAIL) 301
following Verhoef et al (2007) in the thermal domain and Miller et al (2005) for the 302
fluorescence emissions (FluorSAIL) SCOPE requires a number of vegetation structural and 303
physiological parameters as well as weather information as input The model simulates GPP 304
and spectrally distributes SIF with a spectral resolution and a spectral sampling interval of 10 305
nm each Simulated PPFD values (micromol m-2 s-1) were also converted to radiance units (PAR) 306
We carried out three simulations using SCOPE In the first simulation we calculated 307
leaf level LUEf and LUEp of a typical C3 cropland as function of varying APAR For the 308
second simulation at canopy level we calculated LUEf and LUEp as function of varying 309
APAR for differently structured canopies We took the standard SCOPE parameters for a 310
typical C3 cropland and varied APAR and the structural parameters LAI leaf inclination 311
angle (LIDF) and the fraction of brown pigments (Cs) Both simulation experiments provide 312
theoretical evidence on the relationships between LUEf and LUEp between SIF760 and GPP 313
and their respective relationships to APAR For the third canopy level simulation SCOPE 314
was initialized using time series of mid-day (solar noon) meteorological data (PAR air 315
temperature) a seasonal cycle of LAI and the modelrsquos default soil and vegetation parameters 316
for a C3 cropland (cf the SCOPE user manual) The purpose of this simulation was to 317
evaluate seasonal SIF760-GPP relationships at various temporal aggregation levels For better 318
readability we use the following notation through the manuscript SIF760 O for APEX-SIF 319
SIF760 L and SIF760 C for SCOPE simulated leaf and canopy SIF GPPEC for flux tower GPP 320
and GPPL GPPC to relate to simulated GPP at leaf and canopy level 321
322
3 Results 323
31 SIF760 maps 324
14
Two examples of SIF760 O maps obtained from APEX are shown in Figures 2 and 3 325
The appearance of SIF760 O emissions in vegetated areas demonstrates that measured SIF760 O 326
signals originated solely from vegetation and were not contaminated by non-fluorescent non-327
vegetation surfaces Retrieved SIF760 O values range between 0 and 3 mW m-2 sr-1 nm-1 and 328
showed a high agreement (r2 = 07 rRMSE = 289) with in-situ measured reference data 329
Details of the SIF760 O validation are discussed in Appendix-C 330
331
lt Figure 2 gt 332
lt Figure 3gt 333
334
32 Relationships of GPPEC with SIF760 O PRI and MCARI2 335
Relating instantaneous measurements of SIF760 O and GPPEC from several years 336
revealed an asymptotic relationship with saturating GPPEC in presence of moderate to high 337
SIF760 O (Figure 4A Table 3) This general behavior was consistent for all investigated 338
vegetation types The fitted hyperbolic model shows a moderate to high goodness of fit for the 339
grassland (R2 = 059 rRMSE = 271) cropland (R2 = 088 rRMSE = 35) and forest (R2 = 340
048 rRMSE = 1588) The saturation of GPPEC appeared earlier for the cropland (SIF760 O 341
~05 mW m-2 sr-1 nm-1) than for the grassland and forest (SIF760 O gt 10 mW m-2 sr-1 nm-1) An 342
independent assessment considering a linear model to describe the relationship between 343
SIF760 O and GPPEC revealed a consistently lower goodness of fit justifying the use of a 344
hyperbolic model (data not shown) 345
Statistical analysis showed that a hyperbolic model represents well the relationship 346
between both vegetation indices (PRI and MCARI2) and GPPEC for the grassland with a 347
notable variation in LAI (range between 05 and 48 m2 m-2) However a hyperbolic model 348
does not allow well representing the relationship between PRI and MCARI2 with GPPEC for 349
the forest and cropland both showing only a small variation in LAI (less than plusmn03 m2 m-2) 350
15
(Figure 4B-C Table 3) The goodness of fit for the hyperbolic model describing the PRI and 351
GPPEC data for grassland (R2 = 095 rRMSE = 86) was even higher compared to SIF760 O 352
but lower for forest (R2 = 009 rRMSE = 2179) and cropland (R2 = 0008 rRMSE = 353
1176) With MCARI2 the goodness of fit for the hyperbolic model for grassland was high 354
(R2 = 098 rRMSE = 55) but low for cropland (R2 = 0005 rRMSE = 1029) and forest 355
(R2 = 034 rRMSE = 1798) Again considering a linear relationship between both 356
vegetation indices and GPPEC revealed no consistent improvement compared to the use of a 357
hyperbolic model (data not shown) 358
359
lt Figure 4 gt 360
lt Table 3 gt 361
362
33 Assessment of factors determining SIF760 GPPEC relationships 363
The asymptotic relationship between SIF760 O and GPPEC (Figure 4A) represented 364
instantaneous measurements of different canopies at different times and days over several 365
years covering a range of different light conditions phenological stages of the forest and 366
various amounts of green biomass for both investigated grasslands (crosses in Figure 5A-C 367
that indicate EC measurements during APEX overpasses) Relationships between SIF760 O and 368
GPPEC are consequently a complex function of light absorption in the canopy (APAR) of the 369
efficiency of light utilization (ie expressed as photosynthetic capacity and quantum 370
efficiency of photosynthesis) and of structural effects including fractions of non-371
photosynthetic vegetation components Both grass canopies were measured before and after 372
mowing resulting in a large range in LAI (05-48 m2 m-2) and GPPEC (4-27 micromol m-2 s-1) for 373
similar PAR values The forest LAI of 50 m2 m-2 was more constant over the years due to the 374
consistent timing of flights however senescence (eg lower canopy chlorophyll content and 375
light absorption) might explain the decrease in GPPEC of 15 micromol m-2 s-1 in September for 376
16
comparable irradiance conditions (Figure 5C) Investigated crops (winter wheat barley and 377
pea) were characterized by small variations in LAI (22-25 m2 m-2) and chlorophyll contents 378
corresponding to small variations in GPPEC (5 micromol m-2 s-1) while observed under comparable 379
irradiance conditions During the time of observation the barley and wheat canopies were in 380
the ripening phase with a pronounced ear layer 381
382
lt Figure 5 gt 383
384
The validity of the asymptotic relationship between SIF760 O and GPPEC was tested 385
using simulations made with the SCOPE model We emphasize that the regression coefficient 386
b in Eq (6) includes terms that vary in the model (b= cmiddotLUEfmiddotfesc) the fluorescence efficiency 387
LUEf varies with irradiance conditions (predominantly APAR) the fraction fesc depends on 388
vegetation structure while c=GPPmaxLUEpmax varies between sites and over time during the 389
season We first analysed how LUEf and LUEp and consequently SIF760 and GPP vary at 390
leaf (ie SIF760 L and GPPL) and canopy levels (ie SIF760 C and GPPC) using the model of 391
van der Tol et al (2014) that is embedded in SCOPE For the leaf level Figure 6A shows a 392
decrease of LUEp with increasing APAR consistent with Eq (5) The relation between APAR 393
and LUEf appears more complex LUEf first increases with increasing APAR under low light 394
conditions reaches a climax at intermediate light and then decreases with increasing APAR 395
under higher APAR values (gt 50 mW m-2 sr-1 nm-1) (Figure 6B) The initial increase in LUEf 396
is caused by the decline in photochemical quenching of the excitons whereas the decrease of 397
LUEf is caused by the growing number of non-photochemical quenching traps that dissipate 398
light energy before it can be emitted as fluorescence light (van der Tol et al 2009a) It is 399
important to note that the range of LUEp is nearly an order of magnitude greater compared to 400
the range of LUEf (Figure 6C) Although LUEf is not constant we can still conclude that the 401
difference in both LUE terms causes an earlier saturation of leaf-level GPPL (Figure 6D) 402
17
compared to leaf-level SIF760 L (Figure 6E) with APAR leading to an asymptotic relationship 403
between SIF760 L and GPPL (Figure 6F) Our canopy level simulations confirm these trends 404
(Figure 7A-D) The in-field measured asymptotic relationships between SIF760 O and GPPEC 405
are consequently caused by the covariance of GPPEC and SIF760 O with APAR the 406
photosynthetic capacity with APAR and the different value ranges of LUEf and LUEp 407
Additionally our canopy level simulations suggest that structure impacts the SIF760 O - GPPEC 408
relationship Figure 7D shows an example that changing LAI leaf inclination angles or the 409
fraction of senescent plant material determine the curvature of the hyperbolic SIF760 C - GPPC 410
relationships 411
412
lt Figure 6 gt 413
lt Figure 7 gt 414
415
The modelled SIF760 LC - GPPLC curves (Figures 6D and 7D) also indicate that under 416
reduced light intensity GPP and SIF760 are almost linearly related while GPP tends to saturate 417
under higher light intensities Changes in APAR at canopy level are caused by either sun 418
elevation or in the case of a constant solar angle by canopy structure (ie shading fractional 419
vegetation cover) In complex structured canopies with many foliage layers the saturation of 420
GPP with APAR may not be observable because variations of APAR are less related to PAR 421
falling on the leaves but rather to the variation of leaf area exposed to light Model 422
simulations suggest that in complex canopies SIF760 saturates with APAR before GPP due to 423
fesc being lower with high APAR (data not shown) This structural effect reduces the curvature 424
of the hyperbolic leaf level GPPL- SIF760 L relationship at canopy level (compare Figures 6F 425
and 7F) Furthermore the effect of structure and APAR covary in time since canopy structure 426
(ie LAI) varies in concert with APAR during a seasonal cycle especially for crops We 427
18
expect that this covariance makes the relationship between GPP and SIF760 more linear at the 428
canopy level especially if observations are aggregated over time 429
To evaluate the structure related alleviation of the hyperbolic relationship between 430
SIF760 and GPP at canopy level in response to temporal aggregation we modelled an annual 431
course of GPPC and SIF760 C considering varying environmental conditions (Figure 8A-B) 432
ie PAR ranging from 0-500 mW m-2 sr-1 nm-1 air temperature ranging from 0-32degC using 433
data collected during 2009 at a Nitro-Europe flux tower site (Speulderbos The Netherlands) 434
and canopy properties ie LAI ranging from 15-30 m2 m-2 (Figure 8C) The LAI data are 435
synthetic but have a realistic seasonal cycle For daily noon values of modelled SIF760 C and 436
GPPC an asymptotic behaviour can be observed while GPPC tends to saturate compared to 437
SIF760 C The SIF760C-GPPC relationship tends to become linear when monthly or quarterly 438
averages are considered (Figure 8D) 439
440
lt Figure 8 gt 441
442
This visual trend can be confirmed by statistical measures for daily aggregated values 443
the hyperbolic model (rRMSE = 174 R2 = 070) performed slightly better than the linear 444
model (rRMSE = 185 r2 = 068) In case of monthly aggregated data both the hyperbolic 445
and linear models performed similarly while the linear model gave better results (RMSE = 446
90 r2 = 090) than the hyperbolic model (rRMSE = 94 R2 = 088) for quarterly aggregated 447
data 448
449
4 Discussion 450
Significant relationships between remotely measured SIF and ecosystem GPP have 451
been reported in the past (Frankenberg et al 2011 Guanter et al 2014) however sufficient 452
19
process understanding for using SIF as proxy for GPP across ecosystems is still limited 453
(Porcar-Castell et al 2014) Below we discuss how our observational and modeling 454
approaches help bridging the gap between mechanistic understanding at the leaf level and 455
ecosystem-specific observations and thus provide insights on mechanisms determining the 456
complex relationship between SIF and GPP 457
458
41 Insights from the observational approach 459
Our results showed ecosystem-specific asymptotic relationships between SIF760 O and 460
GPPEC for the three investigated ecosystems mixed temperate forest cropland and perennial 461
grassland The varying SIF-GPP relationships across ecosystems were consistent with results 462
recently reported from combined satellite observations and model predictions (Guanter et al 463
2012) Our results showed that the relationships of both tested vegetation indices PRI and 464
MCARI2 to GPPEC experienced a higher variability across ecosystems compared to SIF760 O 465
SIF760 O showed an ecosystem-specific and overall moderate to good relationship (R2 between 466
048 and 088) to GPPEC for the three ecosystems Both vegetation indices showed only strong 467
relationships for the grassland (R2 = 095 and 098) that notably changed in LAI during the 468
various observations It is important to note that we do not further elaborate on the underlying 469
mechanisms relating vegetation indices and GPPEC and that it is unclear if hyperbolic models 470
best describe their relationships to GPPEC based on mechanistic principles The intention of 471
evaluating the relationships between GPPEC and both vegetation indices was to provide a base 472
to judge the performance of SIF760 O in relation to these commonly used remote observations 473
The diversity of sampled conditions and used data sources provide further evidence on 474
the robustness of observed SIF760 O-GPPEC relationships Our measurements represent various 475
canopies characterized by different biomasses sampled over several years Although most 476
observations were acquired under similar light condition and physiological states a few 477
measurements represented lower light conditions and other physiological states This suggests 478
20
that observed relationships are rather robust across different representations of APAR LUEp 479
and LUEf Furthermore we use data from different sources ie four EC flux towers the 480
APEX imaging spectrometer and modeling at leaf and canopy levels to reduce the 481
uncertainties associated with each method of measurements and to get a better understanding 482
of the SIF760 O-GPPEC relationship at ecosystem level 483
Flux tower measurements are representative of a certain source area (footprint) from 484
the ecosystem which changes constantly based on wind direction and turbulent state of the 485
atmosphere Depending on the heterogeneity of the ecosystem GPPEC signals can vary in 486
response to changing footprints (Barcza et al 2009 Kljun et al 2004) although this variation 487
should be rather small if the vegetation is homogeneous Remote measurements of SIF760 are 488
likely representative of the upper layer of the ecosystem thus vertical canopy heterogeneity 489
potentially leads to a mismatch when compared to GPPEC which integrates over the different 490
layers of the ecosystems This is expected to be especially the case in structurally complex 491
ecosystems such as forests Although the upper layer in forest ecosystems substantially 492
contributes to the total rate of GPPEC there are still many layers of leaves or needles within 493
the canopy photosynthesizing at different rates depending on their sunshade exposure In 494
addition understory vegetation in forest ecosystems can significantly contribute to GPPEC at 495
different rates depending on the ecosystem and time of year Even homogeneous vegetation 496
canopies like crops or grasslands can show vertical heterogeneity This is especially the case 497
at peak biomass during ripening or senescence During such phenological stages the top layer 498
of cereal crops consists of less fluorescing components (ie ears) and cereal crops or 499
grasslands can contain a higher fraction of brown pigments resulting in low SIF760 O values 500
while the entire canopy can still produce high photosynthetic rates and thus GPPEC (Damm et 501
al 2010) Indeed most of the crops investigated in our study were in the ripening phase with a 502
pronounced ear layer 503
21
This resulted in relatively low SIF760 O values and in high GPPEC and thus in a more 504
pronounced asymptotic relationship (cf Figure 4A Figure 7F) compared to results reported 505
for other crops (Guanter et al 2013 Guanter et al 2014) Further research is needed to better 506
understand the impact of vertical heterogeneity on GPPEC and SIF760 observations and their 507
respective relationships 508
Despite the technical aspects causing variations in retrieved SIF760 O (refer to 509
Appendix-D for a detailed discussion) canopy structure causes inherent variations in 510
measured SIF760 values and thus impacts SIF760-GPP relationships The combination of 511
complex canopy architecture and the distribution of absorbing and scattering elements 512
determine vegetation canopies to act as photon traps (Knyazikhin et al 2013 Lewis and 513
Disney 2007) Parts of emitted SIF760 photons from inner-canopy leaves are re-absorbed 514
while others escape the canopy in direction of the sensor The probability of photons escaping 515
the canopy is a function of canopy structure which implies sensitivity to measured SIF760 516
intensities for canopy structure In Eq (2) this sensitivity was approximated with the term 517
fesc In our analysis we minimized the impact of fesc by observing always the same forest area 518
representative for the EC tower footprint In less complex structured crop and grass canopies 519
we expect fesc to be less important However future research is required to quantify the impact 520
of fesc and to propose strategies to compensate its influence on SIF760 retrievals 521
522
42 Insights from the modeling approach 523
From a theoretical point of view radiative energy loss competes with photochemistry 524
and non-radiative energy dissipation for absorbed photons Considering that GPP and SIF760 525
can be conceptualized according to Eqs (1) and (2) SIF760 must show under certain 526
environmental conditions a sensitivity to photochemistry (Porcar-Castell et al 2014 van der 527
Tol et al 2009a van der Tol et al 2009b) This relationship is confirmed by our observational 528
data and other studies at leaf (Amoros-Lopez et al 2008) and canopy levels (Damm et al 529
22
2010) Our modeling results however indicated that the relationship between LUEf and LUEp 530
is subject to change hence impacting the sensitivity of SIF760 to track changes in GPP 531
(Figures 6C and 7C) 532
The asymptotic relationship between SIF760 and GPP theoretically predicted and 533
observed at leaf and canopy levels can be related in particular to the different value ranges of 534
both efficiency terms (LUEp and LUEf) (Figures 6C and 7C) while a complex set of 535
mechanisms causes an ecosystem dependency for SIF760-GPP relationships The 536
photosynthetic capacity of the entire ecosystem in combination with its vertical heterogeneity 537
determines differences in GPP and SIF760 and thus the slope and curvature of their respective 538
relationships Furthermore the initial slope of the asymptotic SIF760 - GPP relationship which 539
has a value of LUEpmax(LUEfmiddotfesc) is determined by a combination of the photosynthetic 540
efficiency and canopy structure Canopy structure and related shadowing effects alter the 541
average light interception and quality at leaf level (Nobel et al 1993 Stewart et al 2003) and 542
consequently the overall productivity of the canopy In the case of reduced APAR caused by 543
canopy shadowing the overall apparent stress level in the canopy and consequently the rate 544
of certain photoprotective mechanisms such as non-radiative energy dissipation is reduced 545
(Cheng et al 2015 Demmig-Adams 1998 Niinemets et al 2003) and observed GPP and 546
SIF760 fall in a range where they are more linearly related (cf Figure 6F and 7F) In addition 547
canopy level simulations show that the fraction of senescent plant material impacts the 548
curvature of the hyperbolic relationship 549
Recent literature reports linear relationships between satellite-based SIF and modeled 550
GPP (Frankenberg et al 2011 Guanter et al 2012 Guanter et al 2014) while we found 551
asymptotic relationships Both results are not contradicting if one considers the temporal 552
aggregation applied to the data Our results are based on instantaneous measurements while 553
monthly averages were calculated for the satellite data to minimize noise effects (Frankenberg 554
et al 2011 Guanter et al 2014) It is known from previous research that temporal averaging 555
23
tends to linearize the response between GPP and APAR (Ruimy et al 1995) as saturating 556
light conditions tend to be only a small fraction of averaged diurnalmonthly data 557
Aggregating GPPEC and APAR over different time scales also showed this effect (data not 558
shown) Because of the rather linear relationship between SIF760 and APAR we expect that 559
temporal aggregation tends to linearize the SIF760-GPP relationship as well A recent study 560
presenting continuous measurements of GPP and SIF760 over a temperate deciduous forest 561
support this hypothesis (Yang et al 2015) The increasing number of experiments using 562
autonomous spectrometer systems in combination with flux towers (Balzarolo et al 2011) 563
will likely provide more experimental results that supports this finding Our simulations 564
provide further evidence that the covariance of structure and APAR during a seasonal cycle 565
additionally tends to linearize the relationship between GPP and SIF760 if observations are 566
aggregated over time 567
The dependency of SIF760-GPP relationships on temporal aggregation requires special 568
attention since it has implications on the usage of SIF to constrain GPP In principle 569
conclusions and results obtained from temporally aggregated and instantaneous measurements 570
are valid if consistently related to the underlying temporal aggregation level Generalizing 571
conclusions obtained at various aggregation levels bears the risk for mis-interpretations eg 572
when vegetation models are refined or empirically re-calibrated using observations or for 573
projections of GPP using observational SIF data 574
575
43 Requirements for the use of SIF to assess GPP across ecosystems 576
The changing relationship between SIF760 and GPPEC with vegetation type challenges 577
the usage of SIF760 as a robust constraint to estimate GPP Specific strategies are required to 578
account for ecosystem (or species) specific sensitivities of SIF in general and SIF760 in 579
particular This includes i) integration platforms to combine observations and process 580
24
understanding and ii) accurate observations of additional vegetation and environmental 581
variables 582
Process-based models as data integration platform in combination with comprehensive 583
observations to sufficiently measure important environmental factors and vegetation 584
properties are considered as flexible and powerful framework Parazoo et al (2014) for 585
example proposed the combination of ensemble dynamic global vegetation models (DGVMs) 586
in combination with SIF as observational constraint Lee et al (2015) suggest incorporating 587
SIF in a climate model to utilize SIF as observational constraint of photosynthesis simulations 588
and subsequent calculations of carbon water and energy cycle information Yet other studies 589
propose using SIF to obtain physiological vegetation parameters ie Vcmax for improved 590
parameterizations of photosynthesis models to eventually model GPP (Zhang et al 2014) The 591
European space agencys (ESA) Earth Explorer 8 opportunity mission Fluorescence Explorer 592
(FLEX) suggests a combination of comprehensive observations (ie SIF over the full 593
emission spectrum vegetation ecosystems and actual environmental conditions) and process-594
based models (Guanter et al 2012) 595
Additional information is required to use SIF in process-based models as one has to 596
account for varying photosynthetic efficiencies of plants and prevailing stress responses 597
According to the conceptualization of GPP and SIF as given in Eqs (1) and (2) extracting 598
and evaluating the exact relationship between LUEp and LUEf is essential but requires 599
normalizing APAR and calculating both yields (Damm et al 2010 Govindjee 2004 Louis et 600
al 2005) Retrievals of APAR can be considered challenging (Garbulsky et al 2010 Gitelson 601
and Gamon 2015 Hanan et al 2002) as available approaches often utilize a-priori knowledge 602
of prevailing land cover or plant distribution functions and rely on the inversion of physical-603
based models or simple band ratios (Hilker et al 2008) Research is required to provide high 604
quality information on APAR not perturbed by light absorption of non-photosynthetic active 605
25
canopy elements (stems branches twigs) cf Zhang et al (2013 2012) that demonstrate 606
attempts to improve estimates of APAR 607
Observed SIF760 O - GPPEC relationships are additionally confounded by non-radiative 608
energy dissipation The PRI was designed to monitor pigment changes related to the 609
xanthophyll cycle (Gamon et al 1992) and provides access to this superimposing process 610
However reported sensitivities of PRI for other effects ie structure (Barton and North 611
2001) pigment pool sizes (Gamon and Berry 2012) illumination effects (Damm et al 2015) 612
and the results obtained in this study question the applicability of the PRI at canopy level 613
Alternative approaches such as the development of a canopy PRI as suggested by several 614
groups (Hernandez-Clemente et al 2011 Kovac et al 2013 Wu et al 2010) or the usage of 615
pigment compositions and other functional plant traits might represent interesting strategies 616
and should be elaborated in future research 617
Structural sensitivities of canopy leaving SIF signals are critical and require further 618
research The application of spectrally invariant correction factors eg the directional area 619
scattering factor (Knyazikhin et al 2013) or more advanced physically-based retrieval 620
schemes using combined atmosphere-canopy models (Damm et al 2015 Laurent et al 2013) 621
might provide potential strategies to compensate for canopy structural effects on retrieved 622
SIF760 623
Another important source of information that allows improving the usage of SIF as 624
constraint of GPP is to consider SIF emissions over the entire emission spectrum between 625
approximately 600 and 800 nm Recent research successfully demonstrated the 626
complementary information content of red-fluorescence retrieved in the O2-B band at 688 nm 627
(SIF688) compared to SIF760 because of the different contributions from photosystem I and II 628
(Rossini et al 2015) Yet other studies highlighted the potential to improve predictions of 629
LUEp and GPP using both SIF688 and SIF760 (Cheng et al 2013) 630
631
26
5 Conclusions 632
Remote sensing of SIF provides a new observational approach to assess terrestrial 633
GPP Compared to traditional greenness-based remote sensing parameters we found SIF760 to 634
be more consistently related to GPPEC These results in combination with the more direct 635
mechanistic link between SIF760 and photosynthesis suggest that using SIF760 provides a 636
strategy to decrease uncertainty in estimating GPP across ecosystems 637
Our observational and modeling approaches revealed asymptotic and ecosystem-638
specific relationships for SIF760 and GPPEC We identified a set of interlinked mechanisms 639
determining SIF760-GPPEC relationships to be ecosystem specific ie the photosynthetic 640
capacity and efficiency of ecosystems the confounding impact of non-radiative energy 641
dissipation (NPQ) as well as ecosystem structure and the fraction of non-photosynthetic 642
vegetation components We demonstrated that SIF760-GPPEC relationships scale with temporal 643
aggregation due to a covariance of canopy structure and APAR over the seasonal cycle 644
We suggest going beyond empirical and ecosystem-specific relationships instead 645
using instantaneous observations comprehensively providing information on the full SIF 646
emission vegetation status and functioning as well as environmental conditions in 647
combination with process-based models Such approaches eg suggested for ESArsquos potential 648
ldquoFluorescence Explorerrdquo (FLEX) Earth Explorer mission provide a flexible framework to 649
account for the various influencing factors identified and to successfully apply SIF as 650
constraint of unbiased global GPP estimates 651
Furthermore research is required to improve the comparison between observations of 652
GPPEC and SIF Both observations stem from conceptually contrasting technologies ie 653
measurements of gas exchange vs plant-light interactions and provide independent and 654
complementary access to study ecosystem photosynthesis Despite the need to harmonize 655
horizontally differing footprints the vertical heterogeneity of ecosystems including the 656
27
varying contributions from different ecosystem layers must be better understood to harmonize 657
and successfully integrate both measurements 658
659
Acknowledgements 660
This work was supported by a grant of the Swiss University Conference and ETH-661
Board in frame of the Swiss Earth Observatory Network (SEON) project and by a grant of the 662
European Space Agency (ESA) in frame of the FLEX-PARCS E Paul-Limoges was 663
supported in part by the Natural Sciences and Engineering Research Council of Canada 664
through a postgraduate scholarship We would like to thank the APEX team for acquiring the 665
APEX data Authors sequence is listed following the FLAE approach (doi 666
101371journalpbio0050018) 667
28
References 668
Ammann C Flechard CR Leifeld J Neftel A amp Fuhrer J (2007) The carbon budget of 669
newly established temperate grassland depends on management intensity Agriculture 670
Ecosystems amp Environment 121 5-20 671
Amoros-Lopez J Gomez-Chova L Vila-Frances J Alonso L Calpe J Moreno J amp 672
del Valle-Tascon S (2008) Evaluation of remote sensing of vegetation fluorescence by 673
the analysis of diurnal cycles International Journal of Remote Sensing 29 5423-5436 674
Baker NR (2008) Chlorophyll Fluorescence A probe of photosynthesis in vivo Annual 675
Review of Plant Physiology and Plant Molecular Biology 59 89-113 676
Baldocchi D Falge E Gu LH Olson R Hollinger D Running S Anthoni P 677
Bernhofer C Davis K Evans R Fuentes J Goldstein A Katul G Law B Lee 678
XH Malhi Y Meyers T Munger W Oechel W U KTP Pilegaard K Schmid 679
HP Valentini R Verma S Vesala T Wilson K amp Wofsy S (2001) FLUXNET A 680
new tool to study the temporal and spatial variability of ecosystem-scale carbon dioxide 681
water vapor and energy flux densities Bulletin of the American Meteorological Society 682
82 2415-2434 683
Baldocchi DD (2003) Assessing the eddy covariance technique for evaluating carbon 684
dioxide exchange rates of ecosystems past present and future Global Change Biology 9 685
479-492 686
Balzarolo M Anderson K Nichol C Rossini M Vescovo L Arriga N Wohlfahrt G 687
Calvet J-C Carrara A Cerasoli S Cogliati S Daumard F Eklundh L Elbers JA 688
Evrendilek F Handcock RN Kaduk J Klumpp K Longdoz B Matteucci G 689
Meroni M Montagnani L Ourcival J-M Sanchez-Canete EP Pontailler J-Y 690
Juszczak R Scholes B amp Pilar Martin M (2011) Ground-Based Optical Measurements 691
at European Flux Sites A Review of Methods Instruments and Current Controversies 692
Sensors 11 7954-7981 693
Barcza Z Kern A Haszpra L amp Kljun N (2009) Spatial representativeness of tall tower 694
eddy covariance measurements using remote sensing and footprint analysis Agricultural 695
and Forest Meteorology 149 795-807 696
Barton CVM amp North PRJ (2001) Remote sensing of canopy light use efficiency using 697
the photochemical reflectance index - Model and sensitivity analysis Remote Sensing of 698
Environment 78 264-273 699
Beer C Reichstein M Tomelleri E Ciais P Jung M Carvalhais N Roedenbeck C 700
Arain MA Baldocchi D Bonan GB Bondeau A Cescatti A Lasslop G Lindroth 701
29
A Lomas M Luyssaert S Margolis H Oleson KW Roupsard O Veenendaal E 702
Viovy N Williams C Woodward FI amp Papale D (2010) Terrestrial Gross Carbon 703
Dioxide Uptake Global Distribution and Covariation with Climate Science 329 834-838 704
Berk A Anderson GP Acharya PK Bernstein LS Muratov L Lee J Fox M 705
Adler-Golden SM Chetwynd JH Hoke ML Lockwood RB Gardner JA Cooley 706
TW Borel CC amp Lewis PE (2005) MODTRAN5 A reformulated atmospheric band 707
model with auxiliary species and practical multiple scattering options Proceedings of the 708
Society of Photo-Optical Instrumentation Engineer 5655 662-667 709
Cheng SJ Bohrer G Steiner AL Hollinger DY Suyker A Phillips RP amp 710
Nadelhoffer KJ (2015) Variations in the influence of diffuse light on gross primary 711
productivity in temperate ecosystems Agricultural and Forest Meteorology 201 98-110 712
Cheng Y-B Middleton EM Zhang Q Huemmrich KF Campbell PKE Corp LA 713
Cook BD Kustas WP amp Daughtry CS (2013) Integrating Solar Induced 714
Fluorescence and the Photochemical Reflectance Index for Estimating Gross Primary 715
Production in a Cornfield Remote Sensing 5 6857-6879 716
Collatz GJ Ball JT Grivet C amp Berry JA (1991) Physiological and environmental-717
regulation of stomatal conductance photosynthesis and transpiration - a model that 718
includes a laminar boundary-layer Agricultural and Forest Meteorology 54 107-136 719
DOdorico P Alberti E amp Schaepman ME (2010) In-flight spectral performance 720
monitoring of the Airborne Prism Experiment Applied Optics 49 3082-3091 721
DOdorico P Guanter L Schaepman ME amp Schlaumlpfer D (2011) Performance 722
assessment of onboard and scene-based methods for Airborne Prism Experiment spectral 723
characterization Applied Optics 50 4755-4764 724
Damm A Erler A Gioli B Hamdi K Hutjes R Kosvancova M Meroni M 725
Miglietta F Moersch A Moreno J Schickling A Sonnenschein R Udelhoven T 726
Van der Linden S Hostert P amp Rascher U (2010) Remote sensing of sun induced 727
fluorescence yield to improve modelling of diurnal courses of Gross Primary Production 728
(GPP) Global Change Biology 16 171-186 729
Damm A Erler A Hillen W Meroni M Schaepman ME Verhoef W amp Rascher U 730
(2011) Modeling the impact of spectral sensor configurations on the FLD retrieval 731
accuracy of sun-induced chlorophyll fluorescence Remote Sensing of Environment 115 732
1882-1892 733
Damm A Guanter L Laurent VCE Schaepman ME Schickling A amp Rascher U 734
(2014) FLD-based retrieval of sun-induced chlorophyll fluorescence from medium 735
30
spectral resolution airborne spectroscopy data Remote Sensing of Environment 147 256-736
266 737
Damm A Guanter L Verhoef W Schlaumlpfer D Garbari S amp Schaepman ME (2015) 738
Impact of varying irradiance on vegetation indices and chlorophyll fluorescence derived 739
from spectroscopy data Remote Sensing of Environment 156 202-215 740
Demmig-Adams B (1998) Survey of thermal energy dissipation and pigment composition in 741
sun and shade leaves Plant and Cell Physiology 39 474-482 742
Drolet GG Middleton EM Huemmrich KF Hall FG Amiro BD Barr AG Black 743
TA McCaughey JH amp Margolis HA (2008) Regional mapping of gross light-use 744
efficiency using MODIS spectral indices Remote Sensing of Environment 112 3064-3078 745
Eugster W amp Senn W (1995) A cospectral correction model for measurement of turbulent 746
NO2 fluxes Boundary-Layer Meteorology 74 321-340 747
Eugster W Zeyer K Zeeman M Michna P Zingg A Buchmann N amp Emmenegger 748
L (2007) Methodical study of nitrous oxide eddy covariance measurements using 749
quantum cascade laser spectrometery over a Swiss forest Biogeosciences 4 927-939 750
Falge E Baldocchi D Olson R Anthoni P Aubinet M Bernhofer C Burba G 751
Ceulemans R Clement R Dolman H Granier A Gross P Grunwald T Hollinger 752
D Jensen NO Katul G Keronen P Kowalski A Lai CT Law BE Meyers T 753
Moncrieff H Moors E Munger JW Pilegaard K Rannik U Rebmann C Suyker 754
A Tenhunen J Tu K Verma S Vesala T Wilson K amp Wofsy S (2001) Gap 755
filling strategies for defensible annual sums of net ecosystem exchange Agricultural and 756
Forest Meteorology 107 43-69 757
Falloon P amp Betts R (2010) Climate impacts on European agriculture and water 758
management in the context of adaptation and mitigation-The importance of an integrated 759
approach Science of the Total Environment 408 5667-5687 760
Foken T amp Wichura B (1996) Tools for quality assessment of surface-based flux 761
measurements Agricultural and Forest Meteorology 78 83-105 762
Fournier A Daumard F Champagne S Ounis A Goulas Y amp Moya I (2012) Effect 763
of canopy structure on sun-induced chlorophyll fluorescence Isprs Journal of 764
Photogrammetry and Remote Sensing 68 112-120 765
Frankenberg C Fisher JB Worden J Badgley G Saatchi SS Lee JE Toon GC 766
Butz A Jung M Kuze A amp Yokota T (2011) New global observations of the 767
terrestrial carbon cycle from GOSAT Patterns of plant fluorescence with gross primary 768
productivity Geophysical Research Letters 38 769
31
Gamon JA amp Berry JA (2012) Facultative and constitutive pigment effects on the 770
Photochemical Reflectance Index (PRI) in sun and shade conifer needles Israel Journal of 771
Plant Sciences 60 85-95 772
Gamon JA Coburn C Flanagan LB Huemmrich KF Kiddle C Sanchez-Azofeifa 773
GA Thayer DR Vescovo L Gianelle D Sims DA Rahman AF amp Pastorello 774
GZ (2010) SpecNet revisited bridging flux and remote sensing communities Canadian 775
Journal of Remote Sensing 36 S376-S390 776
Gamon JA Penuelas J amp Field CB (1992) A narrow-waveband spectral index that 777
tracks diurnal changes in photosynthetic efficiency Remote Sensing of Environment 41 778
35-44 779
Garbulsky MF Filella I Verger A amp Penuelas J (2014) Photosynthetic light use 780
efficiency from satellite sensors From global to Mediterranean vegetation Environmental 781
and Experimental Botany 103 3-11 782
Garbulsky MF Penuelas J Papale D Ardo J Goulden ML Kiely G Richardson 783
AD Rotenberg E Veenendaal EM amp Filella I (2010) Patterns and controls of the 784
variability of radiation use efficiency and primary productivity across terrestrial 785
ecosystems Global Ecology and Biogeography 19 253-267 786
Gege P Fries J Haschberger P Schoumltz P Schwarzer H Strobl P Suhr B Ulbrich 787
G amp Vreeling WJ (2009) Calibration facility for airborne imaging spectrometers 788
ISPRS Journal of Photogrammetry amp Remote Sensing 64 387ndash397 789
Gitelson AA amp Gamon JA (2015) The need for a common basis for defining light-use 790
efficiency Implications for productivity estimation Remote Sensing of Environment 156 791
196-201 792
Goetz SJ amp Prince SD (1999) Modelling terrestrial carbon exchange and storage 793
Evidence and implications of functional convergence in light-use efficiency Advances in 794
Ecological Research Vol 28 (pp 57-92) 795
Govindjee (2004) Chlorophyll a fluorescence A bit of basics and history In GC 796
Papageorgiou amp Govindjee (Eds) Chlorophyll a Fluorescence A Signature of 797
Photosynthesis Advances in Photosynthesis and Respiration (pp 1-42) Dordrecht 798
Springer 799
Guanter L Alonso L Gomez-Chova L Amoros-Lopez J Vila J amp Moreno J (2007) 800
Estimation of solar-induced vegetation fluorescence from space measurements 801
Geophysical Research Letters 34 doi 1010292007GL029289 802
32
Guanter L Alonso L Gomez-Chova L Meroni M Preusker R Fischer J amp Moreno 803
J (2010) Developments for vegetation fluorescence retrieval from spaceborne high-804
resolution spectrometry in the O2-A and O2-B absorption bands Journal of Geophysical 805
Research-Atmospheres 115 806
Guanter L Frankenberg C Dudhia A Lewis PE Goacutemez-Dans J Kuze A Suto H amp 807
Grainger R (2012) Retrieval and global assessment of terrestrial chlorophyll fluorescence 808
from GOSAT space measurements Remote Sensing of Environment 121 236-251 809
Guanter L Rossini M Colombo R Meroni M Frankenberg C Lee J-E amp Joiner J 810
(2013) Using field spectroscopy to assess the potential of statistical approaches for the 811
retrieval of sun-induced chlorophyll fluorescence from ground and space Remote Sensing 812
of Environment 133 52-61 813
Guanter L Zhang Y Jung M Joiner J Voigt M Berry JA Frankenberg C Huete 814
AR Zarco-Tejada P Lee J-E Moran MS Ponce-Campos G Beer C Camps-815
Valls G Buchmann N Gianelle D Klumpp K Cescatti A Baker JM amp Griffis 816
TJ (2014) Global and time-resolved monitoring of crop photosynthesis with chlorophyll 817
fluorescence Proceedings of the National Academy of Sciences of the United States of 818
America 111 E1327-E1333 819
Haboudane D Miller JR Pattey E Zarco-Tejada PJ amp Strachan IB (2004) 820
Hyperspectral vegetation indices and novel algorithms for predicting green LAI of crop 821
canopies Modeling and validation in the context of precision agriculture Remote Sensing 822
of Environment 90 337-352 823
Hanan NP Burba G Verma SB Berry JA Suyker A amp Walter-Shea EA (2002) 824
Inversion of net ecosystem CO2 flux measurements for estimation of canopy PAR 825
absorption Global Change Biology 8 563-574 826
Hernandez-Clemente R Navarro-Cerrillo RM Suarez L Morales F amp Zarco-Tejada 827
PJ (2011) Assessing structural effects on PRI for stress detection in conifer forests 828
Remote Sensing of Environment 115 2360-2375 829
Hilker T Coops NC Wulder MA Black TA amp Guy RD (2008) The use of remote 830
sensing in light use efficiency based models of gross primary production A review of 831
current status and future requirements Science of the Total Environment 404 411-423 832
Hilker T Gitelson A Coops NC Hall FG amp Black TA (2011) Tracking plant 833
physiological properties from multi-angular tower-based remote sensing Oecologia 165 834
865-876 835
33
Hilker T Lyapustin A Hall FG Wang Y Coops NC Drolet G amp Black TA 836
(2009) An assessment of photosynthetic light use efficiency from space Modeling the 837
atmospheric and directional impacts on PRI reflectance Remote Sensing of Environment 838
113 2463-2475 839
Hueni A Biesemans J Meuleman K DellEndice F Schlaumlpfer D Adriaensen S 840
Kempenaers S Odermatt D Kneubuehler M Nieke J amp Itten K (2009) Structure 841
Components and Interfaces of the Airborne Prism Experiment (APEX) Processing and 842
Archiving Facility IEEE Transactions on Geoscience and Remote Sensing 47 29-43 843
Hueni A Lenhard K Baumgartner A amp Schaepman M (2013) The APEX (Airborne 844
Prism Experiment - Imaging Spectrometer) Calibration Information System IEEE 845
Transactions on Geoscience and Remote Sensing 51 5169-5180 846
Hueni A Schlaepfer D Jehle M amp Schaepman M (2015) Impacts of Dichroic Prism 847
Coatings on Radiometry of the Airborne Imaging Spectrometer APEX Applied Optics 53 848
5344-5352 849
Imhoff ML Bounoua L Ricketts T Loucks C Harriss R amp Lawrence WT (2004) 850
Global patterns in human consumption of net primary production Nature 429 870-873 851
IPCC (2013) Summary for policymakers Climate change 2013 the physical science basis 852
Cambridge University Press Cambridge United Kingdom and New York NY USA 853
Jacquemoud S amp Baret F (1990) PROSPECT A model of leaf optical properties spectra 854
Remote Sensing of Environment 34 75-91 855
Jehle M Hueni A Damm A DOdorico P Kneubuumlhler M Meuleman K Schlapfer 856
D Schaepman ME amp Weyermann J (2010) APEX - current status performance and 857
validation concept IEEE Sensors 2010 Conference 533-537 858
Joiner J Guanter L Lindstrot R Voigt M Vasilkov AP Middleton EM Huemmrich 859
KF Yoshida Y amp Frankenberg C (2013) Global monitoring of terrestrial chlorophyll 860
fluorescence from moderate spectral resolution near-infrared satellite measurements 861
methodology simulations and application to GOME-2 Atmos Meas Tech Discuss 6 862
3883-3930 863
Jung M Reichstein M Margolis HA Cescatti A Richardson AD Arain MA 864
Arneth A Bernhofer C Bonal D Chen J Gianelle D Gobron N Kiely G Kutsch 865
W Lasslop G Law BE Lindroth A Merbold L Montagnani L Moors EJ 866
Papale D Sottocornola M Vaccari F amp Williams C (2011) Global patterns of land-867
atmosphere fluxes of carbon dioxide latent heat and sensible heat derived from eddy 868
34
covariance satellite and meteorological observations Journal of Geophysical Research-869
Biogeosciences 116 870
Kljun N Kastner-Klein P Fedorovich E amp Rotach MW (2004) Evaluation of 871
Lagrangian footprint model using data from wind tunnel convective boundary layer 872
Agricultural and Forest Meteorology 127 189-201 873
Kljun N Rotach MW amp Schmid HP (2002) A three-dimensional backward lagrangian 874
footprint model for a wide range of boundary-layer stratifications Boundary-Layer 875
Meteorology 103 205-226 876
Knyazikhin Y Schull MA Stenberg P Mottus M Rautiainen M Yang Y Marshak 877
A Latorre Carmona P Kaufmann RK Lewis P Disney MI Vanderbilt V Davis 878
AB Baret F Jacquemoud S Lyapustin A amp Myneni RB (2013) Hyperspectral 879
remote sensing of foliar nitrogen content Proceedings of the National Academy of 880
Sciences of the United States of America 110 E185-E192 881
Kovac D Malenovsky Z Urban O Spunda V Kalina J Ac A Kaplan V amp Hanus 882
J (2013) Response of green reflectance continuum removal index to the xanthophyll de-883
epoxidation cycle in Norway spruce needles Journal of Experimental Botany 64 1817-884
1827 885
Krausmann F Erb K-H Gingrich S Haberl H Bondeau A Gaube V Lauk C 886
Plutzar C amp Searchinger TD (2013) Global human appropriation of net primary 887
production doubled in the 20th century Proceedings of the National Academy of Sciences 888
of the United States of America 110 10324-10329 889
Lasslop G Reichstein M Papale D Richardson AD Arneth A Barr A Stoy P amp 890
Wohlfahrt G (2010) Separation of net ecosystem exchange into assimilation and 891
respiration using a light response curve approach critical issues and global evaluation 892
Global Change Biology 16 187-208 893
Laurent VCE Verhoef W Damm A Schaepman ME amp Clevers JGPW (2013) A 894
Bayesian object-based approach for estimating vegetation biophysical variables from at-895
sensor APEX radiance data Remote Sensing of Environment 139 6-17 896
Lee JE Berry JA Van der Tol C Yang X Guanter L Damm A Baker I amp 897
Frankenberg C (2015) Simulations of chlorophyll fluorescence in corporated into the 898
Community Land Model version 4 Global Change Biology in print 899
Lewis P amp Disney M (2007) Spectral invariants and scattering across multiple scales from 900
within-leaf to canopy Remote Sensing of Environment 109 196-206 901
35
Liu LY amp Cheng ZH (2010) Detection of Vegetation Light-Use Efficiency Based on 902
Solar-Induced Chlorophyll Fluorescence Separated From Canopy Radiance Spectrum Ieee 903
Journal of Selected Topics in Applied Earth Observations and Remote Sensing 3 306-312 904
Louis J Ounis A Ducruet JM Evain S Laurila T Thum T Aurela M Wingsle G 905
Alonso L Pedros R amp Moya I (2005) Remote sensing of sunlight-induced chlorophyll 906
fluorescence and reflectance of Scots pine in the boreal forest during spring recovery 907
Remote Sensing of Environment 96 37-48 908
Maier SW Guumlnther KP amp Stellmes M (2003) Sun-Induced Fluorescence A New Tool 909
for Precision Farming In M McDonald J Schepers L Tartly T van Toai amp D Major 910
(Eds) Digital Imaging and Spectral Techniques Applications to Precision Agriculture 911
and Crop Physiology (pp 209-222) ASA Special Publication 912
Mauder M Foken T Clement R Elbers JA Eugster W Gruenwald T Heusinkveld 913
B amp Kolle O (2008) Quality control of CarboEurope flux data - Part 2 Inter-914
comparison of eddy-covariance software Biogeosciences 5 451-462 915
Meroni M Busetto L Guanter L Cogliati S Crosta GF Migliavacca M Panigada 916
C Rossini M amp Colombo R (2010) Characterization of fine resolution field 917
spectrometers using solar Fraunhofer lines and atmospheric absorption features Applied 918
Optics 49 2858-2871 919
Meroni M Picchi V Rossini M Cogliati S Panigada C Nali C Lorenzini G amp 920
Colombo R (2008) Leaf level early assessment of ozone injuries by passive fluorescence 921
and photochemical reflectance index International Journal of Remote Sensing 29 5409-922
5422 923
Meroni M Rossini M Guanter L Alonso L Rascher U Colombo R amp Moreno J 924
(2009) Remote sensing of solar induced chlorophyll fluorescence review of methods and 925
applications Remote Sensing of Environment doi101016jrse200905003 926
Michaelis L amp Menten ML (1913) The kenetics of the inversion effect Biochemische 927
Zeitschrift 49 333-369 928
Middleton E McMurtney JE Campbell PK Corp LA Butcher LM amp Chappelle 929
EW (2002) Optical and fluorescence properties of corn leaves from different nitrogen 930
regimes In M Owe G Durso amp L Toulios (Eds) Conference on Remote Sensing for 931
Agriculture Ecosystems and Hydrology IV (pp 72-83) Agia Pelagia Greece 932
Miller JR Berger M Goulas Y Jacquemoud S Louis J Moise N Mohammed G 933
Moreno J Moya I Pedroacutes R Verhoef W amp Zarco-Tejada PJ (2005) Development 934
36
of a vegetation fluorescence canopy model Final Report May 2005 In European Space 935
Research and Technology Centre (ESTEC) 936
Monteith JL (1972) Solar-radiation and productivity in tropical ecosystems Journal of 937
Applied Ecology 9 747-766 938
Niinemets U Kollist H Garcia-Plazaola JI Hernandez A amp Becerril JM (2003) Do 939
the capacity and kinetics for modification of xanthophyll cycle pool size depend on growth 940
irradiance in temperate trees Plant Cell and Environment 26 1787-1801 941
Nobel PS Forseth IN amp Long SP (1993) Canopy structure and light interception 942
Ozanne CMP Anhuf D Boulter SL Keller M Kitching RL Korner C Meinzer 943
FC Mitchell AW Nakashizuka T Dias PLS Stork NE Wright SJ amp 944
Yoshimura M (2003) Biodiversity meets the atmosphere A global view of forest 945
canopies Science 301 183-186 946
Parazoo NC Bowman K Fisher JB Frankenberg C Jones DBA Cescatti A Peacuterez-947
Priego Oacute Wohlfahrt G amp Montagnani L (2014) Terrestrial gross primary production 948
inferred from satellite fluorescence and vegetation models Global Change Biology na-na 949
Plascyk JA (1975) MK II Fraunhofer Line Dicsriminator (FLD-II) for airborne and orbital 950
remote-sensing of solar-stimulated luminescence Optical Engineering 14 339-346 951
Porcar-Castell A Tyystjaumlrvi E Atherton J Van der Tol C Flexas J EE P Moreno 952
J Frankenberg C amp Berry JA (2014) Linking chlorophyll a fluorescence to 953
photosynthesis for remote sensing applications mechanisms and challenges Journal of 954
Experimental Botany 65 4065-4095 955
Rascher U Agati G Alonso L Cecci G Champagne S Colombo R Damm A 956
Daumard F De Miguel E Fernandez G Franch B Franke J Gerbig C Gioli B 957
Gomez JA Goulas Y Guanter L Gutierrez-De-La-Camara O Hamdi K Hostert 958
P Jimenez M Kosvancova M Lognoli D Meroni M Miglietta F Moersch A 959
Moreno J Moya I Neininger B Okujeni A Ounis A Palombi L Raimondi V 960
Schickling A Sobrino JA Stellmes M Toci G Toscano P Udelhoven T Van der 961
Linden S amp Zaldei A (2009) CEFLES2 The remote sensing component to quantify 962
photosynthetic efficiency from the leaf to the region by measuring sun-induced 963
fluorescence in the oxygen absorption bands Biogeosciences 6 1181-1198 964
Richter R amp Schlaumlpfer D (2002) Geo-atmospheric processing of airborne imaging 965
spectrometry data Part 2 Atmospherictopographic correction International Journal of 966
Remote Sensing 23 2631-2649 967
37
Rossini M Meroni M Migliavacca M Manca G Cogliati S Busetto L Picchi V 968
Cescatti A Seufert G amp Colombo R (2010) High resolution field spectroscopy 969
measurements for estimating gross ecosystem production in a rice field Agricultural and 970
Forest Meteorology 150 1283-1296 971
Rossini M Nedbal L Guanter L Ač A Alonso L Burkart A Cogliati S Colombo 972
R Damm A Drusch M Hanus J Julitta T Kokkalis P Moreno J Panigada C 973
Pinto F Schickling A Schuumlttemeyer D Zemek F amp Rascher U (2015) Red and far-974
red sun-induced chlorophyll fluorescence as a measure of plant photosynthesis 975
Geophysical Research Letters (accepted for publication) 976
Ruimy A Jarvis PG Baldocchi DD amp B S (1995) CO2 Fluxes over Plant Canopies 977
and Solar Radiation A Review Advances in Ecological Research 26 1-68 978
Running SW Nemani RR Heinsch FA Zhao MS Reeves M amp Hashimoto H 979
(2004) A continuous satellite-derived measure of global terrestrial primary production 980
Bioscience 54 547-560 981
Schaepman ME M J Hueni A DrsquoOdorico P Damm A Weyermann J Schneider F 982
Laurent VCE C P Seidel F Lenhard K Gege P Kuechler C Brazile J Kohler 983
P De Vos L Meuleman K Meynart R Schlaepfer D Kneubuumlhler M amp Itten K 984
(2015) Advanced radiometry measurements and Earth science applications with the 985
Airborne Prism Experiment (APEX) Remote Sensing of Environment 158 207-219 986
Schimel D Pavlick R Fisher JB Asner GP Saatchi S Townsend P Miller C 987
Frankenberg C Hibbard K amp Cox P (2014) Observing terrestrial ecosystems and the 988
carbon cycle from space Global Change Biology na-na 989
Schlaumlpfer D amp Richter R (2002) Geo-atmospheric processing of airborne imaging 990
spectrometry data Part 1 Parametric orthorectification International Journal of Remote 991
Sensing 23 2609-2630 992
Schneider FD Leiterer R Morsdorf F Gastellu-Etchegorry J-P Lauret N Pfeifer N 993
amp Schaepman ME (2014) Simulating imaging spectrometer data 3D forest modeling 994
based on LiDAR and in situ data Remote Sensing of Environment 152 235-250 995
Schroter D Cramer W Leemans R Prentice IC Araujo MB Arnell NW Bondeau 996
A Bugmann H Carter TR Gracia CA de la Vega-Leinert AC Erhard M Ewert 997
F Glendining M House JI Kankaanpaa S Klein RJT Lavorel S Lindner M 998
Metzger MJ Meyer J Mitchell TD Reginster I Rounsevell M Sabate S Sitch 999
S Smith B Smith J Smith P Sykes MT Thonicke K Thuiller W Tuck G 1000
38
Zaehle S amp Zierl B (2005) Ecosystem service supply and vulnerability to global change 1001
in Europe Science 310 1333-1337 1002
Sitch S Smith B Prentice IC Arneth A Bondeau A Cramer W Kaplan JO Levis 1003
S Lucht W Sykes MT Thonicke K amp Venevsky S (2003) Evaluation of ecosystem 1004
dynamics plant geography and terrestrial carbon cycling in the LPJ dynamic global 1005
vegetation model Global Change Biology 9 161-185 1006
Stewart DW Costa C Dwyer LM Smith DL Hamilton RI amp Ma BL (2003) 1007
Canopy structure light interception and photosynthesis in maize Agronomy Journal 95 1008
1465-1474 1009
Trnka M Dubrovsky M amp Zalud Z (2004) Climate change impacts and adaptation 1010
strategies in spring barley production in the Czech Republic Climatic Change 64 227-1011
255 1012
Turner DP Ritts WD Cohen WB Maeirsperger TK Gower ST Kirschbaum AA 1013
Running SW Zhao MS Wofsy SC Dunn AL Law BE Campbell JL Oechel 1014
WC Kwon HJ Meyers TP Small EE Kurc SA amp Gamon JA (2005) Site-level 1015
evaluation of satellite-based global terrestrial gross primary production and net primary 1016
production monitoring Global Change Biology 11 666-684 1017
van der Tol C Berry J Campbell PKE amp Rascher U (2014) Models of fluorescence 1018
and photosynthesis for interpreting measurements of solar-induced chlorophyll 1019
fluorescence Journal of Geophysical Research Biogeosciences IN PRESS 1020
van der Tol C Verhoef W amp Rosema A (2009a) A model for chlorophyll fluorescence 1021
and photosynthesis at leaf scale Agricultural and Forest Meteorology 149 96-105 1022
van der Tol C Verhoef W Timmermans A Verhoef A amp Su Z (2009b) An integrated 1023
model of soil-canopy spectral radiances photosynthesis fluorescence temperature and 1024
energy balance Biogeosciences 6 3109-3129 1025
Verhoef W (1984) Light scattering by leaf layers with application to canopy reflectance 1026
modeling The SAIL model Remote Sensing of Environment 16 125-141 1027
Verhoef W amp Bach H (2003a) Remote sensing data assimilation using coupled radiative 1028
transfer models Physics and Chemistry of the Earth 28 3-13 1029
Verhoef W amp Bach H (2003b) Simulation of hyperspectral and directional radiance 1030
images using coupled biophysical and atmospheric radiative transfer models Remote 1031
Sensing of Environment 87 23-41 1032
39
Verhoef W amp Bach H (2007) Coupled soil-leaf-canopy and atmosphere radiative transfer 1033
modeling to simulate hyperspectral multi-angular surface reflectance and TOA radiance 1034
data Remote Sensing of Environment 109 166-182 1035
Verhoef W Jia L Xiao Q amp Su Z (2007) Unified optical-thermal four-stream radiative 1036
transfer theory for homogeneous vegetation canopies Ieee Transactions on Geoscience 1037
and Remote Sensing 45 1808-1822 1038
Webb EK Pearman GI amp Leuning R (1980) Correction of flux measurements for 1039
density effects due to heat and water-vapour transfer Quarterly Journal of the Royal 1040
Meteorological Society 106 85-100 1041
Wu C Niu Z Tang Q amp Huang W (2010) Revised photochemical reflectance index 1042
(PRI) for predicting light use efficiency of wheat in a growth cycle validation and 1043
comparison International Journal of Remote Sensing 31 2911-2924 1044
Yang X Tang J Mustard JF Lee JE Rossini M Joiner J Munger JW Kornfeld 1045
A amp Richardson AD (2015) Solar-induced chlorophyll fluorescence that correlates with 1046
canopy photosynthesis on diurnal and seasonal scales in a temperate deciduous forest 1047
Geophysical Research Letters 1048
Zarco-Tejada PJ Berni JAJ Suarez L Sepulcre-Canto G Morales F amp Miller JR 1049
(2009) Imaging chlorophyll fluorescence with an airborne narrow-band multispectral 1050
camera for vegetation stress detection Remote Sensing of Environment 113 1262-1275 1051
Zarco-Tejada PJ Gonzalez-Dugo V amp Berni JAJ (2012) Fluorescence temperature and 1052
narrow-band indices acquired from a UAV platform for water stress detection using a 1053
micro-hyperspectral imager and a thermal camera Remote Sensing of Environment 117 1054
322-337 1055
Zarco-Tejada PJ Morales A Testi L amp Villalobos FJ (2013) Spatio-temporal patterns 1056
of chlorophyll fluorescence and physiological and structural indices acquired from 1057
hyperspectral imagery as compared with carbon fluxes measured with eddy covariance 1058
Remote Sensing of Environment 133 102-115 1059
Zhang Q Middleton EM Cheng YB amp Landis DR (2013) Variations of foliage 1060
chlorophyll fAPAR and foliage non-chlorophyll fAPAR (fAPARchl fAPARnonchl) at the 1061
Harvard Forest Ieee Journal of Selected Topics in Applied Earth Observations and Remote 1062
Sensing 6 2254-2264 1063
Zhang Q Middleton EM Gao BC amp Cheng YB (2012) Using EO-1 hyperion to 1064
simulate HyspIRI products for a coniferous forest The fraction of par absorbed by 1065
40
chlorophyll (fAPAR chl) and leaf water content (LWC) Ieee Transactions on Geoscience 1066
and Remote Sensing 50 1844-1852 1067
Zhang Y Guanter L Berry JA Joiner J van der Tol C Huete A Gitelson A Voigt 1068
M amp Koumlhler P (2014) Estimation of vegetation photosynthetic capacity from space-1069
based measurements of chlorophyll fluorescence for terrestrial biosphere models Global 1070
Change Biology 20 3727-3742 1071
1072
41
Appendix-A APEX data calibration 1073
The calibration of APEX images is based on the APEX Processing and Archiving Facility 1074
(PAF) which is the combined software and hardware designed to generate calibrated level 1 1075
at-sensor radiances from APEX raw image streams (Hueni et al 2009) Calibration 1076
coefficients for the radiometric geometric and spectral calibrations are generated from system 1077
calibrations at the APEX Calibration Home Base (CHB) at DLR Oberpfaffenhofen (Gege et 1078
al 2009) These CHB data are stored and processed within the APEX Calibration Information 1079
System (CAL IS) producing the so-called calibration cubes holding coefficients for each 1080
spatio-spectral pixel (Hueni et al 2013) 1081
For the multi-temporal dataset employed within this study all flight lines were 1082
reprocessed from the original raw image streams to ensure that the same version of the 1083
processor was applied The APEX PAF and CAL IS have significantly evolved over the 1084
timeframe of the dataset with calibrations getting more accurate over the years To ensure 1085
consistency all data were calibrated using coefficients obtained in May 2013 1086
The processor was specifically configured to retain the highest information content in 1087
the VNIR channel including i) no spectral resampling to compensate for spectral shifts and 1088
misregistrations (DOdorico et al 2010 DOdorico et al 2011) ii) no compensation of 1089
spectral shift related changes in radiometry (Hueni et al 2015) and iii) no spatial 1090
misregistration correction The calibration was thus effectively reduced to a linear dark 1091
current correction over time a de-smearing of the visible-NIR channel to compensate for 1092
sensor smear effects the application of radiometric gains and offsets followed by a destriping 1093
routine working in the spatial dimension only to remove pushbroom related along track 1094
striping Calibrated radiance data were directly used for the fluorescence retrieval (see Section 1095
24) while the feasibility to use APEX for SIF760 retrievals was theoretically demonstrated in 1096
42
a study of Damm et al (2011) Resulting SIF760 maps were afterwards geo-rectified using a 1097
parametric geocoding approach (Schlaumlpfer and Richter 2002) 1098
43
Appendix-B Retrieval of SIF760 from airborne data 1099
The quantification of SIF measured with ground or airborne-based spectrometers 1100
requires separating emitted SIF from the reflected radiance flux The Fraunhofer Line Depth 1101
(FLD) approach introduced by Plascyk (1975) serves as a de facto standard for medium 1102
resolution instruments such as APEX (Meroni et al 2009) and was applied in our study The 1103
FLD method uses atmospheric absorption bands characterized by lower incident light 1104
compared to wavelength regions outside of these bands This configuration increases the 1105
spectral information and allows the separation of SIF from reflected radiation In this study 1106
we used the broad O2-A oxygen absorption band around 760 nm and quantified the infilling of 1107
SIF760 using radiance measurements inside (subscript i) and outside (subscript o) of the O2-A 1108
band 1109
For the airborne case only atmospheric components can be simulated with 1110
MODTRAN-5 assuming perfect knowledge of the acquisition conditions The reflectance 1111
terms for diffuse and direct irradiance as well as the SIF760 contribution are usually unknown 1112
Assuming Lambertian surface reflectance behavior which introduces some inaccuracies but 1113
allows formulating the radiative transfer (RT) for radiance measurements at sensor level (LAtS) 1114
to obtain SIF760 both measurements inside and outside of the absorption band can be 1115
expressed as 1116
E9FA lang3H IJK LMNrangP QlangRSE rang T UlangVWWH VXWH rang∙langVYYH VYXH rangZH
Hlang[XXH rang T ABCHUlangVWWH ranglangVXWH rangZHlang[XXH rang ] ^ _ (B1) 1117
where E0 is the top-of-atmosphere irradiance including diffuse and direct irradiance 1118
components θil is the illumination zenith angle ρso is the path scattered radiance τss is the 1119
direct transmittance for sunlight τoo is the direct transmittance in view direction τsd is the 1120
diffuse transmittance of the atmosphere for sunlight τdo is the hemispherical-directional 1121
transmittance in view direction and ρdd is the spherical albedo If these atmospheric 1122
44
components are obtained from MODTRAN-5 simulations (Damm et al 2015 Verhoef and 1123
Bach 2003a b 2007) the radiative transfer equation (Eq B1) only contains four unknowns 1124
namely Ri Ro SIFi and SIFo The 3FLD method (Maier et al 2003) which is an adaptation of 1125
the original FLD method proposed by (Plascyk 1975) was used to linearly relate R and SIF 1126
inside and outside of the O2-A absorption band SIF can be finally retrieved with 1127
13 -0 abcMUdWecWlangRff_ rangZghcWUdMecMlangRff^ rangZiUdWecWlangRff_ rangZghUdMecMlangRff^ rangZ j
langVWWM ranglangVXWM rang (B2) 1128
kE lE9FA m lang3HW IJK LMNrangP langRSE rangn ] ^ _ (B3) 1129
E lang3HW IJK LMNrangP langoSSE TopSE rang ∙ langoE opE rang qEprs T Eprt] ^ _ (B4) 1130
r S13rlangoSSr rang T langopSr rang v13S$langoSSS rang T langopSS rangw (B5) 1131
where B is the factor relating SIFi and SIFo and was fixed to a value of 08 justified by 1132
simulations and experiments (Rascher et al 2009 Alonso et al 2008) Xj equals the at-1133
sensor radiance (reflected plus emitted radiation) without path radiance contribution and Ej 1134
expresses surface irradiance as measured at the sensor level A is the factor relating Ri and Ro 1135
and was derived from linear interpolation of R of the left (758 nm) and right (771 nm) O2-A 1136
band shoulder with 1137
xx+ (B6) 1138
y ```-0```z and y `-0`z
```z (B7) 1139
1140
Because APEX suffered from slight spectral smile effects (DOdorico et al 2010) 1141
updated center wavelength positions were involved in the convolution approach The spectral 1142
shift quantification for each pixel across track was based on the Cr method as described in 1143
45
Meroni et al (2010) The method assumes a high correlation between a measured and a 1144
convolved spectrum and iteratively minimizes a cost function which is 1 minus the Pearson 1145
correlation coefficient (r) calculated for both signals Remaining artifacts of the spectral shift 1146
correction and slightly inaccurate estimates of atmospheric properties cause SIF760 retrieval 1147
uncertainties We therefore applied a semi-empirical correction as described in Damm et al 1148
(2014) for each scan line across the track This technique employs reference surfaces which 1149
are free of any SIF760 emission (eg bare soil) to adjust the upward transmittance term inside 1150
the absorption feature oSSr The retrieval of SIF760 from top-of-canopy radiance data measured 1151
on ground follows the same approach as described in Eqs B2-B7 under the assumption that 1152
the surface irradiance can be approximated with the measurement of a reference panel and 1153
that ρso τdo and τdo can be set to 0 Furthermore the spectral resolution of APEX can be 1154
considered suboptimal for SIF760 retrievals although Damm et al (2011) demonstrate that 1155
APEX with its spectral resolution of 54 nm at 760 nm is sensitive for SIF760 However 1156
retrieved SIF760 values are too high and in an absolute sense incorrect We used reference 1157
SIF760 data obtained in parallel to the airborne acquisitions using the ASD field spectrometers 1158
(Section 23) to estimate the actual offset The observed scaling factor of 193 was afterwards 1159
applied to the retrieved SIF760 values to transfer them to a realistic value range 1160
46
Appendix-C SIF retrieval accuracy 1161
We applied a quantitative accuracy evaluation of resulting SIF760 maps using ground 1162
measured SIF760 values (Figure C1) Considering all reference data acquired during five 1163
campaigns a good linear relationship was achieved between ground and airborne-based 1164
SIF760 values (r2 = 071) but with a proportionality factor much higher than 1 (Figure C1-A) 1165
This experimentally obtained systematic overestimation of APEX SIF760 is comparable to 1166
simulation results documented in Damm et al (2011) Further we found slightly changing 1167
correlations between the different years (several linear models in Figure C1-A) which are 1168
likely caused by canopy structural effects spectral and radiometric performances of used 1169
ground instruments or slight deviations of the performance of APEX over time 1170
To compensate for the overestimation of APEX SIF760 we applied an empirical correction 1171
factor of 193 derived from the comparison of reference data and APEX which resulted in a 1172
rRMSE of 289 (Figure C1-B) 1173
1174
lt Figure C1 gt 1175
1176
The Laegeren site was covered with three adjacent flight lines having an overlap of 1177
approximately 10 (cf Figure 3) This configuration provides the opportunity to 1178
quantitatively evaluate the consistency of SIF retrievals obtained from different measurements 1179
and view zenith angles (ie plusmn 135deg) The comparison of SIF760 retrievals obtained from flight 1180
lines 1 and 2 reveals a moderate linear relationship for homogeneous agricultural surfaces (r2 1181
= 081 rRMSE = 57) We observed a systematic underestimation of flight line 1 compared 1182
to flight line 2 (factor 06) for a view zenith angle difference of ~26deg for SIF760 indicating 1183
either a directionality of SIF760 emissions or an insufficient decoupling of surface HCRF 1184
affected by reflectance anisotropy With increasing surface heterogeneity scattering increases 1185
47
and the agreement of retrieved SIF from both flight lines slightly decreases (ie for forested 1186
areas r2 of 05 and rRMSE of 88) This lower correlation can be mainly associated to slight 1187
geometric mis-registrations (ie max 2 pixel ~ 40 m) in combination with surface 1188
heterogeneity (eg shaded and sunlit tree crowns) and emission anisotropy of SIF760 Also 1189
negative SIF760 values are present in the SIF760 maps and caused by sensor noise and 1190
especially for forests due to shadowing effects (Damm et al 2015) 1191
48
Appendix-D Technical aspects determining the SIF760 retrieval accuracy 1192
A rigorous evaluation of the SIF760 retrieval accuracy is crucial to judge the reliability 1193
of our assessment on the relationship between SIF760 and GPPEC across ecosystems 1194
Furthermore additional factors imposing variations on SIF760 retrieved from airborne 1195
spectroscopy data that cannot be related to the physiological origin of SIF760 needs to be 1196
critically discussed to justify the proposed approach 1197
Ground-based measurements of SIF760 were made using field spectrometers to validate 1198
the airborne retrievals Field spectroscopy provides a good reference for validating airborne 1199
retrievals as it is likely not affected by biases resulting from atmospheric composition 1200
estimates (eg aerosol load) due to the simultaneous measurement of irradiance fluxes at 1201
canopy level using a reference panel The reliability of the applied field spectroscopic 1202
approach to measure SIF760 was previously demonstrated using field studies (Damm et al 1203
2010 Liu and Cheng 2010 Meroni et al 2009 Rascher et al 2009) and theoretical 1204
assessments (Damm et al 2011) It must be noted that field spectroscopic approaches are 1205
subject to uncertainties particularly for heterogeneous vegetation canopies Damm et al 1206
(2015) discussed retrieval errors caused by illumination effects likely introducing slight 1207
errors in reference SIF760 This source of uncertainty must be considered when judging the 1208
accuracy of APEX SIF760 The nevertheless good agreement between ground and airborne 1209
observations indicated that atmospheric absorption and scattering effects could be sufficiently 1210
compensated and thus demonstrated the reliability of retrieved SIF760 measurements In 1211
particular the empirical correction applied making use of high spatial resolution airborne IS 1212
data in combination with reference surfaces not emitting SIF760 allowed to bypass retrieval 1213
uncertainties caused by atmospheric effects (Damm et al 2014) 1214
Instrumental effects in combination with retrieval methods were found to cause 1215
systematic differences in SIF760 retrievals (Damm et al 2011) the comparatively low 1216
49
resolution of APEX around the O2-A band used to retrieve SIF760 (ie ~54 nm) resulted in an 1217
overestimation of APEX SIF760 compared to retrievals from high resolution instruments 1218
Indeed maximum APEX SIF760 values are 6 mW m-2 sr-1 nm-1 while typical SIF760 values 1219
obtained from high resolution instruments range between 0 and 3 mW m-2 sr-1 nm-1 (Guanter 1220
et al 2013) Considering SIF760 values retrieved from ASD data in original resolution (3 nm) 1221
APEX showed an overestimation of 1102 which confirmed that low spectral resolution 1222
resulted in an overestimation of SIF760 The reasoning for this absolute error is given by the 1223
sub-optimal spectral resolution of APEX with 54 nm at 760 nm causing a reduced sensitivity 1224
for SIF760 on the one hand and a wider distance of the O2-A shoulder values used to 1225
parameterize the 3FLD approach on the other hand The bias was corrected using the ASD 1226
reference data and does not impact the results of our analysis Further the relative variation of 1227
SIF760 is unaffected by the bias 1228
Surface heterogeneity complicates the retrieval of SIF760 According to Damm et al 1229
(2015) SIF760 retrievals for forest sites are especially subject to uncertainties due to 1230
assumptions on surface irradiance Crown shapes and associated surface orientations 1231
determine the intensity and quality of irradiance including fractional amounts of diffuse and 1232
direct irradiance To account for pixel wise changes in surface irradiance high resolution 1233
digital object models (DOM) (eg derived from LiDAR observations) are required In 1234
absence of such a high resolution DOMrsquos crowns are assumed to be flat which results in 1235
uncertainties of up to 58 in case of cast shadows (Damm et al 2015) Since we used 1236
averaged observations over larger areas representing flux tower footprints and most of our 1237
data were flown under comparable illumination conditions (ie around solar noon) we 1238
expect these potential biases to be less influential in this analysis 1239
1
Tables 1
Table 1 Date and time of APEX flights and corresponding eddy covariance flux tower 2
measurements for the three investigated ecosystems (ie grassland cropland mixed 3
temperate forest) 4
Date Time [UTC] Location Ecosystem Flux tower
17062009 950 Laegeren forest 1 tower
17062009 1030 Oensingen cropland 1 tower
17062009 1030 Oensingen grassland 2 tower
25062010 1030 Oensingen cropland 1 tower
25062010 1030 Oensingen grassland 2 tower
26062010 1500 Laegeren forest 1 tower
26062010 1030 Oensingen cropland 1 tower
26062010 1030 Oensingen grassland 2 tower
29062010 1030 Laegeren forest 1 tower
26062011 1030 Laegeren forest 1 tower
28062011 1030 Oensingen cropland 1 tower
28062011 1030 Oensingen grassland 1 tower
16062012 1025 Laegeren forest 1 tower
16062012 900 Oensingen cropland 1 tower
16062012 1100 Oensingen cropland 1 tower
12072013 730 Laegeren forest 1 tower
03092013 1050 Laegeren forest 1 tower
5
2
Table 2 Availability of reference SIF760 data obtained from field spectroscopy measurements 6
to validate APEX based SIF760 retrievals 7
Date time [UTC] Location Measured crops Nr points
17062009 1030 Oensingen maize rye pea sugar beet wheat white clover 29 points
25062010 1030 Oensingen maize pea sugar beet wheat white clover 15 points
16062012 900 Oensingen carrot maize winter wheat 11 points
16062012 1100 Oensingen carrot maize winter wheat 10 points
8
3
Table 3 Goodness of fit for the hyperbolic model describing the relationship between GPPEC 9
and SIF760 O PRI and MCARI2 for the three ecosystem types perennial grassland cropland 10
and mixed temperate forest Calculated statistics are based on all data acquired from 2009-11
2013 as described in Table 1 12
Optical variable Ecosystem Regression coefficient Relative RMSE []
SIF crops 088 355
grass 059 2708
forest 048 1588
PRI crops 0008 1176
grass 095 860
forest 009 2179
MCARI2 crops 0005 1029
grass 098 550
forest 034 1798
13
1
Figures 1
2
Figure 1 Study sites A Oensingen agricultural site B Laegeren forest site The white 3
rectangles represent in A the boundary of investigated fields that comprise most of the flux-4
tower footprints and in B a coarse outline of the footprint area of the flux-tower The white 5
crosses show the locations of the flux-towers Background RGB images from Google-Earth 6
2
7
Figure 2 APEX reflectance and SIF760 image for the Oensingen site acquired on the 2606 8
2010 1030 UTC A top-of-canopy hemispherical-conical reflectance data as true color 9
composite B SIF760 map The white boxes indicate the approximate position of the flux 10
tower 11
3
12
Figure 3 APEX reflectance and SIF760 image for the Laegeren site acquired on the 2606 13
2010 1510 UTC A top-of-canopy hemispherical-conical reflectance data as true color 14
composite B SIF760 map The black arrows indicate the flight direction of flight line 1 to 3 15
(FL1-FL3) The white line marks a transect along the overlapping region of FL1 and FL2 The 16
white boxes indicate the approximate position of the flux tower 17
4
18
Figure 4 Relationships between GPPEC from the eddy-covariance measurements and SIF760 O 19
instantaneously measured between 2009 and 2013 (see Table 1) with the airborne 20
spectrometer APEX (A) PRI index (B) and MCARI2 index (C) for three vegetation types 21
(black dots perennial grassland dark grey rectangles cropland including winter wheat pea 22
and barley grey triangles mixed temperate forest) The solid curves correspond to a 23
hyperbolic model fitted to the measured data The dashed curves show the extrapolated 24
behavior 25
5
26
Figure 5 Daily light response curves from eddy flux measurements for A cropland B 27
perennial grassland and C mixed temperate forest Data were acquired between 2009 and 28
2013 (see Table 1) Grey curves represent a fitted hyperbolic model to approximate the 29
behavior of measured PAR-GPP values Crosses show GPPEC measurements that were used 30
for the SIF760 O - GPPEC comparison based on the time of APEX flights PAR values are 31
binned in 20 mW m-2
sr-1
nm-1
increments 32
6
33
Figure 6 Leaf level relationships between photosynthetic (LUEp) and fluorescence yield 34
(LUEf) for a typical C3 crop Dependency of LUEp (A) and LUEf (B) on APAR C 35
Relationship between LUEp and LUEf D Relationship between APAR and GPPL GPPL was 36
calculated as APARLUEp E Relationship between APAR and SIF760 SIF760 was calculated 37
as APARLUEf assuming a constant relationship between the SCOPE output SIFtotalL 38
(integral between 640-850nm) and SIF760L F Relationship between SIF760 L and GPPL All 39
data were simulated using SCOPE The grey areas indicate illumination conditions 40
comparable to APEX flights 41
7
42
Figure 7 Canopy level relationships between photosynthetic (LUEp) and fluorescence yield 43
(LUEf) for different canopy representations of a C3 cropland in SCOPE Dependency of 44
LUEp (A) and LUEf (B) on APAR LUEp was calculate as GPPCAPAR and LUEf was 45
directly obtained from SCOPE C Relationship between LUEp and LUEf D Relationship 46
between APAR and GPPC GPPC was directly obtained from SCOPE E Relationship 47
between APAR and SIF760C SIF760C was directly obtained from SCOPE F Relationship 48
between SIF760C and GPPC The black dashed line corresponds to a C3 cropland with LAI = 49
30 fraction of brown pigments (Cs) = 00 and a spherical (sp) leaf inclination distribution 50
function (LIDF) For the grey line Cs was changed to 20 for the black dashed line the LAI 51
was changed to 10 and for the grey dasheddotted line the LIDF was changed to plagiophile 52
(pg) The grey areas indicate illumination conditions comparable to APEX flights 53
8
54
Figure 8 Impact of temporal scaling on the SIF760C-GPPC relationship SIF760C and GPPC 55
data were simulated using SCOPE Model input parameters air temperature (A) PAR (B) and 56
LAI (C) were measured within the NitroEurope project (httpwwwnitroeuropeeu) at the 57
Speulderbos forest site Netherlands D Relationship between SIF760C and GPPC including a 58
fitted hyperbolic model for daily averages (grey dots and grey line) monthly averages (dark 59
grey triangles and line) and quarterly data (black dots and black dashed line) 60
9
61
Figure C1 Comparison of ground and airborne-based SIF760 retrievals from various crops 62
Data were acquired during four campaigns between 2009 and 2012 in the agricultural site 63
Oensingen (see Table 2) Left Fitted linear regression lines for the four considered campaigns 64
are overlaid in black The dashed line corresponds to the 11 line Right SIF retrievals from 65
APEX after applying an empirical correction factor (193) The black line represents the fitted 66
linear model the dashed line corresponds to the 11 line 67
3
1 Introduction 50
Plant photosynthesis is a key process in terrestrial ecosystems mediating gas and 51
energy exchanges in the atmosphere-biosphere system (Baldocchi et al 2001 Ozanne et al 52
2003) Products of photosynthesis provide a wealth of ecosystem services that are essential 53
for human well-being including food fiber energy and oxygen (Imhoff et al 2004 54
Krausmann et al 2013 Schroter et al 2005) Photosynthesis as the underlying process for 55
plant growth is a particularly interesting indicator of crop efficiency and agricultural 56
management practices (Falloon and Betts 2010 Guanter et al 2014 Trnka et al 2004) both 57
of which having important implications for yield forecasts and for the implementation of 58
climate change adaptation strategies (IPCC 2013) 59
Observing the highly dynamic process of photosynthesis beyond the individual leaf or 60
plant levels in-situ is based on measuring the carbon dioxide (CO2) exchange between 61
vegetation and atmosphere with eddy-covariance (EC) flux towers and partitioning it into 62
gross primary production (GPP) and ecosystem respiration (Baldocchi et al 2001) 63
Measurements of plant - light interactions using spectrometers installed on for example EC 64
towers allow deriving information about the pigment status and provide an alternative 65
approach to estimate GPP (Balzarolo et al 2011 Gamon et al 2010 Hilker et al 2011) At 66
landscape scale photosynthesis can be assessed using process-based models (Sitch et al 67
2003) greenness-based satellite observations (Running et al 2004) or hybrid approaches 68
combining in-situ observations and statistical modeling (Jung et al 2011) All these 69
approaches provide important insights to study photosynthesis but usually do not allow 70
assessing photosynthesis at larger scales while preserving the high spatial variability present 71
in ecosystems EC flux tower measurements represent only smaller areas in preselected 72
ecosystems (Drolet et al 2008 Turner et al 2005) are not spatially distributed according to 73
carbon stocks (Schimel et al 2014) and do not allow spatial differentiations within the 74
4
measured footprint (Barcza et al 2009 Kljun et al 2002) Combined large scale modeling 75
and observational approaches based on vegetation greenness are spatially contiguous but face 76
the complexity of naturally varying systems including diverse interactions and complex 77
feedbacks which limit their predictive capabilities (Beer et al 2010 Goetz and Prince 1999 78
Turner et al 2005) 79
Over the last decade significant progress has been made in measuring plant-light 80
interactions and the process of photosynthesis Remote measurements of sun-induced 81
chlorophyll fluorescence (SIF) in particular open a new perspective to assess photosynthesis 82
at ecosystem scale SIF is a radiation flux emitted from plant chlorophyll molecules a few 83
nanoseconds after light absorption in the wavelength range from 600-800 nm and is 84
considered an indicator for the functional status of actual plant photosynthesis (Baker 2008) 85
Various studies demonstrated the possibility to measure SIF at certain wavelengths on ground 86
(Guanter et al 2013 Rascher et al 2009) from airborne platforms (Damm et al 2014 87
Guanter et al 2007 Zarco-Tejada et al 2012) and from satellites (Frankenberg et al 2011 88
Guanter et al 2014 Joiner et al 2013) Recent research demonstrated SIF being sensitive to 89
changes in photosynthesis showing strong links to GPP at the level of leaves (Meroni et al 90
2008 Middleton et al 2002) plants (Damm et al 2010 Rossini et al 2010) canopies (Zarco-91
Tejada et al 2013) and ecosystems (Frankenberg et al 2011 Guanter et al 2012) 92
Observed relationships between SIF and GPP are conceptually explained using an 93
approximation of GPP based on Monteithrsquos light use efficiency concept (Monteith 1972) 94
∙ (1) 95
where APAR is the absorbed photosynthetically active radiation expressed in radiance units 96
and LUEp is the efficiency of light utilization for photosynthesis and allows converting 97
measured radiances into the number of fixed CO2 molecules SIF is expressed by expanding 98
the GPP notation in Eq (1) following Guanter et al (2014) 99
13 ∙ ∙ (2) 100
5
where LUEf is the light use efficiency of SIF (fluorescence yield) and fesc accounts for a 101
structural interference determining the fraction of SIF photons escaping the canopy 102
Relationships between SIF and GPP are mostly driven by the common APAR term In 103
addition a covariance between both light use efficiencies LUEp and LUEf is expected to 104
occur in absence of the confounding impact of other protective mechanisms (Damm et al 105
2010 Guanter et al 2014) 106
The above outlined concept relating SIF and GPP simplifies a complex set of 107
underlying mechanisms and violation of any assumptions made will directly confound the 108
SIF-GPP relationship In particular the competition of three processes for de-exciting 109
absorbed light energy ie photochemistry radiative energy loss (SIF) and non-radiative 110
energy dissipation (commonly approximated as non-photochemical quenching NPQ) causes 111
complex and changing sensitivities of emitted SIF to actual rates of photosynthesis (Porcar-112
Castell et al 2014 van der Tol et al 2014 van der Tol et al 2009a) This directly implies that 113
the functional link between SIF and GPP depends on the rate of NPQ and consequently on 114
ambient stress levels At canopy scale the three-dimensional structure causes gradients in 115
light interception and light quality within canopies (Nobel et al 1993 Stewart et al 2003) 116
additionally altering the rate of NPQ (Demmig-Adams 1998 Niinemets et al 2003) and thus 117
impacting the SIF-GPP relationship Canopy structure also increases the probability for the 118
emitted SIF photons either to be re-absorbed by chlorophyll or to escape the canopy (Fournier 119
et al 2012 Knyazikhin et al 2013) to some extent violating the assumption of fesc to be 120
constant In addition to these structural and physiological effects variations in SIF signals 121
caused by for example instrumental (Damm et al 2011) or atmospheric effects (Damm et al 122
2014 Guanter et al 2010) and retrieval uncertainties related to the estimation of surface 123
irradiance (Damm et al 2015) can potentially affect the apparent relationship between SIF 124
and GPP Proper understanding of confounding factors remains crucial to use SIF to constrain 125
6
estimates for GPP at ecosystem or continental scales (Garbulsky et al 2014 Guanter et al 126
2012 Parazoo et al 2014) 127
Considering the above listed mechanisms several aspects need to be addressed to 128
further exploit SIF as a robust constraint for estimating GPP We therefore aim at 129
investigating the functional information content of SIF and its link to GPP considering three 130
structurally and physiologically contrasting ecosystems ie cropland perennial grassland 131
and mixed temperate forest We use an innovative combination of multi-temporal imaging 132
spectroscopy (IS) data EC flux tower observations and modeling approaches at the leaf and 133
canopy levels i) to assess the relationship between far red SIF retrieved in the O2-A band at 134
760 nm (SIF760) and GPP across ecosystems and ii) to investigate the impact of confounding 135
factors on the SIF760-GPP relationship ie temporal scaling effects and structural and 136
physiological interferences using a photosynthesis model Our findings contribute to a better 137
understanding of the information inherent in remotely measured SIF760 and its functional 138
relationship to GPP Aspects discussed will help bridging the gap between small scale studies 139
and observational attempts to estimate GPP globally 140
141
2 Methods 142
21 Study sites 143
We investigated three contrasting ecosystems located on the Central Swiss Plateau in 144
terms of structure heterogeneity species composition and annual productivity Two of these 145
ecosystems were collocated in the agricultural area near the town of Oensingen (47deg1711rdquo N 146
7deg4401rdquo E 452 masl Figure 1A) This area is characterized by relatively small agricultural 147
parcels with grassland clover fallow cropping bean maize rapeseed pea sugar beet winter 148
barley and winter wheat rotating as dominant crops Two grassland fields differently 149
managed in terms of species composition fertilization and harvesting activities (Ammann et 150
7
al 2007) were investigated as representatives of the ecosystem type perennial grassland as 151
well as a cropland (one field with arable crop rotation) for the ecosystem type cropland The 152
forest area (47deg2842rdquo N 8deg2152rdquo E Figure 1B) is located on the south-facing slope of the 153
Laegeren mountain northwest of the city of Zurich The temperate mixed forest is 154
characterized by a relatively high species diversity and a complex canopy structure with 155
beech ash sycamore and spruce being the dominant species (Eugster et al 2007 Schneider 156
et al 2014) 157
158
lt Figure 1 gt 159
160
Both test sites are well instrumented (ie with eddy-covariance flux towers 161
micrometeorological stations) and were extensively sampled during several airborne 162
campaigns between 2009 and 2013 (Table 1) 163
164
lt Table 1 gt 165
166
22 Airborne spectroscopy 167
All three study sites were measured with the Airborne Prism EXperiment (APEX) 168
sensor on several days between 2009 and 2013 (Table 1) APEX is an airborne dispersive 169
pushbroom imaging spectrometer covering the 400-2500 nm spectral region in 313 narrow 170
continuous spectral bands APEX allows capturing the O2-A atmospheric absorption feature 171
and thus retrieving SIF760 with a spectral sampling interval of 45 nm a full width at half 172
maximum (FWHM) of 57 nm and a signal to noise ratio of approximately 450 in and 800 173
outside of the O2-A feature for a 50 reflective target and a sun zenith angle of 30deg (Jehle et 174
al 2010 Schaepman et al 2015) 175
8
Radiance calibration of APEX images is performed using the approach of Hueni et al 176
(2009) Multitemporal comparison of images is secured by using consistent calibration and 177
processing versions Precise retrievals of SIF typically require data measured in sub-178
nanometer spectral resolution However the feasibility of using APEX like instruments (ie 179
FWHM ~5nm) for SIF760 retrievals was theoretically assessed in Damm et al (2011) and 180
experimentally demonstrated in recent work (Zarco-Tejada et al 2009 Zarco-Tejada et al 181
2013) The use of calibrated APEX radiance data for the fluorescence retrieval is described in 182
Section 24 and Appendix-B Vegetation indices (see Section 25) were calculated using 183
Hemispherical-Conical-Reflectance-Factor data obtained after atmospheric correction using 184
ATCOR-4 (Richter and Schlaumlpfer 2002) Resulting SIF760 and vegetation indices were 185
projected in the same map projection using parametric geocoding (Schlaumlpfer and Richter 186
2002) Details about APEX data calibration are listed in Appendix-A 187
188
23 Field spectroscopy 189
ASD (PANalytics Boulder US) field spectrometer data were acquired for validation 190
purposes within one hour of the APEX overflight during four campaigns In total 23 191
agricultural fields covering various crops including carrot maize pea rye sugar beet wheat 192
white clover were systematically sampled by measuring reflected and emitted radiances in 193
four homogeneous 3 m2 plots per field (Table 2) Incident light was quantified before and 194
after measuring each plot using a Spectralon reference panel 195
196
lt Table 2 gt 197
198
24 SIF760 retrieval 199
Emitted SIF was analytically separated from the reflected radiance flux measured with 200
ground and airborne-based spectrometers (see Appendix-B) We applied the Fraunhofer Line 201
9
Depth (FLD) approach (Plascyk 1975) which serves as a standard for SIF retrievals using 202
medium resolution instruments (Meroni et al 2009) The FLD method uses atmospheric 203
absorption bands characterized by lower incident light compared to wavelength regions 204
outside of these bands This configuration allows evaluating the in-filling of the absorption 205
bands by SIF (Damm et al 2014) In this study we used the broad O2-A oxygen absorption 206
band around 760 nm for the SIF760 retrieval For the ground data surface irradiance was 207
estimated from white reference measurements while perturbing atmospheric absorption and 208
scattering effects were assumed to be negligible on the 1 m pathway between canopy and 209
sensor (cf Damm et al (2014) for details on the set-up for SIF760 retrieval on the ground) 210
For the airborne measurements we compensated atmospheric absorption and scattering using 211
the atmospheric radiative transfer model MODTRAN5 (Berk et al 2005) Details of the 212
SIF760 retrievals using airborne data are provided in Appendix-B 213
214
25 Derivation of additional spectral indices 215
The relationship between two vegetation indices and GPP was investigated in parallel 216
to judge the performance of the new remote observation of SIF compared to commonly used 217
remote sensing approaches The photochemical reflectance index (PRI) (Gamon et al 1992) 218
was found to be sensitive to pigment changes related to the xanthophyll cycle and is 219
frequently used to quantify LUEp and GPP (Cheng et al 2013 Drolet et al 2008 Hilker et al 220
2009) The PRI was calculated as 221
(3) 222
while Rλ accounts for the surface reflectance at the wavelength λ 223
We further tested the soil adjusted Modified Chlorophyll Absorption Ratio Index 2 224
(MCARI2) (Haboudane et al 2004) that was found to be strongly related to green LAI thus 225
potential photosynthesis and is calculated as 226
10
2 $amp($)$+-amp0 (4) 227
228
26 Eddy-covariance measurements 229
Continuous turbulent fluxes of CO2 were measured at the agricultural and forest sites 230
between 2009 and 2013 using the EC technique (Baldocchi 2003) At each site the EC 231
instrumentation consisted of an open-path infrared gas analyzer (IRGA) (model LI-7500 LI-232
COR Inc Lincoln NE USA) and a three-dimensional sonic anemometer-thermometer 233
(models HS R3 and R2 Gill Instruments Lymington UK) EC measurements were made at a 234
frequency of 20 Hz and processed to half-hourly averages using the eth-flux EC software for 235
the forest and cropland (Mauder et al 2008) or a comparable custom-made EC software for 236
the grassland (Ammann et al 2007) Post-processing included corrections for damping losses 237
(Eugster and Senn 1995) air density fluctuations (Webb et al 1980) data screening for 238
optical sensor contamination stationary or low turbulence conditions (Foken and Wichura 239
1996) and statistical outliers Standardized gap filling and partitioning of CO2 fluxes was 240
performed using the methodology from Lasslop et al (2010) for the forest and cropland and 241
using the methodology from Falge et al (2001) for the grassland Measurements of 242
photosynthetic photon flux density (PPFD) quantified in micromol m-2 s-1 were converted to 243
radiance units (mW m-2 sr-1 nm-1) representing the photosynthetic active radiation (PAR) to 244
be consistent with Monteithrsquos LUE concept and the SIF radiance units 245
246
27 Leaf area index measurements 247
The Leaf Area Index (LAI) of the grassland and cropland was measured at the time of 248
APEX flights using an optical non-destructive approach based on LAI-2000 leaf area meter 249
observations (Li-Cor Lincoln USA) The LAI of the forest was estimated using digital 250
11
hemispherical photographs at two subplots following the VALERIE sampling scheme while 251
subsequent analysis were applied to obtain the LAI (Schneider et al 2014) 252
253
28 Statistical analysis of SIF760 - GPP relationship 254
SIF760 values were manually extracted from APEX-SIF760 maps for areas representing 255
the footprint of eddy-flux measurements (Figure 1) For the perennial grassland and cropland 256
we selected all pixels with SIF760 values ge 0 mW m-2 sr-1 nm-1 in respective fields although the 257
EC tower footprint can be slightly smaller than the entire field The increased number of 258
resulting pixels allows reducing data noise and covering small spatial variations within the 259
footprint Using the pixels of the entire field is justified by the large homogeneity of the 260
underlying fields (Figure 1A) For the forest site Laegeren all pixels representing an area that 261
covered 70 of all footprint occurrences were selected irrespective of spatial footprint 262
changes due to changing wind conditions Using the same area for all years reduces variations 263
in SIF due to changes in biomass and canopy structure but also reduces the representativeness 264
of selected pixels for actual spatial EC footprints 265
We used a hyperbolic model to relate GPP to SIF760 and to both vegetation indices 266
Although the hyperbolic model only empirically approximates the data behavior it is 267
supported by theoretical arguments for the SIF760-GPP relationship that are outlined hereafter 268
The photosynthetic efficiency LUEp is often described as a hyperbolic function of APAR 269
following the Michaelis-Menten theory (Michaelis and Menten 1913) 270
∙123467899 (5) 271
where c is a coefficient in radiance units and LUEpmax c represents GPPmax Following Eqs 272
(1) and (5) GPP rises asymptotically with APAR to GPPmax This equation is used in many 273
models for partitioning GPP eg Falge et al (2001) Substituting LUEp from Eq (5) and 274
APAR = SIF760 (LUEf fesc) from Eq (2) into Eq (1) results in 275
12
lt= gtampABCampD (6) 276
where the coefficient b represents cLUEffesc accounting for the difference between LUEp 277
and LUEf GPPmax is a value that is asymptotically reached representing the photosynthetic 278
capacity or GPP of the canopy at light saturation It must be noted that Eq (6) is a 279
simplification of the complex relationships between GPP and SIF760 and thus performs best if 280
c LUEf fesc remains constant or SIF760 corresponds to APAR A constant LUEf is a 281
reasonable first approximation for vegetation that is only moderately stressed meaning that 282
variations in LUEf are substantially smaller than variations in LUEp (van der Tol et al 2014) 283
Moderate stress relates to any kind of environmental conditions (warm temperature strong 284
irradiance reduced water availability) that cause only short term and slight changes in 285
photochemical and non-photochemical protections However c and fesc are known to vary 286
across ecosystems and LUEf changes under environmental stress In order to evaluate their 287
impacts on the SIF-GPP relationships as expressed in Eq (6) we carried out simulations with 288
the Soil-Canopy Observations of Photosynthesis and Energy balance model SCOPE version 289
153 (van der Tol et al 2009b) (see Section 29) The goodness of fit for the hyperbolic model 290
was quantified using non-linear regression analysis and was quantitatively described using the 291
root mean square error normalized by the mean of measured data (rRMSE) and the coefficient 292
of determination R2 defined as the correlation between data and the best fit-curve determined 293
by non-linear regression 294
295
29 SCOPE simulations 296
SCOPE uses semi-empirical models for LUEp (Collatz et al 1991) and LUEf (van der 297
Tol et al 2014) embedded in a radiative transfer scheme for the canopy (van der Tol et al 298
2009b) The radiative transfer model at leaf level (Fluspect) is an extension of PROSPECT 299
(Jacquemoud and Baret 1990) and includes a fluorescence component The radiative transfer 300
13
within the canopy is calculated following Verhoef (1984) in the optical domain (SAIL) 301
following Verhoef et al (2007) in the thermal domain and Miller et al (2005) for the 302
fluorescence emissions (FluorSAIL) SCOPE requires a number of vegetation structural and 303
physiological parameters as well as weather information as input The model simulates GPP 304
and spectrally distributes SIF with a spectral resolution and a spectral sampling interval of 10 305
nm each Simulated PPFD values (micromol m-2 s-1) were also converted to radiance units (PAR) 306
We carried out three simulations using SCOPE In the first simulation we calculated 307
leaf level LUEf and LUEp of a typical C3 cropland as function of varying APAR For the 308
second simulation at canopy level we calculated LUEf and LUEp as function of varying 309
APAR for differently structured canopies We took the standard SCOPE parameters for a 310
typical C3 cropland and varied APAR and the structural parameters LAI leaf inclination 311
angle (LIDF) and the fraction of brown pigments (Cs) Both simulation experiments provide 312
theoretical evidence on the relationships between LUEf and LUEp between SIF760 and GPP 313
and their respective relationships to APAR For the third canopy level simulation SCOPE 314
was initialized using time series of mid-day (solar noon) meteorological data (PAR air 315
temperature) a seasonal cycle of LAI and the modelrsquos default soil and vegetation parameters 316
for a C3 cropland (cf the SCOPE user manual) The purpose of this simulation was to 317
evaluate seasonal SIF760-GPP relationships at various temporal aggregation levels For better 318
readability we use the following notation through the manuscript SIF760 O for APEX-SIF 319
SIF760 L and SIF760 C for SCOPE simulated leaf and canopy SIF GPPEC for flux tower GPP 320
and GPPL GPPC to relate to simulated GPP at leaf and canopy level 321
322
3 Results 323
31 SIF760 maps 324
14
Two examples of SIF760 O maps obtained from APEX are shown in Figures 2 and 3 325
The appearance of SIF760 O emissions in vegetated areas demonstrates that measured SIF760 O 326
signals originated solely from vegetation and were not contaminated by non-fluorescent non-327
vegetation surfaces Retrieved SIF760 O values range between 0 and 3 mW m-2 sr-1 nm-1 and 328
showed a high agreement (r2 = 07 rRMSE = 289) with in-situ measured reference data 329
Details of the SIF760 O validation are discussed in Appendix-C 330
331
lt Figure 2 gt 332
lt Figure 3gt 333
334
32 Relationships of GPPEC with SIF760 O PRI and MCARI2 335
Relating instantaneous measurements of SIF760 O and GPPEC from several years 336
revealed an asymptotic relationship with saturating GPPEC in presence of moderate to high 337
SIF760 O (Figure 4A Table 3) This general behavior was consistent for all investigated 338
vegetation types The fitted hyperbolic model shows a moderate to high goodness of fit for the 339
grassland (R2 = 059 rRMSE = 271) cropland (R2 = 088 rRMSE = 35) and forest (R2 = 340
048 rRMSE = 1588) The saturation of GPPEC appeared earlier for the cropland (SIF760 O 341
~05 mW m-2 sr-1 nm-1) than for the grassland and forest (SIF760 O gt 10 mW m-2 sr-1 nm-1) An 342
independent assessment considering a linear model to describe the relationship between 343
SIF760 O and GPPEC revealed a consistently lower goodness of fit justifying the use of a 344
hyperbolic model (data not shown) 345
Statistical analysis showed that a hyperbolic model represents well the relationship 346
between both vegetation indices (PRI and MCARI2) and GPPEC for the grassland with a 347
notable variation in LAI (range between 05 and 48 m2 m-2) However a hyperbolic model 348
does not allow well representing the relationship between PRI and MCARI2 with GPPEC for 349
the forest and cropland both showing only a small variation in LAI (less than plusmn03 m2 m-2) 350
15
(Figure 4B-C Table 3) The goodness of fit for the hyperbolic model describing the PRI and 351
GPPEC data for grassland (R2 = 095 rRMSE = 86) was even higher compared to SIF760 O 352
but lower for forest (R2 = 009 rRMSE = 2179) and cropland (R2 = 0008 rRMSE = 353
1176) With MCARI2 the goodness of fit for the hyperbolic model for grassland was high 354
(R2 = 098 rRMSE = 55) but low for cropland (R2 = 0005 rRMSE = 1029) and forest 355
(R2 = 034 rRMSE = 1798) Again considering a linear relationship between both 356
vegetation indices and GPPEC revealed no consistent improvement compared to the use of a 357
hyperbolic model (data not shown) 358
359
lt Figure 4 gt 360
lt Table 3 gt 361
362
33 Assessment of factors determining SIF760 GPPEC relationships 363
The asymptotic relationship between SIF760 O and GPPEC (Figure 4A) represented 364
instantaneous measurements of different canopies at different times and days over several 365
years covering a range of different light conditions phenological stages of the forest and 366
various amounts of green biomass for both investigated grasslands (crosses in Figure 5A-C 367
that indicate EC measurements during APEX overpasses) Relationships between SIF760 O and 368
GPPEC are consequently a complex function of light absorption in the canopy (APAR) of the 369
efficiency of light utilization (ie expressed as photosynthetic capacity and quantum 370
efficiency of photosynthesis) and of structural effects including fractions of non-371
photosynthetic vegetation components Both grass canopies were measured before and after 372
mowing resulting in a large range in LAI (05-48 m2 m-2) and GPPEC (4-27 micromol m-2 s-1) for 373
similar PAR values The forest LAI of 50 m2 m-2 was more constant over the years due to the 374
consistent timing of flights however senescence (eg lower canopy chlorophyll content and 375
light absorption) might explain the decrease in GPPEC of 15 micromol m-2 s-1 in September for 376
16
comparable irradiance conditions (Figure 5C) Investigated crops (winter wheat barley and 377
pea) were characterized by small variations in LAI (22-25 m2 m-2) and chlorophyll contents 378
corresponding to small variations in GPPEC (5 micromol m-2 s-1) while observed under comparable 379
irradiance conditions During the time of observation the barley and wheat canopies were in 380
the ripening phase with a pronounced ear layer 381
382
lt Figure 5 gt 383
384
The validity of the asymptotic relationship between SIF760 O and GPPEC was tested 385
using simulations made with the SCOPE model We emphasize that the regression coefficient 386
b in Eq (6) includes terms that vary in the model (b= cmiddotLUEfmiddotfesc) the fluorescence efficiency 387
LUEf varies with irradiance conditions (predominantly APAR) the fraction fesc depends on 388
vegetation structure while c=GPPmaxLUEpmax varies between sites and over time during the 389
season We first analysed how LUEf and LUEp and consequently SIF760 and GPP vary at 390
leaf (ie SIF760 L and GPPL) and canopy levels (ie SIF760 C and GPPC) using the model of 391
van der Tol et al (2014) that is embedded in SCOPE For the leaf level Figure 6A shows a 392
decrease of LUEp with increasing APAR consistent with Eq (5) The relation between APAR 393
and LUEf appears more complex LUEf first increases with increasing APAR under low light 394
conditions reaches a climax at intermediate light and then decreases with increasing APAR 395
under higher APAR values (gt 50 mW m-2 sr-1 nm-1) (Figure 6B) The initial increase in LUEf 396
is caused by the decline in photochemical quenching of the excitons whereas the decrease of 397
LUEf is caused by the growing number of non-photochemical quenching traps that dissipate 398
light energy before it can be emitted as fluorescence light (van der Tol et al 2009a) It is 399
important to note that the range of LUEp is nearly an order of magnitude greater compared to 400
the range of LUEf (Figure 6C) Although LUEf is not constant we can still conclude that the 401
difference in both LUE terms causes an earlier saturation of leaf-level GPPL (Figure 6D) 402
17
compared to leaf-level SIF760 L (Figure 6E) with APAR leading to an asymptotic relationship 403
between SIF760 L and GPPL (Figure 6F) Our canopy level simulations confirm these trends 404
(Figure 7A-D) The in-field measured asymptotic relationships between SIF760 O and GPPEC 405
are consequently caused by the covariance of GPPEC and SIF760 O with APAR the 406
photosynthetic capacity with APAR and the different value ranges of LUEf and LUEp 407
Additionally our canopy level simulations suggest that structure impacts the SIF760 O - GPPEC 408
relationship Figure 7D shows an example that changing LAI leaf inclination angles or the 409
fraction of senescent plant material determine the curvature of the hyperbolic SIF760 C - GPPC 410
relationships 411
412
lt Figure 6 gt 413
lt Figure 7 gt 414
415
The modelled SIF760 LC - GPPLC curves (Figures 6D and 7D) also indicate that under 416
reduced light intensity GPP and SIF760 are almost linearly related while GPP tends to saturate 417
under higher light intensities Changes in APAR at canopy level are caused by either sun 418
elevation or in the case of a constant solar angle by canopy structure (ie shading fractional 419
vegetation cover) In complex structured canopies with many foliage layers the saturation of 420
GPP with APAR may not be observable because variations of APAR are less related to PAR 421
falling on the leaves but rather to the variation of leaf area exposed to light Model 422
simulations suggest that in complex canopies SIF760 saturates with APAR before GPP due to 423
fesc being lower with high APAR (data not shown) This structural effect reduces the curvature 424
of the hyperbolic leaf level GPPL- SIF760 L relationship at canopy level (compare Figures 6F 425
and 7F) Furthermore the effect of structure and APAR covary in time since canopy structure 426
(ie LAI) varies in concert with APAR during a seasonal cycle especially for crops We 427
18
expect that this covariance makes the relationship between GPP and SIF760 more linear at the 428
canopy level especially if observations are aggregated over time 429
To evaluate the structure related alleviation of the hyperbolic relationship between 430
SIF760 and GPP at canopy level in response to temporal aggregation we modelled an annual 431
course of GPPC and SIF760 C considering varying environmental conditions (Figure 8A-B) 432
ie PAR ranging from 0-500 mW m-2 sr-1 nm-1 air temperature ranging from 0-32degC using 433
data collected during 2009 at a Nitro-Europe flux tower site (Speulderbos The Netherlands) 434
and canopy properties ie LAI ranging from 15-30 m2 m-2 (Figure 8C) The LAI data are 435
synthetic but have a realistic seasonal cycle For daily noon values of modelled SIF760 C and 436
GPPC an asymptotic behaviour can be observed while GPPC tends to saturate compared to 437
SIF760 C The SIF760C-GPPC relationship tends to become linear when monthly or quarterly 438
averages are considered (Figure 8D) 439
440
lt Figure 8 gt 441
442
This visual trend can be confirmed by statistical measures for daily aggregated values 443
the hyperbolic model (rRMSE = 174 R2 = 070) performed slightly better than the linear 444
model (rRMSE = 185 r2 = 068) In case of monthly aggregated data both the hyperbolic 445
and linear models performed similarly while the linear model gave better results (RMSE = 446
90 r2 = 090) than the hyperbolic model (rRMSE = 94 R2 = 088) for quarterly aggregated 447
data 448
449
4 Discussion 450
Significant relationships between remotely measured SIF and ecosystem GPP have 451
been reported in the past (Frankenberg et al 2011 Guanter et al 2014) however sufficient 452
19
process understanding for using SIF as proxy for GPP across ecosystems is still limited 453
(Porcar-Castell et al 2014) Below we discuss how our observational and modeling 454
approaches help bridging the gap between mechanistic understanding at the leaf level and 455
ecosystem-specific observations and thus provide insights on mechanisms determining the 456
complex relationship between SIF and GPP 457
458
41 Insights from the observational approach 459
Our results showed ecosystem-specific asymptotic relationships between SIF760 O and 460
GPPEC for the three investigated ecosystems mixed temperate forest cropland and perennial 461
grassland The varying SIF-GPP relationships across ecosystems were consistent with results 462
recently reported from combined satellite observations and model predictions (Guanter et al 463
2012) Our results showed that the relationships of both tested vegetation indices PRI and 464
MCARI2 to GPPEC experienced a higher variability across ecosystems compared to SIF760 O 465
SIF760 O showed an ecosystem-specific and overall moderate to good relationship (R2 between 466
048 and 088) to GPPEC for the three ecosystems Both vegetation indices showed only strong 467
relationships for the grassland (R2 = 095 and 098) that notably changed in LAI during the 468
various observations It is important to note that we do not further elaborate on the underlying 469
mechanisms relating vegetation indices and GPPEC and that it is unclear if hyperbolic models 470
best describe their relationships to GPPEC based on mechanistic principles The intention of 471
evaluating the relationships between GPPEC and both vegetation indices was to provide a base 472
to judge the performance of SIF760 O in relation to these commonly used remote observations 473
The diversity of sampled conditions and used data sources provide further evidence on 474
the robustness of observed SIF760 O-GPPEC relationships Our measurements represent various 475
canopies characterized by different biomasses sampled over several years Although most 476
observations were acquired under similar light condition and physiological states a few 477
measurements represented lower light conditions and other physiological states This suggests 478
20
that observed relationships are rather robust across different representations of APAR LUEp 479
and LUEf Furthermore we use data from different sources ie four EC flux towers the 480
APEX imaging spectrometer and modeling at leaf and canopy levels to reduce the 481
uncertainties associated with each method of measurements and to get a better understanding 482
of the SIF760 O-GPPEC relationship at ecosystem level 483
Flux tower measurements are representative of a certain source area (footprint) from 484
the ecosystem which changes constantly based on wind direction and turbulent state of the 485
atmosphere Depending on the heterogeneity of the ecosystem GPPEC signals can vary in 486
response to changing footprints (Barcza et al 2009 Kljun et al 2004) although this variation 487
should be rather small if the vegetation is homogeneous Remote measurements of SIF760 are 488
likely representative of the upper layer of the ecosystem thus vertical canopy heterogeneity 489
potentially leads to a mismatch when compared to GPPEC which integrates over the different 490
layers of the ecosystems This is expected to be especially the case in structurally complex 491
ecosystems such as forests Although the upper layer in forest ecosystems substantially 492
contributes to the total rate of GPPEC there are still many layers of leaves or needles within 493
the canopy photosynthesizing at different rates depending on their sunshade exposure In 494
addition understory vegetation in forest ecosystems can significantly contribute to GPPEC at 495
different rates depending on the ecosystem and time of year Even homogeneous vegetation 496
canopies like crops or grasslands can show vertical heterogeneity This is especially the case 497
at peak biomass during ripening or senescence During such phenological stages the top layer 498
of cereal crops consists of less fluorescing components (ie ears) and cereal crops or 499
grasslands can contain a higher fraction of brown pigments resulting in low SIF760 O values 500
while the entire canopy can still produce high photosynthetic rates and thus GPPEC (Damm et 501
al 2010) Indeed most of the crops investigated in our study were in the ripening phase with a 502
pronounced ear layer 503
21
This resulted in relatively low SIF760 O values and in high GPPEC and thus in a more 504
pronounced asymptotic relationship (cf Figure 4A Figure 7F) compared to results reported 505
for other crops (Guanter et al 2013 Guanter et al 2014) Further research is needed to better 506
understand the impact of vertical heterogeneity on GPPEC and SIF760 observations and their 507
respective relationships 508
Despite the technical aspects causing variations in retrieved SIF760 O (refer to 509
Appendix-D for a detailed discussion) canopy structure causes inherent variations in 510
measured SIF760 values and thus impacts SIF760-GPP relationships The combination of 511
complex canopy architecture and the distribution of absorbing and scattering elements 512
determine vegetation canopies to act as photon traps (Knyazikhin et al 2013 Lewis and 513
Disney 2007) Parts of emitted SIF760 photons from inner-canopy leaves are re-absorbed 514
while others escape the canopy in direction of the sensor The probability of photons escaping 515
the canopy is a function of canopy structure which implies sensitivity to measured SIF760 516
intensities for canopy structure In Eq (2) this sensitivity was approximated with the term 517
fesc In our analysis we minimized the impact of fesc by observing always the same forest area 518
representative for the EC tower footprint In less complex structured crop and grass canopies 519
we expect fesc to be less important However future research is required to quantify the impact 520
of fesc and to propose strategies to compensate its influence on SIF760 retrievals 521
522
42 Insights from the modeling approach 523
From a theoretical point of view radiative energy loss competes with photochemistry 524
and non-radiative energy dissipation for absorbed photons Considering that GPP and SIF760 525
can be conceptualized according to Eqs (1) and (2) SIF760 must show under certain 526
environmental conditions a sensitivity to photochemistry (Porcar-Castell et al 2014 van der 527
Tol et al 2009a van der Tol et al 2009b) This relationship is confirmed by our observational 528
data and other studies at leaf (Amoros-Lopez et al 2008) and canopy levels (Damm et al 529
22
2010) Our modeling results however indicated that the relationship between LUEf and LUEp 530
is subject to change hence impacting the sensitivity of SIF760 to track changes in GPP 531
(Figures 6C and 7C) 532
The asymptotic relationship between SIF760 and GPP theoretically predicted and 533
observed at leaf and canopy levels can be related in particular to the different value ranges of 534
both efficiency terms (LUEp and LUEf) (Figures 6C and 7C) while a complex set of 535
mechanisms causes an ecosystem dependency for SIF760-GPP relationships The 536
photosynthetic capacity of the entire ecosystem in combination with its vertical heterogeneity 537
determines differences in GPP and SIF760 and thus the slope and curvature of their respective 538
relationships Furthermore the initial slope of the asymptotic SIF760 - GPP relationship which 539
has a value of LUEpmax(LUEfmiddotfesc) is determined by a combination of the photosynthetic 540
efficiency and canopy structure Canopy structure and related shadowing effects alter the 541
average light interception and quality at leaf level (Nobel et al 1993 Stewart et al 2003) and 542
consequently the overall productivity of the canopy In the case of reduced APAR caused by 543
canopy shadowing the overall apparent stress level in the canopy and consequently the rate 544
of certain photoprotective mechanisms such as non-radiative energy dissipation is reduced 545
(Cheng et al 2015 Demmig-Adams 1998 Niinemets et al 2003) and observed GPP and 546
SIF760 fall in a range where they are more linearly related (cf Figure 6F and 7F) In addition 547
canopy level simulations show that the fraction of senescent plant material impacts the 548
curvature of the hyperbolic relationship 549
Recent literature reports linear relationships between satellite-based SIF and modeled 550
GPP (Frankenberg et al 2011 Guanter et al 2012 Guanter et al 2014) while we found 551
asymptotic relationships Both results are not contradicting if one considers the temporal 552
aggregation applied to the data Our results are based on instantaneous measurements while 553
monthly averages were calculated for the satellite data to minimize noise effects (Frankenberg 554
et al 2011 Guanter et al 2014) It is known from previous research that temporal averaging 555
23
tends to linearize the response between GPP and APAR (Ruimy et al 1995) as saturating 556
light conditions tend to be only a small fraction of averaged diurnalmonthly data 557
Aggregating GPPEC and APAR over different time scales also showed this effect (data not 558
shown) Because of the rather linear relationship between SIF760 and APAR we expect that 559
temporal aggregation tends to linearize the SIF760-GPP relationship as well A recent study 560
presenting continuous measurements of GPP and SIF760 over a temperate deciduous forest 561
support this hypothesis (Yang et al 2015) The increasing number of experiments using 562
autonomous spectrometer systems in combination with flux towers (Balzarolo et al 2011) 563
will likely provide more experimental results that supports this finding Our simulations 564
provide further evidence that the covariance of structure and APAR during a seasonal cycle 565
additionally tends to linearize the relationship between GPP and SIF760 if observations are 566
aggregated over time 567
The dependency of SIF760-GPP relationships on temporal aggregation requires special 568
attention since it has implications on the usage of SIF to constrain GPP In principle 569
conclusions and results obtained from temporally aggregated and instantaneous measurements 570
are valid if consistently related to the underlying temporal aggregation level Generalizing 571
conclusions obtained at various aggregation levels bears the risk for mis-interpretations eg 572
when vegetation models are refined or empirically re-calibrated using observations or for 573
projections of GPP using observational SIF data 574
575
43 Requirements for the use of SIF to assess GPP across ecosystems 576
The changing relationship between SIF760 and GPPEC with vegetation type challenges 577
the usage of SIF760 as a robust constraint to estimate GPP Specific strategies are required to 578
account for ecosystem (or species) specific sensitivities of SIF in general and SIF760 in 579
particular This includes i) integration platforms to combine observations and process 580
24
understanding and ii) accurate observations of additional vegetation and environmental 581
variables 582
Process-based models as data integration platform in combination with comprehensive 583
observations to sufficiently measure important environmental factors and vegetation 584
properties are considered as flexible and powerful framework Parazoo et al (2014) for 585
example proposed the combination of ensemble dynamic global vegetation models (DGVMs) 586
in combination with SIF as observational constraint Lee et al (2015) suggest incorporating 587
SIF in a climate model to utilize SIF as observational constraint of photosynthesis simulations 588
and subsequent calculations of carbon water and energy cycle information Yet other studies 589
propose using SIF to obtain physiological vegetation parameters ie Vcmax for improved 590
parameterizations of photosynthesis models to eventually model GPP (Zhang et al 2014) The 591
European space agencys (ESA) Earth Explorer 8 opportunity mission Fluorescence Explorer 592
(FLEX) suggests a combination of comprehensive observations (ie SIF over the full 593
emission spectrum vegetation ecosystems and actual environmental conditions) and process-594
based models (Guanter et al 2012) 595
Additional information is required to use SIF in process-based models as one has to 596
account for varying photosynthetic efficiencies of plants and prevailing stress responses 597
According to the conceptualization of GPP and SIF as given in Eqs (1) and (2) extracting 598
and evaluating the exact relationship between LUEp and LUEf is essential but requires 599
normalizing APAR and calculating both yields (Damm et al 2010 Govindjee 2004 Louis et 600
al 2005) Retrievals of APAR can be considered challenging (Garbulsky et al 2010 Gitelson 601
and Gamon 2015 Hanan et al 2002) as available approaches often utilize a-priori knowledge 602
of prevailing land cover or plant distribution functions and rely on the inversion of physical-603
based models or simple band ratios (Hilker et al 2008) Research is required to provide high 604
quality information on APAR not perturbed by light absorption of non-photosynthetic active 605
25
canopy elements (stems branches twigs) cf Zhang et al (2013 2012) that demonstrate 606
attempts to improve estimates of APAR 607
Observed SIF760 O - GPPEC relationships are additionally confounded by non-radiative 608
energy dissipation The PRI was designed to monitor pigment changes related to the 609
xanthophyll cycle (Gamon et al 1992) and provides access to this superimposing process 610
However reported sensitivities of PRI for other effects ie structure (Barton and North 611
2001) pigment pool sizes (Gamon and Berry 2012) illumination effects (Damm et al 2015) 612
and the results obtained in this study question the applicability of the PRI at canopy level 613
Alternative approaches such as the development of a canopy PRI as suggested by several 614
groups (Hernandez-Clemente et al 2011 Kovac et al 2013 Wu et al 2010) or the usage of 615
pigment compositions and other functional plant traits might represent interesting strategies 616
and should be elaborated in future research 617
Structural sensitivities of canopy leaving SIF signals are critical and require further 618
research The application of spectrally invariant correction factors eg the directional area 619
scattering factor (Knyazikhin et al 2013) or more advanced physically-based retrieval 620
schemes using combined atmosphere-canopy models (Damm et al 2015 Laurent et al 2013) 621
might provide potential strategies to compensate for canopy structural effects on retrieved 622
SIF760 623
Another important source of information that allows improving the usage of SIF as 624
constraint of GPP is to consider SIF emissions over the entire emission spectrum between 625
approximately 600 and 800 nm Recent research successfully demonstrated the 626
complementary information content of red-fluorescence retrieved in the O2-B band at 688 nm 627
(SIF688) compared to SIF760 because of the different contributions from photosystem I and II 628
(Rossini et al 2015) Yet other studies highlighted the potential to improve predictions of 629
LUEp and GPP using both SIF688 and SIF760 (Cheng et al 2013) 630
631
26
5 Conclusions 632
Remote sensing of SIF provides a new observational approach to assess terrestrial 633
GPP Compared to traditional greenness-based remote sensing parameters we found SIF760 to 634
be more consistently related to GPPEC These results in combination with the more direct 635
mechanistic link between SIF760 and photosynthesis suggest that using SIF760 provides a 636
strategy to decrease uncertainty in estimating GPP across ecosystems 637
Our observational and modeling approaches revealed asymptotic and ecosystem-638
specific relationships for SIF760 and GPPEC We identified a set of interlinked mechanisms 639
determining SIF760-GPPEC relationships to be ecosystem specific ie the photosynthetic 640
capacity and efficiency of ecosystems the confounding impact of non-radiative energy 641
dissipation (NPQ) as well as ecosystem structure and the fraction of non-photosynthetic 642
vegetation components We demonstrated that SIF760-GPPEC relationships scale with temporal 643
aggregation due to a covariance of canopy structure and APAR over the seasonal cycle 644
We suggest going beyond empirical and ecosystem-specific relationships instead 645
using instantaneous observations comprehensively providing information on the full SIF 646
emission vegetation status and functioning as well as environmental conditions in 647
combination with process-based models Such approaches eg suggested for ESArsquos potential 648
ldquoFluorescence Explorerrdquo (FLEX) Earth Explorer mission provide a flexible framework to 649
account for the various influencing factors identified and to successfully apply SIF as 650
constraint of unbiased global GPP estimates 651
Furthermore research is required to improve the comparison between observations of 652
GPPEC and SIF Both observations stem from conceptually contrasting technologies ie 653
measurements of gas exchange vs plant-light interactions and provide independent and 654
complementary access to study ecosystem photosynthesis Despite the need to harmonize 655
horizontally differing footprints the vertical heterogeneity of ecosystems including the 656
27
varying contributions from different ecosystem layers must be better understood to harmonize 657
and successfully integrate both measurements 658
659
Acknowledgements 660
This work was supported by a grant of the Swiss University Conference and ETH-661
Board in frame of the Swiss Earth Observatory Network (SEON) project and by a grant of the 662
European Space Agency (ESA) in frame of the FLEX-PARCS E Paul-Limoges was 663
supported in part by the Natural Sciences and Engineering Research Council of Canada 664
through a postgraduate scholarship We would like to thank the APEX team for acquiring the 665
APEX data Authors sequence is listed following the FLAE approach (doi 666
101371journalpbio0050018) 667
28
References 668
Ammann C Flechard CR Leifeld J Neftel A amp Fuhrer J (2007) The carbon budget of 669
newly established temperate grassland depends on management intensity Agriculture 670
Ecosystems amp Environment 121 5-20 671
Amoros-Lopez J Gomez-Chova L Vila-Frances J Alonso L Calpe J Moreno J amp 672
del Valle-Tascon S (2008) Evaluation of remote sensing of vegetation fluorescence by 673
the analysis of diurnal cycles International Journal of Remote Sensing 29 5423-5436 674
Baker NR (2008) Chlorophyll Fluorescence A probe of photosynthesis in vivo Annual 675
Review of Plant Physiology and Plant Molecular Biology 59 89-113 676
Baldocchi D Falge E Gu LH Olson R Hollinger D Running S Anthoni P 677
Bernhofer C Davis K Evans R Fuentes J Goldstein A Katul G Law B Lee 678
XH Malhi Y Meyers T Munger W Oechel W U KTP Pilegaard K Schmid 679
HP Valentini R Verma S Vesala T Wilson K amp Wofsy S (2001) FLUXNET A 680
new tool to study the temporal and spatial variability of ecosystem-scale carbon dioxide 681
water vapor and energy flux densities Bulletin of the American Meteorological Society 682
82 2415-2434 683
Baldocchi DD (2003) Assessing the eddy covariance technique for evaluating carbon 684
dioxide exchange rates of ecosystems past present and future Global Change Biology 9 685
479-492 686
Balzarolo M Anderson K Nichol C Rossini M Vescovo L Arriga N Wohlfahrt G 687
Calvet J-C Carrara A Cerasoli S Cogliati S Daumard F Eklundh L Elbers JA 688
Evrendilek F Handcock RN Kaduk J Klumpp K Longdoz B Matteucci G 689
Meroni M Montagnani L Ourcival J-M Sanchez-Canete EP Pontailler J-Y 690
Juszczak R Scholes B amp Pilar Martin M (2011) Ground-Based Optical Measurements 691
at European Flux Sites A Review of Methods Instruments and Current Controversies 692
Sensors 11 7954-7981 693
Barcza Z Kern A Haszpra L amp Kljun N (2009) Spatial representativeness of tall tower 694
eddy covariance measurements using remote sensing and footprint analysis Agricultural 695
and Forest Meteorology 149 795-807 696
Barton CVM amp North PRJ (2001) Remote sensing of canopy light use efficiency using 697
the photochemical reflectance index - Model and sensitivity analysis Remote Sensing of 698
Environment 78 264-273 699
Beer C Reichstein M Tomelleri E Ciais P Jung M Carvalhais N Roedenbeck C 700
Arain MA Baldocchi D Bonan GB Bondeau A Cescatti A Lasslop G Lindroth 701
29
A Lomas M Luyssaert S Margolis H Oleson KW Roupsard O Veenendaal E 702
Viovy N Williams C Woodward FI amp Papale D (2010) Terrestrial Gross Carbon 703
Dioxide Uptake Global Distribution and Covariation with Climate Science 329 834-838 704
Berk A Anderson GP Acharya PK Bernstein LS Muratov L Lee J Fox M 705
Adler-Golden SM Chetwynd JH Hoke ML Lockwood RB Gardner JA Cooley 706
TW Borel CC amp Lewis PE (2005) MODTRAN5 A reformulated atmospheric band 707
model with auxiliary species and practical multiple scattering options Proceedings of the 708
Society of Photo-Optical Instrumentation Engineer 5655 662-667 709
Cheng SJ Bohrer G Steiner AL Hollinger DY Suyker A Phillips RP amp 710
Nadelhoffer KJ (2015) Variations in the influence of diffuse light on gross primary 711
productivity in temperate ecosystems Agricultural and Forest Meteorology 201 98-110 712
Cheng Y-B Middleton EM Zhang Q Huemmrich KF Campbell PKE Corp LA 713
Cook BD Kustas WP amp Daughtry CS (2013) Integrating Solar Induced 714
Fluorescence and the Photochemical Reflectance Index for Estimating Gross Primary 715
Production in a Cornfield Remote Sensing 5 6857-6879 716
Collatz GJ Ball JT Grivet C amp Berry JA (1991) Physiological and environmental-717
regulation of stomatal conductance photosynthesis and transpiration - a model that 718
includes a laminar boundary-layer Agricultural and Forest Meteorology 54 107-136 719
DOdorico P Alberti E amp Schaepman ME (2010) In-flight spectral performance 720
monitoring of the Airborne Prism Experiment Applied Optics 49 3082-3091 721
DOdorico P Guanter L Schaepman ME amp Schlaumlpfer D (2011) Performance 722
assessment of onboard and scene-based methods for Airborne Prism Experiment spectral 723
characterization Applied Optics 50 4755-4764 724
Damm A Erler A Gioli B Hamdi K Hutjes R Kosvancova M Meroni M 725
Miglietta F Moersch A Moreno J Schickling A Sonnenschein R Udelhoven T 726
Van der Linden S Hostert P amp Rascher U (2010) Remote sensing of sun induced 727
fluorescence yield to improve modelling of diurnal courses of Gross Primary Production 728
(GPP) Global Change Biology 16 171-186 729
Damm A Erler A Hillen W Meroni M Schaepman ME Verhoef W amp Rascher U 730
(2011) Modeling the impact of spectral sensor configurations on the FLD retrieval 731
accuracy of sun-induced chlorophyll fluorescence Remote Sensing of Environment 115 732
1882-1892 733
Damm A Guanter L Laurent VCE Schaepman ME Schickling A amp Rascher U 734
(2014) FLD-based retrieval of sun-induced chlorophyll fluorescence from medium 735
30
spectral resolution airborne spectroscopy data Remote Sensing of Environment 147 256-736
266 737
Damm A Guanter L Verhoef W Schlaumlpfer D Garbari S amp Schaepman ME (2015) 738
Impact of varying irradiance on vegetation indices and chlorophyll fluorescence derived 739
from spectroscopy data Remote Sensing of Environment 156 202-215 740
Demmig-Adams B (1998) Survey of thermal energy dissipation and pigment composition in 741
sun and shade leaves Plant and Cell Physiology 39 474-482 742
Drolet GG Middleton EM Huemmrich KF Hall FG Amiro BD Barr AG Black 743
TA McCaughey JH amp Margolis HA (2008) Regional mapping of gross light-use 744
efficiency using MODIS spectral indices Remote Sensing of Environment 112 3064-3078 745
Eugster W amp Senn W (1995) A cospectral correction model for measurement of turbulent 746
NO2 fluxes Boundary-Layer Meteorology 74 321-340 747
Eugster W Zeyer K Zeeman M Michna P Zingg A Buchmann N amp Emmenegger 748
L (2007) Methodical study of nitrous oxide eddy covariance measurements using 749
quantum cascade laser spectrometery over a Swiss forest Biogeosciences 4 927-939 750
Falge E Baldocchi D Olson R Anthoni P Aubinet M Bernhofer C Burba G 751
Ceulemans R Clement R Dolman H Granier A Gross P Grunwald T Hollinger 752
D Jensen NO Katul G Keronen P Kowalski A Lai CT Law BE Meyers T 753
Moncrieff H Moors E Munger JW Pilegaard K Rannik U Rebmann C Suyker 754
A Tenhunen J Tu K Verma S Vesala T Wilson K amp Wofsy S (2001) Gap 755
filling strategies for defensible annual sums of net ecosystem exchange Agricultural and 756
Forest Meteorology 107 43-69 757
Falloon P amp Betts R (2010) Climate impacts on European agriculture and water 758
management in the context of adaptation and mitigation-The importance of an integrated 759
approach Science of the Total Environment 408 5667-5687 760
Foken T amp Wichura B (1996) Tools for quality assessment of surface-based flux 761
measurements Agricultural and Forest Meteorology 78 83-105 762
Fournier A Daumard F Champagne S Ounis A Goulas Y amp Moya I (2012) Effect 763
of canopy structure on sun-induced chlorophyll fluorescence Isprs Journal of 764
Photogrammetry and Remote Sensing 68 112-120 765
Frankenberg C Fisher JB Worden J Badgley G Saatchi SS Lee JE Toon GC 766
Butz A Jung M Kuze A amp Yokota T (2011) New global observations of the 767
terrestrial carbon cycle from GOSAT Patterns of plant fluorescence with gross primary 768
productivity Geophysical Research Letters 38 769
31
Gamon JA amp Berry JA (2012) Facultative and constitutive pigment effects on the 770
Photochemical Reflectance Index (PRI) in sun and shade conifer needles Israel Journal of 771
Plant Sciences 60 85-95 772
Gamon JA Coburn C Flanagan LB Huemmrich KF Kiddle C Sanchez-Azofeifa 773
GA Thayer DR Vescovo L Gianelle D Sims DA Rahman AF amp Pastorello 774
GZ (2010) SpecNet revisited bridging flux and remote sensing communities Canadian 775
Journal of Remote Sensing 36 S376-S390 776
Gamon JA Penuelas J amp Field CB (1992) A narrow-waveband spectral index that 777
tracks diurnal changes in photosynthetic efficiency Remote Sensing of Environment 41 778
35-44 779
Garbulsky MF Filella I Verger A amp Penuelas J (2014) Photosynthetic light use 780
efficiency from satellite sensors From global to Mediterranean vegetation Environmental 781
and Experimental Botany 103 3-11 782
Garbulsky MF Penuelas J Papale D Ardo J Goulden ML Kiely G Richardson 783
AD Rotenberg E Veenendaal EM amp Filella I (2010) Patterns and controls of the 784
variability of radiation use efficiency and primary productivity across terrestrial 785
ecosystems Global Ecology and Biogeography 19 253-267 786
Gege P Fries J Haschberger P Schoumltz P Schwarzer H Strobl P Suhr B Ulbrich 787
G amp Vreeling WJ (2009) Calibration facility for airborne imaging spectrometers 788
ISPRS Journal of Photogrammetry amp Remote Sensing 64 387ndash397 789
Gitelson AA amp Gamon JA (2015) The need for a common basis for defining light-use 790
efficiency Implications for productivity estimation Remote Sensing of Environment 156 791
196-201 792
Goetz SJ amp Prince SD (1999) Modelling terrestrial carbon exchange and storage 793
Evidence and implications of functional convergence in light-use efficiency Advances in 794
Ecological Research Vol 28 (pp 57-92) 795
Govindjee (2004) Chlorophyll a fluorescence A bit of basics and history In GC 796
Papageorgiou amp Govindjee (Eds) Chlorophyll a Fluorescence A Signature of 797
Photosynthesis Advances in Photosynthesis and Respiration (pp 1-42) Dordrecht 798
Springer 799
Guanter L Alonso L Gomez-Chova L Amoros-Lopez J Vila J amp Moreno J (2007) 800
Estimation of solar-induced vegetation fluorescence from space measurements 801
Geophysical Research Letters 34 doi 1010292007GL029289 802
32
Guanter L Alonso L Gomez-Chova L Meroni M Preusker R Fischer J amp Moreno 803
J (2010) Developments for vegetation fluorescence retrieval from spaceborne high-804
resolution spectrometry in the O2-A and O2-B absorption bands Journal of Geophysical 805
Research-Atmospheres 115 806
Guanter L Frankenberg C Dudhia A Lewis PE Goacutemez-Dans J Kuze A Suto H amp 807
Grainger R (2012) Retrieval and global assessment of terrestrial chlorophyll fluorescence 808
from GOSAT space measurements Remote Sensing of Environment 121 236-251 809
Guanter L Rossini M Colombo R Meroni M Frankenberg C Lee J-E amp Joiner J 810
(2013) Using field spectroscopy to assess the potential of statistical approaches for the 811
retrieval of sun-induced chlorophyll fluorescence from ground and space Remote Sensing 812
of Environment 133 52-61 813
Guanter L Zhang Y Jung M Joiner J Voigt M Berry JA Frankenberg C Huete 814
AR Zarco-Tejada P Lee J-E Moran MS Ponce-Campos G Beer C Camps-815
Valls G Buchmann N Gianelle D Klumpp K Cescatti A Baker JM amp Griffis 816
TJ (2014) Global and time-resolved monitoring of crop photosynthesis with chlorophyll 817
fluorescence Proceedings of the National Academy of Sciences of the United States of 818
America 111 E1327-E1333 819
Haboudane D Miller JR Pattey E Zarco-Tejada PJ amp Strachan IB (2004) 820
Hyperspectral vegetation indices and novel algorithms for predicting green LAI of crop 821
canopies Modeling and validation in the context of precision agriculture Remote Sensing 822
of Environment 90 337-352 823
Hanan NP Burba G Verma SB Berry JA Suyker A amp Walter-Shea EA (2002) 824
Inversion of net ecosystem CO2 flux measurements for estimation of canopy PAR 825
absorption Global Change Biology 8 563-574 826
Hernandez-Clemente R Navarro-Cerrillo RM Suarez L Morales F amp Zarco-Tejada 827
PJ (2011) Assessing structural effects on PRI for stress detection in conifer forests 828
Remote Sensing of Environment 115 2360-2375 829
Hilker T Coops NC Wulder MA Black TA amp Guy RD (2008) The use of remote 830
sensing in light use efficiency based models of gross primary production A review of 831
current status and future requirements Science of the Total Environment 404 411-423 832
Hilker T Gitelson A Coops NC Hall FG amp Black TA (2011) Tracking plant 833
physiological properties from multi-angular tower-based remote sensing Oecologia 165 834
865-876 835
33
Hilker T Lyapustin A Hall FG Wang Y Coops NC Drolet G amp Black TA 836
(2009) An assessment of photosynthetic light use efficiency from space Modeling the 837
atmospheric and directional impacts on PRI reflectance Remote Sensing of Environment 838
113 2463-2475 839
Hueni A Biesemans J Meuleman K DellEndice F Schlaumlpfer D Adriaensen S 840
Kempenaers S Odermatt D Kneubuehler M Nieke J amp Itten K (2009) Structure 841
Components and Interfaces of the Airborne Prism Experiment (APEX) Processing and 842
Archiving Facility IEEE Transactions on Geoscience and Remote Sensing 47 29-43 843
Hueni A Lenhard K Baumgartner A amp Schaepman M (2013) The APEX (Airborne 844
Prism Experiment - Imaging Spectrometer) Calibration Information System IEEE 845
Transactions on Geoscience and Remote Sensing 51 5169-5180 846
Hueni A Schlaepfer D Jehle M amp Schaepman M (2015) Impacts of Dichroic Prism 847
Coatings on Radiometry of the Airborne Imaging Spectrometer APEX Applied Optics 53 848
5344-5352 849
Imhoff ML Bounoua L Ricketts T Loucks C Harriss R amp Lawrence WT (2004) 850
Global patterns in human consumption of net primary production Nature 429 870-873 851
IPCC (2013) Summary for policymakers Climate change 2013 the physical science basis 852
Cambridge University Press Cambridge United Kingdom and New York NY USA 853
Jacquemoud S amp Baret F (1990) PROSPECT A model of leaf optical properties spectra 854
Remote Sensing of Environment 34 75-91 855
Jehle M Hueni A Damm A DOdorico P Kneubuumlhler M Meuleman K Schlapfer 856
D Schaepman ME amp Weyermann J (2010) APEX - current status performance and 857
validation concept IEEE Sensors 2010 Conference 533-537 858
Joiner J Guanter L Lindstrot R Voigt M Vasilkov AP Middleton EM Huemmrich 859
KF Yoshida Y amp Frankenberg C (2013) Global monitoring of terrestrial chlorophyll 860
fluorescence from moderate spectral resolution near-infrared satellite measurements 861
methodology simulations and application to GOME-2 Atmos Meas Tech Discuss 6 862
3883-3930 863
Jung M Reichstein M Margolis HA Cescatti A Richardson AD Arain MA 864
Arneth A Bernhofer C Bonal D Chen J Gianelle D Gobron N Kiely G Kutsch 865
W Lasslop G Law BE Lindroth A Merbold L Montagnani L Moors EJ 866
Papale D Sottocornola M Vaccari F amp Williams C (2011) Global patterns of land-867
atmosphere fluxes of carbon dioxide latent heat and sensible heat derived from eddy 868
34
covariance satellite and meteorological observations Journal of Geophysical Research-869
Biogeosciences 116 870
Kljun N Kastner-Klein P Fedorovich E amp Rotach MW (2004) Evaluation of 871
Lagrangian footprint model using data from wind tunnel convective boundary layer 872
Agricultural and Forest Meteorology 127 189-201 873
Kljun N Rotach MW amp Schmid HP (2002) A three-dimensional backward lagrangian 874
footprint model for a wide range of boundary-layer stratifications Boundary-Layer 875
Meteorology 103 205-226 876
Knyazikhin Y Schull MA Stenberg P Mottus M Rautiainen M Yang Y Marshak 877
A Latorre Carmona P Kaufmann RK Lewis P Disney MI Vanderbilt V Davis 878
AB Baret F Jacquemoud S Lyapustin A amp Myneni RB (2013) Hyperspectral 879
remote sensing of foliar nitrogen content Proceedings of the National Academy of 880
Sciences of the United States of America 110 E185-E192 881
Kovac D Malenovsky Z Urban O Spunda V Kalina J Ac A Kaplan V amp Hanus 882
J (2013) Response of green reflectance continuum removal index to the xanthophyll de-883
epoxidation cycle in Norway spruce needles Journal of Experimental Botany 64 1817-884
1827 885
Krausmann F Erb K-H Gingrich S Haberl H Bondeau A Gaube V Lauk C 886
Plutzar C amp Searchinger TD (2013) Global human appropriation of net primary 887
production doubled in the 20th century Proceedings of the National Academy of Sciences 888
of the United States of America 110 10324-10329 889
Lasslop G Reichstein M Papale D Richardson AD Arneth A Barr A Stoy P amp 890
Wohlfahrt G (2010) Separation of net ecosystem exchange into assimilation and 891
respiration using a light response curve approach critical issues and global evaluation 892
Global Change Biology 16 187-208 893
Laurent VCE Verhoef W Damm A Schaepman ME amp Clevers JGPW (2013) A 894
Bayesian object-based approach for estimating vegetation biophysical variables from at-895
sensor APEX radiance data Remote Sensing of Environment 139 6-17 896
Lee JE Berry JA Van der Tol C Yang X Guanter L Damm A Baker I amp 897
Frankenberg C (2015) Simulations of chlorophyll fluorescence in corporated into the 898
Community Land Model version 4 Global Change Biology in print 899
Lewis P amp Disney M (2007) Spectral invariants and scattering across multiple scales from 900
within-leaf to canopy Remote Sensing of Environment 109 196-206 901
35
Liu LY amp Cheng ZH (2010) Detection of Vegetation Light-Use Efficiency Based on 902
Solar-Induced Chlorophyll Fluorescence Separated From Canopy Radiance Spectrum Ieee 903
Journal of Selected Topics in Applied Earth Observations and Remote Sensing 3 306-312 904
Louis J Ounis A Ducruet JM Evain S Laurila T Thum T Aurela M Wingsle G 905
Alonso L Pedros R amp Moya I (2005) Remote sensing of sunlight-induced chlorophyll 906
fluorescence and reflectance of Scots pine in the boreal forest during spring recovery 907
Remote Sensing of Environment 96 37-48 908
Maier SW Guumlnther KP amp Stellmes M (2003) Sun-Induced Fluorescence A New Tool 909
for Precision Farming In M McDonald J Schepers L Tartly T van Toai amp D Major 910
(Eds) Digital Imaging and Spectral Techniques Applications to Precision Agriculture 911
and Crop Physiology (pp 209-222) ASA Special Publication 912
Mauder M Foken T Clement R Elbers JA Eugster W Gruenwald T Heusinkveld 913
B amp Kolle O (2008) Quality control of CarboEurope flux data - Part 2 Inter-914
comparison of eddy-covariance software Biogeosciences 5 451-462 915
Meroni M Busetto L Guanter L Cogliati S Crosta GF Migliavacca M Panigada 916
C Rossini M amp Colombo R (2010) Characterization of fine resolution field 917
spectrometers using solar Fraunhofer lines and atmospheric absorption features Applied 918
Optics 49 2858-2871 919
Meroni M Picchi V Rossini M Cogliati S Panigada C Nali C Lorenzini G amp 920
Colombo R (2008) Leaf level early assessment of ozone injuries by passive fluorescence 921
and photochemical reflectance index International Journal of Remote Sensing 29 5409-922
5422 923
Meroni M Rossini M Guanter L Alonso L Rascher U Colombo R amp Moreno J 924
(2009) Remote sensing of solar induced chlorophyll fluorescence review of methods and 925
applications Remote Sensing of Environment doi101016jrse200905003 926
Michaelis L amp Menten ML (1913) The kenetics of the inversion effect Biochemische 927
Zeitschrift 49 333-369 928
Middleton E McMurtney JE Campbell PK Corp LA Butcher LM amp Chappelle 929
EW (2002) Optical and fluorescence properties of corn leaves from different nitrogen 930
regimes In M Owe G Durso amp L Toulios (Eds) Conference on Remote Sensing for 931
Agriculture Ecosystems and Hydrology IV (pp 72-83) Agia Pelagia Greece 932
Miller JR Berger M Goulas Y Jacquemoud S Louis J Moise N Mohammed G 933
Moreno J Moya I Pedroacutes R Verhoef W amp Zarco-Tejada PJ (2005) Development 934
36
of a vegetation fluorescence canopy model Final Report May 2005 In European Space 935
Research and Technology Centre (ESTEC) 936
Monteith JL (1972) Solar-radiation and productivity in tropical ecosystems Journal of 937
Applied Ecology 9 747-766 938
Niinemets U Kollist H Garcia-Plazaola JI Hernandez A amp Becerril JM (2003) Do 939
the capacity and kinetics for modification of xanthophyll cycle pool size depend on growth 940
irradiance in temperate trees Plant Cell and Environment 26 1787-1801 941
Nobel PS Forseth IN amp Long SP (1993) Canopy structure and light interception 942
Ozanne CMP Anhuf D Boulter SL Keller M Kitching RL Korner C Meinzer 943
FC Mitchell AW Nakashizuka T Dias PLS Stork NE Wright SJ amp 944
Yoshimura M (2003) Biodiversity meets the atmosphere A global view of forest 945
canopies Science 301 183-186 946
Parazoo NC Bowman K Fisher JB Frankenberg C Jones DBA Cescatti A Peacuterez-947
Priego Oacute Wohlfahrt G amp Montagnani L (2014) Terrestrial gross primary production 948
inferred from satellite fluorescence and vegetation models Global Change Biology na-na 949
Plascyk JA (1975) MK II Fraunhofer Line Dicsriminator (FLD-II) for airborne and orbital 950
remote-sensing of solar-stimulated luminescence Optical Engineering 14 339-346 951
Porcar-Castell A Tyystjaumlrvi E Atherton J Van der Tol C Flexas J EE P Moreno 952
J Frankenberg C amp Berry JA (2014) Linking chlorophyll a fluorescence to 953
photosynthesis for remote sensing applications mechanisms and challenges Journal of 954
Experimental Botany 65 4065-4095 955
Rascher U Agati G Alonso L Cecci G Champagne S Colombo R Damm A 956
Daumard F De Miguel E Fernandez G Franch B Franke J Gerbig C Gioli B 957
Gomez JA Goulas Y Guanter L Gutierrez-De-La-Camara O Hamdi K Hostert 958
P Jimenez M Kosvancova M Lognoli D Meroni M Miglietta F Moersch A 959
Moreno J Moya I Neininger B Okujeni A Ounis A Palombi L Raimondi V 960
Schickling A Sobrino JA Stellmes M Toci G Toscano P Udelhoven T Van der 961
Linden S amp Zaldei A (2009) CEFLES2 The remote sensing component to quantify 962
photosynthetic efficiency from the leaf to the region by measuring sun-induced 963
fluorescence in the oxygen absorption bands Biogeosciences 6 1181-1198 964
Richter R amp Schlaumlpfer D (2002) Geo-atmospheric processing of airborne imaging 965
spectrometry data Part 2 Atmospherictopographic correction International Journal of 966
Remote Sensing 23 2631-2649 967
37
Rossini M Meroni M Migliavacca M Manca G Cogliati S Busetto L Picchi V 968
Cescatti A Seufert G amp Colombo R (2010) High resolution field spectroscopy 969
measurements for estimating gross ecosystem production in a rice field Agricultural and 970
Forest Meteorology 150 1283-1296 971
Rossini M Nedbal L Guanter L Ač A Alonso L Burkart A Cogliati S Colombo 972
R Damm A Drusch M Hanus J Julitta T Kokkalis P Moreno J Panigada C 973
Pinto F Schickling A Schuumlttemeyer D Zemek F amp Rascher U (2015) Red and far-974
red sun-induced chlorophyll fluorescence as a measure of plant photosynthesis 975
Geophysical Research Letters (accepted for publication) 976
Ruimy A Jarvis PG Baldocchi DD amp B S (1995) CO2 Fluxes over Plant Canopies 977
and Solar Radiation A Review Advances in Ecological Research 26 1-68 978
Running SW Nemani RR Heinsch FA Zhao MS Reeves M amp Hashimoto H 979
(2004) A continuous satellite-derived measure of global terrestrial primary production 980
Bioscience 54 547-560 981
Schaepman ME M J Hueni A DrsquoOdorico P Damm A Weyermann J Schneider F 982
Laurent VCE C P Seidel F Lenhard K Gege P Kuechler C Brazile J Kohler 983
P De Vos L Meuleman K Meynart R Schlaepfer D Kneubuumlhler M amp Itten K 984
(2015) Advanced radiometry measurements and Earth science applications with the 985
Airborne Prism Experiment (APEX) Remote Sensing of Environment 158 207-219 986
Schimel D Pavlick R Fisher JB Asner GP Saatchi S Townsend P Miller C 987
Frankenberg C Hibbard K amp Cox P (2014) Observing terrestrial ecosystems and the 988
carbon cycle from space Global Change Biology na-na 989
Schlaumlpfer D amp Richter R (2002) Geo-atmospheric processing of airborne imaging 990
spectrometry data Part 1 Parametric orthorectification International Journal of Remote 991
Sensing 23 2609-2630 992
Schneider FD Leiterer R Morsdorf F Gastellu-Etchegorry J-P Lauret N Pfeifer N 993
amp Schaepman ME (2014) Simulating imaging spectrometer data 3D forest modeling 994
based on LiDAR and in situ data Remote Sensing of Environment 152 235-250 995
Schroter D Cramer W Leemans R Prentice IC Araujo MB Arnell NW Bondeau 996
A Bugmann H Carter TR Gracia CA de la Vega-Leinert AC Erhard M Ewert 997
F Glendining M House JI Kankaanpaa S Klein RJT Lavorel S Lindner M 998
Metzger MJ Meyer J Mitchell TD Reginster I Rounsevell M Sabate S Sitch 999
S Smith B Smith J Smith P Sykes MT Thonicke K Thuiller W Tuck G 1000
38
Zaehle S amp Zierl B (2005) Ecosystem service supply and vulnerability to global change 1001
in Europe Science 310 1333-1337 1002
Sitch S Smith B Prentice IC Arneth A Bondeau A Cramer W Kaplan JO Levis 1003
S Lucht W Sykes MT Thonicke K amp Venevsky S (2003) Evaluation of ecosystem 1004
dynamics plant geography and terrestrial carbon cycling in the LPJ dynamic global 1005
vegetation model Global Change Biology 9 161-185 1006
Stewart DW Costa C Dwyer LM Smith DL Hamilton RI amp Ma BL (2003) 1007
Canopy structure light interception and photosynthesis in maize Agronomy Journal 95 1008
1465-1474 1009
Trnka M Dubrovsky M amp Zalud Z (2004) Climate change impacts and adaptation 1010
strategies in spring barley production in the Czech Republic Climatic Change 64 227-1011
255 1012
Turner DP Ritts WD Cohen WB Maeirsperger TK Gower ST Kirschbaum AA 1013
Running SW Zhao MS Wofsy SC Dunn AL Law BE Campbell JL Oechel 1014
WC Kwon HJ Meyers TP Small EE Kurc SA amp Gamon JA (2005) Site-level 1015
evaluation of satellite-based global terrestrial gross primary production and net primary 1016
production monitoring Global Change Biology 11 666-684 1017
van der Tol C Berry J Campbell PKE amp Rascher U (2014) Models of fluorescence 1018
and photosynthesis for interpreting measurements of solar-induced chlorophyll 1019
fluorescence Journal of Geophysical Research Biogeosciences IN PRESS 1020
van der Tol C Verhoef W amp Rosema A (2009a) A model for chlorophyll fluorescence 1021
and photosynthesis at leaf scale Agricultural and Forest Meteorology 149 96-105 1022
van der Tol C Verhoef W Timmermans A Verhoef A amp Su Z (2009b) An integrated 1023
model of soil-canopy spectral radiances photosynthesis fluorescence temperature and 1024
energy balance Biogeosciences 6 3109-3129 1025
Verhoef W (1984) Light scattering by leaf layers with application to canopy reflectance 1026
modeling The SAIL model Remote Sensing of Environment 16 125-141 1027
Verhoef W amp Bach H (2003a) Remote sensing data assimilation using coupled radiative 1028
transfer models Physics and Chemistry of the Earth 28 3-13 1029
Verhoef W amp Bach H (2003b) Simulation of hyperspectral and directional radiance 1030
images using coupled biophysical and atmospheric radiative transfer models Remote 1031
Sensing of Environment 87 23-41 1032
39
Verhoef W amp Bach H (2007) Coupled soil-leaf-canopy and atmosphere radiative transfer 1033
modeling to simulate hyperspectral multi-angular surface reflectance and TOA radiance 1034
data Remote Sensing of Environment 109 166-182 1035
Verhoef W Jia L Xiao Q amp Su Z (2007) Unified optical-thermal four-stream radiative 1036
transfer theory for homogeneous vegetation canopies Ieee Transactions on Geoscience 1037
and Remote Sensing 45 1808-1822 1038
Webb EK Pearman GI amp Leuning R (1980) Correction of flux measurements for 1039
density effects due to heat and water-vapour transfer Quarterly Journal of the Royal 1040
Meteorological Society 106 85-100 1041
Wu C Niu Z Tang Q amp Huang W (2010) Revised photochemical reflectance index 1042
(PRI) for predicting light use efficiency of wheat in a growth cycle validation and 1043
comparison International Journal of Remote Sensing 31 2911-2924 1044
Yang X Tang J Mustard JF Lee JE Rossini M Joiner J Munger JW Kornfeld 1045
A amp Richardson AD (2015) Solar-induced chlorophyll fluorescence that correlates with 1046
canopy photosynthesis on diurnal and seasonal scales in a temperate deciduous forest 1047
Geophysical Research Letters 1048
Zarco-Tejada PJ Berni JAJ Suarez L Sepulcre-Canto G Morales F amp Miller JR 1049
(2009) Imaging chlorophyll fluorescence with an airborne narrow-band multispectral 1050
camera for vegetation stress detection Remote Sensing of Environment 113 1262-1275 1051
Zarco-Tejada PJ Gonzalez-Dugo V amp Berni JAJ (2012) Fluorescence temperature and 1052
narrow-band indices acquired from a UAV platform for water stress detection using a 1053
micro-hyperspectral imager and a thermal camera Remote Sensing of Environment 117 1054
322-337 1055
Zarco-Tejada PJ Morales A Testi L amp Villalobos FJ (2013) Spatio-temporal patterns 1056
of chlorophyll fluorescence and physiological and structural indices acquired from 1057
hyperspectral imagery as compared with carbon fluxes measured with eddy covariance 1058
Remote Sensing of Environment 133 102-115 1059
Zhang Q Middleton EM Cheng YB amp Landis DR (2013) Variations of foliage 1060
chlorophyll fAPAR and foliage non-chlorophyll fAPAR (fAPARchl fAPARnonchl) at the 1061
Harvard Forest Ieee Journal of Selected Topics in Applied Earth Observations and Remote 1062
Sensing 6 2254-2264 1063
Zhang Q Middleton EM Gao BC amp Cheng YB (2012) Using EO-1 hyperion to 1064
simulate HyspIRI products for a coniferous forest The fraction of par absorbed by 1065
40
chlorophyll (fAPAR chl) and leaf water content (LWC) Ieee Transactions on Geoscience 1066
and Remote Sensing 50 1844-1852 1067
Zhang Y Guanter L Berry JA Joiner J van der Tol C Huete A Gitelson A Voigt 1068
M amp Koumlhler P (2014) Estimation of vegetation photosynthetic capacity from space-1069
based measurements of chlorophyll fluorescence for terrestrial biosphere models Global 1070
Change Biology 20 3727-3742 1071
1072
41
Appendix-A APEX data calibration 1073
The calibration of APEX images is based on the APEX Processing and Archiving Facility 1074
(PAF) which is the combined software and hardware designed to generate calibrated level 1 1075
at-sensor radiances from APEX raw image streams (Hueni et al 2009) Calibration 1076
coefficients for the radiometric geometric and spectral calibrations are generated from system 1077
calibrations at the APEX Calibration Home Base (CHB) at DLR Oberpfaffenhofen (Gege et 1078
al 2009) These CHB data are stored and processed within the APEX Calibration Information 1079
System (CAL IS) producing the so-called calibration cubes holding coefficients for each 1080
spatio-spectral pixel (Hueni et al 2013) 1081
For the multi-temporal dataset employed within this study all flight lines were 1082
reprocessed from the original raw image streams to ensure that the same version of the 1083
processor was applied The APEX PAF and CAL IS have significantly evolved over the 1084
timeframe of the dataset with calibrations getting more accurate over the years To ensure 1085
consistency all data were calibrated using coefficients obtained in May 2013 1086
The processor was specifically configured to retain the highest information content in 1087
the VNIR channel including i) no spectral resampling to compensate for spectral shifts and 1088
misregistrations (DOdorico et al 2010 DOdorico et al 2011) ii) no compensation of 1089
spectral shift related changes in radiometry (Hueni et al 2015) and iii) no spatial 1090
misregistration correction The calibration was thus effectively reduced to a linear dark 1091
current correction over time a de-smearing of the visible-NIR channel to compensate for 1092
sensor smear effects the application of radiometric gains and offsets followed by a destriping 1093
routine working in the spatial dimension only to remove pushbroom related along track 1094
striping Calibrated radiance data were directly used for the fluorescence retrieval (see Section 1095
24) while the feasibility to use APEX for SIF760 retrievals was theoretically demonstrated in 1096
42
a study of Damm et al (2011) Resulting SIF760 maps were afterwards geo-rectified using a 1097
parametric geocoding approach (Schlaumlpfer and Richter 2002) 1098
43
Appendix-B Retrieval of SIF760 from airborne data 1099
The quantification of SIF measured with ground or airborne-based spectrometers 1100
requires separating emitted SIF from the reflected radiance flux The Fraunhofer Line Depth 1101
(FLD) approach introduced by Plascyk (1975) serves as a de facto standard for medium 1102
resolution instruments such as APEX (Meroni et al 2009) and was applied in our study The 1103
FLD method uses atmospheric absorption bands characterized by lower incident light 1104
compared to wavelength regions outside of these bands This configuration increases the 1105
spectral information and allows the separation of SIF from reflected radiation In this study 1106
we used the broad O2-A oxygen absorption band around 760 nm and quantified the infilling of 1107
SIF760 using radiance measurements inside (subscript i) and outside (subscript o) of the O2-A 1108
band 1109
For the airborne case only atmospheric components can be simulated with 1110
MODTRAN-5 assuming perfect knowledge of the acquisition conditions The reflectance 1111
terms for diffuse and direct irradiance as well as the SIF760 contribution are usually unknown 1112
Assuming Lambertian surface reflectance behavior which introduces some inaccuracies but 1113
allows formulating the radiative transfer (RT) for radiance measurements at sensor level (LAtS) 1114
to obtain SIF760 both measurements inside and outside of the absorption band can be 1115
expressed as 1116
E9FA lang3H IJK LMNrangP QlangRSE rang T UlangVWWH VXWH rang∙langVYYH VYXH rangZH
Hlang[XXH rang T ABCHUlangVWWH ranglangVXWH rangZHlang[XXH rang ] ^ _ (B1) 1117
where E0 is the top-of-atmosphere irradiance including diffuse and direct irradiance 1118
components θil is the illumination zenith angle ρso is the path scattered radiance τss is the 1119
direct transmittance for sunlight τoo is the direct transmittance in view direction τsd is the 1120
diffuse transmittance of the atmosphere for sunlight τdo is the hemispherical-directional 1121
transmittance in view direction and ρdd is the spherical albedo If these atmospheric 1122
44
components are obtained from MODTRAN-5 simulations (Damm et al 2015 Verhoef and 1123
Bach 2003a b 2007) the radiative transfer equation (Eq B1) only contains four unknowns 1124
namely Ri Ro SIFi and SIFo The 3FLD method (Maier et al 2003) which is an adaptation of 1125
the original FLD method proposed by (Plascyk 1975) was used to linearly relate R and SIF 1126
inside and outside of the O2-A absorption band SIF can be finally retrieved with 1127
13 -0 abcMUdWecWlangRff_ rangZghcWUdMecMlangRff^ rangZiUdWecWlangRff_ rangZghUdMecMlangRff^ rangZ j
langVWWM ranglangVXWM rang (B2) 1128
kE lE9FA m lang3HW IJK LMNrangP langRSE rangn ] ^ _ (B3) 1129
E lang3HW IJK LMNrangP langoSSE TopSE rang ∙ langoE opE rang qEprs T Eprt] ^ _ (B4) 1130
r S13rlangoSSr rang T langopSr rang v13S$langoSSS rang T langopSS rangw (B5) 1131
where B is the factor relating SIFi and SIFo and was fixed to a value of 08 justified by 1132
simulations and experiments (Rascher et al 2009 Alonso et al 2008) Xj equals the at-1133
sensor radiance (reflected plus emitted radiation) without path radiance contribution and Ej 1134
expresses surface irradiance as measured at the sensor level A is the factor relating Ri and Ro 1135
and was derived from linear interpolation of R of the left (758 nm) and right (771 nm) O2-A 1136
band shoulder with 1137
xx+ (B6) 1138
y ```-0```z and y `-0`z
```z (B7) 1139
1140
Because APEX suffered from slight spectral smile effects (DOdorico et al 2010) 1141
updated center wavelength positions were involved in the convolution approach The spectral 1142
shift quantification for each pixel across track was based on the Cr method as described in 1143
45
Meroni et al (2010) The method assumes a high correlation between a measured and a 1144
convolved spectrum and iteratively minimizes a cost function which is 1 minus the Pearson 1145
correlation coefficient (r) calculated for both signals Remaining artifacts of the spectral shift 1146
correction and slightly inaccurate estimates of atmospheric properties cause SIF760 retrieval 1147
uncertainties We therefore applied a semi-empirical correction as described in Damm et al 1148
(2014) for each scan line across the track This technique employs reference surfaces which 1149
are free of any SIF760 emission (eg bare soil) to adjust the upward transmittance term inside 1150
the absorption feature oSSr The retrieval of SIF760 from top-of-canopy radiance data measured 1151
on ground follows the same approach as described in Eqs B2-B7 under the assumption that 1152
the surface irradiance can be approximated with the measurement of a reference panel and 1153
that ρso τdo and τdo can be set to 0 Furthermore the spectral resolution of APEX can be 1154
considered suboptimal for SIF760 retrievals although Damm et al (2011) demonstrate that 1155
APEX with its spectral resolution of 54 nm at 760 nm is sensitive for SIF760 However 1156
retrieved SIF760 values are too high and in an absolute sense incorrect We used reference 1157
SIF760 data obtained in parallel to the airborne acquisitions using the ASD field spectrometers 1158
(Section 23) to estimate the actual offset The observed scaling factor of 193 was afterwards 1159
applied to the retrieved SIF760 values to transfer them to a realistic value range 1160
46
Appendix-C SIF retrieval accuracy 1161
We applied a quantitative accuracy evaluation of resulting SIF760 maps using ground 1162
measured SIF760 values (Figure C1) Considering all reference data acquired during five 1163
campaigns a good linear relationship was achieved between ground and airborne-based 1164
SIF760 values (r2 = 071) but with a proportionality factor much higher than 1 (Figure C1-A) 1165
This experimentally obtained systematic overestimation of APEX SIF760 is comparable to 1166
simulation results documented in Damm et al (2011) Further we found slightly changing 1167
correlations between the different years (several linear models in Figure C1-A) which are 1168
likely caused by canopy structural effects spectral and radiometric performances of used 1169
ground instruments or slight deviations of the performance of APEX over time 1170
To compensate for the overestimation of APEX SIF760 we applied an empirical correction 1171
factor of 193 derived from the comparison of reference data and APEX which resulted in a 1172
rRMSE of 289 (Figure C1-B) 1173
1174
lt Figure C1 gt 1175
1176
The Laegeren site was covered with three adjacent flight lines having an overlap of 1177
approximately 10 (cf Figure 3) This configuration provides the opportunity to 1178
quantitatively evaluate the consistency of SIF retrievals obtained from different measurements 1179
and view zenith angles (ie plusmn 135deg) The comparison of SIF760 retrievals obtained from flight 1180
lines 1 and 2 reveals a moderate linear relationship for homogeneous agricultural surfaces (r2 1181
= 081 rRMSE = 57) We observed a systematic underestimation of flight line 1 compared 1182
to flight line 2 (factor 06) for a view zenith angle difference of ~26deg for SIF760 indicating 1183
either a directionality of SIF760 emissions or an insufficient decoupling of surface HCRF 1184
affected by reflectance anisotropy With increasing surface heterogeneity scattering increases 1185
47
and the agreement of retrieved SIF from both flight lines slightly decreases (ie for forested 1186
areas r2 of 05 and rRMSE of 88) This lower correlation can be mainly associated to slight 1187
geometric mis-registrations (ie max 2 pixel ~ 40 m) in combination with surface 1188
heterogeneity (eg shaded and sunlit tree crowns) and emission anisotropy of SIF760 Also 1189
negative SIF760 values are present in the SIF760 maps and caused by sensor noise and 1190
especially for forests due to shadowing effects (Damm et al 2015) 1191
48
Appendix-D Technical aspects determining the SIF760 retrieval accuracy 1192
A rigorous evaluation of the SIF760 retrieval accuracy is crucial to judge the reliability 1193
of our assessment on the relationship between SIF760 and GPPEC across ecosystems 1194
Furthermore additional factors imposing variations on SIF760 retrieved from airborne 1195
spectroscopy data that cannot be related to the physiological origin of SIF760 needs to be 1196
critically discussed to justify the proposed approach 1197
Ground-based measurements of SIF760 were made using field spectrometers to validate 1198
the airborne retrievals Field spectroscopy provides a good reference for validating airborne 1199
retrievals as it is likely not affected by biases resulting from atmospheric composition 1200
estimates (eg aerosol load) due to the simultaneous measurement of irradiance fluxes at 1201
canopy level using a reference panel The reliability of the applied field spectroscopic 1202
approach to measure SIF760 was previously demonstrated using field studies (Damm et al 1203
2010 Liu and Cheng 2010 Meroni et al 2009 Rascher et al 2009) and theoretical 1204
assessments (Damm et al 2011) It must be noted that field spectroscopic approaches are 1205
subject to uncertainties particularly for heterogeneous vegetation canopies Damm et al 1206
(2015) discussed retrieval errors caused by illumination effects likely introducing slight 1207
errors in reference SIF760 This source of uncertainty must be considered when judging the 1208
accuracy of APEX SIF760 The nevertheless good agreement between ground and airborne 1209
observations indicated that atmospheric absorption and scattering effects could be sufficiently 1210
compensated and thus demonstrated the reliability of retrieved SIF760 measurements In 1211
particular the empirical correction applied making use of high spatial resolution airborne IS 1212
data in combination with reference surfaces not emitting SIF760 allowed to bypass retrieval 1213
uncertainties caused by atmospheric effects (Damm et al 2014) 1214
Instrumental effects in combination with retrieval methods were found to cause 1215
systematic differences in SIF760 retrievals (Damm et al 2011) the comparatively low 1216
49
resolution of APEX around the O2-A band used to retrieve SIF760 (ie ~54 nm) resulted in an 1217
overestimation of APEX SIF760 compared to retrievals from high resolution instruments 1218
Indeed maximum APEX SIF760 values are 6 mW m-2 sr-1 nm-1 while typical SIF760 values 1219
obtained from high resolution instruments range between 0 and 3 mW m-2 sr-1 nm-1 (Guanter 1220
et al 2013) Considering SIF760 values retrieved from ASD data in original resolution (3 nm) 1221
APEX showed an overestimation of 1102 which confirmed that low spectral resolution 1222
resulted in an overestimation of SIF760 The reasoning for this absolute error is given by the 1223
sub-optimal spectral resolution of APEX with 54 nm at 760 nm causing a reduced sensitivity 1224
for SIF760 on the one hand and a wider distance of the O2-A shoulder values used to 1225
parameterize the 3FLD approach on the other hand The bias was corrected using the ASD 1226
reference data and does not impact the results of our analysis Further the relative variation of 1227
SIF760 is unaffected by the bias 1228
Surface heterogeneity complicates the retrieval of SIF760 According to Damm et al 1229
(2015) SIF760 retrievals for forest sites are especially subject to uncertainties due to 1230
assumptions on surface irradiance Crown shapes and associated surface orientations 1231
determine the intensity and quality of irradiance including fractional amounts of diffuse and 1232
direct irradiance To account for pixel wise changes in surface irradiance high resolution 1233
digital object models (DOM) (eg derived from LiDAR observations) are required In 1234
absence of such a high resolution DOMrsquos crowns are assumed to be flat which results in 1235
uncertainties of up to 58 in case of cast shadows (Damm et al 2015) Since we used 1236
averaged observations over larger areas representing flux tower footprints and most of our 1237
data were flown under comparable illumination conditions (ie around solar noon) we 1238
expect these potential biases to be less influential in this analysis 1239
1
Tables 1
Table 1 Date and time of APEX flights and corresponding eddy covariance flux tower 2
measurements for the three investigated ecosystems (ie grassland cropland mixed 3
temperate forest) 4
Date Time [UTC] Location Ecosystem Flux tower
17062009 950 Laegeren forest 1 tower
17062009 1030 Oensingen cropland 1 tower
17062009 1030 Oensingen grassland 2 tower
25062010 1030 Oensingen cropland 1 tower
25062010 1030 Oensingen grassland 2 tower
26062010 1500 Laegeren forest 1 tower
26062010 1030 Oensingen cropland 1 tower
26062010 1030 Oensingen grassland 2 tower
29062010 1030 Laegeren forest 1 tower
26062011 1030 Laegeren forest 1 tower
28062011 1030 Oensingen cropland 1 tower
28062011 1030 Oensingen grassland 1 tower
16062012 1025 Laegeren forest 1 tower
16062012 900 Oensingen cropland 1 tower
16062012 1100 Oensingen cropland 1 tower
12072013 730 Laegeren forest 1 tower
03092013 1050 Laegeren forest 1 tower
5
2
Table 2 Availability of reference SIF760 data obtained from field spectroscopy measurements 6
to validate APEX based SIF760 retrievals 7
Date time [UTC] Location Measured crops Nr points
17062009 1030 Oensingen maize rye pea sugar beet wheat white clover 29 points
25062010 1030 Oensingen maize pea sugar beet wheat white clover 15 points
16062012 900 Oensingen carrot maize winter wheat 11 points
16062012 1100 Oensingen carrot maize winter wheat 10 points
8
3
Table 3 Goodness of fit for the hyperbolic model describing the relationship between GPPEC 9
and SIF760 O PRI and MCARI2 for the three ecosystem types perennial grassland cropland 10
and mixed temperate forest Calculated statistics are based on all data acquired from 2009-11
2013 as described in Table 1 12
Optical variable Ecosystem Regression coefficient Relative RMSE []
SIF crops 088 355
grass 059 2708
forest 048 1588
PRI crops 0008 1176
grass 095 860
forest 009 2179
MCARI2 crops 0005 1029
grass 098 550
forest 034 1798
13
1
Figures 1
2
Figure 1 Study sites A Oensingen agricultural site B Laegeren forest site The white 3
rectangles represent in A the boundary of investigated fields that comprise most of the flux-4
tower footprints and in B a coarse outline of the footprint area of the flux-tower The white 5
crosses show the locations of the flux-towers Background RGB images from Google-Earth 6
2
7
Figure 2 APEX reflectance and SIF760 image for the Oensingen site acquired on the 2606 8
2010 1030 UTC A top-of-canopy hemispherical-conical reflectance data as true color 9
composite B SIF760 map The white boxes indicate the approximate position of the flux 10
tower 11
3
12
Figure 3 APEX reflectance and SIF760 image for the Laegeren site acquired on the 2606 13
2010 1510 UTC A top-of-canopy hemispherical-conical reflectance data as true color 14
composite B SIF760 map The black arrows indicate the flight direction of flight line 1 to 3 15
(FL1-FL3) The white line marks a transect along the overlapping region of FL1 and FL2 The 16
white boxes indicate the approximate position of the flux tower 17
4
18
Figure 4 Relationships between GPPEC from the eddy-covariance measurements and SIF760 O 19
instantaneously measured between 2009 and 2013 (see Table 1) with the airborne 20
spectrometer APEX (A) PRI index (B) and MCARI2 index (C) for three vegetation types 21
(black dots perennial grassland dark grey rectangles cropland including winter wheat pea 22
and barley grey triangles mixed temperate forest) The solid curves correspond to a 23
hyperbolic model fitted to the measured data The dashed curves show the extrapolated 24
behavior 25
5
26
Figure 5 Daily light response curves from eddy flux measurements for A cropland B 27
perennial grassland and C mixed temperate forest Data were acquired between 2009 and 28
2013 (see Table 1) Grey curves represent a fitted hyperbolic model to approximate the 29
behavior of measured PAR-GPP values Crosses show GPPEC measurements that were used 30
for the SIF760 O - GPPEC comparison based on the time of APEX flights PAR values are 31
binned in 20 mW m-2
sr-1
nm-1
increments 32
6
33
Figure 6 Leaf level relationships between photosynthetic (LUEp) and fluorescence yield 34
(LUEf) for a typical C3 crop Dependency of LUEp (A) and LUEf (B) on APAR C 35
Relationship between LUEp and LUEf D Relationship between APAR and GPPL GPPL was 36
calculated as APARLUEp E Relationship between APAR and SIF760 SIF760 was calculated 37
as APARLUEf assuming a constant relationship between the SCOPE output SIFtotalL 38
(integral between 640-850nm) and SIF760L F Relationship between SIF760 L and GPPL All 39
data were simulated using SCOPE The grey areas indicate illumination conditions 40
comparable to APEX flights 41
7
42
Figure 7 Canopy level relationships between photosynthetic (LUEp) and fluorescence yield 43
(LUEf) for different canopy representations of a C3 cropland in SCOPE Dependency of 44
LUEp (A) and LUEf (B) on APAR LUEp was calculate as GPPCAPAR and LUEf was 45
directly obtained from SCOPE C Relationship between LUEp and LUEf D Relationship 46
between APAR and GPPC GPPC was directly obtained from SCOPE E Relationship 47
between APAR and SIF760C SIF760C was directly obtained from SCOPE F Relationship 48
between SIF760C and GPPC The black dashed line corresponds to a C3 cropland with LAI = 49
30 fraction of brown pigments (Cs) = 00 and a spherical (sp) leaf inclination distribution 50
function (LIDF) For the grey line Cs was changed to 20 for the black dashed line the LAI 51
was changed to 10 and for the grey dasheddotted line the LIDF was changed to plagiophile 52
(pg) The grey areas indicate illumination conditions comparable to APEX flights 53
8
54
Figure 8 Impact of temporal scaling on the SIF760C-GPPC relationship SIF760C and GPPC 55
data were simulated using SCOPE Model input parameters air temperature (A) PAR (B) and 56
LAI (C) were measured within the NitroEurope project (httpwwwnitroeuropeeu) at the 57
Speulderbos forest site Netherlands D Relationship between SIF760C and GPPC including a 58
fitted hyperbolic model for daily averages (grey dots and grey line) monthly averages (dark 59
grey triangles and line) and quarterly data (black dots and black dashed line) 60
9
61
Figure C1 Comparison of ground and airborne-based SIF760 retrievals from various crops 62
Data were acquired during four campaigns between 2009 and 2012 in the agricultural site 63
Oensingen (see Table 2) Left Fitted linear regression lines for the four considered campaigns 64
are overlaid in black The dashed line corresponds to the 11 line Right SIF retrievals from 65
APEX after applying an empirical correction factor (193) The black line represents the fitted 66
linear model the dashed line corresponds to the 11 line 67
4
measured footprint (Barcza et al 2009 Kljun et al 2002) Combined large scale modeling 75
and observational approaches based on vegetation greenness are spatially contiguous but face 76
the complexity of naturally varying systems including diverse interactions and complex 77
feedbacks which limit their predictive capabilities (Beer et al 2010 Goetz and Prince 1999 78
Turner et al 2005) 79
Over the last decade significant progress has been made in measuring plant-light 80
interactions and the process of photosynthesis Remote measurements of sun-induced 81
chlorophyll fluorescence (SIF) in particular open a new perspective to assess photosynthesis 82
at ecosystem scale SIF is a radiation flux emitted from plant chlorophyll molecules a few 83
nanoseconds after light absorption in the wavelength range from 600-800 nm and is 84
considered an indicator for the functional status of actual plant photosynthesis (Baker 2008) 85
Various studies demonstrated the possibility to measure SIF at certain wavelengths on ground 86
(Guanter et al 2013 Rascher et al 2009) from airborne platforms (Damm et al 2014 87
Guanter et al 2007 Zarco-Tejada et al 2012) and from satellites (Frankenberg et al 2011 88
Guanter et al 2014 Joiner et al 2013) Recent research demonstrated SIF being sensitive to 89
changes in photosynthesis showing strong links to GPP at the level of leaves (Meroni et al 90
2008 Middleton et al 2002) plants (Damm et al 2010 Rossini et al 2010) canopies (Zarco-91
Tejada et al 2013) and ecosystems (Frankenberg et al 2011 Guanter et al 2012) 92
Observed relationships between SIF and GPP are conceptually explained using an 93
approximation of GPP based on Monteithrsquos light use efficiency concept (Monteith 1972) 94
∙ (1) 95
where APAR is the absorbed photosynthetically active radiation expressed in radiance units 96
and LUEp is the efficiency of light utilization for photosynthesis and allows converting 97
measured radiances into the number of fixed CO2 molecules SIF is expressed by expanding 98
the GPP notation in Eq (1) following Guanter et al (2014) 99
13 ∙ ∙ (2) 100
5
where LUEf is the light use efficiency of SIF (fluorescence yield) and fesc accounts for a 101
structural interference determining the fraction of SIF photons escaping the canopy 102
Relationships between SIF and GPP are mostly driven by the common APAR term In 103
addition a covariance between both light use efficiencies LUEp and LUEf is expected to 104
occur in absence of the confounding impact of other protective mechanisms (Damm et al 105
2010 Guanter et al 2014) 106
The above outlined concept relating SIF and GPP simplifies a complex set of 107
underlying mechanisms and violation of any assumptions made will directly confound the 108
SIF-GPP relationship In particular the competition of three processes for de-exciting 109
absorbed light energy ie photochemistry radiative energy loss (SIF) and non-radiative 110
energy dissipation (commonly approximated as non-photochemical quenching NPQ) causes 111
complex and changing sensitivities of emitted SIF to actual rates of photosynthesis (Porcar-112
Castell et al 2014 van der Tol et al 2014 van der Tol et al 2009a) This directly implies that 113
the functional link between SIF and GPP depends on the rate of NPQ and consequently on 114
ambient stress levels At canopy scale the three-dimensional structure causes gradients in 115
light interception and light quality within canopies (Nobel et al 1993 Stewart et al 2003) 116
additionally altering the rate of NPQ (Demmig-Adams 1998 Niinemets et al 2003) and thus 117
impacting the SIF-GPP relationship Canopy structure also increases the probability for the 118
emitted SIF photons either to be re-absorbed by chlorophyll or to escape the canopy (Fournier 119
et al 2012 Knyazikhin et al 2013) to some extent violating the assumption of fesc to be 120
constant In addition to these structural and physiological effects variations in SIF signals 121
caused by for example instrumental (Damm et al 2011) or atmospheric effects (Damm et al 122
2014 Guanter et al 2010) and retrieval uncertainties related to the estimation of surface 123
irradiance (Damm et al 2015) can potentially affect the apparent relationship between SIF 124
and GPP Proper understanding of confounding factors remains crucial to use SIF to constrain 125
6
estimates for GPP at ecosystem or continental scales (Garbulsky et al 2014 Guanter et al 126
2012 Parazoo et al 2014) 127
Considering the above listed mechanisms several aspects need to be addressed to 128
further exploit SIF as a robust constraint for estimating GPP We therefore aim at 129
investigating the functional information content of SIF and its link to GPP considering three 130
structurally and physiologically contrasting ecosystems ie cropland perennial grassland 131
and mixed temperate forest We use an innovative combination of multi-temporal imaging 132
spectroscopy (IS) data EC flux tower observations and modeling approaches at the leaf and 133
canopy levels i) to assess the relationship between far red SIF retrieved in the O2-A band at 134
760 nm (SIF760) and GPP across ecosystems and ii) to investigate the impact of confounding 135
factors on the SIF760-GPP relationship ie temporal scaling effects and structural and 136
physiological interferences using a photosynthesis model Our findings contribute to a better 137
understanding of the information inherent in remotely measured SIF760 and its functional 138
relationship to GPP Aspects discussed will help bridging the gap between small scale studies 139
and observational attempts to estimate GPP globally 140
141
2 Methods 142
21 Study sites 143
We investigated three contrasting ecosystems located on the Central Swiss Plateau in 144
terms of structure heterogeneity species composition and annual productivity Two of these 145
ecosystems were collocated in the agricultural area near the town of Oensingen (47deg1711rdquo N 146
7deg4401rdquo E 452 masl Figure 1A) This area is characterized by relatively small agricultural 147
parcels with grassland clover fallow cropping bean maize rapeseed pea sugar beet winter 148
barley and winter wheat rotating as dominant crops Two grassland fields differently 149
managed in terms of species composition fertilization and harvesting activities (Ammann et 150
7
al 2007) were investigated as representatives of the ecosystem type perennial grassland as 151
well as a cropland (one field with arable crop rotation) for the ecosystem type cropland The 152
forest area (47deg2842rdquo N 8deg2152rdquo E Figure 1B) is located on the south-facing slope of the 153
Laegeren mountain northwest of the city of Zurich The temperate mixed forest is 154
characterized by a relatively high species diversity and a complex canopy structure with 155
beech ash sycamore and spruce being the dominant species (Eugster et al 2007 Schneider 156
et al 2014) 157
158
lt Figure 1 gt 159
160
Both test sites are well instrumented (ie with eddy-covariance flux towers 161
micrometeorological stations) and were extensively sampled during several airborne 162
campaigns between 2009 and 2013 (Table 1) 163
164
lt Table 1 gt 165
166
22 Airborne spectroscopy 167
All three study sites were measured with the Airborne Prism EXperiment (APEX) 168
sensor on several days between 2009 and 2013 (Table 1) APEX is an airborne dispersive 169
pushbroom imaging spectrometer covering the 400-2500 nm spectral region in 313 narrow 170
continuous spectral bands APEX allows capturing the O2-A atmospheric absorption feature 171
and thus retrieving SIF760 with a spectral sampling interval of 45 nm a full width at half 172
maximum (FWHM) of 57 nm and a signal to noise ratio of approximately 450 in and 800 173
outside of the O2-A feature for a 50 reflective target and a sun zenith angle of 30deg (Jehle et 174
al 2010 Schaepman et al 2015) 175
8
Radiance calibration of APEX images is performed using the approach of Hueni et al 176
(2009) Multitemporal comparison of images is secured by using consistent calibration and 177
processing versions Precise retrievals of SIF typically require data measured in sub-178
nanometer spectral resolution However the feasibility of using APEX like instruments (ie 179
FWHM ~5nm) for SIF760 retrievals was theoretically assessed in Damm et al (2011) and 180
experimentally demonstrated in recent work (Zarco-Tejada et al 2009 Zarco-Tejada et al 181
2013) The use of calibrated APEX radiance data for the fluorescence retrieval is described in 182
Section 24 and Appendix-B Vegetation indices (see Section 25) were calculated using 183
Hemispherical-Conical-Reflectance-Factor data obtained after atmospheric correction using 184
ATCOR-4 (Richter and Schlaumlpfer 2002) Resulting SIF760 and vegetation indices were 185
projected in the same map projection using parametric geocoding (Schlaumlpfer and Richter 186
2002) Details about APEX data calibration are listed in Appendix-A 187
188
23 Field spectroscopy 189
ASD (PANalytics Boulder US) field spectrometer data were acquired for validation 190
purposes within one hour of the APEX overflight during four campaigns In total 23 191
agricultural fields covering various crops including carrot maize pea rye sugar beet wheat 192
white clover were systematically sampled by measuring reflected and emitted radiances in 193
four homogeneous 3 m2 plots per field (Table 2) Incident light was quantified before and 194
after measuring each plot using a Spectralon reference panel 195
196
lt Table 2 gt 197
198
24 SIF760 retrieval 199
Emitted SIF was analytically separated from the reflected radiance flux measured with 200
ground and airborne-based spectrometers (see Appendix-B) We applied the Fraunhofer Line 201
9
Depth (FLD) approach (Plascyk 1975) which serves as a standard for SIF retrievals using 202
medium resolution instruments (Meroni et al 2009) The FLD method uses atmospheric 203
absorption bands characterized by lower incident light compared to wavelength regions 204
outside of these bands This configuration allows evaluating the in-filling of the absorption 205
bands by SIF (Damm et al 2014) In this study we used the broad O2-A oxygen absorption 206
band around 760 nm for the SIF760 retrieval For the ground data surface irradiance was 207
estimated from white reference measurements while perturbing atmospheric absorption and 208
scattering effects were assumed to be negligible on the 1 m pathway between canopy and 209
sensor (cf Damm et al (2014) for details on the set-up for SIF760 retrieval on the ground) 210
For the airborne measurements we compensated atmospheric absorption and scattering using 211
the atmospheric radiative transfer model MODTRAN5 (Berk et al 2005) Details of the 212
SIF760 retrievals using airborne data are provided in Appendix-B 213
214
25 Derivation of additional spectral indices 215
The relationship between two vegetation indices and GPP was investigated in parallel 216
to judge the performance of the new remote observation of SIF compared to commonly used 217
remote sensing approaches The photochemical reflectance index (PRI) (Gamon et al 1992) 218
was found to be sensitive to pigment changes related to the xanthophyll cycle and is 219
frequently used to quantify LUEp and GPP (Cheng et al 2013 Drolet et al 2008 Hilker et al 220
2009) The PRI was calculated as 221
(3) 222
while Rλ accounts for the surface reflectance at the wavelength λ 223
We further tested the soil adjusted Modified Chlorophyll Absorption Ratio Index 2 224
(MCARI2) (Haboudane et al 2004) that was found to be strongly related to green LAI thus 225
potential photosynthesis and is calculated as 226
10
2 $amp($)$+-amp0 (4) 227
228
26 Eddy-covariance measurements 229
Continuous turbulent fluxes of CO2 were measured at the agricultural and forest sites 230
between 2009 and 2013 using the EC technique (Baldocchi 2003) At each site the EC 231
instrumentation consisted of an open-path infrared gas analyzer (IRGA) (model LI-7500 LI-232
COR Inc Lincoln NE USA) and a three-dimensional sonic anemometer-thermometer 233
(models HS R3 and R2 Gill Instruments Lymington UK) EC measurements were made at a 234
frequency of 20 Hz and processed to half-hourly averages using the eth-flux EC software for 235
the forest and cropland (Mauder et al 2008) or a comparable custom-made EC software for 236
the grassland (Ammann et al 2007) Post-processing included corrections for damping losses 237
(Eugster and Senn 1995) air density fluctuations (Webb et al 1980) data screening for 238
optical sensor contamination stationary or low turbulence conditions (Foken and Wichura 239
1996) and statistical outliers Standardized gap filling and partitioning of CO2 fluxes was 240
performed using the methodology from Lasslop et al (2010) for the forest and cropland and 241
using the methodology from Falge et al (2001) for the grassland Measurements of 242
photosynthetic photon flux density (PPFD) quantified in micromol m-2 s-1 were converted to 243
radiance units (mW m-2 sr-1 nm-1) representing the photosynthetic active radiation (PAR) to 244
be consistent with Monteithrsquos LUE concept and the SIF radiance units 245
246
27 Leaf area index measurements 247
The Leaf Area Index (LAI) of the grassland and cropland was measured at the time of 248
APEX flights using an optical non-destructive approach based on LAI-2000 leaf area meter 249
observations (Li-Cor Lincoln USA) The LAI of the forest was estimated using digital 250
11
hemispherical photographs at two subplots following the VALERIE sampling scheme while 251
subsequent analysis were applied to obtain the LAI (Schneider et al 2014) 252
253
28 Statistical analysis of SIF760 - GPP relationship 254
SIF760 values were manually extracted from APEX-SIF760 maps for areas representing 255
the footprint of eddy-flux measurements (Figure 1) For the perennial grassland and cropland 256
we selected all pixels with SIF760 values ge 0 mW m-2 sr-1 nm-1 in respective fields although the 257
EC tower footprint can be slightly smaller than the entire field The increased number of 258
resulting pixels allows reducing data noise and covering small spatial variations within the 259
footprint Using the pixels of the entire field is justified by the large homogeneity of the 260
underlying fields (Figure 1A) For the forest site Laegeren all pixels representing an area that 261
covered 70 of all footprint occurrences were selected irrespective of spatial footprint 262
changes due to changing wind conditions Using the same area for all years reduces variations 263
in SIF due to changes in biomass and canopy structure but also reduces the representativeness 264
of selected pixels for actual spatial EC footprints 265
We used a hyperbolic model to relate GPP to SIF760 and to both vegetation indices 266
Although the hyperbolic model only empirically approximates the data behavior it is 267
supported by theoretical arguments for the SIF760-GPP relationship that are outlined hereafter 268
The photosynthetic efficiency LUEp is often described as a hyperbolic function of APAR 269
following the Michaelis-Menten theory (Michaelis and Menten 1913) 270
∙123467899 (5) 271
where c is a coefficient in radiance units and LUEpmax c represents GPPmax Following Eqs 272
(1) and (5) GPP rises asymptotically with APAR to GPPmax This equation is used in many 273
models for partitioning GPP eg Falge et al (2001) Substituting LUEp from Eq (5) and 274
APAR = SIF760 (LUEf fesc) from Eq (2) into Eq (1) results in 275
12
lt= gtampABCampD (6) 276
where the coefficient b represents cLUEffesc accounting for the difference between LUEp 277
and LUEf GPPmax is a value that is asymptotically reached representing the photosynthetic 278
capacity or GPP of the canopy at light saturation It must be noted that Eq (6) is a 279
simplification of the complex relationships between GPP and SIF760 and thus performs best if 280
c LUEf fesc remains constant or SIF760 corresponds to APAR A constant LUEf is a 281
reasonable first approximation for vegetation that is only moderately stressed meaning that 282
variations in LUEf are substantially smaller than variations in LUEp (van der Tol et al 2014) 283
Moderate stress relates to any kind of environmental conditions (warm temperature strong 284
irradiance reduced water availability) that cause only short term and slight changes in 285
photochemical and non-photochemical protections However c and fesc are known to vary 286
across ecosystems and LUEf changes under environmental stress In order to evaluate their 287
impacts on the SIF-GPP relationships as expressed in Eq (6) we carried out simulations with 288
the Soil-Canopy Observations of Photosynthesis and Energy balance model SCOPE version 289
153 (van der Tol et al 2009b) (see Section 29) The goodness of fit for the hyperbolic model 290
was quantified using non-linear regression analysis and was quantitatively described using the 291
root mean square error normalized by the mean of measured data (rRMSE) and the coefficient 292
of determination R2 defined as the correlation between data and the best fit-curve determined 293
by non-linear regression 294
295
29 SCOPE simulations 296
SCOPE uses semi-empirical models for LUEp (Collatz et al 1991) and LUEf (van der 297
Tol et al 2014) embedded in a radiative transfer scheme for the canopy (van der Tol et al 298
2009b) The radiative transfer model at leaf level (Fluspect) is an extension of PROSPECT 299
(Jacquemoud and Baret 1990) and includes a fluorescence component The radiative transfer 300
13
within the canopy is calculated following Verhoef (1984) in the optical domain (SAIL) 301
following Verhoef et al (2007) in the thermal domain and Miller et al (2005) for the 302
fluorescence emissions (FluorSAIL) SCOPE requires a number of vegetation structural and 303
physiological parameters as well as weather information as input The model simulates GPP 304
and spectrally distributes SIF with a spectral resolution and a spectral sampling interval of 10 305
nm each Simulated PPFD values (micromol m-2 s-1) were also converted to radiance units (PAR) 306
We carried out three simulations using SCOPE In the first simulation we calculated 307
leaf level LUEf and LUEp of a typical C3 cropland as function of varying APAR For the 308
second simulation at canopy level we calculated LUEf and LUEp as function of varying 309
APAR for differently structured canopies We took the standard SCOPE parameters for a 310
typical C3 cropland and varied APAR and the structural parameters LAI leaf inclination 311
angle (LIDF) and the fraction of brown pigments (Cs) Both simulation experiments provide 312
theoretical evidence on the relationships between LUEf and LUEp between SIF760 and GPP 313
and their respective relationships to APAR For the third canopy level simulation SCOPE 314
was initialized using time series of mid-day (solar noon) meteorological data (PAR air 315
temperature) a seasonal cycle of LAI and the modelrsquos default soil and vegetation parameters 316
for a C3 cropland (cf the SCOPE user manual) The purpose of this simulation was to 317
evaluate seasonal SIF760-GPP relationships at various temporal aggregation levels For better 318
readability we use the following notation through the manuscript SIF760 O for APEX-SIF 319
SIF760 L and SIF760 C for SCOPE simulated leaf and canopy SIF GPPEC for flux tower GPP 320
and GPPL GPPC to relate to simulated GPP at leaf and canopy level 321
322
3 Results 323
31 SIF760 maps 324
14
Two examples of SIF760 O maps obtained from APEX are shown in Figures 2 and 3 325
The appearance of SIF760 O emissions in vegetated areas demonstrates that measured SIF760 O 326
signals originated solely from vegetation and were not contaminated by non-fluorescent non-327
vegetation surfaces Retrieved SIF760 O values range between 0 and 3 mW m-2 sr-1 nm-1 and 328
showed a high agreement (r2 = 07 rRMSE = 289) with in-situ measured reference data 329
Details of the SIF760 O validation are discussed in Appendix-C 330
331
lt Figure 2 gt 332
lt Figure 3gt 333
334
32 Relationships of GPPEC with SIF760 O PRI and MCARI2 335
Relating instantaneous measurements of SIF760 O and GPPEC from several years 336
revealed an asymptotic relationship with saturating GPPEC in presence of moderate to high 337
SIF760 O (Figure 4A Table 3) This general behavior was consistent for all investigated 338
vegetation types The fitted hyperbolic model shows a moderate to high goodness of fit for the 339
grassland (R2 = 059 rRMSE = 271) cropland (R2 = 088 rRMSE = 35) and forest (R2 = 340
048 rRMSE = 1588) The saturation of GPPEC appeared earlier for the cropland (SIF760 O 341
~05 mW m-2 sr-1 nm-1) than for the grassland and forest (SIF760 O gt 10 mW m-2 sr-1 nm-1) An 342
independent assessment considering a linear model to describe the relationship between 343
SIF760 O and GPPEC revealed a consistently lower goodness of fit justifying the use of a 344
hyperbolic model (data not shown) 345
Statistical analysis showed that a hyperbolic model represents well the relationship 346
between both vegetation indices (PRI and MCARI2) and GPPEC for the grassland with a 347
notable variation in LAI (range between 05 and 48 m2 m-2) However a hyperbolic model 348
does not allow well representing the relationship between PRI and MCARI2 with GPPEC for 349
the forest and cropland both showing only a small variation in LAI (less than plusmn03 m2 m-2) 350
15
(Figure 4B-C Table 3) The goodness of fit for the hyperbolic model describing the PRI and 351
GPPEC data for grassland (R2 = 095 rRMSE = 86) was even higher compared to SIF760 O 352
but lower for forest (R2 = 009 rRMSE = 2179) and cropland (R2 = 0008 rRMSE = 353
1176) With MCARI2 the goodness of fit for the hyperbolic model for grassland was high 354
(R2 = 098 rRMSE = 55) but low for cropland (R2 = 0005 rRMSE = 1029) and forest 355
(R2 = 034 rRMSE = 1798) Again considering a linear relationship between both 356
vegetation indices and GPPEC revealed no consistent improvement compared to the use of a 357
hyperbolic model (data not shown) 358
359
lt Figure 4 gt 360
lt Table 3 gt 361
362
33 Assessment of factors determining SIF760 GPPEC relationships 363
The asymptotic relationship between SIF760 O and GPPEC (Figure 4A) represented 364
instantaneous measurements of different canopies at different times and days over several 365
years covering a range of different light conditions phenological stages of the forest and 366
various amounts of green biomass for both investigated grasslands (crosses in Figure 5A-C 367
that indicate EC measurements during APEX overpasses) Relationships between SIF760 O and 368
GPPEC are consequently a complex function of light absorption in the canopy (APAR) of the 369
efficiency of light utilization (ie expressed as photosynthetic capacity and quantum 370
efficiency of photosynthesis) and of structural effects including fractions of non-371
photosynthetic vegetation components Both grass canopies were measured before and after 372
mowing resulting in a large range in LAI (05-48 m2 m-2) and GPPEC (4-27 micromol m-2 s-1) for 373
similar PAR values The forest LAI of 50 m2 m-2 was more constant over the years due to the 374
consistent timing of flights however senescence (eg lower canopy chlorophyll content and 375
light absorption) might explain the decrease in GPPEC of 15 micromol m-2 s-1 in September for 376
16
comparable irradiance conditions (Figure 5C) Investigated crops (winter wheat barley and 377
pea) were characterized by small variations in LAI (22-25 m2 m-2) and chlorophyll contents 378
corresponding to small variations in GPPEC (5 micromol m-2 s-1) while observed under comparable 379
irradiance conditions During the time of observation the barley and wheat canopies were in 380
the ripening phase with a pronounced ear layer 381
382
lt Figure 5 gt 383
384
The validity of the asymptotic relationship between SIF760 O and GPPEC was tested 385
using simulations made with the SCOPE model We emphasize that the regression coefficient 386
b in Eq (6) includes terms that vary in the model (b= cmiddotLUEfmiddotfesc) the fluorescence efficiency 387
LUEf varies with irradiance conditions (predominantly APAR) the fraction fesc depends on 388
vegetation structure while c=GPPmaxLUEpmax varies between sites and over time during the 389
season We first analysed how LUEf and LUEp and consequently SIF760 and GPP vary at 390
leaf (ie SIF760 L and GPPL) and canopy levels (ie SIF760 C and GPPC) using the model of 391
van der Tol et al (2014) that is embedded in SCOPE For the leaf level Figure 6A shows a 392
decrease of LUEp with increasing APAR consistent with Eq (5) The relation between APAR 393
and LUEf appears more complex LUEf first increases with increasing APAR under low light 394
conditions reaches a climax at intermediate light and then decreases with increasing APAR 395
under higher APAR values (gt 50 mW m-2 sr-1 nm-1) (Figure 6B) The initial increase in LUEf 396
is caused by the decline in photochemical quenching of the excitons whereas the decrease of 397
LUEf is caused by the growing number of non-photochemical quenching traps that dissipate 398
light energy before it can be emitted as fluorescence light (van der Tol et al 2009a) It is 399
important to note that the range of LUEp is nearly an order of magnitude greater compared to 400
the range of LUEf (Figure 6C) Although LUEf is not constant we can still conclude that the 401
difference in both LUE terms causes an earlier saturation of leaf-level GPPL (Figure 6D) 402
17
compared to leaf-level SIF760 L (Figure 6E) with APAR leading to an asymptotic relationship 403
between SIF760 L and GPPL (Figure 6F) Our canopy level simulations confirm these trends 404
(Figure 7A-D) The in-field measured asymptotic relationships between SIF760 O and GPPEC 405
are consequently caused by the covariance of GPPEC and SIF760 O with APAR the 406
photosynthetic capacity with APAR and the different value ranges of LUEf and LUEp 407
Additionally our canopy level simulations suggest that structure impacts the SIF760 O - GPPEC 408
relationship Figure 7D shows an example that changing LAI leaf inclination angles or the 409
fraction of senescent plant material determine the curvature of the hyperbolic SIF760 C - GPPC 410
relationships 411
412
lt Figure 6 gt 413
lt Figure 7 gt 414
415
The modelled SIF760 LC - GPPLC curves (Figures 6D and 7D) also indicate that under 416
reduced light intensity GPP and SIF760 are almost linearly related while GPP tends to saturate 417
under higher light intensities Changes in APAR at canopy level are caused by either sun 418
elevation or in the case of a constant solar angle by canopy structure (ie shading fractional 419
vegetation cover) In complex structured canopies with many foliage layers the saturation of 420
GPP with APAR may not be observable because variations of APAR are less related to PAR 421
falling on the leaves but rather to the variation of leaf area exposed to light Model 422
simulations suggest that in complex canopies SIF760 saturates with APAR before GPP due to 423
fesc being lower with high APAR (data not shown) This structural effect reduces the curvature 424
of the hyperbolic leaf level GPPL- SIF760 L relationship at canopy level (compare Figures 6F 425
and 7F) Furthermore the effect of structure and APAR covary in time since canopy structure 426
(ie LAI) varies in concert with APAR during a seasonal cycle especially for crops We 427
18
expect that this covariance makes the relationship between GPP and SIF760 more linear at the 428
canopy level especially if observations are aggregated over time 429
To evaluate the structure related alleviation of the hyperbolic relationship between 430
SIF760 and GPP at canopy level in response to temporal aggregation we modelled an annual 431
course of GPPC and SIF760 C considering varying environmental conditions (Figure 8A-B) 432
ie PAR ranging from 0-500 mW m-2 sr-1 nm-1 air temperature ranging from 0-32degC using 433
data collected during 2009 at a Nitro-Europe flux tower site (Speulderbos The Netherlands) 434
and canopy properties ie LAI ranging from 15-30 m2 m-2 (Figure 8C) The LAI data are 435
synthetic but have a realistic seasonal cycle For daily noon values of modelled SIF760 C and 436
GPPC an asymptotic behaviour can be observed while GPPC tends to saturate compared to 437
SIF760 C The SIF760C-GPPC relationship tends to become linear when monthly or quarterly 438
averages are considered (Figure 8D) 439
440
lt Figure 8 gt 441
442
This visual trend can be confirmed by statistical measures for daily aggregated values 443
the hyperbolic model (rRMSE = 174 R2 = 070) performed slightly better than the linear 444
model (rRMSE = 185 r2 = 068) In case of monthly aggregated data both the hyperbolic 445
and linear models performed similarly while the linear model gave better results (RMSE = 446
90 r2 = 090) than the hyperbolic model (rRMSE = 94 R2 = 088) for quarterly aggregated 447
data 448
449
4 Discussion 450
Significant relationships between remotely measured SIF and ecosystem GPP have 451
been reported in the past (Frankenberg et al 2011 Guanter et al 2014) however sufficient 452
19
process understanding for using SIF as proxy for GPP across ecosystems is still limited 453
(Porcar-Castell et al 2014) Below we discuss how our observational and modeling 454
approaches help bridging the gap between mechanistic understanding at the leaf level and 455
ecosystem-specific observations and thus provide insights on mechanisms determining the 456
complex relationship between SIF and GPP 457
458
41 Insights from the observational approach 459
Our results showed ecosystem-specific asymptotic relationships between SIF760 O and 460
GPPEC for the three investigated ecosystems mixed temperate forest cropland and perennial 461
grassland The varying SIF-GPP relationships across ecosystems were consistent with results 462
recently reported from combined satellite observations and model predictions (Guanter et al 463
2012) Our results showed that the relationships of both tested vegetation indices PRI and 464
MCARI2 to GPPEC experienced a higher variability across ecosystems compared to SIF760 O 465
SIF760 O showed an ecosystem-specific and overall moderate to good relationship (R2 between 466
048 and 088) to GPPEC for the three ecosystems Both vegetation indices showed only strong 467
relationships for the grassland (R2 = 095 and 098) that notably changed in LAI during the 468
various observations It is important to note that we do not further elaborate on the underlying 469
mechanisms relating vegetation indices and GPPEC and that it is unclear if hyperbolic models 470
best describe their relationships to GPPEC based on mechanistic principles The intention of 471
evaluating the relationships between GPPEC and both vegetation indices was to provide a base 472
to judge the performance of SIF760 O in relation to these commonly used remote observations 473
The diversity of sampled conditions and used data sources provide further evidence on 474
the robustness of observed SIF760 O-GPPEC relationships Our measurements represent various 475
canopies characterized by different biomasses sampled over several years Although most 476
observations were acquired under similar light condition and physiological states a few 477
measurements represented lower light conditions and other physiological states This suggests 478
20
that observed relationships are rather robust across different representations of APAR LUEp 479
and LUEf Furthermore we use data from different sources ie four EC flux towers the 480
APEX imaging spectrometer and modeling at leaf and canopy levels to reduce the 481
uncertainties associated with each method of measurements and to get a better understanding 482
of the SIF760 O-GPPEC relationship at ecosystem level 483
Flux tower measurements are representative of a certain source area (footprint) from 484
the ecosystem which changes constantly based on wind direction and turbulent state of the 485
atmosphere Depending on the heterogeneity of the ecosystem GPPEC signals can vary in 486
response to changing footprints (Barcza et al 2009 Kljun et al 2004) although this variation 487
should be rather small if the vegetation is homogeneous Remote measurements of SIF760 are 488
likely representative of the upper layer of the ecosystem thus vertical canopy heterogeneity 489
potentially leads to a mismatch when compared to GPPEC which integrates over the different 490
layers of the ecosystems This is expected to be especially the case in structurally complex 491
ecosystems such as forests Although the upper layer in forest ecosystems substantially 492
contributes to the total rate of GPPEC there are still many layers of leaves or needles within 493
the canopy photosynthesizing at different rates depending on their sunshade exposure In 494
addition understory vegetation in forest ecosystems can significantly contribute to GPPEC at 495
different rates depending on the ecosystem and time of year Even homogeneous vegetation 496
canopies like crops or grasslands can show vertical heterogeneity This is especially the case 497
at peak biomass during ripening or senescence During such phenological stages the top layer 498
of cereal crops consists of less fluorescing components (ie ears) and cereal crops or 499
grasslands can contain a higher fraction of brown pigments resulting in low SIF760 O values 500
while the entire canopy can still produce high photosynthetic rates and thus GPPEC (Damm et 501
al 2010) Indeed most of the crops investigated in our study were in the ripening phase with a 502
pronounced ear layer 503
21
This resulted in relatively low SIF760 O values and in high GPPEC and thus in a more 504
pronounced asymptotic relationship (cf Figure 4A Figure 7F) compared to results reported 505
for other crops (Guanter et al 2013 Guanter et al 2014) Further research is needed to better 506
understand the impact of vertical heterogeneity on GPPEC and SIF760 observations and their 507
respective relationships 508
Despite the technical aspects causing variations in retrieved SIF760 O (refer to 509
Appendix-D for a detailed discussion) canopy structure causes inherent variations in 510
measured SIF760 values and thus impacts SIF760-GPP relationships The combination of 511
complex canopy architecture and the distribution of absorbing and scattering elements 512
determine vegetation canopies to act as photon traps (Knyazikhin et al 2013 Lewis and 513
Disney 2007) Parts of emitted SIF760 photons from inner-canopy leaves are re-absorbed 514
while others escape the canopy in direction of the sensor The probability of photons escaping 515
the canopy is a function of canopy structure which implies sensitivity to measured SIF760 516
intensities for canopy structure In Eq (2) this sensitivity was approximated with the term 517
fesc In our analysis we minimized the impact of fesc by observing always the same forest area 518
representative for the EC tower footprint In less complex structured crop and grass canopies 519
we expect fesc to be less important However future research is required to quantify the impact 520
of fesc and to propose strategies to compensate its influence on SIF760 retrievals 521
522
42 Insights from the modeling approach 523
From a theoretical point of view radiative energy loss competes with photochemistry 524
and non-radiative energy dissipation for absorbed photons Considering that GPP and SIF760 525
can be conceptualized according to Eqs (1) and (2) SIF760 must show under certain 526
environmental conditions a sensitivity to photochemistry (Porcar-Castell et al 2014 van der 527
Tol et al 2009a van der Tol et al 2009b) This relationship is confirmed by our observational 528
data and other studies at leaf (Amoros-Lopez et al 2008) and canopy levels (Damm et al 529
22
2010) Our modeling results however indicated that the relationship between LUEf and LUEp 530
is subject to change hence impacting the sensitivity of SIF760 to track changes in GPP 531
(Figures 6C and 7C) 532
The asymptotic relationship between SIF760 and GPP theoretically predicted and 533
observed at leaf and canopy levels can be related in particular to the different value ranges of 534
both efficiency terms (LUEp and LUEf) (Figures 6C and 7C) while a complex set of 535
mechanisms causes an ecosystem dependency for SIF760-GPP relationships The 536
photosynthetic capacity of the entire ecosystem in combination with its vertical heterogeneity 537
determines differences in GPP and SIF760 and thus the slope and curvature of their respective 538
relationships Furthermore the initial slope of the asymptotic SIF760 - GPP relationship which 539
has a value of LUEpmax(LUEfmiddotfesc) is determined by a combination of the photosynthetic 540
efficiency and canopy structure Canopy structure and related shadowing effects alter the 541
average light interception and quality at leaf level (Nobel et al 1993 Stewart et al 2003) and 542
consequently the overall productivity of the canopy In the case of reduced APAR caused by 543
canopy shadowing the overall apparent stress level in the canopy and consequently the rate 544
of certain photoprotective mechanisms such as non-radiative energy dissipation is reduced 545
(Cheng et al 2015 Demmig-Adams 1998 Niinemets et al 2003) and observed GPP and 546
SIF760 fall in a range where they are more linearly related (cf Figure 6F and 7F) In addition 547
canopy level simulations show that the fraction of senescent plant material impacts the 548
curvature of the hyperbolic relationship 549
Recent literature reports linear relationships between satellite-based SIF and modeled 550
GPP (Frankenberg et al 2011 Guanter et al 2012 Guanter et al 2014) while we found 551
asymptotic relationships Both results are not contradicting if one considers the temporal 552
aggregation applied to the data Our results are based on instantaneous measurements while 553
monthly averages were calculated for the satellite data to minimize noise effects (Frankenberg 554
et al 2011 Guanter et al 2014) It is known from previous research that temporal averaging 555
23
tends to linearize the response between GPP and APAR (Ruimy et al 1995) as saturating 556
light conditions tend to be only a small fraction of averaged diurnalmonthly data 557
Aggregating GPPEC and APAR over different time scales also showed this effect (data not 558
shown) Because of the rather linear relationship between SIF760 and APAR we expect that 559
temporal aggregation tends to linearize the SIF760-GPP relationship as well A recent study 560
presenting continuous measurements of GPP and SIF760 over a temperate deciduous forest 561
support this hypothesis (Yang et al 2015) The increasing number of experiments using 562
autonomous spectrometer systems in combination with flux towers (Balzarolo et al 2011) 563
will likely provide more experimental results that supports this finding Our simulations 564
provide further evidence that the covariance of structure and APAR during a seasonal cycle 565
additionally tends to linearize the relationship between GPP and SIF760 if observations are 566
aggregated over time 567
The dependency of SIF760-GPP relationships on temporal aggregation requires special 568
attention since it has implications on the usage of SIF to constrain GPP In principle 569
conclusions and results obtained from temporally aggregated and instantaneous measurements 570
are valid if consistently related to the underlying temporal aggregation level Generalizing 571
conclusions obtained at various aggregation levels bears the risk for mis-interpretations eg 572
when vegetation models are refined or empirically re-calibrated using observations or for 573
projections of GPP using observational SIF data 574
575
43 Requirements for the use of SIF to assess GPP across ecosystems 576
The changing relationship between SIF760 and GPPEC with vegetation type challenges 577
the usage of SIF760 as a robust constraint to estimate GPP Specific strategies are required to 578
account for ecosystem (or species) specific sensitivities of SIF in general and SIF760 in 579
particular This includes i) integration platforms to combine observations and process 580
24
understanding and ii) accurate observations of additional vegetation and environmental 581
variables 582
Process-based models as data integration platform in combination with comprehensive 583
observations to sufficiently measure important environmental factors and vegetation 584
properties are considered as flexible and powerful framework Parazoo et al (2014) for 585
example proposed the combination of ensemble dynamic global vegetation models (DGVMs) 586
in combination with SIF as observational constraint Lee et al (2015) suggest incorporating 587
SIF in a climate model to utilize SIF as observational constraint of photosynthesis simulations 588
and subsequent calculations of carbon water and energy cycle information Yet other studies 589
propose using SIF to obtain physiological vegetation parameters ie Vcmax for improved 590
parameterizations of photosynthesis models to eventually model GPP (Zhang et al 2014) The 591
European space agencys (ESA) Earth Explorer 8 opportunity mission Fluorescence Explorer 592
(FLEX) suggests a combination of comprehensive observations (ie SIF over the full 593
emission spectrum vegetation ecosystems and actual environmental conditions) and process-594
based models (Guanter et al 2012) 595
Additional information is required to use SIF in process-based models as one has to 596
account for varying photosynthetic efficiencies of plants and prevailing stress responses 597
According to the conceptualization of GPP and SIF as given in Eqs (1) and (2) extracting 598
and evaluating the exact relationship between LUEp and LUEf is essential but requires 599
normalizing APAR and calculating both yields (Damm et al 2010 Govindjee 2004 Louis et 600
al 2005) Retrievals of APAR can be considered challenging (Garbulsky et al 2010 Gitelson 601
and Gamon 2015 Hanan et al 2002) as available approaches often utilize a-priori knowledge 602
of prevailing land cover or plant distribution functions and rely on the inversion of physical-603
based models or simple band ratios (Hilker et al 2008) Research is required to provide high 604
quality information on APAR not perturbed by light absorption of non-photosynthetic active 605
25
canopy elements (stems branches twigs) cf Zhang et al (2013 2012) that demonstrate 606
attempts to improve estimates of APAR 607
Observed SIF760 O - GPPEC relationships are additionally confounded by non-radiative 608
energy dissipation The PRI was designed to monitor pigment changes related to the 609
xanthophyll cycle (Gamon et al 1992) and provides access to this superimposing process 610
However reported sensitivities of PRI for other effects ie structure (Barton and North 611
2001) pigment pool sizes (Gamon and Berry 2012) illumination effects (Damm et al 2015) 612
and the results obtained in this study question the applicability of the PRI at canopy level 613
Alternative approaches such as the development of a canopy PRI as suggested by several 614
groups (Hernandez-Clemente et al 2011 Kovac et al 2013 Wu et al 2010) or the usage of 615
pigment compositions and other functional plant traits might represent interesting strategies 616
and should be elaborated in future research 617
Structural sensitivities of canopy leaving SIF signals are critical and require further 618
research The application of spectrally invariant correction factors eg the directional area 619
scattering factor (Knyazikhin et al 2013) or more advanced physically-based retrieval 620
schemes using combined atmosphere-canopy models (Damm et al 2015 Laurent et al 2013) 621
might provide potential strategies to compensate for canopy structural effects on retrieved 622
SIF760 623
Another important source of information that allows improving the usage of SIF as 624
constraint of GPP is to consider SIF emissions over the entire emission spectrum between 625
approximately 600 and 800 nm Recent research successfully demonstrated the 626
complementary information content of red-fluorescence retrieved in the O2-B band at 688 nm 627
(SIF688) compared to SIF760 because of the different contributions from photosystem I and II 628
(Rossini et al 2015) Yet other studies highlighted the potential to improve predictions of 629
LUEp and GPP using both SIF688 and SIF760 (Cheng et al 2013) 630
631
26
5 Conclusions 632
Remote sensing of SIF provides a new observational approach to assess terrestrial 633
GPP Compared to traditional greenness-based remote sensing parameters we found SIF760 to 634
be more consistently related to GPPEC These results in combination with the more direct 635
mechanistic link between SIF760 and photosynthesis suggest that using SIF760 provides a 636
strategy to decrease uncertainty in estimating GPP across ecosystems 637
Our observational and modeling approaches revealed asymptotic and ecosystem-638
specific relationships for SIF760 and GPPEC We identified a set of interlinked mechanisms 639
determining SIF760-GPPEC relationships to be ecosystem specific ie the photosynthetic 640
capacity and efficiency of ecosystems the confounding impact of non-radiative energy 641
dissipation (NPQ) as well as ecosystem structure and the fraction of non-photosynthetic 642
vegetation components We demonstrated that SIF760-GPPEC relationships scale with temporal 643
aggregation due to a covariance of canopy structure and APAR over the seasonal cycle 644
We suggest going beyond empirical and ecosystem-specific relationships instead 645
using instantaneous observations comprehensively providing information on the full SIF 646
emission vegetation status and functioning as well as environmental conditions in 647
combination with process-based models Such approaches eg suggested for ESArsquos potential 648
ldquoFluorescence Explorerrdquo (FLEX) Earth Explorer mission provide a flexible framework to 649
account for the various influencing factors identified and to successfully apply SIF as 650
constraint of unbiased global GPP estimates 651
Furthermore research is required to improve the comparison between observations of 652
GPPEC and SIF Both observations stem from conceptually contrasting technologies ie 653
measurements of gas exchange vs plant-light interactions and provide independent and 654
complementary access to study ecosystem photosynthesis Despite the need to harmonize 655
horizontally differing footprints the vertical heterogeneity of ecosystems including the 656
27
varying contributions from different ecosystem layers must be better understood to harmonize 657
and successfully integrate both measurements 658
659
Acknowledgements 660
This work was supported by a grant of the Swiss University Conference and ETH-661
Board in frame of the Swiss Earth Observatory Network (SEON) project and by a grant of the 662
European Space Agency (ESA) in frame of the FLEX-PARCS E Paul-Limoges was 663
supported in part by the Natural Sciences and Engineering Research Council of Canada 664
through a postgraduate scholarship We would like to thank the APEX team for acquiring the 665
APEX data Authors sequence is listed following the FLAE approach (doi 666
101371journalpbio0050018) 667
28
References 668
Ammann C Flechard CR Leifeld J Neftel A amp Fuhrer J (2007) The carbon budget of 669
newly established temperate grassland depends on management intensity Agriculture 670
Ecosystems amp Environment 121 5-20 671
Amoros-Lopez J Gomez-Chova L Vila-Frances J Alonso L Calpe J Moreno J amp 672
del Valle-Tascon S (2008) Evaluation of remote sensing of vegetation fluorescence by 673
the analysis of diurnal cycles International Journal of Remote Sensing 29 5423-5436 674
Baker NR (2008) Chlorophyll Fluorescence A probe of photosynthesis in vivo Annual 675
Review of Plant Physiology and Plant Molecular Biology 59 89-113 676
Baldocchi D Falge E Gu LH Olson R Hollinger D Running S Anthoni P 677
Bernhofer C Davis K Evans R Fuentes J Goldstein A Katul G Law B Lee 678
XH Malhi Y Meyers T Munger W Oechel W U KTP Pilegaard K Schmid 679
HP Valentini R Verma S Vesala T Wilson K amp Wofsy S (2001) FLUXNET A 680
new tool to study the temporal and spatial variability of ecosystem-scale carbon dioxide 681
water vapor and energy flux densities Bulletin of the American Meteorological Society 682
82 2415-2434 683
Baldocchi DD (2003) Assessing the eddy covariance technique for evaluating carbon 684
dioxide exchange rates of ecosystems past present and future Global Change Biology 9 685
479-492 686
Balzarolo M Anderson K Nichol C Rossini M Vescovo L Arriga N Wohlfahrt G 687
Calvet J-C Carrara A Cerasoli S Cogliati S Daumard F Eklundh L Elbers JA 688
Evrendilek F Handcock RN Kaduk J Klumpp K Longdoz B Matteucci G 689
Meroni M Montagnani L Ourcival J-M Sanchez-Canete EP Pontailler J-Y 690
Juszczak R Scholes B amp Pilar Martin M (2011) Ground-Based Optical Measurements 691
at European Flux Sites A Review of Methods Instruments and Current Controversies 692
Sensors 11 7954-7981 693
Barcza Z Kern A Haszpra L amp Kljun N (2009) Spatial representativeness of tall tower 694
eddy covariance measurements using remote sensing and footprint analysis Agricultural 695
and Forest Meteorology 149 795-807 696
Barton CVM amp North PRJ (2001) Remote sensing of canopy light use efficiency using 697
the photochemical reflectance index - Model and sensitivity analysis Remote Sensing of 698
Environment 78 264-273 699
Beer C Reichstein M Tomelleri E Ciais P Jung M Carvalhais N Roedenbeck C 700
Arain MA Baldocchi D Bonan GB Bondeau A Cescatti A Lasslop G Lindroth 701
29
A Lomas M Luyssaert S Margolis H Oleson KW Roupsard O Veenendaal E 702
Viovy N Williams C Woodward FI amp Papale D (2010) Terrestrial Gross Carbon 703
Dioxide Uptake Global Distribution and Covariation with Climate Science 329 834-838 704
Berk A Anderson GP Acharya PK Bernstein LS Muratov L Lee J Fox M 705
Adler-Golden SM Chetwynd JH Hoke ML Lockwood RB Gardner JA Cooley 706
TW Borel CC amp Lewis PE (2005) MODTRAN5 A reformulated atmospheric band 707
model with auxiliary species and practical multiple scattering options Proceedings of the 708
Society of Photo-Optical Instrumentation Engineer 5655 662-667 709
Cheng SJ Bohrer G Steiner AL Hollinger DY Suyker A Phillips RP amp 710
Nadelhoffer KJ (2015) Variations in the influence of diffuse light on gross primary 711
productivity in temperate ecosystems Agricultural and Forest Meteorology 201 98-110 712
Cheng Y-B Middleton EM Zhang Q Huemmrich KF Campbell PKE Corp LA 713
Cook BD Kustas WP amp Daughtry CS (2013) Integrating Solar Induced 714
Fluorescence and the Photochemical Reflectance Index for Estimating Gross Primary 715
Production in a Cornfield Remote Sensing 5 6857-6879 716
Collatz GJ Ball JT Grivet C amp Berry JA (1991) Physiological and environmental-717
regulation of stomatal conductance photosynthesis and transpiration - a model that 718
includes a laminar boundary-layer Agricultural and Forest Meteorology 54 107-136 719
DOdorico P Alberti E amp Schaepman ME (2010) In-flight spectral performance 720
monitoring of the Airborne Prism Experiment Applied Optics 49 3082-3091 721
DOdorico P Guanter L Schaepman ME amp Schlaumlpfer D (2011) Performance 722
assessment of onboard and scene-based methods for Airborne Prism Experiment spectral 723
characterization Applied Optics 50 4755-4764 724
Damm A Erler A Gioli B Hamdi K Hutjes R Kosvancova M Meroni M 725
Miglietta F Moersch A Moreno J Schickling A Sonnenschein R Udelhoven T 726
Van der Linden S Hostert P amp Rascher U (2010) Remote sensing of sun induced 727
fluorescence yield to improve modelling of diurnal courses of Gross Primary Production 728
(GPP) Global Change Biology 16 171-186 729
Damm A Erler A Hillen W Meroni M Schaepman ME Verhoef W amp Rascher U 730
(2011) Modeling the impact of spectral sensor configurations on the FLD retrieval 731
accuracy of sun-induced chlorophyll fluorescence Remote Sensing of Environment 115 732
1882-1892 733
Damm A Guanter L Laurent VCE Schaepman ME Schickling A amp Rascher U 734
(2014) FLD-based retrieval of sun-induced chlorophyll fluorescence from medium 735
30
spectral resolution airborne spectroscopy data Remote Sensing of Environment 147 256-736
266 737
Damm A Guanter L Verhoef W Schlaumlpfer D Garbari S amp Schaepman ME (2015) 738
Impact of varying irradiance on vegetation indices and chlorophyll fluorescence derived 739
from spectroscopy data Remote Sensing of Environment 156 202-215 740
Demmig-Adams B (1998) Survey of thermal energy dissipation and pigment composition in 741
sun and shade leaves Plant and Cell Physiology 39 474-482 742
Drolet GG Middleton EM Huemmrich KF Hall FG Amiro BD Barr AG Black 743
TA McCaughey JH amp Margolis HA (2008) Regional mapping of gross light-use 744
efficiency using MODIS spectral indices Remote Sensing of Environment 112 3064-3078 745
Eugster W amp Senn W (1995) A cospectral correction model for measurement of turbulent 746
NO2 fluxes Boundary-Layer Meteorology 74 321-340 747
Eugster W Zeyer K Zeeman M Michna P Zingg A Buchmann N amp Emmenegger 748
L (2007) Methodical study of nitrous oxide eddy covariance measurements using 749
quantum cascade laser spectrometery over a Swiss forest Biogeosciences 4 927-939 750
Falge E Baldocchi D Olson R Anthoni P Aubinet M Bernhofer C Burba G 751
Ceulemans R Clement R Dolman H Granier A Gross P Grunwald T Hollinger 752
D Jensen NO Katul G Keronen P Kowalski A Lai CT Law BE Meyers T 753
Moncrieff H Moors E Munger JW Pilegaard K Rannik U Rebmann C Suyker 754
A Tenhunen J Tu K Verma S Vesala T Wilson K amp Wofsy S (2001) Gap 755
filling strategies for defensible annual sums of net ecosystem exchange Agricultural and 756
Forest Meteorology 107 43-69 757
Falloon P amp Betts R (2010) Climate impacts on European agriculture and water 758
management in the context of adaptation and mitigation-The importance of an integrated 759
approach Science of the Total Environment 408 5667-5687 760
Foken T amp Wichura B (1996) Tools for quality assessment of surface-based flux 761
measurements Agricultural and Forest Meteorology 78 83-105 762
Fournier A Daumard F Champagne S Ounis A Goulas Y amp Moya I (2012) Effect 763
of canopy structure on sun-induced chlorophyll fluorescence Isprs Journal of 764
Photogrammetry and Remote Sensing 68 112-120 765
Frankenberg C Fisher JB Worden J Badgley G Saatchi SS Lee JE Toon GC 766
Butz A Jung M Kuze A amp Yokota T (2011) New global observations of the 767
terrestrial carbon cycle from GOSAT Patterns of plant fluorescence with gross primary 768
productivity Geophysical Research Letters 38 769
31
Gamon JA amp Berry JA (2012) Facultative and constitutive pigment effects on the 770
Photochemical Reflectance Index (PRI) in sun and shade conifer needles Israel Journal of 771
Plant Sciences 60 85-95 772
Gamon JA Coburn C Flanagan LB Huemmrich KF Kiddle C Sanchez-Azofeifa 773
GA Thayer DR Vescovo L Gianelle D Sims DA Rahman AF amp Pastorello 774
GZ (2010) SpecNet revisited bridging flux and remote sensing communities Canadian 775
Journal of Remote Sensing 36 S376-S390 776
Gamon JA Penuelas J amp Field CB (1992) A narrow-waveband spectral index that 777
tracks diurnal changes in photosynthetic efficiency Remote Sensing of Environment 41 778
35-44 779
Garbulsky MF Filella I Verger A amp Penuelas J (2014) Photosynthetic light use 780
efficiency from satellite sensors From global to Mediterranean vegetation Environmental 781
and Experimental Botany 103 3-11 782
Garbulsky MF Penuelas J Papale D Ardo J Goulden ML Kiely G Richardson 783
AD Rotenberg E Veenendaal EM amp Filella I (2010) Patterns and controls of the 784
variability of radiation use efficiency and primary productivity across terrestrial 785
ecosystems Global Ecology and Biogeography 19 253-267 786
Gege P Fries J Haschberger P Schoumltz P Schwarzer H Strobl P Suhr B Ulbrich 787
G amp Vreeling WJ (2009) Calibration facility for airborne imaging spectrometers 788
ISPRS Journal of Photogrammetry amp Remote Sensing 64 387ndash397 789
Gitelson AA amp Gamon JA (2015) The need for a common basis for defining light-use 790
efficiency Implications for productivity estimation Remote Sensing of Environment 156 791
196-201 792
Goetz SJ amp Prince SD (1999) Modelling terrestrial carbon exchange and storage 793
Evidence and implications of functional convergence in light-use efficiency Advances in 794
Ecological Research Vol 28 (pp 57-92) 795
Govindjee (2004) Chlorophyll a fluorescence A bit of basics and history In GC 796
Papageorgiou amp Govindjee (Eds) Chlorophyll a Fluorescence A Signature of 797
Photosynthesis Advances in Photosynthesis and Respiration (pp 1-42) Dordrecht 798
Springer 799
Guanter L Alonso L Gomez-Chova L Amoros-Lopez J Vila J amp Moreno J (2007) 800
Estimation of solar-induced vegetation fluorescence from space measurements 801
Geophysical Research Letters 34 doi 1010292007GL029289 802
32
Guanter L Alonso L Gomez-Chova L Meroni M Preusker R Fischer J amp Moreno 803
J (2010) Developments for vegetation fluorescence retrieval from spaceborne high-804
resolution spectrometry in the O2-A and O2-B absorption bands Journal of Geophysical 805
Research-Atmospheres 115 806
Guanter L Frankenberg C Dudhia A Lewis PE Goacutemez-Dans J Kuze A Suto H amp 807
Grainger R (2012) Retrieval and global assessment of terrestrial chlorophyll fluorescence 808
from GOSAT space measurements Remote Sensing of Environment 121 236-251 809
Guanter L Rossini M Colombo R Meroni M Frankenberg C Lee J-E amp Joiner J 810
(2013) Using field spectroscopy to assess the potential of statistical approaches for the 811
retrieval of sun-induced chlorophyll fluorescence from ground and space Remote Sensing 812
of Environment 133 52-61 813
Guanter L Zhang Y Jung M Joiner J Voigt M Berry JA Frankenberg C Huete 814
AR Zarco-Tejada P Lee J-E Moran MS Ponce-Campos G Beer C Camps-815
Valls G Buchmann N Gianelle D Klumpp K Cescatti A Baker JM amp Griffis 816
TJ (2014) Global and time-resolved monitoring of crop photosynthesis with chlorophyll 817
fluorescence Proceedings of the National Academy of Sciences of the United States of 818
America 111 E1327-E1333 819
Haboudane D Miller JR Pattey E Zarco-Tejada PJ amp Strachan IB (2004) 820
Hyperspectral vegetation indices and novel algorithms for predicting green LAI of crop 821
canopies Modeling and validation in the context of precision agriculture Remote Sensing 822
of Environment 90 337-352 823
Hanan NP Burba G Verma SB Berry JA Suyker A amp Walter-Shea EA (2002) 824
Inversion of net ecosystem CO2 flux measurements for estimation of canopy PAR 825
absorption Global Change Biology 8 563-574 826
Hernandez-Clemente R Navarro-Cerrillo RM Suarez L Morales F amp Zarco-Tejada 827
PJ (2011) Assessing structural effects on PRI for stress detection in conifer forests 828
Remote Sensing of Environment 115 2360-2375 829
Hilker T Coops NC Wulder MA Black TA amp Guy RD (2008) The use of remote 830
sensing in light use efficiency based models of gross primary production A review of 831
current status and future requirements Science of the Total Environment 404 411-423 832
Hilker T Gitelson A Coops NC Hall FG amp Black TA (2011) Tracking plant 833
physiological properties from multi-angular tower-based remote sensing Oecologia 165 834
865-876 835
33
Hilker T Lyapustin A Hall FG Wang Y Coops NC Drolet G amp Black TA 836
(2009) An assessment of photosynthetic light use efficiency from space Modeling the 837
atmospheric and directional impacts on PRI reflectance Remote Sensing of Environment 838
113 2463-2475 839
Hueni A Biesemans J Meuleman K DellEndice F Schlaumlpfer D Adriaensen S 840
Kempenaers S Odermatt D Kneubuehler M Nieke J amp Itten K (2009) Structure 841
Components and Interfaces of the Airborne Prism Experiment (APEX) Processing and 842
Archiving Facility IEEE Transactions on Geoscience and Remote Sensing 47 29-43 843
Hueni A Lenhard K Baumgartner A amp Schaepman M (2013) The APEX (Airborne 844
Prism Experiment - Imaging Spectrometer) Calibration Information System IEEE 845
Transactions on Geoscience and Remote Sensing 51 5169-5180 846
Hueni A Schlaepfer D Jehle M amp Schaepman M (2015) Impacts of Dichroic Prism 847
Coatings on Radiometry of the Airborne Imaging Spectrometer APEX Applied Optics 53 848
5344-5352 849
Imhoff ML Bounoua L Ricketts T Loucks C Harriss R amp Lawrence WT (2004) 850
Global patterns in human consumption of net primary production Nature 429 870-873 851
IPCC (2013) Summary for policymakers Climate change 2013 the physical science basis 852
Cambridge University Press Cambridge United Kingdom and New York NY USA 853
Jacquemoud S amp Baret F (1990) PROSPECT A model of leaf optical properties spectra 854
Remote Sensing of Environment 34 75-91 855
Jehle M Hueni A Damm A DOdorico P Kneubuumlhler M Meuleman K Schlapfer 856
D Schaepman ME amp Weyermann J (2010) APEX - current status performance and 857
validation concept IEEE Sensors 2010 Conference 533-537 858
Joiner J Guanter L Lindstrot R Voigt M Vasilkov AP Middleton EM Huemmrich 859
KF Yoshida Y amp Frankenberg C (2013) Global monitoring of terrestrial chlorophyll 860
fluorescence from moderate spectral resolution near-infrared satellite measurements 861
methodology simulations and application to GOME-2 Atmos Meas Tech Discuss 6 862
3883-3930 863
Jung M Reichstein M Margolis HA Cescatti A Richardson AD Arain MA 864
Arneth A Bernhofer C Bonal D Chen J Gianelle D Gobron N Kiely G Kutsch 865
W Lasslop G Law BE Lindroth A Merbold L Montagnani L Moors EJ 866
Papale D Sottocornola M Vaccari F amp Williams C (2011) Global patterns of land-867
atmosphere fluxes of carbon dioxide latent heat and sensible heat derived from eddy 868
34
covariance satellite and meteorological observations Journal of Geophysical Research-869
Biogeosciences 116 870
Kljun N Kastner-Klein P Fedorovich E amp Rotach MW (2004) Evaluation of 871
Lagrangian footprint model using data from wind tunnel convective boundary layer 872
Agricultural and Forest Meteorology 127 189-201 873
Kljun N Rotach MW amp Schmid HP (2002) A three-dimensional backward lagrangian 874
footprint model for a wide range of boundary-layer stratifications Boundary-Layer 875
Meteorology 103 205-226 876
Knyazikhin Y Schull MA Stenberg P Mottus M Rautiainen M Yang Y Marshak 877
A Latorre Carmona P Kaufmann RK Lewis P Disney MI Vanderbilt V Davis 878
AB Baret F Jacquemoud S Lyapustin A amp Myneni RB (2013) Hyperspectral 879
remote sensing of foliar nitrogen content Proceedings of the National Academy of 880
Sciences of the United States of America 110 E185-E192 881
Kovac D Malenovsky Z Urban O Spunda V Kalina J Ac A Kaplan V amp Hanus 882
J (2013) Response of green reflectance continuum removal index to the xanthophyll de-883
epoxidation cycle in Norway spruce needles Journal of Experimental Botany 64 1817-884
1827 885
Krausmann F Erb K-H Gingrich S Haberl H Bondeau A Gaube V Lauk C 886
Plutzar C amp Searchinger TD (2013) Global human appropriation of net primary 887
production doubled in the 20th century Proceedings of the National Academy of Sciences 888
of the United States of America 110 10324-10329 889
Lasslop G Reichstein M Papale D Richardson AD Arneth A Barr A Stoy P amp 890
Wohlfahrt G (2010) Separation of net ecosystem exchange into assimilation and 891
respiration using a light response curve approach critical issues and global evaluation 892
Global Change Biology 16 187-208 893
Laurent VCE Verhoef W Damm A Schaepman ME amp Clevers JGPW (2013) A 894
Bayesian object-based approach for estimating vegetation biophysical variables from at-895
sensor APEX radiance data Remote Sensing of Environment 139 6-17 896
Lee JE Berry JA Van der Tol C Yang X Guanter L Damm A Baker I amp 897
Frankenberg C (2015) Simulations of chlorophyll fluorescence in corporated into the 898
Community Land Model version 4 Global Change Biology in print 899
Lewis P amp Disney M (2007) Spectral invariants and scattering across multiple scales from 900
within-leaf to canopy Remote Sensing of Environment 109 196-206 901
35
Liu LY amp Cheng ZH (2010) Detection of Vegetation Light-Use Efficiency Based on 902
Solar-Induced Chlorophyll Fluorescence Separated From Canopy Radiance Spectrum Ieee 903
Journal of Selected Topics in Applied Earth Observations and Remote Sensing 3 306-312 904
Louis J Ounis A Ducruet JM Evain S Laurila T Thum T Aurela M Wingsle G 905
Alonso L Pedros R amp Moya I (2005) Remote sensing of sunlight-induced chlorophyll 906
fluorescence and reflectance of Scots pine in the boreal forest during spring recovery 907
Remote Sensing of Environment 96 37-48 908
Maier SW Guumlnther KP amp Stellmes M (2003) Sun-Induced Fluorescence A New Tool 909
for Precision Farming In M McDonald J Schepers L Tartly T van Toai amp D Major 910
(Eds) Digital Imaging and Spectral Techniques Applications to Precision Agriculture 911
and Crop Physiology (pp 209-222) ASA Special Publication 912
Mauder M Foken T Clement R Elbers JA Eugster W Gruenwald T Heusinkveld 913
B amp Kolle O (2008) Quality control of CarboEurope flux data - Part 2 Inter-914
comparison of eddy-covariance software Biogeosciences 5 451-462 915
Meroni M Busetto L Guanter L Cogliati S Crosta GF Migliavacca M Panigada 916
C Rossini M amp Colombo R (2010) Characterization of fine resolution field 917
spectrometers using solar Fraunhofer lines and atmospheric absorption features Applied 918
Optics 49 2858-2871 919
Meroni M Picchi V Rossini M Cogliati S Panigada C Nali C Lorenzini G amp 920
Colombo R (2008) Leaf level early assessment of ozone injuries by passive fluorescence 921
and photochemical reflectance index International Journal of Remote Sensing 29 5409-922
5422 923
Meroni M Rossini M Guanter L Alonso L Rascher U Colombo R amp Moreno J 924
(2009) Remote sensing of solar induced chlorophyll fluorescence review of methods and 925
applications Remote Sensing of Environment doi101016jrse200905003 926
Michaelis L amp Menten ML (1913) The kenetics of the inversion effect Biochemische 927
Zeitschrift 49 333-369 928
Middleton E McMurtney JE Campbell PK Corp LA Butcher LM amp Chappelle 929
EW (2002) Optical and fluorescence properties of corn leaves from different nitrogen 930
regimes In M Owe G Durso amp L Toulios (Eds) Conference on Remote Sensing for 931
Agriculture Ecosystems and Hydrology IV (pp 72-83) Agia Pelagia Greece 932
Miller JR Berger M Goulas Y Jacquemoud S Louis J Moise N Mohammed G 933
Moreno J Moya I Pedroacutes R Verhoef W amp Zarco-Tejada PJ (2005) Development 934
36
of a vegetation fluorescence canopy model Final Report May 2005 In European Space 935
Research and Technology Centre (ESTEC) 936
Monteith JL (1972) Solar-radiation and productivity in tropical ecosystems Journal of 937
Applied Ecology 9 747-766 938
Niinemets U Kollist H Garcia-Plazaola JI Hernandez A amp Becerril JM (2003) Do 939
the capacity and kinetics for modification of xanthophyll cycle pool size depend on growth 940
irradiance in temperate trees Plant Cell and Environment 26 1787-1801 941
Nobel PS Forseth IN amp Long SP (1993) Canopy structure and light interception 942
Ozanne CMP Anhuf D Boulter SL Keller M Kitching RL Korner C Meinzer 943
FC Mitchell AW Nakashizuka T Dias PLS Stork NE Wright SJ amp 944
Yoshimura M (2003) Biodiversity meets the atmosphere A global view of forest 945
canopies Science 301 183-186 946
Parazoo NC Bowman K Fisher JB Frankenberg C Jones DBA Cescatti A Peacuterez-947
Priego Oacute Wohlfahrt G amp Montagnani L (2014) Terrestrial gross primary production 948
inferred from satellite fluorescence and vegetation models Global Change Biology na-na 949
Plascyk JA (1975) MK II Fraunhofer Line Dicsriminator (FLD-II) for airborne and orbital 950
remote-sensing of solar-stimulated luminescence Optical Engineering 14 339-346 951
Porcar-Castell A Tyystjaumlrvi E Atherton J Van der Tol C Flexas J EE P Moreno 952
J Frankenberg C amp Berry JA (2014) Linking chlorophyll a fluorescence to 953
photosynthesis for remote sensing applications mechanisms and challenges Journal of 954
Experimental Botany 65 4065-4095 955
Rascher U Agati G Alonso L Cecci G Champagne S Colombo R Damm A 956
Daumard F De Miguel E Fernandez G Franch B Franke J Gerbig C Gioli B 957
Gomez JA Goulas Y Guanter L Gutierrez-De-La-Camara O Hamdi K Hostert 958
P Jimenez M Kosvancova M Lognoli D Meroni M Miglietta F Moersch A 959
Moreno J Moya I Neininger B Okujeni A Ounis A Palombi L Raimondi V 960
Schickling A Sobrino JA Stellmes M Toci G Toscano P Udelhoven T Van der 961
Linden S amp Zaldei A (2009) CEFLES2 The remote sensing component to quantify 962
photosynthetic efficiency from the leaf to the region by measuring sun-induced 963
fluorescence in the oxygen absorption bands Biogeosciences 6 1181-1198 964
Richter R amp Schlaumlpfer D (2002) Geo-atmospheric processing of airborne imaging 965
spectrometry data Part 2 Atmospherictopographic correction International Journal of 966
Remote Sensing 23 2631-2649 967
37
Rossini M Meroni M Migliavacca M Manca G Cogliati S Busetto L Picchi V 968
Cescatti A Seufert G amp Colombo R (2010) High resolution field spectroscopy 969
measurements for estimating gross ecosystem production in a rice field Agricultural and 970
Forest Meteorology 150 1283-1296 971
Rossini M Nedbal L Guanter L Ač A Alonso L Burkart A Cogliati S Colombo 972
R Damm A Drusch M Hanus J Julitta T Kokkalis P Moreno J Panigada C 973
Pinto F Schickling A Schuumlttemeyer D Zemek F amp Rascher U (2015) Red and far-974
red sun-induced chlorophyll fluorescence as a measure of plant photosynthesis 975
Geophysical Research Letters (accepted for publication) 976
Ruimy A Jarvis PG Baldocchi DD amp B S (1995) CO2 Fluxes over Plant Canopies 977
and Solar Radiation A Review Advances in Ecological Research 26 1-68 978
Running SW Nemani RR Heinsch FA Zhao MS Reeves M amp Hashimoto H 979
(2004) A continuous satellite-derived measure of global terrestrial primary production 980
Bioscience 54 547-560 981
Schaepman ME M J Hueni A DrsquoOdorico P Damm A Weyermann J Schneider F 982
Laurent VCE C P Seidel F Lenhard K Gege P Kuechler C Brazile J Kohler 983
P De Vos L Meuleman K Meynart R Schlaepfer D Kneubuumlhler M amp Itten K 984
(2015) Advanced radiometry measurements and Earth science applications with the 985
Airborne Prism Experiment (APEX) Remote Sensing of Environment 158 207-219 986
Schimel D Pavlick R Fisher JB Asner GP Saatchi S Townsend P Miller C 987
Frankenberg C Hibbard K amp Cox P (2014) Observing terrestrial ecosystems and the 988
carbon cycle from space Global Change Biology na-na 989
Schlaumlpfer D amp Richter R (2002) Geo-atmospheric processing of airborne imaging 990
spectrometry data Part 1 Parametric orthorectification International Journal of Remote 991
Sensing 23 2609-2630 992
Schneider FD Leiterer R Morsdorf F Gastellu-Etchegorry J-P Lauret N Pfeifer N 993
amp Schaepman ME (2014) Simulating imaging spectrometer data 3D forest modeling 994
based on LiDAR and in situ data Remote Sensing of Environment 152 235-250 995
Schroter D Cramer W Leemans R Prentice IC Araujo MB Arnell NW Bondeau 996
A Bugmann H Carter TR Gracia CA de la Vega-Leinert AC Erhard M Ewert 997
F Glendining M House JI Kankaanpaa S Klein RJT Lavorel S Lindner M 998
Metzger MJ Meyer J Mitchell TD Reginster I Rounsevell M Sabate S Sitch 999
S Smith B Smith J Smith P Sykes MT Thonicke K Thuiller W Tuck G 1000
38
Zaehle S amp Zierl B (2005) Ecosystem service supply and vulnerability to global change 1001
in Europe Science 310 1333-1337 1002
Sitch S Smith B Prentice IC Arneth A Bondeau A Cramer W Kaplan JO Levis 1003
S Lucht W Sykes MT Thonicke K amp Venevsky S (2003) Evaluation of ecosystem 1004
dynamics plant geography and terrestrial carbon cycling in the LPJ dynamic global 1005
vegetation model Global Change Biology 9 161-185 1006
Stewart DW Costa C Dwyer LM Smith DL Hamilton RI amp Ma BL (2003) 1007
Canopy structure light interception and photosynthesis in maize Agronomy Journal 95 1008
1465-1474 1009
Trnka M Dubrovsky M amp Zalud Z (2004) Climate change impacts and adaptation 1010
strategies in spring barley production in the Czech Republic Climatic Change 64 227-1011
255 1012
Turner DP Ritts WD Cohen WB Maeirsperger TK Gower ST Kirschbaum AA 1013
Running SW Zhao MS Wofsy SC Dunn AL Law BE Campbell JL Oechel 1014
WC Kwon HJ Meyers TP Small EE Kurc SA amp Gamon JA (2005) Site-level 1015
evaluation of satellite-based global terrestrial gross primary production and net primary 1016
production monitoring Global Change Biology 11 666-684 1017
van der Tol C Berry J Campbell PKE amp Rascher U (2014) Models of fluorescence 1018
and photosynthesis for interpreting measurements of solar-induced chlorophyll 1019
fluorescence Journal of Geophysical Research Biogeosciences IN PRESS 1020
van der Tol C Verhoef W amp Rosema A (2009a) A model for chlorophyll fluorescence 1021
and photosynthesis at leaf scale Agricultural and Forest Meteorology 149 96-105 1022
van der Tol C Verhoef W Timmermans A Verhoef A amp Su Z (2009b) An integrated 1023
model of soil-canopy spectral radiances photosynthesis fluorescence temperature and 1024
energy balance Biogeosciences 6 3109-3129 1025
Verhoef W (1984) Light scattering by leaf layers with application to canopy reflectance 1026
modeling The SAIL model Remote Sensing of Environment 16 125-141 1027
Verhoef W amp Bach H (2003a) Remote sensing data assimilation using coupled radiative 1028
transfer models Physics and Chemistry of the Earth 28 3-13 1029
Verhoef W amp Bach H (2003b) Simulation of hyperspectral and directional radiance 1030
images using coupled biophysical and atmospheric radiative transfer models Remote 1031
Sensing of Environment 87 23-41 1032
39
Verhoef W amp Bach H (2007) Coupled soil-leaf-canopy and atmosphere radiative transfer 1033
modeling to simulate hyperspectral multi-angular surface reflectance and TOA radiance 1034
data Remote Sensing of Environment 109 166-182 1035
Verhoef W Jia L Xiao Q amp Su Z (2007) Unified optical-thermal four-stream radiative 1036
transfer theory for homogeneous vegetation canopies Ieee Transactions on Geoscience 1037
and Remote Sensing 45 1808-1822 1038
Webb EK Pearman GI amp Leuning R (1980) Correction of flux measurements for 1039
density effects due to heat and water-vapour transfer Quarterly Journal of the Royal 1040
Meteorological Society 106 85-100 1041
Wu C Niu Z Tang Q amp Huang W (2010) Revised photochemical reflectance index 1042
(PRI) for predicting light use efficiency of wheat in a growth cycle validation and 1043
comparison International Journal of Remote Sensing 31 2911-2924 1044
Yang X Tang J Mustard JF Lee JE Rossini M Joiner J Munger JW Kornfeld 1045
A amp Richardson AD (2015) Solar-induced chlorophyll fluorescence that correlates with 1046
canopy photosynthesis on diurnal and seasonal scales in a temperate deciduous forest 1047
Geophysical Research Letters 1048
Zarco-Tejada PJ Berni JAJ Suarez L Sepulcre-Canto G Morales F amp Miller JR 1049
(2009) Imaging chlorophyll fluorescence with an airborne narrow-band multispectral 1050
camera for vegetation stress detection Remote Sensing of Environment 113 1262-1275 1051
Zarco-Tejada PJ Gonzalez-Dugo V amp Berni JAJ (2012) Fluorescence temperature and 1052
narrow-band indices acquired from a UAV platform for water stress detection using a 1053
micro-hyperspectral imager and a thermal camera Remote Sensing of Environment 117 1054
322-337 1055
Zarco-Tejada PJ Morales A Testi L amp Villalobos FJ (2013) Spatio-temporal patterns 1056
of chlorophyll fluorescence and physiological and structural indices acquired from 1057
hyperspectral imagery as compared with carbon fluxes measured with eddy covariance 1058
Remote Sensing of Environment 133 102-115 1059
Zhang Q Middleton EM Cheng YB amp Landis DR (2013) Variations of foliage 1060
chlorophyll fAPAR and foliage non-chlorophyll fAPAR (fAPARchl fAPARnonchl) at the 1061
Harvard Forest Ieee Journal of Selected Topics in Applied Earth Observations and Remote 1062
Sensing 6 2254-2264 1063
Zhang Q Middleton EM Gao BC amp Cheng YB (2012) Using EO-1 hyperion to 1064
simulate HyspIRI products for a coniferous forest The fraction of par absorbed by 1065
40
chlorophyll (fAPAR chl) and leaf water content (LWC) Ieee Transactions on Geoscience 1066
and Remote Sensing 50 1844-1852 1067
Zhang Y Guanter L Berry JA Joiner J van der Tol C Huete A Gitelson A Voigt 1068
M amp Koumlhler P (2014) Estimation of vegetation photosynthetic capacity from space-1069
based measurements of chlorophyll fluorescence for terrestrial biosphere models Global 1070
Change Biology 20 3727-3742 1071
1072
41
Appendix-A APEX data calibration 1073
The calibration of APEX images is based on the APEX Processing and Archiving Facility 1074
(PAF) which is the combined software and hardware designed to generate calibrated level 1 1075
at-sensor radiances from APEX raw image streams (Hueni et al 2009) Calibration 1076
coefficients for the radiometric geometric and spectral calibrations are generated from system 1077
calibrations at the APEX Calibration Home Base (CHB) at DLR Oberpfaffenhofen (Gege et 1078
al 2009) These CHB data are stored and processed within the APEX Calibration Information 1079
System (CAL IS) producing the so-called calibration cubes holding coefficients for each 1080
spatio-spectral pixel (Hueni et al 2013) 1081
For the multi-temporal dataset employed within this study all flight lines were 1082
reprocessed from the original raw image streams to ensure that the same version of the 1083
processor was applied The APEX PAF and CAL IS have significantly evolved over the 1084
timeframe of the dataset with calibrations getting more accurate over the years To ensure 1085
consistency all data were calibrated using coefficients obtained in May 2013 1086
The processor was specifically configured to retain the highest information content in 1087
the VNIR channel including i) no spectral resampling to compensate for spectral shifts and 1088
misregistrations (DOdorico et al 2010 DOdorico et al 2011) ii) no compensation of 1089
spectral shift related changes in radiometry (Hueni et al 2015) and iii) no spatial 1090
misregistration correction The calibration was thus effectively reduced to a linear dark 1091
current correction over time a de-smearing of the visible-NIR channel to compensate for 1092
sensor smear effects the application of radiometric gains and offsets followed by a destriping 1093
routine working in the spatial dimension only to remove pushbroom related along track 1094
striping Calibrated radiance data were directly used for the fluorescence retrieval (see Section 1095
24) while the feasibility to use APEX for SIF760 retrievals was theoretically demonstrated in 1096
42
a study of Damm et al (2011) Resulting SIF760 maps were afterwards geo-rectified using a 1097
parametric geocoding approach (Schlaumlpfer and Richter 2002) 1098
43
Appendix-B Retrieval of SIF760 from airborne data 1099
The quantification of SIF measured with ground or airborne-based spectrometers 1100
requires separating emitted SIF from the reflected radiance flux The Fraunhofer Line Depth 1101
(FLD) approach introduced by Plascyk (1975) serves as a de facto standard for medium 1102
resolution instruments such as APEX (Meroni et al 2009) and was applied in our study The 1103
FLD method uses atmospheric absorption bands characterized by lower incident light 1104
compared to wavelength regions outside of these bands This configuration increases the 1105
spectral information and allows the separation of SIF from reflected radiation In this study 1106
we used the broad O2-A oxygen absorption band around 760 nm and quantified the infilling of 1107
SIF760 using radiance measurements inside (subscript i) and outside (subscript o) of the O2-A 1108
band 1109
For the airborne case only atmospheric components can be simulated with 1110
MODTRAN-5 assuming perfect knowledge of the acquisition conditions The reflectance 1111
terms for diffuse and direct irradiance as well as the SIF760 contribution are usually unknown 1112
Assuming Lambertian surface reflectance behavior which introduces some inaccuracies but 1113
allows formulating the radiative transfer (RT) for radiance measurements at sensor level (LAtS) 1114
to obtain SIF760 both measurements inside and outside of the absorption band can be 1115
expressed as 1116
E9FA lang3H IJK LMNrangP QlangRSE rang T UlangVWWH VXWH rang∙langVYYH VYXH rangZH
Hlang[XXH rang T ABCHUlangVWWH ranglangVXWH rangZHlang[XXH rang ] ^ _ (B1) 1117
where E0 is the top-of-atmosphere irradiance including diffuse and direct irradiance 1118
components θil is the illumination zenith angle ρso is the path scattered radiance τss is the 1119
direct transmittance for sunlight τoo is the direct transmittance in view direction τsd is the 1120
diffuse transmittance of the atmosphere for sunlight τdo is the hemispherical-directional 1121
transmittance in view direction and ρdd is the spherical albedo If these atmospheric 1122
44
components are obtained from MODTRAN-5 simulations (Damm et al 2015 Verhoef and 1123
Bach 2003a b 2007) the radiative transfer equation (Eq B1) only contains four unknowns 1124
namely Ri Ro SIFi and SIFo The 3FLD method (Maier et al 2003) which is an adaptation of 1125
the original FLD method proposed by (Plascyk 1975) was used to linearly relate R and SIF 1126
inside and outside of the O2-A absorption band SIF can be finally retrieved with 1127
13 -0 abcMUdWecWlangRff_ rangZghcWUdMecMlangRff^ rangZiUdWecWlangRff_ rangZghUdMecMlangRff^ rangZ j
langVWWM ranglangVXWM rang (B2) 1128
kE lE9FA m lang3HW IJK LMNrangP langRSE rangn ] ^ _ (B3) 1129
E lang3HW IJK LMNrangP langoSSE TopSE rang ∙ langoE opE rang qEprs T Eprt] ^ _ (B4) 1130
r S13rlangoSSr rang T langopSr rang v13S$langoSSS rang T langopSS rangw (B5) 1131
where B is the factor relating SIFi and SIFo and was fixed to a value of 08 justified by 1132
simulations and experiments (Rascher et al 2009 Alonso et al 2008) Xj equals the at-1133
sensor radiance (reflected plus emitted radiation) without path radiance contribution and Ej 1134
expresses surface irradiance as measured at the sensor level A is the factor relating Ri and Ro 1135
and was derived from linear interpolation of R of the left (758 nm) and right (771 nm) O2-A 1136
band shoulder with 1137
xx+ (B6) 1138
y ```-0```z and y `-0`z
```z (B7) 1139
1140
Because APEX suffered from slight spectral smile effects (DOdorico et al 2010) 1141
updated center wavelength positions were involved in the convolution approach The spectral 1142
shift quantification for each pixel across track was based on the Cr method as described in 1143
45
Meroni et al (2010) The method assumes a high correlation between a measured and a 1144
convolved spectrum and iteratively minimizes a cost function which is 1 minus the Pearson 1145
correlation coefficient (r) calculated for both signals Remaining artifacts of the spectral shift 1146
correction and slightly inaccurate estimates of atmospheric properties cause SIF760 retrieval 1147
uncertainties We therefore applied a semi-empirical correction as described in Damm et al 1148
(2014) for each scan line across the track This technique employs reference surfaces which 1149
are free of any SIF760 emission (eg bare soil) to adjust the upward transmittance term inside 1150
the absorption feature oSSr The retrieval of SIF760 from top-of-canopy radiance data measured 1151
on ground follows the same approach as described in Eqs B2-B7 under the assumption that 1152
the surface irradiance can be approximated with the measurement of a reference panel and 1153
that ρso τdo and τdo can be set to 0 Furthermore the spectral resolution of APEX can be 1154
considered suboptimal for SIF760 retrievals although Damm et al (2011) demonstrate that 1155
APEX with its spectral resolution of 54 nm at 760 nm is sensitive for SIF760 However 1156
retrieved SIF760 values are too high and in an absolute sense incorrect We used reference 1157
SIF760 data obtained in parallel to the airborne acquisitions using the ASD field spectrometers 1158
(Section 23) to estimate the actual offset The observed scaling factor of 193 was afterwards 1159
applied to the retrieved SIF760 values to transfer them to a realistic value range 1160
46
Appendix-C SIF retrieval accuracy 1161
We applied a quantitative accuracy evaluation of resulting SIF760 maps using ground 1162
measured SIF760 values (Figure C1) Considering all reference data acquired during five 1163
campaigns a good linear relationship was achieved between ground and airborne-based 1164
SIF760 values (r2 = 071) but with a proportionality factor much higher than 1 (Figure C1-A) 1165
This experimentally obtained systematic overestimation of APEX SIF760 is comparable to 1166
simulation results documented in Damm et al (2011) Further we found slightly changing 1167
correlations between the different years (several linear models in Figure C1-A) which are 1168
likely caused by canopy structural effects spectral and radiometric performances of used 1169
ground instruments or slight deviations of the performance of APEX over time 1170
To compensate for the overestimation of APEX SIF760 we applied an empirical correction 1171
factor of 193 derived from the comparison of reference data and APEX which resulted in a 1172
rRMSE of 289 (Figure C1-B) 1173
1174
lt Figure C1 gt 1175
1176
The Laegeren site was covered with three adjacent flight lines having an overlap of 1177
approximately 10 (cf Figure 3) This configuration provides the opportunity to 1178
quantitatively evaluate the consistency of SIF retrievals obtained from different measurements 1179
and view zenith angles (ie plusmn 135deg) The comparison of SIF760 retrievals obtained from flight 1180
lines 1 and 2 reveals a moderate linear relationship for homogeneous agricultural surfaces (r2 1181
= 081 rRMSE = 57) We observed a systematic underestimation of flight line 1 compared 1182
to flight line 2 (factor 06) for a view zenith angle difference of ~26deg for SIF760 indicating 1183
either a directionality of SIF760 emissions or an insufficient decoupling of surface HCRF 1184
affected by reflectance anisotropy With increasing surface heterogeneity scattering increases 1185
47
and the agreement of retrieved SIF from both flight lines slightly decreases (ie for forested 1186
areas r2 of 05 and rRMSE of 88) This lower correlation can be mainly associated to slight 1187
geometric mis-registrations (ie max 2 pixel ~ 40 m) in combination with surface 1188
heterogeneity (eg shaded and sunlit tree crowns) and emission anisotropy of SIF760 Also 1189
negative SIF760 values are present in the SIF760 maps and caused by sensor noise and 1190
especially for forests due to shadowing effects (Damm et al 2015) 1191
48
Appendix-D Technical aspects determining the SIF760 retrieval accuracy 1192
A rigorous evaluation of the SIF760 retrieval accuracy is crucial to judge the reliability 1193
of our assessment on the relationship between SIF760 and GPPEC across ecosystems 1194
Furthermore additional factors imposing variations on SIF760 retrieved from airborne 1195
spectroscopy data that cannot be related to the physiological origin of SIF760 needs to be 1196
critically discussed to justify the proposed approach 1197
Ground-based measurements of SIF760 were made using field spectrometers to validate 1198
the airborne retrievals Field spectroscopy provides a good reference for validating airborne 1199
retrievals as it is likely not affected by biases resulting from atmospheric composition 1200
estimates (eg aerosol load) due to the simultaneous measurement of irradiance fluxes at 1201
canopy level using a reference panel The reliability of the applied field spectroscopic 1202
approach to measure SIF760 was previously demonstrated using field studies (Damm et al 1203
2010 Liu and Cheng 2010 Meroni et al 2009 Rascher et al 2009) and theoretical 1204
assessments (Damm et al 2011) It must be noted that field spectroscopic approaches are 1205
subject to uncertainties particularly for heterogeneous vegetation canopies Damm et al 1206
(2015) discussed retrieval errors caused by illumination effects likely introducing slight 1207
errors in reference SIF760 This source of uncertainty must be considered when judging the 1208
accuracy of APEX SIF760 The nevertheless good agreement between ground and airborne 1209
observations indicated that atmospheric absorption and scattering effects could be sufficiently 1210
compensated and thus demonstrated the reliability of retrieved SIF760 measurements In 1211
particular the empirical correction applied making use of high spatial resolution airborne IS 1212
data in combination with reference surfaces not emitting SIF760 allowed to bypass retrieval 1213
uncertainties caused by atmospheric effects (Damm et al 2014) 1214
Instrumental effects in combination with retrieval methods were found to cause 1215
systematic differences in SIF760 retrievals (Damm et al 2011) the comparatively low 1216
49
resolution of APEX around the O2-A band used to retrieve SIF760 (ie ~54 nm) resulted in an 1217
overestimation of APEX SIF760 compared to retrievals from high resolution instruments 1218
Indeed maximum APEX SIF760 values are 6 mW m-2 sr-1 nm-1 while typical SIF760 values 1219
obtained from high resolution instruments range between 0 and 3 mW m-2 sr-1 nm-1 (Guanter 1220
et al 2013) Considering SIF760 values retrieved from ASD data in original resolution (3 nm) 1221
APEX showed an overestimation of 1102 which confirmed that low spectral resolution 1222
resulted in an overestimation of SIF760 The reasoning for this absolute error is given by the 1223
sub-optimal spectral resolution of APEX with 54 nm at 760 nm causing a reduced sensitivity 1224
for SIF760 on the one hand and a wider distance of the O2-A shoulder values used to 1225
parameterize the 3FLD approach on the other hand The bias was corrected using the ASD 1226
reference data and does not impact the results of our analysis Further the relative variation of 1227
SIF760 is unaffected by the bias 1228
Surface heterogeneity complicates the retrieval of SIF760 According to Damm et al 1229
(2015) SIF760 retrievals for forest sites are especially subject to uncertainties due to 1230
assumptions on surface irradiance Crown shapes and associated surface orientations 1231
determine the intensity and quality of irradiance including fractional amounts of diffuse and 1232
direct irradiance To account for pixel wise changes in surface irradiance high resolution 1233
digital object models (DOM) (eg derived from LiDAR observations) are required In 1234
absence of such a high resolution DOMrsquos crowns are assumed to be flat which results in 1235
uncertainties of up to 58 in case of cast shadows (Damm et al 2015) Since we used 1236
averaged observations over larger areas representing flux tower footprints and most of our 1237
data were flown under comparable illumination conditions (ie around solar noon) we 1238
expect these potential biases to be less influential in this analysis 1239
1
Tables 1
Table 1 Date and time of APEX flights and corresponding eddy covariance flux tower 2
measurements for the three investigated ecosystems (ie grassland cropland mixed 3
temperate forest) 4
Date Time [UTC] Location Ecosystem Flux tower
17062009 950 Laegeren forest 1 tower
17062009 1030 Oensingen cropland 1 tower
17062009 1030 Oensingen grassland 2 tower
25062010 1030 Oensingen cropland 1 tower
25062010 1030 Oensingen grassland 2 tower
26062010 1500 Laegeren forest 1 tower
26062010 1030 Oensingen cropland 1 tower
26062010 1030 Oensingen grassland 2 tower
29062010 1030 Laegeren forest 1 tower
26062011 1030 Laegeren forest 1 tower
28062011 1030 Oensingen cropland 1 tower
28062011 1030 Oensingen grassland 1 tower
16062012 1025 Laegeren forest 1 tower
16062012 900 Oensingen cropland 1 tower
16062012 1100 Oensingen cropland 1 tower
12072013 730 Laegeren forest 1 tower
03092013 1050 Laegeren forest 1 tower
5
2
Table 2 Availability of reference SIF760 data obtained from field spectroscopy measurements 6
to validate APEX based SIF760 retrievals 7
Date time [UTC] Location Measured crops Nr points
17062009 1030 Oensingen maize rye pea sugar beet wheat white clover 29 points
25062010 1030 Oensingen maize pea sugar beet wheat white clover 15 points
16062012 900 Oensingen carrot maize winter wheat 11 points
16062012 1100 Oensingen carrot maize winter wheat 10 points
8
3
Table 3 Goodness of fit for the hyperbolic model describing the relationship between GPPEC 9
and SIF760 O PRI and MCARI2 for the three ecosystem types perennial grassland cropland 10
and mixed temperate forest Calculated statistics are based on all data acquired from 2009-11
2013 as described in Table 1 12
Optical variable Ecosystem Regression coefficient Relative RMSE []
SIF crops 088 355
grass 059 2708
forest 048 1588
PRI crops 0008 1176
grass 095 860
forest 009 2179
MCARI2 crops 0005 1029
grass 098 550
forest 034 1798
13
1
Figures 1
2
Figure 1 Study sites A Oensingen agricultural site B Laegeren forest site The white 3
rectangles represent in A the boundary of investigated fields that comprise most of the flux-4
tower footprints and in B a coarse outline of the footprint area of the flux-tower The white 5
crosses show the locations of the flux-towers Background RGB images from Google-Earth 6
2
7
Figure 2 APEX reflectance and SIF760 image for the Oensingen site acquired on the 2606 8
2010 1030 UTC A top-of-canopy hemispherical-conical reflectance data as true color 9
composite B SIF760 map The white boxes indicate the approximate position of the flux 10
tower 11
3
12
Figure 3 APEX reflectance and SIF760 image for the Laegeren site acquired on the 2606 13
2010 1510 UTC A top-of-canopy hemispherical-conical reflectance data as true color 14
composite B SIF760 map The black arrows indicate the flight direction of flight line 1 to 3 15
(FL1-FL3) The white line marks a transect along the overlapping region of FL1 and FL2 The 16
white boxes indicate the approximate position of the flux tower 17
4
18
Figure 4 Relationships between GPPEC from the eddy-covariance measurements and SIF760 O 19
instantaneously measured between 2009 and 2013 (see Table 1) with the airborne 20
spectrometer APEX (A) PRI index (B) and MCARI2 index (C) for three vegetation types 21
(black dots perennial grassland dark grey rectangles cropland including winter wheat pea 22
and barley grey triangles mixed temperate forest) The solid curves correspond to a 23
hyperbolic model fitted to the measured data The dashed curves show the extrapolated 24
behavior 25
5
26
Figure 5 Daily light response curves from eddy flux measurements for A cropland B 27
perennial grassland and C mixed temperate forest Data were acquired between 2009 and 28
2013 (see Table 1) Grey curves represent a fitted hyperbolic model to approximate the 29
behavior of measured PAR-GPP values Crosses show GPPEC measurements that were used 30
for the SIF760 O - GPPEC comparison based on the time of APEX flights PAR values are 31
binned in 20 mW m-2
sr-1
nm-1
increments 32
6
33
Figure 6 Leaf level relationships between photosynthetic (LUEp) and fluorescence yield 34
(LUEf) for a typical C3 crop Dependency of LUEp (A) and LUEf (B) on APAR C 35
Relationship between LUEp and LUEf D Relationship between APAR and GPPL GPPL was 36
calculated as APARLUEp E Relationship between APAR and SIF760 SIF760 was calculated 37
as APARLUEf assuming a constant relationship between the SCOPE output SIFtotalL 38
(integral between 640-850nm) and SIF760L F Relationship between SIF760 L and GPPL All 39
data were simulated using SCOPE The grey areas indicate illumination conditions 40
comparable to APEX flights 41
7
42
Figure 7 Canopy level relationships between photosynthetic (LUEp) and fluorescence yield 43
(LUEf) for different canopy representations of a C3 cropland in SCOPE Dependency of 44
LUEp (A) and LUEf (B) on APAR LUEp was calculate as GPPCAPAR and LUEf was 45
directly obtained from SCOPE C Relationship between LUEp and LUEf D Relationship 46
between APAR and GPPC GPPC was directly obtained from SCOPE E Relationship 47
between APAR and SIF760C SIF760C was directly obtained from SCOPE F Relationship 48
between SIF760C and GPPC The black dashed line corresponds to a C3 cropland with LAI = 49
30 fraction of brown pigments (Cs) = 00 and a spherical (sp) leaf inclination distribution 50
function (LIDF) For the grey line Cs was changed to 20 for the black dashed line the LAI 51
was changed to 10 and for the grey dasheddotted line the LIDF was changed to plagiophile 52
(pg) The grey areas indicate illumination conditions comparable to APEX flights 53
8
54
Figure 8 Impact of temporal scaling on the SIF760C-GPPC relationship SIF760C and GPPC 55
data were simulated using SCOPE Model input parameters air temperature (A) PAR (B) and 56
LAI (C) were measured within the NitroEurope project (httpwwwnitroeuropeeu) at the 57
Speulderbos forest site Netherlands D Relationship between SIF760C and GPPC including a 58
fitted hyperbolic model for daily averages (grey dots and grey line) monthly averages (dark 59
grey triangles and line) and quarterly data (black dots and black dashed line) 60
9
61
Figure C1 Comparison of ground and airborne-based SIF760 retrievals from various crops 62
Data were acquired during four campaigns between 2009 and 2012 in the agricultural site 63
Oensingen (see Table 2) Left Fitted linear regression lines for the four considered campaigns 64
are overlaid in black The dashed line corresponds to the 11 line Right SIF retrievals from 65
APEX after applying an empirical correction factor (193) The black line represents the fitted 66
linear model the dashed line corresponds to the 11 line 67
5
where LUEf is the light use efficiency of SIF (fluorescence yield) and fesc accounts for a 101
structural interference determining the fraction of SIF photons escaping the canopy 102
Relationships between SIF and GPP are mostly driven by the common APAR term In 103
addition a covariance between both light use efficiencies LUEp and LUEf is expected to 104
occur in absence of the confounding impact of other protective mechanisms (Damm et al 105
2010 Guanter et al 2014) 106
The above outlined concept relating SIF and GPP simplifies a complex set of 107
underlying mechanisms and violation of any assumptions made will directly confound the 108
SIF-GPP relationship In particular the competition of three processes for de-exciting 109
absorbed light energy ie photochemistry radiative energy loss (SIF) and non-radiative 110
energy dissipation (commonly approximated as non-photochemical quenching NPQ) causes 111
complex and changing sensitivities of emitted SIF to actual rates of photosynthesis (Porcar-112
Castell et al 2014 van der Tol et al 2014 van der Tol et al 2009a) This directly implies that 113
the functional link between SIF and GPP depends on the rate of NPQ and consequently on 114
ambient stress levels At canopy scale the three-dimensional structure causes gradients in 115
light interception and light quality within canopies (Nobel et al 1993 Stewart et al 2003) 116
additionally altering the rate of NPQ (Demmig-Adams 1998 Niinemets et al 2003) and thus 117
impacting the SIF-GPP relationship Canopy structure also increases the probability for the 118
emitted SIF photons either to be re-absorbed by chlorophyll or to escape the canopy (Fournier 119
et al 2012 Knyazikhin et al 2013) to some extent violating the assumption of fesc to be 120
constant In addition to these structural and physiological effects variations in SIF signals 121
caused by for example instrumental (Damm et al 2011) or atmospheric effects (Damm et al 122
2014 Guanter et al 2010) and retrieval uncertainties related to the estimation of surface 123
irradiance (Damm et al 2015) can potentially affect the apparent relationship between SIF 124
and GPP Proper understanding of confounding factors remains crucial to use SIF to constrain 125
6
estimates for GPP at ecosystem or continental scales (Garbulsky et al 2014 Guanter et al 126
2012 Parazoo et al 2014) 127
Considering the above listed mechanisms several aspects need to be addressed to 128
further exploit SIF as a robust constraint for estimating GPP We therefore aim at 129
investigating the functional information content of SIF and its link to GPP considering three 130
structurally and physiologically contrasting ecosystems ie cropland perennial grassland 131
and mixed temperate forest We use an innovative combination of multi-temporal imaging 132
spectroscopy (IS) data EC flux tower observations and modeling approaches at the leaf and 133
canopy levels i) to assess the relationship between far red SIF retrieved in the O2-A band at 134
760 nm (SIF760) and GPP across ecosystems and ii) to investigate the impact of confounding 135
factors on the SIF760-GPP relationship ie temporal scaling effects and structural and 136
physiological interferences using a photosynthesis model Our findings contribute to a better 137
understanding of the information inherent in remotely measured SIF760 and its functional 138
relationship to GPP Aspects discussed will help bridging the gap between small scale studies 139
and observational attempts to estimate GPP globally 140
141
2 Methods 142
21 Study sites 143
We investigated three contrasting ecosystems located on the Central Swiss Plateau in 144
terms of structure heterogeneity species composition and annual productivity Two of these 145
ecosystems were collocated in the agricultural area near the town of Oensingen (47deg1711rdquo N 146
7deg4401rdquo E 452 masl Figure 1A) This area is characterized by relatively small agricultural 147
parcels with grassland clover fallow cropping bean maize rapeseed pea sugar beet winter 148
barley and winter wheat rotating as dominant crops Two grassland fields differently 149
managed in terms of species composition fertilization and harvesting activities (Ammann et 150
7
al 2007) were investigated as representatives of the ecosystem type perennial grassland as 151
well as a cropland (one field with arable crop rotation) for the ecosystem type cropland The 152
forest area (47deg2842rdquo N 8deg2152rdquo E Figure 1B) is located on the south-facing slope of the 153
Laegeren mountain northwest of the city of Zurich The temperate mixed forest is 154
characterized by a relatively high species diversity and a complex canopy structure with 155
beech ash sycamore and spruce being the dominant species (Eugster et al 2007 Schneider 156
et al 2014) 157
158
lt Figure 1 gt 159
160
Both test sites are well instrumented (ie with eddy-covariance flux towers 161
micrometeorological stations) and were extensively sampled during several airborne 162
campaigns between 2009 and 2013 (Table 1) 163
164
lt Table 1 gt 165
166
22 Airborne spectroscopy 167
All three study sites were measured with the Airborne Prism EXperiment (APEX) 168
sensor on several days between 2009 and 2013 (Table 1) APEX is an airborne dispersive 169
pushbroom imaging spectrometer covering the 400-2500 nm spectral region in 313 narrow 170
continuous spectral bands APEX allows capturing the O2-A atmospheric absorption feature 171
and thus retrieving SIF760 with a spectral sampling interval of 45 nm a full width at half 172
maximum (FWHM) of 57 nm and a signal to noise ratio of approximately 450 in and 800 173
outside of the O2-A feature for a 50 reflective target and a sun zenith angle of 30deg (Jehle et 174
al 2010 Schaepman et al 2015) 175
8
Radiance calibration of APEX images is performed using the approach of Hueni et al 176
(2009) Multitemporal comparison of images is secured by using consistent calibration and 177
processing versions Precise retrievals of SIF typically require data measured in sub-178
nanometer spectral resolution However the feasibility of using APEX like instruments (ie 179
FWHM ~5nm) for SIF760 retrievals was theoretically assessed in Damm et al (2011) and 180
experimentally demonstrated in recent work (Zarco-Tejada et al 2009 Zarco-Tejada et al 181
2013) The use of calibrated APEX radiance data for the fluorescence retrieval is described in 182
Section 24 and Appendix-B Vegetation indices (see Section 25) were calculated using 183
Hemispherical-Conical-Reflectance-Factor data obtained after atmospheric correction using 184
ATCOR-4 (Richter and Schlaumlpfer 2002) Resulting SIF760 and vegetation indices were 185
projected in the same map projection using parametric geocoding (Schlaumlpfer and Richter 186
2002) Details about APEX data calibration are listed in Appendix-A 187
188
23 Field spectroscopy 189
ASD (PANalytics Boulder US) field spectrometer data were acquired for validation 190
purposes within one hour of the APEX overflight during four campaigns In total 23 191
agricultural fields covering various crops including carrot maize pea rye sugar beet wheat 192
white clover were systematically sampled by measuring reflected and emitted radiances in 193
four homogeneous 3 m2 plots per field (Table 2) Incident light was quantified before and 194
after measuring each plot using a Spectralon reference panel 195
196
lt Table 2 gt 197
198
24 SIF760 retrieval 199
Emitted SIF was analytically separated from the reflected radiance flux measured with 200
ground and airborne-based spectrometers (see Appendix-B) We applied the Fraunhofer Line 201
9
Depth (FLD) approach (Plascyk 1975) which serves as a standard for SIF retrievals using 202
medium resolution instruments (Meroni et al 2009) The FLD method uses atmospheric 203
absorption bands characterized by lower incident light compared to wavelength regions 204
outside of these bands This configuration allows evaluating the in-filling of the absorption 205
bands by SIF (Damm et al 2014) In this study we used the broad O2-A oxygen absorption 206
band around 760 nm for the SIF760 retrieval For the ground data surface irradiance was 207
estimated from white reference measurements while perturbing atmospheric absorption and 208
scattering effects were assumed to be negligible on the 1 m pathway between canopy and 209
sensor (cf Damm et al (2014) for details on the set-up for SIF760 retrieval on the ground) 210
For the airborne measurements we compensated atmospheric absorption and scattering using 211
the atmospheric radiative transfer model MODTRAN5 (Berk et al 2005) Details of the 212
SIF760 retrievals using airborne data are provided in Appendix-B 213
214
25 Derivation of additional spectral indices 215
The relationship between two vegetation indices and GPP was investigated in parallel 216
to judge the performance of the new remote observation of SIF compared to commonly used 217
remote sensing approaches The photochemical reflectance index (PRI) (Gamon et al 1992) 218
was found to be sensitive to pigment changes related to the xanthophyll cycle and is 219
frequently used to quantify LUEp and GPP (Cheng et al 2013 Drolet et al 2008 Hilker et al 220
2009) The PRI was calculated as 221
(3) 222
while Rλ accounts for the surface reflectance at the wavelength λ 223
We further tested the soil adjusted Modified Chlorophyll Absorption Ratio Index 2 224
(MCARI2) (Haboudane et al 2004) that was found to be strongly related to green LAI thus 225
potential photosynthesis and is calculated as 226
10
2 $amp($)$+-amp0 (4) 227
228
26 Eddy-covariance measurements 229
Continuous turbulent fluxes of CO2 were measured at the agricultural and forest sites 230
between 2009 and 2013 using the EC technique (Baldocchi 2003) At each site the EC 231
instrumentation consisted of an open-path infrared gas analyzer (IRGA) (model LI-7500 LI-232
COR Inc Lincoln NE USA) and a three-dimensional sonic anemometer-thermometer 233
(models HS R3 and R2 Gill Instruments Lymington UK) EC measurements were made at a 234
frequency of 20 Hz and processed to half-hourly averages using the eth-flux EC software for 235
the forest and cropland (Mauder et al 2008) or a comparable custom-made EC software for 236
the grassland (Ammann et al 2007) Post-processing included corrections for damping losses 237
(Eugster and Senn 1995) air density fluctuations (Webb et al 1980) data screening for 238
optical sensor contamination stationary or low turbulence conditions (Foken and Wichura 239
1996) and statistical outliers Standardized gap filling and partitioning of CO2 fluxes was 240
performed using the methodology from Lasslop et al (2010) for the forest and cropland and 241
using the methodology from Falge et al (2001) for the grassland Measurements of 242
photosynthetic photon flux density (PPFD) quantified in micromol m-2 s-1 were converted to 243
radiance units (mW m-2 sr-1 nm-1) representing the photosynthetic active radiation (PAR) to 244
be consistent with Monteithrsquos LUE concept and the SIF radiance units 245
246
27 Leaf area index measurements 247
The Leaf Area Index (LAI) of the grassland and cropland was measured at the time of 248
APEX flights using an optical non-destructive approach based on LAI-2000 leaf area meter 249
observations (Li-Cor Lincoln USA) The LAI of the forest was estimated using digital 250
11
hemispherical photographs at two subplots following the VALERIE sampling scheme while 251
subsequent analysis were applied to obtain the LAI (Schneider et al 2014) 252
253
28 Statistical analysis of SIF760 - GPP relationship 254
SIF760 values were manually extracted from APEX-SIF760 maps for areas representing 255
the footprint of eddy-flux measurements (Figure 1) For the perennial grassland and cropland 256
we selected all pixels with SIF760 values ge 0 mW m-2 sr-1 nm-1 in respective fields although the 257
EC tower footprint can be slightly smaller than the entire field The increased number of 258
resulting pixels allows reducing data noise and covering small spatial variations within the 259
footprint Using the pixels of the entire field is justified by the large homogeneity of the 260
underlying fields (Figure 1A) For the forest site Laegeren all pixels representing an area that 261
covered 70 of all footprint occurrences were selected irrespective of spatial footprint 262
changes due to changing wind conditions Using the same area for all years reduces variations 263
in SIF due to changes in biomass and canopy structure but also reduces the representativeness 264
of selected pixels for actual spatial EC footprints 265
We used a hyperbolic model to relate GPP to SIF760 and to both vegetation indices 266
Although the hyperbolic model only empirically approximates the data behavior it is 267
supported by theoretical arguments for the SIF760-GPP relationship that are outlined hereafter 268
The photosynthetic efficiency LUEp is often described as a hyperbolic function of APAR 269
following the Michaelis-Menten theory (Michaelis and Menten 1913) 270
∙123467899 (5) 271
where c is a coefficient in radiance units and LUEpmax c represents GPPmax Following Eqs 272
(1) and (5) GPP rises asymptotically with APAR to GPPmax This equation is used in many 273
models for partitioning GPP eg Falge et al (2001) Substituting LUEp from Eq (5) and 274
APAR = SIF760 (LUEf fesc) from Eq (2) into Eq (1) results in 275
12
lt= gtampABCampD (6) 276
where the coefficient b represents cLUEffesc accounting for the difference between LUEp 277
and LUEf GPPmax is a value that is asymptotically reached representing the photosynthetic 278
capacity or GPP of the canopy at light saturation It must be noted that Eq (6) is a 279
simplification of the complex relationships between GPP and SIF760 and thus performs best if 280
c LUEf fesc remains constant or SIF760 corresponds to APAR A constant LUEf is a 281
reasonable first approximation for vegetation that is only moderately stressed meaning that 282
variations in LUEf are substantially smaller than variations in LUEp (van der Tol et al 2014) 283
Moderate stress relates to any kind of environmental conditions (warm temperature strong 284
irradiance reduced water availability) that cause only short term and slight changes in 285
photochemical and non-photochemical protections However c and fesc are known to vary 286
across ecosystems and LUEf changes under environmental stress In order to evaluate their 287
impacts on the SIF-GPP relationships as expressed in Eq (6) we carried out simulations with 288
the Soil-Canopy Observations of Photosynthesis and Energy balance model SCOPE version 289
153 (van der Tol et al 2009b) (see Section 29) The goodness of fit for the hyperbolic model 290
was quantified using non-linear regression analysis and was quantitatively described using the 291
root mean square error normalized by the mean of measured data (rRMSE) and the coefficient 292
of determination R2 defined as the correlation between data and the best fit-curve determined 293
by non-linear regression 294
295
29 SCOPE simulations 296
SCOPE uses semi-empirical models for LUEp (Collatz et al 1991) and LUEf (van der 297
Tol et al 2014) embedded in a radiative transfer scheme for the canopy (van der Tol et al 298
2009b) The radiative transfer model at leaf level (Fluspect) is an extension of PROSPECT 299
(Jacquemoud and Baret 1990) and includes a fluorescence component The radiative transfer 300
13
within the canopy is calculated following Verhoef (1984) in the optical domain (SAIL) 301
following Verhoef et al (2007) in the thermal domain and Miller et al (2005) for the 302
fluorescence emissions (FluorSAIL) SCOPE requires a number of vegetation structural and 303
physiological parameters as well as weather information as input The model simulates GPP 304
and spectrally distributes SIF with a spectral resolution and a spectral sampling interval of 10 305
nm each Simulated PPFD values (micromol m-2 s-1) were also converted to radiance units (PAR) 306
We carried out three simulations using SCOPE In the first simulation we calculated 307
leaf level LUEf and LUEp of a typical C3 cropland as function of varying APAR For the 308
second simulation at canopy level we calculated LUEf and LUEp as function of varying 309
APAR for differently structured canopies We took the standard SCOPE parameters for a 310
typical C3 cropland and varied APAR and the structural parameters LAI leaf inclination 311
angle (LIDF) and the fraction of brown pigments (Cs) Both simulation experiments provide 312
theoretical evidence on the relationships between LUEf and LUEp between SIF760 and GPP 313
and their respective relationships to APAR For the third canopy level simulation SCOPE 314
was initialized using time series of mid-day (solar noon) meteorological data (PAR air 315
temperature) a seasonal cycle of LAI and the modelrsquos default soil and vegetation parameters 316
for a C3 cropland (cf the SCOPE user manual) The purpose of this simulation was to 317
evaluate seasonal SIF760-GPP relationships at various temporal aggregation levels For better 318
readability we use the following notation through the manuscript SIF760 O for APEX-SIF 319
SIF760 L and SIF760 C for SCOPE simulated leaf and canopy SIF GPPEC for flux tower GPP 320
and GPPL GPPC to relate to simulated GPP at leaf and canopy level 321
322
3 Results 323
31 SIF760 maps 324
14
Two examples of SIF760 O maps obtained from APEX are shown in Figures 2 and 3 325
The appearance of SIF760 O emissions in vegetated areas demonstrates that measured SIF760 O 326
signals originated solely from vegetation and were not contaminated by non-fluorescent non-327
vegetation surfaces Retrieved SIF760 O values range between 0 and 3 mW m-2 sr-1 nm-1 and 328
showed a high agreement (r2 = 07 rRMSE = 289) with in-situ measured reference data 329
Details of the SIF760 O validation are discussed in Appendix-C 330
331
lt Figure 2 gt 332
lt Figure 3gt 333
334
32 Relationships of GPPEC with SIF760 O PRI and MCARI2 335
Relating instantaneous measurements of SIF760 O and GPPEC from several years 336
revealed an asymptotic relationship with saturating GPPEC in presence of moderate to high 337
SIF760 O (Figure 4A Table 3) This general behavior was consistent for all investigated 338
vegetation types The fitted hyperbolic model shows a moderate to high goodness of fit for the 339
grassland (R2 = 059 rRMSE = 271) cropland (R2 = 088 rRMSE = 35) and forest (R2 = 340
048 rRMSE = 1588) The saturation of GPPEC appeared earlier for the cropland (SIF760 O 341
~05 mW m-2 sr-1 nm-1) than for the grassland and forest (SIF760 O gt 10 mW m-2 sr-1 nm-1) An 342
independent assessment considering a linear model to describe the relationship between 343
SIF760 O and GPPEC revealed a consistently lower goodness of fit justifying the use of a 344
hyperbolic model (data not shown) 345
Statistical analysis showed that a hyperbolic model represents well the relationship 346
between both vegetation indices (PRI and MCARI2) and GPPEC for the grassland with a 347
notable variation in LAI (range between 05 and 48 m2 m-2) However a hyperbolic model 348
does not allow well representing the relationship between PRI and MCARI2 with GPPEC for 349
the forest and cropland both showing only a small variation in LAI (less than plusmn03 m2 m-2) 350
15
(Figure 4B-C Table 3) The goodness of fit for the hyperbolic model describing the PRI and 351
GPPEC data for grassland (R2 = 095 rRMSE = 86) was even higher compared to SIF760 O 352
but lower for forest (R2 = 009 rRMSE = 2179) and cropland (R2 = 0008 rRMSE = 353
1176) With MCARI2 the goodness of fit for the hyperbolic model for grassland was high 354
(R2 = 098 rRMSE = 55) but low for cropland (R2 = 0005 rRMSE = 1029) and forest 355
(R2 = 034 rRMSE = 1798) Again considering a linear relationship between both 356
vegetation indices and GPPEC revealed no consistent improvement compared to the use of a 357
hyperbolic model (data not shown) 358
359
lt Figure 4 gt 360
lt Table 3 gt 361
362
33 Assessment of factors determining SIF760 GPPEC relationships 363
The asymptotic relationship between SIF760 O and GPPEC (Figure 4A) represented 364
instantaneous measurements of different canopies at different times and days over several 365
years covering a range of different light conditions phenological stages of the forest and 366
various amounts of green biomass for both investigated grasslands (crosses in Figure 5A-C 367
that indicate EC measurements during APEX overpasses) Relationships between SIF760 O and 368
GPPEC are consequently a complex function of light absorption in the canopy (APAR) of the 369
efficiency of light utilization (ie expressed as photosynthetic capacity and quantum 370
efficiency of photosynthesis) and of structural effects including fractions of non-371
photosynthetic vegetation components Both grass canopies were measured before and after 372
mowing resulting in a large range in LAI (05-48 m2 m-2) and GPPEC (4-27 micromol m-2 s-1) for 373
similar PAR values The forest LAI of 50 m2 m-2 was more constant over the years due to the 374
consistent timing of flights however senescence (eg lower canopy chlorophyll content and 375
light absorption) might explain the decrease in GPPEC of 15 micromol m-2 s-1 in September for 376
16
comparable irradiance conditions (Figure 5C) Investigated crops (winter wheat barley and 377
pea) were characterized by small variations in LAI (22-25 m2 m-2) and chlorophyll contents 378
corresponding to small variations in GPPEC (5 micromol m-2 s-1) while observed under comparable 379
irradiance conditions During the time of observation the barley and wheat canopies were in 380
the ripening phase with a pronounced ear layer 381
382
lt Figure 5 gt 383
384
The validity of the asymptotic relationship between SIF760 O and GPPEC was tested 385
using simulations made with the SCOPE model We emphasize that the regression coefficient 386
b in Eq (6) includes terms that vary in the model (b= cmiddotLUEfmiddotfesc) the fluorescence efficiency 387
LUEf varies with irradiance conditions (predominantly APAR) the fraction fesc depends on 388
vegetation structure while c=GPPmaxLUEpmax varies between sites and over time during the 389
season We first analysed how LUEf and LUEp and consequently SIF760 and GPP vary at 390
leaf (ie SIF760 L and GPPL) and canopy levels (ie SIF760 C and GPPC) using the model of 391
van der Tol et al (2014) that is embedded in SCOPE For the leaf level Figure 6A shows a 392
decrease of LUEp with increasing APAR consistent with Eq (5) The relation between APAR 393
and LUEf appears more complex LUEf first increases with increasing APAR under low light 394
conditions reaches a climax at intermediate light and then decreases with increasing APAR 395
under higher APAR values (gt 50 mW m-2 sr-1 nm-1) (Figure 6B) The initial increase in LUEf 396
is caused by the decline in photochemical quenching of the excitons whereas the decrease of 397
LUEf is caused by the growing number of non-photochemical quenching traps that dissipate 398
light energy before it can be emitted as fluorescence light (van der Tol et al 2009a) It is 399
important to note that the range of LUEp is nearly an order of magnitude greater compared to 400
the range of LUEf (Figure 6C) Although LUEf is not constant we can still conclude that the 401
difference in both LUE terms causes an earlier saturation of leaf-level GPPL (Figure 6D) 402
17
compared to leaf-level SIF760 L (Figure 6E) with APAR leading to an asymptotic relationship 403
between SIF760 L and GPPL (Figure 6F) Our canopy level simulations confirm these trends 404
(Figure 7A-D) The in-field measured asymptotic relationships between SIF760 O and GPPEC 405
are consequently caused by the covariance of GPPEC and SIF760 O with APAR the 406
photosynthetic capacity with APAR and the different value ranges of LUEf and LUEp 407
Additionally our canopy level simulations suggest that structure impacts the SIF760 O - GPPEC 408
relationship Figure 7D shows an example that changing LAI leaf inclination angles or the 409
fraction of senescent plant material determine the curvature of the hyperbolic SIF760 C - GPPC 410
relationships 411
412
lt Figure 6 gt 413
lt Figure 7 gt 414
415
The modelled SIF760 LC - GPPLC curves (Figures 6D and 7D) also indicate that under 416
reduced light intensity GPP and SIF760 are almost linearly related while GPP tends to saturate 417
under higher light intensities Changes in APAR at canopy level are caused by either sun 418
elevation or in the case of a constant solar angle by canopy structure (ie shading fractional 419
vegetation cover) In complex structured canopies with many foliage layers the saturation of 420
GPP with APAR may not be observable because variations of APAR are less related to PAR 421
falling on the leaves but rather to the variation of leaf area exposed to light Model 422
simulations suggest that in complex canopies SIF760 saturates with APAR before GPP due to 423
fesc being lower with high APAR (data not shown) This structural effect reduces the curvature 424
of the hyperbolic leaf level GPPL- SIF760 L relationship at canopy level (compare Figures 6F 425
and 7F) Furthermore the effect of structure and APAR covary in time since canopy structure 426
(ie LAI) varies in concert with APAR during a seasonal cycle especially for crops We 427
18
expect that this covariance makes the relationship between GPP and SIF760 more linear at the 428
canopy level especially if observations are aggregated over time 429
To evaluate the structure related alleviation of the hyperbolic relationship between 430
SIF760 and GPP at canopy level in response to temporal aggregation we modelled an annual 431
course of GPPC and SIF760 C considering varying environmental conditions (Figure 8A-B) 432
ie PAR ranging from 0-500 mW m-2 sr-1 nm-1 air temperature ranging from 0-32degC using 433
data collected during 2009 at a Nitro-Europe flux tower site (Speulderbos The Netherlands) 434
and canopy properties ie LAI ranging from 15-30 m2 m-2 (Figure 8C) The LAI data are 435
synthetic but have a realistic seasonal cycle For daily noon values of modelled SIF760 C and 436
GPPC an asymptotic behaviour can be observed while GPPC tends to saturate compared to 437
SIF760 C The SIF760C-GPPC relationship tends to become linear when monthly or quarterly 438
averages are considered (Figure 8D) 439
440
lt Figure 8 gt 441
442
This visual trend can be confirmed by statistical measures for daily aggregated values 443
the hyperbolic model (rRMSE = 174 R2 = 070) performed slightly better than the linear 444
model (rRMSE = 185 r2 = 068) In case of monthly aggregated data both the hyperbolic 445
and linear models performed similarly while the linear model gave better results (RMSE = 446
90 r2 = 090) than the hyperbolic model (rRMSE = 94 R2 = 088) for quarterly aggregated 447
data 448
449
4 Discussion 450
Significant relationships between remotely measured SIF and ecosystem GPP have 451
been reported in the past (Frankenberg et al 2011 Guanter et al 2014) however sufficient 452
19
process understanding for using SIF as proxy for GPP across ecosystems is still limited 453
(Porcar-Castell et al 2014) Below we discuss how our observational and modeling 454
approaches help bridging the gap between mechanistic understanding at the leaf level and 455
ecosystem-specific observations and thus provide insights on mechanisms determining the 456
complex relationship between SIF and GPP 457
458
41 Insights from the observational approach 459
Our results showed ecosystem-specific asymptotic relationships between SIF760 O and 460
GPPEC for the three investigated ecosystems mixed temperate forest cropland and perennial 461
grassland The varying SIF-GPP relationships across ecosystems were consistent with results 462
recently reported from combined satellite observations and model predictions (Guanter et al 463
2012) Our results showed that the relationships of both tested vegetation indices PRI and 464
MCARI2 to GPPEC experienced a higher variability across ecosystems compared to SIF760 O 465
SIF760 O showed an ecosystem-specific and overall moderate to good relationship (R2 between 466
048 and 088) to GPPEC for the three ecosystems Both vegetation indices showed only strong 467
relationships for the grassland (R2 = 095 and 098) that notably changed in LAI during the 468
various observations It is important to note that we do not further elaborate on the underlying 469
mechanisms relating vegetation indices and GPPEC and that it is unclear if hyperbolic models 470
best describe their relationships to GPPEC based on mechanistic principles The intention of 471
evaluating the relationships between GPPEC and both vegetation indices was to provide a base 472
to judge the performance of SIF760 O in relation to these commonly used remote observations 473
The diversity of sampled conditions and used data sources provide further evidence on 474
the robustness of observed SIF760 O-GPPEC relationships Our measurements represent various 475
canopies characterized by different biomasses sampled over several years Although most 476
observations were acquired under similar light condition and physiological states a few 477
measurements represented lower light conditions and other physiological states This suggests 478
20
that observed relationships are rather robust across different representations of APAR LUEp 479
and LUEf Furthermore we use data from different sources ie four EC flux towers the 480
APEX imaging spectrometer and modeling at leaf and canopy levels to reduce the 481
uncertainties associated with each method of measurements and to get a better understanding 482
of the SIF760 O-GPPEC relationship at ecosystem level 483
Flux tower measurements are representative of a certain source area (footprint) from 484
the ecosystem which changes constantly based on wind direction and turbulent state of the 485
atmosphere Depending on the heterogeneity of the ecosystem GPPEC signals can vary in 486
response to changing footprints (Barcza et al 2009 Kljun et al 2004) although this variation 487
should be rather small if the vegetation is homogeneous Remote measurements of SIF760 are 488
likely representative of the upper layer of the ecosystem thus vertical canopy heterogeneity 489
potentially leads to a mismatch when compared to GPPEC which integrates over the different 490
layers of the ecosystems This is expected to be especially the case in structurally complex 491
ecosystems such as forests Although the upper layer in forest ecosystems substantially 492
contributes to the total rate of GPPEC there are still many layers of leaves or needles within 493
the canopy photosynthesizing at different rates depending on their sunshade exposure In 494
addition understory vegetation in forest ecosystems can significantly contribute to GPPEC at 495
different rates depending on the ecosystem and time of year Even homogeneous vegetation 496
canopies like crops or grasslands can show vertical heterogeneity This is especially the case 497
at peak biomass during ripening or senescence During such phenological stages the top layer 498
of cereal crops consists of less fluorescing components (ie ears) and cereal crops or 499
grasslands can contain a higher fraction of brown pigments resulting in low SIF760 O values 500
while the entire canopy can still produce high photosynthetic rates and thus GPPEC (Damm et 501
al 2010) Indeed most of the crops investigated in our study were in the ripening phase with a 502
pronounced ear layer 503
21
This resulted in relatively low SIF760 O values and in high GPPEC and thus in a more 504
pronounced asymptotic relationship (cf Figure 4A Figure 7F) compared to results reported 505
for other crops (Guanter et al 2013 Guanter et al 2014) Further research is needed to better 506
understand the impact of vertical heterogeneity on GPPEC and SIF760 observations and their 507
respective relationships 508
Despite the technical aspects causing variations in retrieved SIF760 O (refer to 509
Appendix-D for a detailed discussion) canopy structure causes inherent variations in 510
measured SIF760 values and thus impacts SIF760-GPP relationships The combination of 511
complex canopy architecture and the distribution of absorbing and scattering elements 512
determine vegetation canopies to act as photon traps (Knyazikhin et al 2013 Lewis and 513
Disney 2007) Parts of emitted SIF760 photons from inner-canopy leaves are re-absorbed 514
while others escape the canopy in direction of the sensor The probability of photons escaping 515
the canopy is a function of canopy structure which implies sensitivity to measured SIF760 516
intensities for canopy structure In Eq (2) this sensitivity was approximated with the term 517
fesc In our analysis we minimized the impact of fesc by observing always the same forest area 518
representative for the EC tower footprint In less complex structured crop and grass canopies 519
we expect fesc to be less important However future research is required to quantify the impact 520
of fesc and to propose strategies to compensate its influence on SIF760 retrievals 521
522
42 Insights from the modeling approach 523
From a theoretical point of view radiative energy loss competes with photochemistry 524
and non-radiative energy dissipation for absorbed photons Considering that GPP and SIF760 525
can be conceptualized according to Eqs (1) and (2) SIF760 must show under certain 526
environmental conditions a sensitivity to photochemistry (Porcar-Castell et al 2014 van der 527
Tol et al 2009a van der Tol et al 2009b) This relationship is confirmed by our observational 528
data and other studies at leaf (Amoros-Lopez et al 2008) and canopy levels (Damm et al 529
22
2010) Our modeling results however indicated that the relationship between LUEf and LUEp 530
is subject to change hence impacting the sensitivity of SIF760 to track changes in GPP 531
(Figures 6C and 7C) 532
The asymptotic relationship between SIF760 and GPP theoretically predicted and 533
observed at leaf and canopy levels can be related in particular to the different value ranges of 534
both efficiency terms (LUEp and LUEf) (Figures 6C and 7C) while a complex set of 535
mechanisms causes an ecosystem dependency for SIF760-GPP relationships The 536
photosynthetic capacity of the entire ecosystem in combination with its vertical heterogeneity 537
determines differences in GPP and SIF760 and thus the slope and curvature of their respective 538
relationships Furthermore the initial slope of the asymptotic SIF760 - GPP relationship which 539
has a value of LUEpmax(LUEfmiddotfesc) is determined by a combination of the photosynthetic 540
efficiency and canopy structure Canopy structure and related shadowing effects alter the 541
average light interception and quality at leaf level (Nobel et al 1993 Stewart et al 2003) and 542
consequently the overall productivity of the canopy In the case of reduced APAR caused by 543
canopy shadowing the overall apparent stress level in the canopy and consequently the rate 544
of certain photoprotective mechanisms such as non-radiative energy dissipation is reduced 545
(Cheng et al 2015 Demmig-Adams 1998 Niinemets et al 2003) and observed GPP and 546
SIF760 fall in a range where they are more linearly related (cf Figure 6F and 7F) In addition 547
canopy level simulations show that the fraction of senescent plant material impacts the 548
curvature of the hyperbolic relationship 549
Recent literature reports linear relationships between satellite-based SIF and modeled 550
GPP (Frankenberg et al 2011 Guanter et al 2012 Guanter et al 2014) while we found 551
asymptotic relationships Both results are not contradicting if one considers the temporal 552
aggregation applied to the data Our results are based on instantaneous measurements while 553
monthly averages were calculated for the satellite data to minimize noise effects (Frankenberg 554
et al 2011 Guanter et al 2014) It is known from previous research that temporal averaging 555
23
tends to linearize the response between GPP and APAR (Ruimy et al 1995) as saturating 556
light conditions tend to be only a small fraction of averaged diurnalmonthly data 557
Aggregating GPPEC and APAR over different time scales also showed this effect (data not 558
shown) Because of the rather linear relationship between SIF760 and APAR we expect that 559
temporal aggregation tends to linearize the SIF760-GPP relationship as well A recent study 560
presenting continuous measurements of GPP and SIF760 over a temperate deciduous forest 561
support this hypothesis (Yang et al 2015) The increasing number of experiments using 562
autonomous spectrometer systems in combination with flux towers (Balzarolo et al 2011) 563
will likely provide more experimental results that supports this finding Our simulations 564
provide further evidence that the covariance of structure and APAR during a seasonal cycle 565
additionally tends to linearize the relationship between GPP and SIF760 if observations are 566
aggregated over time 567
The dependency of SIF760-GPP relationships on temporal aggregation requires special 568
attention since it has implications on the usage of SIF to constrain GPP In principle 569
conclusions and results obtained from temporally aggregated and instantaneous measurements 570
are valid if consistently related to the underlying temporal aggregation level Generalizing 571
conclusions obtained at various aggregation levels bears the risk for mis-interpretations eg 572
when vegetation models are refined or empirically re-calibrated using observations or for 573
projections of GPP using observational SIF data 574
575
43 Requirements for the use of SIF to assess GPP across ecosystems 576
The changing relationship between SIF760 and GPPEC with vegetation type challenges 577
the usage of SIF760 as a robust constraint to estimate GPP Specific strategies are required to 578
account for ecosystem (or species) specific sensitivities of SIF in general and SIF760 in 579
particular This includes i) integration platforms to combine observations and process 580
24
understanding and ii) accurate observations of additional vegetation and environmental 581
variables 582
Process-based models as data integration platform in combination with comprehensive 583
observations to sufficiently measure important environmental factors and vegetation 584
properties are considered as flexible and powerful framework Parazoo et al (2014) for 585
example proposed the combination of ensemble dynamic global vegetation models (DGVMs) 586
in combination with SIF as observational constraint Lee et al (2015) suggest incorporating 587
SIF in a climate model to utilize SIF as observational constraint of photosynthesis simulations 588
and subsequent calculations of carbon water and energy cycle information Yet other studies 589
propose using SIF to obtain physiological vegetation parameters ie Vcmax for improved 590
parameterizations of photosynthesis models to eventually model GPP (Zhang et al 2014) The 591
European space agencys (ESA) Earth Explorer 8 opportunity mission Fluorescence Explorer 592
(FLEX) suggests a combination of comprehensive observations (ie SIF over the full 593
emission spectrum vegetation ecosystems and actual environmental conditions) and process-594
based models (Guanter et al 2012) 595
Additional information is required to use SIF in process-based models as one has to 596
account for varying photosynthetic efficiencies of plants and prevailing stress responses 597
According to the conceptualization of GPP and SIF as given in Eqs (1) and (2) extracting 598
and evaluating the exact relationship between LUEp and LUEf is essential but requires 599
normalizing APAR and calculating both yields (Damm et al 2010 Govindjee 2004 Louis et 600
al 2005) Retrievals of APAR can be considered challenging (Garbulsky et al 2010 Gitelson 601
and Gamon 2015 Hanan et al 2002) as available approaches often utilize a-priori knowledge 602
of prevailing land cover or plant distribution functions and rely on the inversion of physical-603
based models or simple band ratios (Hilker et al 2008) Research is required to provide high 604
quality information on APAR not perturbed by light absorption of non-photosynthetic active 605
25
canopy elements (stems branches twigs) cf Zhang et al (2013 2012) that demonstrate 606
attempts to improve estimates of APAR 607
Observed SIF760 O - GPPEC relationships are additionally confounded by non-radiative 608
energy dissipation The PRI was designed to monitor pigment changes related to the 609
xanthophyll cycle (Gamon et al 1992) and provides access to this superimposing process 610
However reported sensitivities of PRI for other effects ie structure (Barton and North 611
2001) pigment pool sizes (Gamon and Berry 2012) illumination effects (Damm et al 2015) 612
and the results obtained in this study question the applicability of the PRI at canopy level 613
Alternative approaches such as the development of a canopy PRI as suggested by several 614
groups (Hernandez-Clemente et al 2011 Kovac et al 2013 Wu et al 2010) or the usage of 615
pigment compositions and other functional plant traits might represent interesting strategies 616
and should be elaborated in future research 617
Structural sensitivities of canopy leaving SIF signals are critical and require further 618
research The application of spectrally invariant correction factors eg the directional area 619
scattering factor (Knyazikhin et al 2013) or more advanced physically-based retrieval 620
schemes using combined atmosphere-canopy models (Damm et al 2015 Laurent et al 2013) 621
might provide potential strategies to compensate for canopy structural effects on retrieved 622
SIF760 623
Another important source of information that allows improving the usage of SIF as 624
constraint of GPP is to consider SIF emissions over the entire emission spectrum between 625
approximately 600 and 800 nm Recent research successfully demonstrated the 626
complementary information content of red-fluorescence retrieved in the O2-B band at 688 nm 627
(SIF688) compared to SIF760 because of the different contributions from photosystem I and II 628
(Rossini et al 2015) Yet other studies highlighted the potential to improve predictions of 629
LUEp and GPP using both SIF688 and SIF760 (Cheng et al 2013) 630
631
26
5 Conclusions 632
Remote sensing of SIF provides a new observational approach to assess terrestrial 633
GPP Compared to traditional greenness-based remote sensing parameters we found SIF760 to 634
be more consistently related to GPPEC These results in combination with the more direct 635
mechanistic link between SIF760 and photosynthesis suggest that using SIF760 provides a 636
strategy to decrease uncertainty in estimating GPP across ecosystems 637
Our observational and modeling approaches revealed asymptotic and ecosystem-638
specific relationships for SIF760 and GPPEC We identified a set of interlinked mechanisms 639
determining SIF760-GPPEC relationships to be ecosystem specific ie the photosynthetic 640
capacity and efficiency of ecosystems the confounding impact of non-radiative energy 641
dissipation (NPQ) as well as ecosystem structure and the fraction of non-photosynthetic 642
vegetation components We demonstrated that SIF760-GPPEC relationships scale with temporal 643
aggregation due to a covariance of canopy structure and APAR over the seasonal cycle 644
We suggest going beyond empirical and ecosystem-specific relationships instead 645
using instantaneous observations comprehensively providing information on the full SIF 646
emission vegetation status and functioning as well as environmental conditions in 647
combination with process-based models Such approaches eg suggested for ESArsquos potential 648
ldquoFluorescence Explorerrdquo (FLEX) Earth Explorer mission provide a flexible framework to 649
account for the various influencing factors identified and to successfully apply SIF as 650
constraint of unbiased global GPP estimates 651
Furthermore research is required to improve the comparison between observations of 652
GPPEC and SIF Both observations stem from conceptually contrasting technologies ie 653
measurements of gas exchange vs plant-light interactions and provide independent and 654
complementary access to study ecosystem photosynthesis Despite the need to harmonize 655
horizontally differing footprints the vertical heterogeneity of ecosystems including the 656
27
varying contributions from different ecosystem layers must be better understood to harmonize 657
and successfully integrate both measurements 658
659
Acknowledgements 660
This work was supported by a grant of the Swiss University Conference and ETH-661
Board in frame of the Swiss Earth Observatory Network (SEON) project and by a grant of the 662
European Space Agency (ESA) in frame of the FLEX-PARCS E Paul-Limoges was 663
supported in part by the Natural Sciences and Engineering Research Council of Canada 664
through a postgraduate scholarship We would like to thank the APEX team for acquiring the 665
APEX data Authors sequence is listed following the FLAE approach (doi 666
101371journalpbio0050018) 667
28
References 668
Ammann C Flechard CR Leifeld J Neftel A amp Fuhrer J (2007) The carbon budget of 669
newly established temperate grassland depends on management intensity Agriculture 670
Ecosystems amp Environment 121 5-20 671
Amoros-Lopez J Gomez-Chova L Vila-Frances J Alonso L Calpe J Moreno J amp 672
del Valle-Tascon S (2008) Evaluation of remote sensing of vegetation fluorescence by 673
the analysis of diurnal cycles International Journal of Remote Sensing 29 5423-5436 674
Baker NR (2008) Chlorophyll Fluorescence A probe of photosynthesis in vivo Annual 675
Review of Plant Physiology and Plant Molecular Biology 59 89-113 676
Baldocchi D Falge E Gu LH Olson R Hollinger D Running S Anthoni P 677
Bernhofer C Davis K Evans R Fuentes J Goldstein A Katul G Law B Lee 678
XH Malhi Y Meyers T Munger W Oechel W U KTP Pilegaard K Schmid 679
HP Valentini R Verma S Vesala T Wilson K amp Wofsy S (2001) FLUXNET A 680
new tool to study the temporal and spatial variability of ecosystem-scale carbon dioxide 681
water vapor and energy flux densities Bulletin of the American Meteorological Society 682
82 2415-2434 683
Baldocchi DD (2003) Assessing the eddy covariance technique for evaluating carbon 684
dioxide exchange rates of ecosystems past present and future Global Change Biology 9 685
479-492 686
Balzarolo M Anderson K Nichol C Rossini M Vescovo L Arriga N Wohlfahrt G 687
Calvet J-C Carrara A Cerasoli S Cogliati S Daumard F Eklundh L Elbers JA 688
Evrendilek F Handcock RN Kaduk J Klumpp K Longdoz B Matteucci G 689
Meroni M Montagnani L Ourcival J-M Sanchez-Canete EP Pontailler J-Y 690
Juszczak R Scholes B amp Pilar Martin M (2011) Ground-Based Optical Measurements 691
at European Flux Sites A Review of Methods Instruments and Current Controversies 692
Sensors 11 7954-7981 693
Barcza Z Kern A Haszpra L amp Kljun N (2009) Spatial representativeness of tall tower 694
eddy covariance measurements using remote sensing and footprint analysis Agricultural 695
and Forest Meteorology 149 795-807 696
Barton CVM amp North PRJ (2001) Remote sensing of canopy light use efficiency using 697
the photochemical reflectance index - Model and sensitivity analysis Remote Sensing of 698
Environment 78 264-273 699
Beer C Reichstein M Tomelleri E Ciais P Jung M Carvalhais N Roedenbeck C 700
Arain MA Baldocchi D Bonan GB Bondeau A Cescatti A Lasslop G Lindroth 701
29
A Lomas M Luyssaert S Margolis H Oleson KW Roupsard O Veenendaal E 702
Viovy N Williams C Woodward FI amp Papale D (2010) Terrestrial Gross Carbon 703
Dioxide Uptake Global Distribution and Covariation with Climate Science 329 834-838 704
Berk A Anderson GP Acharya PK Bernstein LS Muratov L Lee J Fox M 705
Adler-Golden SM Chetwynd JH Hoke ML Lockwood RB Gardner JA Cooley 706
TW Borel CC amp Lewis PE (2005) MODTRAN5 A reformulated atmospheric band 707
model with auxiliary species and practical multiple scattering options Proceedings of the 708
Society of Photo-Optical Instrumentation Engineer 5655 662-667 709
Cheng SJ Bohrer G Steiner AL Hollinger DY Suyker A Phillips RP amp 710
Nadelhoffer KJ (2015) Variations in the influence of diffuse light on gross primary 711
productivity in temperate ecosystems Agricultural and Forest Meteorology 201 98-110 712
Cheng Y-B Middleton EM Zhang Q Huemmrich KF Campbell PKE Corp LA 713
Cook BD Kustas WP amp Daughtry CS (2013) Integrating Solar Induced 714
Fluorescence and the Photochemical Reflectance Index for Estimating Gross Primary 715
Production in a Cornfield Remote Sensing 5 6857-6879 716
Collatz GJ Ball JT Grivet C amp Berry JA (1991) Physiological and environmental-717
regulation of stomatal conductance photosynthesis and transpiration - a model that 718
includes a laminar boundary-layer Agricultural and Forest Meteorology 54 107-136 719
DOdorico P Alberti E amp Schaepman ME (2010) In-flight spectral performance 720
monitoring of the Airborne Prism Experiment Applied Optics 49 3082-3091 721
DOdorico P Guanter L Schaepman ME amp Schlaumlpfer D (2011) Performance 722
assessment of onboard and scene-based methods for Airborne Prism Experiment spectral 723
characterization Applied Optics 50 4755-4764 724
Damm A Erler A Gioli B Hamdi K Hutjes R Kosvancova M Meroni M 725
Miglietta F Moersch A Moreno J Schickling A Sonnenschein R Udelhoven T 726
Van der Linden S Hostert P amp Rascher U (2010) Remote sensing of sun induced 727
fluorescence yield to improve modelling of diurnal courses of Gross Primary Production 728
(GPP) Global Change Biology 16 171-186 729
Damm A Erler A Hillen W Meroni M Schaepman ME Verhoef W amp Rascher U 730
(2011) Modeling the impact of spectral sensor configurations on the FLD retrieval 731
accuracy of sun-induced chlorophyll fluorescence Remote Sensing of Environment 115 732
1882-1892 733
Damm A Guanter L Laurent VCE Schaepman ME Schickling A amp Rascher U 734
(2014) FLD-based retrieval of sun-induced chlorophyll fluorescence from medium 735
30
spectral resolution airborne spectroscopy data Remote Sensing of Environment 147 256-736
266 737
Damm A Guanter L Verhoef W Schlaumlpfer D Garbari S amp Schaepman ME (2015) 738
Impact of varying irradiance on vegetation indices and chlorophyll fluorescence derived 739
from spectroscopy data Remote Sensing of Environment 156 202-215 740
Demmig-Adams B (1998) Survey of thermal energy dissipation and pigment composition in 741
sun and shade leaves Plant and Cell Physiology 39 474-482 742
Drolet GG Middleton EM Huemmrich KF Hall FG Amiro BD Barr AG Black 743
TA McCaughey JH amp Margolis HA (2008) Regional mapping of gross light-use 744
efficiency using MODIS spectral indices Remote Sensing of Environment 112 3064-3078 745
Eugster W amp Senn W (1995) A cospectral correction model for measurement of turbulent 746
NO2 fluxes Boundary-Layer Meteorology 74 321-340 747
Eugster W Zeyer K Zeeman M Michna P Zingg A Buchmann N amp Emmenegger 748
L (2007) Methodical study of nitrous oxide eddy covariance measurements using 749
quantum cascade laser spectrometery over a Swiss forest Biogeosciences 4 927-939 750
Falge E Baldocchi D Olson R Anthoni P Aubinet M Bernhofer C Burba G 751
Ceulemans R Clement R Dolman H Granier A Gross P Grunwald T Hollinger 752
D Jensen NO Katul G Keronen P Kowalski A Lai CT Law BE Meyers T 753
Moncrieff H Moors E Munger JW Pilegaard K Rannik U Rebmann C Suyker 754
A Tenhunen J Tu K Verma S Vesala T Wilson K amp Wofsy S (2001) Gap 755
filling strategies for defensible annual sums of net ecosystem exchange Agricultural and 756
Forest Meteorology 107 43-69 757
Falloon P amp Betts R (2010) Climate impacts on European agriculture and water 758
management in the context of adaptation and mitigation-The importance of an integrated 759
approach Science of the Total Environment 408 5667-5687 760
Foken T amp Wichura B (1996) Tools for quality assessment of surface-based flux 761
measurements Agricultural and Forest Meteorology 78 83-105 762
Fournier A Daumard F Champagne S Ounis A Goulas Y amp Moya I (2012) Effect 763
of canopy structure on sun-induced chlorophyll fluorescence Isprs Journal of 764
Photogrammetry and Remote Sensing 68 112-120 765
Frankenberg C Fisher JB Worden J Badgley G Saatchi SS Lee JE Toon GC 766
Butz A Jung M Kuze A amp Yokota T (2011) New global observations of the 767
terrestrial carbon cycle from GOSAT Patterns of plant fluorescence with gross primary 768
productivity Geophysical Research Letters 38 769
31
Gamon JA amp Berry JA (2012) Facultative and constitutive pigment effects on the 770
Photochemical Reflectance Index (PRI) in sun and shade conifer needles Israel Journal of 771
Plant Sciences 60 85-95 772
Gamon JA Coburn C Flanagan LB Huemmrich KF Kiddle C Sanchez-Azofeifa 773
GA Thayer DR Vescovo L Gianelle D Sims DA Rahman AF amp Pastorello 774
GZ (2010) SpecNet revisited bridging flux and remote sensing communities Canadian 775
Journal of Remote Sensing 36 S376-S390 776
Gamon JA Penuelas J amp Field CB (1992) A narrow-waveband spectral index that 777
tracks diurnal changes in photosynthetic efficiency Remote Sensing of Environment 41 778
35-44 779
Garbulsky MF Filella I Verger A amp Penuelas J (2014) Photosynthetic light use 780
efficiency from satellite sensors From global to Mediterranean vegetation Environmental 781
and Experimental Botany 103 3-11 782
Garbulsky MF Penuelas J Papale D Ardo J Goulden ML Kiely G Richardson 783
AD Rotenberg E Veenendaal EM amp Filella I (2010) Patterns and controls of the 784
variability of radiation use efficiency and primary productivity across terrestrial 785
ecosystems Global Ecology and Biogeography 19 253-267 786
Gege P Fries J Haschberger P Schoumltz P Schwarzer H Strobl P Suhr B Ulbrich 787
G amp Vreeling WJ (2009) Calibration facility for airborne imaging spectrometers 788
ISPRS Journal of Photogrammetry amp Remote Sensing 64 387ndash397 789
Gitelson AA amp Gamon JA (2015) The need for a common basis for defining light-use 790
efficiency Implications for productivity estimation Remote Sensing of Environment 156 791
196-201 792
Goetz SJ amp Prince SD (1999) Modelling terrestrial carbon exchange and storage 793
Evidence and implications of functional convergence in light-use efficiency Advances in 794
Ecological Research Vol 28 (pp 57-92) 795
Govindjee (2004) Chlorophyll a fluorescence A bit of basics and history In GC 796
Papageorgiou amp Govindjee (Eds) Chlorophyll a Fluorescence A Signature of 797
Photosynthesis Advances in Photosynthesis and Respiration (pp 1-42) Dordrecht 798
Springer 799
Guanter L Alonso L Gomez-Chova L Amoros-Lopez J Vila J amp Moreno J (2007) 800
Estimation of solar-induced vegetation fluorescence from space measurements 801
Geophysical Research Letters 34 doi 1010292007GL029289 802
32
Guanter L Alonso L Gomez-Chova L Meroni M Preusker R Fischer J amp Moreno 803
J (2010) Developments for vegetation fluorescence retrieval from spaceborne high-804
resolution spectrometry in the O2-A and O2-B absorption bands Journal of Geophysical 805
Research-Atmospheres 115 806
Guanter L Frankenberg C Dudhia A Lewis PE Goacutemez-Dans J Kuze A Suto H amp 807
Grainger R (2012) Retrieval and global assessment of terrestrial chlorophyll fluorescence 808
from GOSAT space measurements Remote Sensing of Environment 121 236-251 809
Guanter L Rossini M Colombo R Meroni M Frankenberg C Lee J-E amp Joiner J 810
(2013) Using field spectroscopy to assess the potential of statistical approaches for the 811
retrieval of sun-induced chlorophyll fluorescence from ground and space Remote Sensing 812
of Environment 133 52-61 813
Guanter L Zhang Y Jung M Joiner J Voigt M Berry JA Frankenberg C Huete 814
AR Zarco-Tejada P Lee J-E Moran MS Ponce-Campos G Beer C Camps-815
Valls G Buchmann N Gianelle D Klumpp K Cescatti A Baker JM amp Griffis 816
TJ (2014) Global and time-resolved monitoring of crop photosynthesis with chlorophyll 817
fluorescence Proceedings of the National Academy of Sciences of the United States of 818
America 111 E1327-E1333 819
Haboudane D Miller JR Pattey E Zarco-Tejada PJ amp Strachan IB (2004) 820
Hyperspectral vegetation indices and novel algorithms for predicting green LAI of crop 821
canopies Modeling and validation in the context of precision agriculture Remote Sensing 822
of Environment 90 337-352 823
Hanan NP Burba G Verma SB Berry JA Suyker A amp Walter-Shea EA (2002) 824
Inversion of net ecosystem CO2 flux measurements for estimation of canopy PAR 825
absorption Global Change Biology 8 563-574 826
Hernandez-Clemente R Navarro-Cerrillo RM Suarez L Morales F amp Zarco-Tejada 827
PJ (2011) Assessing structural effects on PRI for stress detection in conifer forests 828
Remote Sensing of Environment 115 2360-2375 829
Hilker T Coops NC Wulder MA Black TA amp Guy RD (2008) The use of remote 830
sensing in light use efficiency based models of gross primary production A review of 831
current status and future requirements Science of the Total Environment 404 411-423 832
Hilker T Gitelson A Coops NC Hall FG amp Black TA (2011) Tracking plant 833
physiological properties from multi-angular tower-based remote sensing Oecologia 165 834
865-876 835
33
Hilker T Lyapustin A Hall FG Wang Y Coops NC Drolet G amp Black TA 836
(2009) An assessment of photosynthetic light use efficiency from space Modeling the 837
atmospheric and directional impacts on PRI reflectance Remote Sensing of Environment 838
113 2463-2475 839
Hueni A Biesemans J Meuleman K DellEndice F Schlaumlpfer D Adriaensen S 840
Kempenaers S Odermatt D Kneubuehler M Nieke J amp Itten K (2009) Structure 841
Components and Interfaces of the Airborne Prism Experiment (APEX) Processing and 842
Archiving Facility IEEE Transactions on Geoscience and Remote Sensing 47 29-43 843
Hueni A Lenhard K Baumgartner A amp Schaepman M (2013) The APEX (Airborne 844
Prism Experiment - Imaging Spectrometer) Calibration Information System IEEE 845
Transactions on Geoscience and Remote Sensing 51 5169-5180 846
Hueni A Schlaepfer D Jehle M amp Schaepman M (2015) Impacts of Dichroic Prism 847
Coatings on Radiometry of the Airborne Imaging Spectrometer APEX Applied Optics 53 848
5344-5352 849
Imhoff ML Bounoua L Ricketts T Loucks C Harriss R amp Lawrence WT (2004) 850
Global patterns in human consumption of net primary production Nature 429 870-873 851
IPCC (2013) Summary for policymakers Climate change 2013 the physical science basis 852
Cambridge University Press Cambridge United Kingdom and New York NY USA 853
Jacquemoud S amp Baret F (1990) PROSPECT A model of leaf optical properties spectra 854
Remote Sensing of Environment 34 75-91 855
Jehle M Hueni A Damm A DOdorico P Kneubuumlhler M Meuleman K Schlapfer 856
D Schaepman ME amp Weyermann J (2010) APEX - current status performance and 857
validation concept IEEE Sensors 2010 Conference 533-537 858
Joiner J Guanter L Lindstrot R Voigt M Vasilkov AP Middleton EM Huemmrich 859
KF Yoshida Y amp Frankenberg C (2013) Global monitoring of terrestrial chlorophyll 860
fluorescence from moderate spectral resolution near-infrared satellite measurements 861
methodology simulations and application to GOME-2 Atmos Meas Tech Discuss 6 862
3883-3930 863
Jung M Reichstein M Margolis HA Cescatti A Richardson AD Arain MA 864
Arneth A Bernhofer C Bonal D Chen J Gianelle D Gobron N Kiely G Kutsch 865
W Lasslop G Law BE Lindroth A Merbold L Montagnani L Moors EJ 866
Papale D Sottocornola M Vaccari F amp Williams C (2011) Global patterns of land-867
atmosphere fluxes of carbon dioxide latent heat and sensible heat derived from eddy 868
34
covariance satellite and meteorological observations Journal of Geophysical Research-869
Biogeosciences 116 870
Kljun N Kastner-Klein P Fedorovich E amp Rotach MW (2004) Evaluation of 871
Lagrangian footprint model using data from wind tunnel convective boundary layer 872
Agricultural and Forest Meteorology 127 189-201 873
Kljun N Rotach MW amp Schmid HP (2002) A three-dimensional backward lagrangian 874
footprint model for a wide range of boundary-layer stratifications Boundary-Layer 875
Meteorology 103 205-226 876
Knyazikhin Y Schull MA Stenberg P Mottus M Rautiainen M Yang Y Marshak 877
A Latorre Carmona P Kaufmann RK Lewis P Disney MI Vanderbilt V Davis 878
AB Baret F Jacquemoud S Lyapustin A amp Myneni RB (2013) Hyperspectral 879
remote sensing of foliar nitrogen content Proceedings of the National Academy of 880
Sciences of the United States of America 110 E185-E192 881
Kovac D Malenovsky Z Urban O Spunda V Kalina J Ac A Kaplan V amp Hanus 882
J (2013) Response of green reflectance continuum removal index to the xanthophyll de-883
epoxidation cycle in Norway spruce needles Journal of Experimental Botany 64 1817-884
1827 885
Krausmann F Erb K-H Gingrich S Haberl H Bondeau A Gaube V Lauk C 886
Plutzar C amp Searchinger TD (2013) Global human appropriation of net primary 887
production doubled in the 20th century Proceedings of the National Academy of Sciences 888
of the United States of America 110 10324-10329 889
Lasslop G Reichstein M Papale D Richardson AD Arneth A Barr A Stoy P amp 890
Wohlfahrt G (2010) Separation of net ecosystem exchange into assimilation and 891
respiration using a light response curve approach critical issues and global evaluation 892
Global Change Biology 16 187-208 893
Laurent VCE Verhoef W Damm A Schaepman ME amp Clevers JGPW (2013) A 894
Bayesian object-based approach for estimating vegetation biophysical variables from at-895
sensor APEX radiance data Remote Sensing of Environment 139 6-17 896
Lee JE Berry JA Van der Tol C Yang X Guanter L Damm A Baker I amp 897
Frankenberg C (2015) Simulations of chlorophyll fluorescence in corporated into the 898
Community Land Model version 4 Global Change Biology in print 899
Lewis P amp Disney M (2007) Spectral invariants and scattering across multiple scales from 900
within-leaf to canopy Remote Sensing of Environment 109 196-206 901
35
Liu LY amp Cheng ZH (2010) Detection of Vegetation Light-Use Efficiency Based on 902
Solar-Induced Chlorophyll Fluorescence Separated From Canopy Radiance Spectrum Ieee 903
Journal of Selected Topics in Applied Earth Observations and Remote Sensing 3 306-312 904
Louis J Ounis A Ducruet JM Evain S Laurila T Thum T Aurela M Wingsle G 905
Alonso L Pedros R amp Moya I (2005) Remote sensing of sunlight-induced chlorophyll 906
fluorescence and reflectance of Scots pine in the boreal forest during spring recovery 907
Remote Sensing of Environment 96 37-48 908
Maier SW Guumlnther KP amp Stellmes M (2003) Sun-Induced Fluorescence A New Tool 909
for Precision Farming In M McDonald J Schepers L Tartly T van Toai amp D Major 910
(Eds) Digital Imaging and Spectral Techniques Applications to Precision Agriculture 911
and Crop Physiology (pp 209-222) ASA Special Publication 912
Mauder M Foken T Clement R Elbers JA Eugster W Gruenwald T Heusinkveld 913
B amp Kolle O (2008) Quality control of CarboEurope flux data - Part 2 Inter-914
comparison of eddy-covariance software Biogeosciences 5 451-462 915
Meroni M Busetto L Guanter L Cogliati S Crosta GF Migliavacca M Panigada 916
C Rossini M amp Colombo R (2010) Characterization of fine resolution field 917
spectrometers using solar Fraunhofer lines and atmospheric absorption features Applied 918
Optics 49 2858-2871 919
Meroni M Picchi V Rossini M Cogliati S Panigada C Nali C Lorenzini G amp 920
Colombo R (2008) Leaf level early assessment of ozone injuries by passive fluorescence 921
and photochemical reflectance index International Journal of Remote Sensing 29 5409-922
5422 923
Meroni M Rossini M Guanter L Alonso L Rascher U Colombo R amp Moreno J 924
(2009) Remote sensing of solar induced chlorophyll fluorescence review of methods and 925
applications Remote Sensing of Environment doi101016jrse200905003 926
Michaelis L amp Menten ML (1913) The kenetics of the inversion effect Biochemische 927
Zeitschrift 49 333-369 928
Middleton E McMurtney JE Campbell PK Corp LA Butcher LM amp Chappelle 929
EW (2002) Optical and fluorescence properties of corn leaves from different nitrogen 930
regimes In M Owe G Durso amp L Toulios (Eds) Conference on Remote Sensing for 931
Agriculture Ecosystems and Hydrology IV (pp 72-83) Agia Pelagia Greece 932
Miller JR Berger M Goulas Y Jacquemoud S Louis J Moise N Mohammed G 933
Moreno J Moya I Pedroacutes R Verhoef W amp Zarco-Tejada PJ (2005) Development 934
36
of a vegetation fluorescence canopy model Final Report May 2005 In European Space 935
Research and Technology Centre (ESTEC) 936
Monteith JL (1972) Solar-radiation and productivity in tropical ecosystems Journal of 937
Applied Ecology 9 747-766 938
Niinemets U Kollist H Garcia-Plazaola JI Hernandez A amp Becerril JM (2003) Do 939
the capacity and kinetics for modification of xanthophyll cycle pool size depend on growth 940
irradiance in temperate trees Plant Cell and Environment 26 1787-1801 941
Nobel PS Forseth IN amp Long SP (1993) Canopy structure and light interception 942
Ozanne CMP Anhuf D Boulter SL Keller M Kitching RL Korner C Meinzer 943
FC Mitchell AW Nakashizuka T Dias PLS Stork NE Wright SJ amp 944
Yoshimura M (2003) Biodiversity meets the atmosphere A global view of forest 945
canopies Science 301 183-186 946
Parazoo NC Bowman K Fisher JB Frankenberg C Jones DBA Cescatti A Peacuterez-947
Priego Oacute Wohlfahrt G amp Montagnani L (2014) Terrestrial gross primary production 948
inferred from satellite fluorescence and vegetation models Global Change Biology na-na 949
Plascyk JA (1975) MK II Fraunhofer Line Dicsriminator (FLD-II) for airborne and orbital 950
remote-sensing of solar-stimulated luminescence Optical Engineering 14 339-346 951
Porcar-Castell A Tyystjaumlrvi E Atherton J Van der Tol C Flexas J EE P Moreno 952
J Frankenberg C amp Berry JA (2014) Linking chlorophyll a fluorescence to 953
photosynthesis for remote sensing applications mechanisms and challenges Journal of 954
Experimental Botany 65 4065-4095 955
Rascher U Agati G Alonso L Cecci G Champagne S Colombo R Damm A 956
Daumard F De Miguel E Fernandez G Franch B Franke J Gerbig C Gioli B 957
Gomez JA Goulas Y Guanter L Gutierrez-De-La-Camara O Hamdi K Hostert 958
P Jimenez M Kosvancova M Lognoli D Meroni M Miglietta F Moersch A 959
Moreno J Moya I Neininger B Okujeni A Ounis A Palombi L Raimondi V 960
Schickling A Sobrino JA Stellmes M Toci G Toscano P Udelhoven T Van der 961
Linden S amp Zaldei A (2009) CEFLES2 The remote sensing component to quantify 962
photosynthetic efficiency from the leaf to the region by measuring sun-induced 963
fluorescence in the oxygen absorption bands Biogeosciences 6 1181-1198 964
Richter R amp Schlaumlpfer D (2002) Geo-atmospheric processing of airborne imaging 965
spectrometry data Part 2 Atmospherictopographic correction International Journal of 966
Remote Sensing 23 2631-2649 967
37
Rossini M Meroni M Migliavacca M Manca G Cogliati S Busetto L Picchi V 968
Cescatti A Seufert G amp Colombo R (2010) High resolution field spectroscopy 969
measurements for estimating gross ecosystem production in a rice field Agricultural and 970
Forest Meteorology 150 1283-1296 971
Rossini M Nedbal L Guanter L Ač A Alonso L Burkart A Cogliati S Colombo 972
R Damm A Drusch M Hanus J Julitta T Kokkalis P Moreno J Panigada C 973
Pinto F Schickling A Schuumlttemeyer D Zemek F amp Rascher U (2015) Red and far-974
red sun-induced chlorophyll fluorescence as a measure of plant photosynthesis 975
Geophysical Research Letters (accepted for publication) 976
Ruimy A Jarvis PG Baldocchi DD amp B S (1995) CO2 Fluxes over Plant Canopies 977
and Solar Radiation A Review Advances in Ecological Research 26 1-68 978
Running SW Nemani RR Heinsch FA Zhao MS Reeves M amp Hashimoto H 979
(2004) A continuous satellite-derived measure of global terrestrial primary production 980
Bioscience 54 547-560 981
Schaepman ME M J Hueni A DrsquoOdorico P Damm A Weyermann J Schneider F 982
Laurent VCE C P Seidel F Lenhard K Gege P Kuechler C Brazile J Kohler 983
P De Vos L Meuleman K Meynart R Schlaepfer D Kneubuumlhler M amp Itten K 984
(2015) Advanced radiometry measurements and Earth science applications with the 985
Airborne Prism Experiment (APEX) Remote Sensing of Environment 158 207-219 986
Schimel D Pavlick R Fisher JB Asner GP Saatchi S Townsend P Miller C 987
Frankenberg C Hibbard K amp Cox P (2014) Observing terrestrial ecosystems and the 988
carbon cycle from space Global Change Biology na-na 989
Schlaumlpfer D amp Richter R (2002) Geo-atmospheric processing of airborne imaging 990
spectrometry data Part 1 Parametric orthorectification International Journal of Remote 991
Sensing 23 2609-2630 992
Schneider FD Leiterer R Morsdorf F Gastellu-Etchegorry J-P Lauret N Pfeifer N 993
amp Schaepman ME (2014) Simulating imaging spectrometer data 3D forest modeling 994
based on LiDAR and in situ data Remote Sensing of Environment 152 235-250 995
Schroter D Cramer W Leemans R Prentice IC Araujo MB Arnell NW Bondeau 996
A Bugmann H Carter TR Gracia CA de la Vega-Leinert AC Erhard M Ewert 997
F Glendining M House JI Kankaanpaa S Klein RJT Lavorel S Lindner M 998
Metzger MJ Meyer J Mitchell TD Reginster I Rounsevell M Sabate S Sitch 999
S Smith B Smith J Smith P Sykes MT Thonicke K Thuiller W Tuck G 1000
38
Zaehle S amp Zierl B (2005) Ecosystem service supply and vulnerability to global change 1001
in Europe Science 310 1333-1337 1002
Sitch S Smith B Prentice IC Arneth A Bondeau A Cramer W Kaplan JO Levis 1003
S Lucht W Sykes MT Thonicke K amp Venevsky S (2003) Evaluation of ecosystem 1004
dynamics plant geography and terrestrial carbon cycling in the LPJ dynamic global 1005
vegetation model Global Change Biology 9 161-185 1006
Stewart DW Costa C Dwyer LM Smith DL Hamilton RI amp Ma BL (2003) 1007
Canopy structure light interception and photosynthesis in maize Agronomy Journal 95 1008
1465-1474 1009
Trnka M Dubrovsky M amp Zalud Z (2004) Climate change impacts and adaptation 1010
strategies in spring barley production in the Czech Republic Climatic Change 64 227-1011
255 1012
Turner DP Ritts WD Cohen WB Maeirsperger TK Gower ST Kirschbaum AA 1013
Running SW Zhao MS Wofsy SC Dunn AL Law BE Campbell JL Oechel 1014
WC Kwon HJ Meyers TP Small EE Kurc SA amp Gamon JA (2005) Site-level 1015
evaluation of satellite-based global terrestrial gross primary production and net primary 1016
production monitoring Global Change Biology 11 666-684 1017
van der Tol C Berry J Campbell PKE amp Rascher U (2014) Models of fluorescence 1018
and photosynthesis for interpreting measurements of solar-induced chlorophyll 1019
fluorescence Journal of Geophysical Research Biogeosciences IN PRESS 1020
van der Tol C Verhoef W amp Rosema A (2009a) A model for chlorophyll fluorescence 1021
and photosynthesis at leaf scale Agricultural and Forest Meteorology 149 96-105 1022
van der Tol C Verhoef W Timmermans A Verhoef A amp Su Z (2009b) An integrated 1023
model of soil-canopy spectral radiances photosynthesis fluorescence temperature and 1024
energy balance Biogeosciences 6 3109-3129 1025
Verhoef W (1984) Light scattering by leaf layers with application to canopy reflectance 1026
modeling The SAIL model Remote Sensing of Environment 16 125-141 1027
Verhoef W amp Bach H (2003a) Remote sensing data assimilation using coupled radiative 1028
transfer models Physics and Chemistry of the Earth 28 3-13 1029
Verhoef W amp Bach H (2003b) Simulation of hyperspectral and directional radiance 1030
images using coupled biophysical and atmospheric radiative transfer models Remote 1031
Sensing of Environment 87 23-41 1032
39
Verhoef W amp Bach H (2007) Coupled soil-leaf-canopy and atmosphere radiative transfer 1033
modeling to simulate hyperspectral multi-angular surface reflectance and TOA radiance 1034
data Remote Sensing of Environment 109 166-182 1035
Verhoef W Jia L Xiao Q amp Su Z (2007) Unified optical-thermal four-stream radiative 1036
transfer theory for homogeneous vegetation canopies Ieee Transactions on Geoscience 1037
and Remote Sensing 45 1808-1822 1038
Webb EK Pearman GI amp Leuning R (1980) Correction of flux measurements for 1039
density effects due to heat and water-vapour transfer Quarterly Journal of the Royal 1040
Meteorological Society 106 85-100 1041
Wu C Niu Z Tang Q amp Huang W (2010) Revised photochemical reflectance index 1042
(PRI) for predicting light use efficiency of wheat in a growth cycle validation and 1043
comparison International Journal of Remote Sensing 31 2911-2924 1044
Yang X Tang J Mustard JF Lee JE Rossini M Joiner J Munger JW Kornfeld 1045
A amp Richardson AD (2015) Solar-induced chlorophyll fluorescence that correlates with 1046
canopy photosynthesis on diurnal and seasonal scales in a temperate deciduous forest 1047
Geophysical Research Letters 1048
Zarco-Tejada PJ Berni JAJ Suarez L Sepulcre-Canto G Morales F amp Miller JR 1049
(2009) Imaging chlorophyll fluorescence with an airborne narrow-band multispectral 1050
camera for vegetation stress detection Remote Sensing of Environment 113 1262-1275 1051
Zarco-Tejada PJ Gonzalez-Dugo V amp Berni JAJ (2012) Fluorescence temperature and 1052
narrow-band indices acquired from a UAV platform for water stress detection using a 1053
micro-hyperspectral imager and a thermal camera Remote Sensing of Environment 117 1054
322-337 1055
Zarco-Tejada PJ Morales A Testi L amp Villalobos FJ (2013) Spatio-temporal patterns 1056
of chlorophyll fluorescence and physiological and structural indices acquired from 1057
hyperspectral imagery as compared with carbon fluxes measured with eddy covariance 1058
Remote Sensing of Environment 133 102-115 1059
Zhang Q Middleton EM Cheng YB amp Landis DR (2013) Variations of foliage 1060
chlorophyll fAPAR and foliage non-chlorophyll fAPAR (fAPARchl fAPARnonchl) at the 1061
Harvard Forest Ieee Journal of Selected Topics in Applied Earth Observations and Remote 1062
Sensing 6 2254-2264 1063
Zhang Q Middleton EM Gao BC amp Cheng YB (2012) Using EO-1 hyperion to 1064
simulate HyspIRI products for a coniferous forest The fraction of par absorbed by 1065
40
chlorophyll (fAPAR chl) and leaf water content (LWC) Ieee Transactions on Geoscience 1066
and Remote Sensing 50 1844-1852 1067
Zhang Y Guanter L Berry JA Joiner J van der Tol C Huete A Gitelson A Voigt 1068
M amp Koumlhler P (2014) Estimation of vegetation photosynthetic capacity from space-1069
based measurements of chlorophyll fluorescence for terrestrial biosphere models Global 1070
Change Biology 20 3727-3742 1071
1072
41
Appendix-A APEX data calibration 1073
The calibration of APEX images is based on the APEX Processing and Archiving Facility 1074
(PAF) which is the combined software and hardware designed to generate calibrated level 1 1075
at-sensor radiances from APEX raw image streams (Hueni et al 2009) Calibration 1076
coefficients for the radiometric geometric and spectral calibrations are generated from system 1077
calibrations at the APEX Calibration Home Base (CHB) at DLR Oberpfaffenhofen (Gege et 1078
al 2009) These CHB data are stored and processed within the APEX Calibration Information 1079
System (CAL IS) producing the so-called calibration cubes holding coefficients for each 1080
spatio-spectral pixel (Hueni et al 2013) 1081
For the multi-temporal dataset employed within this study all flight lines were 1082
reprocessed from the original raw image streams to ensure that the same version of the 1083
processor was applied The APEX PAF and CAL IS have significantly evolved over the 1084
timeframe of the dataset with calibrations getting more accurate over the years To ensure 1085
consistency all data were calibrated using coefficients obtained in May 2013 1086
The processor was specifically configured to retain the highest information content in 1087
the VNIR channel including i) no spectral resampling to compensate for spectral shifts and 1088
misregistrations (DOdorico et al 2010 DOdorico et al 2011) ii) no compensation of 1089
spectral shift related changes in radiometry (Hueni et al 2015) and iii) no spatial 1090
misregistration correction The calibration was thus effectively reduced to a linear dark 1091
current correction over time a de-smearing of the visible-NIR channel to compensate for 1092
sensor smear effects the application of radiometric gains and offsets followed by a destriping 1093
routine working in the spatial dimension only to remove pushbroom related along track 1094
striping Calibrated radiance data were directly used for the fluorescence retrieval (see Section 1095
24) while the feasibility to use APEX for SIF760 retrievals was theoretically demonstrated in 1096
42
a study of Damm et al (2011) Resulting SIF760 maps were afterwards geo-rectified using a 1097
parametric geocoding approach (Schlaumlpfer and Richter 2002) 1098
43
Appendix-B Retrieval of SIF760 from airborne data 1099
The quantification of SIF measured with ground or airborne-based spectrometers 1100
requires separating emitted SIF from the reflected radiance flux The Fraunhofer Line Depth 1101
(FLD) approach introduced by Plascyk (1975) serves as a de facto standard for medium 1102
resolution instruments such as APEX (Meroni et al 2009) and was applied in our study The 1103
FLD method uses atmospheric absorption bands characterized by lower incident light 1104
compared to wavelength regions outside of these bands This configuration increases the 1105
spectral information and allows the separation of SIF from reflected radiation In this study 1106
we used the broad O2-A oxygen absorption band around 760 nm and quantified the infilling of 1107
SIF760 using radiance measurements inside (subscript i) and outside (subscript o) of the O2-A 1108
band 1109
For the airborne case only atmospheric components can be simulated with 1110
MODTRAN-5 assuming perfect knowledge of the acquisition conditions The reflectance 1111
terms for diffuse and direct irradiance as well as the SIF760 contribution are usually unknown 1112
Assuming Lambertian surface reflectance behavior which introduces some inaccuracies but 1113
allows formulating the radiative transfer (RT) for radiance measurements at sensor level (LAtS) 1114
to obtain SIF760 both measurements inside and outside of the absorption band can be 1115
expressed as 1116
E9FA lang3H IJK LMNrangP QlangRSE rang T UlangVWWH VXWH rang∙langVYYH VYXH rangZH
Hlang[XXH rang T ABCHUlangVWWH ranglangVXWH rangZHlang[XXH rang ] ^ _ (B1) 1117
where E0 is the top-of-atmosphere irradiance including diffuse and direct irradiance 1118
components θil is the illumination zenith angle ρso is the path scattered radiance τss is the 1119
direct transmittance for sunlight τoo is the direct transmittance in view direction τsd is the 1120
diffuse transmittance of the atmosphere for sunlight τdo is the hemispherical-directional 1121
transmittance in view direction and ρdd is the spherical albedo If these atmospheric 1122
44
components are obtained from MODTRAN-5 simulations (Damm et al 2015 Verhoef and 1123
Bach 2003a b 2007) the radiative transfer equation (Eq B1) only contains four unknowns 1124
namely Ri Ro SIFi and SIFo The 3FLD method (Maier et al 2003) which is an adaptation of 1125
the original FLD method proposed by (Plascyk 1975) was used to linearly relate R and SIF 1126
inside and outside of the O2-A absorption band SIF can be finally retrieved with 1127
13 -0 abcMUdWecWlangRff_ rangZghcWUdMecMlangRff^ rangZiUdWecWlangRff_ rangZghUdMecMlangRff^ rangZ j
langVWWM ranglangVXWM rang (B2) 1128
kE lE9FA m lang3HW IJK LMNrangP langRSE rangn ] ^ _ (B3) 1129
E lang3HW IJK LMNrangP langoSSE TopSE rang ∙ langoE opE rang qEprs T Eprt] ^ _ (B4) 1130
r S13rlangoSSr rang T langopSr rang v13S$langoSSS rang T langopSS rangw (B5) 1131
where B is the factor relating SIFi and SIFo and was fixed to a value of 08 justified by 1132
simulations and experiments (Rascher et al 2009 Alonso et al 2008) Xj equals the at-1133
sensor radiance (reflected plus emitted radiation) without path radiance contribution and Ej 1134
expresses surface irradiance as measured at the sensor level A is the factor relating Ri and Ro 1135
and was derived from linear interpolation of R of the left (758 nm) and right (771 nm) O2-A 1136
band shoulder with 1137
xx+ (B6) 1138
y ```-0```z and y `-0`z
```z (B7) 1139
1140
Because APEX suffered from slight spectral smile effects (DOdorico et al 2010) 1141
updated center wavelength positions were involved in the convolution approach The spectral 1142
shift quantification for each pixel across track was based on the Cr method as described in 1143
45
Meroni et al (2010) The method assumes a high correlation between a measured and a 1144
convolved spectrum and iteratively minimizes a cost function which is 1 minus the Pearson 1145
correlation coefficient (r) calculated for both signals Remaining artifacts of the spectral shift 1146
correction and slightly inaccurate estimates of atmospheric properties cause SIF760 retrieval 1147
uncertainties We therefore applied a semi-empirical correction as described in Damm et al 1148
(2014) for each scan line across the track This technique employs reference surfaces which 1149
are free of any SIF760 emission (eg bare soil) to adjust the upward transmittance term inside 1150
the absorption feature oSSr The retrieval of SIF760 from top-of-canopy radiance data measured 1151
on ground follows the same approach as described in Eqs B2-B7 under the assumption that 1152
the surface irradiance can be approximated with the measurement of a reference panel and 1153
that ρso τdo and τdo can be set to 0 Furthermore the spectral resolution of APEX can be 1154
considered suboptimal for SIF760 retrievals although Damm et al (2011) demonstrate that 1155
APEX with its spectral resolution of 54 nm at 760 nm is sensitive for SIF760 However 1156
retrieved SIF760 values are too high and in an absolute sense incorrect We used reference 1157
SIF760 data obtained in parallel to the airborne acquisitions using the ASD field spectrometers 1158
(Section 23) to estimate the actual offset The observed scaling factor of 193 was afterwards 1159
applied to the retrieved SIF760 values to transfer them to a realistic value range 1160
46
Appendix-C SIF retrieval accuracy 1161
We applied a quantitative accuracy evaluation of resulting SIF760 maps using ground 1162
measured SIF760 values (Figure C1) Considering all reference data acquired during five 1163
campaigns a good linear relationship was achieved between ground and airborne-based 1164
SIF760 values (r2 = 071) but with a proportionality factor much higher than 1 (Figure C1-A) 1165
This experimentally obtained systematic overestimation of APEX SIF760 is comparable to 1166
simulation results documented in Damm et al (2011) Further we found slightly changing 1167
correlations between the different years (several linear models in Figure C1-A) which are 1168
likely caused by canopy structural effects spectral and radiometric performances of used 1169
ground instruments or slight deviations of the performance of APEX over time 1170
To compensate for the overestimation of APEX SIF760 we applied an empirical correction 1171
factor of 193 derived from the comparison of reference data and APEX which resulted in a 1172
rRMSE of 289 (Figure C1-B) 1173
1174
lt Figure C1 gt 1175
1176
The Laegeren site was covered with three adjacent flight lines having an overlap of 1177
approximately 10 (cf Figure 3) This configuration provides the opportunity to 1178
quantitatively evaluate the consistency of SIF retrievals obtained from different measurements 1179
and view zenith angles (ie plusmn 135deg) The comparison of SIF760 retrievals obtained from flight 1180
lines 1 and 2 reveals a moderate linear relationship for homogeneous agricultural surfaces (r2 1181
= 081 rRMSE = 57) We observed a systematic underestimation of flight line 1 compared 1182
to flight line 2 (factor 06) for a view zenith angle difference of ~26deg for SIF760 indicating 1183
either a directionality of SIF760 emissions or an insufficient decoupling of surface HCRF 1184
affected by reflectance anisotropy With increasing surface heterogeneity scattering increases 1185
47
and the agreement of retrieved SIF from both flight lines slightly decreases (ie for forested 1186
areas r2 of 05 and rRMSE of 88) This lower correlation can be mainly associated to slight 1187
geometric mis-registrations (ie max 2 pixel ~ 40 m) in combination with surface 1188
heterogeneity (eg shaded and sunlit tree crowns) and emission anisotropy of SIF760 Also 1189
negative SIF760 values are present in the SIF760 maps and caused by sensor noise and 1190
especially for forests due to shadowing effects (Damm et al 2015) 1191
48
Appendix-D Technical aspects determining the SIF760 retrieval accuracy 1192
A rigorous evaluation of the SIF760 retrieval accuracy is crucial to judge the reliability 1193
of our assessment on the relationship between SIF760 and GPPEC across ecosystems 1194
Furthermore additional factors imposing variations on SIF760 retrieved from airborne 1195
spectroscopy data that cannot be related to the physiological origin of SIF760 needs to be 1196
critically discussed to justify the proposed approach 1197
Ground-based measurements of SIF760 were made using field spectrometers to validate 1198
the airborne retrievals Field spectroscopy provides a good reference for validating airborne 1199
retrievals as it is likely not affected by biases resulting from atmospheric composition 1200
estimates (eg aerosol load) due to the simultaneous measurement of irradiance fluxes at 1201
canopy level using a reference panel The reliability of the applied field spectroscopic 1202
approach to measure SIF760 was previously demonstrated using field studies (Damm et al 1203
2010 Liu and Cheng 2010 Meroni et al 2009 Rascher et al 2009) and theoretical 1204
assessments (Damm et al 2011) It must be noted that field spectroscopic approaches are 1205
subject to uncertainties particularly for heterogeneous vegetation canopies Damm et al 1206
(2015) discussed retrieval errors caused by illumination effects likely introducing slight 1207
errors in reference SIF760 This source of uncertainty must be considered when judging the 1208
accuracy of APEX SIF760 The nevertheless good agreement between ground and airborne 1209
observations indicated that atmospheric absorption and scattering effects could be sufficiently 1210
compensated and thus demonstrated the reliability of retrieved SIF760 measurements In 1211
particular the empirical correction applied making use of high spatial resolution airborne IS 1212
data in combination with reference surfaces not emitting SIF760 allowed to bypass retrieval 1213
uncertainties caused by atmospheric effects (Damm et al 2014) 1214
Instrumental effects in combination with retrieval methods were found to cause 1215
systematic differences in SIF760 retrievals (Damm et al 2011) the comparatively low 1216
49
resolution of APEX around the O2-A band used to retrieve SIF760 (ie ~54 nm) resulted in an 1217
overestimation of APEX SIF760 compared to retrievals from high resolution instruments 1218
Indeed maximum APEX SIF760 values are 6 mW m-2 sr-1 nm-1 while typical SIF760 values 1219
obtained from high resolution instruments range between 0 and 3 mW m-2 sr-1 nm-1 (Guanter 1220
et al 2013) Considering SIF760 values retrieved from ASD data in original resolution (3 nm) 1221
APEX showed an overestimation of 1102 which confirmed that low spectral resolution 1222
resulted in an overestimation of SIF760 The reasoning for this absolute error is given by the 1223
sub-optimal spectral resolution of APEX with 54 nm at 760 nm causing a reduced sensitivity 1224
for SIF760 on the one hand and a wider distance of the O2-A shoulder values used to 1225
parameterize the 3FLD approach on the other hand The bias was corrected using the ASD 1226
reference data and does not impact the results of our analysis Further the relative variation of 1227
SIF760 is unaffected by the bias 1228
Surface heterogeneity complicates the retrieval of SIF760 According to Damm et al 1229
(2015) SIF760 retrievals for forest sites are especially subject to uncertainties due to 1230
assumptions on surface irradiance Crown shapes and associated surface orientations 1231
determine the intensity and quality of irradiance including fractional amounts of diffuse and 1232
direct irradiance To account for pixel wise changes in surface irradiance high resolution 1233
digital object models (DOM) (eg derived from LiDAR observations) are required In 1234
absence of such a high resolution DOMrsquos crowns are assumed to be flat which results in 1235
uncertainties of up to 58 in case of cast shadows (Damm et al 2015) Since we used 1236
averaged observations over larger areas representing flux tower footprints and most of our 1237
data were flown under comparable illumination conditions (ie around solar noon) we 1238
expect these potential biases to be less influential in this analysis 1239
1
Tables 1
Table 1 Date and time of APEX flights and corresponding eddy covariance flux tower 2
measurements for the three investigated ecosystems (ie grassland cropland mixed 3
temperate forest) 4
Date Time [UTC] Location Ecosystem Flux tower
17062009 950 Laegeren forest 1 tower
17062009 1030 Oensingen cropland 1 tower
17062009 1030 Oensingen grassland 2 tower
25062010 1030 Oensingen cropland 1 tower
25062010 1030 Oensingen grassland 2 tower
26062010 1500 Laegeren forest 1 tower
26062010 1030 Oensingen cropland 1 tower
26062010 1030 Oensingen grassland 2 tower
29062010 1030 Laegeren forest 1 tower
26062011 1030 Laegeren forest 1 tower
28062011 1030 Oensingen cropland 1 tower
28062011 1030 Oensingen grassland 1 tower
16062012 1025 Laegeren forest 1 tower
16062012 900 Oensingen cropland 1 tower
16062012 1100 Oensingen cropland 1 tower
12072013 730 Laegeren forest 1 tower
03092013 1050 Laegeren forest 1 tower
5
2
Table 2 Availability of reference SIF760 data obtained from field spectroscopy measurements 6
to validate APEX based SIF760 retrievals 7
Date time [UTC] Location Measured crops Nr points
17062009 1030 Oensingen maize rye pea sugar beet wheat white clover 29 points
25062010 1030 Oensingen maize pea sugar beet wheat white clover 15 points
16062012 900 Oensingen carrot maize winter wheat 11 points
16062012 1100 Oensingen carrot maize winter wheat 10 points
8
3
Table 3 Goodness of fit for the hyperbolic model describing the relationship between GPPEC 9
and SIF760 O PRI and MCARI2 for the three ecosystem types perennial grassland cropland 10
and mixed temperate forest Calculated statistics are based on all data acquired from 2009-11
2013 as described in Table 1 12
Optical variable Ecosystem Regression coefficient Relative RMSE []
SIF crops 088 355
grass 059 2708
forest 048 1588
PRI crops 0008 1176
grass 095 860
forest 009 2179
MCARI2 crops 0005 1029
grass 098 550
forest 034 1798
13
1
Figures 1
2
Figure 1 Study sites A Oensingen agricultural site B Laegeren forest site The white 3
rectangles represent in A the boundary of investigated fields that comprise most of the flux-4
tower footprints and in B a coarse outline of the footprint area of the flux-tower The white 5
crosses show the locations of the flux-towers Background RGB images from Google-Earth 6
2
7
Figure 2 APEX reflectance and SIF760 image for the Oensingen site acquired on the 2606 8
2010 1030 UTC A top-of-canopy hemispherical-conical reflectance data as true color 9
composite B SIF760 map The white boxes indicate the approximate position of the flux 10
tower 11
3
12
Figure 3 APEX reflectance and SIF760 image for the Laegeren site acquired on the 2606 13
2010 1510 UTC A top-of-canopy hemispherical-conical reflectance data as true color 14
composite B SIF760 map The black arrows indicate the flight direction of flight line 1 to 3 15
(FL1-FL3) The white line marks a transect along the overlapping region of FL1 and FL2 The 16
white boxes indicate the approximate position of the flux tower 17
4
18
Figure 4 Relationships between GPPEC from the eddy-covariance measurements and SIF760 O 19
instantaneously measured between 2009 and 2013 (see Table 1) with the airborne 20
spectrometer APEX (A) PRI index (B) and MCARI2 index (C) for three vegetation types 21
(black dots perennial grassland dark grey rectangles cropland including winter wheat pea 22
and barley grey triangles mixed temperate forest) The solid curves correspond to a 23
hyperbolic model fitted to the measured data The dashed curves show the extrapolated 24
behavior 25
5
26
Figure 5 Daily light response curves from eddy flux measurements for A cropland B 27
perennial grassland and C mixed temperate forest Data were acquired between 2009 and 28
2013 (see Table 1) Grey curves represent a fitted hyperbolic model to approximate the 29
behavior of measured PAR-GPP values Crosses show GPPEC measurements that were used 30
for the SIF760 O - GPPEC comparison based on the time of APEX flights PAR values are 31
binned in 20 mW m-2
sr-1
nm-1
increments 32
6
33
Figure 6 Leaf level relationships between photosynthetic (LUEp) and fluorescence yield 34
(LUEf) for a typical C3 crop Dependency of LUEp (A) and LUEf (B) on APAR C 35
Relationship between LUEp and LUEf D Relationship between APAR and GPPL GPPL was 36
calculated as APARLUEp E Relationship between APAR and SIF760 SIF760 was calculated 37
as APARLUEf assuming a constant relationship between the SCOPE output SIFtotalL 38
(integral between 640-850nm) and SIF760L F Relationship between SIF760 L and GPPL All 39
data were simulated using SCOPE The grey areas indicate illumination conditions 40
comparable to APEX flights 41
7
42
Figure 7 Canopy level relationships between photosynthetic (LUEp) and fluorescence yield 43
(LUEf) for different canopy representations of a C3 cropland in SCOPE Dependency of 44
LUEp (A) and LUEf (B) on APAR LUEp was calculate as GPPCAPAR and LUEf was 45
directly obtained from SCOPE C Relationship between LUEp and LUEf D Relationship 46
between APAR and GPPC GPPC was directly obtained from SCOPE E Relationship 47
between APAR and SIF760C SIF760C was directly obtained from SCOPE F Relationship 48
between SIF760C and GPPC The black dashed line corresponds to a C3 cropland with LAI = 49
30 fraction of brown pigments (Cs) = 00 and a spherical (sp) leaf inclination distribution 50
function (LIDF) For the grey line Cs was changed to 20 for the black dashed line the LAI 51
was changed to 10 and for the grey dasheddotted line the LIDF was changed to plagiophile 52
(pg) The grey areas indicate illumination conditions comparable to APEX flights 53
8
54
Figure 8 Impact of temporal scaling on the SIF760C-GPPC relationship SIF760C and GPPC 55
data were simulated using SCOPE Model input parameters air temperature (A) PAR (B) and 56
LAI (C) were measured within the NitroEurope project (httpwwwnitroeuropeeu) at the 57
Speulderbos forest site Netherlands D Relationship between SIF760C and GPPC including a 58
fitted hyperbolic model for daily averages (grey dots and grey line) monthly averages (dark 59
grey triangles and line) and quarterly data (black dots and black dashed line) 60
9
61
Figure C1 Comparison of ground and airborne-based SIF760 retrievals from various crops 62
Data were acquired during four campaigns between 2009 and 2012 in the agricultural site 63
Oensingen (see Table 2) Left Fitted linear regression lines for the four considered campaigns 64
are overlaid in black The dashed line corresponds to the 11 line Right SIF retrievals from 65
APEX after applying an empirical correction factor (193) The black line represents the fitted 66
linear model the dashed line corresponds to the 11 line 67
6
estimates for GPP at ecosystem or continental scales (Garbulsky et al 2014 Guanter et al 126
2012 Parazoo et al 2014) 127
Considering the above listed mechanisms several aspects need to be addressed to 128
further exploit SIF as a robust constraint for estimating GPP We therefore aim at 129
investigating the functional information content of SIF and its link to GPP considering three 130
structurally and physiologically contrasting ecosystems ie cropland perennial grassland 131
and mixed temperate forest We use an innovative combination of multi-temporal imaging 132
spectroscopy (IS) data EC flux tower observations and modeling approaches at the leaf and 133
canopy levels i) to assess the relationship between far red SIF retrieved in the O2-A band at 134
760 nm (SIF760) and GPP across ecosystems and ii) to investigate the impact of confounding 135
factors on the SIF760-GPP relationship ie temporal scaling effects and structural and 136
physiological interferences using a photosynthesis model Our findings contribute to a better 137
understanding of the information inherent in remotely measured SIF760 and its functional 138
relationship to GPP Aspects discussed will help bridging the gap between small scale studies 139
and observational attempts to estimate GPP globally 140
141
2 Methods 142
21 Study sites 143
We investigated three contrasting ecosystems located on the Central Swiss Plateau in 144
terms of structure heterogeneity species composition and annual productivity Two of these 145
ecosystems were collocated in the agricultural area near the town of Oensingen (47deg1711rdquo N 146
7deg4401rdquo E 452 masl Figure 1A) This area is characterized by relatively small agricultural 147
parcels with grassland clover fallow cropping bean maize rapeseed pea sugar beet winter 148
barley and winter wheat rotating as dominant crops Two grassland fields differently 149
managed in terms of species composition fertilization and harvesting activities (Ammann et 150
7
al 2007) were investigated as representatives of the ecosystem type perennial grassland as 151
well as a cropland (one field with arable crop rotation) for the ecosystem type cropland The 152
forest area (47deg2842rdquo N 8deg2152rdquo E Figure 1B) is located on the south-facing slope of the 153
Laegeren mountain northwest of the city of Zurich The temperate mixed forest is 154
characterized by a relatively high species diversity and a complex canopy structure with 155
beech ash sycamore and spruce being the dominant species (Eugster et al 2007 Schneider 156
et al 2014) 157
158
lt Figure 1 gt 159
160
Both test sites are well instrumented (ie with eddy-covariance flux towers 161
micrometeorological stations) and were extensively sampled during several airborne 162
campaigns between 2009 and 2013 (Table 1) 163
164
lt Table 1 gt 165
166
22 Airborne spectroscopy 167
All three study sites were measured with the Airborne Prism EXperiment (APEX) 168
sensor on several days between 2009 and 2013 (Table 1) APEX is an airborne dispersive 169
pushbroom imaging spectrometer covering the 400-2500 nm spectral region in 313 narrow 170
continuous spectral bands APEX allows capturing the O2-A atmospheric absorption feature 171
and thus retrieving SIF760 with a spectral sampling interval of 45 nm a full width at half 172
maximum (FWHM) of 57 nm and a signal to noise ratio of approximately 450 in and 800 173
outside of the O2-A feature for a 50 reflective target and a sun zenith angle of 30deg (Jehle et 174
al 2010 Schaepman et al 2015) 175
8
Radiance calibration of APEX images is performed using the approach of Hueni et al 176
(2009) Multitemporal comparison of images is secured by using consistent calibration and 177
processing versions Precise retrievals of SIF typically require data measured in sub-178
nanometer spectral resolution However the feasibility of using APEX like instruments (ie 179
FWHM ~5nm) for SIF760 retrievals was theoretically assessed in Damm et al (2011) and 180
experimentally demonstrated in recent work (Zarco-Tejada et al 2009 Zarco-Tejada et al 181
2013) The use of calibrated APEX radiance data for the fluorescence retrieval is described in 182
Section 24 and Appendix-B Vegetation indices (see Section 25) were calculated using 183
Hemispherical-Conical-Reflectance-Factor data obtained after atmospheric correction using 184
ATCOR-4 (Richter and Schlaumlpfer 2002) Resulting SIF760 and vegetation indices were 185
projected in the same map projection using parametric geocoding (Schlaumlpfer and Richter 186
2002) Details about APEX data calibration are listed in Appendix-A 187
188
23 Field spectroscopy 189
ASD (PANalytics Boulder US) field spectrometer data were acquired for validation 190
purposes within one hour of the APEX overflight during four campaigns In total 23 191
agricultural fields covering various crops including carrot maize pea rye sugar beet wheat 192
white clover were systematically sampled by measuring reflected and emitted radiances in 193
four homogeneous 3 m2 plots per field (Table 2) Incident light was quantified before and 194
after measuring each plot using a Spectralon reference panel 195
196
lt Table 2 gt 197
198
24 SIF760 retrieval 199
Emitted SIF was analytically separated from the reflected radiance flux measured with 200
ground and airborne-based spectrometers (see Appendix-B) We applied the Fraunhofer Line 201
9
Depth (FLD) approach (Plascyk 1975) which serves as a standard for SIF retrievals using 202
medium resolution instruments (Meroni et al 2009) The FLD method uses atmospheric 203
absorption bands characterized by lower incident light compared to wavelength regions 204
outside of these bands This configuration allows evaluating the in-filling of the absorption 205
bands by SIF (Damm et al 2014) In this study we used the broad O2-A oxygen absorption 206
band around 760 nm for the SIF760 retrieval For the ground data surface irradiance was 207
estimated from white reference measurements while perturbing atmospheric absorption and 208
scattering effects were assumed to be negligible on the 1 m pathway between canopy and 209
sensor (cf Damm et al (2014) for details on the set-up for SIF760 retrieval on the ground) 210
For the airborne measurements we compensated atmospheric absorption and scattering using 211
the atmospheric radiative transfer model MODTRAN5 (Berk et al 2005) Details of the 212
SIF760 retrievals using airborne data are provided in Appendix-B 213
214
25 Derivation of additional spectral indices 215
The relationship between two vegetation indices and GPP was investigated in parallel 216
to judge the performance of the new remote observation of SIF compared to commonly used 217
remote sensing approaches The photochemical reflectance index (PRI) (Gamon et al 1992) 218
was found to be sensitive to pigment changes related to the xanthophyll cycle and is 219
frequently used to quantify LUEp and GPP (Cheng et al 2013 Drolet et al 2008 Hilker et al 220
2009) The PRI was calculated as 221
(3) 222
while Rλ accounts for the surface reflectance at the wavelength λ 223
We further tested the soil adjusted Modified Chlorophyll Absorption Ratio Index 2 224
(MCARI2) (Haboudane et al 2004) that was found to be strongly related to green LAI thus 225
potential photosynthesis and is calculated as 226
10
2 $amp($)$+-amp0 (4) 227
228
26 Eddy-covariance measurements 229
Continuous turbulent fluxes of CO2 were measured at the agricultural and forest sites 230
between 2009 and 2013 using the EC technique (Baldocchi 2003) At each site the EC 231
instrumentation consisted of an open-path infrared gas analyzer (IRGA) (model LI-7500 LI-232
COR Inc Lincoln NE USA) and a three-dimensional sonic anemometer-thermometer 233
(models HS R3 and R2 Gill Instruments Lymington UK) EC measurements were made at a 234
frequency of 20 Hz and processed to half-hourly averages using the eth-flux EC software for 235
the forest and cropland (Mauder et al 2008) or a comparable custom-made EC software for 236
the grassland (Ammann et al 2007) Post-processing included corrections for damping losses 237
(Eugster and Senn 1995) air density fluctuations (Webb et al 1980) data screening for 238
optical sensor contamination stationary or low turbulence conditions (Foken and Wichura 239
1996) and statistical outliers Standardized gap filling and partitioning of CO2 fluxes was 240
performed using the methodology from Lasslop et al (2010) for the forest and cropland and 241
using the methodology from Falge et al (2001) for the grassland Measurements of 242
photosynthetic photon flux density (PPFD) quantified in micromol m-2 s-1 were converted to 243
radiance units (mW m-2 sr-1 nm-1) representing the photosynthetic active radiation (PAR) to 244
be consistent with Monteithrsquos LUE concept and the SIF radiance units 245
246
27 Leaf area index measurements 247
The Leaf Area Index (LAI) of the grassland and cropland was measured at the time of 248
APEX flights using an optical non-destructive approach based on LAI-2000 leaf area meter 249
observations (Li-Cor Lincoln USA) The LAI of the forest was estimated using digital 250
11
hemispherical photographs at two subplots following the VALERIE sampling scheme while 251
subsequent analysis were applied to obtain the LAI (Schneider et al 2014) 252
253
28 Statistical analysis of SIF760 - GPP relationship 254
SIF760 values were manually extracted from APEX-SIF760 maps for areas representing 255
the footprint of eddy-flux measurements (Figure 1) For the perennial grassland and cropland 256
we selected all pixels with SIF760 values ge 0 mW m-2 sr-1 nm-1 in respective fields although the 257
EC tower footprint can be slightly smaller than the entire field The increased number of 258
resulting pixels allows reducing data noise and covering small spatial variations within the 259
footprint Using the pixels of the entire field is justified by the large homogeneity of the 260
underlying fields (Figure 1A) For the forest site Laegeren all pixels representing an area that 261
covered 70 of all footprint occurrences were selected irrespective of spatial footprint 262
changes due to changing wind conditions Using the same area for all years reduces variations 263
in SIF due to changes in biomass and canopy structure but also reduces the representativeness 264
of selected pixels for actual spatial EC footprints 265
We used a hyperbolic model to relate GPP to SIF760 and to both vegetation indices 266
Although the hyperbolic model only empirically approximates the data behavior it is 267
supported by theoretical arguments for the SIF760-GPP relationship that are outlined hereafter 268
The photosynthetic efficiency LUEp is often described as a hyperbolic function of APAR 269
following the Michaelis-Menten theory (Michaelis and Menten 1913) 270
∙123467899 (5) 271
where c is a coefficient in radiance units and LUEpmax c represents GPPmax Following Eqs 272
(1) and (5) GPP rises asymptotically with APAR to GPPmax This equation is used in many 273
models for partitioning GPP eg Falge et al (2001) Substituting LUEp from Eq (5) and 274
APAR = SIF760 (LUEf fesc) from Eq (2) into Eq (1) results in 275
12
lt= gtampABCampD (6) 276
where the coefficient b represents cLUEffesc accounting for the difference between LUEp 277
and LUEf GPPmax is a value that is asymptotically reached representing the photosynthetic 278
capacity or GPP of the canopy at light saturation It must be noted that Eq (6) is a 279
simplification of the complex relationships between GPP and SIF760 and thus performs best if 280
c LUEf fesc remains constant or SIF760 corresponds to APAR A constant LUEf is a 281
reasonable first approximation for vegetation that is only moderately stressed meaning that 282
variations in LUEf are substantially smaller than variations in LUEp (van der Tol et al 2014) 283
Moderate stress relates to any kind of environmental conditions (warm temperature strong 284
irradiance reduced water availability) that cause only short term and slight changes in 285
photochemical and non-photochemical protections However c and fesc are known to vary 286
across ecosystems and LUEf changes under environmental stress In order to evaluate their 287
impacts on the SIF-GPP relationships as expressed in Eq (6) we carried out simulations with 288
the Soil-Canopy Observations of Photosynthesis and Energy balance model SCOPE version 289
153 (van der Tol et al 2009b) (see Section 29) The goodness of fit for the hyperbolic model 290
was quantified using non-linear regression analysis and was quantitatively described using the 291
root mean square error normalized by the mean of measured data (rRMSE) and the coefficient 292
of determination R2 defined as the correlation between data and the best fit-curve determined 293
by non-linear regression 294
295
29 SCOPE simulations 296
SCOPE uses semi-empirical models for LUEp (Collatz et al 1991) and LUEf (van der 297
Tol et al 2014) embedded in a radiative transfer scheme for the canopy (van der Tol et al 298
2009b) The radiative transfer model at leaf level (Fluspect) is an extension of PROSPECT 299
(Jacquemoud and Baret 1990) and includes a fluorescence component The radiative transfer 300
13
within the canopy is calculated following Verhoef (1984) in the optical domain (SAIL) 301
following Verhoef et al (2007) in the thermal domain and Miller et al (2005) for the 302
fluorescence emissions (FluorSAIL) SCOPE requires a number of vegetation structural and 303
physiological parameters as well as weather information as input The model simulates GPP 304
and spectrally distributes SIF with a spectral resolution and a spectral sampling interval of 10 305
nm each Simulated PPFD values (micromol m-2 s-1) were also converted to radiance units (PAR) 306
We carried out three simulations using SCOPE In the first simulation we calculated 307
leaf level LUEf and LUEp of a typical C3 cropland as function of varying APAR For the 308
second simulation at canopy level we calculated LUEf and LUEp as function of varying 309
APAR for differently structured canopies We took the standard SCOPE parameters for a 310
typical C3 cropland and varied APAR and the structural parameters LAI leaf inclination 311
angle (LIDF) and the fraction of brown pigments (Cs) Both simulation experiments provide 312
theoretical evidence on the relationships between LUEf and LUEp between SIF760 and GPP 313
and their respective relationships to APAR For the third canopy level simulation SCOPE 314
was initialized using time series of mid-day (solar noon) meteorological data (PAR air 315
temperature) a seasonal cycle of LAI and the modelrsquos default soil and vegetation parameters 316
for a C3 cropland (cf the SCOPE user manual) The purpose of this simulation was to 317
evaluate seasonal SIF760-GPP relationships at various temporal aggregation levels For better 318
readability we use the following notation through the manuscript SIF760 O for APEX-SIF 319
SIF760 L and SIF760 C for SCOPE simulated leaf and canopy SIF GPPEC for flux tower GPP 320
and GPPL GPPC to relate to simulated GPP at leaf and canopy level 321
322
3 Results 323
31 SIF760 maps 324
14
Two examples of SIF760 O maps obtained from APEX are shown in Figures 2 and 3 325
The appearance of SIF760 O emissions in vegetated areas demonstrates that measured SIF760 O 326
signals originated solely from vegetation and were not contaminated by non-fluorescent non-327
vegetation surfaces Retrieved SIF760 O values range between 0 and 3 mW m-2 sr-1 nm-1 and 328
showed a high agreement (r2 = 07 rRMSE = 289) with in-situ measured reference data 329
Details of the SIF760 O validation are discussed in Appendix-C 330
331
lt Figure 2 gt 332
lt Figure 3gt 333
334
32 Relationships of GPPEC with SIF760 O PRI and MCARI2 335
Relating instantaneous measurements of SIF760 O and GPPEC from several years 336
revealed an asymptotic relationship with saturating GPPEC in presence of moderate to high 337
SIF760 O (Figure 4A Table 3) This general behavior was consistent for all investigated 338
vegetation types The fitted hyperbolic model shows a moderate to high goodness of fit for the 339
grassland (R2 = 059 rRMSE = 271) cropland (R2 = 088 rRMSE = 35) and forest (R2 = 340
048 rRMSE = 1588) The saturation of GPPEC appeared earlier for the cropland (SIF760 O 341
~05 mW m-2 sr-1 nm-1) than for the grassland and forest (SIF760 O gt 10 mW m-2 sr-1 nm-1) An 342
independent assessment considering a linear model to describe the relationship between 343
SIF760 O and GPPEC revealed a consistently lower goodness of fit justifying the use of a 344
hyperbolic model (data not shown) 345
Statistical analysis showed that a hyperbolic model represents well the relationship 346
between both vegetation indices (PRI and MCARI2) and GPPEC for the grassland with a 347
notable variation in LAI (range between 05 and 48 m2 m-2) However a hyperbolic model 348
does not allow well representing the relationship between PRI and MCARI2 with GPPEC for 349
the forest and cropland both showing only a small variation in LAI (less than plusmn03 m2 m-2) 350
15
(Figure 4B-C Table 3) The goodness of fit for the hyperbolic model describing the PRI and 351
GPPEC data for grassland (R2 = 095 rRMSE = 86) was even higher compared to SIF760 O 352
but lower for forest (R2 = 009 rRMSE = 2179) and cropland (R2 = 0008 rRMSE = 353
1176) With MCARI2 the goodness of fit for the hyperbolic model for grassland was high 354
(R2 = 098 rRMSE = 55) but low for cropland (R2 = 0005 rRMSE = 1029) and forest 355
(R2 = 034 rRMSE = 1798) Again considering a linear relationship between both 356
vegetation indices and GPPEC revealed no consistent improvement compared to the use of a 357
hyperbolic model (data not shown) 358
359
lt Figure 4 gt 360
lt Table 3 gt 361
362
33 Assessment of factors determining SIF760 GPPEC relationships 363
The asymptotic relationship between SIF760 O and GPPEC (Figure 4A) represented 364
instantaneous measurements of different canopies at different times and days over several 365
years covering a range of different light conditions phenological stages of the forest and 366
various amounts of green biomass for both investigated grasslands (crosses in Figure 5A-C 367
that indicate EC measurements during APEX overpasses) Relationships between SIF760 O and 368
GPPEC are consequently a complex function of light absorption in the canopy (APAR) of the 369
efficiency of light utilization (ie expressed as photosynthetic capacity and quantum 370
efficiency of photosynthesis) and of structural effects including fractions of non-371
photosynthetic vegetation components Both grass canopies were measured before and after 372
mowing resulting in a large range in LAI (05-48 m2 m-2) and GPPEC (4-27 micromol m-2 s-1) for 373
similar PAR values The forest LAI of 50 m2 m-2 was more constant over the years due to the 374
consistent timing of flights however senescence (eg lower canopy chlorophyll content and 375
light absorption) might explain the decrease in GPPEC of 15 micromol m-2 s-1 in September for 376
16
comparable irradiance conditions (Figure 5C) Investigated crops (winter wheat barley and 377
pea) were characterized by small variations in LAI (22-25 m2 m-2) and chlorophyll contents 378
corresponding to small variations in GPPEC (5 micromol m-2 s-1) while observed under comparable 379
irradiance conditions During the time of observation the barley and wheat canopies were in 380
the ripening phase with a pronounced ear layer 381
382
lt Figure 5 gt 383
384
The validity of the asymptotic relationship between SIF760 O and GPPEC was tested 385
using simulations made with the SCOPE model We emphasize that the regression coefficient 386
b in Eq (6) includes terms that vary in the model (b= cmiddotLUEfmiddotfesc) the fluorescence efficiency 387
LUEf varies with irradiance conditions (predominantly APAR) the fraction fesc depends on 388
vegetation structure while c=GPPmaxLUEpmax varies between sites and over time during the 389
season We first analysed how LUEf and LUEp and consequently SIF760 and GPP vary at 390
leaf (ie SIF760 L and GPPL) and canopy levels (ie SIF760 C and GPPC) using the model of 391
van der Tol et al (2014) that is embedded in SCOPE For the leaf level Figure 6A shows a 392
decrease of LUEp with increasing APAR consistent with Eq (5) The relation between APAR 393
and LUEf appears more complex LUEf first increases with increasing APAR under low light 394
conditions reaches a climax at intermediate light and then decreases with increasing APAR 395
under higher APAR values (gt 50 mW m-2 sr-1 nm-1) (Figure 6B) The initial increase in LUEf 396
is caused by the decline in photochemical quenching of the excitons whereas the decrease of 397
LUEf is caused by the growing number of non-photochemical quenching traps that dissipate 398
light energy before it can be emitted as fluorescence light (van der Tol et al 2009a) It is 399
important to note that the range of LUEp is nearly an order of magnitude greater compared to 400
the range of LUEf (Figure 6C) Although LUEf is not constant we can still conclude that the 401
difference in both LUE terms causes an earlier saturation of leaf-level GPPL (Figure 6D) 402
17
compared to leaf-level SIF760 L (Figure 6E) with APAR leading to an asymptotic relationship 403
between SIF760 L and GPPL (Figure 6F) Our canopy level simulations confirm these trends 404
(Figure 7A-D) The in-field measured asymptotic relationships between SIF760 O and GPPEC 405
are consequently caused by the covariance of GPPEC and SIF760 O with APAR the 406
photosynthetic capacity with APAR and the different value ranges of LUEf and LUEp 407
Additionally our canopy level simulations suggest that structure impacts the SIF760 O - GPPEC 408
relationship Figure 7D shows an example that changing LAI leaf inclination angles or the 409
fraction of senescent plant material determine the curvature of the hyperbolic SIF760 C - GPPC 410
relationships 411
412
lt Figure 6 gt 413
lt Figure 7 gt 414
415
The modelled SIF760 LC - GPPLC curves (Figures 6D and 7D) also indicate that under 416
reduced light intensity GPP and SIF760 are almost linearly related while GPP tends to saturate 417
under higher light intensities Changes in APAR at canopy level are caused by either sun 418
elevation or in the case of a constant solar angle by canopy structure (ie shading fractional 419
vegetation cover) In complex structured canopies with many foliage layers the saturation of 420
GPP with APAR may not be observable because variations of APAR are less related to PAR 421
falling on the leaves but rather to the variation of leaf area exposed to light Model 422
simulations suggest that in complex canopies SIF760 saturates with APAR before GPP due to 423
fesc being lower with high APAR (data not shown) This structural effect reduces the curvature 424
of the hyperbolic leaf level GPPL- SIF760 L relationship at canopy level (compare Figures 6F 425
and 7F) Furthermore the effect of structure and APAR covary in time since canopy structure 426
(ie LAI) varies in concert with APAR during a seasonal cycle especially for crops We 427
18
expect that this covariance makes the relationship between GPP and SIF760 more linear at the 428
canopy level especially if observations are aggregated over time 429
To evaluate the structure related alleviation of the hyperbolic relationship between 430
SIF760 and GPP at canopy level in response to temporal aggregation we modelled an annual 431
course of GPPC and SIF760 C considering varying environmental conditions (Figure 8A-B) 432
ie PAR ranging from 0-500 mW m-2 sr-1 nm-1 air temperature ranging from 0-32degC using 433
data collected during 2009 at a Nitro-Europe flux tower site (Speulderbos The Netherlands) 434
and canopy properties ie LAI ranging from 15-30 m2 m-2 (Figure 8C) The LAI data are 435
synthetic but have a realistic seasonal cycle For daily noon values of modelled SIF760 C and 436
GPPC an asymptotic behaviour can be observed while GPPC tends to saturate compared to 437
SIF760 C The SIF760C-GPPC relationship tends to become linear when monthly or quarterly 438
averages are considered (Figure 8D) 439
440
lt Figure 8 gt 441
442
This visual trend can be confirmed by statistical measures for daily aggregated values 443
the hyperbolic model (rRMSE = 174 R2 = 070) performed slightly better than the linear 444
model (rRMSE = 185 r2 = 068) In case of monthly aggregated data both the hyperbolic 445
and linear models performed similarly while the linear model gave better results (RMSE = 446
90 r2 = 090) than the hyperbolic model (rRMSE = 94 R2 = 088) for quarterly aggregated 447
data 448
449
4 Discussion 450
Significant relationships between remotely measured SIF and ecosystem GPP have 451
been reported in the past (Frankenberg et al 2011 Guanter et al 2014) however sufficient 452
19
process understanding for using SIF as proxy for GPP across ecosystems is still limited 453
(Porcar-Castell et al 2014) Below we discuss how our observational and modeling 454
approaches help bridging the gap between mechanistic understanding at the leaf level and 455
ecosystem-specific observations and thus provide insights on mechanisms determining the 456
complex relationship between SIF and GPP 457
458
41 Insights from the observational approach 459
Our results showed ecosystem-specific asymptotic relationships between SIF760 O and 460
GPPEC for the three investigated ecosystems mixed temperate forest cropland and perennial 461
grassland The varying SIF-GPP relationships across ecosystems were consistent with results 462
recently reported from combined satellite observations and model predictions (Guanter et al 463
2012) Our results showed that the relationships of both tested vegetation indices PRI and 464
MCARI2 to GPPEC experienced a higher variability across ecosystems compared to SIF760 O 465
SIF760 O showed an ecosystem-specific and overall moderate to good relationship (R2 between 466
048 and 088) to GPPEC for the three ecosystems Both vegetation indices showed only strong 467
relationships for the grassland (R2 = 095 and 098) that notably changed in LAI during the 468
various observations It is important to note that we do not further elaborate on the underlying 469
mechanisms relating vegetation indices and GPPEC and that it is unclear if hyperbolic models 470
best describe their relationships to GPPEC based on mechanistic principles The intention of 471
evaluating the relationships between GPPEC and both vegetation indices was to provide a base 472
to judge the performance of SIF760 O in relation to these commonly used remote observations 473
The diversity of sampled conditions and used data sources provide further evidence on 474
the robustness of observed SIF760 O-GPPEC relationships Our measurements represent various 475
canopies characterized by different biomasses sampled over several years Although most 476
observations were acquired under similar light condition and physiological states a few 477
measurements represented lower light conditions and other physiological states This suggests 478
20
that observed relationships are rather robust across different representations of APAR LUEp 479
and LUEf Furthermore we use data from different sources ie four EC flux towers the 480
APEX imaging spectrometer and modeling at leaf and canopy levels to reduce the 481
uncertainties associated with each method of measurements and to get a better understanding 482
of the SIF760 O-GPPEC relationship at ecosystem level 483
Flux tower measurements are representative of a certain source area (footprint) from 484
the ecosystem which changes constantly based on wind direction and turbulent state of the 485
atmosphere Depending on the heterogeneity of the ecosystem GPPEC signals can vary in 486
response to changing footprints (Barcza et al 2009 Kljun et al 2004) although this variation 487
should be rather small if the vegetation is homogeneous Remote measurements of SIF760 are 488
likely representative of the upper layer of the ecosystem thus vertical canopy heterogeneity 489
potentially leads to a mismatch when compared to GPPEC which integrates over the different 490
layers of the ecosystems This is expected to be especially the case in structurally complex 491
ecosystems such as forests Although the upper layer in forest ecosystems substantially 492
contributes to the total rate of GPPEC there are still many layers of leaves or needles within 493
the canopy photosynthesizing at different rates depending on their sunshade exposure In 494
addition understory vegetation in forest ecosystems can significantly contribute to GPPEC at 495
different rates depending on the ecosystem and time of year Even homogeneous vegetation 496
canopies like crops or grasslands can show vertical heterogeneity This is especially the case 497
at peak biomass during ripening or senescence During such phenological stages the top layer 498
of cereal crops consists of less fluorescing components (ie ears) and cereal crops or 499
grasslands can contain a higher fraction of brown pigments resulting in low SIF760 O values 500
while the entire canopy can still produce high photosynthetic rates and thus GPPEC (Damm et 501
al 2010) Indeed most of the crops investigated in our study were in the ripening phase with a 502
pronounced ear layer 503
21
This resulted in relatively low SIF760 O values and in high GPPEC and thus in a more 504
pronounced asymptotic relationship (cf Figure 4A Figure 7F) compared to results reported 505
for other crops (Guanter et al 2013 Guanter et al 2014) Further research is needed to better 506
understand the impact of vertical heterogeneity on GPPEC and SIF760 observations and their 507
respective relationships 508
Despite the technical aspects causing variations in retrieved SIF760 O (refer to 509
Appendix-D for a detailed discussion) canopy structure causes inherent variations in 510
measured SIF760 values and thus impacts SIF760-GPP relationships The combination of 511
complex canopy architecture and the distribution of absorbing and scattering elements 512
determine vegetation canopies to act as photon traps (Knyazikhin et al 2013 Lewis and 513
Disney 2007) Parts of emitted SIF760 photons from inner-canopy leaves are re-absorbed 514
while others escape the canopy in direction of the sensor The probability of photons escaping 515
the canopy is a function of canopy structure which implies sensitivity to measured SIF760 516
intensities for canopy structure In Eq (2) this sensitivity was approximated with the term 517
fesc In our analysis we minimized the impact of fesc by observing always the same forest area 518
representative for the EC tower footprint In less complex structured crop and grass canopies 519
we expect fesc to be less important However future research is required to quantify the impact 520
of fesc and to propose strategies to compensate its influence on SIF760 retrievals 521
522
42 Insights from the modeling approach 523
From a theoretical point of view radiative energy loss competes with photochemistry 524
and non-radiative energy dissipation for absorbed photons Considering that GPP and SIF760 525
can be conceptualized according to Eqs (1) and (2) SIF760 must show under certain 526
environmental conditions a sensitivity to photochemistry (Porcar-Castell et al 2014 van der 527
Tol et al 2009a van der Tol et al 2009b) This relationship is confirmed by our observational 528
data and other studies at leaf (Amoros-Lopez et al 2008) and canopy levels (Damm et al 529
22
2010) Our modeling results however indicated that the relationship between LUEf and LUEp 530
is subject to change hence impacting the sensitivity of SIF760 to track changes in GPP 531
(Figures 6C and 7C) 532
The asymptotic relationship between SIF760 and GPP theoretically predicted and 533
observed at leaf and canopy levels can be related in particular to the different value ranges of 534
both efficiency terms (LUEp and LUEf) (Figures 6C and 7C) while a complex set of 535
mechanisms causes an ecosystem dependency for SIF760-GPP relationships The 536
photosynthetic capacity of the entire ecosystem in combination with its vertical heterogeneity 537
determines differences in GPP and SIF760 and thus the slope and curvature of their respective 538
relationships Furthermore the initial slope of the asymptotic SIF760 - GPP relationship which 539
has a value of LUEpmax(LUEfmiddotfesc) is determined by a combination of the photosynthetic 540
efficiency and canopy structure Canopy structure and related shadowing effects alter the 541
average light interception and quality at leaf level (Nobel et al 1993 Stewart et al 2003) and 542
consequently the overall productivity of the canopy In the case of reduced APAR caused by 543
canopy shadowing the overall apparent stress level in the canopy and consequently the rate 544
of certain photoprotective mechanisms such as non-radiative energy dissipation is reduced 545
(Cheng et al 2015 Demmig-Adams 1998 Niinemets et al 2003) and observed GPP and 546
SIF760 fall in a range where they are more linearly related (cf Figure 6F and 7F) In addition 547
canopy level simulations show that the fraction of senescent plant material impacts the 548
curvature of the hyperbolic relationship 549
Recent literature reports linear relationships between satellite-based SIF and modeled 550
GPP (Frankenberg et al 2011 Guanter et al 2012 Guanter et al 2014) while we found 551
asymptotic relationships Both results are not contradicting if one considers the temporal 552
aggregation applied to the data Our results are based on instantaneous measurements while 553
monthly averages were calculated for the satellite data to minimize noise effects (Frankenberg 554
et al 2011 Guanter et al 2014) It is known from previous research that temporal averaging 555
23
tends to linearize the response between GPP and APAR (Ruimy et al 1995) as saturating 556
light conditions tend to be only a small fraction of averaged diurnalmonthly data 557
Aggregating GPPEC and APAR over different time scales also showed this effect (data not 558
shown) Because of the rather linear relationship between SIF760 and APAR we expect that 559
temporal aggregation tends to linearize the SIF760-GPP relationship as well A recent study 560
presenting continuous measurements of GPP and SIF760 over a temperate deciduous forest 561
support this hypothesis (Yang et al 2015) The increasing number of experiments using 562
autonomous spectrometer systems in combination with flux towers (Balzarolo et al 2011) 563
will likely provide more experimental results that supports this finding Our simulations 564
provide further evidence that the covariance of structure and APAR during a seasonal cycle 565
additionally tends to linearize the relationship between GPP and SIF760 if observations are 566
aggregated over time 567
The dependency of SIF760-GPP relationships on temporal aggregation requires special 568
attention since it has implications on the usage of SIF to constrain GPP In principle 569
conclusions and results obtained from temporally aggregated and instantaneous measurements 570
are valid if consistently related to the underlying temporal aggregation level Generalizing 571
conclusions obtained at various aggregation levels bears the risk for mis-interpretations eg 572
when vegetation models are refined or empirically re-calibrated using observations or for 573
projections of GPP using observational SIF data 574
575
43 Requirements for the use of SIF to assess GPP across ecosystems 576
The changing relationship between SIF760 and GPPEC with vegetation type challenges 577
the usage of SIF760 as a robust constraint to estimate GPP Specific strategies are required to 578
account for ecosystem (or species) specific sensitivities of SIF in general and SIF760 in 579
particular This includes i) integration platforms to combine observations and process 580
24
understanding and ii) accurate observations of additional vegetation and environmental 581
variables 582
Process-based models as data integration platform in combination with comprehensive 583
observations to sufficiently measure important environmental factors and vegetation 584
properties are considered as flexible and powerful framework Parazoo et al (2014) for 585
example proposed the combination of ensemble dynamic global vegetation models (DGVMs) 586
in combination with SIF as observational constraint Lee et al (2015) suggest incorporating 587
SIF in a climate model to utilize SIF as observational constraint of photosynthesis simulations 588
and subsequent calculations of carbon water and energy cycle information Yet other studies 589
propose using SIF to obtain physiological vegetation parameters ie Vcmax for improved 590
parameterizations of photosynthesis models to eventually model GPP (Zhang et al 2014) The 591
European space agencys (ESA) Earth Explorer 8 opportunity mission Fluorescence Explorer 592
(FLEX) suggests a combination of comprehensive observations (ie SIF over the full 593
emission spectrum vegetation ecosystems and actual environmental conditions) and process-594
based models (Guanter et al 2012) 595
Additional information is required to use SIF in process-based models as one has to 596
account for varying photosynthetic efficiencies of plants and prevailing stress responses 597
According to the conceptualization of GPP and SIF as given in Eqs (1) and (2) extracting 598
and evaluating the exact relationship between LUEp and LUEf is essential but requires 599
normalizing APAR and calculating both yields (Damm et al 2010 Govindjee 2004 Louis et 600
al 2005) Retrievals of APAR can be considered challenging (Garbulsky et al 2010 Gitelson 601
and Gamon 2015 Hanan et al 2002) as available approaches often utilize a-priori knowledge 602
of prevailing land cover or plant distribution functions and rely on the inversion of physical-603
based models or simple band ratios (Hilker et al 2008) Research is required to provide high 604
quality information on APAR not perturbed by light absorption of non-photosynthetic active 605
25
canopy elements (stems branches twigs) cf Zhang et al (2013 2012) that demonstrate 606
attempts to improve estimates of APAR 607
Observed SIF760 O - GPPEC relationships are additionally confounded by non-radiative 608
energy dissipation The PRI was designed to monitor pigment changes related to the 609
xanthophyll cycle (Gamon et al 1992) and provides access to this superimposing process 610
However reported sensitivities of PRI for other effects ie structure (Barton and North 611
2001) pigment pool sizes (Gamon and Berry 2012) illumination effects (Damm et al 2015) 612
and the results obtained in this study question the applicability of the PRI at canopy level 613
Alternative approaches such as the development of a canopy PRI as suggested by several 614
groups (Hernandez-Clemente et al 2011 Kovac et al 2013 Wu et al 2010) or the usage of 615
pigment compositions and other functional plant traits might represent interesting strategies 616
and should be elaborated in future research 617
Structural sensitivities of canopy leaving SIF signals are critical and require further 618
research The application of spectrally invariant correction factors eg the directional area 619
scattering factor (Knyazikhin et al 2013) or more advanced physically-based retrieval 620
schemes using combined atmosphere-canopy models (Damm et al 2015 Laurent et al 2013) 621
might provide potential strategies to compensate for canopy structural effects on retrieved 622
SIF760 623
Another important source of information that allows improving the usage of SIF as 624
constraint of GPP is to consider SIF emissions over the entire emission spectrum between 625
approximately 600 and 800 nm Recent research successfully demonstrated the 626
complementary information content of red-fluorescence retrieved in the O2-B band at 688 nm 627
(SIF688) compared to SIF760 because of the different contributions from photosystem I and II 628
(Rossini et al 2015) Yet other studies highlighted the potential to improve predictions of 629
LUEp and GPP using both SIF688 and SIF760 (Cheng et al 2013) 630
631
26
5 Conclusions 632
Remote sensing of SIF provides a new observational approach to assess terrestrial 633
GPP Compared to traditional greenness-based remote sensing parameters we found SIF760 to 634
be more consistently related to GPPEC These results in combination with the more direct 635
mechanistic link between SIF760 and photosynthesis suggest that using SIF760 provides a 636
strategy to decrease uncertainty in estimating GPP across ecosystems 637
Our observational and modeling approaches revealed asymptotic and ecosystem-638
specific relationships for SIF760 and GPPEC We identified a set of interlinked mechanisms 639
determining SIF760-GPPEC relationships to be ecosystem specific ie the photosynthetic 640
capacity and efficiency of ecosystems the confounding impact of non-radiative energy 641
dissipation (NPQ) as well as ecosystem structure and the fraction of non-photosynthetic 642
vegetation components We demonstrated that SIF760-GPPEC relationships scale with temporal 643
aggregation due to a covariance of canopy structure and APAR over the seasonal cycle 644
We suggest going beyond empirical and ecosystem-specific relationships instead 645
using instantaneous observations comprehensively providing information on the full SIF 646
emission vegetation status and functioning as well as environmental conditions in 647
combination with process-based models Such approaches eg suggested for ESArsquos potential 648
ldquoFluorescence Explorerrdquo (FLEX) Earth Explorer mission provide a flexible framework to 649
account for the various influencing factors identified and to successfully apply SIF as 650
constraint of unbiased global GPP estimates 651
Furthermore research is required to improve the comparison between observations of 652
GPPEC and SIF Both observations stem from conceptually contrasting technologies ie 653
measurements of gas exchange vs plant-light interactions and provide independent and 654
complementary access to study ecosystem photosynthesis Despite the need to harmonize 655
horizontally differing footprints the vertical heterogeneity of ecosystems including the 656
27
varying contributions from different ecosystem layers must be better understood to harmonize 657
and successfully integrate both measurements 658
659
Acknowledgements 660
This work was supported by a grant of the Swiss University Conference and ETH-661
Board in frame of the Swiss Earth Observatory Network (SEON) project and by a grant of the 662
European Space Agency (ESA) in frame of the FLEX-PARCS E Paul-Limoges was 663
supported in part by the Natural Sciences and Engineering Research Council of Canada 664
through a postgraduate scholarship We would like to thank the APEX team for acquiring the 665
APEX data Authors sequence is listed following the FLAE approach (doi 666
101371journalpbio0050018) 667
28
References 668
Ammann C Flechard CR Leifeld J Neftel A amp Fuhrer J (2007) The carbon budget of 669
newly established temperate grassland depends on management intensity Agriculture 670
Ecosystems amp Environment 121 5-20 671
Amoros-Lopez J Gomez-Chova L Vila-Frances J Alonso L Calpe J Moreno J amp 672
del Valle-Tascon S (2008) Evaluation of remote sensing of vegetation fluorescence by 673
the analysis of diurnal cycles International Journal of Remote Sensing 29 5423-5436 674
Baker NR (2008) Chlorophyll Fluorescence A probe of photosynthesis in vivo Annual 675
Review of Plant Physiology and Plant Molecular Biology 59 89-113 676
Baldocchi D Falge E Gu LH Olson R Hollinger D Running S Anthoni P 677
Bernhofer C Davis K Evans R Fuentes J Goldstein A Katul G Law B Lee 678
XH Malhi Y Meyers T Munger W Oechel W U KTP Pilegaard K Schmid 679
HP Valentini R Verma S Vesala T Wilson K amp Wofsy S (2001) FLUXNET A 680
new tool to study the temporal and spatial variability of ecosystem-scale carbon dioxide 681
water vapor and energy flux densities Bulletin of the American Meteorological Society 682
82 2415-2434 683
Baldocchi DD (2003) Assessing the eddy covariance technique for evaluating carbon 684
dioxide exchange rates of ecosystems past present and future Global Change Biology 9 685
479-492 686
Balzarolo M Anderson K Nichol C Rossini M Vescovo L Arriga N Wohlfahrt G 687
Calvet J-C Carrara A Cerasoli S Cogliati S Daumard F Eklundh L Elbers JA 688
Evrendilek F Handcock RN Kaduk J Klumpp K Longdoz B Matteucci G 689
Meroni M Montagnani L Ourcival J-M Sanchez-Canete EP Pontailler J-Y 690
Juszczak R Scholes B amp Pilar Martin M (2011) Ground-Based Optical Measurements 691
at European Flux Sites A Review of Methods Instruments and Current Controversies 692
Sensors 11 7954-7981 693
Barcza Z Kern A Haszpra L amp Kljun N (2009) Spatial representativeness of tall tower 694
eddy covariance measurements using remote sensing and footprint analysis Agricultural 695
and Forest Meteorology 149 795-807 696
Barton CVM amp North PRJ (2001) Remote sensing of canopy light use efficiency using 697
the photochemical reflectance index - Model and sensitivity analysis Remote Sensing of 698
Environment 78 264-273 699
Beer C Reichstein M Tomelleri E Ciais P Jung M Carvalhais N Roedenbeck C 700
Arain MA Baldocchi D Bonan GB Bondeau A Cescatti A Lasslop G Lindroth 701
29
A Lomas M Luyssaert S Margolis H Oleson KW Roupsard O Veenendaal E 702
Viovy N Williams C Woodward FI amp Papale D (2010) Terrestrial Gross Carbon 703
Dioxide Uptake Global Distribution and Covariation with Climate Science 329 834-838 704
Berk A Anderson GP Acharya PK Bernstein LS Muratov L Lee J Fox M 705
Adler-Golden SM Chetwynd JH Hoke ML Lockwood RB Gardner JA Cooley 706
TW Borel CC amp Lewis PE (2005) MODTRAN5 A reformulated atmospheric band 707
model with auxiliary species and practical multiple scattering options Proceedings of the 708
Society of Photo-Optical Instrumentation Engineer 5655 662-667 709
Cheng SJ Bohrer G Steiner AL Hollinger DY Suyker A Phillips RP amp 710
Nadelhoffer KJ (2015) Variations in the influence of diffuse light on gross primary 711
productivity in temperate ecosystems Agricultural and Forest Meteorology 201 98-110 712
Cheng Y-B Middleton EM Zhang Q Huemmrich KF Campbell PKE Corp LA 713
Cook BD Kustas WP amp Daughtry CS (2013) Integrating Solar Induced 714
Fluorescence and the Photochemical Reflectance Index for Estimating Gross Primary 715
Production in a Cornfield Remote Sensing 5 6857-6879 716
Collatz GJ Ball JT Grivet C amp Berry JA (1991) Physiological and environmental-717
regulation of stomatal conductance photosynthesis and transpiration - a model that 718
includes a laminar boundary-layer Agricultural and Forest Meteorology 54 107-136 719
DOdorico P Alberti E amp Schaepman ME (2010) In-flight spectral performance 720
monitoring of the Airborne Prism Experiment Applied Optics 49 3082-3091 721
DOdorico P Guanter L Schaepman ME amp Schlaumlpfer D (2011) Performance 722
assessment of onboard and scene-based methods for Airborne Prism Experiment spectral 723
characterization Applied Optics 50 4755-4764 724
Damm A Erler A Gioli B Hamdi K Hutjes R Kosvancova M Meroni M 725
Miglietta F Moersch A Moreno J Schickling A Sonnenschein R Udelhoven T 726
Van der Linden S Hostert P amp Rascher U (2010) Remote sensing of sun induced 727
fluorescence yield to improve modelling of diurnal courses of Gross Primary Production 728
(GPP) Global Change Biology 16 171-186 729
Damm A Erler A Hillen W Meroni M Schaepman ME Verhoef W amp Rascher U 730
(2011) Modeling the impact of spectral sensor configurations on the FLD retrieval 731
accuracy of sun-induced chlorophyll fluorescence Remote Sensing of Environment 115 732
1882-1892 733
Damm A Guanter L Laurent VCE Schaepman ME Schickling A amp Rascher U 734
(2014) FLD-based retrieval of sun-induced chlorophyll fluorescence from medium 735
30
spectral resolution airborne spectroscopy data Remote Sensing of Environment 147 256-736
266 737
Damm A Guanter L Verhoef W Schlaumlpfer D Garbari S amp Schaepman ME (2015) 738
Impact of varying irradiance on vegetation indices and chlorophyll fluorescence derived 739
from spectroscopy data Remote Sensing of Environment 156 202-215 740
Demmig-Adams B (1998) Survey of thermal energy dissipation and pigment composition in 741
sun and shade leaves Plant and Cell Physiology 39 474-482 742
Drolet GG Middleton EM Huemmrich KF Hall FG Amiro BD Barr AG Black 743
TA McCaughey JH amp Margolis HA (2008) Regional mapping of gross light-use 744
efficiency using MODIS spectral indices Remote Sensing of Environment 112 3064-3078 745
Eugster W amp Senn W (1995) A cospectral correction model for measurement of turbulent 746
NO2 fluxes Boundary-Layer Meteorology 74 321-340 747
Eugster W Zeyer K Zeeman M Michna P Zingg A Buchmann N amp Emmenegger 748
L (2007) Methodical study of nitrous oxide eddy covariance measurements using 749
quantum cascade laser spectrometery over a Swiss forest Biogeosciences 4 927-939 750
Falge E Baldocchi D Olson R Anthoni P Aubinet M Bernhofer C Burba G 751
Ceulemans R Clement R Dolman H Granier A Gross P Grunwald T Hollinger 752
D Jensen NO Katul G Keronen P Kowalski A Lai CT Law BE Meyers T 753
Moncrieff H Moors E Munger JW Pilegaard K Rannik U Rebmann C Suyker 754
A Tenhunen J Tu K Verma S Vesala T Wilson K amp Wofsy S (2001) Gap 755
filling strategies for defensible annual sums of net ecosystem exchange Agricultural and 756
Forest Meteorology 107 43-69 757
Falloon P amp Betts R (2010) Climate impacts on European agriculture and water 758
management in the context of adaptation and mitigation-The importance of an integrated 759
approach Science of the Total Environment 408 5667-5687 760
Foken T amp Wichura B (1996) Tools for quality assessment of surface-based flux 761
measurements Agricultural and Forest Meteorology 78 83-105 762
Fournier A Daumard F Champagne S Ounis A Goulas Y amp Moya I (2012) Effect 763
of canopy structure on sun-induced chlorophyll fluorescence Isprs Journal of 764
Photogrammetry and Remote Sensing 68 112-120 765
Frankenberg C Fisher JB Worden J Badgley G Saatchi SS Lee JE Toon GC 766
Butz A Jung M Kuze A amp Yokota T (2011) New global observations of the 767
terrestrial carbon cycle from GOSAT Patterns of plant fluorescence with gross primary 768
productivity Geophysical Research Letters 38 769
31
Gamon JA amp Berry JA (2012) Facultative and constitutive pigment effects on the 770
Photochemical Reflectance Index (PRI) in sun and shade conifer needles Israel Journal of 771
Plant Sciences 60 85-95 772
Gamon JA Coburn C Flanagan LB Huemmrich KF Kiddle C Sanchez-Azofeifa 773
GA Thayer DR Vescovo L Gianelle D Sims DA Rahman AF amp Pastorello 774
GZ (2010) SpecNet revisited bridging flux and remote sensing communities Canadian 775
Journal of Remote Sensing 36 S376-S390 776
Gamon JA Penuelas J amp Field CB (1992) A narrow-waveband spectral index that 777
tracks diurnal changes in photosynthetic efficiency Remote Sensing of Environment 41 778
35-44 779
Garbulsky MF Filella I Verger A amp Penuelas J (2014) Photosynthetic light use 780
efficiency from satellite sensors From global to Mediterranean vegetation Environmental 781
and Experimental Botany 103 3-11 782
Garbulsky MF Penuelas J Papale D Ardo J Goulden ML Kiely G Richardson 783
AD Rotenberg E Veenendaal EM amp Filella I (2010) Patterns and controls of the 784
variability of radiation use efficiency and primary productivity across terrestrial 785
ecosystems Global Ecology and Biogeography 19 253-267 786
Gege P Fries J Haschberger P Schoumltz P Schwarzer H Strobl P Suhr B Ulbrich 787
G amp Vreeling WJ (2009) Calibration facility for airborne imaging spectrometers 788
ISPRS Journal of Photogrammetry amp Remote Sensing 64 387ndash397 789
Gitelson AA amp Gamon JA (2015) The need for a common basis for defining light-use 790
efficiency Implications for productivity estimation Remote Sensing of Environment 156 791
196-201 792
Goetz SJ amp Prince SD (1999) Modelling terrestrial carbon exchange and storage 793
Evidence and implications of functional convergence in light-use efficiency Advances in 794
Ecological Research Vol 28 (pp 57-92) 795
Govindjee (2004) Chlorophyll a fluorescence A bit of basics and history In GC 796
Papageorgiou amp Govindjee (Eds) Chlorophyll a Fluorescence A Signature of 797
Photosynthesis Advances in Photosynthesis and Respiration (pp 1-42) Dordrecht 798
Springer 799
Guanter L Alonso L Gomez-Chova L Amoros-Lopez J Vila J amp Moreno J (2007) 800
Estimation of solar-induced vegetation fluorescence from space measurements 801
Geophysical Research Letters 34 doi 1010292007GL029289 802
32
Guanter L Alonso L Gomez-Chova L Meroni M Preusker R Fischer J amp Moreno 803
J (2010) Developments for vegetation fluorescence retrieval from spaceborne high-804
resolution spectrometry in the O2-A and O2-B absorption bands Journal of Geophysical 805
Research-Atmospheres 115 806
Guanter L Frankenberg C Dudhia A Lewis PE Goacutemez-Dans J Kuze A Suto H amp 807
Grainger R (2012) Retrieval and global assessment of terrestrial chlorophyll fluorescence 808
from GOSAT space measurements Remote Sensing of Environment 121 236-251 809
Guanter L Rossini M Colombo R Meroni M Frankenberg C Lee J-E amp Joiner J 810
(2013) Using field spectroscopy to assess the potential of statistical approaches for the 811
retrieval of sun-induced chlorophyll fluorescence from ground and space Remote Sensing 812
of Environment 133 52-61 813
Guanter L Zhang Y Jung M Joiner J Voigt M Berry JA Frankenberg C Huete 814
AR Zarco-Tejada P Lee J-E Moran MS Ponce-Campos G Beer C Camps-815
Valls G Buchmann N Gianelle D Klumpp K Cescatti A Baker JM amp Griffis 816
TJ (2014) Global and time-resolved monitoring of crop photosynthesis with chlorophyll 817
fluorescence Proceedings of the National Academy of Sciences of the United States of 818
America 111 E1327-E1333 819
Haboudane D Miller JR Pattey E Zarco-Tejada PJ amp Strachan IB (2004) 820
Hyperspectral vegetation indices and novel algorithms for predicting green LAI of crop 821
canopies Modeling and validation in the context of precision agriculture Remote Sensing 822
of Environment 90 337-352 823
Hanan NP Burba G Verma SB Berry JA Suyker A amp Walter-Shea EA (2002) 824
Inversion of net ecosystem CO2 flux measurements for estimation of canopy PAR 825
absorption Global Change Biology 8 563-574 826
Hernandez-Clemente R Navarro-Cerrillo RM Suarez L Morales F amp Zarco-Tejada 827
PJ (2011) Assessing structural effects on PRI for stress detection in conifer forests 828
Remote Sensing of Environment 115 2360-2375 829
Hilker T Coops NC Wulder MA Black TA amp Guy RD (2008) The use of remote 830
sensing in light use efficiency based models of gross primary production A review of 831
current status and future requirements Science of the Total Environment 404 411-423 832
Hilker T Gitelson A Coops NC Hall FG amp Black TA (2011) Tracking plant 833
physiological properties from multi-angular tower-based remote sensing Oecologia 165 834
865-876 835
33
Hilker T Lyapustin A Hall FG Wang Y Coops NC Drolet G amp Black TA 836
(2009) An assessment of photosynthetic light use efficiency from space Modeling the 837
atmospheric and directional impacts on PRI reflectance Remote Sensing of Environment 838
113 2463-2475 839
Hueni A Biesemans J Meuleman K DellEndice F Schlaumlpfer D Adriaensen S 840
Kempenaers S Odermatt D Kneubuehler M Nieke J amp Itten K (2009) Structure 841
Components and Interfaces of the Airborne Prism Experiment (APEX) Processing and 842
Archiving Facility IEEE Transactions on Geoscience and Remote Sensing 47 29-43 843
Hueni A Lenhard K Baumgartner A amp Schaepman M (2013) The APEX (Airborne 844
Prism Experiment - Imaging Spectrometer) Calibration Information System IEEE 845
Transactions on Geoscience and Remote Sensing 51 5169-5180 846
Hueni A Schlaepfer D Jehle M amp Schaepman M (2015) Impacts of Dichroic Prism 847
Coatings on Radiometry of the Airborne Imaging Spectrometer APEX Applied Optics 53 848
5344-5352 849
Imhoff ML Bounoua L Ricketts T Loucks C Harriss R amp Lawrence WT (2004) 850
Global patterns in human consumption of net primary production Nature 429 870-873 851
IPCC (2013) Summary for policymakers Climate change 2013 the physical science basis 852
Cambridge University Press Cambridge United Kingdom and New York NY USA 853
Jacquemoud S amp Baret F (1990) PROSPECT A model of leaf optical properties spectra 854
Remote Sensing of Environment 34 75-91 855
Jehle M Hueni A Damm A DOdorico P Kneubuumlhler M Meuleman K Schlapfer 856
D Schaepman ME amp Weyermann J (2010) APEX - current status performance and 857
validation concept IEEE Sensors 2010 Conference 533-537 858
Joiner J Guanter L Lindstrot R Voigt M Vasilkov AP Middleton EM Huemmrich 859
KF Yoshida Y amp Frankenberg C (2013) Global monitoring of terrestrial chlorophyll 860
fluorescence from moderate spectral resolution near-infrared satellite measurements 861
methodology simulations and application to GOME-2 Atmos Meas Tech Discuss 6 862
3883-3930 863
Jung M Reichstein M Margolis HA Cescatti A Richardson AD Arain MA 864
Arneth A Bernhofer C Bonal D Chen J Gianelle D Gobron N Kiely G Kutsch 865
W Lasslop G Law BE Lindroth A Merbold L Montagnani L Moors EJ 866
Papale D Sottocornola M Vaccari F amp Williams C (2011) Global patterns of land-867
atmosphere fluxes of carbon dioxide latent heat and sensible heat derived from eddy 868
34
covariance satellite and meteorological observations Journal of Geophysical Research-869
Biogeosciences 116 870
Kljun N Kastner-Klein P Fedorovich E amp Rotach MW (2004) Evaluation of 871
Lagrangian footprint model using data from wind tunnel convective boundary layer 872
Agricultural and Forest Meteorology 127 189-201 873
Kljun N Rotach MW amp Schmid HP (2002) A three-dimensional backward lagrangian 874
footprint model for a wide range of boundary-layer stratifications Boundary-Layer 875
Meteorology 103 205-226 876
Knyazikhin Y Schull MA Stenberg P Mottus M Rautiainen M Yang Y Marshak 877
A Latorre Carmona P Kaufmann RK Lewis P Disney MI Vanderbilt V Davis 878
AB Baret F Jacquemoud S Lyapustin A amp Myneni RB (2013) Hyperspectral 879
remote sensing of foliar nitrogen content Proceedings of the National Academy of 880
Sciences of the United States of America 110 E185-E192 881
Kovac D Malenovsky Z Urban O Spunda V Kalina J Ac A Kaplan V amp Hanus 882
J (2013) Response of green reflectance continuum removal index to the xanthophyll de-883
epoxidation cycle in Norway spruce needles Journal of Experimental Botany 64 1817-884
1827 885
Krausmann F Erb K-H Gingrich S Haberl H Bondeau A Gaube V Lauk C 886
Plutzar C amp Searchinger TD (2013) Global human appropriation of net primary 887
production doubled in the 20th century Proceedings of the National Academy of Sciences 888
of the United States of America 110 10324-10329 889
Lasslop G Reichstein M Papale D Richardson AD Arneth A Barr A Stoy P amp 890
Wohlfahrt G (2010) Separation of net ecosystem exchange into assimilation and 891
respiration using a light response curve approach critical issues and global evaluation 892
Global Change Biology 16 187-208 893
Laurent VCE Verhoef W Damm A Schaepman ME amp Clevers JGPW (2013) A 894
Bayesian object-based approach for estimating vegetation biophysical variables from at-895
sensor APEX radiance data Remote Sensing of Environment 139 6-17 896
Lee JE Berry JA Van der Tol C Yang X Guanter L Damm A Baker I amp 897
Frankenberg C (2015) Simulations of chlorophyll fluorescence in corporated into the 898
Community Land Model version 4 Global Change Biology in print 899
Lewis P amp Disney M (2007) Spectral invariants and scattering across multiple scales from 900
within-leaf to canopy Remote Sensing of Environment 109 196-206 901
35
Liu LY amp Cheng ZH (2010) Detection of Vegetation Light-Use Efficiency Based on 902
Solar-Induced Chlorophyll Fluorescence Separated From Canopy Radiance Spectrum Ieee 903
Journal of Selected Topics in Applied Earth Observations and Remote Sensing 3 306-312 904
Louis J Ounis A Ducruet JM Evain S Laurila T Thum T Aurela M Wingsle G 905
Alonso L Pedros R amp Moya I (2005) Remote sensing of sunlight-induced chlorophyll 906
fluorescence and reflectance of Scots pine in the boreal forest during spring recovery 907
Remote Sensing of Environment 96 37-48 908
Maier SW Guumlnther KP amp Stellmes M (2003) Sun-Induced Fluorescence A New Tool 909
for Precision Farming In M McDonald J Schepers L Tartly T van Toai amp D Major 910
(Eds) Digital Imaging and Spectral Techniques Applications to Precision Agriculture 911
and Crop Physiology (pp 209-222) ASA Special Publication 912
Mauder M Foken T Clement R Elbers JA Eugster W Gruenwald T Heusinkveld 913
B amp Kolle O (2008) Quality control of CarboEurope flux data - Part 2 Inter-914
comparison of eddy-covariance software Biogeosciences 5 451-462 915
Meroni M Busetto L Guanter L Cogliati S Crosta GF Migliavacca M Panigada 916
C Rossini M amp Colombo R (2010) Characterization of fine resolution field 917
spectrometers using solar Fraunhofer lines and atmospheric absorption features Applied 918
Optics 49 2858-2871 919
Meroni M Picchi V Rossini M Cogliati S Panigada C Nali C Lorenzini G amp 920
Colombo R (2008) Leaf level early assessment of ozone injuries by passive fluorescence 921
and photochemical reflectance index International Journal of Remote Sensing 29 5409-922
5422 923
Meroni M Rossini M Guanter L Alonso L Rascher U Colombo R amp Moreno J 924
(2009) Remote sensing of solar induced chlorophyll fluorescence review of methods and 925
applications Remote Sensing of Environment doi101016jrse200905003 926
Michaelis L amp Menten ML (1913) The kenetics of the inversion effect Biochemische 927
Zeitschrift 49 333-369 928
Middleton E McMurtney JE Campbell PK Corp LA Butcher LM amp Chappelle 929
EW (2002) Optical and fluorescence properties of corn leaves from different nitrogen 930
regimes In M Owe G Durso amp L Toulios (Eds) Conference on Remote Sensing for 931
Agriculture Ecosystems and Hydrology IV (pp 72-83) Agia Pelagia Greece 932
Miller JR Berger M Goulas Y Jacquemoud S Louis J Moise N Mohammed G 933
Moreno J Moya I Pedroacutes R Verhoef W amp Zarco-Tejada PJ (2005) Development 934
36
of a vegetation fluorescence canopy model Final Report May 2005 In European Space 935
Research and Technology Centre (ESTEC) 936
Monteith JL (1972) Solar-radiation and productivity in tropical ecosystems Journal of 937
Applied Ecology 9 747-766 938
Niinemets U Kollist H Garcia-Plazaola JI Hernandez A amp Becerril JM (2003) Do 939
the capacity and kinetics for modification of xanthophyll cycle pool size depend on growth 940
irradiance in temperate trees Plant Cell and Environment 26 1787-1801 941
Nobel PS Forseth IN amp Long SP (1993) Canopy structure and light interception 942
Ozanne CMP Anhuf D Boulter SL Keller M Kitching RL Korner C Meinzer 943
FC Mitchell AW Nakashizuka T Dias PLS Stork NE Wright SJ amp 944
Yoshimura M (2003) Biodiversity meets the atmosphere A global view of forest 945
canopies Science 301 183-186 946
Parazoo NC Bowman K Fisher JB Frankenberg C Jones DBA Cescatti A Peacuterez-947
Priego Oacute Wohlfahrt G amp Montagnani L (2014) Terrestrial gross primary production 948
inferred from satellite fluorescence and vegetation models Global Change Biology na-na 949
Plascyk JA (1975) MK II Fraunhofer Line Dicsriminator (FLD-II) for airborne and orbital 950
remote-sensing of solar-stimulated luminescence Optical Engineering 14 339-346 951
Porcar-Castell A Tyystjaumlrvi E Atherton J Van der Tol C Flexas J EE P Moreno 952
J Frankenberg C amp Berry JA (2014) Linking chlorophyll a fluorescence to 953
photosynthesis for remote sensing applications mechanisms and challenges Journal of 954
Experimental Botany 65 4065-4095 955
Rascher U Agati G Alonso L Cecci G Champagne S Colombo R Damm A 956
Daumard F De Miguel E Fernandez G Franch B Franke J Gerbig C Gioli B 957
Gomez JA Goulas Y Guanter L Gutierrez-De-La-Camara O Hamdi K Hostert 958
P Jimenez M Kosvancova M Lognoli D Meroni M Miglietta F Moersch A 959
Moreno J Moya I Neininger B Okujeni A Ounis A Palombi L Raimondi V 960
Schickling A Sobrino JA Stellmes M Toci G Toscano P Udelhoven T Van der 961
Linden S amp Zaldei A (2009) CEFLES2 The remote sensing component to quantify 962
photosynthetic efficiency from the leaf to the region by measuring sun-induced 963
fluorescence in the oxygen absorption bands Biogeosciences 6 1181-1198 964
Richter R amp Schlaumlpfer D (2002) Geo-atmospheric processing of airborne imaging 965
spectrometry data Part 2 Atmospherictopographic correction International Journal of 966
Remote Sensing 23 2631-2649 967
37
Rossini M Meroni M Migliavacca M Manca G Cogliati S Busetto L Picchi V 968
Cescatti A Seufert G amp Colombo R (2010) High resolution field spectroscopy 969
measurements for estimating gross ecosystem production in a rice field Agricultural and 970
Forest Meteorology 150 1283-1296 971
Rossini M Nedbal L Guanter L Ač A Alonso L Burkart A Cogliati S Colombo 972
R Damm A Drusch M Hanus J Julitta T Kokkalis P Moreno J Panigada C 973
Pinto F Schickling A Schuumlttemeyer D Zemek F amp Rascher U (2015) Red and far-974
red sun-induced chlorophyll fluorescence as a measure of plant photosynthesis 975
Geophysical Research Letters (accepted for publication) 976
Ruimy A Jarvis PG Baldocchi DD amp B S (1995) CO2 Fluxes over Plant Canopies 977
and Solar Radiation A Review Advances in Ecological Research 26 1-68 978
Running SW Nemani RR Heinsch FA Zhao MS Reeves M amp Hashimoto H 979
(2004) A continuous satellite-derived measure of global terrestrial primary production 980
Bioscience 54 547-560 981
Schaepman ME M J Hueni A DrsquoOdorico P Damm A Weyermann J Schneider F 982
Laurent VCE C P Seidel F Lenhard K Gege P Kuechler C Brazile J Kohler 983
P De Vos L Meuleman K Meynart R Schlaepfer D Kneubuumlhler M amp Itten K 984
(2015) Advanced radiometry measurements and Earth science applications with the 985
Airborne Prism Experiment (APEX) Remote Sensing of Environment 158 207-219 986
Schimel D Pavlick R Fisher JB Asner GP Saatchi S Townsend P Miller C 987
Frankenberg C Hibbard K amp Cox P (2014) Observing terrestrial ecosystems and the 988
carbon cycle from space Global Change Biology na-na 989
Schlaumlpfer D amp Richter R (2002) Geo-atmospheric processing of airborne imaging 990
spectrometry data Part 1 Parametric orthorectification International Journal of Remote 991
Sensing 23 2609-2630 992
Schneider FD Leiterer R Morsdorf F Gastellu-Etchegorry J-P Lauret N Pfeifer N 993
amp Schaepman ME (2014) Simulating imaging spectrometer data 3D forest modeling 994
based on LiDAR and in situ data Remote Sensing of Environment 152 235-250 995
Schroter D Cramer W Leemans R Prentice IC Araujo MB Arnell NW Bondeau 996
A Bugmann H Carter TR Gracia CA de la Vega-Leinert AC Erhard M Ewert 997
F Glendining M House JI Kankaanpaa S Klein RJT Lavorel S Lindner M 998
Metzger MJ Meyer J Mitchell TD Reginster I Rounsevell M Sabate S Sitch 999
S Smith B Smith J Smith P Sykes MT Thonicke K Thuiller W Tuck G 1000
38
Zaehle S amp Zierl B (2005) Ecosystem service supply and vulnerability to global change 1001
in Europe Science 310 1333-1337 1002
Sitch S Smith B Prentice IC Arneth A Bondeau A Cramer W Kaplan JO Levis 1003
S Lucht W Sykes MT Thonicke K amp Venevsky S (2003) Evaluation of ecosystem 1004
dynamics plant geography and terrestrial carbon cycling in the LPJ dynamic global 1005
vegetation model Global Change Biology 9 161-185 1006
Stewart DW Costa C Dwyer LM Smith DL Hamilton RI amp Ma BL (2003) 1007
Canopy structure light interception and photosynthesis in maize Agronomy Journal 95 1008
1465-1474 1009
Trnka M Dubrovsky M amp Zalud Z (2004) Climate change impacts and adaptation 1010
strategies in spring barley production in the Czech Republic Climatic Change 64 227-1011
255 1012
Turner DP Ritts WD Cohen WB Maeirsperger TK Gower ST Kirschbaum AA 1013
Running SW Zhao MS Wofsy SC Dunn AL Law BE Campbell JL Oechel 1014
WC Kwon HJ Meyers TP Small EE Kurc SA amp Gamon JA (2005) Site-level 1015
evaluation of satellite-based global terrestrial gross primary production and net primary 1016
production monitoring Global Change Biology 11 666-684 1017
van der Tol C Berry J Campbell PKE amp Rascher U (2014) Models of fluorescence 1018
and photosynthesis for interpreting measurements of solar-induced chlorophyll 1019
fluorescence Journal of Geophysical Research Biogeosciences IN PRESS 1020
van der Tol C Verhoef W amp Rosema A (2009a) A model for chlorophyll fluorescence 1021
and photosynthesis at leaf scale Agricultural and Forest Meteorology 149 96-105 1022
van der Tol C Verhoef W Timmermans A Verhoef A amp Su Z (2009b) An integrated 1023
model of soil-canopy spectral radiances photosynthesis fluorescence temperature and 1024
energy balance Biogeosciences 6 3109-3129 1025
Verhoef W (1984) Light scattering by leaf layers with application to canopy reflectance 1026
modeling The SAIL model Remote Sensing of Environment 16 125-141 1027
Verhoef W amp Bach H (2003a) Remote sensing data assimilation using coupled radiative 1028
transfer models Physics and Chemistry of the Earth 28 3-13 1029
Verhoef W amp Bach H (2003b) Simulation of hyperspectral and directional radiance 1030
images using coupled biophysical and atmospheric radiative transfer models Remote 1031
Sensing of Environment 87 23-41 1032
39
Verhoef W amp Bach H (2007) Coupled soil-leaf-canopy and atmosphere radiative transfer 1033
modeling to simulate hyperspectral multi-angular surface reflectance and TOA radiance 1034
data Remote Sensing of Environment 109 166-182 1035
Verhoef W Jia L Xiao Q amp Su Z (2007) Unified optical-thermal four-stream radiative 1036
transfer theory for homogeneous vegetation canopies Ieee Transactions on Geoscience 1037
and Remote Sensing 45 1808-1822 1038
Webb EK Pearman GI amp Leuning R (1980) Correction of flux measurements for 1039
density effects due to heat and water-vapour transfer Quarterly Journal of the Royal 1040
Meteorological Society 106 85-100 1041
Wu C Niu Z Tang Q amp Huang W (2010) Revised photochemical reflectance index 1042
(PRI) for predicting light use efficiency of wheat in a growth cycle validation and 1043
comparison International Journal of Remote Sensing 31 2911-2924 1044
Yang X Tang J Mustard JF Lee JE Rossini M Joiner J Munger JW Kornfeld 1045
A amp Richardson AD (2015) Solar-induced chlorophyll fluorescence that correlates with 1046
canopy photosynthesis on diurnal and seasonal scales in a temperate deciduous forest 1047
Geophysical Research Letters 1048
Zarco-Tejada PJ Berni JAJ Suarez L Sepulcre-Canto G Morales F amp Miller JR 1049
(2009) Imaging chlorophyll fluorescence with an airborne narrow-band multispectral 1050
camera for vegetation stress detection Remote Sensing of Environment 113 1262-1275 1051
Zarco-Tejada PJ Gonzalez-Dugo V amp Berni JAJ (2012) Fluorescence temperature and 1052
narrow-band indices acquired from a UAV platform for water stress detection using a 1053
micro-hyperspectral imager and a thermal camera Remote Sensing of Environment 117 1054
322-337 1055
Zarco-Tejada PJ Morales A Testi L amp Villalobos FJ (2013) Spatio-temporal patterns 1056
of chlorophyll fluorescence and physiological and structural indices acquired from 1057
hyperspectral imagery as compared with carbon fluxes measured with eddy covariance 1058
Remote Sensing of Environment 133 102-115 1059
Zhang Q Middleton EM Cheng YB amp Landis DR (2013) Variations of foliage 1060
chlorophyll fAPAR and foliage non-chlorophyll fAPAR (fAPARchl fAPARnonchl) at the 1061
Harvard Forest Ieee Journal of Selected Topics in Applied Earth Observations and Remote 1062
Sensing 6 2254-2264 1063
Zhang Q Middleton EM Gao BC amp Cheng YB (2012) Using EO-1 hyperion to 1064
simulate HyspIRI products for a coniferous forest The fraction of par absorbed by 1065
40
chlorophyll (fAPAR chl) and leaf water content (LWC) Ieee Transactions on Geoscience 1066
and Remote Sensing 50 1844-1852 1067
Zhang Y Guanter L Berry JA Joiner J van der Tol C Huete A Gitelson A Voigt 1068
M amp Koumlhler P (2014) Estimation of vegetation photosynthetic capacity from space-1069
based measurements of chlorophyll fluorescence for terrestrial biosphere models Global 1070
Change Biology 20 3727-3742 1071
1072
41
Appendix-A APEX data calibration 1073
The calibration of APEX images is based on the APEX Processing and Archiving Facility 1074
(PAF) which is the combined software and hardware designed to generate calibrated level 1 1075
at-sensor radiances from APEX raw image streams (Hueni et al 2009) Calibration 1076
coefficients for the radiometric geometric and spectral calibrations are generated from system 1077
calibrations at the APEX Calibration Home Base (CHB) at DLR Oberpfaffenhofen (Gege et 1078
al 2009) These CHB data are stored and processed within the APEX Calibration Information 1079
System (CAL IS) producing the so-called calibration cubes holding coefficients for each 1080
spatio-spectral pixel (Hueni et al 2013) 1081
For the multi-temporal dataset employed within this study all flight lines were 1082
reprocessed from the original raw image streams to ensure that the same version of the 1083
processor was applied The APEX PAF and CAL IS have significantly evolved over the 1084
timeframe of the dataset with calibrations getting more accurate over the years To ensure 1085
consistency all data were calibrated using coefficients obtained in May 2013 1086
The processor was specifically configured to retain the highest information content in 1087
the VNIR channel including i) no spectral resampling to compensate for spectral shifts and 1088
misregistrations (DOdorico et al 2010 DOdorico et al 2011) ii) no compensation of 1089
spectral shift related changes in radiometry (Hueni et al 2015) and iii) no spatial 1090
misregistration correction The calibration was thus effectively reduced to a linear dark 1091
current correction over time a de-smearing of the visible-NIR channel to compensate for 1092
sensor smear effects the application of radiometric gains and offsets followed by a destriping 1093
routine working in the spatial dimension only to remove pushbroom related along track 1094
striping Calibrated radiance data were directly used for the fluorescence retrieval (see Section 1095
24) while the feasibility to use APEX for SIF760 retrievals was theoretically demonstrated in 1096
42
a study of Damm et al (2011) Resulting SIF760 maps were afterwards geo-rectified using a 1097
parametric geocoding approach (Schlaumlpfer and Richter 2002) 1098
43
Appendix-B Retrieval of SIF760 from airborne data 1099
The quantification of SIF measured with ground or airborne-based spectrometers 1100
requires separating emitted SIF from the reflected radiance flux The Fraunhofer Line Depth 1101
(FLD) approach introduced by Plascyk (1975) serves as a de facto standard for medium 1102
resolution instruments such as APEX (Meroni et al 2009) and was applied in our study The 1103
FLD method uses atmospheric absorption bands characterized by lower incident light 1104
compared to wavelength regions outside of these bands This configuration increases the 1105
spectral information and allows the separation of SIF from reflected radiation In this study 1106
we used the broad O2-A oxygen absorption band around 760 nm and quantified the infilling of 1107
SIF760 using radiance measurements inside (subscript i) and outside (subscript o) of the O2-A 1108
band 1109
For the airborne case only atmospheric components can be simulated with 1110
MODTRAN-5 assuming perfect knowledge of the acquisition conditions The reflectance 1111
terms for diffuse and direct irradiance as well as the SIF760 contribution are usually unknown 1112
Assuming Lambertian surface reflectance behavior which introduces some inaccuracies but 1113
allows formulating the radiative transfer (RT) for radiance measurements at sensor level (LAtS) 1114
to obtain SIF760 both measurements inside and outside of the absorption band can be 1115
expressed as 1116
E9FA lang3H IJK LMNrangP QlangRSE rang T UlangVWWH VXWH rang∙langVYYH VYXH rangZH
Hlang[XXH rang T ABCHUlangVWWH ranglangVXWH rangZHlang[XXH rang ] ^ _ (B1) 1117
where E0 is the top-of-atmosphere irradiance including diffuse and direct irradiance 1118
components θil is the illumination zenith angle ρso is the path scattered radiance τss is the 1119
direct transmittance for sunlight τoo is the direct transmittance in view direction τsd is the 1120
diffuse transmittance of the atmosphere for sunlight τdo is the hemispherical-directional 1121
transmittance in view direction and ρdd is the spherical albedo If these atmospheric 1122
44
components are obtained from MODTRAN-5 simulations (Damm et al 2015 Verhoef and 1123
Bach 2003a b 2007) the radiative transfer equation (Eq B1) only contains four unknowns 1124
namely Ri Ro SIFi and SIFo The 3FLD method (Maier et al 2003) which is an adaptation of 1125
the original FLD method proposed by (Plascyk 1975) was used to linearly relate R and SIF 1126
inside and outside of the O2-A absorption band SIF can be finally retrieved with 1127
13 -0 abcMUdWecWlangRff_ rangZghcWUdMecMlangRff^ rangZiUdWecWlangRff_ rangZghUdMecMlangRff^ rangZ j
langVWWM ranglangVXWM rang (B2) 1128
kE lE9FA m lang3HW IJK LMNrangP langRSE rangn ] ^ _ (B3) 1129
E lang3HW IJK LMNrangP langoSSE TopSE rang ∙ langoE opE rang qEprs T Eprt] ^ _ (B4) 1130
r S13rlangoSSr rang T langopSr rang v13S$langoSSS rang T langopSS rangw (B5) 1131
where B is the factor relating SIFi and SIFo and was fixed to a value of 08 justified by 1132
simulations and experiments (Rascher et al 2009 Alonso et al 2008) Xj equals the at-1133
sensor radiance (reflected plus emitted radiation) without path radiance contribution and Ej 1134
expresses surface irradiance as measured at the sensor level A is the factor relating Ri and Ro 1135
and was derived from linear interpolation of R of the left (758 nm) and right (771 nm) O2-A 1136
band shoulder with 1137
xx+ (B6) 1138
y ```-0```z and y `-0`z
```z (B7) 1139
1140
Because APEX suffered from slight spectral smile effects (DOdorico et al 2010) 1141
updated center wavelength positions were involved in the convolution approach The spectral 1142
shift quantification for each pixel across track was based on the Cr method as described in 1143
45
Meroni et al (2010) The method assumes a high correlation between a measured and a 1144
convolved spectrum and iteratively minimizes a cost function which is 1 minus the Pearson 1145
correlation coefficient (r) calculated for both signals Remaining artifacts of the spectral shift 1146
correction and slightly inaccurate estimates of atmospheric properties cause SIF760 retrieval 1147
uncertainties We therefore applied a semi-empirical correction as described in Damm et al 1148
(2014) for each scan line across the track This technique employs reference surfaces which 1149
are free of any SIF760 emission (eg bare soil) to adjust the upward transmittance term inside 1150
the absorption feature oSSr The retrieval of SIF760 from top-of-canopy radiance data measured 1151
on ground follows the same approach as described in Eqs B2-B7 under the assumption that 1152
the surface irradiance can be approximated with the measurement of a reference panel and 1153
that ρso τdo and τdo can be set to 0 Furthermore the spectral resolution of APEX can be 1154
considered suboptimal for SIF760 retrievals although Damm et al (2011) demonstrate that 1155
APEX with its spectral resolution of 54 nm at 760 nm is sensitive for SIF760 However 1156
retrieved SIF760 values are too high and in an absolute sense incorrect We used reference 1157
SIF760 data obtained in parallel to the airborne acquisitions using the ASD field spectrometers 1158
(Section 23) to estimate the actual offset The observed scaling factor of 193 was afterwards 1159
applied to the retrieved SIF760 values to transfer them to a realistic value range 1160
46
Appendix-C SIF retrieval accuracy 1161
We applied a quantitative accuracy evaluation of resulting SIF760 maps using ground 1162
measured SIF760 values (Figure C1) Considering all reference data acquired during five 1163
campaigns a good linear relationship was achieved between ground and airborne-based 1164
SIF760 values (r2 = 071) but with a proportionality factor much higher than 1 (Figure C1-A) 1165
This experimentally obtained systematic overestimation of APEX SIF760 is comparable to 1166
simulation results documented in Damm et al (2011) Further we found slightly changing 1167
correlations between the different years (several linear models in Figure C1-A) which are 1168
likely caused by canopy structural effects spectral and radiometric performances of used 1169
ground instruments or slight deviations of the performance of APEX over time 1170
To compensate for the overestimation of APEX SIF760 we applied an empirical correction 1171
factor of 193 derived from the comparison of reference data and APEX which resulted in a 1172
rRMSE of 289 (Figure C1-B) 1173
1174
lt Figure C1 gt 1175
1176
The Laegeren site was covered with three adjacent flight lines having an overlap of 1177
approximately 10 (cf Figure 3) This configuration provides the opportunity to 1178
quantitatively evaluate the consistency of SIF retrievals obtained from different measurements 1179
and view zenith angles (ie plusmn 135deg) The comparison of SIF760 retrievals obtained from flight 1180
lines 1 and 2 reveals a moderate linear relationship for homogeneous agricultural surfaces (r2 1181
= 081 rRMSE = 57) We observed a systematic underestimation of flight line 1 compared 1182
to flight line 2 (factor 06) for a view zenith angle difference of ~26deg for SIF760 indicating 1183
either a directionality of SIF760 emissions or an insufficient decoupling of surface HCRF 1184
affected by reflectance anisotropy With increasing surface heterogeneity scattering increases 1185
47
and the agreement of retrieved SIF from both flight lines slightly decreases (ie for forested 1186
areas r2 of 05 and rRMSE of 88) This lower correlation can be mainly associated to slight 1187
geometric mis-registrations (ie max 2 pixel ~ 40 m) in combination with surface 1188
heterogeneity (eg shaded and sunlit tree crowns) and emission anisotropy of SIF760 Also 1189
negative SIF760 values are present in the SIF760 maps and caused by sensor noise and 1190
especially for forests due to shadowing effects (Damm et al 2015) 1191
48
Appendix-D Technical aspects determining the SIF760 retrieval accuracy 1192
A rigorous evaluation of the SIF760 retrieval accuracy is crucial to judge the reliability 1193
of our assessment on the relationship between SIF760 and GPPEC across ecosystems 1194
Furthermore additional factors imposing variations on SIF760 retrieved from airborne 1195
spectroscopy data that cannot be related to the physiological origin of SIF760 needs to be 1196
critically discussed to justify the proposed approach 1197
Ground-based measurements of SIF760 were made using field spectrometers to validate 1198
the airborne retrievals Field spectroscopy provides a good reference for validating airborne 1199
retrievals as it is likely not affected by biases resulting from atmospheric composition 1200
estimates (eg aerosol load) due to the simultaneous measurement of irradiance fluxes at 1201
canopy level using a reference panel The reliability of the applied field spectroscopic 1202
approach to measure SIF760 was previously demonstrated using field studies (Damm et al 1203
2010 Liu and Cheng 2010 Meroni et al 2009 Rascher et al 2009) and theoretical 1204
assessments (Damm et al 2011) It must be noted that field spectroscopic approaches are 1205
subject to uncertainties particularly for heterogeneous vegetation canopies Damm et al 1206
(2015) discussed retrieval errors caused by illumination effects likely introducing slight 1207
errors in reference SIF760 This source of uncertainty must be considered when judging the 1208
accuracy of APEX SIF760 The nevertheless good agreement between ground and airborne 1209
observations indicated that atmospheric absorption and scattering effects could be sufficiently 1210
compensated and thus demonstrated the reliability of retrieved SIF760 measurements In 1211
particular the empirical correction applied making use of high spatial resolution airborne IS 1212
data in combination with reference surfaces not emitting SIF760 allowed to bypass retrieval 1213
uncertainties caused by atmospheric effects (Damm et al 2014) 1214
Instrumental effects in combination with retrieval methods were found to cause 1215
systematic differences in SIF760 retrievals (Damm et al 2011) the comparatively low 1216
49
resolution of APEX around the O2-A band used to retrieve SIF760 (ie ~54 nm) resulted in an 1217
overestimation of APEX SIF760 compared to retrievals from high resolution instruments 1218
Indeed maximum APEX SIF760 values are 6 mW m-2 sr-1 nm-1 while typical SIF760 values 1219
obtained from high resolution instruments range between 0 and 3 mW m-2 sr-1 nm-1 (Guanter 1220
et al 2013) Considering SIF760 values retrieved from ASD data in original resolution (3 nm) 1221
APEX showed an overestimation of 1102 which confirmed that low spectral resolution 1222
resulted in an overestimation of SIF760 The reasoning for this absolute error is given by the 1223
sub-optimal spectral resolution of APEX with 54 nm at 760 nm causing a reduced sensitivity 1224
for SIF760 on the one hand and a wider distance of the O2-A shoulder values used to 1225
parameterize the 3FLD approach on the other hand The bias was corrected using the ASD 1226
reference data and does not impact the results of our analysis Further the relative variation of 1227
SIF760 is unaffected by the bias 1228
Surface heterogeneity complicates the retrieval of SIF760 According to Damm et al 1229
(2015) SIF760 retrievals for forest sites are especially subject to uncertainties due to 1230
assumptions on surface irradiance Crown shapes and associated surface orientations 1231
determine the intensity and quality of irradiance including fractional amounts of diffuse and 1232
direct irradiance To account for pixel wise changes in surface irradiance high resolution 1233
digital object models (DOM) (eg derived from LiDAR observations) are required In 1234
absence of such a high resolution DOMrsquos crowns are assumed to be flat which results in 1235
uncertainties of up to 58 in case of cast shadows (Damm et al 2015) Since we used 1236
averaged observations over larger areas representing flux tower footprints and most of our 1237
data were flown under comparable illumination conditions (ie around solar noon) we 1238
expect these potential biases to be less influential in this analysis 1239
1
Tables 1
Table 1 Date and time of APEX flights and corresponding eddy covariance flux tower 2
measurements for the three investigated ecosystems (ie grassland cropland mixed 3
temperate forest) 4
Date Time [UTC] Location Ecosystem Flux tower
17062009 950 Laegeren forest 1 tower
17062009 1030 Oensingen cropland 1 tower
17062009 1030 Oensingen grassland 2 tower
25062010 1030 Oensingen cropland 1 tower
25062010 1030 Oensingen grassland 2 tower
26062010 1500 Laegeren forest 1 tower
26062010 1030 Oensingen cropland 1 tower
26062010 1030 Oensingen grassland 2 tower
29062010 1030 Laegeren forest 1 tower
26062011 1030 Laegeren forest 1 tower
28062011 1030 Oensingen cropland 1 tower
28062011 1030 Oensingen grassland 1 tower
16062012 1025 Laegeren forest 1 tower
16062012 900 Oensingen cropland 1 tower
16062012 1100 Oensingen cropland 1 tower
12072013 730 Laegeren forest 1 tower
03092013 1050 Laegeren forest 1 tower
5
2
Table 2 Availability of reference SIF760 data obtained from field spectroscopy measurements 6
to validate APEX based SIF760 retrievals 7
Date time [UTC] Location Measured crops Nr points
17062009 1030 Oensingen maize rye pea sugar beet wheat white clover 29 points
25062010 1030 Oensingen maize pea sugar beet wheat white clover 15 points
16062012 900 Oensingen carrot maize winter wheat 11 points
16062012 1100 Oensingen carrot maize winter wheat 10 points
8
3
Table 3 Goodness of fit for the hyperbolic model describing the relationship between GPPEC 9
and SIF760 O PRI and MCARI2 for the three ecosystem types perennial grassland cropland 10
and mixed temperate forest Calculated statistics are based on all data acquired from 2009-11
2013 as described in Table 1 12
Optical variable Ecosystem Regression coefficient Relative RMSE []
SIF crops 088 355
grass 059 2708
forest 048 1588
PRI crops 0008 1176
grass 095 860
forest 009 2179
MCARI2 crops 0005 1029
grass 098 550
forest 034 1798
13
1
Figures 1
2
Figure 1 Study sites A Oensingen agricultural site B Laegeren forest site The white 3
rectangles represent in A the boundary of investigated fields that comprise most of the flux-4
tower footprints and in B a coarse outline of the footprint area of the flux-tower The white 5
crosses show the locations of the flux-towers Background RGB images from Google-Earth 6
2
7
Figure 2 APEX reflectance and SIF760 image for the Oensingen site acquired on the 2606 8
2010 1030 UTC A top-of-canopy hemispherical-conical reflectance data as true color 9
composite B SIF760 map The white boxes indicate the approximate position of the flux 10
tower 11
3
12
Figure 3 APEX reflectance and SIF760 image for the Laegeren site acquired on the 2606 13
2010 1510 UTC A top-of-canopy hemispherical-conical reflectance data as true color 14
composite B SIF760 map The black arrows indicate the flight direction of flight line 1 to 3 15
(FL1-FL3) The white line marks a transect along the overlapping region of FL1 and FL2 The 16
white boxes indicate the approximate position of the flux tower 17
4
18
Figure 4 Relationships between GPPEC from the eddy-covariance measurements and SIF760 O 19
instantaneously measured between 2009 and 2013 (see Table 1) with the airborne 20
spectrometer APEX (A) PRI index (B) and MCARI2 index (C) for three vegetation types 21
(black dots perennial grassland dark grey rectangles cropland including winter wheat pea 22
and barley grey triangles mixed temperate forest) The solid curves correspond to a 23
hyperbolic model fitted to the measured data The dashed curves show the extrapolated 24
behavior 25
5
26
Figure 5 Daily light response curves from eddy flux measurements for A cropland B 27
perennial grassland and C mixed temperate forest Data were acquired between 2009 and 28
2013 (see Table 1) Grey curves represent a fitted hyperbolic model to approximate the 29
behavior of measured PAR-GPP values Crosses show GPPEC measurements that were used 30
for the SIF760 O - GPPEC comparison based on the time of APEX flights PAR values are 31
binned in 20 mW m-2
sr-1
nm-1
increments 32
6
33
Figure 6 Leaf level relationships between photosynthetic (LUEp) and fluorescence yield 34
(LUEf) for a typical C3 crop Dependency of LUEp (A) and LUEf (B) on APAR C 35
Relationship between LUEp and LUEf D Relationship between APAR and GPPL GPPL was 36
calculated as APARLUEp E Relationship between APAR and SIF760 SIF760 was calculated 37
as APARLUEf assuming a constant relationship between the SCOPE output SIFtotalL 38
(integral between 640-850nm) and SIF760L F Relationship between SIF760 L and GPPL All 39
data were simulated using SCOPE The grey areas indicate illumination conditions 40
comparable to APEX flights 41
7
42
Figure 7 Canopy level relationships between photosynthetic (LUEp) and fluorescence yield 43
(LUEf) for different canopy representations of a C3 cropland in SCOPE Dependency of 44
LUEp (A) and LUEf (B) on APAR LUEp was calculate as GPPCAPAR and LUEf was 45
directly obtained from SCOPE C Relationship between LUEp and LUEf D Relationship 46
between APAR and GPPC GPPC was directly obtained from SCOPE E Relationship 47
between APAR and SIF760C SIF760C was directly obtained from SCOPE F Relationship 48
between SIF760C and GPPC The black dashed line corresponds to a C3 cropland with LAI = 49
30 fraction of brown pigments (Cs) = 00 and a spherical (sp) leaf inclination distribution 50
function (LIDF) For the grey line Cs was changed to 20 for the black dashed line the LAI 51
was changed to 10 and for the grey dasheddotted line the LIDF was changed to plagiophile 52
(pg) The grey areas indicate illumination conditions comparable to APEX flights 53
8
54
Figure 8 Impact of temporal scaling on the SIF760C-GPPC relationship SIF760C and GPPC 55
data were simulated using SCOPE Model input parameters air temperature (A) PAR (B) and 56
LAI (C) were measured within the NitroEurope project (httpwwwnitroeuropeeu) at the 57
Speulderbos forest site Netherlands D Relationship between SIF760C and GPPC including a 58
fitted hyperbolic model for daily averages (grey dots and grey line) monthly averages (dark 59
grey triangles and line) and quarterly data (black dots and black dashed line) 60
9
61
Figure C1 Comparison of ground and airborne-based SIF760 retrievals from various crops 62
Data were acquired during four campaigns between 2009 and 2012 in the agricultural site 63
Oensingen (see Table 2) Left Fitted linear regression lines for the four considered campaigns 64
are overlaid in black The dashed line corresponds to the 11 line Right SIF retrievals from 65
APEX after applying an empirical correction factor (193) The black line represents the fitted 66
linear model the dashed line corresponds to the 11 line 67
7
al 2007) were investigated as representatives of the ecosystem type perennial grassland as 151
well as a cropland (one field with arable crop rotation) for the ecosystem type cropland The 152
forest area (47deg2842rdquo N 8deg2152rdquo E Figure 1B) is located on the south-facing slope of the 153
Laegeren mountain northwest of the city of Zurich The temperate mixed forest is 154
characterized by a relatively high species diversity and a complex canopy structure with 155
beech ash sycamore and spruce being the dominant species (Eugster et al 2007 Schneider 156
et al 2014) 157
158
lt Figure 1 gt 159
160
Both test sites are well instrumented (ie with eddy-covariance flux towers 161
micrometeorological stations) and were extensively sampled during several airborne 162
campaigns between 2009 and 2013 (Table 1) 163
164
lt Table 1 gt 165
166
22 Airborne spectroscopy 167
All three study sites were measured with the Airborne Prism EXperiment (APEX) 168
sensor on several days between 2009 and 2013 (Table 1) APEX is an airborne dispersive 169
pushbroom imaging spectrometer covering the 400-2500 nm spectral region in 313 narrow 170
continuous spectral bands APEX allows capturing the O2-A atmospheric absorption feature 171
and thus retrieving SIF760 with a spectral sampling interval of 45 nm a full width at half 172
maximum (FWHM) of 57 nm and a signal to noise ratio of approximately 450 in and 800 173
outside of the O2-A feature for a 50 reflective target and a sun zenith angle of 30deg (Jehle et 174
al 2010 Schaepman et al 2015) 175
8
Radiance calibration of APEX images is performed using the approach of Hueni et al 176
(2009) Multitemporal comparison of images is secured by using consistent calibration and 177
processing versions Precise retrievals of SIF typically require data measured in sub-178
nanometer spectral resolution However the feasibility of using APEX like instruments (ie 179
FWHM ~5nm) for SIF760 retrievals was theoretically assessed in Damm et al (2011) and 180
experimentally demonstrated in recent work (Zarco-Tejada et al 2009 Zarco-Tejada et al 181
2013) The use of calibrated APEX radiance data for the fluorescence retrieval is described in 182
Section 24 and Appendix-B Vegetation indices (see Section 25) were calculated using 183
Hemispherical-Conical-Reflectance-Factor data obtained after atmospheric correction using 184
ATCOR-4 (Richter and Schlaumlpfer 2002) Resulting SIF760 and vegetation indices were 185
projected in the same map projection using parametric geocoding (Schlaumlpfer and Richter 186
2002) Details about APEX data calibration are listed in Appendix-A 187
188
23 Field spectroscopy 189
ASD (PANalytics Boulder US) field spectrometer data were acquired for validation 190
purposes within one hour of the APEX overflight during four campaigns In total 23 191
agricultural fields covering various crops including carrot maize pea rye sugar beet wheat 192
white clover were systematically sampled by measuring reflected and emitted radiances in 193
four homogeneous 3 m2 plots per field (Table 2) Incident light was quantified before and 194
after measuring each plot using a Spectralon reference panel 195
196
lt Table 2 gt 197
198
24 SIF760 retrieval 199
Emitted SIF was analytically separated from the reflected radiance flux measured with 200
ground and airborne-based spectrometers (see Appendix-B) We applied the Fraunhofer Line 201
9
Depth (FLD) approach (Plascyk 1975) which serves as a standard for SIF retrievals using 202
medium resolution instruments (Meroni et al 2009) The FLD method uses atmospheric 203
absorption bands characterized by lower incident light compared to wavelength regions 204
outside of these bands This configuration allows evaluating the in-filling of the absorption 205
bands by SIF (Damm et al 2014) In this study we used the broad O2-A oxygen absorption 206
band around 760 nm for the SIF760 retrieval For the ground data surface irradiance was 207
estimated from white reference measurements while perturbing atmospheric absorption and 208
scattering effects were assumed to be negligible on the 1 m pathway between canopy and 209
sensor (cf Damm et al (2014) for details on the set-up for SIF760 retrieval on the ground) 210
For the airborne measurements we compensated atmospheric absorption and scattering using 211
the atmospheric radiative transfer model MODTRAN5 (Berk et al 2005) Details of the 212
SIF760 retrievals using airborne data are provided in Appendix-B 213
214
25 Derivation of additional spectral indices 215
The relationship between two vegetation indices and GPP was investigated in parallel 216
to judge the performance of the new remote observation of SIF compared to commonly used 217
remote sensing approaches The photochemical reflectance index (PRI) (Gamon et al 1992) 218
was found to be sensitive to pigment changes related to the xanthophyll cycle and is 219
frequently used to quantify LUEp and GPP (Cheng et al 2013 Drolet et al 2008 Hilker et al 220
2009) The PRI was calculated as 221
(3) 222
while Rλ accounts for the surface reflectance at the wavelength λ 223
We further tested the soil adjusted Modified Chlorophyll Absorption Ratio Index 2 224
(MCARI2) (Haboudane et al 2004) that was found to be strongly related to green LAI thus 225
potential photosynthesis and is calculated as 226
10
2 $amp($)$+-amp0 (4) 227
228
26 Eddy-covariance measurements 229
Continuous turbulent fluxes of CO2 were measured at the agricultural and forest sites 230
between 2009 and 2013 using the EC technique (Baldocchi 2003) At each site the EC 231
instrumentation consisted of an open-path infrared gas analyzer (IRGA) (model LI-7500 LI-232
COR Inc Lincoln NE USA) and a three-dimensional sonic anemometer-thermometer 233
(models HS R3 and R2 Gill Instruments Lymington UK) EC measurements were made at a 234
frequency of 20 Hz and processed to half-hourly averages using the eth-flux EC software for 235
the forest and cropland (Mauder et al 2008) or a comparable custom-made EC software for 236
the grassland (Ammann et al 2007) Post-processing included corrections for damping losses 237
(Eugster and Senn 1995) air density fluctuations (Webb et al 1980) data screening for 238
optical sensor contamination stationary or low turbulence conditions (Foken and Wichura 239
1996) and statistical outliers Standardized gap filling and partitioning of CO2 fluxes was 240
performed using the methodology from Lasslop et al (2010) for the forest and cropland and 241
using the methodology from Falge et al (2001) for the grassland Measurements of 242
photosynthetic photon flux density (PPFD) quantified in micromol m-2 s-1 were converted to 243
radiance units (mW m-2 sr-1 nm-1) representing the photosynthetic active radiation (PAR) to 244
be consistent with Monteithrsquos LUE concept and the SIF radiance units 245
246
27 Leaf area index measurements 247
The Leaf Area Index (LAI) of the grassland and cropland was measured at the time of 248
APEX flights using an optical non-destructive approach based on LAI-2000 leaf area meter 249
observations (Li-Cor Lincoln USA) The LAI of the forest was estimated using digital 250
11
hemispherical photographs at two subplots following the VALERIE sampling scheme while 251
subsequent analysis were applied to obtain the LAI (Schneider et al 2014) 252
253
28 Statistical analysis of SIF760 - GPP relationship 254
SIF760 values were manually extracted from APEX-SIF760 maps for areas representing 255
the footprint of eddy-flux measurements (Figure 1) For the perennial grassland and cropland 256
we selected all pixels with SIF760 values ge 0 mW m-2 sr-1 nm-1 in respective fields although the 257
EC tower footprint can be slightly smaller than the entire field The increased number of 258
resulting pixels allows reducing data noise and covering small spatial variations within the 259
footprint Using the pixels of the entire field is justified by the large homogeneity of the 260
underlying fields (Figure 1A) For the forest site Laegeren all pixels representing an area that 261
covered 70 of all footprint occurrences were selected irrespective of spatial footprint 262
changes due to changing wind conditions Using the same area for all years reduces variations 263
in SIF due to changes in biomass and canopy structure but also reduces the representativeness 264
of selected pixels for actual spatial EC footprints 265
We used a hyperbolic model to relate GPP to SIF760 and to both vegetation indices 266
Although the hyperbolic model only empirically approximates the data behavior it is 267
supported by theoretical arguments for the SIF760-GPP relationship that are outlined hereafter 268
The photosynthetic efficiency LUEp is often described as a hyperbolic function of APAR 269
following the Michaelis-Menten theory (Michaelis and Menten 1913) 270
∙123467899 (5) 271
where c is a coefficient in radiance units and LUEpmax c represents GPPmax Following Eqs 272
(1) and (5) GPP rises asymptotically with APAR to GPPmax This equation is used in many 273
models for partitioning GPP eg Falge et al (2001) Substituting LUEp from Eq (5) and 274
APAR = SIF760 (LUEf fesc) from Eq (2) into Eq (1) results in 275
12
lt= gtampABCampD (6) 276
where the coefficient b represents cLUEffesc accounting for the difference between LUEp 277
and LUEf GPPmax is a value that is asymptotically reached representing the photosynthetic 278
capacity or GPP of the canopy at light saturation It must be noted that Eq (6) is a 279
simplification of the complex relationships between GPP and SIF760 and thus performs best if 280
c LUEf fesc remains constant or SIF760 corresponds to APAR A constant LUEf is a 281
reasonable first approximation for vegetation that is only moderately stressed meaning that 282
variations in LUEf are substantially smaller than variations in LUEp (van der Tol et al 2014) 283
Moderate stress relates to any kind of environmental conditions (warm temperature strong 284
irradiance reduced water availability) that cause only short term and slight changes in 285
photochemical and non-photochemical protections However c and fesc are known to vary 286
across ecosystems and LUEf changes under environmental stress In order to evaluate their 287
impacts on the SIF-GPP relationships as expressed in Eq (6) we carried out simulations with 288
the Soil-Canopy Observations of Photosynthesis and Energy balance model SCOPE version 289
153 (van der Tol et al 2009b) (see Section 29) The goodness of fit for the hyperbolic model 290
was quantified using non-linear regression analysis and was quantitatively described using the 291
root mean square error normalized by the mean of measured data (rRMSE) and the coefficient 292
of determination R2 defined as the correlation between data and the best fit-curve determined 293
by non-linear regression 294
295
29 SCOPE simulations 296
SCOPE uses semi-empirical models for LUEp (Collatz et al 1991) and LUEf (van der 297
Tol et al 2014) embedded in a radiative transfer scheme for the canopy (van der Tol et al 298
2009b) The radiative transfer model at leaf level (Fluspect) is an extension of PROSPECT 299
(Jacquemoud and Baret 1990) and includes a fluorescence component The radiative transfer 300
13
within the canopy is calculated following Verhoef (1984) in the optical domain (SAIL) 301
following Verhoef et al (2007) in the thermal domain and Miller et al (2005) for the 302
fluorescence emissions (FluorSAIL) SCOPE requires a number of vegetation structural and 303
physiological parameters as well as weather information as input The model simulates GPP 304
and spectrally distributes SIF with a spectral resolution and a spectral sampling interval of 10 305
nm each Simulated PPFD values (micromol m-2 s-1) were also converted to radiance units (PAR) 306
We carried out three simulations using SCOPE In the first simulation we calculated 307
leaf level LUEf and LUEp of a typical C3 cropland as function of varying APAR For the 308
second simulation at canopy level we calculated LUEf and LUEp as function of varying 309
APAR for differently structured canopies We took the standard SCOPE parameters for a 310
typical C3 cropland and varied APAR and the structural parameters LAI leaf inclination 311
angle (LIDF) and the fraction of brown pigments (Cs) Both simulation experiments provide 312
theoretical evidence on the relationships between LUEf and LUEp between SIF760 and GPP 313
and their respective relationships to APAR For the third canopy level simulation SCOPE 314
was initialized using time series of mid-day (solar noon) meteorological data (PAR air 315
temperature) a seasonal cycle of LAI and the modelrsquos default soil and vegetation parameters 316
for a C3 cropland (cf the SCOPE user manual) The purpose of this simulation was to 317
evaluate seasonal SIF760-GPP relationships at various temporal aggregation levels For better 318
readability we use the following notation through the manuscript SIF760 O for APEX-SIF 319
SIF760 L and SIF760 C for SCOPE simulated leaf and canopy SIF GPPEC for flux tower GPP 320
and GPPL GPPC to relate to simulated GPP at leaf and canopy level 321
322
3 Results 323
31 SIF760 maps 324
14
Two examples of SIF760 O maps obtained from APEX are shown in Figures 2 and 3 325
The appearance of SIF760 O emissions in vegetated areas demonstrates that measured SIF760 O 326
signals originated solely from vegetation and were not contaminated by non-fluorescent non-327
vegetation surfaces Retrieved SIF760 O values range between 0 and 3 mW m-2 sr-1 nm-1 and 328
showed a high agreement (r2 = 07 rRMSE = 289) with in-situ measured reference data 329
Details of the SIF760 O validation are discussed in Appendix-C 330
331
lt Figure 2 gt 332
lt Figure 3gt 333
334
32 Relationships of GPPEC with SIF760 O PRI and MCARI2 335
Relating instantaneous measurements of SIF760 O and GPPEC from several years 336
revealed an asymptotic relationship with saturating GPPEC in presence of moderate to high 337
SIF760 O (Figure 4A Table 3) This general behavior was consistent for all investigated 338
vegetation types The fitted hyperbolic model shows a moderate to high goodness of fit for the 339
grassland (R2 = 059 rRMSE = 271) cropland (R2 = 088 rRMSE = 35) and forest (R2 = 340
048 rRMSE = 1588) The saturation of GPPEC appeared earlier for the cropland (SIF760 O 341
~05 mW m-2 sr-1 nm-1) than for the grassland and forest (SIF760 O gt 10 mW m-2 sr-1 nm-1) An 342
independent assessment considering a linear model to describe the relationship between 343
SIF760 O and GPPEC revealed a consistently lower goodness of fit justifying the use of a 344
hyperbolic model (data not shown) 345
Statistical analysis showed that a hyperbolic model represents well the relationship 346
between both vegetation indices (PRI and MCARI2) and GPPEC for the grassland with a 347
notable variation in LAI (range between 05 and 48 m2 m-2) However a hyperbolic model 348
does not allow well representing the relationship between PRI and MCARI2 with GPPEC for 349
the forest and cropland both showing only a small variation in LAI (less than plusmn03 m2 m-2) 350
15
(Figure 4B-C Table 3) The goodness of fit for the hyperbolic model describing the PRI and 351
GPPEC data for grassland (R2 = 095 rRMSE = 86) was even higher compared to SIF760 O 352
but lower for forest (R2 = 009 rRMSE = 2179) and cropland (R2 = 0008 rRMSE = 353
1176) With MCARI2 the goodness of fit for the hyperbolic model for grassland was high 354
(R2 = 098 rRMSE = 55) but low for cropland (R2 = 0005 rRMSE = 1029) and forest 355
(R2 = 034 rRMSE = 1798) Again considering a linear relationship between both 356
vegetation indices and GPPEC revealed no consistent improvement compared to the use of a 357
hyperbolic model (data not shown) 358
359
lt Figure 4 gt 360
lt Table 3 gt 361
362
33 Assessment of factors determining SIF760 GPPEC relationships 363
The asymptotic relationship between SIF760 O and GPPEC (Figure 4A) represented 364
instantaneous measurements of different canopies at different times and days over several 365
years covering a range of different light conditions phenological stages of the forest and 366
various amounts of green biomass for both investigated grasslands (crosses in Figure 5A-C 367
that indicate EC measurements during APEX overpasses) Relationships between SIF760 O and 368
GPPEC are consequently a complex function of light absorption in the canopy (APAR) of the 369
efficiency of light utilization (ie expressed as photosynthetic capacity and quantum 370
efficiency of photosynthesis) and of structural effects including fractions of non-371
photosynthetic vegetation components Both grass canopies were measured before and after 372
mowing resulting in a large range in LAI (05-48 m2 m-2) and GPPEC (4-27 micromol m-2 s-1) for 373
similar PAR values The forest LAI of 50 m2 m-2 was more constant over the years due to the 374
consistent timing of flights however senescence (eg lower canopy chlorophyll content and 375
light absorption) might explain the decrease in GPPEC of 15 micromol m-2 s-1 in September for 376
16
comparable irradiance conditions (Figure 5C) Investigated crops (winter wheat barley and 377
pea) were characterized by small variations in LAI (22-25 m2 m-2) and chlorophyll contents 378
corresponding to small variations in GPPEC (5 micromol m-2 s-1) while observed under comparable 379
irradiance conditions During the time of observation the barley and wheat canopies were in 380
the ripening phase with a pronounced ear layer 381
382
lt Figure 5 gt 383
384
The validity of the asymptotic relationship between SIF760 O and GPPEC was tested 385
using simulations made with the SCOPE model We emphasize that the regression coefficient 386
b in Eq (6) includes terms that vary in the model (b= cmiddotLUEfmiddotfesc) the fluorescence efficiency 387
LUEf varies with irradiance conditions (predominantly APAR) the fraction fesc depends on 388
vegetation structure while c=GPPmaxLUEpmax varies between sites and over time during the 389
season We first analysed how LUEf and LUEp and consequently SIF760 and GPP vary at 390
leaf (ie SIF760 L and GPPL) and canopy levels (ie SIF760 C and GPPC) using the model of 391
van der Tol et al (2014) that is embedded in SCOPE For the leaf level Figure 6A shows a 392
decrease of LUEp with increasing APAR consistent with Eq (5) The relation between APAR 393
and LUEf appears more complex LUEf first increases with increasing APAR under low light 394
conditions reaches a climax at intermediate light and then decreases with increasing APAR 395
under higher APAR values (gt 50 mW m-2 sr-1 nm-1) (Figure 6B) The initial increase in LUEf 396
is caused by the decline in photochemical quenching of the excitons whereas the decrease of 397
LUEf is caused by the growing number of non-photochemical quenching traps that dissipate 398
light energy before it can be emitted as fluorescence light (van der Tol et al 2009a) It is 399
important to note that the range of LUEp is nearly an order of magnitude greater compared to 400
the range of LUEf (Figure 6C) Although LUEf is not constant we can still conclude that the 401
difference in both LUE terms causes an earlier saturation of leaf-level GPPL (Figure 6D) 402
17
compared to leaf-level SIF760 L (Figure 6E) with APAR leading to an asymptotic relationship 403
between SIF760 L and GPPL (Figure 6F) Our canopy level simulations confirm these trends 404
(Figure 7A-D) The in-field measured asymptotic relationships between SIF760 O and GPPEC 405
are consequently caused by the covariance of GPPEC and SIF760 O with APAR the 406
photosynthetic capacity with APAR and the different value ranges of LUEf and LUEp 407
Additionally our canopy level simulations suggest that structure impacts the SIF760 O - GPPEC 408
relationship Figure 7D shows an example that changing LAI leaf inclination angles or the 409
fraction of senescent plant material determine the curvature of the hyperbolic SIF760 C - GPPC 410
relationships 411
412
lt Figure 6 gt 413
lt Figure 7 gt 414
415
The modelled SIF760 LC - GPPLC curves (Figures 6D and 7D) also indicate that under 416
reduced light intensity GPP and SIF760 are almost linearly related while GPP tends to saturate 417
under higher light intensities Changes in APAR at canopy level are caused by either sun 418
elevation or in the case of a constant solar angle by canopy structure (ie shading fractional 419
vegetation cover) In complex structured canopies with many foliage layers the saturation of 420
GPP with APAR may not be observable because variations of APAR are less related to PAR 421
falling on the leaves but rather to the variation of leaf area exposed to light Model 422
simulations suggest that in complex canopies SIF760 saturates with APAR before GPP due to 423
fesc being lower with high APAR (data not shown) This structural effect reduces the curvature 424
of the hyperbolic leaf level GPPL- SIF760 L relationship at canopy level (compare Figures 6F 425
and 7F) Furthermore the effect of structure and APAR covary in time since canopy structure 426
(ie LAI) varies in concert with APAR during a seasonal cycle especially for crops We 427
18
expect that this covariance makes the relationship between GPP and SIF760 more linear at the 428
canopy level especially if observations are aggregated over time 429
To evaluate the structure related alleviation of the hyperbolic relationship between 430
SIF760 and GPP at canopy level in response to temporal aggregation we modelled an annual 431
course of GPPC and SIF760 C considering varying environmental conditions (Figure 8A-B) 432
ie PAR ranging from 0-500 mW m-2 sr-1 nm-1 air temperature ranging from 0-32degC using 433
data collected during 2009 at a Nitro-Europe flux tower site (Speulderbos The Netherlands) 434
and canopy properties ie LAI ranging from 15-30 m2 m-2 (Figure 8C) The LAI data are 435
synthetic but have a realistic seasonal cycle For daily noon values of modelled SIF760 C and 436
GPPC an asymptotic behaviour can be observed while GPPC tends to saturate compared to 437
SIF760 C The SIF760C-GPPC relationship tends to become linear when monthly or quarterly 438
averages are considered (Figure 8D) 439
440
lt Figure 8 gt 441
442
This visual trend can be confirmed by statistical measures for daily aggregated values 443
the hyperbolic model (rRMSE = 174 R2 = 070) performed slightly better than the linear 444
model (rRMSE = 185 r2 = 068) In case of monthly aggregated data both the hyperbolic 445
and linear models performed similarly while the linear model gave better results (RMSE = 446
90 r2 = 090) than the hyperbolic model (rRMSE = 94 R2 = 088) for quarterly aggregated 447
data 448
449
4 Discussion 450
Significant relationships between remotely measured SIF and ecosystem GPP have 451
been reported in the past (Frankenberg et al 2011 Guanter et al 2014) however sufficient 452
19
process understanding for using SIF as proxy for GPP across ecosystems is still limited 453
(Porcar-Castell et al 2014) Below we discuss how our observational and modeling 454
approaches help bridging the gap between mechanistic understanding at the leaf level and 455
ecosystem-specific observations and thus provide insights on mechanisms determining the 456
complex relationship between SIF and GPP 457
458
41 Insights from the observational approach 459
Our results showed ecosystem-specific asymptotic relationships between SIF760 O and 460
GPPEC for the three investigated ecosystems mixed temperate forest cropland and perennial 461
grassland The varying SIF-GPP relationships across ecosystems were consistent with results 462
recently reported from combined satellite observations and model predictions (Guanter et al 463
2012) Our results showed that the relationships of both tested vegetation indices PRI and 464
MCARI2 to GPPEC experienced a higher variability across ecosystems compared to SIF760 O 465
SIF760 O showed an ecosystem-specific and overall moderate to good relationship (R2 between 466
048 and 088) to GPPEC for the three ecosystems Both vegetation indices showed only strong 467
relationships for the grassland (R2 = 095 and 098) that notably changed in LAI during the 468
various observations It is important to note that we do not further elaborate on the underlying 469
mechanisms relating vegetation indices and GPPEC and that it is unclear if hyperbolic models 470
best describe their relationships to GPPEC based on mechanistic principles The intention of 471
evaluating the relationships between GPPEC and both vegetation indices was to provide a base 472
to judge the performance of SIF760 O in relation to these commonly used remote observations 473
The diversity of sampled conditions and used data sources provide further evidence on 474
the robustness of observed SIF760 O-GPPEC relationships Our measurements represent various 475
canopies characterized by different biomasses sampled over several years Although most 476
observations were acquired under similar light condition and physiological states a few 477
measurements represented lower light conditions and other physiological states This suggests 478
20
that observed relationships are rather robust across different representations of APAR LUEp 479
and LUEf Furthermore we use data from different sources ie four EC flux towers the 480
APEX imaging spectrometer and modeling at leaf and canopy levels to reduce the 481
uncertainties associated with each method of measurements and to get a better understanding 482
of the SIF760 O-GPPEC relationship at ecosystem level 483
Flux tower measurements are representative of a certain source area (footprint) from 484
the ecosystem which changes constantly based on wind direction and turbulent state of the 485
atmosphere Depending on the heterogeneity of the ecosystem GPPEC signals can vary in 486
response to changing footprints (Barcza et al 2009 Kljun et al 2004) although this variation 487
should be rather small if the vegetation is homogeneous Remote measurements of SIF760 are 488
likely representative of the upper layer of the ecosystem thus vertical canopy heterogeneity 489
potentially leads to a mismatch when compared to GPPEC which integrates over the different 490
layers of the ecosystems This is expected to be especially the case in structurally complex 491
ecosystems such as forests Although the upper layer in forest ecosystems substantially 492
contributes to the total rate of GPPEC there are still many layers of leaves or needles within 493
the canopy photosynthesizing at different rates depending on their sunshade exposure In 494
addition understory vegetation in forest ecosystems can significantly contribute to GPPEC at 495
different rates depending on the ecosystem and time of year Even homogeneous vegetation 496
canopies like crops or grasslands can show vertical heterogeneity This is especially the case 497
at peak biomass during ripening or senescence During such phenological stages the top layer 498
of cereal crops consists of less fluorescing components (ie ears) and cereal crops or 499
grasslands can contain a higher fraction of brown pigments resulting in low SIF760 O values 500
while the entire canopy can still produce high photosynthetic rates and thus GPPEC (Damm et 501
al 2010) Indeed most of the crops investigated in our study were in the ripening phase with a 502
pronounced ear layer 503
21
This resulted in relatively low SIF760 O values and in high GPPEC and thus in a more 504
pronounced asymptotic relationship (cf Figure 4A Figure 7F) compared to results reported 505
for other crops (Guanter et al 2013 Guanter et al 2014) Further research is needed to better 506
understand the impact of vertical heterogeneity on GPPEC and SIF760 observations and their 507
respective relationships 508
Despite the technical aspects causing variations in retrieved SIF760 O (refer to 509
Appendix-D for a detailed discussion) canopy structure causes inherent variations in 510
measured SIF760 values and thus impacts SIF760-GPP relationships The combination of 511
complex canopy architecture and the distribution of absorbing and scattering elements 512
determine vegetation canopies to act as photon traps (Knyazikhin et al 2013 Lewis and 513
Disney 2007) Parts of emitted SIF760 photons from inner-canopy leaves are re-absorbed 514
while others escape the canopy in direction of the sensor The probability of photons escaping 515
the canopy is a function of canopy structure which implies sensitivity to measured SIF760 516
intensities for canopy structure In Eq (2) this sensitivity was approximated with the term 517
fesc In our analysis we minimized the impact of fesc by observing always the same forest area 518
representative for the EC tower footprint In less complex structured crop and grass canopies 519
we expect fesc to be less important However future research is required to quantify the impact 520
of fesc and to propose strategies to compensate its influence on SIF760 retrievals 521
522
42 Insights from the modeling approach 523
From a theoretical point of view radiative energy loss competes with photochemistry 524
and non-radiative energy dissipation for absorbed photons Considering that GPP and SIF760 525
can be conceptualized according to Eqs (1) and (2) SIF760 must show under certain 526
environmental conditions a sensitivity to photochemistry (Porcar-Castell et al 2014 van der 527
Tol et al 2009a van der Tol et al 2009b) This relationship is confirmed by our observational 528
data and other studies at leaf (Amoros-Lopez et al 2008) and canopy levels (Damm et al 529
22
2010) Our modeling results however indicated that the relationship between LUEf and LUEp 530
is subject to change hence impacting the sensitivity of SIF760 to track changes in GPP 531
(Figures 6C and 7C) 532
The asymptotic relationship between SIF760 and GPP theoretically predicted and 533
observed at leaf and canopy levels can be related in particular to the different value ranges of 534
both efficiency terms (LUEp and LUEf) (Figures 6C and 7C) while a complex set of 535
mechanisms causes an ecosystem dependency for SIF760-GPP relationships The 536
photosynthetic capacity of the entire ecosystem in combination with its vertical heterogeneity 537
determines differences in GPP and SIF760 and thus the slope and curvature of their respective 538
relationships Furthermore the initial slope of the asymptotic SIF760 - GPP relationship which 539
has a value of LUEpmax(LUEfmiddotfesc) is determined by a combination of the photosynthetic 540
efficiency and canopy structure Canopy structure and related shadowing effects alter the 541
average light interception and quality at leaf level (Nobel et al 1993 Stewart et al 2003) and 542
consequently the overall productivity of the canopy In the case of reduced APAR caused by 543
canopy shadowing the overall apparent stress level in the canopy and consequently the rate 544
of certain photoprotective mechanisms such as non-radiative energy dissipation is reduced 545
(Cheng et al 2015 Demmig-Adams 1998 Niinemets et al 2003) and observed GPP and 546
SIF760 fall in a range where they are more linearly related (cf Figure 6F and 7F) In addition 547
canopy level simulations show that the fraction of senescent plant material impacts the 548
curvature of the hyperbolic relationship 549
Recent literature reports linear relationships between satellite-based SIF and modeled 550
GPP (Frankenberg et al 2011 Guanter et al 2012 Guanter et al 2014) while we found 551
asymptotic relationships Both results are not contradicting if one considers the temporal 552
aggregation applied to the data Our results are based on instantaneous measurements while 553
monthly averages were calculated for the satellite data to minimize noise effects (Frankenberg 554
et al 2011 Guanter et al 2014) It is known from previous research that temporal averaging 555
23
tends to linearize the response between GPP and APAR (Ruimy et al 1995) as saturating 556
light conditions tend to be only a small fraction of averaged diurnalmonthly data 557
Aggregating GPPEC and APAR over different time scales also showed this effect (data not 558
shown) Because of the rather linear relationship between SIF760 and APAR we expect that 559
temporal aggregation tends to linearize the SIF760-GPP relationship as well A recent study 560
presenting continuous measurements of GPP and SIF760 over a temperate deciduous forest 561
support this hypothesis (Yang et al 2015) The increasing number of experiments using 562
autonomous spectrometer systems in combination with flux towers (Balzarolo et al 2011) 563
will likely provide more experimental results that supports this finding Our simulations 564
provide further evidence that the covariance of structure and APAR during a seasonal cycle 565
additionally tends to linearize the relationship between GPP and SIF760 if observations are 566
aggregated over time 567
The dependency of SIF760-GPP relationships on temporal aggregation requires special 568
attention since it has implications on the usage of SIF to constrain GPP In principle 569
conclusions and results obtained from temporally aggregated and instantaneous measurements 570
are valid if consistently related to the underlying temporal aggregation level Generalizing 571
conclusions obtained at various aggregation levels bears the risk for mis-interpretations eg 572
when vegetation models are refined or empirically re-calibrated using observations or for 573
projections of GPP using observational SIF data 574
575
43 Requirements for the use of SIF to assess GPP across ecosystems 576
The changing relationship between SIF760 and GPPEC with vegetation type challenges 577
the usage of SIF760 as a robust constraint to estimate GPP Specific strategies are required to 578
account for ecosystem (or species) specific sensitivities of SIF in general and SIF760 in 579
particular This includes i) integration platforms to combine observations and process 580
24
understanding and ii) accurate observations of additional vegetation and environmental 581
variables 582
Process-based models as data integration platform in combination with comprehensive 583
observations to sufficiently measure important environmental factors and vegetation 584
properties are considered as flexible and powerful framework Parazoo et al (2014) for 585
example proposed the combination of ensemble dynamic global vegetation models (DGVMs) 586
in combination with SIF as observational constraint Lee et al (2015) suggest incorporating 587
SIF in a climate model to utilize SIF as observational constraint of photosynthesis simulations 588
and subsequent calculations of carbon water and energy cycle information Yet other studies 589
propose using SIF to obtain physiological vegetation parameters ie Vcmax for improved 590
parameterizations of photosynthesis models to eventually model GPP (Zhang et al 2014) The 591
European space agencys (ESA) Earth Explorer 8 opportunity mission Fluorescence Explorer 592
(FLEX) suggests a combination of comprehensive observations (ie SIF over the full 593
emission spectrum vegetation ecosystems and actual environmental conditions) and process-594
based models (Guanter et al 2012) 595
Additional information is required to use SIF in process-based models as one has to 596
account for varying photosynthetic efficiencies of plants and prevailing stress responses 597
According to the conceptualization of GPP and SIF as given in Eqs (1) and (2) extracting 598
and evaluating the exact relationship between LUEp and LUEf is essential but requires 599
normalizing APAR and calculating both yields (Damm et al 2010 Govindjee 2004 Louis et 600
al 2005) Retrievals of APAR can be considered challenging (Garbulsky et al 2010 Gitelson 601
and Gamon 2015 Hanan et al 2002) as available approaches often utilize a-priori knowledge 602
of prevailing land cover or plant distribution functions and rely on the inversion of physical-603
based models or simple band ratios (Hilker et al 2008) Research is required to provide high 604
quality information on APAR not perturbed by light absorption of non-photosynthetic active 605
25
canopy elements (stems branches twigs) cf Zhang et al (2013 2012) that demonstrate 606
attempts to improve estimates of APAR 607
Observed SIF760 O - GPPEC relationships are additionally confounded by non-radiative 608
energy dissipation The PRI was designed to monitor pigment changes related to the 609
xanthophyll cycle (Gamon et al 1992) and provides access to this superimposing process 610
However reported sensitivities of PRI for other effects ie structure (Barton and North 611
2001) pigment pool sizes (Gamon and Berry 2012) illumination effects (Damm et al 2015) 612
and the results obtained in this study question the applicability of the PRI at canopy level 613
Alternative approaches such as the development of a canopy PRI as suggested by several 614
groups (Hernandez-Clemente et al 2011 Kovac et al 2013 Wu et al 2010) or the usage of 615
pigment compositions and other functional plant traits might represent interesting strategies 616
and should be elaborated in future research 617
Structural sensitivities of canopy leaving SIF signals are critical and require further 618
research The application of spectrally invariant correction factors eg the directional area 619
scattering factor (Knyazikhin et al 2013) or more advanced physically-based retrieval 620
schemes using combined atmosphere-canopy models (Damm et al 2015 Laurent et al 2013) 621
might provide potential strategies to compensate for canopy structural effects on retrieved 622
SIF760 623
Another important source of information that allows improving the usage of SIF as 624
constraint of GPP is to consider SIF emissions over the entire emission spectrum between 625
approximately 600 and 800 nm Recent research successfully demonstrated the 626
complementary information content of red-fluorescence retrieved in the O2-B band at 688 nm 627
(SIF688) compared to SIF760 because of the different contributions from photosystem I and II 628
(Rossini et al 2015) Yet other studies highlighted the potential to improve predictions of 629
LUEp and GPP using both SIF688 and SIF760 (Cheng et al 2013) 630
631
26
5 Conclusions 632
Remote sensing of SIF provides a new observational approach to assess terrestrial 633
GPP Compared to traditional greenness-based remote sensing parameters we found SIF760 to 634
be more consistently related to GPPEC These results in combination with the more direct 635
mechanistic link between SIF760 and photosynthesis suggest that using SIF760 provides a 636
strategy to decrease uncertainty in estimating GPP across ecosystems 637
Our observational and modeling approaches revealed asymptotic and ecosystem-638
specific relationships for SIF760 and GPPEC We identified a set of interlinked mechanisms 639
determining SIF760-GPPEC relationships to be ecosystem specific ie the photosynthetic 640
capacity and efficiency of ecosystems the confounding impact of non-radiative energy 641
dissipation (NPQ) as well as ecosystem structure and the fraction of non-photosynthetic 642
vegetation components We demonstrated that SIF760-GPPEC relationships scale with temporal 643
aggregation due to a covariance of canopy structure and APAR over the seasonal cycle 644
We suggest going beyond empirical and ecosystem-specific relationships instead 645
using instantaneous observations comprehensively providing information on the full SIF 646
emission vegetation status and functioning as well as environmental conditions in 647
combination with process-based models Such approaches eg suggested for ESArsquos potential 648
ldquoFluorescence Explorerrdquo (FLEX) Earth Explorer mission provide a flexible framework to 649
account for the various influencing factors identified and to successfully apply SIF as 650
constraint of unbiased global GPP estimates 651
Furthermore research is required to improve the comparison between observations of 652
GPPEC and SIF Both observations stem from conceptually contrasting technologies ie 653
measurements of gas exchange vs plant-light interactions and provide independent and 654
complementary access to study ecosystem photosynthesis Despite the need to harmonize 655
horizontally differing footprints the vertical heterogeneity of ecosystems including the 656
27
varying contributions from different ecosystem layers must be better understood to harmonize 657
and successfully integrate both measurements 658
659
Acknowledgements 660
This work was supported by a grant of the Swiss University Conference and ETH-661
Board in frame of the Swiss Earth Observatory Network (SEON) project and by a grant of the 662
European Space Agency (ESA) in frame of the FLEX-PARCS E Paul-Limoges was 663
supported in part by the Natural Sciences and Engineering Research Council of Canada 664
through a postgraduate scholarship We would like to thank the APEX team for acquiring the 665
APEX data Authors sequence is listed following the FLAE approach (doi 666
101371journalpbio0050018) 667
28
References 668
Ammann C Flechard CR Leifeld J Neftel A amp Fuhrer J (2007) The carbon budget of 669
newly established temperate grassland depends on management intensity Agriculture 670
Ecosystems amp Environment 121 5-20 671
Amoros-Lopez J Gomez-Chova L Vila-Frances J Alonso L Calpe J Moreno J amp 672
del Valle-Tascon S (2008) Evaluation of remote sensing of vegetation fluorescence by 673
the analysis of diurnal cycles International Journal of Remote Sensing 29 5423-5436 674
Baker NR (2008) Chlorophyll Fluorescence A probe of photosynthesis in vivo Annual 675
Review of Plant Physiology and Plant Molecular Biology 59 89-113 676
Baldocchi D Falge E Gu LH Olson R Hollinger D Running S Anthoni P 677
Bernhofer C Davis K Evans R Fuentes J Goldstein A Katul G Law B Lee 678
XH Malhi Y Meyers T Munger W Oechel W U KTP Pilegaard K Schmid 679
HP Valentini R Verma S Vesala T Wilson K amp Wofsy S (2001) FLUXNET A 680
new tool to study the temporal and spatial variability of ecosystem-scale carbon dioxide 681
water vapor and energy flux densities Bulletin of the American Meteorological Society 682
82 2415-2434 683
Baldocchi DD (2003) Assessing the eddy covariance technique for evaluating carbon 684
dioxide exchange rates of ecosystems past present and future Global Change Biology 9 685
479-492 686
Balzarolo M Anderson K Nichol C Rossini M Vescovo L Arriga N Wohlfahrt G 687
Calvet J-C Carrara A Cerasoli S Cogliati S Daumard F Eklundh L Elbers JA 688
Evrendilek F Handcock RN Kaduk J Klumpp K Longdoz B Matteucci G 689
Meroni M Montagnani L Ourcival J-M Sanchez-Canete EP Pontailler J-Y 690
Juszczak R Scholes B amp Pilar Martin M (2011) Ground-Based Optical Measurements 691
at European Flux Sites A Review of Methods Instruments and Current Controversies 692
Sensors 11 7954-7981 693
Barcza Z Kern A Haszpra L amp Kljun N (2009) Spatial representativeness of tall tower 694
eddy covariance measurements using remote sensing and footprint analysis Agricultural 695
and Forest Meteorology 149 795-807 696
Barton CVM amp North PRJ (2001) Remote sensing of canopy light use efficiency using 697
the photochemical reflectance index - Model and sensitivity analysis Remote Sensing of 698
Environment 78 264-273 699
Beer C Reichstein M Tomelleri E Ciais P Jung M Carvalhais N Roedenbeck C 700
Arain MA Baldocchi D Bonan GB Bondeau A Cescatti A Lasslop G Lindroth 701
29
A Lomas M Luyssaert S Margolis H Oleson KW Roupsard O Veenendaal E 702
Viovy N Williams C Woodward FI amp Papale D (2010) Terrestrial Gross Carbon 703
Dioxide Uptake Global Distribution and Covariation with Climate Science 329 834-838 704
Berk A Anderson GP Acharya PK Bernstein LS Muratov L Lee J Fox M 705
Adler-Golden SM Chetwynd JH Hoke ML Lockwood RB Gardner JA Cooley 706
TW Borel CC amp Lewis PE (2005) MODTRAN5 A reformulated atmospheric band 707
model with auxiliary species and practical multiple scattering options Proceedings of the 708
Society of Photo-Optical Instrumentation Engineer 5655 662-667 709
Cheng SJ Bohrer G Steiner AL Hollinger DY Suyker A Phillips RP amp 710
Nadelhoffer KJ (2015) Variations in the influence of diffuse light on gross primary 711
productivity in temperate ecosystems Agricultural and Forest Meteorology 201 98-110 712
Cheng Y-B Middleton EM Zhang Q Huemmrich KF Campbell PKE Corp LA 713
Cook BD Kustas WP amp Daughtry CS (2013) Integrating Solar Induced 714
Fluorescence and the Photochemical Reflectance Index for Estimating Gross Primary 715
Production in a Cornfield Remote Sensing 5 6857-6879 716
Collatz GJ Ball JT Grivet C amp Berry JA (1991) Physiological and environmental-717
regulation of stomatal conductance photosynthesis and transpiration - a model that 718
includes a laminar boundary-layer Agricultural and Forest Meteorology 54 107-136 719
DOdorico P Alberti E amp Schaepman ME (2010) In-flight spectral performance 720
monitoring of the Airborne Prism Experiment Applied Optics 49 3082-3091 721
DOdorico P Guanter L Schaepman ME amp Schlaumlpfer D (2011) Performance 722
assessment of onboard and scene-based methods for Airborne Prism Experiment spectral 723
characterization Applied Optics 50 4755-4764 724
Damm A Erler A Gioli B Hamdi K Hutjes R Kosvancova M Meroni M 725
Miglietta F Moersch A Moreno J Schickling A Sonnenschein R Udelhoven T 726
Van der Linden S Hostert P amp Rascher U (2010) Remote sensing of sun induced 727
fluorescence yield to improve modelling of diurnal courses of Gross Primary Production 728
(GPP) Global Change Biology 16 171-186 729
Damm A Erler A Hillen W Meroni M Schaepman ME Verhoef W amp Rascher U 730
(2011) Modeling the impact of spectral sensor configurations on the FLD retrieval 731
accuracy of sun-induced chlorophyll fluorescence Remote Sensing of Environment 115 732
1882-1892 733
Damm A Guanter L Laurent VCE Schaepman ME Schickling A amp Rascher U 734
(2014) FLD-based retrieval of sun-induced chlorophyll fluorescence from medium 735
30
spectral resolution airborne spectroscopy data Remote Sensing of Environment 147 256-736
266 737
Damm A Guanter L Verhoef W Schlaumlpfer D Garbari S amp Schaepman ME (2015) 738
Impact of varying irradiance on vegetation indices and chlorophyll fluorescence derived 739
from spectroscopy data Remote Sensing of Environment 156 202-215 740
Demmig-Adams B (1998) Survey of thermal energy dissipation and pigment composition in 741
sun and shade leaves Plant and Cell Physiology 39 474-482 742
Drolet GG Middleton EM Huemmrich KF Hall FG Amiro BD Barr AG Black 743
TA McCaughey JH amp Margolis HA (2008) Regional mapping of gross light-use 744
efficiency using MODIS spectral indices Remote Sensing of Environment 112 3064-3078 745
Eugster W amp Senn W (1995) A cospectral correction model for measurement of turbulent 746
NO2 fluxes Boundary-Layer Meteorology 74 321-340 747
Eugster W Zeyer K Zeeman M Michna P Zingg A Buchmann N amp Emmenegger 748
L (2007) Methodical study of nitrous oxide eddy covariance measurements using 749
quantum cascade laser spectrometery over a Swiss forest Biogeosciences 4 927-939 750
Falge E Baldocchi D Olson R Anthoni P Aubinet M Bernhofer C Burba G 751
Ceulemans R Clement R Dolman H Granier A Gross P Grunwald T Hollinger 752
D Jensen NO Katul G Keronen P Kowalski A Lai CT Law BE Meyers T 753
Moncrieff H Moors E Munger JW Pilegaard K Rannik U Rebmann C Suyker 754
A Tenhunen J Tu K Verma S Vesala T Wilson K amp Wofsy S (2001) Gap 755
filling strategies for defensible annual sums of net ecosystem exchange Agricultural and 756
Forest Meteorology 107 43-69 757
Falloon P amp Betts R (2010) Climate impacts on European agriculture and water 758
management in the context of adaptation and mitigation-The importance of an integrated 759
approach Science of the Total Environment 408 5667-5687 760
Foken T amp Wichura B (1996) Tools for quality assessment of surface-based flux 761
measurements Agricultural and Forest Meteorology 78 83-105 762
Fournier A Daumard F Champagne S Ounis A Goulas Y amp Moya I (2012) Effect 763
of canopy structure on sun-induced chlorophyll fluorescence Isprs Journal of 764
Photogrammetry and Remote Sensing 68 112-120 765
Frankenberg C Fisher JB Worden J Badgley G Saatchi SS Lee JE Toon GC 766
Butz A Jung M Kuze A amp Yokota T (2011) New global observations of the 767
terrestrial carbon cycle from GOSAT Patterns of plant fluorescence with gross primary 768
productivity Geophysical Research Letters 38 769
31
Gamon JA amp Berry JA (2012) Facultative and constitutive pigment effects on the 770
Photochemical Reflectance Index (PRI) in sun and shade conifer needles Israel Journal of 771
Plant Sciences 60 85-95 772
Gamon JA Coburn C Flanagan LB Huemmrich KF Kiddle C Sanchez-Azofeifa 773
GA Thayer DR Vescovo L Gianelle D Sims DA Rahman AF amp Pastorello 774
GZ (2010) SpecNet revisited bridging flux and remote sensing communities Canadian 775
Journal of Remote Sensing 36 S376-S390 776
Gamon JA Penuelas J amp Field CB (1992) A narrow-waveband spectral index that 777
tracks diurnal changes in photosynthetic efficiency Remote Sensing of Environment 41 778
35-44 779
Garbulsky MF Filella I Verger A amp Penuelas J (2014) Photosynthetic light use 780
efficiency from satellite sensors From global to Mediterranean vegetation Environmental 781
and Experimental Botany 103 3-11 782
Garbulsky MF Penuelas J Papale D Ardo J Goulden ML Kiely G Richardson 783
AD Rotenberg E Veenendaal EM amp Filella I (2010) Patterns and controls of the 784
variability of radiation use efficiency and primary productivity across terrestrial 785
ecosystems Global Ecology and Biogeography 19 253-267 786
Gege P Fries J Haschberger P Schoumltz P Schwarzer H Strobl P Suhr B Ulbrich 787
G amp Vreeling WJ (2009) Calibration facility for airborne imaging spectrometers 788
ISPRS Journal of Photogrammetry amp Remote Sensing 64 387ndash397 789
Gitelson AA amp Gamon JA (2015) The need for a common basis for defining light-use 790
efficiency Implications for productivity estimation Remote Sensing of Environment 156 791
196-201 792
Goetz SJ amp Prince SD (1999) Modelling terrestrial carbon exchange and storage 793
Evidence and implications of functional convergence in light-use efficiency Advances in 794
Ecological Research Vol 28 (pp 57-92) 795
Govindjee (2004) Chlorophyll a fluorescence A bit of basics and history In GC 796
Papageorgiou amp Govindjee (Eds) Chlorophyll a Fluorescence A Signature of 797
Photosynthesis Advances in Photosynthesis and Respiration (pp 1-42) Dordrecht 798
Springer 799
Guanter L Alonso L Gomez-Chova L Amoros-Lopez J Vila J amp Moreno J (2007) 800
Estimation of solar-induced vegetation fluorescence from space measurements 801
Geophysical Research Letters 34 doi 1010292007GL029289 802
32
Guanter L Alonso L Gomez-Chova L Meroni M Preusker R Fischer J amp Moreno 803
J (2010) Developments for vegetation fluorescence retrieval from spaceborne high-804
resolution spectrometry in the O2-A and O2-B absorption bands Journal of Geophysical 805
Research-Atmospheres 115 806
Guanter L Frankenberg C Dudhia A Lewis PE Goacutemez-Dans J Kuze A Suto H amp 807
Grainger R (2012) Retrieval and global assessment of terrestrial chlorophyll fluorescence 808
from GOSAT space measurements Remote Sensing of Environment 121 236-251 809
Guanter L Rossini M Colombo R Meroni M Frankenberg C Lee J-E amp Joiner J 810
(2013) Using field spectroscopy to assess the potential of statistical approaches for the 811
retrieval of sun-induced chlorophyll fluorescence from ground and space Remote Sensing 812
of Environment 133 52-61 813
Guanter L Zhang Y Jung M Joiner J Voigt M Berry JA Frankenberg C Huete 814
AR Zarco-Tejada P Lee J-E Moran MS Ponce-Campos G Beer C Camps-815
Valls G Buchmann N Gianelle D Klumpp K Cescatti A Baker JM amp Griffis 816
TJ (2014) Global and time-resolved monitoring of crop photosynthesis with chlorophyll 817
fluorescence Proceedings of the National Academy of Sciences of the United States of 818
America 111 E1327-E1333 819
Haboudane D Miller JR Pattey E Zarco-Tejada PJ amp Strachan IB (2004) 820
Hyperspectral vegetation indices and novel algorithms for predicting green LAI of crop 821
canopies Modeling and validation in the context of precision agriculture Remote Sensing 822
of Environment 90 337-352 823
Hanan NP Burba G Verma SB Berry JA Suyker A amp Walter-Shea EA (2002) 824
Inversion of net ecosystem CO2 flux measurements for estimation of canopy PAR 825
absorption Global Change Biology 8 563-574 826
Hernandez-Clemente R Navarro-Cerrillo RM Suarez L Morales F amp Zarco-Tejada 827
PJ (2011) Assessing structural effects on PRI for stress detection in conifer forests 828
Remote Sensing of Environment 115 2360-2375 829
Hilker T Coops NC Wulder MA Black TA amp Guy RD (2008) The use of remote 830
sensing in light use efficiency based models of gross primary production A review of 831
current status and future requirements Science of the Total Environment 404 411-423 832
Hilker T Gitelson A Coops NC Hall FG amp Black TA (2011) Tracking plant 833
physiological properties from multi-angular tower-based remote sensing Oecologia 165 834
865-876 835
33
Hilker T Lyapustin A Hall FG Wang Y Coops NC Drolet G amp Black TA 836
(2009) An assessment of photosynthetic light use efficiency from space Modeling the 837
atmospheric and directional impacts on PRI reflectance Remote Sensing of Environment 838
113 2463-2475 839
Hueni A Biesemans J Meuleman K DellEndice F Schlaumlpfer D Adriaensen S 840
Kempenaers S Odermatt D Kneubuehler M Nieke J amp Itten K (2009) Structure 841
Components and Interfaces of the Airborne Prism Experiment (APEX) Processing and 842
Archiving Facility IEEE Transactions on Geoscience and Remote Sensing 47 29-43 843
Hueni A Lenhard K Baumgartner A amp Schaepman M (2013) The APEX (Airborne 844
Prism Experiment - Imaging Spectrometer) Calibration Information System IEEE 845
Transactions on Geoscience and Remote Sensing 51 5169-5180 846
Hueni A Schlaepfer D Jehle M amp Schaepman M (2015) Impacts of Dichroic Prism 847
Coatings on Radiometry of the Airborne Imaging Spectrometer APEX Applied Optics 53 848
5344-5352 849
Imhoff ML Bounoua L Ricketts T Loucks C Harriss R amp Lawrence WT (2004) 850
Global patterns in human consumption of net primary production Nature 429 870-873 851
IPCC (2013) Summary for policymakers Climate change 2013 the physical science basis 852
Cambridge University Press Cambridge United Kingdom and New York NY USA 853
Jacquemoud S amp Baret F (1990) PROSPECT A model of leaf optical properties spectra 854
Remote Sensing of Environment 34 75-91 855
Jehle M Hueni A Damm A DOdorico P Kneubuumlhler M Meuleman K Schlapfer 856
D Schaepman ME amp Weyermann J (2010) APEX - current status performance and 857
validation concept IEEE Sensors 2010 Conference 533-537 858
Joiner J Guanter L Lindstrot R Voigt M Vasilkov AP Middleton EM Huemmrich 859
KF Yoshida Y amp Frankenberg C (2013) Global monitoring of terrestrial chlorophyll 860
fluorescence from moderate spectral resolution near-infrared satellite measurements 861
methodology simulations and application to GOME-2 Atmos Meas Tech Discuss 6 862
3883-3930 863
Jung M Reichstein M Margolis HA Cescatti A Richardson AD Arain MA 864
Arneth A Bernhofer C Bonal D Chen J Gianelle D Gobron N Kiely G Kutsch 865
W Lasslop G Law BE Lindroth A Merbold L Montagnani L Moors EJ 866
Papale D Sottocornola M Vaccari F amp Williams C (2011) Global patterns of land-867
atmosphere fluxes of carbon dioxide latent heat and sensible heat derived from eddy 868
34
covariance satellite and meteorological observations Journal of Geophysical Research-869
Biogeosciences 116 870
Kljun N Kastner-Klein P Fedorovich E amp Rotach MW (2004) Evaluation of 871
Lagrangian footprint model using data from wind tunnel convective boundary layer 872
Agricultural and Forest Meteorology 127 189-201 873
Kljun N Rotach MW amp Schmid HP (2002) A three-dimensional backward lagrangian 874
footprint model for a wide range of boundary-layer stratifications Boundary-Layer 875
Meteorology 103 205-226 876
Knyazikhin Y Schull MA Stenberg P Mottus M Rautiainen M Yang Y Marshak 877
A Latorre Carmona P Kaufmann RK Lewis P Disney MI Vanderbilt V Davis 878
AB Baret F Jacquemoud S Lyapustin A amp Myneni RB (2013) Hyperspectral 879
remote sensing of foliar nitrogen content Proceedings of the National Academy of 880
Sciences of the United States of America 110 E185-E192 881
Kovac D Malenovsky Z Urban O Spunda V Kalina J Ac A Kaplan V amp Hanus 882
J (2013) Response of green reflectance continuum removal index to the xanthophyll de-883
epoxidation cycle in Norway spruce needles Journal of Experimental Botany 64 1817-884
1827 885
Krausmann F Erb K-H Gingrich S Haberl H Bondeau A Gaube V Lauk C 886
Plutzar C amp Searchinger TD (2013) Global human appropriation of net primary 887
production doubled in the 20th century Proceedings of the National Academy of Sciences 888
of the United States of America 110 10324-10329 889
Lasslop G Reichstein M Papale D Richardson AD Arneth A Barr A Stoy P amp 890
Wohlfahrt G (2010) Separation of net ecosystem exchange into assimilation and 891
respiration using a light response curve approach critical issues and global evaluation 892
Global Change Biology 16 187-208 893
Laurent VCE Verhoef W Damm A Schaepman ME amp Clevers JGPW (2013) A 894
Bayesian object-based approach for estimating vegetation biophysical variables from at-895
sensor APEX radiance data Remote Sensing of Environment 139 6-17 896
Lee JE Berry JA Van der Tol C Yang X Guanter L Damm A Baker I amp 897
Frankenberg C (2015) Simulations of chlorophyll fluorescence in corporated into the 898
Community Land Model version 4 Global Change Biology in print 899
Lewis P amp Disney M (2007) Spectral invariants and scattering across multiple scales from 900
within-leaf to canopy Remote Sensing of Environment 109 196-206 901
35
Liu LY amp Cheng ZH (2010) Detection of Vegetation Light-Use Efficiency Based on 902
Solar-Induced Chlorophyll Fluorescence Separated From Canopy Radiance Spectrum Ieee 903
Journal of Selected Topics in Applied Earth Observations and Remote Sensing 3 306-312 904
Louis J Ounis A Ducruet JM Evain S Laurila T Thum T Aurela M Wingsle G 905
Alonso L Pedros R amp Moya I (2005) Remote sensing of sunlight-induced chlorophyll 906
fluorescence and reflectance of Scots pine in the boreal forest during spring recovery 907
Remote Sensing of Environment 96 37-48 908
Maier SW Guumlnther KP amp Stellmes M (2003) Sun-Induced Fluorescence A New Tool 909
for Precision Farming In M McDonald J Schepers L Tartly T van Toai amp D Major 910
(Eds) Digital Imaging and Spectral Techniques Applications to Precision Agriculture 911
and Crop Physiology (pp 209-222) ASA Special Publication 912
Mauder M Foken T Clement R Elbers JA Eugster W Gruenwald T Heusinkveld 913
B amp Kolle O (2008) Quality control of CarboEurope flux data - Part 2 Inter-914
comparison of eddy-covariance software Biogeosciences 5 451-462 915
Meroni M Busetto L Guanter L Cogliati S Crosta GF Migliavacca M Panigada 916
C Rossini M amp Colombo R (2010) Characterization of fine resolution field 917
spectrometers using solar Fraunhofer lines and atmospheric absorption features Applied 918
Optics 49 2858-2871 919
Meroni M Picchi V Rossini M Cogliati S Panigada C Nali C Lorenzini G amp 920
Colombo R (2008) Leaf level early assessment of ozone injuries by passive fluorescence 921
and photochemical reflectance index International Journal of Remote Sensing 29 5409-922
5422 923
Meroni M Rossini M Guanter L Alonso L Rascher U Colombo R amp Moreno J 924
(2009) Remote sensing of solar induced chlorophyll fluorescence review of methods and 925
applications Remote Sensing of Environment doi101016jrse200905003 926
Michaelis L amp Menten ML (1913) The kenetics of the inversion effect Biochemische 927
Zeitschrift 49 333-369 928
Middleton E McMurtney JE Campbell PK Corp LA Butcher LM amp Chappelle 929
EW (2002) Optical and fluorescence properties of corn leaves from different nitrogen 930
regimes In M Owe G Durso amp L Toulios (Eds) Conference on Remote Sensing for 931
Agriculture Ecosystems and Hydrology IV (pp 72-83) Agia Pelagia Greece 932
Miller JR Berger M Goulas Y Jacquemoud S Louis J Moise N Mohammed G 933
Moreno J Moya I Pedroacutes R Verhoef W amp Zarco-Tejada PJ (2005) Development 934
36
of a vegetation fluorescence canopy model Final Report May 2005 In European Space 935
Research and Technology Centre (ESTEC) 936
Monteith JL (1972) Solar-radiation and productivity in tropical ecosystems Journal of 937
Applied Ecology 9 747-766 938
Niinemets U Kollist H Garcia-Plazaola JI Hernandez A amp Becerril JM (2003) Do 939
the capacity and kinetics for modification of xanthophyll cycle pool size depend on growth 940
irradiance in temperate trees Plant Cell and Environment 26 1787-1801 941
Nobel PS Forseth IN amp Long SP (1993) Canopy structure and light interception 942
Ozanne CMP Anhuf D Boulter SL Keller M Kitching RL Korner C Meinzer 943
FC Mitchell AW Nakashizuka T Dias PLS Stork NE Wright SJ amp 944
Yoshimura M (2003) Biodiversity meets the atmosphere A global view of forest 945
canopies Science 301 183-186 946
Parazoo NC Bowman K Fisher JB Frankenberg C Jones DBA Cescatti A Peacuterez-947
Priego Oacute Wohlfahrt G amp Montagnani L (2014) Terrestrial gross primary production 948
inferred from satellite fluorescence and vegetation models Global Change Biology na-na 949
Plascyk JA (1975) MK II Fraunhofer Line Dicsriminator (FLD-II) for airborne and orbital 950
remote-sensing of solar-stimulated luminescence Optical Engineering 14 339-346 951
Porcar-Castell A Tyystjaumlrvi E Atherton J Van der Tol C Flexas J EE P Moreno 952
J Frankenberg C amp Berry JA (2014) Linking chlorophyll a fluorescence to 953
photosynthesis for remote sensing applications mechanisms and challenges Journal of 954
Experimental Botany 65 4065-4095 955
Rascher U Agati G Alonso L Cecci G Champagne S Colombo R Damm A 956
Daumard F De Miguel E Fernandez G Franch B Franke J Gerbig C Gioli B 957
Gomez JA Goulas Y Guanter L Gutierrez-De-La-Camara O Hamdi K Hostert 958
P Jimenez M Kosvancova M Lognoli D Meroni M Miglietta F Moersch A 959
Moreno J Moya I Neininger B Okujeni A Ounis A Palombi L Raimondi V 960
Schickling A Sobrino JA Stellmes M Toci G Toscano P Udelhoven T Van der 961
Linden S amp Zaldei A (2009) CEFLES2 The remote sensing component to quantify 962
photosynthetic efficiency from the leaf to the region by measuring sun-induced 963
fluorescence in the oxygen absorption bands Biogeosciences 6 1181-1198 964
Richter R amp Schlaumlpfer D (2002) Geo-atmospheric processing of airborne imaging 965
spectrometry data Part 2 Atmospherictopographic correction International Journal of 966
Remote Sensing 23 2631-2649 967
37
Rossini M Meroni M Migliavacca M Manca G Cogliati S Busetto L Picchi V 968
Cescatti A Seufert G amp Colombo R (2010) High resolution field spectroscopy 969
measurements for estimating gross ecosystem production in a rice field Agricultural and 970
Forest Meteorology 150 1283-1296 971
Rossini M Nedbal L Guanter L Ač A Alonso L Burkart A Cogliati S Colombo 972
R Damm A Drusch M Hanus J Julitta T Kokkalis P Moreno J Panigada C 973
Pinto F Schickling A Schuumlttemeyer D Zemek F amp Rascher U (2015) Red and far-974
red sun-induced chlorophyll fluorescence as a measure of plant photosynthesis 975
Geophysical Research Letters (accepted for publication) 976
Ruimy A Jarvis PG Baldocchi DD amp B S (1995) CO2 Fluxes over Plant Canopies 977
and Solar Radiation A Review Advances in Ecological Research 26 1-68 978
Running SW Nemani RR Heinsch FA Zhao MS Reeves M amp Hashimoto H 979
(2004) A continuous satellite-derived measure of global terrestrial primary production 980
Bioscience 54 547-560 981
Schaepman ME M J Hueni A DrsquoOdorico P Damm A Weyermann J Schneider F 982
Laurent VCE C P Seidel F Lenhard K Gege P Kuechler C Brazile J Kohler 983
P De Vos L Meuleman K Meynart R Schlaepfer D Kneubuumlhler M amp Itten K 984
(2015) Advanced radiometry measurements and Earth science applications with the 985
Airborne Prism Experiment (APEX) Remote Sensing of Environment 158 207-219 986
Schimel D Pavlick R Fisher JB Asner GP Saatchi S Townsend P Miller C 987
Frankenberg C Hibbard K amp Cox P (2014) Observing terrestrial ecosystems and the 988
carbon cycle from space Global Change Biology na-na 989
Schlaumlpfer D amp Richter R (2002) Geo-atmospheric processing of airborne imaging 990
spectrometry data Part 1 Parametric orthorectification International Journal of Remote 991
Sensing 23 2609-2630 992
Schneider FD Leiterer R Morsdorf F Gastellu-Etchegorry J-P Lauret N Pfeifer N 993
amp Schaepman ME (2014) Simulating imaging spectrometer data 3D forest modeling 994
based on LiDAR and in situ data Remote Sensing of Environment 152 235-250 995
Schroter D Cramer W Leemans R Prentice IC Araujo MB Arnell NW Bondeau 996
A Bugmann H Carter TR Gracia CA de la Vega-Leinert AC Erhard M Ewert 997
F Glendining M House JI Kankaanpaa S Klein RJT Lavorel S Lindner M 998
Metzger MJ Meyer J Mitchell TD Reginster I Rounsevell M Sabate S Sitch 999
S Smith B Smith J Smith P Sykes MT Thonicke K Thuiller W Tuck G 1000
38
Zaehle S amp Zierl B (2005) Ecosystem service supply and vulnerability to global change 1001
in Europe Science 310 1333-1337 1002
Sitch S Smith B Prentice IC Arneth A Bondeau A Cramer W Kaplan JO Levis 1003
S Lucht W Sykes MT Thonicke K amp Venevsky S (2003) Evaluation of ecosystem 1004
dynamics plant geography and terrestrial carbon cycling in the LPJ dynamic global 1005
vegetation model Global Change Biology 9 161-185 1006
Stewart DW Costa C Dwyer LM Smith DL Hamilton RI amp Ma BL (2003) 1007
Canopy structure light interception and photosynthesis in maize Agronomy Journal 95 1008
1465-1474 1009
Trnka M Dubrovsky M amp Zalud Z (2004) Climate change impacts and adaptation 1010
strategies in spring barley production in the Czech Republic Climatic Change 64 227-1011
255 1012
Turner DP Ritts WD Cohen WB Maeirsperger TK Gower ST Kirschbaum AA 1013
Running SW Zhao MS Wofsy SC Dunn AL Law BE Campbell JL Oechel 1014
WC Kwon HJ Meyers TP Small EE Kurc SA amp Gamon JA (2005) Site-level 1015
evaluation of satellite-based global terrestrial gross primary production and net primary 1016
production monitoring Global Change Biology 11 666-684 1017
van der Tol C Berry J Campbell PKE amp Rascher U (2014) Models of fluorescence 1018
and photosynthesis for interpreting measurements of solar-induced chlorophyll 1019
fluorescence Journal of Geophysical Research Biogeosciences IN PRESS 1020
van der Tol C Verhoef W amp Rosema A (2009a) A model for chlorophyll fluorescence 1021
and photosynthesis at leaf scale Agricultural and Forest Meteorology 149 96-105 1022
van der Tol C Verhoef W Timmermans A Verhoef A amp Su Z (2009b) An integrated 1023
model of soil-canopy spectral radiances photosynthesis fluorescence temperature and 1024
energy balance Biogeosciences 6 3109-3129 1025
Verhoef W (1984) Light scattering by leaf layers with application to canopy reflectance 1026
modeling The SAIL model Remote Sensing of Environment 16 125-141 1027
Verhoef W amp Bach H (2003a) Remote sensing data assimilation using coupled radiative 1028
transfer models Physics and Chemistry of the Earth 28 3-13 1029
Verhoef W amp Bach H (2003b) Simulation of hyperspectral and directional radiance 1030
images using coupled biophysical and atmospheric radiative transfer models Remote 1031
Sensing of Environment 87 23-41 1032
39
Verhoef W amp Bach H (2007) Coupled soil-leaf-canopy and atmosphere radiative transfer 1033
modeling to simulate hyperspectral multi-angular surface reflectance and TOA radiance 1034
data Remote Sensing of Environment 109 166-182 1035
Verhoef W Jia L Xiao Q amp Su Z (2007) Unified optical-thermal four-stream radiative 1036
transfer theory for homogeneous vegetation canopies Ieee Transactions on Geoscience 1037
and Remote Sensing 45 1808-1822 1038
Webb EK Pearman GI amp Leuning R (1980) Correction of flux measurements for 1039
density effects due to heat and water-vapour transfer Quarterly Journal of the Royal 1040
Meteorological Society 106 85-100 1041
Wu C Niu Z Tang Q amp Huang W (2010) Revised photochemical reflectance index 1042
(PRI) for predicting light use efficiency of wheat in a growth cycle validation and 1043
comparison International Journal of Remote Sensing 31 2911-2924 1044
Yang X Tang J Mustard JF Lee JE Rossini M Joiner J Munger JW Kornfeld 1045
A amp Richardson AD (2015) Solar-induced chlorophyll fluorescence that correlates with 1046
canopy photosynthesis on diurnal and seasonal scales in a temperate deciduous forest 1047
Geophysical Research Letters 1048
Zarco-Tejada PJ Berni JAJ Suarez L Sepulcre-Canto G Morales F amp Miller JR 1049
(2009) Imaging chlorophyll fluorescence with an airborne narrow-band multispectral 1050
camera for vegetation stress detection Remote Sensing of Environment 113 1262-1275 1051
Zarco-Tejada PJ Gonzalez-Dugo V amp Berni JAJ (2012) Fluorescence temperature and 1052
narrow-band indices acquired from a UAV platform for water stress detection using a 1053
micro-hyperspectral imager and a thermal camera Remote Sensing of Environment 117 1054
322-337 1055
Zarco-Tejada PJ Morales A Testi L amp Villalobos FJ (2013) Spatio-temporal patterns 1056
of chlorophyll fluorescence and physiological and structural indices acquired from 1057
hyperspectral imagery as compared with carbon fluxes measured with eddy covariance 1058
Remote Sensing of Environment 133 102-115 1059
Zhang Q Middleton EM Cheng YB amp Landis DR (2013) Variations of foliage 1060
chlorophyll fAPAR and foliage non-chlorophyll fAPAR (fAPARchl fAPARnonchl) at the 1061
Harvard Forest Ieee Journal of Selected Topics in Applied Earth Observations and Remote 1062
Sensing 6 2254-2264 1063
Zhang Q Middleton EM Gao BC amp Cheng YB (2012) Using EO-1 hyperion to 1064
simulate HyspIRI products for a coniferous forest The fraction of par absorbed by 1065
40
chlorophyll (fAPAR chl) and leaf water content (LWC) Ieee Transactions on Geoscience 1066
and Remote Sensing 50 1844-1852 1067
Zhang Y Guanter L Berry JA Joiner J van der Tol C Huete A Gitelson A Voigt 1068
M amp Koumlhler P (2014) Estimation of vegetation photosynthetic capacity from space-1069
based measurements of chlorophyll fluorescence for terrestrial biosphere models Global 1070
Change Biology 20 3727-3742 1071
1072
41
Appendix-A APEX data calibration 1073
The calibration of APEX images is based on the APEX Processing and Archiving Facility 1074
(PAF) which is the combined software and hardware designed to generate calibrated level 1 1075
at-sensor radiances from APEX raw image streams (Hueni et al 2009) Calibration 1076
coefficients for the radiometric geometric and spectral calibrations are generated from system 1077
calibrations at the APEX Calibration Home Base (CHB) at DLR Oberpfaffenhofen (Gege et 1078
al 2009) These CHB data are stored and processed within the APEX Calibration Information 1079
System (CAL IS) producing the so-called calibration cubes holding coefficients for each 1080
spatio-spectral pixel (Hueni et al 2013) 1081
For the multi-temporal dataset employed within this study all flight lines were 1082
reprocessed from the original raw image streams to ensure that the same version of the 1083
processor was applied The APEX PAF and CAL IS have significantly evolved over the 1084
timeframe of the dataset with calibrations getting more accurate over the years To ensure 1085
consistency all data were calibrated using coefficients obtained in May 2013 1086
The processor was specifically configured to retain the highest information content in 1087
the VNIR channel including i) no spectral resampling to compensate for spectral shifts and 1088
misregistrations (DOdorico et al 2010 DOdorico et al 2011) ii) no compensation of 1089
spectral shift related changes in radiometry (Hueni et al 2015) and iii) no spatial 1090
misregistration correction The calibration was thus effectively reduced to a linear dark 1091
current correction over time a de-smearing of the visible-NIR channel to compensate for 1092
sensor smear effects the application of radiometric gains and offsets followed by a destriping 1093
routine working in the spatial dimension only to remove pushbroom related along track 1094
striping Calibrated radiance data were directly used for the fluorescence retrieval (see Section 1095
24) while the feasibility to use APEX for SIF760 retrievals was theoretically demonstrated in 1096
42
a study of Damm et al (2011) Resulting SIF760 maps were afterwards geo-rectified using a 1097
parametric geocoding approach (Schlaumlpfer and Richter 2002) 1098
43
Appendix-B Retrieval of SIF760 from airborne data 1099
The quantification of SIF measured with ground or airborne-based spectrometers 1100
requires separating emitted SIF from the reflected radiance flux The Fraunhofer Line Depth 1101
(FLD) approach introduced by Plascyk (1975) serves as a de facto standard for medium 1102
resolution instruments such as APEX (Meroni et al 2009) and was applied in our study The 1103
FLD method uses atmospheric absorption bands characterized by lower incident light 1104
compared to wavelength regions outside of these bands This configuration increases the 1105
spectral information and allows the separation of SIF from reflected radiation In this study 1106
we used the broad O2-A oxygen absorption band around 760 nm and quantified the infilling of 1107
SIF760 using radiance measurements inside (subscript i) and outside (subscript o) of the O2-A 1108
band 1109
For the airborne case only atmospheric components can be simulated with 1110
MODTRAN-5 assuming perfect knowledge of the acquisition conditions The reflectance 1111
terms for diffuse and direct irradiance as well as the SIF760 contribution are usually unknown 1112
Assuming Lambertian surface reflectance behavior which introduces some inaccuracies but 1113
allows formulating the radiative transfer (RT) for radiance measurements at sensor level (LAtS) 1114
to obtain SIF760 both measurements inside and outside of the absorption band can be 1115
expressed as 1116
E9FA lang3H IJK LMNrangP QlangRSE rang T UlangVWWH VXWH rang∙langVYYH VYXH rangZH
Hlang[XXH rang T ABCHUlangVWWH ranglangVXWH rangZHlang[XXH rang ] ^ _ (B1) 1117
where E0 is the top-of-atmosphere irradiance including diffuse and direct irradiance 1118
components θil is the illumination zenith angle ρso is the path scattered radiance τss is the 1119
direct transmittance for sunlight τoo is the direct transmittance in view direction τsd is the 1120
diffuse transmittance of the atmosphere for sunlight τdo is the hemispherical-directional 1121
transmittance in view direction and ρdd is the spherical albedo If these atmospheric 1122
44
components are obtained from MODTRAN-5 simulations (Damm et al 2015 Verhoef and 1123
Bach 2003a b 2007) the radiative transfer equation (Eq B1) only contains four unknowns 1124
namely Ri Ro SIFi and SIFo The 3FLD method (Maier et al 2003) which is an adaptation of 1125
the original FLD method proposed by (Plascyk 1975) was used to linearly relate R and SIF 1126
inside and outside of the O2-A absorption band SIF can be finally retrieved with 1127
13 -0 abcMUdWecWlangRff_ rangZghcWUdMecMlangRff^ rangZiUdWecWlangRff_ rangZghUdMecMlangRff^ rangZ j
langVWWM ranglangVXWM rang (B2) 1128
kE lE9FA m lang3HW IJK LMNrangP langRSE rangn ] ^ _ (B3) 1129
E lang3HW IJK LMNrangP langoSSE TopSE rang ∙ langoE opE rang qEprs T Eprt] ^ _ (B4) 1130
r S13rlangoSSr rang T langopSr rang v13S$langoSSS rang T langopSS rangw (B5) 1131
where B is the factor relating SIFi and SIFo and was fixed to a value of 08 justified by 1132
simulations and experiments (Rascher et al 2009 Alonso et al 2008) Xj equals the at-1133
sensor radiance (reflected plus emitted radiation) without path radiance contribution and Ej 1134
expresses surface irradiance as measured at the sensor level A is the factor relating Ri and Ro 1135
and was derived from linear interpolation of R of the left (758 nm) and right (771 nm) O2-A 1136
band shoulder with 1137
xx+ (B6) 1138
y ```-0```z and y `-0`z
```z (B7) 1139
1140
Because APEX suffered from slight spectral smile effects (DOdorico et al 2010) 1141
updated center wavelength positions were involved in the convolution approach The spectral 1142
shift quantification for each pixel across track was based on the Cr method as described in 1143
45
Meroni et al (2010) The method assumes a high correlation between a measured and a 1144
convolved spectrum and iteratively minimizes a cost function which is 1 minus the Pearson 1145
correlation coefficient (r) calculated for both signals Remaining artifacts of the spectral shift 1146
correction and slightly inaccurate estimates of atmospheric properties cause SIF760 retrieval 1147
uncertainties We therefore applied a semi-empirical correction as described in Damm et al 1148
(2014) for each scan line across the track This technique employs reference surfaces which 1149
are free of any SIF760 emission (eg bare soil) to adjust the upward transmittance term inside 1150
the absorption feature oSSr The retrieval of SIF760 from top-of-canopy radiance data measured 1151
on ground follows the same approach as described in Eqs B2-B7 under the assumption that 1152
the surface irradiance can be approximated with the measurement of a reference panel and 1153
that ρso τdo and τdo can be set to 0 Furthermore the spectral resolution of APEX can be 1154
considered suboptimal for SIF760 retrievals although Damm et al (2011) demonstrate that 1155
APEX with its spectral resolution of 54 nm at 760 nm is sensitive for SIF760 However 1156
retrieved SIF760 values are too high and in an absolute sense incorrect We used reference 1157
SIF760 data obtained in parallel to the airborne acquisitions using the ASD field spectrometers 1158
(Section 23) to estimate the actual offset The observed scaling factor of 193 was afterwards 1159
applied to the retrieved SIF760 values to transfer them to a realistic value range 1160
46
Appendix-C SIF retrieval accuracy 1161
We applied a quantitative accuracy evaluation of resulting SIF760 maps using ground 1162
measured SIF760 values (Figure C1) Considering all reference data acquired during five 1163
campaigns a good linear relationship was achieved between ground and airborne-based 1164
SIF760 values (r2 = 071) but with a proportionality factor much higher than 1 (Figure C1-A) 1165
This experimentally obtained systematic overestimation of APEX SIF760 is comparable to 1166
simulation results documented in Damm et al (2011) Further we found slightly changing 1167
correlations between the different years (several linear models in Figure C1-A) which are 1168
likely caused by canopy structural effects spectral and radiometric performances of used 1169
ground instruments or slight deviations of the performance of APEX over time 1170
To compensate for the overestimation of APEX SIF760 we applied an empirical correction 1171
factor of 193 derived from the comparison of reference data and APEX which resulted in a 1172
rRMSE of 289 (Figure C1-B) 1173
1174
lt Figure C1 gt 1175
1176
The Laegeren site was covered with three adjacent flight lines having an overlap of 1177
approximately 10 (cf Figure 3) This configuration provides the opportunity to 1178
quantitatively evaluate the consistency of SIF retrievals obtained from different measurements 1179
and view zenith angles (ie plusmn 135deg) The comparison of SIF760 retrievals obtained from flight 1180
lines 1 and 2 reveals a moderate linear relationship for homogeneous agricultural surfaces (r2 1181
= 081 rRMSE = 57) We observed a systematic underestimation of flight line 1 compared 1182
to flight line 2 (factor 06) for a view zenith angle difference of ~26deg for SIF760 indicating 1183
either a directionality of SIF760 emissions or an insufficient decoupling of surface HCRF 1184
affected by reflectance anisotropy With increasing surface heterogeneity scattering increases 1185
47
and the agreement of retrieved SIF from both flight lines slightly decreases (ie for forested 1186
areas r2 of 05 and rRMSE of 88) This lower correlation can be mainly associated to slight 1187
geometric mis-registrations (ie max 2 pixel ~ 40 m) in combination with surface 1188
heterogeneity (eg shaded and sunlit tree crowns) and emission anisotropy of SIF760 Also 1189
negative SIF760 values are present in the SIF760 maps and caused by sensor noise and 1190
especially for forests due to shadowing effects (Damm et al 2015) 1191
48
Appendix-D Technical aspects determining the SIF760 retrieval accuracy 1192
A rigorous evaluation of the SIF760 retrieval accuracy is crucial to judge the reliability 1193
of our assessment on the relationship between SIF760 and GPPEC across ecosystems 1194
Furthermore additional factors imposing variations on SIF760 retrieved from airborne 1195
spectroscopy data that cannot be related to the physiological origin of SIF760 needs to be 1196
critically discussed to justify the proposed approach 1197
Ground-based measurements of SIF760 were made using field spectrometers to validate 1198
the airborne retrievals Field spectroscopy provides a good reference for validating airborne 1199
retrievals as it is likely not affected by biases resulting from atmospheric composition 1200
estimates (eg aerosol load) due to the simultaneous measurement of irradiance fluxes at 1201
canopy level using a reference panel The reliability of the applied field spectroscopic 1202
approach to measure SIF760 was previously demonstrated using field studies (Damm et al 1203
2010 Liu and Cheng 2010 Meroni et al 2009 Rascher et al 2009) and theoretical 1204
assessments (Damm et al 2011) It must be noted that field spectroscopic approaches are 1205
subject to uncertainties particularly for heterogeneous vegetation canopies Damm et al 1206
(2015) discussed retrieval errors caused by illumination effects likely introducing slight 1207
errors in reference SIF760 This source of uncertainty must be considered when judging the 1208
accuracy of APEX SIF760 The nevertheless good agreement between ground and airborne 1209
observations indicated that atmospheric absorption and scattering effects could be sufficiently 1210
compensated and thus demonstrated the reliability of retrieved SIF760 measurements In 1211
particular the empirical correction applied making use of high spatial resolution airborne IS 1212
data in combination with reference surfaces not emitting SIF760 allowed to bypass retrieval 1213
uncertainties caused by atmospheric effects (Damm et al 2014) 1214
Instrumental effects in combination with retrieval methods were found to cause 1215
systematic differences in SIF760 retrievals (Damm et al 2011) the comparatively low 1216
49
resolution of APEX around the O2-A band used to retrieve SIF760 (ie ~54 nm) resulted in an 1217
overestimation of APEX SIF760 compared to retrievals from high resolution instruments 1218
Indeed maximum APEX SIF760 values are 6 mW m-2 sr-1 nm-1 while typical SIF760 values 1219
obtained from high resolution instruments range between 0 and 3 mW m-2 sr-1 nm-1 (Guanter 1220
et al 2013) Considering SIF760 values retrieved from ASD data in original resolution (3 nm) 1221
APEX showed an overestimation of 1102 which confirmed that low spectral resolution 1222
resulted in an overestimation of SIF760 The reasoning for this absolute error is given by the 1223
sub-optimal spectral resolution of APEX with 54 nm at 760 nm causing a reduced sensitivity 1224
for SIF760 on the one hand and a wider distance of the O2-A shoulder values used to 1225
parameterize the 3FLD approach on the other hand The bias was corrected using the ASD 1226
reference data and does not impact the results of our analysis Further the relative variation of 1227
SIF760 is unaffected by the bias 1228
Surface heterogeneity complicates the retrieval of SIF760 According to Damm et al 1229
(2015) SIF760 retrievals for forest sites are especially subject to uncertainties due to 1230
assumptions on surface irradiance Crown shapes and associated surface orientations 1231
determine the intensity and quality of irradiance including fractional amounts of diffuse and 1232
direct irradiance To account for pixel wise changes in surface irradiance high resolution 1233
digital object models (DOM) (eg derived from LiDAR observations) are required In 1234
absence of such a high resolution DOMrsquos crowns are assumed to be flat which results in 1235
uncertainties of up to 58 in case of cast shadows (Damm et al 2015) Since we used 1236
averaged observations over larger areas representing flux tower footprints and most of our 1237
data were flown under comparable illumination conditions (ie around solar noon) we 1238
expect these potential biases to be less influential in this analysis 1239
1
Tables 1
Table 1 Date and time of APEX flights and corresponding eddy covariance flux tower 2
measurements for the three investigated ecosystems (ie grassland cropland mixed 3
temperate forest) 4
Date Time [UTC] Location Ecosystem Flux tower
17062009 950 Laegeren forest 1 tower
17062009 1030 Oensingen cropland 1 tower
17062009 1030 Oensingen grassland 2 tower
25062010 1030 Oensingen cropland 1 tower
25062010 1030 Oensingen grassland 2 tower
26062010 1500 Laegeren forest 1 tower
26062010 1030 Oensingen cropland 1 tower
26062010 1030 Oensingen grassland 2 tower
29062010 1030 Laegeren forest 1 tower
26062011 1030 Laegeren forest 1 tower
28062011 1030 Oensingen cropland 1 tower
28062011 1030 Oensingen grassland 1 tower
16062012 1025 Laegeren forest 1 tower
16062012 900 Oensingen cropland 1 tower
16062012 1100 Oensingen cropland 1 tower
12072013 730 Laegeren forest 1 tower
03092013 1050 Laegeren forest 1 tower
5
2
Table 2 Availability of reference SIF760 data obtained from field spectroscopy measurements 6
to validate APEX based SIF760 retrievals 7
Date time [UTC] Location Measured crops Nr points
17062009 1030 Oensingen maize rye pea sugar beet wheat white clover 29 points
25062010 1030 Oensingen maize pea sugar beet wheat white clover 15 points
16062012 900 Oensingen carrot maize winter wheat 11 points
16062012 1100 Oensingen carrot maize winter wheat 10 points
8
3
Table 3 Goodness of fit for the hyperbolic model describing the relationship between GPPEC 9
and SIF760 O PRI and MCARI2 for the three ecosystem types perennial grassland cropland 10
and mixed temperate forest Calculated statistics are based on all data acquired from 2009-11
2013 as described in Table 1 12
Optical variable Ecosystem Regression coefficient Relative RMSE []
SIF crops 088 355
grass 059 2708
forest 048 1588
PRI crops 0008 1176
grass 095 860
forest 009 2179
MCARI2 crops 0005 1029
grass 098 550
forest 034 1798
13
1
Figures 1
2
Figure 1 Study sites A Oensingen agricultural site B Laegeren forest site The white 3
rectangles represent in A the boundary of investigated fields that comprise most of the flux-4
tower footprints and in B a coarse outline of the footprint area of the flux-tower The white 5
crosses show the locations of the flux-towers Background RGB images from Google-Earth 6
2
7
Figure 2 APEX reflectance and SIF760 image for the Oensingen site acquired on the 2606 8
2010 1030 UTC A top-of-canopy hemispherical-conical reflectance data as true color 9
composite B SIF760 map The white boxes indicate the approximate position of the flux 10
tower 11
3
12
Figure 3 APEX reflectance and SIF760 image for the Laegeren site acquired on the 2606 13
2010 1510 UTC A top-of-canopy hemispherical-conical reflectance data as true color 14
composite B SIF760 map The black arrows indicate the flight direction of flight line 1 to 3 15
(FL1-FL3) The white line marks a transect along the overlapping region of FL1 and FL2 The 16
white boxes indicate the approximate position of the flux tower 17
4
18
Figure 4 Relationships between GPPEC from the eddy-covariance measurements and SIF760 O 19
instantaneously measured between 2009 and 2013 (see Table 1) with the airborne 20
spectrometer APEX (A) PRI index (B) and MCARI2 index (C) for three vegetation types 21
(black dots perennial grassland dark grey rectangles cropland including winter wheat pea 22
and barley grey triangles mixed temperate forest) The solid curves correspond to a 23
hyperbolic model fitted to the measured data The dashed curves show the extrapolated 24
behavior 25
5
26
Figure 5 Daily light response curves from eddy flux measurements for A cropland B 27
perennial grassland and C mixed temperate forest Data were acquired between 2009 and 28
2013 (see Table 1) Grey curves represent a fitted hyperbolic model to approximate the 29
behavior of measured PAR-GPP values Crosses show GPPEC measurements that were used 30
for the SIF760 O - GPPEC comparison based on the time of APEX flights PAR values are 31
binned in 20 mW m-2
sr-1
nm-1
increments 32
6
33
Figure 6 Leaf level relationships between photosynthetic (LUEp) and fluorescence yield 34
(LUEf) for a typical C3 crop Dependency of LUEp (A) and LUEf (B) on APAR C 35
Relationship between LUEp and LUEf D Relationship between APAR and GPPL GPPL was 36
calculated as APARLUEp E Relationship between APAR and SIF760 SIF760 was calculated 37
as APARLUEf assuming a constant relationship between the SCOPE output SIFtotalL 38
(integral between 640-850nm) and SIF760L F Relationship between SIF760 L and GPPL All 39
data were simulated using SCOPE The grey areas indicate illumination conditions 40
comparable to APEX flights 41
7
42
Figure 7 Canopy level relationships between photosynthetic (LUEp) and fluorescence yield 43
(LUEf) for different canopy representations of a C3 cropland in SCOPE Dependency of 44
LUEp (A) and LUEf (B) on APAR LUEp was calculate as GPPCAPAR and LUEf was 45
directly obtained from SCOPE C Relationship between LUEp and LUEf D Relationship 46
between APAR and GPPC GPPC was directly obtained from SCOPE E Relationship 47
between APAR and SIF760C SIF760C was directly obtained from SCOPE F Relationship 48
between SIF760C and GPPC The black dashed line corresponds to a C3 cropland with LAI = 49
30 fraction of brown pigments (Cs) = 00 and a spherical (sp) leaf inclination distribution 50
function (LIDF) For the grey line Cs was changed to 20 for the black dashed line the LAI 51
was changed to 10 and for the grey dasheddotted line the LIDF was changed to plagiophile 52
(pg) The grey areas indicate illumination conditions comparable to APEX flights 53
8
54
Figure 8 Impact of temporal scaling on the SIF760C-GPPC relationship SIF760C and GPPC 55
data were simulated using SCOPE Model input parameters air temperature (A) PAR (B) and 56
LAI (C) were measured within the NitroEurope project (httpwwwnitroeuropeeu) at the 57
Speulderbos forest site Netherlands D Relationship between SIF760C and GPPC including a 58
fitted hyperbolic model for daily averages (grey dots and grey line) monthly averages (dark 59
grey triangles and line) and quarterly data (black dots and black dashed line) 60
9
61
Figure C1 Comparison of ground and airborne-based SIF760 retrievals from various crops 62
Data were acquired during four campaigns between 2009 and 2012 in the agricultural site 63
Oensingen (see Table 2) Left Fitted linear regression lines for the four considered campaigns 64
are overlaid in black The dashed line corresponds to the 11 line Right SIF retrievals from 65
APEX after applying an empirical correction factor (193) The black line represents the fitted 66
linear model the dashed line corresponds to the 11 line 67
8
Radiance calibration of APEX images is performed using the approach of Hueni et al 176
(2009) Multitemporal comparison of images is secured by using consistent calibration and 177
processing versions Precise retrievals of SIF typically require data measured in sub-178
nanometer spectral resolution However the feasibility of using APEX like instruments (ie 179
FWHM ~5nm) for SIF760 retrievals was theoretically assessed in Damm et al (2011) and 180
experimentally demonstrated in recent work (Zarco-Tejada et al 2009 Zarco-Tejada et al 181
2013) The use of calibrated APEX radiance data for the fluorescence retrieval is described in 182
Section 24 and Appendix-B Vegetation indices (see Section 25) were calculated using 183
Hemispherical-Conical-Reflectance-Factor data obtained after atmospheric correction using 184
ATCOR-4 (Richter and Schlaumlpfer 2002) Resulting SIF760 and vegetation indices were 185
projected in the same map projection using parametric geocoding (Schlaumlpfer and Richter 186
2002) Details about APEX data calibration are listed in Appendix-A 187
188
23 Field spectroscopy 189
ASD (PANalytics Boulder US) field spectrometer data were acquired for validation 190
purposes within one hour of the APEX overflight during four campaigns In total 23 191
agricultural fields covering various crops including carrot maize pea rye sugar beet wheat 192
white clover were systematically sampled by measuring reflected and emitted radiances in 193
four homogeneous 3 m2 plots per field (Table 2) Incident light was quantified before and 194
after measuring each plot using a Spectralon reference panel 195
196
lt Table 2 gt 197
198
24 SIF760 retrieval 199
Emitted SIF was analytically separated from the reflected radiance flux measured with 200
ground and airborne-based spectrometers (see Appendix-B) We applied the Fraunhofer Line 201
9
Depth (FLD) approach (Plascyk 1975) which serves as a standard for SIF retrievals using 202
medium resolution instruments (Meroni et al 2009) The FLD method uses atmospheric 203
absorption bands characterized by lower incident light compared to wavelength regions 204
outside of these bands This configuration allows evaluating the in-filling of the absorption 205
bands by SIF (Damm et al 2014) In this study we used the broad O2-A oxygen absorption 206
band around 760 nm for the SIF760 retrieval For the ground data surface irradiance was 207
estimated from white reference measurements while perturbing atmospheric absorption and 208
scattering effects were assumed to be negligible on the 1 m pathway between canopy and 209
sensor (cf Damm et al (2014) for details on the set-up for SIF760 retrieval on the ground) 210
For the airborne measurements we compensated atmospheric absorption and scattering using 211
the atmospheric radiative transfer model MODTRAN5 (Berk et al 2005) Details of the 212
SIF760 retrievals using airborne data are provided in Appendix-B 213
214
25 Derivation of additional spectral indices 215
The relationship between two vegetation indices and GPP was investigated in parallel 216
to judge the performance of the new remote observation of SIF compared to commonly used 217
remote sensing approaches The photochemical reflectance index (PRI) (Gamon et al 1992) 218
was found to be sensitive to pigment changes related to the xanthophyll cycle and is 219
frequently used to quantify LUEp and GPP (Cheng et al 2013 Drolet et al 2008 Hilker et al 220
2009) The PRI was calculated as 221
(3) 222
while Rλ accounts for the surface reflectance at the wavelength λ 223
We further tested the soil adjusted Modified Chlorophyll Absorption Ratio Index 2 224
(MCARI2) (Haboudane et al 2004) that was found to be strongly related to green LAI thus 225
potential photosynthesis and is calculated as 226
10
2 $amp($)$+-amp0 (4) 227
228
26 Eddy-covariance measurements 229
Continuous turbulent fluxes of CO2 were measured at the agricultural and forest sites 230
between 2009 and 2013 using the EC technique (Baldocchi 2003) At each site the EC 231
instrumentation consisted of an open-path infrared gas analyzer (IRGA) (model LI-7500 LI-232
COR Inc Lincoln NE USA) and a three-dimensional sonic anemometer-thermometer 233
(models HS R3 and R2 Gill Instruments Lymington UK) EC measurements were made at a 234
frequency of 20 Hz and processed to half-hourly averages using the eth-flux EC software for 235
the forest and cropland (Mauder et al 2008) or a comparable custom-made EC software for 236
the grassland (Ammann et al 2007) Post-processing included corrections for damping losses 237
(Eugster and Senn 1995) air density fluctuations (Webb et al 1980) data screening for 238
optical sensor contamination stationary or low turbulence conditions (Foken and Wichura 239
1996) and statistical outliers Standardized gap filling and partitioning of CO2 fluxes was 240
performed using the methodology from Lasslop et al (2010) for the forest and cropland and 241
using the methodology from Falge et al (2001) for the grassland Measurements of 242
photosynthetic photon flux density (PPFD) quantified in micromol m-2 s-1 were converted to 243
radiance units (mW m-2 sr-1 nm-1) representing the photosynthetic active radiation (PAR) to 244
be consistent with Monteithrsquos LUE concept and the SIF radiance units 245
246
27 Leaf area index measurements 247
The Leaf Area Index (LAI) of the grassland and cropland was measured at the time of 248
APEX flights using an optical non-destructive approach based on LAI-2000 leaf area meter 249
observations (Li-Cor Lincoln USA) The LAI of the forest was estimated using digital 250
11
hemispherical photographs at two subplots following the VALERIE sampling scheme while 251
subsequent analysis were applied to obtain the LAI (Schneider et al 2014) 252
253
28 Statistical analysis of SIF760 - GPP relationship 254
SIF760 values were manually extracted from APEX-SIF760 maps for areas representing 255
the footprint of eddy-flux measurements (Figure 1) For the perennial grassland and cropland 256
we selected all pixels with SIF760 values ge 0 mW m-2 sr-1 nm-1 in respective fields although the 257
EC tower footprint can be slightly smaller than the entire field The increased number of 258
resulting pixels allows reducing data noise and covering small spatial variations within the 259
footprint Using the pixels of the entire field is justified by the large homogeneity of the 260
underlying fields (Figure 1A) For the forest site Laegeren all pixels representing an area that 261
covered 70 of all footprint occurrences were selected irrespective of spatial footprint 262
changes due to changing wind conditions Using the same area for all years reduces variations 263
in SIF due to changes in biomass and canopy structure but also reduces the representativeness 264
of selected pixels for actual spatial EC footprints 265
We used a hyperbolic model to relate GPP to SIF760 and to both vegetation indices 266
Although the hyperbolic model only empirically approximates the data behavior it is 267
supported by theoretical arguments for the SIF760-GPP relationship that are outlined hereafter 268
The photosynthetic efficiency LUEp is often described as a hyperbolic function of APAR 269
following the Michaelis-Menten theory (Michaelis and Menten 1913) 270
∙123467899 (5) 271
where c is a coefficient in radiance units and LUEpmax c represents GPPmax Following Eqs 272
(1) and (5) GPP rises asymptotically with APAR to GPPmax This equation is used in many 273
models for partitioning GPP eg Falge et al (2001) Substituting LUEp from Eq (5) and 274
APAR = SIF760 (LUEf fesc) from Eq (2) into Eq (1) results in 275
12
lt= gtampABCampD (6) 276
where the coefficient b represents cLUEffesc accounting for the difference between LUEp 277
and LUEf GPPmax is a value that is asymptotically reached representing the photosynthetic 278
capacity or GPP of the canopy at light saturation It must be noted that Eq (6) is a 279
simplification of the complex relationships between GPP and SIF760 and thus performs best if 280
c LUEf fesc remains constant or SIF760 corresponds to APAR A constant LUEf is a 281
reasonable first approximation for vegetation that is only moderately stressed meaning that 282
variations in LUEf are substantially smaller than variations in LUEp (van der Tol et al 2014) 283
Moderate stress relates to any kind of environmental conditions (warm temperature strong 284
irradiance reduced water availability) that cause only short term and slight changes in 285
photochemical and non-photochemical protections However c and fesc are known to vary 286
across ecosystems and LUEf changes under environmental stress In order to evaluate their 287
impacts on the SIF-GPP relationships as expressed in Eq (6) we carried out simulations with 288
the Soil-Canopy Observations of Photosynthesis and Energy balance model SCOPE version 289
153 (van der Tol et al 2009b) (see Section 29) The goodness of fit for the hyperbolic model 290
was quantified using non-linear regression analysis and was quantitatively described using the 291
root mean square error normalized by the mean of measured data (rRMSE) and the coefficient 292
of determination R2 defined as the correlation between data and the best fit-curve determined 293
by non-linear regression 294
295
29 SCOPE simulations 296
SCOPE uses semi-empirical models for LUEp (Collatz et al 1991) and LUEf (van der 297
Tol et al 2014) embedded in a radiative transfer scheme for the canopy (van der Tol et al 298
2009b) The radiative transfer model at leaf level (Fluspect) is an extension of PROSPECT 299
(Jacquemoud and Baret 1990) and includes a fluorescence component The radiative transfer 300
13
within the canopy is calculated following Verhoef (1984) in the optical domain (SAIL) 301
following Verhoef et al (2007) in the thermal domain and Miller et al (2005) for the 302
fluorescence emissions (FluorSAIL) SCOPE requires a number of vegetation structural and 303
physiological parameters as well as weather information as input The model simulates GPP 304
and spectrally distributes SIF with a spectral resolution and a spectral sampling interval of 10 305
nm each Simulated PPFD values (micromol m-2 s-1) were also converted to radiance units (PAR) 306
We carried out three simulations using SCOPE In the first simulation we calculated 307
leaf level LUEf and LUEp of a typical C3 cropland as function of varying APAR For the 308
second simulation at canopy level we calculated LUEf and LUEp as function of varying 309
APAR for differently structured canopies We took the standard SCOPE parameters for a 310
typical C3 cropland and varied APAR and the structural parameters LAI leaf inclination 311
angle (LIDF) and the fraction of brown pigments (Cs) Both simulation experiments provide 312
theoretical evidence on the relationships between LUEf and LUEp between SIF760 and GPP 313
and their respective relationships to APAR For the third canopy level simulation SCOPE 314
was initialized using time series of mid-day (solar noon) meteorological data (PAR air 315
temperature) a seasonal cycle of LAI and the modelrsquos default soil and vegetation parameters 316
for a C3 cropland (cf the SCOPE user manual) The purpose of this simulation was to 317
evaluate seasonal SIF760-GPP relationships at various temporal aggregation levels For better 318
readability we use the following notation through the manuscript SIF760 O for APEX-SIF 319
SIF760 L and SIF760 C for SCOPE simulated leaf and canopy SIF GPPEC for flux tower GPP 320
and GPPL GPPC to relate to simulated GPP at leaf and canopy level 321
322
3 Results 323
31 SIF760 maps 324
14
Two examples of SIF760 O maps obtained from APEX are shown in Figures 2 and 3 325
The appearance of SIF760 O emissions in vegetated areas demonstrates that measured SIF760 O 326
signals originated solely from vegetation and were not contaminated by non-fluorescent non-327
vegetation surfaces Retrieved SIF760 O values range between 0 and 3 mW m-2 sr-1 nm-1 and 328
showed a high agreement (r2 = 07 rRMSE = 289) with in-situ measured reference data 329
Details of the SIF760 O validation are discussed in Appendix-C 330
331
lt Figure 2 gt 332
lt Figure 3gt 333
334
32 Relationships of GPPEC with SIF760 O PRI and MCARI2 335
Relating instantaneous measurements of SIF760 O and GPPEC from several years 336
revealed an asymptotic relationship with saturating GPPEC in presence of moderate to high 337
SIF760 O (Figure 4A Table 3) This general behavior was consistent for all investigated 338
vegetation types The fitted hyperbolic model shows a moderate to high goodness of fit for the 339
grassland (R2 = 059 rRMSE = 271) cropland (R2 = 088 rRMSE = 35) and forest (R2 = 340
048 rRMSE = 1588) The saturation of GPPEC appeared earlier for the cropland (SIF760 O 341
~05 mW m-2 sr-1 nm-1) than for the grassland and forest (SIF760 O gt 10 mW m-2 sr-1 nm-1) An 342
independent assessment considering a linear model to describe the relationship between 343
SIF760 O and GPPEC revealed a consistently lower goodness of fit justifying the use of a 344
hyperbolic model (data not shown) 345
Statistical analysis showed that a hyperbolic model represents well the relationship 346
between both vegetation indices (PRI and MCARI2) and GPPEC for the grassland with a 347
notable variation in LAI (range between 05 and 48 m2 m-2) However a hyperbolic model 348
does not allow well representing the relationship between PRI and MCARI2 with GPPEC for 349
the forest and cropland both showing only a small variation in LAI (less than plusmn03 m2 m-2) 350
15
(Figure 4B-C Table 3) The goodness of fit for the hyperbolic model describing the PRI and 351
GPPEC data for grassland (R2 = 095 rRMSE = 86) was even higher compared to SIF760 O 352
but lower for forest (R2 = 009 rRMSE = 2179) and cropland (R2 = 0008 rRMSE = 353
1176) With MCARI2 the goodness of fit for the hyperbolic model for grassland was high 354
(R2 = 098 rRMSE = 55) but low for cropland (R2 = 0005 rRMSE = 1029) and forest 355
(R2 = 034 rRMSE = 1798) Again considering a linear relationship between both 356
vegetation indices and GPPEC revealed no consistent improvement compared to the use of a 357
hyperbolic model (data not shown) 358
359
lt Figure 4 gt 360
lt Table 3 gt 361
362
33 Assessment of factors determining SIF760 GPPEC relationships 363
The asymptotic relationship between SIF760 O and GPPEC (Figure 4A) represented 364
instantaneous measurements of different canopies at different times and days over several 365
years covering a range of different light conditions phenological stages of the forest and 366
various amounts of green biomass for both investigated grasslands (crosses in Figure 5A-C 367
that indicate EC measurements during APEX overpasses) Relationships between SIF760 O and 368
GPPEC are consequently a complex function of light absorption in the canopy (APAR) of the 369
efficiency of light utilization (ie expressed as photosynthetic capacity and quantum 370
efficiency of photosynthesis) and of structural effects including fractions of non-371
photosynthetic vegetation components Both grass canopies were measured before and after 372
mowing resulting in a large range in LAI (05-48 m2 m-2) and GPPEC (4-27 micromol m-2 s-1) for 373
similar PAR values The forest LAI of 50 m2 m-2 was more constant over the years due to the 374
consistent timing of flights however senescence (eg lower canopy chlorophyll content and 375
light absorption) might explain the decrease in GPPEC of 15 micromol m-2 s-1 in September for 376
16
comparable irradiance conditions (Figure 5C) Investigated crops (winter wheat barley and 377
pea) were characterized by small variations in LAI (22-25 m2 m-2) and chlorophyll contents 378
corresponding to small variations in GPPEC (5 micromol m-2 s-1) while observed under comparable 379
irradiance conditions During the time of observation the barley and wheat canopies were in 380
the ripening phase with a pronounced ear layer 381
382
lt Figure 5 gt 383
384
The validity of the asymptotic relationship between SIF760 O and GPPEC was tested 385
using simulations made with the SCOPE model We emphasize that the regression coefficient 386
b in Eq (6) includes terms that vary in the model (b= cmiddotLUEfmiddotfesc) the fluorescence efficiency 387
LUEf varies with irradiance conditions (predominantly APAR) the fraction fesc depends on 388
vegetation structure while c=GPPmaxLUEpmax varies between sites and over time during the 389
season We first analysed how LUEf and LUEp and consequently SIF760 and GPP vary at 390
leaf (ie SIF760 L and GPPL) and canopy levels (ie SIF760 C and GPPC) using the model of 391
van der Tol et al (2014) that is embedded in SCOPE For the leaf level Figure 6A shows a 392
decrease of LUEp with increasing APAR consistent with Eq (5) The relation between APAR 393
and LUEf appears more complex LUEf first increases with increasing APAR under low light 394
conditions reaches a climax at intermediate light and then decreases with increasing APAR 395
under higher APAR values (gt 50 mW m-2 sr-1 nm-1) (Figure 6B) The initial increase in LUEf 396
is caused by the decline in photochemical quenching of the excitons whereas the decrease of 397
LUEf is caused by the growing number of non-photochemical quenching traps that dissipate 398
light energy before it can be emitted as fluorescence light (van der Tol et al 2009a) It is 399
important to note that the range of LUEp is nearly an order of magnitude greater compared to 400
the range of LUEf (Figure 6C) Although LUEf is not constant we can still conclude that the 401
difference in both LUE terms causes an earlier saturation of leaf-level GPPL (Figure 6D) 402
17
compared to leaf-level SIF760 L (Figure 6E) with APAR leading to an asymptotic relationship 403
between SIF760 L and GPPL (Figure 6F) Our canopy level simulations confirm these trends 404
(Figure 7A-D) The in-field measured asymptotic relationships between SIF760 O and GPPEC 405
are consequently caused by the covariance of GPPEC and SIF760 O with APAR the 406
photosynthetic capacity with APAR and the different value ranges of LUEf and LUEp 407
Additionally our canopy level simulations suggest that structure impacts the SIF760 O - GPPEC 408
relationship Figure 7D shows an example that changing LAI leaf inclination angles or the 409
fraction of senescent plant material determine the curvature of the hyperbolic SIF760 C - GPPC 410
relationships 411
412
lt Figure 6 gt 413
lt Figure 7 gt 414
415
The modelled SIF760 LC - GPPLC curves (Figures 6D and 7D) also indicate that under 416
reduced light intensity GPP and SIF760 are almost linearly related while GPP tends to saturate 417
under higher light intensities Changes in APAR at canopy level are caused by either sun 418
elevation or in the case of a constant solar angle by canopy structure (ie shading fractional 419
vegetation cover) In complex structured canopies with many foliage layers the saturation of 420
GPP with APAR may not be observable because variations of APAR are less related to PAR 421
falling on the leaves but rather to the variation of leaf area exposed to light Model 422
simulations suggest that in complex canopies SIF760 saturates with APAR before GPP due to 423
fesc being lower with high APAR (data not shown) This structural effect reduces the curvature 424
of the hyperbolic leaf level GPPL- SIF760 L relationship at canopy level (compare Figures 6F 425
and 7F) Furthermore the effect of structure and APAR covary in time since canopy structure 426
(ie LAI) varies in concert with APAR during a seasonal cycle especially for crops We 427
18
expect that this covariance makes the relationship between GPP and SIF760 more linear at the 428
canopy level especially if observations are aggregated over time 429
To evaluate the structure related alleviation of the hyperbolic relationship between 430
SIF760 and GPP at canopy level in response to temporal aggregation we modelled an annual 431
course of GPPC and SIF760 C considering varying environmental conditions (Figure 8A-B) 432
ie PAR ranging from 0-500 mW m-2 sr-1 nm-1 air temperature ranging from 0-32degC using 433
data collected during 2009 at a Nitro-Europe flux tower site (Speulderbos The Netherlands) 434
and canopy properties ie LAI ranging from 15-30 m2 m-2 (Figure 8C) The LAI data are 435
synthetic but have a realistic seasonal cycle For daily noon values of modelled SIF760 C and 436
GPPC an asymptotic behaviour can be observed while GPPC tends to saturate compared to 437
SIF760 C The SIF760C-GPPC relationship tends to become linear when monthly or quarterly 438
averages are considered (Figure 8D) 439
440
lt Figure 8 gt 441
442
This visual trend can be confirmed by statistical measures for daily aggregated values 443
the hyperbolic model (rRMSE = 174 R2 = 070) performed slightly better than the linear 444
model (rRMSE = 185 r2 = 068) In case of monthly aggregated data both the hyperbolic 445
and linear models performed similarly while the linear model gave better results (RMSE = 446
90 r2 = 090) than the hyperbolic model (rRMSE = 94 R2 = 088) for quarterly aggregated 447
data 448
449
4 Discussion 450
Significant relationships between remotely measured SIF and ecosystem GPP have 451
been reported in the past (Frankenberg et al 2011 Guanter et al 2014) however sufficient 452
19
process understanding for using SIF as proxy for GPP across ecosystems is still limited 453
(Porcar-Castell et al 2014) Below we discuss how our observational and modeling 454
approaches help bridging the gap between mechanistic understanding at the leaf level and 455
ecosystem-specific observations and thus provide insights on mechanisms determining the 456
complex relationship between SIF and GPP 457
458
41 Insights from the observational approach 459
Our results showed ecosystem-specific asymptotic relationships between SIF760 O and 460
GPPEC for the three investigated ecosystems mixed temperate forest cropland and perennial 461
grassland The varying SIF-GPP relationships across ecosystems were consistent with results 462
recently reported from combined satellite observations and model predictions (Guanter et al 463
2012) Our results showed that the relationships of both tested vegetation indices PRI and 464
MCARI2 to GPPEC experienced a higher variability across ecosystems compared to SIF760 O 465
SIF760 O showed an ecosystem-specific and overall moderate to good relationship (R2 between 466
048 and 088) to GPPEC for the three ecosystems Both vegetation indices showed only strong 467
relationships for the grassland (R2 = 095 and 098) that notably changed in LAI during the 468
various observations It is important to note that we do not further elaborate on the underlying 469
mechanisms relating vegetation indices and GPPEC and that it is unclear if hyperbolic models 470
best describe their relationships to GPPEC based on mechanistic principles The intention of 471
evaluating the relationships between GPPEC and both vegetation indices was to provide a base 472
to judge the performance of SIF760 O in relation to these commonly used remote observations 473
The diversity of sampled conditions and used data sources provide further evidence on 474
the robustness of observed SIF760 O-GPPEC relationships Our measurements represent various 475
canopies characterized by different biomasses sampled over several years Although most 476
observations were acquired under similar light condition and physiological states a few 477
measurements represented lower light conditions and other physiological states This suggests 478
20
that observed relationships are rather robust across different representations of APAR LUEp 479
and LUEf Furthermore we use data from different sources ie four EC flux towers the 480
APEX imaging spectrometer and modeling at leaf and canopy levels to reduce the 481
uncertainties associated with each method of measurements and to get a better understanding 482
of the SIF760 O-GPPEC relationship at ecosystem level 483
Flux tower measurements are representative of a certain source area (footprint) from 484
the ecosystem which changes constantly based on wind direction and turbulent state of the 485
atmosphere Depending on the heterogeneity of the ecosystem GPPEC signals can vary in 486
response to changing footprints (Barcza et al 2009 Kljun et al 2004) although this variation 487
should be rather small if the vegetation is homogeneous Remote measurements of SIF760 are 488
likely representative of the upper layer of the ecosystem thus vertical canopy heterogeneity 489
potentially leads to a mismatch when compared to GPPEC which integrates over the different 490
layers of the ecosystems This is expected to be especially the case in structurally complex 491
ecosystems such as forests Although the upper layer in forest ecosystems substantially 492
contributes to the total rate of GPPEC there are still many layers of leaves or needles within 493
the canopy photosynthesizing at different rates depending on their sunshade exposure In 494
addition understory vegetation in forest ecosystems can significantly contribute to GPPEC at 495
different rates depending on the ecosystem and time of year Even homogeneous vegetation 496
canopies like crops or grasslands can show vertical heterogeneity This is especially the case 497
at peak biomass during ripening or senescence During such phenological stages the top layer 498
of cereal crops consists of less fluorescing components (ie ears) and cereal crops or 499
grasslands can contain a higher fraction of brown pigments resulting in low SIF760 O values 500
while the entire canopy can still produce high photosynthetic rates and thus GPPEC (Damm et 501
al 2010) Indeed most of the crops investigated in our study were in the ripening phase with a 502
pronounced ear layer 503
21
This resulted in relatively low SIF760 O values and in high GPPEC and thus in a more 504
pronounced asymptotic relationship (cf Figure 4A Figure 7F) compared to results reported 505
for other crops (Guanter et al 2013 Guanter et al 2014) Further research is needed to better 506
understand the impact of vertical heterogeneity on GPPEC and SIF760 observations and their 507
respective relationships 508
Despite the technical aspects causing variations in retrieved SIF760 O (refer to 509
Appendix-D for a detailed discussion) canopy structure causes inherent variations in 510
measured SIF760 values and thus impacts SIF760-GPP relationships The combination of 511
complex canopy architecture and the distribution of absorbing and scattering elements 512
determine vegetation canopies to act as photon traps (Knyazikhin et al 2013 Lewis and 513
Disney 2007) Parts of emitted SIF760 photons from inner-canopy leaves are re-absorbed 514
while others escape the canopy in direction of the sensor The probability of photons escaping 515
the canopy is a function of canopy structure which implies sensitivity to measured SIF760 516
intensities for canopy structure In Eq (2) this sensitivity was approximated with the term 517
fesc In our analysis we minimized the impact of fesc by observing always the same forest area 518
representative for the EC tower footprint In less complex structured crop and grass canopies 519
we expect fesc to be less important However future research is required to quantify the impact 520
of fesc and to propose strategies to compensate its influence on SIF760 retrievals 521
522
42 Insights from the modeling approach 523
From a theoretical point of view radiative energy loss competes with photochemistry 524
and non-radiative energy dissipation for absorbed photons Considering that GPP and SIF760 525
can be conceptualized according to Eqs (1) and (2) SIF760 must show under certain 526
environmental conditions a sensitivity to photochemistry (Porcar-Castell et al 2014 van der 527
Tol et al 2009a van der Tol et al 2009b) This relationship is confirmed by our observational 528
data and other studies at leaf (Amoros-Lopez et al 2008) and canopy levels (Damm et al 529
22
2010) Our modeling results however indicated that the relationship between LUEf and LUEp 530
is subject to change hence impacting the sensitivity of SIF760 to track changes in GPP 531
(Figures 6C and 7C) 532
The asymptotic relationship between SIF760 and GPP theoretically predicted and 533
observed at leaf and canopy levels can be related in particular to the different value ranges of 534
both efficiency terms (LUEp and LUEf) (Figures 6C and 7C) while a complex set of 535
mechanisms causes an ecosystem dependency for SIF760-GPP relationships The 536
photosynthetic capacity of the entire ecosystem in combination with its vertical heterogeneity 537
determines differences in GPP and SIF760 and thus the slope and curvature of their respective 538
relationships Furthermore the initial slope of the asymptotic SIF760 - GPP relationship which 539
has a value of LUEpmax(LUEfmiddotfesc) is determined by a combination of the photosynthetic 540
efficiency and canopy structure Canopy structure and related shadowing effects alter the 541
average light interception and quality at leaf level (Nobel et al 1993 Stewart et al 2003) and 542
consequently the overall productivity of the canopy In the case of reduced APAR caused by 543
canopy shadowing the overall apparent stress level in the canopy and consequently the rate 544
of certain photoprotective mechanisms such as non-radiative energy dissipation is reduced 545
(Cheng et al 2015 Demmig-Adams 1998 Niinemets et al 2003) and observed GPP and 546
SIF760 fall in a range where they are more linearly related (cf Figure 6F and 7F) In addition 547
canopy level simulations show that the fraction of senescent plant material impacts the 548
curvature of the hyperbolic relationship 549
Recent literature reports linear relationships between satellite-based SIF and modeled 550
GPP (Frankenberg et al 2011 Guanter et al 2012 Guanter et al 2014) while we found 551
asymptotic relationships Both results are not contradicting if one considers the temporal 552
aggregation applied to the data Our results are based on instantaneous measurements while 553
monthly averages were calculated for the satellite data to minimize noise effects (Frankenberg 554
et al 2011 Guanter et al 2014) It is known from previous research that temporal averaging 555
23
tends to linearize the response between GPP and APAR (Ruimy et al 1995) as saturating 556
light conditions tend to be only a small fraction of averaged diurnalmonthly data 557
Aggregating GPPEC and APAR over different time scales also showed this effect (data not 558
shown) Because of the rather linear relationship between SIF760 and APAR we expect that 559
temporal aggregation tends to linearize the SIF760-GPP relationship as well A recent study 560
presenting continuous measurements of GPP and SIF760 over a temperate deciduous forest 561
support this hypothesis (Yang et al 2015) The increasing number of experiments using 562
autonomous spectrometer systems in combination with flux towers (Balzarolo et al 2011) 563
will likely provide more experimental results that supports this finding Our simulations 564
provide further evidence that the covariance of structure and APAR during a seasonal cycle 565
additionally tends to linearize the relationship between GPP and SIF760 if observations are 566
aggregated over time 567
The dependency of SIF760-GPP relationships on temporal aggregation requires special 568
attention since it has implications on the usage of SIF to constrain GPP In principle 569
conclusions and results obtained from temporally aggregated and instantaneous measurements 570
are valid if consistently related to the underlying temporal aggregation level Generalizing 571
conclusions obtained at various aggregation levels bears the risk for mis-interpretations eg 572
when vegetation models are refined or empirically re-calibrated using observations or for 573
projections of GPP using observational SIF data 574
575
43 Requirements for the use of SIF to assess GPP across ecosystems 576
The changing relationship between SIF760 and GPPEC with vegetation type challenges 577
the usage of SIF760 as a robust constraint to estimate GPP Specific strategies are required to 578
account for ecosystem (or species) specific sensitivities of SIF in general and SIF760 in 579
particular This includes i) integration platforms to combine observations and process 580
24
understanding and ii) accurate observations of additional vegetation and environmental 581
variables 582
Process-based models as data integration platform in combination with comprehensive 583
observations to sufficiently measure important environmental factors and vegetation 584
properties are considered as flexible and powerful framework Parazoo et al (2014) for 585
example proposed the combination of ensemble dynamic global vegetation models (DGVMs) 586
in combination with SIF as observational constraint Lee et al (2015) suggest incorporating 587
SIF in a climate model to utilize SIF as observational constraint of photosynthesis simulations 588
and subsequent calculations of carbon water and energy cycle information Yet other studies 589
propose using SIF to obtain physiological vegetation parameters ie Vcmax for improved 590
parameterizations of photosynthesis models to eventually model GPP (Zhang et al 2014) The 591
European space agencys (ESA) Earth Explorer 8 opportunity mission Fluorescence Explorer 592
(FLEX) suggests a combination of comprehensive observations (ie SIF over the full 593
emission spectrum vegetation ecosystems and actual environmental conditions) and process-594
based models (Guanter et al 2012) 595
Additional information is required to use SIF in process-based models as one has to 596
account for varying photosynthetic efficiencies of plants and prevailing stress responses 597
According to the conceptualization of GPP and SIF as given in Eqs (1) and (2) extracting 598
and evaluating the exact relationship between LUEp and LUEf is essential but requires 599
normalizing APAR and calculating both yields (Damm et al 2010 Govindjee 2004 Louis et 600
al 2005) Retrievals of APAR can be considered challenging (Garbulsky et al 2010 Gitelson 601
and Gamon 2015 Hanan et al 2002) as available approaches often utilize a-priori knowledge 602
of prevailing land cover or plant distribution functions and rely on the inversion of physical-603
based models or simple band ratios (Hilker et al 2008) Research is required to provide high 604
quality information on APAR not perturbed by light absorption of non-photosynthetic active 605
25
canopy elements (stems branches twigs) cf Zhang et al (2013 2012) that demonstrate 606
attempts to improve estimates of APAR 607
Observed SIF760 O - GPPEC relationships are additionally confounded by non-radiative 608
energy dissipation The PRI was designed to monitor pigment changes related to the 609
xanthophyll cycle (Gamon et al 1992) and provides access to this superimposing process 610
However reported sensitivities of PRI for other effects ie structure (Barton and North 611
2001) pigment pool sizes (Gamon and Berry 2012) illumination effects (Damm et al 2015) 612
and the results obtained in this study question the applicability of the PRI at canopy level 613
Alternative approaches such as the development of a canopy PRI as suggested by several 614
groups (Hernandez-Clemente et al 2011 Kovac et al 2013 Wu et al 2010) or the usage of 615
pigment compositions and other functional plant traits might represent interesting strategies 616
and should be elaborated in future research 617
Structural sensitivities of canopy leaving SIF signals are critical and require further 618
research The application of spectrally invariant correction factors eg the directional area 619
scattering factor (Knyazikhin et al 2013) or more advanced physically-based retrieval 620
schemes using combined atmosphere-canopy models (Damm et al 2015 Laurent et al 2013) 621
might provide potential strategies to compensate for canopy structural effects on retrieved 622
SIF760 623
Another important source of information that allows improving the usage of SIF as 624
constraint of GPP is to consider SIF emissions over the entire emission spectrum between 625
approximately 600 and 800 nm Recent research successfully demonstrated the 626
complementary information content of red-fluorescence retrieved in the O2-B band at 688 nm 627
(SIF688) compared to SIF760 because of the different contributions from photosystem I and II 628
(Rossini et al 2015) Yet other studies highlighted the potential to improve predictions of 629
LUEp and GPP using both SIF688 and SIF760 (Cheng et al 2013) 630
631
26
5 Conclusions 632
Remote sensing of SIF provides a new observational approach to assess terrestrial 633
GPP Compared to traditional greenness-based remote sensing parameters we found SIF760 to 634
be more consistently related to GPPEC These results in combination with the more direct 635
mechanistic link between SIF760 and photosynthesis suggest that using SIF760 provides a 636
strategy to decrease uncertainty in estimating GPP across ecosystems 637
Our observational and modeling approaches revealed asymptotic and ecosystem-638
specific relationships for SIF760 and GPPEC We identified a set of interlinked mechanisms 639
determining SIF760-GPPEC relationships to be ecosystem specific ie the photosynthetic 640
capacity and efficiency of ecosystems the confounding impact of non-radiative energy 641
dissipation (NPQ) as well as ecosystem structure and the fraction of non-photosynthetic 642
vegetation components We demonstrated that SIF760-GPPEC relationships scale with temporal 643
aggregation due to a covariance of canopy structure and APAR over the seasonal cycle 644
We suggest going beyond empirical and ecosystem-specific relationships instead 645
using instantaneous observations comprehensively providing information on the full SIF 646
emission vegetation status and functioning as well as environmental conditions in 647
combination with process-based models Such approaches eg suggested for ESArsquos potential 648
ldquoFluorescence Explorerrdquo (FLEX) Earth Explorer mission provide a flexible framework to 649
account for the various influencing factors identified and to successfully apply SIF as 650
constraint of unbiased global GPP estimates 651
Furthermore research is required to improve the comparison between observations of 652
GPPEC and SIF Both observations stem from conceptually contrasting technologies ie 653
measurements of gas exchange vs plant-light interactions and provide independent and 654
complementary access to study ecosystem photosynthesis Despite the need to harmonize 655
horizontally differing footprints the vertical heterogeneity of ecosystems including the 656
27
varying contributions from different ecosystem layers must be better understood to harmonize 657
and successfully integrate both measurements 658
659
Acknowledgements 660
This work was supported by a grant of the Swiss University Conference and ETH-661
Board in frame of the Swiss Earth Observatory Network (SEON) project and by a grant of the 662
European Space Agency (ESA) in frame of the FLEX-PARCS E Paul-Limoges was 663
supported in part by the Natural Sciences and Engineering Research Council of Canada 664
through a postgraduate scholarship We would like to thank the APEX team for acquiring the 665
APEX data Authors sequence is listed following the FLAE approach (doi 666
101371journalpbio0050018) 667
28
References 668
Ammann C Flechard CR Leifeld J Neftel A amp Fuhrer J (2007) The carbon budget of 669
newly established temperate grassland depends on management intensity Agriculture 670
Ecosystems amp Environment 121 5-20 671
Amoros-Lopez J Gomez-Chova L Vila-Frances J Alonso L Calpe J Moreno J amp 672
del Valle-Tascon S (2008) Evaluation of remote sensing of vegetation fluorescence by 673
the analysis of diurnal cycles International Journal of Remote Sensing 29 5423-5436 674
Baker NR (2008) Chlorophyll Fluorescence A probe of photosynthesis in vivo Annual 675
Review of Plant Physiology and Plant Molecular Biology 59 89-113 676
Baldocchi D Falge E Gu LH Olson R Hollinger D Running S Anthoni P 677
Bernhofer C Davis K Evans R Fuentes J Goldstein A Katul G Law B Lee 678
XH Malhi Y Meyers T Munger W Oechel W U KTP Pilegaard K Schmid 679
HP Valentini R Verma S Vesala T Wilson K amp Wofsy S (2001) FLUXNET A 680
new tool to study the temporal and spatial variability of ecosystem-scale carbon dioxide 681
water vapor and energy flux densities Bulletin of the American Meteorological Society 682
82 2415-2434 683
Baldocchi DD (2003) Assessing the eddy covariance technique for evaluating carbon 684
dioxide exchange rates of ecosystems past present and future Global Change Biology 9 685
479-492 686
Balzarolo M Anderson K Nichol C Rossini M Vescovo L Arriga N Wohlfahrt G 687
Calvet J-C Carrara A Cerasoli S Cogliati S Daumard F Eklundh L Elbers JA 688
Evrendilek F Handcock RN Kaduk J Klumpp K Longdoz B Matteucci G 689
Meroni M Montagnani L Ourcival J-M Sanchez-Canete EP Pontailler J-Y 690
Juszczak R Scholes B amp Pilar Martin M (2011) Ground-Based Optical Measurements 691
at European Flux Sites A Review of Methods Instruments and Current Controversies 692
Sensors 11 7954-7981 693
Barcza Z Kern A Haszpra L amp Kljun N (2009) Spatial representativeness of tall tower 694
eddy covariance measurements using remote sensing and footprint analysis Agricultural 695
and Forest Meteorology 149 795-807 696
Barton CVM amp North PRJ (2001) Remote sensing of canopy light use efficiency using 697
the photochemical reflectance index - Model and sensitivity analysis Remote Sensing of 698
Environment 78 264-273 699
Beer C Reichstein M Tomelleri E Ciais P Jung M Carvalhais N Roedenbeck C 700
Arain MA Baldocchi D Bonan GB Bondeau A Cescatti A Lasslop G Lindroth 701
29
A Lomas M Luyssaert S Margolis H Oleson KW Roupsard O Veenendaal E 702
Viovy N Williams C Woodward FI amp Papale D (2010) Terrestrial Gross Carbon 703
Dioxide Uptake Global Distribution and Covariation with Climate Science 329 834-838 704
Berk A Anderson GP Acharya PK Bernstein LS Muratov L Lee J Fox M 705
Adler-Golden SM Chetwynd JH Hoke ML Lockwood RB Gardner JA Cooley 706
TW Borel CC amp Lewis PE (2005) MODTRAN5 A reformulated atmospheric band 707
model with auxiliary species and practical multiple scattering options Proceedings of the 708
Society of Photo-Optical Instrumentation Engineer 5655 662-667 709
Cheng SJ Bohrer G Steiner AL Hollinger DY Suyker A Phillips RP amp 710
Nadelhoffer KJ (2015) Variations in the influence of diffuse light on gross primary 711
productivity in temperate ecosystems Agricultural and Forest Meteorology 201 98-110 712
Cheng Y-B Middleton EM Zhang Q Huemmrich KF Campbell PKE Corp LA 713
Cook BD Kustas WP amp Daughtry CS (2013) Integrating Solar Induced 714
Fluorescence and the Photochemical Reflectance Index for Estimating Gross Primary 715
Production in a Cornfield Remote Sensing 5 6857-6879 716
Collatz GJ Ball JT Grivet C amp Berry JA (1991) Physiological and environmental-717
regulation of stomatal conductance photosynthesis and transpiration - a model that 718
includes a laminar boundary-layer Agricultural and Forest Meteorology 54 107-136 719
DOdorico P Alberti E amp Schaepman ME (2010) In-flight spectral performance 720
monitoring of the Airborne Prism Experiment Applied Optics 49 3082-3091 721
DOdorico P Guanter L Schaepman ME amp Schlaumlpfer D (2011) Performance 722
assessment of onboard and scene-based methods for Airborne Prism Experiment spectral 723
characterization Applied Optics 50 4755-4764 724
Damm A Erler A Gioli B Hamdi K Hutjes R Kosvancova M Meroni M 725
Miglietta F Moersch A Moreno J Schickling A Sonnenschein R Udelhoven T 726
Van der Linden S Hostert P amp Rascher U (2010) Remote sensing of sun induced 727
fluorescence yield to improve modelling of diurnal courses of Gross Primary Production 728
(GPP) Global Change Biology 16 171-186 729
Damm A Erler A Hillen W Meroni M Schaepman ME Verhoef W amp Rascher U 730
(2011) Modeling the impact of spectral sensor configurations on the FLD retrieval 731
accuracy of sun-induced chlorophyll fluorescence Remote Sensing of Environment 115 732
1882-1892 733
Damm A Guanter L Laurent VCE Schaepman ME Schickling A amp Rascher U 734
(2014) FLD-based retrieval of sun-induced chlorophyll fluorescence from medium 735
30
spectral resolution airborne spectroscopy data Remote Sensing of Environment 147 256-736
266 737
Damm A Guanter L Verhoef W Schlaumlpfer D Garbari S amp Schaepman ME (2015) 738
Impact of varying irradiance on vegetation indices and chlorophyll fluorescence derived 739
from spectroscopy data Remote Sensing of Environment 156 202-215 740
Demmig-Adams B (1998) Survey of thermal energy dissipation and pigment composition in 741
sun and shade leaves Plant and Cell Physiology 39 474-482 742
Drolet GG Middleton EM Huemmrich KF Hall FG Amiro BD Barr AG Black 743
TA McCaughey JH amp Margolis HA (2008) Regional mapping of gross light-use 744
efficiency using MODIS spectral indices Remote Sensing of Environment 112 3064-3078 745
Eugster W amp Senn W (1995) A cospectral correction model for measurement of turbulent 746
NO2 fluxes Boundary-Layer Meteorology 74 321-340 747
Eugster W Zeyer K Zeeman M Michna P Zingg A Buchmann N amp Emmenegger 748
L (2007) Methodical study of nitrous oxide eddy covariance measurements using 749
quantum cascade laser spectrometery over a Swiss forest Biogeosciences 4 927-939 750
Falge E Baldocchi D Olson R Anthoni P Aubinet M Bernhofer C Burba G 751
Ceulemans R Clement R Dolman H Granier A Gross P Grunwald T Hollinger 752
D Jensen NO Katul G Keronen P Kowalski A Lai CT Law BE Meyers T 753
Moncrieff H Moors E Munger JW Pilegaard K Rannik U Rebmann C Suyker 754
A Tenhunen J Tu K Verma S Vesala T Wilson K amp Wofsy S (2001) Gap 755
filling strategies for defensible annual sums of net ecosystem exchange Agricultural and 756
Forest Meteorology 107 43-69 757
Falloon P amp Betts R (2010) Climate impacts on European agriculture and water 758
management in the context of adaptation and mitigation-The importance of an integrated 759
approach Science of the Total Environment 408 5667-5687 760
Foken T amp Wichura B (1996) Tools for quality assessment of surface-based flux 761
measurements Agricultural and Forest Meteorology 78 83-105 762
Fournier A Daumard F Champagne S Ounis A Goulas Y amp Moya I (2012) Effect 763
of canopy structure on sun-induced chlorophyll fluorescence Isprs Journal of 764
Photogrammetry and Remote Sensing 68 112-120 765
Frankenberg C Fisher JB Worden J Badgley G Saatchi SS Lee JE Toon GC 766
Butz A Jung M Kuze A amp Yokota T (2011) New global observations of the 767
terrestrial carbon cycle from GOSAT Patterns of plant fluorescence with gross primary 768
productivity Geophysical Research Letters 38 769
31
Gamon JA amp Berry JA (2012) Facultative and constitutive pigment effects on the 770
Photochemical Reflectance Index (PRI) in sun and shade conifer needles Israel Journal of 771
Plant Sciences 60 85-95 772
Gamon JA Coburn C Flanagan LB Huemmrich KF Kiddle C Sanchez-Azofeifa 773
GA Thayer DR Vescovo L Gianelle D Sims DA Rahman AF amp Pastorello 774
GZ (2010) SpecNet revisited bridging flux and remote sensing communities Canadian 775
Journal of Remote Sensing 36 S376-S390 776
Gamon JA Penuelas J amp Field CB (1992) A narrow-waveband spectral index that 777
tracks diurnal changes in photosynthetic efficiency Remote Sensing of Environment 41 778
35-44 779
Garbulsky MF Filella I Verger A amp Penuelas J (2014) Photosynthetic light use 780
efficiency from satellite sensors From global to Mediterranean vegetation Environmental 781
and Experimental Botany 103 3-11 782
Garbulsky MF Penuelas J Papale D Ardo J Goulden ML Kiely G Richardson 783
AD Rotenberg E Veenendaal EM amp Filella I (2010) Patterns and controls of the 784
variability of radiation use efficiency and primary productivity across terrestrial 785
ecosystems Global Ecology and Biogeography 19 253-267 786
Gege P Fries J Haschberger P Schoumltz P Schwarzer H Strobl P Suhr B Ulbrich 787
G amp Vreeling WJ (2009) Calibration facility for airborne imaging spectrometers 788
ISPRS Journal of Photogrammetry amp Remote Sensing 64 387ndash397 789
Gitelson AA amp Gamon JA (2015) The need for a common basis for defining light-use 790
efficiency Implications for productivity estimation Remote Sensing of Environment 156 791
196-201 792
Goetz SJ amp Prince SD (1999) Modelling terrestrial carbon exchange and storage 793
Evidence and implications of functional convergence in light-use efficiency Advances in 794
Ecological Research Vol 28 (pp 57-92) 795
Govindjee (2004) Chlorophyll a fluorescence A bit of basics and history In GC 796
Papageorgiou amp Govindjee (Eds) Chlorophyll a Fluorescence A Signature of 797
Photosynthesis Advances in Photosynthesis and Respiration (pp 1-42) Dordrecht 798
Springer 799
Guanter L Alonso L Gomez-Chova L Amoros-Lopez J Vila J amp Moreno J (2007) 800
Estimation of solar-induced vegetation fluorescence from space measurements 801
Geophysical Research Letters 34 doi 1010292007GL029289 802
32
Guanter L Alonso L Gomez-Chova L Meroni M Preusker R Fischer J amp Moreno 803
J (2010) Developments for vegetation fluorescence retrieval from spaceborne high-804
resolution spectrometry in the O2-A and O2-B absorption bands Journal of Geophysical 805
Research-Atmospheres 115 806
Guanter L Frankenberg C Dudhia A Lewis PE Goacutemez-Dans J Kuze A Suto H amp 807
Grainger R (2012) Retrieval and global assessment of terrestrial chlorophyll fluorescence 808
from GOSAT space measurements Remote Sensing of Environment 121 236-251 809
Guanter L Rossini M Colombo R Meroni M Frankenberg C Lee J-E amp Joiner J 810
(2013) Using field spectroscopy to assess the potential of statistical approaches for the 811
retrieval of sun-induced chlorophyll fluorescence from ground and space Remote Sensing 812
of Environment 133 52-61 813
Guanter L Zhang Y Jung M Joiner J Voigt M Berry JA Frankenberg C Huete 814
AR Zarco-Tejada P Lee J-E Moran MS Ponce-Campos G Beer C Camps-815
Valls G Buchmann N Gianelle D Klumpp K Cescatti A Baker JM amp Griffis 816
TJ (2014) Global and time-resolved monitoring of crop photosynthesis with chlorophyll 817
fluorescence Proceedings of the National Academy of Sciences of the United States of 818
America 111 E1327-E1333 819
Haboudane D Miller JR Pattey E Zarco-Tejada PJ amp Strachan IB (2004) 820
Hyperspectral vegetation indices and novel algorithms for predicting green LAI of crop 821
canopies Modeling and validation in the context of precision agriculture Remote Sensing 822
of Environment 90 337-352 823
Hanan NP Burba G Verma SB Berry JA Suyker A amp Walter-Shea EA (2002) 824
Inversion of net ecosystem CO2 flux measurements for estimation of canopy PAR 825
absorption Global Change Biology 8 563-574 826
Hernandez-Clemente R Navarro-Cerrillo RM Suarez L Morales F amp Zarco-Tejada 827
PJ (2011) Assessing structural effects on PRI for stress detection in conifer forests 828
Remote Sensing of Environment 115 2360-2375 829
Hilker T Coops NC Wulder MA Black TA amp Guy RD (2008) The use of remote 830
sensing in light use efficiency based models of gross primary production A review of 831
current status and future requirements Science of the Total Environment 404 411-423 832
Hilker T Gitelson A Coops NC Hall FG amp Black TA (2011) Tracking plant 833
physiological properties from multi-angular tower-based remote sensing Oecologia 165 834
865-876 835
33
Hilker T Lyapustin A Hall FG Wang Y Coops NC Drolet G amp Black TA 836
(2009) An assessment of photosynthetic light use efficiency from space Modeling the 837
atmospheric and directional impacts on PRI reflectance Remote Sensing of Environment 838
113 2463-2475 839
Hueni A Biesemans J Meuleman K DellEndice F Schlaumlpfer D Adriaensen S 840
Kempenaers S Odermatt D Kneubuehler M Nieke J amp Itten K (2009) Structure 841
Components and Interfaces of the Airborne Prism Experiment (APEX) Processing and 842
Archiving Facility IEEE Transactions on Geoscience and Remote Sensing 47 29-43 843
Hueni A Lenhard K Baumgartner A amp Schaepman M (2013) The APEX (Airborne 844
Prism Experiment - Imaging Spectrometer) Calibration Information System IEEE 845
Transactions on Geoscience and Remote Sensing 51 5169-5180 846
Hueni A Schlaepfer D Jehle M amp Schaepman M (2015) Impacts of Dichroic Prism 847
Coatings on Radiometry of the Airborne Imaging Spectrometer APEX Applied Optics 53 848
5344-5352 849
Imhoff ML Bounoua L Ricketts T Loucks C Harriss R amp Lawrence WT (2004) 850
Global patterns in human consumption of net primary production Nature 429 870-873 851
IPCC (2013) Summary for policymakers Climate change 2013 the physical science basis 852
Cambridge University Press Cambridge United Kingdom and New York NY USA 853
Jacquemoud S amp Baret F (1990) PROSPECT A model of leaf optical properties spectra 854
Remote Sensing of Environment 34 75-91 855
Jehle M Hueni A Damm A DOdorico P Kneubuumlhler M Meuleman K Schlapfer 856
D Schaepman ME amp Weyermann J (2010) APEX - current status performance and 857
validation concept IEEE Sensors 2010 Conference 533-537 858
Joiner J Guanter L Lindstrot R Voigt M Vasilkov AP Middleton EM Huemmrich 859
KF Yoshida Y amp Frankenberg C (2013) Global monitoring of terrestrial chlorophyll 860
fluorescence from moderate spectral resolution near-infrared satellite measurements 861
methodology simulations and application to GOME-2 Atmos Meas Tech Discuss 6 862
3883-3930 863
Jung M Reichstein M Margolis HA Cescatti A Richardson AD Arain MA 864
Arneth A Bernhofer C Bonal D Chen J Gianelle D Gobron N Kiely G Kutsch 865
W Lasslop G Law BE Lindroth A Merbold L Montagnani L Moors EJ 866
Papale D Sottocornola M Vaccari F amp Williams C (2011) Global patterns of land-867
atmosphere fluxes of carbon dioxide latent heat and sensible heat derived from eddy 868
34
covariance satellite and meteorological observations Journal of Geophysical Research-869
Biogeosciences 116 870
Kljun N Kastner-Klein P Fedorovich E amp Rotach MW (2004) Evaluation of 871
Lagrangian footprint model using data from wind tunnel convective boundary layer 872
Agricultural and Forest Meteorology 127 189-201 873
Kljun N Rotach MW amp Schmid HP (2002) A three-dimensional backward lagrangian 874
footprint model for a wide range of boundary-layer stratifications Boundary-Layer 875
Meteorology 103 205-226 876
Knyazikhin Y Schull MA Stenberg P Mottus M Rautiainen M Yang Y Marshak 877
A Latorre Carmona P Kaufmann RK Lewis P Disney MI Vanderbilt V Davis 878
AB Baret F Jacquemoud S Lyapustin A amp Myneni RB (2013) Hyperspectral 879
remote sensing of foliar nitrogen content Proceedings of the National Academy of 880
Sciences of the United States of America 110 E185-E192 881
Kovac D Malenovsky Z Urban O Spunda V Kalina J Ac A Kaplan V amp Hanus 882
J (2013) Response of green reflectance continuum removal index to the xanthophyll de-883
epoxidation cycle in Norway spruce needles Journal of Experimental Botany 64 1817-884
1827 885
Krausmann F Erb K-H Gingrich S Haberl H Bondeau A Gaube V Lauk C 886
Plutzar C amp Searchinger TD (2013) Global human appropriation of net primary 887
production doubled in the 20th century Proceedings of the National Academy of Sciences 888
of the United States of America 110 10324-10329 889
Lasslop G Reichstein M Papale D Richardson AD Arneth A Barr A Stoy P amp 890
Wohlfahrt G (2010) Separation of net ecosystem exchange into assimilation and 891
respiration using a light response curve approach critical issues and global evaluation 892
Global Change Biology 16 187-208 893
Laurent VCE Verhoef W Damm A Schaepman ME amp Clevers JGPW (2013) A 894
Bayesian object-based approach for estimating vegetation biophysical variables from at-895
sensor APEX radiance data Remote Sensing of Environment 139 6-17 896
Lee JE Berry JA Van der Tol C Yang X Guanter L Damm A Baker I amp 897
Frankenberg C (2015) Simulations of chlorophyll fluorescence in corporated into the 898
Community Land Model version 4 Global Change Biology in print 899
Lewis P amp Disney M (2007) Spectral invariants and scattering across multiple scales from 900
within-leaf to canopy Remote Sensing of Environment 109 196-206 901
35
Liu LY amp Cheng ZH (2010) Detection of Vegetation Light-Use Efficiency Based on 902
Solar-Induced Chlorophyll Fluorescence Separated From Canopy Radiance Spectrum Ieee 903
Journal of Selected Topics in Applied Earth Observations and Remote Sensing 3 306-312 904
Louis J Ounis A Ducruet JM Evain S Laurila T Thum T Aurela M Wingsle G 905
Alonso L Pedros R amp Moya I (2005) Remote sensing of sunlight-induced chlorophyll 906
fluorescence and reflectance of Scots pine in the boreal forest during spring recovery 907
Remote Sensing of Environment 96 37-48 908
Maier SW Guumlnther KP amp Stellmes M (2003) Sun-Induced Fluorescence A New Tool 909
for Precision Farming In M McDonald J Schepers L Tartly T van Toai amp D Major 910
(Eds) Digital Imaging and Spectral Techniques Applications to Precision Agriculture 911
and Crop Physiology (pp 209-222) ASA Special Publication 912
Mauder M Foken T Clement R Elbers JA Eugster W Gruenwald T Heusinkveld 913
B amp Kolle O (2008) Quality control of CarboEurope flux data - Part 2 Inter-914
comparison of eddy-covariance software Biogeosciences 5 451-462 915
Meroni M Busetto L Guanter L Cogliati S Crosta GF Migliavacca M Panigada 916
C Rossini M amp Colombo R (2010) Characterization of fine resolution field 917
spectrometers using solar Fraunhofer lines and atmospheric absorption features Applied 918
Optics 49 2858-2871 919
Meroni M Picchi V Rossini M Cogliati S Panigada C Nali C Lorenzini G amp 920
Colombo R (2008) Leaf level early assessment of ozone injuries by passive fluorescence 921
and photochemical reflectance index International Journal of Remote Sensing 29 5409-922
5422 923
Meroni M Rossini M Guanter L Alonso L Rascher U Colombo R amp Moreno J 924
(2009) Remote sensing of solar induced chlorophyll fluorescence review of methods and 925
applications Remote Sensing of Environment doi101016jrse200905003 926
Michaelis L amp Menten ML (1913) The kenetics of the inversion effect Biochemische 927
Zeitschrift 49 333-369 928
Middleton E McMurtney JE Campbell PK Corp LA Butcher LM amp Chappelle 929
EW (2002) Optical and fluorescence properties of corn leaves from different nitrogen 930
regimes In M Owe G Durso amp L Toulios (Eds) Conference on Remote Sensing for 931
Agriculture Ecosystems and Hydrology IV (pp 72-83) Agia Pelagia Greece 932
Miller JR Berger M Goulas Y Jacquemoud S Louis J Moise N Mohammed G 933
Moreno J Moya I Pedroacutes R Verhoef W amp Zarco-Tejada PJ (2005) Development 934
36
of a vegetation fluorescence canopy model Final Report May 2005 In European Space 935
Research and Technology Centre (ESTEC) 936
Monteith JL (1972) Solar-radiation and productivity in tropical ecosystems Journal of 937
Applied Ecology 9 747-766 938
Niinemets U Kollist H Garcia-Plazaola JI Hernandez A amp Becerril JM (2003) Do 939
the capacity and kinetics for modification of xanthophyll cycle pool size depend on growth 940
irradiance in temperate trees Plant Cell and Environment 26 1787-1801 941
Nobel PS Forseth IN amp Long SP (1993) Canopy structure and light interception 942
Ozanne CMP Anhuf D Boulter SL Keller M Kitching RL Korner C Meinzer 943
FC Mitchell AW Nakashizuka T Dias PLS Stork NE Wright SJ amp 944
Yoshimura M (2003) Biodiversity meets the atmosphere A global view of forest 945
canopies Science 301 183-186 946
Parazoo NC Bowman K Fisher JB Frankenberg C Jones DBA Cescatti A Peacuterez-947
Priego Oacute Wohlfahrt G amp Montagnani L (2014) Terrestrial gross primary production 948
inferred from satellite fluorescence and vegetation models Global Change Biology na-na 949
Plascyk JA (1975) MK II Fraunhofer Line Dicsriminator (FLD-II) for airborne and orbital 950
remote-sensing of solar-stimulated luminescence Optical Engineering 14 339-346 951
Porcar-Castell A Tyystjaumlrvi E Atherton J Van der Tol C Flexas J EE P Moreno 952
J Frankenberg C amp Berry JA (2014) Linking chlorophyll a fluorescence to 953
photosynthesis for remote sensing applications mechanisms and challenges Journal of 954
Experimental Botany 65 4065-4095 955
Rascher U Agati G Alonso L Cecci G Champagne S Colombo R Damm A 956
Daumard F De Miguel E Fernandez G Franch B Franke J Gerbig C Gioli B 957
Gomez JA Goulas Y Guanter L Gutierrez-De-La-Camara O Hamdi K Hostert 958
P Jimenez M Kosvancova M Lognoli D Meroni M Miglietta F Moersch A 959
Moreno J Moya I Neininger B Okujeni A Ounis A Palombi L Raimondi V 960
Schickling A Sobrino JA Stellmes M Toci G Toscano P Udelhoven T Van der 961
Linden S amp Zaldei A (2009) CEFLES2 The remote sensing component to quantify 962
photosynthetic efficiency from the leaf to the region by measuring sun-induced 963
fluorescence in the oxygen absorption bands Biogeosciences 6 1181-1198 964
Richter R amp Schlaumlpfer D (2002) Geo-atmospheric processing of airborne imaging 965
spectrometry data Part 2 Atmospherictopographic correction International Journal of 966
Remote Sensing 23 2631-2649 967
37
Rossini M Meroni M Migliavacca M Manca G Cogliati S Busetto L Picchi V 968
Cescatti A Seufert G amp Colombo R (2010) High resolution field spectroscopy 969
measurements for estimating gross ecosystem production in a rice field Agricultural and 970
Forest Meteorology 150 1283-1296 971
Rossini M Nedbal L Guanter L Ač A Alonso L Burkart A Cogliati S Colombo 972
R Damm A Drusch M Hanus J Julitta T Kokkalis P Moreno J Panigada C 973
Pinto F Schickling A Schuumlttemeyer D Zemek F amp Rascher U (2015) Red and far-974
red sun-induced chlorophyll fluorescence as a measure of plant photosynthesis 975
Geophysical Research Letters (accepted for publication) 976
Ruimy A Jarvis PG Baldocchi DD amp B S (1995) CO2 Fluxes over Plant Canopies 977
and Solar Radiation A Review Advances in Ecological Research 26 1-68 978
Running SW Nemani RR Heinsch FA Zhao MS Reeves M amp Hashimoto H 979
(2004) A continuous satellite-derived measure of global terrestrial primary production 980
Bioscience 54 547-560 981
Schaepman ME M J Hueni A DrsquoOdorico P Damm A Weyermann J Schneider F 982
Laurent VCE C P Seidel F Lenhard K Gege P Kuechler C Brazile J Kohler 983
P De Vos L Meuleman K Meynart R Schlaepfer D Kneubuumlhler M amp Itten K 984
(2015) Advanced radiometry measurements and Earth science applications with the 985
Airborne Prism Experiment (APEX) Remote Sensing of Environment 158 207-219 986
Schimel D Pavlick R Fisher JB Asner GP Saatchi S Townsend P Miller C 987
Frankenberg C Hibbard K amp Cox P (2014) Observing terrestrial ecosystems and the 988
carbon cycle from space Global Change Biology na-na 989
Schlaumlpfer D amp Richter R (2002) Geo-atmospheric processing of airborne imaging 990
spectrometry data Part 1 Parametric orthorectification International Journal of Remote 991
Sensing 23 2609-2630 992
Schneider FD Leiterer R Morsdorf F Gastellu-Etchegorry J-P Lauret N Pfeifer N 993
amp Schaepman ME (2014) Simulating imaging spectrometer data 3D forest modeling 994
based on LiDAR and in situ data Remote Sensing of Environment 152 235-250 995
Schroter D Cramer W Leemans R Prentice IC Araujo MB Arnell NW Bondeau 996
A Bugmann H Carter TR Gracia CA de la Vega-Leinert AC Erhard M Ewert 997
F Glendining M House JI Kankaanpaa S Klein RJT Lavorel S Lindner M 998
Metzger MJ Meyer J Mitchell TD Reginster I Rounsevell M Sabate S Sitch 999
S Smith B Smith J Smith P Sykes MT Thonicke K Thuiller W Tuck G 1000
38
Zaehle S amp Zierl B (2005) Ecosystem service supply and vulnerability to global change 1001
in Europe Science 310 1333-1337 1002
Sitch S Smith B Prentice IC Arneth A Bondeau A Cramer W Kaplan JO Levis 1003
S Lucht W Sykes MT Thonicke K amp Venevsky S (2003) Evaluation of ecosystem 1004
dynamics plant geography and terrestrial carbon cycling in the LPJ dynamic global 1005
vegetation model Global Change Biology 9 161-185 1006
Stewart DW Costa C Dwyer LM Smith DL Hamilton RI amp Ma BL (2003) 1007
Canopy structure light interception and photosynthesis in maize Agronomy Journal 95 1008
1465-1474 1009
Trnka M Dubrovsky M amp Zalud Z (2004) Climate change impacts and adaptation 1010
strategies in spring barley production in the Czech Republic Climatic Change 64 227-1011
255 1012
Turner DP Ritts WD Cohen WB Maeirsperger TK Gower ST Kirschbaum AA 1013
Running SW Zhao MS Wofsy SC Dunn AL Law BE Campbell JL Oechel 1014
WC Kwon HJ Meyers TP Small EE Kurc SA amp Gamon JA (2005) Site-level 1015
evaluation of satellite-based global terrestrial gross primary production and net primary 1016
production monitoring Global Change Biology 11 666-684 1017
van der Tol C Berry J Campbell PKE amp Rascher U (2014) Models of fluorescence 1018
and photosynthesis for interpreting measurements of solar-induced chlorophyll 1019
fluorescence Journal of Geophysical Research Biogeosciences IN PRESS 1020
van der Tol C Verhoef W amp Rosema A (2009a) A model for chlorophyll fluorescence 1021
and photosynthesis at leaf scale Agricultural and Forest Meteorology 149 96-105 1022
van der Tol C Verhoef W Timmermans A Verhoef A amp Su Z (2009b) An integrated 1023
model of soil-canopy spectral radiances photosynthesis fluorescence temperature and 1024
energy balance Biogeosciences 6 3109-3129 1025
Verhoef W (1984) Light scattering by leaf layers with application to canopy reflectance 1026
modeling The SAIL model Remote Sensing of Environment 16 125-141 1027
Verhoef W amp Bach H (2003a) Remote sensing data assimilation using coupled radiative 1028
transfer models Physics and Chemistry of the Earth 28 3-13 1029
Verhoef W amp Bach H (2003b) Simulation of hyperspectral and directional radiance 1030
images using coupled biophysical and atmospheric radiative transfer models Remote 1031
Sensing of Environment 87 23-41 1032
39
Verhoef W amp Bach H (2007) Coupled soil-leaf-canopy and atmosphere radiative transfer 1033
modeling to simulate hyperspectral multi-angular surface reflectance and TOA radiance 1034
data Remote Sensing of Environment 109 166-182 1035
Verhoef W Jia L Xiao Q amp Su Z (2007) Unified optical-thermal four-stream radiative 1036
transfer theory for homogeneous vegetation canopies Ieee Transactions on Geoscience 1037
and Remote Sensing 45 1808-1822 1038
Webb EK Pearman GI amp Leuning R (1980) Correction of flux measurements for 1039
density effects due to heat and water-vapour transfer Quarterly Journal of the Royal 1040
Meteorological Society 106 85-100 1041
Wu C Niu Z Tang Q amp Huang W (2010) Revised photochemical reflectance index 1042
(PRI) for predicting light use efficiency of wheat in a growth cycle validation and 1043
comparison International Journal of Remote Sensing 31 2911-2924 1044
Yang X Tang J Mustard JF Lee JE Rossini M Joiner J Munger JW Kornfeld 1045
A amp Richardson AD (2015) Solar-induced chlorophyll fluorescence that correlates with 1046
canopy photosynthesis on diurnal and seasonal scales in a temperate deciduous forest 1047
Geophysical Research Letters 1048
Zarco-Tejada PJ Berni JAJ Suarez L Sepulcre-Canto G Morales F amp Miller JR 1049
(2009) Imaging chlorophyll fluorescence with an airborne narrow-band multispectral 1050
camera for vegetation stress detection Remote Sensing of Environment 113 1262-1275 1051
Zarco-Tejada PJ Gonzalez-Dugo V amp Berni JAJ (2012) Fluorescence temperature and 1052
narrow-band indices acquired from a UAV platform for water stress detection using a 1053
micro-hyperspectral imager and a thermal camera Remote Sensing of Environment 117 1054
322-337 1055
Zarco-Tejada PJ Morales A Testi L amp Villalobos FJ (2013) Spatio-temporal patterns 1056
of chlorophyll fluorescence and physiological and structural indices acquired from 1057
hyperspectral imagery as compared with carbon fluxes measured with eddy covariance 1058
Remote Sensing of Environment 133 102-115 1059
Zhang Q Middleton EM Cheng YB amp Landis DR (2013) Variations of foliage 1060
chlorophyll fAPAR and foliage non-chlorophyll fAPAR (fAPARchl fAPARnonchl) at the 1061
Harvard Forest Ieee Journal of Selected Topics in Applied Earth Observations and Remote 1062
Sensing 6 2254-2264 1063
Zhang Q Middleton EM Gao BC amp Cheng YB (2012) Using EO-1 hyperion to 1064
simulate HyspIRI products for a coniferous forest The fraction of par absorbed by 1065
40
chlorophyll (fAPAR chl) and leaf water content (LWC) Ieee Transactions on Geoscience 1066
and Remote Sensing 50 1844-1852 1067
Zhang Y Guanter L Berry JA Joiner J van der Tol C Huete A Gitelson A Voigt 1068
M amp Koumlhler P (2014) Estimation of vegetation photosynthetic capacity from space-1069
based measurements of chlorophyll fluorescence for terrestrial biosphere models Global 1070
Change Biology 20 3727-3742 1071
1072
41
Appendix-A APEX data calibration 1073
The calibration of APEX images is based on the APEX Processing and Archiving Facility 1074
(PAF) which is the combined software and hardware designed to generate calibrated level 1 1075
at-sensor radiances from APEX raw image streams (Hueni et al 2009) Calibration 1076
coefficients for the radiometric geometric and spectral calibrations are generated from system 1077
calibrations at the APEX Calibration Home Base (CHB) at DLR Oberpfaffenhofen (Gege et 1078
al 2009) These CHB data are stored and processed within the APEX Calibration Information 1079
System (CAL IS) producing the so-called calibration cubes holding coefficients for each 1080
spatio-spectral pixel (Hueni et al 2013) 1081
For the multi-temporal dataset employed within this study all flight lines were 1082
reprocessed from the original raw image streams to ensure that the same version of the 1083
processor was applied The APEX PAF and CAL IS have significantly evolved over the 1084
timeframe of the dataset with calibrations getting more accurate over the years To ensure 1085
consistency all data were calibrated using coefficients obtained in May 2013 1086
The processor was specifically configured to retain the highest information content in 1087
the VNIR channel including i) no spectral resampling to compensate for spectral shifts and 1088
misregistrations (DOdorico et al 2010 DOdorico et al 2011) ii) no compensation of 1089
spectral shift related changes in radiometry (Hueni et al 2015) and iii) no spatial 1090
misregistration correction The calibration was thus effectively reduced to a linear dark 1091
current correction over time a de-smearing of the visible-NIR channel to compensate for 1092
sensor smear effects the application of radiometric gains and offsets followed by a destriping 1093
routine working in the spatial dimension only to remove pushbroom related along track 1094
striping Calibrated radiance data were directly used for the fluorescence retrieval (see Section 1095
24) while the feasibility to use APEX for SIF760 retrievals was theoretically demonstrated in 1096
42
a study of Damm et al (2011) Resulting SIF760 maps were afterwards geo-rectified using a 1097
parametric geocoding approach (Schlaumlpfer and Richter 2002) 1098
43
Appendix-B Retrieval of SIF760 from airborne data 1099
The quantification of SIF measured with ground or airborne-based spectrometers 1100
requires separating emitted SIF from the reflected radiance flux The Fraunhofer Line Depth 1101
(FLD) approach introduced by Plascyk (1975) serves as a de facto standard for medium 1102
resolution instruments such as APEX (Meroni et al 2009) and was applied in our study The 1103
FLD method uses atmospheric absorption bands characterized by lower incident light 1104
compared to wavelength regions outside of these bands This configuration increases the 1105
spectral information and allows the separation of SIF from reflected radiation In this study 1106
we used the broad O2-A oxygen absorption band around 760 nm and quantified the infilling of 1107
SIF760 using radiance measurements inside (subscript i) and outside (subscript o) of the O2-A 1108
band 1109
For the airborne case only atmospheric components can be simulated with 1110
MODTRAN-5 assuming perfect knowledge of the acquisition conditions The reflectance 1111
terms for diffuse and direct irradiance as well as the SIF760 contribution are usually unknown 1112
Assuming Lambertian surface reflectance behavior which introduces some inaccuracies but 1113
allows formulating the radiative transfer (RT) for radiance measurements at sensor level (LAtS) 1114
to obtain SIF760 both measurements inside and outside of the absorption band can be 1115
expressed as 1116
E9FA lang3H IJK LMNrangP QlangRSE rang T UlangVWWH VXWH rang∙langVYYH VYXH rangZH
Hlang[XXH rang T ABCHUlangVWWH ranglangVXWH rangZHlang[XXH rang ] ^ _ (B1) 1117
where E0 is the top-of-atmosphere irradiance including diffuse and direct irradiance 1118
components θil is the illumination zenith angle ρso is the path scattered radiance τss is the 1119
direct transmittance for sunlight τoo is the direct transmittance in view direction τsd is the 1120
diffuse transmittance of the atmosphere for sunlight τdo is the hemispherical-directional 1121
transmittance in view direction and ρdd is the spherical albedo If these atmospheric 1122
44
components are obtained from MODTRAN-5 simulations (Damm et al 2015 Verhoef and 1123
Bach 2003a b 2007) the radiative transfer equation (Eq B1) only contains four unknowns 1124
namely Ri Ro SIFi and SIFo The 3FLD method (Maier et al 2003) which is an adaptation of 1125
the original FLD method proposed by (Plascyk 1975) was used to linearly relate R and SIF 1126
inside and outside of the O2-A absorption band SIF can be finally retrieved with 1127
13 -0 abcMUdWecWlangRff_ rangZghcWUdMecMlangRff^ rangZiUdWecWlangRff_ rangZghUdMecMlangRff^ rangZ j
langVWWM ranglangVXWM rang (B2) 1128
kE lE9FA m lang3HW IJK LMNrangP langRSE rangn ] ^ _ (B3) 1129
E lang3HW IJK LMNrangP langoSSE TopSE rang ∙ langoE opE rang qEprs T Eprt] ^ _ (B4) 1130
r S13rlangoSSr rang T langopSr rang v13S$langoSSS rang T langopSS rangw (B5) 1131
where B is the factor relating SIFi and SIFo and was fixed to a value of 08 justified by 1132
simulations and experiments (Rascher et al 2009 Alonso et al 2008) Xj equals the at-1133
sensor radiance (reflected plus emitted radiation) without path radiance contribution and Ej 1134
expresses surface irradiance as measured at the sensor level A is the factor relating Ri and Ro 1135
and was derived from linear interpolation of R of the left (758 nm) and right (771 nm) O2-A 1136
band shoulder with 1137
xx+ (B6) 1138
y ```-0```z and y `-0`z
```z (B7) 1139
1140
Because APEX suffered from slight spectral smile effects (DOdorico et al 2010) 1141
updated center wavelength positions were involved in the convolution approach The spectral 1142
shift quantification for each pixel across track was based on the Cr method as described in 1143
45
Meroni et al (2010) The method assumes a high correlation between a measured and a 1144
convolved spectrum and iteratively minimizes a cost function which is 1 minus the Pearson 1145
correlation coefficient (r) calculated for both signals Remaining artifacts of the spectral shift 1146
correction and slightly inaccurate estimates of atmospheric properties cause SIF760 retrieval 1147
uncertainties We therefore applied a semi-empirical correction as described in Damm et al 1148
(2014) for each scan line across the track This technique employs reference surfaces which 1149
are free of any SIF760 emission (eg bare soil) to adjust the upward transmittance term inside 1150
the absorption feature oSSr The retrieval of SIF760 from top-of-canopy radiance data measured 1151
on ground follows the same approach as described in Eqs B2-B7 under the assumption that 1152
the surface irradiance can be approximated with the measurement of a reference panel and 1153
that ρso τdo and τdo can be set to 0 Furthermore the spectral resolution of APEX can be 1154
considered suboptimal for SIF760 retrievals although Damm et al (2011) demonstrate that 1155
APEX with its spectral resolution of 54 nm at 760 nm is sensitive for SIF760 However 1156
retrieved SIF760 values are too high and in an absolute sense incorrect We used reference 1157
SIF760 data obtained in parallel to the airborne acquisitions using the ASD field spectrometers 1158
(Section 23) to estimate the actual offset The observed scaling factor of 193 was afterwards 1159
applied to the retrieved SIF760 values to transfer them to a realistic value range 1160
46
Appendix-C SIF retrieval accuracy 1161
We applied a quantitative accuracy evaluation of resulting SIF760 maps using ground 1162
measured SIF760 values (Figure C1) Considering all reference data acquired during five 1163
campaigns a good linear relationship was achieved between ground and airborne-based 1164
SIF760 values (r2 = 071) but with a proportionality factor much higher than 1 (Figure C1-A) 1165
This experimentally obtained systematic overestimation of APEX SIF760 is comparable to 1166
simulation results documented in Damm et al (2011) Further we found slightly changing 1167
correlations between the different years (several linear models in Figure C1-A) which are 1168
likely caused by canopy structural effects spectral and radiometric performances of used 1169
ground instruments or slight deviations of the performance of APEX over time 1170
To compensate for the overestimation of APEX SIF760 we applied an empirical correction 1171
factor of 193 derived from the comparison of reference data and APEX which resulted in a 1172
rRMSE of 289 (Figure C1-B) 1173
1174
lt Figure C1 gt 1175
1176
The Laegeren site was covered with three adjacent flight lines having an overlap of 1177
approximately 10 (cf Figure 3) This configuration provides the opportunity to 1178
quantitatively evaluate the consistency of SIF retrievals obtained from different measurements 1179
and view zenith angles (ie plusmn 135deg) The comparison of SIF760 retrievals obtained from flight 1180
lines 1 and 2 reveals a moderate linear relationship for homogeneous agricultural surfaces (r2 1181
= 081 rRMSE = 57) We observed a systematic underestimation of flight line 1 compared 1182
to flight line 2 (factor 06) for a view zenith angle difference of ~26deg for SIF760 indicating 1183
either a directionality of SIF760 emissions or an insufficient decoupling of surface HCRF 1184
affected by reflectance anisotropy With increasing surface heterogeneity scattering increases 1185
47
and the agreement of retrieved SIF from both flight lines slightly decreases (ie for forested 1186
areas r2 of 05 and rRMSE of 88) This lower correlation can be mainly associated to slight 1187
geometric mis-registrations (ie max 2 pixel ~ 40 m) in combination with surface 1188
heterogeneity (eg shaded and sunlit tree crowns) and emission anisotropy of SIF760 Also 1189
negative SIF760 values are present in the SIF760 maps and caused by sensor noise and 1190
especially for forests due to shadowing effects (Damm et al 2015) 1191
48
Appendix-D Technical aspects determining the SIF760 retrieval accuracy 1192
A rigorous evaluation of the SIF760 retrieval accuracy is crucial to judge the reliability 1193
of our assessment on the relationship between SIF760 and GPPEC across ecosystems 1194
Furthermore additional factors imposing variations on SIF760 retrieved from airborne 1195
spectroscopy data that cannot be related to the physiological origin of SIF760 needs to be 1196
critically discussed to justify the proposed approach 1197
Ground-based measurements of SIF760 were made using field spectrometers to validate 1198
the airborne retrievals Field spectroscopy provides a good reference for validating airborne 1199
retrievals as it is likely not affected by biases resulting from atmospheric composition 1200
estimates (eg aerosol load) due to the simultaneous measurement of irradiance fluxes at 1201
canopy level using a reference panel The reliability of the applied field spectroscopic 1202
approach to measure SIF760 was previously demonstrated using field studies (Damm et al 1203
2010 Liu and Cheng 2010 Meroni et al 2009 Rascher et al 2009) and theoretical 1204
assessments (Damm et al 2011) It must be noted that field spectroscopic approaches are 1205
subject to uncertainties particularly for heterogeneous vegetation canopies Damm et al 1206
(2015) discussed retrieval errors caused by illumination effects likely introducing slight 1207
errors in reference SIF760 This source of uncertainty must be considered when judging the 1208
accuracy of APEX SIF760 The nevertheless good agreement between ground and airborne 1209
observations indicated that atmospheric absorption and scattering effects could be sufficiently 1210
compensated and thus demonstrated the reliability of retrieved SIF760 measurements In 1211
particular the empirical correction applied making use of high spatial resolution airborne IS 1212
data in combination with reference surfaces not emitting SIF760 allowed to bypass retrieval 1213
uncertainties caused by atmospheric effects (Damm et al 2014) 1214
Instrumental effects in combination with retrieval methods were found to cause 1215
systematic differences in SIF760 retrievals (Damm et al 2011) the comparatively low 1216
49
resolution of APEX around the O2-A band used to retrieve SIF760 (ie ~54 nm) resulted in an 1217
overestimation of APEX SIF760 compared to retrievals from high resolution instruments 1218
Indeed maximum APEX SIF760 values are 6 mW m-2 sr-1 nm-1 while typical SIF760 values 1219
obtained from high resolution instruments range between 0 and 3 mW m-2 sr-1 nm-1 (Guanter 1220
et al 2013) Considering SIF760 values retrieved from ASD data in original resolution (3 nm) 1221
APEX showed an overestimation of 1102 which confirmed that low spectral resolution 1222
resulted in an overestimation of SIF760 The reasoning for this absolute error is given by the 1223
sub-optimal spectral resolution of APEX with 54 nm at 760 nm causing a reduced sensitivity 1224
for SIF760 on the one hand and a wider distance of the O2-A shoulder values used to 1225
parameterize the 3FLD approach on the other hand The bias was corrected using the ASD 1226
reference data and does not impact the results of our analysis Further the relative variation of 1227
SIF760 is unaffected by the bias 1228
Surface heterogeneity complicates the retrieval of SIF760 According to Damm et al 1229
(2015) SIF760 retrievals for forest sites are especially subject to uncertainties due to 1230
assumptions on surface irradiance Crown shapes and associated surface orientations 1231
determine the intensity and quality of irradiance including fractional amounts of diffuse and 1232
direct irradiance To account for pixel wise changes in surface irradiance high resolution 1233
digital object models (DOM) (eg derived from LiDAR observations) are required In 1234
absence of such a high resolution DOMrsquos crowns are assumed to be flat which results in 1235
uncertainties of up to 58 in case of cast shadows (Damm et al 2015) Since we used 1236
averaged observations over larger areas representing flux tower footprints and most of our 1237
data were flown under comparable illumination conditions (ie around solar noon) we 1238
expect these potential biases to be less influential in this analysis 1239
1
Tables 1
Table 1 Date and time of APEX flights and corresponding eddy covariance flux tower 2
measurements for the three investigated ecosystems (ie grassland cropland mixed 3
temperate forest) 4
Date Time [UTC] Location Ecosystem Flux tower
17062009 950 Laegeren forest 1 tower
17062009 1030 Oensingen cropland 1 tower
17062009 1030 Oensingen grassland 2 tower
25062010 1030 Oensingen cropland 1 tower
25062010 1030 Oensingen grassland 2 tower
26062010 1500 Laegeren forest 1 tower
26062010 1030 Oensingen cropland 1 tower
26062010 1030 Oensingen grassland 2 tower
29062010 1030 Laegeren forest 1 tower
26062011 1030 Laegeren forest 1 tower
28062011 1030 Oensingen cropland 1 tower
28062011 1030 Oensingen grassland 1 tower
16062012 1025 Laegeren forest 1 tower
16062012 900 Oensingen cropland 1 tower
16062012 1100 Oensingen cropland 1 tower
12072013 730 Laegeren forest 1 tower
03092013 1050 Laegeren forest 1 tower
5
2
Table 2 Availability of reference SIF760 data obtained from field spectroscopy measurements 6
to validate APEX based SIF760 retrievals 7
Date time [UTC] Location Measured crops Nr points
17062009 1030 Oensingen maize rye pea sugar beet wheat white clover 29 points
25062010 1030 Oensingen maize pea sugar beet wheat white clover 15 points
16062012 900 Oensingen carrot maize winter wheat 11 points
16062012 1100 Oensingen carrot maize winter wheat 10 points
8
3
Table 3 Goodness of fit for the hyperbolic model describing the relationship between GPPEC 9
and SIF760 O PRI and MCARI2 for the three ecosystem types perennial grassland cropland 10
and mixed temperate forest Calculated statistics are based on all data acquired from 2009-11
2013 as described in Table 1 12
Optical variable Ecosystem Regression coefficient Relative RMSE []
SIF crops 088 355
grass 059 2708
forest 048 1588
PRI crops 0008 1176
grass 095 860
forest 009 2179
MCARI2 crops 0005 1029
grass 098 550
forest 034 1798
13
1
Figures 1
2
Figure 1 Study sites A Oensingen agricultural site B Laegeren forest site The white 3
rectangles represent in A the boundary of investigated fields that comprise most of the flux-4
tower footprints and in B a coarse outline of the footprint area of the flux-tower The white 5
crosses show the locations of the flux-towers Background RGB images from Google-Earth 6
2
7
Figure 2 APEX reflectance and SIF760 image for the Oensingen site acquired on the 2606 8
2010 1030 UTC A top-of-canopy hemispherical-conical reflectance data as true color 9
composite B SIF760 map The white boxes indicate the approximate position of the flux 10
tower 11
3
12
Figure 3 APEX reflectance and SIF760 image for the Laegeren site acquired on the 2606 13
2010 1510 UTC A top-of-canopy hemispherical-conical reflectance data as true color 14
composite B SIF760 map The black arrows indicate the flight direction of flight line 1 to 3 15
(FL1-FL3) The white line marks a transect along the overlapping region of FL1 and FL2 The 16
white boxes indicate the approximate position of the flux tower 17
4
18
Figure 4 Relationships between GPPEC from the eddy-covariance measurements and SIF760 O 19
instantaneously measured between 2009 and 2013 (see Table 1) with the airborne 20
spectrometer APEX (A) PRI index (B) and MCARI2 index (C) for three vegetation types 21
(black dots perennial grassland dark grey rectangles cropland including winter wheat pea 22
and barley grey triangles mixed temperate forest) The solid curves correspond to a 23
hyperbolic model fitted to the measured data The dashed curves show the extrapolated 24
behavior 25
5
26
Figure 5 Daily light response curves from eddy flux measurements for A cropland B 27
perennial grassland and C mixed temperate forest Data were acquired between 2009 and 28
2013 (see Table 1) Grey curves represent a fitted hyperbolic model to approximate the 29
behavior of measured PAR-GPP values Crosses show GPPEC measurements that were used 30
for the SIF760 O - GPPEC comparison based on the time of APEX flights PAR values are 31
binned in 20 mW m-2
sr-1
nm-1
increments 32
6
33
Figure 6 Leaf level relationships between photosynthetic (LUEp) and fluorescence yield 34
(LUEf) for a typical C3 crop Dependency of LUEp (A) and LUEf (B) on APAR C 35
Relationship between LUEp and LUEf D Relationship between APAR and GPPL GPPL was 36
calculated as APARLUEp E Relationship between APAR and SIF760 SIF760 was calculated 37
as APARLUEf assuming a constant relationship between the SCOPE output SIFtotalL 38
(integral between 640-850nm) and SIF760L F Relationship between SIF760 L and GPPL All 39
data were simulated using SCOPE The grey areas indicate illumination conditions 40
comparable to APEX flights 41
7
42
Figure 7 Canopy level relationships between photosynthetic (LUEp) and fluorescence yield 43
(LUEf) for different canopy representations of a C3 cropland in SCOPE Dependency of 44
LUEp (A) and LUEf (B) on APAR LUEp was calculate as GPPCAPAR and LUEf was 45
directly obtained from SCOPE C Relationship between LUEp and LUEf D Relationship 46
between APAR and GPPC GPPC was directly obtained from SCOPE E Relationship 47
between APAR and SIF760C SIF760C was directly obtained from SCOPE F Relationship 48
between SIF760C and GPPC The black dashed line corresponds to a C3 cropland with LAI = 49
30 fraction of brown pigments (Cs) = 00 and a spherical (sp) leaf inclination distribution 50
function (LIDF) For the grey line Cs was changed to 20 for the black dashed line the LAI 51
was changed to 10 and for the grey dasheddotted line the LIDF was changed to plagiophile 52
(pg) The grey areas indicate illumination conditions comparable to APEX flights 53
8
54
Figure 8 Impact of temporal scaling on the SIF760C-GPPC relationship SIF760C and GPPC 55
data were simulated using SCOPE Model input parameters air temperature (A) PAR (B) and 56
LAI (C) were measured within the NitroEurope project (httpwwwnitroeuropeeu) at the 57
Speulderbos forest site Netherlands D Relationship between SIF760C and GPPC including a 58
fitted hyperbolic model for daily averages (grey dots and grey line) monthly averages (dark 59
grey triangles and line) and quarterly data (black dots and black dashed line) 60
9
61
Figure C1 Comparison of ground and airborne-based SIF760 retrievals from various crops 62
Data were acquired during four campaigns between 2009 and 2012 in the agricultural site 63
Oensingen (see Table 2) Left Fitted linear regression lines for the four considered campaigns 64
are overlaid in black The dashed line corresponds to the 11 line Right SIF retrievals from 65
APEX after applying an empirical correction factor (193) The black line represents the fitted 66
linear model the dashed line corresponds to the 11 line 67
9
Depth (FLD) approach (Plascyk 1975) which serves as a standard for SIF retrievals using 202
medium resolution instruments (Meroni et al 2009) The FLD method uses atmospheric 203
absorption bands characterized by lower incident light compared to wavelength regions 204
outside of these bands This configuration allows evaluating the in-filling of the absorption 205
bands by SIF (Damm et al 2014) In this study we used the broad O2-A oxygen absorption 206
band around 760 nm for the SIF760 retrieval For the ground data surface irradiance was 207
estimated from white reference measurements while perturbing atmospheric absorption and 208
scattering effects were assumed to be negligible on the 1 m pathway between canopy and 209
sensor (cf Damm et al (2014) for details on the set-up for SIF760 retrieval on the ground) 210
For the airborne measurements we compensated atmospheric absorption and scattering using 211
the atmospheric radiative transfer model MODTRAN5 (Berk et al 2005) Details of the 212
SIF760 retrievals using airborne data are provided in Appendix-B 213
214
25 Derivation of additional spectral indices 215
The relationship between two vegetation indices and GPP was investigated in parallel 216
to judge the performance of the new remote observation of SIF compared to commonly used 217
remote sensing approaches The photochemical reflectance index (PRI) (Gamon et al 1992) 218
was found to be sensitive to pigment changes related to the xanthophyll cycle and is 219
frequently used to quantify LUEp and GPP (Cheng et al 2013 Drolet et al 2008 Hilker et al 220
2009) The PRI was calculated as 221
(3) 222
while Rλ accounts for the surface reflectance at the wavelength λ 223
We further tested the soil adjusted Modified Chlorophyll Absorption Ratio Index 2 224
(MCARI2) (Haboudane et al 2004) that was found to be strongly related to green LAI thus 225
potential photosynthesis and is calculated as 226
10
2 $amp($)$+-amp0 (4) 227
228
26 Eddy-covariance measurements 229
Continuous turbulent fluxes of CO2 were measured at the agricultural and forest sites 230
between 2009 and 2013 using the EC technique (Baldocchi 2003) At each site the EC 231
instrumentation consisted of an open-path infrared gas analyzer (IRGA) (model LI-7500 LI-232
COR Inc Lincoln NE USA) and a three-dimensional sonic anemometer-thermometer 233
(models HS R3 and R2 Gill Instruments Lymington UK) EC measurements were made at a 234
frequency of 20 Hz and processed to half-hourly averages using the eth-flux EC software for 235
the forest and cropland (Mauder et al 2008) or a comparable custom-made EC software for 236
the grassland (Ammann et al 2007) Post-processing included corrections for damping losses 237
(Eugster and Senn 1995) air density fluctuations (Webb et al 1980) data screening for 238
optical sensor contamination stationary or low turbulence conditions (Foken and Wichura 239
1996) and statistical outliers Standardized gap filling and partitioning of CO2 fluxes was 240
performed using the methodology from Lasslop et al (2010) for the forest and cropland and 241
using the methodology from Falge et al (2001) for the grassland Measurements of 242
photosynthetic photon flux density (PPFD) quantified in micromol m-2 s-1 were converted to 243
radiance units (mW m-2 sr-1 nm-1) representing the photosynthetic active radiation (PAR) to 244
be consistent with Monteithrsquos LUE concept and the SIF radiance units 245
246
27 Leaf area index measurements 247
The Leaf Area Index (LAI) of the grassland and cropland was measured at the time of 248
APEX flights using an optical non-destructive approach based on LAI-2000 leaf area meter 249
observations (Li-Cor Lincoln USA) The LAI of the forest was estimated using digital 250
11
hemispherical photographs at two subplots following the VALERIE sampling scheme while 251
subsequent analysis were applied to obtain the LAI (Schneider et al 2014) 252
253
28 Statistical analysis of SIF760 - GPP relationship 254
SIF760 values were manually extracted from APEX-SIF760 maps for areas representing 255
the footprint of eddy-flux measurements (Figure 1) For the perennial grassland and cropland 256
we selected all pixels with SIF760 values ge 0 mW m-2 sr-1 nm-1 in respective fields although the 257
EC tower footprint can be slightly smaller than the entire field The increased number of 258
resulting pixels allows reducing data noise and covering small spatial variations within the 259
footprint Using the pixels of the entire field is justified by the large homogeneity of the 260
underlying fields (Figure 1A) For the forest site Laegeren all pixels representing an area that 261
covered 70 of all footprint occurrences were selected irrespective of spatial footprint 262
changes due to changing wind conditions Using the same area for all years reduces variations 263
in SIF due to changes in biomass and canopy structure but also reduces the representativeness 264
of selected pixels for actual spatial EC footprints 265
We used a hyperbolic model to relate GPP to SIF760 and to both vegetation indices 266
Although the hyperbolic model only empirically approximates the data behavior it is 267
supported by theoretical arguments for the SIF760-GPP relationship that are outlined hereafter 268
The photosynthetic efficiency LUEp is often described as a hyperbolic function of APAR 269
following the Michaelis-Menten theory (Michaelis and Menten 1913) 270
∙123467899 (5) 271
where c is a coefficient in radiance units and LUEpmax c represents GPPmax Following Eqs 272
(1) and (5) GPP rises asymptotically with APAR to GPPmax This equation is used in many 273
models for partitioning GPP eg Falge et al (2001) Substituting LUEp from Eq (5) and 274
APAR = SIF760 (LUEf fesc) from Eq (2) into Eq (1) results in 275
12
lt= gtampABCampD (6) 276
where the coefficient b represents cLUEffesc accounting for the difference between LUEp 277
and LUEf GPPmax is a value that is asymptotically reached representing the photosynthetic 278
capacity or GPP of the canopy at light saturation It must be noted that Eq (6) is a 279
simplification of the complex relationships between GPP and SIF760 and thus performs best if 280
c LUEf fesc remains constant or SIF760 corresponds to APAR A constant LUEf is a 281
reasonable first approximation for vegetation that is only moderately stressed meaning that 282
variations in LUEf are substantially smaller than variations in LUEp (van der Tol et al 2014) 283
Moderate stress relates to any kind of environmental conditions (warm temperature strong 284
irradiance reduced water availability) that cause only short term and slight changes in 285
photochemical and non-photochemical protections However c and fesc are known to vary 286
across ecosystems and LUEf changes under environmental stress In order to evaluate their 287
impacts on the SIF-GPP relationships as expressed in Eq (6) we carried out simulations with 288
the Soil-Canopy Observations of Photosynthesis and Energy balance model SCOPE version 289
153 (van der Tol et al 2009b) (see Section 29) The goodness of fit for the hyperbolic model 290
was quantified using non-linear regression analysis and was quantitatively described using the 291
root mean square error normalized by the mean of measured data (rRMSE) and the coefficient 292
of determination R2 defined as the correlation between data and the best fit-curve determined 293
by non-linear regression 294
295
29 SCOPE simulations 296
SCOPE uses semi-empirical models for LUEp (Collatz et al 1991) and LUEf (van der 297
Tol et al 2014) embedded in a radiative transfer scheme for the canopy (van der Tol et al 298
2009b) The radiative transfer model at leaf level (Fluspect) is an extension of PROSPECT 299
(Jacquemoud and Baret 1990) and includes a fluorescence component The radiative transfer 300
13
within the canopy is calculated following Verhoef (1984) in the optical domain (SAIL) 301
following Verhoef et al (2007) in the thermal domain and Miller et al (2005) for the 302
fluorescence emissions (FluorSAIL) SCOPE requires a number of vegetation structural and 303
physiological parameters as well as weather information as input The model simulates GPP 304
and spectrally distributes SIF with a spectral resolution and a spectral sampling interval of 10 305
nm each Simulated PPFD values (micromol m-2 s-1) were also converted to radiance units (PAR) 306
We carried out three simulations using SCOPE In the first simulation we calculated 307
leaf level LUEf and LUEp of a typical C3 cropland as function of varying APAR For the 308
second simulation at canopy level we calculated LUEf and LUEp as function of varying 309
APAR for differently structured canopies We took the standard SCOPE parameters for a 310
typical C3 cropland and varied APAR and the structural parameters LAI leaf inclination 311
angle (LIDF) and the fraction of brown pigments (Cs) Both simulation experiments provide 312
theoretical evidence on the relationships between LUEf and LUEp between SIF760 and GPP 313
and their respective relationships to APAR For the third canopy level simulation SCOPE 314
was initialized using time series of mid-day (solar noon) meteorological data (PAR air 315
temperature) a seasonal cycle of LAI and the modelrsquos default soil and vegetation parameters 316
for a C3 cropland (cf the SCOPE user manual) The purpose of this simulation was to 317
evaluate seasonal SIF760-GPP relationships at various temporal aggregation levels For better 318
readability we use the following notation through the manuscript SIF760 O for APEX-SIF 319
SIF760 L and SIF760 C for SCOPE simulated leaf and canopy SIF GPPEC for flux tower GPP 320
and GPPL GPPC to relate to simulated GPP at leaf and canopy level 321
322
3 Results 323
31 SIF760 maps 324
14
Two examples of SIF760 O maps obtained from APEX are shown in Figures 2 and 3 325
The appearance of SIF760 O emissions in vegetated areas demonstrates that measured SIF760 O 326
signals originated solely from vegetation and were not contaminated by non-fluorescent non-327
vegetation surfaces Retrieved SIF760 O values range between 0 and 3 mW m-2 sr-1 nm-1 and 328
showed a high agreement (r2 = 07 rRMSE = 289) with in-situ measured reference data 329
Details of the SIF760 O validation are discussed in Appendix-C 330
331
lt Figure 2 gt 332
lt Figure 3gt 333
334
32 Relationships of GPPEC with SIF760 O PRI and MCARI2 335
Relating instantaneous measurements of SIF760 O and GPPEC from several years 336
revealed an asymptotic relationship with saturating GPPEC in presence of moderate to high 337
SIF760 O (Figure 4A Table 3) This general behavior was consistent for all investigated 338
vegetation types The fitted hyperbolic model shows a moderate to high goodness of fit for the 339
grassland (R2 = 059 rRMSE = 271) cropland (R2 = 088 rRMSE = 35) and forest (R2 = 340
048 rRMSE = 1588) The saturation of GPPEC appeared earlier for the cropland (SIF760 O 341
~05 mW m-2 sr-1 nm-1) than for the grassland and forest (SIF760 O gt 10 mW m-2 sr-1 nm-1) An 342
independent assessment considering a linear model to describe the relationship between 343
SIF760 O and GPPEC revealed a consistently lower goodness of fit justifying the use of a 344
hyperbolic model (data not shown) 345
Statistical analysis showed that a hyperbolic model represents well the relationship 346
between both vegetation indices (PRI and MCARI2) and GPPEC for the grassland with a 347
notable variation in LAI (range between 05 and 48 m2 m-2) However a hyperbolic model 348
does not allow well representing the relationship between PRI and MCARI2 with GPPEC for 349
the forest and cropland both showing only a small variation in LAI (less than plusmn03 m2 m-2) 350
15
(Figure 4B-C Table 3) The goodness of fit for the hyperbolic model describing the PRI and 351
GPPEC data for grassland (R2 = 095 rRMSE = 86) was even higher compared to SIF760 O 352
but lower for forest (R2 = 009 rRMSE = 2179) and cropland (R2 = 0008 rRMSE = 353
1176) With MCARI2 the goodness of fit for the hyperbolic model for grassland was high 354
(R2 = 098 rRMSE = 55) but low for cropland (R2 = 0005 rRMSE = 1029) and forest 355
(R2 = 034 rRMSE = 1798) Again considering a linear relationship between both 356
vegetation indices and GPPEC revealed no consistent improvement compared to the use of a 357
hyperbolic model (data not shown) 358
359
lt Figure 4 gt 360
lt Table 3 gt 361
362
33 Assessment of factors determining SIF760 GPPEC relationships 363
The asymptotic relationship between SIF760 O and GPPEC (Figure 4A) represented 364
instantaneous measurements of different canopies at different times and days over several 365
years covering a range of different light conditions phenological stages of the forest and 366
various amounts of green biomass for both investigated grasslands (crosses in Figure 5A-C 367
that indicate EC measurements during APEX overpasses) Relationships between SIF760 O and 368
GPPEC are consequently a complex function of light absorption in the canopy (APAR) of the 369
efficiency of light utilization (ie expressed as photosynthetic capacity and quantum 370
efficiency of photosynthesis) and of structural effects including fractions of non-371
photosynthetic vegetation components Both grass canopies were measured before and after 372
mowing resulting in a large range in LAI (05-48 m2 m-2) and GPPEC (4-27 micromol m-2 s-1) for 373
similar PAR values The forest LAI of 50 m2 m-2 was more constant over the years due to the 374
consistent timing of flights however senescence (eg lower canopy chlorophyll content and 375
light absorption) might explain the decrease in GPPEC of 15 micromol m-2 s-1 in September for 376
16
comparable irradiance conditions (Figure 5C) Investigated crops (winter wheat barley and 377
pea) were characterized by small variations in LAI (22-25 m2 m-2) and chlorophyll contents 378
corresponding to small variations in GPPEC (5 micromol m-2 s-1) while observed under comparable 379
irradiance conditions During the time of observation the barley and wheat canopies were in 380
the ripening phase with a pronounced ear layer 381
382
lt Figure 5 gt 383
384
The validity of the asymptotic relationship between SIF760 O and GPPEC was tested 385
using simulations made with the SCOPE model We emphasize that the regression coefficient 386
b in Eq (6) includes terms that vary in the model (b= cmiddotLUEfmiddotfesc) the fluorescence efficiency 387
LUEf varies with irradiance conditions (predominantly APAR) the fraction fesc depends on 388
vegetation structure while c=GPPmaxLUEpmax varies between sites and over time during the 389
season We first analysed how LUEf and LUEp and consequently SIF760 and GPP vary at 390
leaf (ie SIF760 L and GPPL) and canopy levels (ie SIF760 C and GPPC) using the model of 391
van der Tol et al (2014) that is embedded in SCOPE For the leaf level Figure 6A shows a 392
decrease of LUEp with increasing APAR consistent with Eq (5) The relation between APAR 393
and LUEf appears more complex LUEf first increases with increasing APAR under low light 394
conditions reaches a climax at intermediate light and then decreases with increasing APAR 395
under higher APAR values (gt 50 mW m-2 sr-1 nm-1) (Figure 6B) The initial increase in LUEf 396
is caused by the decline in photochemical quenching of the excitons whereas the decrease of 397
LUEf is caused by the growing number of non-photochemical quenching traps that dissipate 398
light energy before it can be emitted as fluorescence light (van der Tol et al 2009a) It is 399
important to note that the range of LUEp is nearly an order of magnitude greater compared to 400
the range of LUEf (Figure 6C) Although LUEf is not constant we can still conclude that the 401
difference in both LUE terms causes an earlier saturation of leaf-level GPPL (Figure 6D) 402
17
compared to leaf-level SIF760 L (Figure 6E) with APAR leading to an asymptotic relationship 403
between SIF760 L and GPPL (Figure 6F) Our canopy level simulations confirm these trends 404
(Figure 7A-D) The in-field measured asymptotic relationships between SIF760 O and GPPEC 405
are consequently caused by the covariance of GPPEC and SIF760 O with APAR the 406
photosynthetic capacity with APAR and the different value ranges of LUEf and LUEp 407
Additionally our canopy level simulations suggest that structure impacts the SIF760 O - GPPEC 408
relationship Figure 7D shows an example that changing LAI leaf inclination angles or the 409
fraction of senescent plant material determine the curvature of the hyperbolic SIF760 C - GPPC 410
relationships 411
412
lt Figure 6 gt 413
lt Figure 7 gt 414
415
The modelled SIF760 LC - GPPLC curves (Figures 6D and 7D) also indicate that under 416
reduced light intensity GPP and SIF760 are almost linearly related while GPP tends to saturate 417
under higher light intensities Changes in APAR at canopy level are caused by either sun 418
elevation or in the case of a constant solar angle by canopy structure (ie shading fractional 419
vegetation cover) In complex structured canopies with many foliage layers the saturation of 420
GPP with APAR may not be observable because variations of APAR are less related to PAR 421
falling on the leaves but rather to the variation of leaf area exposed to light Model 422
simulations suggest that in complex canopies SIF760 saturates with APAR before GPP due to 423
fesc being lower with high APAR (data not shown) This structural effect reduces the curvature 424
of the hyperbolic leaf level GPPL- SIF760 L relationship at canopy level (compare Figures 6F 425
and 7F) Furthermore the effect of structure and APAR covary in time since canopy structure 426
(ie LAI) varies in concert with APAR during a seasonal cycle especially for crops We 427
18
expect that this covariance makes the relationship between GPP and SIF760 more linear at the 428
canopy level especially if observations are aggregated over time 429
To evaluate the structure related alleviation of the hyperbolic relationship between 430
SIF760 and GPP at canopy level in response to temporal aggregation we modelled an annual 431
course of GPPC and SIF760 C considering varying environmental conditions (Figure 8A-B) 432
ie PAR ranging from 0-500 mW m-2 sr-1 nm-1 air temperature ranging from 0-32degC using 433
data collected during 2009 at a Nitro-Europe flux tower site (Speulderbos The Netherlands) 434
and canopy properties ie LAI ranging from 15-30 m2 m-2 (Figure 8C) The LAI data are 435
synthetic but have a realistic seasonal cycle For daily noon values of modelled SIF760 C and 436
GPPC an asymptotic behaviour can be observed while GPPC tends to saturate compared to 437
SIF760 C The SIF760C-GPPC relationship tends to become linear when monthly or quarterly 438
averages are considered (Figure 8D) 439
440
lt Figure 8 gt 441
442
This visual trend can be confirmed by statistical measures for daily aggregated values 443
the hyperbolic model (rRMSE = 174 R2 = 070) performed slightly better than the linear 444
model (rRMSE = 185 r2 = 068) In case of monthly aggregated data both the hyperbolic 445
and linear models performed similarly while the linear model gave better results (RMSE = 446
90 r2 = 090) than the hyperbolic model (rRMSE = 94 R2 = 088) for quarterly aggregated 447
data 448
449
4 Discussion 450
Significant relationships between remotely measured SIF and ecosystem GPP have 451
been reported in the past (Frankenberg et al 2011 Guanter et al 2014) however sufficient 452
19
process understanding for using SIF as proxy for GPP across ecosystems is still limited 453
(Porcar-Castell et al 2014) Below we discuss how our observational and modeling 454
approaches help bridging the gap between mechanistic understanding at the leaf level and 455
ecosystem-specific observations and thus provide insights on mechanisms determining the 456
complex relationship between SIF and GPP 457
458
41 Insights from the observational approach 459
Our results showed ecosystem-specific asymptotic relationships between SIF760 O and 460
GPPEC for the three investigated ecosystems mixed temperate forest cropland and perennial 461
grassland The varying SIF-GPP relationships across ecosystems were consistent with results 462
recently reported from combined satellite observations and model predictions (Guanter et al 463
2012) Our results showed that the relationships of both tested vegetation indices PRI and 464
MCARI2 to GPPEC experienced a higher variability across ecosystems compared to SIF760 O 465
SIF760 O showed an ecosystem-specific and overall moderate to good relationship (R2 between 466
048 and 088) to GPPEC for the three ecosystems Both vegetation indices showed only strong 467
relationships for the grassland (R2 = 095 and 098) that notably changed in LAI during the 468
various observations It is important to note that we do not further elaborate on the underlying 469
mechanisms relating vegetation indices and GPPEC and that it is unclear if hyperbolic models 470
best describe their relationships to GPPEC based on mechanistic principles The intention of 471
evaluating the relationships between GPPEC and both vegetation indices was to provide a base 472
to judge the performance of SIF760 O in relation to these commonly used remote observations 473
The diversity of sampled conditions and used data sources provide further evidence on 474
the robustness of observed SIF760 O-GPPEC relationships Our measurements represent various 475
canopies characterized by different biomasses sampled over several years Although most 476
observations were acquired under similar light condition and physiological states a few 477
measurements represented lower light conditions and other physiological states This suggests 478
20
that observed relationships are rather robust across different representations of APAR LUEp 479
and LUEf Furthermore we use data from different sources ie four EC flux towers the 480
APEX imaging spectrometer and modeling at leaf and canopy levels to reduce the 481
uncertainties associated with each method of measurements and to get a better understanding 482
of the SIF760 O-GPPEC relationship at ecosystem level 483
Flux tower measurements are representative of a certain source area (footprint) from 484
the ecosystem which changes constantly based on wind direction and turbulent state of the 485
atmosphere Depending on the heterogeneity of the ecosystem GPPEC signals can vary in 486
response to changing footprints (Barcza et al 2009 Kljun et al 2004) although this variation 487
should be rather small if the vegetation is homogeneous Remote measurements of SIF760 are 488
likely representative of the upper layer of the ecosystem thus vertical canopy heterogeneity 489
potentially leads to a mismatch when compared to GPPEC which integrates over the different 490
layers of the ecosystems This is expected to be especially the case in structurally complex 491
ecosystems such as forests Although the upper layer in forest ecosystems substantially 492
contributes to the total rate of GPPEC there are still many layers of leaves or needles within 493
the canopy photosynthesizing at different rates depending on their sunshade exposure In 494
addition understory vegetation in forest ecosystems can significantly contribute to GPPEC at 495
different rates depending on the ecosystem and time of year Even homogeneous vegetation 496
canopies like crops or grasslands can show vertical heterogeneity This is especially the case 497
at peak biomass during ripening or senescence During such phenological stages the top layer 498
of cereal crops consists of less fluorescing components (ie ears) and cereal crops or 499
grasslands can contain a higher fraction of brown pigments resulting in low SIF760 O values 500
while the entire canopy can still produce high photosynthetic rates and thus GPPEC (Damm et 501
al 2010) Indeed most of the crops investigated in our study were in the ripening phase with a 502
pronounced ear layer 503
21
This resulted in relatively low SIF760 O values and in high GPPEC and thus in a more 504
pronounced asymptotic relationship (cf Figure 4A Figure 7F) compared to results reported 505
for other crops (Guanter et al 2013 Guanter et al 2014) Further research is needed to better 506
understand the impact of vertical heterogeneity on GPPEC and SIF760 observations and their 507
respective relationships 508
Despite the technical aspects causing variations in retrieved SIF760 O (refer to 509
Appendix-D for a detailed discussion) canopy structure causes inherent variations in 510
measured SIF760 values and thus impacts SIF760-GPP relationships The combination of 511
complex canopy architecture and the distribution of absorbing and scattering elements 512
determine vegetation canopies to act as photon traps (Knyazikhin et al 2013 Lewis and 513
Disney 2007) Parts of emitted SIF760 photons from inner-canopy leaves are re-absorbed 514
while others escape the canopy in direction of the sensor The probability of photons escaping 515
the canopy is a function of canopy structure which implies sensitivity to measured SIF760 516
intensities for canopy structure In Eq (2) this sensitivity was approximated with the term 517
fesc In our analysis we minimized the impact of fesc by observing always the same forest area 518
representative for the EC tower footprint In less complex structured crop and grass canopies 519
we expect fesc to be less important However future research is required to quantify the impact 520
of fesc and to propose strategies to compensate its influence on SIF760 retrievals 521
522
42 Insights from the modeling approach 523
From a theoretical point of view radiative energy loss competes with photochemistry 524
and non-radiative energy dissipation for absorbed photons Considering that GPP and SIF760 525
can be conceptualized according to Eqs (1) and (2) SIF760 must show under certain 526
environmental conditions a sensitivity to photochemistry (Porcar-Castell et al 2014 van der 527
Tol et al 2009a van der Tol et al 2009b) This relationship is confirmed by our observational 528
data and other studies at leaf (Amoros-Lopez et al 2008) and canopy levels (Damm et al 529
22
2010) Our modeling results however indicated that the relationship between LUEf and LUEp 530
is subject to change hence impacting the sensitivity of SIF760 to track changes in GPP 531
(Figures 6C and 7C) 532
The asymptotic relationship between SIF760 and GPP theoretically predicted and 533
observed at leaf and canopy levels can be related in particular to the different value ranges of 534
both efficiency terms (LUEp and LUEf) (Figures 6C and 7C) while a complex set of 535
mechanisms causes an ecosystem dependency for SIF760-GPP relationships The 536
photosynthetic capacity of the entire ecosystem in combination with its vertical heterogeneity 537
determines differences in GPP and SIF760 and thus the slope and curvature of their respective 538
relationships Furthermore the initial slope of the asymptotic SIF760 - GPP relationship which 539
has a value of LUEpmax(LUEfmiddotfesc) is determined by a combination of the photosynthetic 540
efficiency and canopy structure Canopy structure and related shadowing effects alter the 541
average light interception and quality at leaf level (Nobel et al 1993 Stewart et al 2003) and 542
consequently the overall productivity of the canopy In the case of reduced APAR caused by 543
canopy shadowing the overall apparent stress level in the canopy and consequently the rate 544
of certain photoprotective mechanisms such as non-radiative energy dissipation is reduced 545
(Cheng et al 2015 Demmig-Adams 1998 Niinemets et al 2003) and observed GPP and 546
SIF760 fall in a range where they are more linearly related (cf Figure 6F and 7F) In addition 547
canopy level simulations show that the fraction of senescent plant material impacts the 548
curvature of the hyperbolic relationship 549
Recent literature reports linear relationships between satellite-based SIF and modeled 550
GPP (Frankenberg et al 2011 Guanter et al 2012 Guanter et al 2014) while we found 551
asymptotic relationships Both results are not contradicting if one considers the temporal 552
aggregation applied to the data Our results are based on instantaneous measurements while 553
monthly averages were calculated for the satellite data to minimize noise effects (Frankenberg 554
et al 2011 Guanter et al 2014) It is known from previous research that temporal averaging 555
23
tends to linearize the response between GPP and APAR (Ruimy et al 1995) as saturating 556
light conditions tend to be only a small fraction of averaged diurnalmonthly data 557
Aggregating GPPEC and APAR over different time scales also showed this effect (data not 558
shown) Because of the rather linear relationship between SIF760 and APAR we expect that 559
temporal aggregation tends to linearize the SIF760-GPP relationship as well A recent study 560
presenting continuous measurements of GPP and SIF760 over a temperate deciduous forest 561
support this hypothesis (Yang et al 2015) The increasing number of experiments using 562
autonomous spectrometer systems in combination with flux towers (Balzarolo et al 2011) 563
will likely provide more experimental results that supports this finding Our simulations 564
provide further evidence that the covariance of structure and APAR during a seasonal cycle 565
additionally tends to linearize the relationship between GPP and SIF760 if observations are 566
aggregated over time 567
The dependency of SIF760-GPP relationships on temporal aggregation requires special 568
attention since it has implications on the usage of SIF to constrain GPP In principle 569
conclusions and results obtained from temporally aggregated and instantaneous measurements 570
are valid if consistently related to the underlying temporal aggregation level Generalizing 571
conclusions obtained at various aggregation levels bears the risk for mis-interpretations eg 572
when vegetation models are refined or empirically re-calibrated using observations or for 573
projections of GPP using observational SIF data 574
575
43 Requirements for the use of SIF to assess GPP across ecosystems 576
The changing relationship between SIF760 and GPPEC with vegetation type challenges 577
the usage of SIF760 as a robust constraint to estimate GPP Specific strategies are required to 578
account for ecosystem (or species) specific sensitivities of SIF in general and SIF760 in 579
particular This includes i) integration platforms to combine observations and process 580
24
understanding and ii) accurate observations of additional vegetation and environmental 581
variables 582
Process-based models as data integration platform in combination with comprehensive 583
observations to sufficiently measure important environmental factors and vegetation 584
properties are considered as flexible and powerful framework Parazoo et al (2014) for 585
example proposed the combination of ensemble dynamic global vegetation models (DGVMs) 586
in combination with SIF as observational constraint Lee et al (2015) suggest incorporating 587
SIF in a climate model to utilize SIF as observational constraint of photosynthesis simulations 588
and subsequent calculations of carbon water and energy cycle information Yet other studies 589
propose using SIF to obtain physiological vegetation parameters ie Vcmax for improved 590
parameterizations of photosynthesis models to eventually model GPP (Zhang et al 2014) The 591
European space agencys (ESA) Earth Explorer 8 opportunity mission Fluorescence Explorer 592
(FLEX) suggests a combination of comprehensive observations (ie SIF over the full 593
emission spectrum vegetation ecosystems and actual environmental conditions) and process-594
based models (Guanter et al 2012) 595
Additional information is required to use SIF in process-based models as one has to 596
account for varying photosynthetic efficiencies of plants and prevailing stress responses 597
According to the conceptualization of GPP and SIF as given in Eqs (1) and (2) extracting 598
and evaluating the exact relationship between LUEp and LUEf is essential but requires 599
normalizing APAR and calculating both yields (Damm et al 2010 Govindjee 2004 Louis et 600
al 2005) Retrievals of APAR can be considered challenging (Garbulsky et al 2010 Gitelson 601
and Gamon 2015 Hanan et al 2002) as available approaches often utilize a-priori knowledge 602
of prevailing land cover or plant distribution functions and rely on the inversion of physical-603
based models or simple band ratios (Hilker et al 2008) Research is required to provide high 604
quality information on APAR not perturbed by light absorption of non-photosynthetic active 605
25
canopy elements (stems branches twigs) cf Zhang et al (2013 2012) that demonstrate 606
attempts to improve estimates of APAR 607
Observed SIF760 O - GPPEC relationships are additionally confounded by non-radiative 608
energy dissipation The PRI was designed to monitor pigment changes related to the 609
xanthophyll cycle (Gamon et al 1992) and provides access to this superimposing process 610
However reported sensitivities of PRI for other effects ie structure (Barton and North 611
2001) pigment pool sizes (Gamon and Berry 2012) illumination effects (Damm et al 2015) 612
and the results obtained in this study question the applicability of the PRI at canopy level 613
Alternative approaches such as the development of a canopy PRI as suggested by several 614
groups (Hernandez-Clemente et al 2011 Kovac et al 2013 Wu et al 2010) or the usage of 615
pigment compositions and other functional plant traits might represent interesting strategies 616
and should be elaborated in future research 617
Structural sensitivities of canopy leaving SIF signals are critical and require further 618
research The application of spectrally invariant correction factors eg the directional area 619
scattering factor (Knyazikhin et al 2013) or more advanced physically-based retrieval 620
schemes using combined atmosphere-canopy models (Damm et al 2015 Laurent et al 2013) 621
might provide potential strategies to compensate for canopy structural effects on retrieved 622
SIF760 623
Another important source of information that allows improving the usage of SIF as 624
constraint of GPP is to consider SIF emissions over the entire emission spectrum between 625
approximately 600 and 800 nm Recent research successfully demonstrated the 626
complementary information content of red-fluorescence retrieved in the O2-B band at 688 nm 627
(SIF688) compared to SIF760 because of the different contributions from photosystem I and II 628
(Rossini et al 2015) Yet other studies highlighted the potential to improve predictions of 629
LUEp and GPP using both SIF688 and SIF760 (Cheng et al 2013) 630
631
26
5 Conclusions 632
Remote sensing of SIF provides a new observational approach to assess terrestrial 633
GPP Compared to traditional greenness-based remote sensing parameters we found SIF760 to 634
be more consistently related to GPPEC These results in combination with the more direct 635
mechanistic link between SIF760 and photosynthesis suggest that using SIF760 provides a 636
strategy to decrease uncertainty in estimating GPP across ecosystems 637
Our observational and modeling approaches revealed asymptotic and ecosystem-638
specific relationships for SIF760 and GPPEC We identified a set of interlinked mechanisms 639
determining SIF760-GPPEC relationships to be ecosystem specific ie the photosynthetic 640
capacity and efficiency of ecosystems the confounding impact of non-radiative energy 641
dissipation (NPQ) as well as ecosystem structure and the fraction of non-photosynthetic 642
vegetation components We demonstrated that SIF760-GPPEC relationships scale with temporal 643
aggregation due to a covariance of canopy structure and APAR over the seasonal cycle 644
We suggest going beyond empirical and ecosystem-specific relationships instead 645
using instantaneous observations comprehensively providing information on the full SIF 646
emission vegetation status and functioning as well as environmental conditions in 647
combination with process-based models Such approaches eg suggested for ESArsquos potential 648
ldquoFluorescence Explorerrdquo (FLEX) Earth Explorer mission provide a flexible framework to 649
account for the various influencing factors identified and to successfully apply SIF as 650
constraint of unbiased global GPP estimates 651
Furthermore research is required to improve the comparison between observations of 652
GPPEC and SIF Both observations stem from conceptually contrasting technologies ie 653
measurements of gas exchange vs plant-light interactions and provide independent and 654
complementary access to study ecosystem photosynthesis Despite the need to harmonize 655
horizontally differing footprints the vertical heterogeneity of ecosystems including the 656
27
varying contributions from different ecosystem layers must be better understood to harmonize 657
and successfully integrate both measurements 658
659
Acknowledgements 660
This work was supported by a grant of the Swiss University Conference and ETH-661
Board in frame of the Swiss Earth Observatory Network (SEON) project and by a grant of the 662
European Space Agency (ESA) in frame of the FLEX-PARCS E Paul-Limoges was 663
supported in part by the Natural Sciences and Engineering Research Council of Canada 664
through a postgraduate scholarship We would like to thank the APEX team for acquiring the 665
APEX data Authors sequence is listed following the FLAE approach (doi 666
101371journalpbio0050018) 667
28
References 668
Ammann C Flechard CR Leifeld J Neftel A amp Fuhrer J (2007) The carbon budget of 669
newly established temperate grassland depends on management intensity Agriculture 670
Ecosystems amp Environment 121 5-20 671
Amoros-Lopez J Gomez-Chova L Vila-Frances J Alonso L Calpe J Moreno J amp 672
del Valle-Tascon S (2008) Evaluation of remote sensing of vegetation fluorescence by 673
the analysis of diurnal cycles International Journal of Remote Sensing 29 5423-5436 674
Baker NR (2008) Chlorophyll Fluorescence A probe of photosynthesis in vivo Annual 675
Review of Plant Physiology and Plant Molecular Biology 59 89-113 676
Baldocchi D Falge E Gu LH Olson R Hollinger D Running S Anthoni P 677
Bernhofer C Davis K Evans R Fuentes J Goldstein A Katul G Law B Lee 678
XH Malhi Y Meyers T Munger W Oechel W U KTP Pilegaard K Schmid 679
HP Valentini R Verma S Vesala T Wilson K amp Wofsy S (2001) FLUXNET A 680
new tool to study the temporal and spatial variability of ecosystem-scale carbon dioxide 681
water vapor and energy flux densities Bulletin of the American Meteorological Society 682
82 2415-2434 683
Baldocchi DD (2003) Assessing the eddy covariance technique for evaluating carbon 684
dioxide exchange rates of ecosystems past present and future Global Change Biology 9 685
479-492 686
Balzarolo M Anderson K Nichol C Rossini M Vescovo L Arriga N Wohlfahrt G 687
Calvet J-C Carrara A Cerasoli S Cogliati S Daumard F Eklundh L Elbers JA 688
Evrendilek F Handcock RN Kaduk J Klumpp K Longdoz B Matteucci G 689
Meroni M Montagnani L Ourcival J-M Sanchez-Canete EP Pontailler J-Y 690
Juszczak R Scholes B amp Pilar Martin M (2011) Ground-Based Optical Measurements 691
at European Flux Sites A Review of Methods Instruments and Current Controversies 692
Sensors 11 7954-7981 693
Barcza Z Kern A Haszpra L amp Kljun N (2009) Spatial representativeness of tall tower 694
eddy covariance measurements using remote sensing and footprint analysis Agricultural 695
and Forest Meteorology 149 795-807 696
Barton CVM amp North PRJ (2001) Remote sensing of canopy light use efficiency using 697
the photochemical reflectance index - Model and sensitivity analysis Remote Sensing of 698
Environment 78 264-273 699
Beer C Reichstein M Tomelleri E Ciais P Jung M Carvalhais N Roedenbeck C 700
Arain MA Baldocchi D Bonan GB Bondeau A Cescatti A Lasslop G Lindroth 701
29
A Lomas M Luyssaert S Margolis H Oleson KW Roupsard O Veenendaal E 702
Viovy N Williams C Woodward FI amp Papale D (2010) Terrestrial Gross Carbon 703
Dioxide Uptake Global Distribution and Covariation with Climate Science 329 834-838 704
Berk A Anderson GP Acharya PK Bernstein LS Muratov L Lee J Fox M 705
Adler-Golden SM Chetwynd JH Hoke ML Lockwood RB Gardner JA Cooley 706
TW Borel CC amp Lewis PE (2005) MODTRAN5 A reformulated atmospheric band 707
model with auxiliary species and practical multiple scattering options Proceedings of the 708
Society of Photo-Optical Instrumentation Engineer 5655 662-667 709
Cheng SJ Bohrer G Steiner AL Hollinger DY Suyker A Phillips RP amp 710
Nadelhoffer KJ (2015) Variations in the influence of diffuse light on gross primary 711
productivity in temperate ecosystems Agricultural and Forest Meteorology 201 98-110 712
Cheng Y-B Middleton EM Zhang Q Huemmrich KF Campbell PKE Corp LA 713
Cook BD Kustas WP amp Daughtry CS (2013) Integrating Solar Induced 714
Fluorescence and the Photochemical Reflectance Index for Estimating Gross Primary 715
Production in a Cornfield Remote Sensing 5 6857-6879 716
Collatz GJ Ball JT Grivet C amp Berry JA (1991) Physiological and environmental-717
regulation of stomatal conductance photosynthesis and transpiration - a model that 718
includes a laminar boundary-layer Agricultural and Forest Meteorology 54 107-136 719
DOdorico P Alberti E amp Schaepman ME (2010) In-flight spectral performance 720
monitoring of the Airborne Prism Experiment Applied Optics 49 3082-3091 721
DOdorico P Guanter L Schaepman ME amp Schlaumlpfer D (2011) Performance 722
assessment of onboard and scene-based methods for Airborne Prism Experiment spectral 723
characterization Applied Optics 50 4755-4764 724
Damm A Erler A Gioli B Hamdi K Hutjes R Kosvancova M Meroni M 725
Miglietta F Moersch A Moreno J Schickling A Sonnenschein R Udelhoven T 726
Van der Linden S Hostert P amp Rascher U (2010) Remote sensing of sun induced 727
fluorescence yield to improve modelling of diurnal courses of Gross Primary Production 728
(GPP) Global Change Biology 16 171-186 729
Damm A Erler A Hillen W Meroni M Schaepman ME Verhoef W amp Rascher U 730
(2011) Modeling the impact of spectral sensor configurations on the FLD retrieval 731
accuracy of sun-induced chlorophyll fluorescence Remote Sensing of Environment 115 732
1882-1892 733
Damm A Guanter L Laurent VCE Schaepman ME Schickling A amp Rascher U 734
(2014) FLD-based retrieval of sun-induced chlorophyll fluorescence from medium 735
30
spectral resolution airborne spectroscopy data Remote Sensing of Environment 147 256-736
266 737
Damm A Guanter L Verhoef W Schlaumlpfer D Garbari S amp Schaepman ME (2015) 738
Impact of varying irradiance on vegetation indices and chlorophyll fluorescence derived 739
from spectroscopy data Remote Sensing of Environment 156 202-215 740
Demmig-Adams B (1998) Survey of thermal energy dissipation and pigment composition in 741
sun and shade leaves Plant and Cell Physiology 39 474-482 742
Drolet GG Middleton EM Huemmrich KF Hall FG Amiro BD Barr AG Black 743
TA McCaughey JH amp Margolis HA (2008) Regional mapping of gross light-use 744
efficiency using MODIS spectral indices Remote Sensing of Environment 112 3064-3078 745
Eugster W amp Senn W (1995) A cospectral correction model for measurement of turbulent 746
NO2 fluxes Boundary-Layer Meteorology 74 321-340 747
Eugster W Zeyer K Zeeman M Michna P Zingg A Buchmann N amp Emmenegger 748
L (2007) Methodical study of nitrous oxide eddy covariance measurements using 749
quantum cascade laser spectrometery over a Swiss forest Biogeosciences 4 927-939 750
Falge E Baldocchi D Olson R Anthoni P Aubinet M Bernhofer C Burba G 751
Ceulemans R Clement R Dolman H Granier A Gross P Grunwald T Hollinger 752
D Jensen NO Katul G Keronen P Kowalski A Lai CT Law BE Meyers T 753
Moncrieff H Moors E Munger JW Pilegaard K Rannik U Rebmann C Suyker 754
A Tenhunen J Tu K Verma S Vesala T Wilson K amp Wofsy S (2001) Gap 755
filling strategies for defensible annual sums of net ecosystem exchange Agricultural and 756
Forest Meteorology 107 43-69 757
Falloon P amp Betts R (2010) Climate impacts on European agriculture and water 758
management in the context of adaptation and mitigation-The importance of an integrated 759
approach Science of the Total Environment 408 5667-5687 760
Foken T amp Wichura B (1996) Tools for quality assessment of surface-based flux 761
measurements Agricultural and Forest Meteorology 78 83-105 762
Fournier A Daumard F Champagne S Ounis A Goulas Y amp Moya I (2012) Effect 763
of canopy structure on sun-induced chlorophyll fluorescence Isprs Journal of 764
Photogrammetry and Remote Sensing 68 112-120 765
Frankenberg C Fisher JB Worden J Badgley G Saatchi SS Lee JE Toon GC 766
Butz A Jung M Kuze A amp Yokota T (2011) New global observations of the 767
terrestrial carbon cycle from GOSAT Patterns of plant fluorescence with gross primary 768
productivity Geophysical Research Letters 38 769
31
Gamon JA amp Berry JA (2012) Facultative and constitutive pigment effects on the 770
Photochemical Reflectance Index (PRI) in sun and shade conifer needles Israel Journal of 771
Plant Sciences 60 85-95 772
Gamon JA Coburn C Flanagan LB Huemmrich KF Kiddle C Sanchez-Azofeifa 773
GA Thayer DR Vescovo L Gianelle D Sims DA Rahman AF amp Pastorello 774
GZ (2010) SpecNet revisited bridging flux and remote sensing communities Canadian 775
Journal of Remote Sensing 36 S376-S390 776
Gamon JA Penuelas J amp Field CB (1992) A narrow-waveband spectral index that 777
tracks diurnal changes in photosynthetic efficiency Remote Sensing of Environment 41 778
35-44 779
Garbulsky MF Filella I Verger A amp Penuelas J (2014) Photosynthetic light use 780
efficiency from satellite sensors From global to Mediterranean vegetation Environmental 781
and Experimental Botany 103 3-11 782
Garbulsky MF Penuelas J Papale D Ardo J Goulden ML Kiely G Richardson 783
AD Rotenberg E Veenendaal EM amp Filella I (2010) Patterns and controls of the 784
variability of radiation use efficiency and primary productivity across terrestrial 785
ecosystems Global Ecology and Biogeography 19 253-267 786
Gege P Fries J Haschberger P Schoumltz P Schwarzer H Strobl P Suhr B Ulbrich 787
G amp Vreeling WJ (2009) Calibration facility for airborne imaging spectrometers 788
ISPRS Journal of Photogrammetry amp Remote Sensing 64 387ndash397 789
Gitelson AA amp Gamon JA (2015) The need for a common basis for defining light-use 790
efficiency Implications for productivity estimation Remote Sensing of Environment 156 791
196-201 792
Goetz SJ amp Prince SD (1999) Modelling terrestrial carbon exchange and storage 793
Evidence and implications of functional convergence in light-use efficiency Advances in 794
Ecological Research Vol 28 (pp 57-92) 795
Govindjee (2004) Chlorophyll a fluorescence A bit of basics and history In GC 796
Papageorgiou amp Govindjee (Eds) Chlorophyll a Fluorescence A Signature of 797
Photosynthesis Advances in Photosynthesis and Respiration (pp 1-42) Dordrecht 798
Springer 799
Guanter L Alonso L Gomez-Chova L Amoros-Lopez J Vila J amp Moreno J (2007) 800
Estimation of solar-induced vegetation fluorescence from space measurements 801
Geophysical Research Letters 34 doi 1010292007GL029289 802
32
Guanter L Alonso L Gomez-Chova L Meroni M Preusker R Fischer J amp Moreno 803
J (2010) Developments for vegetation fluorescence retrieval from spaceborne high-804
resolution spectrometry in the O2-A and O2-B absorption bands Journal of Geophysical 805
Research-Atmospheres 115 806
Guanter L Frankenberg C Dudhia A Lewis PE Goacutemez-Dans J Kuze A Suto H amp 807
Grainger R (2012) Retrieval and global assessment of terrestrial chlorophyll fluorescence 808
from GOSAT space measurements Remote Sensing of Environment 121 236-251 809
Guanter L Rossini M Colombo R Meroni M Frankenberg C Lee J-E amp Joiner J 810
(2013) Using field spectroscopy to assess the potential of statistical approaches for the 811
retrieval of sun-induced chlorophyll fluorescence from ground and space Remote Sensing 812
of Environment 133 52-61 813
Guanter L Zhang Y Jung M Joiner J Voigt M Berry JA Frankenberg C Huete 814
AR Zarco-Tejada P Lee J-E Moran MS Ponce-Campos G Beer C Camps-815
Valls G Buchmann N Gianelle D Klumpp K Cescatti A Baker JM amp Griffis 816
TJ (2014) Global and time-resolved monitoring of crop photosynthesis with chlorophyll 817
fluorescence Proceedings of the National Academy of Sciences of the United States of 818
America 111 E1327-E1333 819
Haboudane D Miller JR Pattey E Zarco-Tejada PJ amp Strachan IB (2004) 820
Hyperspectral vegetation indices and novel algorithms for predicting green LAI of crop 821
canopies Modeling and validation in the context of precision agriculture Remote Sensing 822
of Environment 90 337-352 823
Hanan NP Burba G Verma SB Berry JA Suyker A amp Walter-Shea EA (2002) 824
Inversion of net ecosystem CO2 flux measurements for estimation of canopy PAR 825
absorption Global Change Biology 8 563-574 826
Hernandez-Clemente R Navarro-Cerrillo RM Suarez L Morales F amp Zarco-Tejada 827
PJ (2011) Assessing structural effects on PRI for stress detection in conifer forests 828
Remote Sensing of Environment 115 2360-2375 829
Hilker T Coops NC Wulder MA Black TA amp Guy RD (2008) The use of remote 830
sensing in light use efficiency based models of gross primary production A review of 831
current status and future requirements Science of the Total Environment 404 411-423 832
Hilker T Gitelson A Coops NC Hall FG amp Black TA (2011) Tracking plant 833
physiological properties from multi-angular tower-based remote sensing Oecologia 165 834
865-876 835
33
Hilker T Lyapustin A Hall FG Wang Y Coops NC Drolet G amp Black TA 836
(2009) An assessment of photosynthetic light use efficiency from space Modeling the 837
atmospheric and directional impacts on PRI reflectance Remote Sensing of Environment 838
113 2463-2475 839
Hueni A Biesemans J Meuleman K DellEndice F Schlaumlpfer D Adriaensen S 840
Kempenaers S Odermatt D Kneubuehler M Nieke J amp Itten K (2009) Structure 841
Components and Interfaces of the Airborne Prism Experiment (APEX) Processing and 842
Archiving Facility IEEE Transactions on Geoscience and Remote Sensing 47 29-43 843
Hueni A Lenhard K Baumgartner A amp Schaepman M (2013) The APEX (Airborne 844
Prism Experiment - Imaging Spectrometer) Calibration Information System IEEE 845
Transactions on Geoscience and Remote Sensing 51 5169-5180 846
Hueni A Schlaepfer D Jehle M amp Schaepman M (2015) Impacts of Dichroic Prism 847
Coatings on Radiometry of the Airborne Imaging Spectrometer APEX Applied Optics 53 848
5344-5352 849
Imhoff ML Bounoua L Ricketts T Loucks C Harriss R amp Lawrence WT (2004) 850
Global patterns in human consumption of net primary production Nature 429 870-873 851
IPCC (2013) Summary for policymakers Climate change 2013 the physical science basis 852
Cambridge University Press Cambridge United Kingdom and New York NY USA 853
Jacquemoud S amp Baret F (1990) PROSPECT A model of leaf optical properties spectra 854
Remote Sensing of Environment 34 75-91 855
Jehle M Hueni A Damm A DOdorico P Kneubuumlhler M Meuleman K Schlapfer 856
D Schaepman ME amp Weyermann J (2010) APEX - current status performance and 857
validation concept IEEE Sensors 2010 Conference 533-537 858
Joiner J Guanter L Lindstrot R Voigt M Vasilkov AP Middleton EM Huemmrich 859
KF Yoshida Y amp Frankenberg C (2013) Global monitoring of terrestrial chlorophyll 860
fluorescence from moderate spectral resolution near-infrared satellite measurements 861
methodology simulations and application to GOME-2 Atmos Meas Tech Discuss 6 862
3883-3930 863
Jung M Reichstein M Margolis HA Cescatti A Richardson AD Arain MA 864
Arneth A Bernhofer C Bonal D Chen J Gianelle D Gobron N Kiely G Kutsch 865
W Lasslop G Law BE Lindroth A Merbold L Montagnani L Moors EJ 866
Papale D Sottocornola M Vaccari F amp Williams C (2011) Global patterns of land-867
atmosphere fluxes of carbon dioxide latent heat and sensible heat derived from eddy 868
34
covariance satellite and meteorological observations Journal of Geophysical Research-869
Biogeosciences 116 870
Kljun N Kastner-Klein P Fedorovich E amp Rotach MW (2004) Evaluation of 871
Lagrangian footprint model using data from wind tunnel convective boundary layer 872
Agricultural and Forest Meteorology 127 189-201 873
Kljun N Rotach MW amp Schmid HP (2002) A three-dimensional backward lagrangian 874
footprint model for a wide range of boundary-layer stratifications Boundary-Layer 875
Meteorology 103 205-226 876
Knyazikhin Y Schull MA Stenberg P Mottus M Rautiainen M Yang Y Marshak 877
A Latorre Carmona P Kaufmann RK Lewis P Disney MI Vanderbilt V Davis 878
AB Baret F Jacquemoud S Lyapustin A amp Myneni RB (2013) Hyperspectral 879
remote sensing of foliar nitrogen content Proceedings of the National Academy of 880
Sciences of the United States of America 110 E185-E192 881
Kovac D Malenovsky Z Urban O Spunda V Kalina J Ac A Kaplan V amp Hanus 882
J (2013) Response of green reflectance continuum removal index to the xanthophyll de-883
epoxidation cycle in Norway spruce needles Journal of Experimental Botany 64 1817-884
1827 885
Krausmann F Erb K-H Gingrich S Haberl H Bondeau A Gaube V Lauk C 886
Plutzar C amp Searchinger TD (2013) Global human appropriation of net primary 887
production doubled in the 20th century Proceedings of the National Academy of Sciences 888
of the United States of America 110 10324-10329 889
Lasslop G Reichstein M Papale D Richardson AD Arneth A Barr A Stoy P amp 890
Wohlfahrt G (2010) Separation of net ecosystem exchange into assimilation and 891
respiration using a light response curve approach critical issues and global evaluation 892
Global Change Biology 16 187-208 893
Laurent VCE Verhoef W Damm A Schaepman ME amp Clevers JGPW (2013) A 894
Bayesian object-based approach for estimating vegetation biophysical variables from at-895
sensor APEX radiance data Remote Sensing of Environment 139 6-17 896
Lee JE Berry JA Van der Tol C Yang X Guanter L Damm A Baker I amp 897
Frankenberg C (2015) Simulations of chlorophyll fluorescence in corporated into the 898
Community Land Model version 4 Global Change Biology in print 899
Lewis P amp Disney M (2007) Spectral invariants and scattering across multiple scales from 900
within-leaf to canopy Remote Sensing of Environment 109 196-206 901
35
Liu LY amp Cheng ZH (2010) Detection of Vegetation Light-Use Efficiency Based on 902
Solar-Induced Chlorophyll Fluorescence Separated From Canopy Radiance Spectrum Ieee 903
Journal of Selected Topics in Applied Earth Observations and Remote Sensing 3 306-312 904
Louis J Ounis A Ducruet JM Evain S Laurila T Thum T Aurela M Wingsle G 905
Alonso L Pedros R amp Moya I (2005) Remote sensing of sunlight-induced chlorophyll 906
fluorescence and reflectance of Scots pine in the boreal forest during spring recovery 907
Remote Sensing of Environment 96 37-48 908
Maier SW Guumlnther KP amp Stellmes M (2003) Sun-Induced Fluorescence A New Tool 909
for Precision Farming In M McDonald J Schepers L Tartly T van Toai amp D Major 910
(Eds) Digital Imaging and Spectral Techniques Applications to Precision Agriculture 911
and Crop Physiology (pp 209-222) ASA Special Publication 912
Mauder M Foken T Clement R Elbers JA Eugster W Gruenwald T Heusinkveld 913
B amp Kolle O (2008) Quality control of CarboEurope flux data - Part 2 Inter-914
comparison of eddy-covariance software Biogeosciences 5 451-462 915
Meroni M Busetto L Guanter L Cogliati S Crosta GF Migliavacca M Panigada 916
C Rossini M amp Colombo R (2010) Characterization of fine resolution field 917
spectrometers using solar Fraunhofer lines and atmospheric absorption features Applied 918
Optics 49 2858-2871 919
Meroni M Picchi V Rossini M Cogliati S Panigada C Nali C Lorenzini G amp 920
Colombo R (2008) Leaf level early assessment of ozone injuries by passive fluorescence 921
and photochemical reflectance index International Journal of Remote Sensing 29 5409-922
5422 923
Meroni M Rossini M Guanter L Alonso L Rascher U Colombo R amp Moreno J 924
(2009) Remote sensing of solar induced chlorophyll fluorescence review of methods and 925
applications Remote Sensing of Environment doi101016jrse200905003 926
Michaelis L amp Menten ML (1913) The kenetics of the inversion effect Biochemische 927
Zeitschrift 49 333-369 928
Middleton E McMurtney JE Campbell PK Corp LA Butcher LM amp Chappelle 929
EW (2002) Optical and fluorescence properties of corn leaves from different nitrogen 930
regimes In M Owe G Durso amp L Toulios (Eds) Conference on Remote Sensing for 931
Agriculture Ecosystems and Hydrology IV (pp 72-83) Agia Pelagia Greece 932
Miller JR Berger M Goulas Y Jacquemoud S Louis J Moise N Mohammed G 933
Moreno J Moya I Pedroacutes R Verhoef W amp Zarco-Tejada PJ (2005) Development 934
36
of a vegetation fluorescence canopy model Final Report May 2005 In European Space 935
Research and Technology Centre (ESTEC) 936
Monteith JL (1972) Solar-radiation and productivity in tropical ecosystems Journal of 937
Applied Ecology 9 747-766 938
Niinemets U Kollist H Garcia-Plazaola JI Hernandez A amp Becerril JM (2003) Do 939
the capacity and kinetics for modification of xanthophyll cycle pool size depend on growth 940
irradiance in temperate trees Plant Cell and Environment 26 1787-1801 941
Nobel PS Forseth IN amp Long SP (1993) Canopy structure and light interception 942
Ozanne CMP Anhuf D Boulter SL Keller M Kitching RL Korner C Meinzer 943
FC Mitchell AW Nakashizuka T Dias PLS Stork NE Wright SJ amp 944
Yoshimura M (2003) Biodiversity meets the atmosphere A global view of forest 945
canopies Science 301 183-186 946
Parazoo NC Bowman K Fisher JB Frankenberg C Jones DBA Cescatti A Peacuterez-947
Priego Oacute Wohlfahrt G amp Montagnani L (2014) Terrestrial gross primary production 948
inferred from satellite fluorescence and vegetation models Global Change Biology na-na 949
Plascyk JA (1975) MK II Fraunhofer Line Dicsriminator (FLD-II) for airborne and orbital 950
remote-sensing of solar-stimulated luminescence Optical Engineering 14 339-346 951
Porcar-Castell A Tyystjaumlrvi E Atherton J Van der Tol C Flexas J EE P Moreno 952
J Frankenberg C amp Berry JA (2014) Linking chlorophyll a fluorescence to 953
photosynthesis for remote sensing applications mechanisms and challenges Journal of 954
Experimental Botany 65 4065-4095 955
Rascher U Agati G Alonso L Cecci G Champagne S Colombo R Damm A 956
Daumard F De Miguel E Fernandez G Franch B Franke J Gerbig C Gioli B 957
Gomez JA Goulas Y Guanter L Gutierrez-De-La-Camara O Hamdi K Hostert 958
P Jimenez M Kosvancova M Lognoli D Meroni M Miglietta F Moersch A 959
Moreno J Moya I Neininger B Okujeni A Ounis A Palombi L Raimondi V 960
Schickling A Sobrino JA Stellmes M Toci G Toscano P Udelhoven T Van der 961
Linden S amp Zaldei A (2009) CEFLES2 The remote sensing component to quantify 962
photosynthetic efficiency from the leaf to the region by measuring sun-induced 963
fluorescence in the oxygen absorption bands Biogeosciences 6 1181-1198 964
Richter R amp Schlaumlpfer D (2002) Geo-atmospheric processing of airborne imaging 965
spectrometry data Part 2 Atmospherictopographic correction International Journal of 966
Remote Sensing 23 2631-2649 967
37
Rossini M Meroni M Migliavacca M Manca G Cogliati S Busetto L Picchi V 968
Cescatti A Seufert G amp Colombo R (2010) High resolution field spectroscopy 969
measurements for estimating gross ecosystem production in a rice field Agricultural and 970
Forest Meteorology 150 1283-1296 971
Rossini M Nedbal L Guanter L Ač A Alonso L Burkart A Cogliati S Colombo 972
R Damm A Drusch M Hanus J Julitta T Kokkalis P Moreno J Panigada C 973
Pinto F Schickling A Schuumlttemeyer D Zemek F amp Rascher U (2015) Red and far-974
red sun-induced chlorophyll fluorescence as a measure of plant photosynthesis 975
Geophysical Research Letters (accepted for publication) 976
Ruimy A Jarvis PG Baldocchi DD amp B S (1995) CO2 Fluxes over Plant Canopies 977
and Solar Radiation A Review Advances in Ecological Research 26 1-68 978
Running SW Nemani RR Heinsch FA Zhao MS Reeves M amp Hashimoto H 979
(2004) A continuous satellite-derived measure of global terrestrial primary production 980
Bioscience 54 547-560 981
Schaepman ME M J Hueni A DrsquoOdorico P Damm A Weyermann J Schneider F 982
Laurent VCE C P Seidel F Lenhard K Gege P Kuechler C Brazile J Kohler 983
P De Vos L Meuleman K Meynart R Schlaepfer D Kneubuumlhler M amp Itten K 984
(2015) Advanced radiometry measurements and Earth science applications with the 985
Airborne Prism Experiment (APEX) Remote Sensing of Environment 158 207-219 986
Schimel D Pavlick R Fisher JB Asner GP Saatchi S Townsend P Miller C 987
Frankenberg C Hibbard K amp Cox P (2014) Observing terrestrial ecosystems and the 988
carbon cycle from space Global Change Biology na-na 989
Schlaumlpfer D amp Richter R (2002) Geo-atmospheric processing of airborne imaging 990
spectrometry data Part 1 Parametric orthorectification International Journal of Remote 991
Sensing 23 2609-2630 992
Schneider FD Leiterer R Morsdorf F Gastellu-Etchegorry J-P Lauret N Pfeifer N 993
amp Schaepman ME (2014) Simulating imaging spectrometer data 3D forest modeling 994
based on LiDAR and in situ data Remote Sensing of Environment 152 235-250 995
Schroter D Cramer W Leemans R Prentice IC Araujo MB Arnell NW Bondeau 996
A Bugmann H Carter TR Gracia CA de la Vega-Leinert AC Erhard M Ewert 997
F Glendining M House JI Kankaanpaa S Klein RJT Lavorel S Lindner M 998
Metzger MJ Meyer J Mitchell TD Reginster I Rounsevell M Sabate S Sitch 999
S Smith B Smith J Smith P Sykes MT Thonicke K Thuiller W Tuck G 1000
38
Zaehle S amp Zierl B (2005) Ecosystem service supply and vulnerability to global change 1001
in Europe Science 310 1333-1337 1002
Sitch S Smith B Prentice IC Arneth A Bondeau A Cramer W Kaplan JO Levis 1003
S Lucht W Sykes MT Thonicke K amp Venevsky S (2003) Evaluation of ecosystem 1004
dynamics plant geography and terrestrial carbon cycling in the LPJ dynamic global 1005
vegetation model Global Change Biology 9 161-185 1006
Stewart DW Costa C Dwyer LM Smith DL Hamilton RI amp Ma BL (2003) 1007
Canopy structure light interception and photosynthesis in maize Agronomy Journal 95 1008
1465-1474 1009
Trnka M Dubrovsky M amp Zalud Z (2004) Climate change impacts and adaptation 1010
strategies in spring barley production in the Czech Republic Climatic Change 64 227-1011
255 1012
Turner DP Ritts WD Cohen WB Maeirsperger TK Gower ST Kirschbaum AA 1013
Running SW Zhao MS Wofsy SC Dunn AL Law BE Campbell JL Oechel 1014
WC Kwon HJ Meyers TP Small EE Kurc SA amp Gamon JA (2005) Site-level 1015
evaluation of satellite-based global terrestrial gross primary production and net primary 1016
production monitoring Global Change Biology 11 666-684 1017
van der Tol C Berry J Campbell PKE amp Rascher U (2014) Models of fluorescence 1018
and photosynthesis for interpreting measurements of solar-induced chlorophyll 1019
fluorescence Journal of Geophysical Research Biogeosciences IN PRESS 1020
van der Tol C Verhoef W amp Rosema A (2009a) A model for chlorophyll fluorescence 1021
and photosynthesis at leaf scale Agricultural and Forest Meteorology 149 96-105 1022
van der Tol C Verhoef W Timmermans A Verhoef A amp Su Z (2009b) An integrated 1023
model of soil-canopy spectral radiances photosynthesis fluorescence temperature and 1024
energy balance Biogeosciences 6 3109-3129 1025
Verhoef W (1984) Light scattering by leaf layers with application to canopy reflectance 1026
modeling The SAIL model Remote Sensing of Environment 16 125-141 1027
Verhoef W amp Bach H (2003a) Remote sensing data assimilation using coupled radiative 1028
transfer models Physics and Chemistry of the Earth 28 3-13 1029
Verhoef W amp Bach H (2003b) Simulation of hyperspectral and directional radiance 1030
images using coupled biophysical and atmospheric radiative transfer models Remote 1031
Sensing of Environment 87 23-41 1032
39
Verhoef W amp Bach H (2007) Coupled soil-leaf-canopy and atmosphere radiative transfer 1033
modeling to simulate hyperspectral multi-angular surface reflectance and TOA radiance 1034
data Remote Sensing of Environment 109 166-182 1035
Verhoef W Jia L Xiao Q amp Su Z (2007) Unified optical-thermal four-stream radiative 1036
transfer theory for homogeneous vegetation canopies Ieee Transactions on Geoscience 1037
and Remote Sensing 45 1808-1822 1038
Webb EK Pearman GI amp Leuning R (1980) Correction of flux measurements for 1039
density effects due to heat and water-vapour transfer Quarterly Journal of the Royal 1040
Meteorological Society 106 85-100 1041
Wu C Niu Z Tang Q amp Huang W (2010) Revised photochemical reflectance index 1042
(PRI) for predicting light use efficiency of wheat in a growth cycle validation and 1043
comparison International Journal of Remote Sensing 31 2911-2924 1044
Yang X Tang J Mustard JF Lee JE Rossini M Joiner J Munger JW Kornfeld 1045
A amp Richardson AD (2015) Solar-induced chlorophyll fluorescence that correlates with 1046
canopy photosynthesis on diurnal and seasonal scales in a temperate deciduous forest 1047
Geophysical Research Letters 1048
Zarco-Tejada PJ Berni JAJ Suarez L Sepulcre-Canto G Morales F amp Miller JR 1049
(2009) Imaging chlorophyll fluorescence with an airborne narrow-band multispectral 1050
camera for vegetation stress detection Remote Sensing of Environment 113 1262-1275 1051
Zarco-Tejada PJ Gonzalez-Dugo V amp Berni JAJ (2012) Fluorescence temperature and 1052
narrow-band indices acquired from a UAV platform for water stress detection using a 1053
micro-hyperspectral imager and a thermal camera Remote Sensing of Environment 117 1054
322-337 1055
Zarco-Tejada PJ Morales A Testi L amp Villalobos FJ (2013) Spatio-temporal patterns 1056
of chlorophyll fluorescence and physiological and structural indices acquired from 1057
hyperspectral imagery as compared with carbon fluxes measured with eddy covariance 1058
Remote Sensing of Environment 133 102-115 1059
Zhang Q Middleton EM Cheng YB amp Landis DR (2013) Variations of foliage 1060
chlorophyll fAPAR and foliage non-chlorophyll fAPAR (fAPARchl fAPARnonchl) at the 1061
Harvard Forest Ieee Journal of Selected Topics in Applied Earth Observations and Remote 1062
Sensing 6 2254-2264 1063
Zhang Q Middleton EM Gao BC amp Cheng YB (2012) Using EO-1 hyperion to 1064
simulate HyspIRI products for a coniferous forest The fraction of par absorbed by 1065
40
chlorophyll (fAPAR chl) and leaf water content (LWC) Ieee Transactions on Geoscience 1066
and Remote Sensing 50 1844-1852 1067
Zhang Y Guanter L Berry JA Joiner J van der Tol C Huete A Gitelson A Voigt 1068
M amp Koumlhler P (2014) Estimation of vegetation photosynthetic capacity from space-1069
based measurements of chlorophyll fluorescence for terrestrial biosphere models Global 1070
Change Biology 20 3727-3742 1071
1072
41
Appendix-A APEX data calibration 1073
The calibration of APEX images is based on the APEX Processing and Archiving Facility 1074
(PAF) which is the combined software and hardware designed to generate calibrated level 1 1075
at-sensor radiances from APEX raw image streams (Hueni et al 2009) Calibration 1076
coefficients for the radiometric geometric and spectral calibrations are generated from system 1077
calibrations at the APEX Calibration Home Base (CHB) at DLR Oberpfaffenhofen (Gege et 1078
al 2009) These CHB data are stored and processed within the APEX Calibration Information 1079
System (CAL IS) producing the so-called calibration cubes holding coefficients for each 1080
spatio-spectral pixel (Hueni et al 2013) 1081
For the multi-temporal dataset employed within this study all flight lines were 1082
reprocessed from the original raw image streams to ensure that the same version of the 1083
processor was applied The APEX PAF and CAL IS have significantly evolved over the 1084
timeframe of the dataset with calibrations getting more accurate over the years To ensure 1085
consistency all data were calibrated using coefficients obtained in May 2013 1086
The processor was specifically configured to retain the highest information content in 1087
the VNIR channel including i) no spectral resampling to compensate for spectral shifts and 1088
misregistrations (DOdorico et al 2010 DOdorico et al 2011) ii) no compensation of 1089
spectral shift related changes in radiometry (Hueni et al 2015) and iii) no spatial 1090
misregistration correction The calibration was thus effectively reduced to a linear dark 1091
current correction over time a de-smearing of the visible-NIR channel to compensate for 1092
sensor smear effects the application of radiometric gains and offsets followed by a destriping 1093
routine working in the spatial dimension only to remove pushbroom related along track 1094
striping Calibrated radiance data were directly used for the fluorescence retrieval (see Section 1095
24) while the feasibility to use APEX for SIF760 retrievals was theoretically demonstrated in 1096
42
a study of Damm et al (2011) Resulting SIF760 maps were afterwards geo-rectified using a 1097
parametric geocoding approach (Schlaumlpfer and Richter 2002) 1098
43
Appendix-B Retrieval of SIF760 from airborne data 1099
The quantification of SIF measured with ground or airborne-based spectrometers 1100
requires separating emitted SIF from the reflected radiance flux The Fraunhofer Line Depth 1101
(FLD) approach introduced by Plascyk (1975) serves as a de facto standard for medium 1102
resolution instruments such as APEX (Meroni et al 2009) and was applied in our study The 1103
FLD method uses atmospheric absorption bands characterized by lower incident light 1104
compared to wavelength regions outside of these bands This configuration increases the 1105
spectral information and allows the separation of SIF from reflected radiation In this study 1106
we used the broad O2-A oxygen absorption band around 760 nm and quantified the infilling of 1107
SIF760 using radiance measurements inside (subscript i) and outside (subscript o) of the O2-A 1108
band 1109
For the airborne case only atmospheric components can be simulated with 1110
MODTRAN-5 assuming perfect knowledge of the acquisition conditions The reflectance 1111
terms for diffuse and direct irradiance as well as the SIF760 contribution are usually unknown 1112
Assuming Lambertian surface reflectance behavior which introduces some inaccuracies but 1113
allows formulating the radiative transfer (RT) for radiance measurements at sensor level (LAtS) 1114
to obtain SIF760 both measurements inside and outside of the absorption band can be 1115
expressed as 1116
E9FA lang3H IJK LMNrangP QlangRSE rang T UlangVWWH VXWH rang∙langVYYH VYXH rangZH
Hlang[XXH rang T ABCHUlangVWWH ranglangVXWH rangZHlang[XXH rang ] ^ _ (B1) 1117
where E0 is the top-of-atmosphere irradiance including diffuse and direct irradiance 1118
components θil is the illumination zenith angle ρso is the path scattered radiance τss is the 1119
direct transmittance for sunlight τoo is the direct transmittance in view direction τsd is the 1120
diffuse transmittance of the atmosphere for sunlight τdo is the hemispherical-directional 1121
transmittance in view direction and ρdd is the spherical albedo If these atmospheric 1122
44
components are obtained from MODTRAN-5 simulations (Damm et al 2015 Verhoef and 1123
Bach 2003a b 2007) the radiative transfer equation (Eq B1) only contains four unknowns 1124
namely Ri Ro SIFi and SIFo The 3FLD method (Maier et al 2003) which is an adaptation of 1125
the original FLD method proposed by (Plascyk 1975) was used to linearly relate R and SIF 1126
inside and outside of the O2-A absorption band SIF can be finally retrieved with 1127
13 -0 abcMUdWecWlangRff_ rangZghcWUdMecMlangRff^ rangZiUdWecWlangRff_ rangZghUdMecMlangRff^ rangZ j
langVWWM ranglangVXWM rang (B2) 1128
kE lE9FA m lang3HW IJK LMNrangP langRSE rangn ] ^ _ (B3) 1129
E lang3HW IJK LMNrangP langoSSE TopSE rang ∙ langoE opE rang qEprs T Eprt] ^ _ (B4) 1130
r S13rlangoSSr rang T langopSr rang v13S$langoSSS rang T langopSS rangw (B5) 1131
where B is the factor relating SIFi and SIFo and was fixed to a value of 08 justified by 1132
simulations and experiments (Rascher et al 2009 Alonso et al 2008) Xj equals the at-1133
sensor radiance (reflected plus emitted radiation) without path radiance contribution and Ej 1134
expresses surface irradiance as measured at the sensor level A is the factor relating Ri and Ro 1135
and was derived from linear interpolation of R of the left (758 nm) and right (771 nm) O2-A 1136
band shoulder with 1137
xx+ (B6) 1138
y ```-0```z and y `-0`z
```z (B7) 1139
1140
Because APEX suffered from slight spectral smile effects (DOdorico et al 2010) 1141
updated center wavelength positions were involved in the convolution approach The spectral 1142
shift quantification for each pixel across track was based on the Cr method as described in 1143
45
Meroni et al (2010) The method assumes a high correlation between a measured and a 1144
convolved spectrum and iteratively minimizes a cost function which is 1 minus the Pearson 1145
correlation coefficient (r) calculated for both signals Remaining artifacts of the spectral shift 1146
correction and slightly inaccurate estimates of atmospheric properties cause SIF760 retrieval 1147
uncertainties We therefore applied a semi-empirical correction as described in Damm et al 1148
(2014) for each scan line across the track This technique employs reference surfaces which 1149
are free of any SIF760 emission (eg bare soil) to adjust the upward transmittance term inside 1150
the absorption feature oSSr The retrieval of SIF760 from top-of-canopy radiance data measured 1151
on ground follows the same approach as described in Eqs B2-B7 under the assumption that 1152
the surface irradiance can be approximated with the measurement of a reference panel and 1153
that ρso τdo and τdo can be set to 0 Furthermore the spectral resolution of APEX can be 1154
considered suboptimal for SIF760 retrievals although Damm et al (2011) demonstrate that 1155
APEX with its spectral resolution of 54 nm at 760 nm is sensitive for SIF760 However 1156
retrieved SIF760 values are too high and in an absolute sense incorrect We used reference 1157
SIF760 data obtained in parallel to the airborne acquisitions using the ASD field spectrometers 1158
(Section 23) to estimate the actual offset The observed scaling factor of 193 was afterwards 1159
applied to the retrieved SIF760 values to transfer them to a realistic value range 1160
46
Appendix-C SIF retrieval accuracy 1161
We applied a quantitative accuracy evaluation of resulting SIF760 maps using ground 1162
measured SIF760 values (Figure C1) Considering all reference data acquired during five 1163
campaigns a good linear relationship was achieved between ground and airborne-based 1164
SIF760 values (r2 = 071) but with a proportionality factor much higher than 1 (Figure C1-A) 1165
This experimentally obtained systematic overestimation of APEX SIF760 is comparable to 1166
simulation results documented in Damm et al (2011) Further we found slightly changing 1167
correlations between the different years (several linear models in Figure C1-A) which are 1168
likely caused by canopy structural effects spectral and radiometric performances of used 1169
ground instruments or slight deviations of the performance of APEX over time 1170
To compensate for the overestimation of APEX SIF760 we applied an empirical correction 1171
factor of 193 derived from the comparison of reference data and APEX which resulted in a 1172
rRMSE of 289 (Figure C1-B) 1173
1174
lt Figure C1 gt 1175
1176
The Laegeren site was covered with three adjacent flight lines having an overlap of 1177
approximately 10 (cf Figure 3) This configuration provides the opportunity to 1178
quantitatively evaluate the consistency of SIF retrievals obtained from different measurements 1179
and view zenith angles (ie plusmn 135deg) The comparison of SIF760 retrievals obtained from flight 1180
lines 1 and 2 reveals a moderate linear relationship for homogeneous agricultural surfaces (r2 1181
= 081 rRMSE = 57) We observed a systematic underestimation of flight line 1 compared 1182
to flight line 2 (factor 06) for a view zenith angle difference of ~26deg for SIF760 indicating 1183
either a directionality of SIF760 emissions or an insufficient decoupling of surface HCRF 1184
affected by reflectance anisotropy With increasing surface heterogeneity scattering increases 1185
47
and the agreement of retrieved SIF from both flight lines slightly decreases (ie for forested 1186
areas r2 of 05 and rRMSE of 88) This lower correlation can be mainly associated to slight 1187
geometric mis-registrations (ie max 2 pixel ~ 40 m) in combination with surface 1188
heterogeneity (eg shaded and sunlit tree crowns) and emission anisotropy of SIF760 Also 1189
negative SIF760 values are present in the SIF760 maps and caused by sensor noise and 1190
especially for forests due to shadowing effects (Damm et al 2015) 1191
48
Appendix-D Technical aspects determining the SIF760 retrieval accuracy 1192
A rigorous evaluation of the SIF760 retrieval accuracy is crucial to judge the reliability 1193
of our assessment on the relationship between SIF760 and GPPEC across ecosystems 1194
Furthermore additional factors imposing variations on SIF760 retrieved from airborne 1195
spectroscopy data that cannot be related to the physiological origin of SIF760 needs to be 1196
critically discussed to justify the proposed approach 1197
Ground-based measurements of SIF760 were made using field spectrometers to validate 1198
the airborne retrievals Field spectroscopy provides a good reference for validating airborne 1199
retrievals as it is likely not affected by biases resulting from atmospheric composition 1200
estimates (eg aerosol load) due to the simultaneous measurement of irradiance fluxes at 1201
canopy level using a reference panel The reliability of the applied field spectroscopic 1202
approach to measure SIF760 was previously demonstrated using field studies (Damm et al 1203
2010 Liu and Cheng 2010 Meroni et al 2009 Rascher et al 2009) and theoretical 1204
assessments (Damm et al 2011) It must be noted that field spectroscopic approaches are 1205
subject to uncertainties particularly for heterogeneous vegetation canopies Damm et al 1206
(2015) discussed retrieval errors caused by illumination effects likely introducing slight 1207
errors in reference SIF760 This source of uncertainty must be considered when judging the 1208
accuracy of APEX SIF760 The nevertheless good agreement between ground and airborne 1209
observations indicated that atmospheric absorption and scattering effects could be sufficiently 1210
compensated and thus demonstrated the reliability of retrieved SIF760 measurements In 1211
particular the empirical correction applied making use of high spatial resolution airborne IS 1212
data in combination with reference surfaces not emitting SIF760 allowed to bypass retrieval 1213
uncertainties caused by atmospheric effects (Damm et al 2014) 1214
Instrumental effects in combination with retrieval methods were found to cause 1215
systematic differences in SIF760 retrievals (Damm et al 2011) the comparatively low 1216
49
resolution of APEX around the O2-A band used to retrieve SIF760 (ie ~54 nm) resulted in an 1217
overestimation of APEX SIF760 compared to retrievals from high resolution instruments 1218
Indeed maximum APEX SIF760 values are 6 mW m-2 sr-1 nm-1 while typical SIF760 values 1219
obtained from high resolution instruments range between 0 and 3 mW m-2 sr-1 nm-1 (Guanter 1220
et al 2013) Considering SIF760 values retrieved from ASD data in original resolution (3 nm) 1221
APEX showed an overestimation of 1102 which confirmed that low spectral resolution 1222
resulted in an overestimation of SIF760 The reasoning for this absolute error is given by the 1223
sub-optimal spectral resolution of APEX with 54 nm at 760 nm causing a reduced sensitivity 1224
for SIF760 on the one hand and a wider distance of the O2-A shoulder values used to 1225
parameterize the 3FLD approach on the other hand The bias was corrected using the ASD 1226
reference data and does not impact the results of our analysis Further the relative variation of 1227
SIF760 is unaffected by the bias 1228
Surface heterogeneity complicates the retrieval of SIF760 According to Damm et al 1229
(2015) SIF760 retrievals for forest sites are especially subject to uncertainties due to 1230
assumptions on surface irradiance Crown shapes and associated surface orientations 1231
determine the intensity and quality of irradiance including fractional amounts of diffuse and 1232
direct irradiance To account for pixel wise changes in surface irradiance high resolution 1233
digital object models (DOM) (eg derived from LiDAR observations) are required In 1234
absence of such a high resolution DOMrsquos crowns are assumed to be flat which results in 1235
uncertainties of up to 58 in case of cast shadows (Damm et al 2015) Since we used 1236
averaged observations over larger areas representing flux tower footprints and most of our 1237
data were flown under comparable illumination conditions (ie around solar noon) we 1238
expect these potential biases to be less influential in this analysis 1239
1
Tables 1
Table 1 Date and time of APEX flights and corresponding eddy covariance flux tower 2
measurements for the three investigated ecosystems (ie grassland cropland mixed 3
temperate forest) 4
Date Time [UTC] Location Ecosystem Flux tower
17062009 950 Laegeren forest 1 tower
17062009 1030 Oensingen cropland 1 tower
17062009 1030 Oensingen grassland 2 tower
25062010 1030 Oensingen cropland 1 tower
25062010 1030 Oensingen grassland 2 tower
26062010 1500 Laegeren forest 1 tower
26062010 1030 Oensingen cropland 1 tower
26062010 1030 Oensingen grassland 2 tower
29062010 1030 Laegeren forest 1 tower
26062011 1030 Laegeren forest 1 tower
28062011 1030 Oensingen cropland 1 tower
28062011 1030 Oensingen grassland 1 tower
16062012 1025 Laegeren forest 1 tower
16062012 900 Oensingen cropland 1 tower
16062012 1100 Oensingen cropland 1 tower
12072013 730 Laegeren forest 1 tower
03092013 1050 Laegeren forest 1 tower
5
2
Table 2 Availability of reference SIF760 data obtained from field spectroscopy measurements 6
to validate APEX based SIF760 retrievals 7
Date time [UTC] Location Measured crops Nr points
17062009 1030 Oensingen maize rye pea sugar beet wheat white clover 29 points
25062010 1030 Oensingen maize pea sugar beet wheat white clover 15 points
16062012 900 Oensingen carrot maize winter wheat 11 points
16062012 1100 Oensingen carrot maize winter wheat 10 points
8
3
Table 3 Goodness of fit for the hyperbolic model describing the relationship between GPPEC 9
and SIF760 O PRI and MCARI2 for the three ecosystem types perennial grassland cropland 10
and mixed temperate forest Calculated statistics are based on all data acquired from 2009-11
2013 as described in Table 1 12
Optical variable Ecosystem Regression coefficient Relative RMSE []
SIF crops 088 355
grass 059 2708
forest 048 1588
PRI crops 0008 1176
grass 095 860
forest 009 2179
MCARI2 crops 0005 1029
grass 098 550
forest 034 1798
13
1
Figures 1
2
Figure 1 Study sites A Oensingen agricultural site B Laegeren forest site The white 3
rectangles represent in A the boundary of investigated fields that comprise most of the flux-4
tower footprints and in B a coarse outline of the footprint area of the flux-tower The white 5
crosses show the locations of the flux-towers Background RGB images from Google-Earth 6
2
7
Figure 2 APEX reflectance and SIF760 image for the Oensingen site acquired on the 2606 8
2010 1030 UTC A top-of-canopy hemispherical-conical reflectance data as true color 9
composite B SIF760 map The white boxes indicate the approximate position of the flux 10
tower 11
3
12
Figure 3 APEX reflectance and SIF760 image for the Laegeren site acquired on the 2606 13
2010 1510 UTC A top-of-canopy hemispherical-conical reflectance data as true color 14
composite B SIF760 map The black arrows indicate the flight direction of flight line 1 to 3 15
(FL1-FL3) The white line marks a transect along the overlapping region of FL1 and FL2 The 16
white boxes indicate the approximate position of the flux tower 17
4
18
Figure 4 Relationships between GPPEC from the eddy-covariance measurements and SIF760 O 19
instantaneously measured between 2009 and 2013 (see Table 1) with the airborne 20
spectrometer APEX (A) PRI index (B) and MCARI2 index (C) for three vegetation types 21
(black dots perennial grassland dark grey rectangles cropland including winter wheat pea 22
and barley grey triangles mixed temperate forest) The solid curves correspond to a 23
hyperbolic model fitted to the measured data The dashed curves show the extrapolated 24
behavior 25
5
26
Figure 5 Daily light response curves from eddy flux measurements for A cropland B 27
perennial grassland and C mixed temperate forest Data were acquired between 2009 and 28
2013 (see Table 1) Grey curves represent a fitted hyperbolic model to approximate the 29
behavior of measured PAR-GPP values Crosses show GPPEC measurements that were used 30
for the SIF760 O - GPPEC comparison based on the time of APEX flights PAR values are 31
binned in 20 mW m-2
sr-1
nm-1
increments 32
6
33
Figure 6 Leaf level relationships between photosynthetic (LUEp) and fluorescence yield 34
(LUEf) for a typical C3 crop Dependency of LUEp (A) and LUEf (B) on APAR C 35
Relationship between LUEp and LUEf D Relationship between APAR and GPPL GPPL was 36
calculated as APARLUEp E Relationship between APAR and SIF760 SIF760 was calculated 37
as APARLUEf assuming a constant relationship between the SCOPE output SIFtotalL 38
(integral between 640-850nm) and SIF760L F Relationship between SIF760 L and GPPL All 39
data were simulated using SCOPE The grey areas indicate illumination conditions 40
comparable to APEX flights 41
7
42
Figure 7 Canopy level relationships between photosynthetic (LUEp) and fluorescence yield 43
(LUEf) for different canopy representations of a C3 cropland in SCOPE Dependency of 44
LUEp (A) and LUEf (B) on APAR LUEp was calculate as GPPCAPAR and LUEf was 45
directly obtained from SCOPE C Relationship between LUEp and LUEf D Relationship 46
between APAR and GPPC GPPC was directly obtained from SCOPE E Relationship 47
between APAR and SIF760C SIF760C was directly obtained from SCOPE F Relationship 48
between SIF760C and GPPC The black dashed line corresponds to a C3 cropland with LAI = 49
30 fraction of brown pigments (Cs) = 00 and a spherical (sp) leaf inclination distribution 50
function (LIDF) For the grey line Cs was changed to 20 for the black dashed line the LAI 51
was changed to 10 and for the grey dasheddotted line the LIDF was changed to plagiophile 52
(pg) The grey areas indicate illumination conditions comparable to APEX flights 53
8
54
Figure 8 Impact of temporal scaling on the SIF760C-GPPC relationship SIF760C and GPPC 55
data were simulated using SCOPE Model input parameters air temperature (A) PAR (B) and 56
LAI (C) were measured within the NitroEurope project (httpwwwnitroeuropeeu) at the 57
Speulderbos forest site Netherlands D Relationship between SIF760C and GPPC including a 58
fitted hyperbolic model for daily averages (grey dots and grey line) monthly averages (dark 59
grey triangles and line) and quarterly data (black dots and black dashed line) 60
9
61
Figure C1 Comparison of ground and airborne-based SIF760 retrievals from various crops 62
Data were acquired during four campaigns between 2009 and 2012 in the agricultural site 63
Oensingen (see Table 2) Left Fitted linear regression lines for the four considered campaigns 64
are overlaid in black The dashed line corresponds to the 11 line Right SIF retrievals from 65
APEX after applying an empirical correction factor (193) The black line represents the fitted 66
linear model the dashed line corresponds to the 11 line 67
12
lt= gtampABCampD (6) 276
where the coefficient b represents cLUEffesc accounting for the difference between LUEp 277
and LUEf GPPmax is a value that is asymptotically reached representing the photosynthetic 278
capacity or GPP of the canopy at light saturation It must be noted that Eq (6) is a 279
simplification of the complex relationships between GPP and SIF760 and thus performs best if 280
c LUEf fesc remains constant or SIF760 corresponds to APAR A constant LUEf is a 281
reasonable first approximation for vegetation that is only moderately stressed meaning that 282
variations in LUEf are substantially smaller than variations in LUEp (van der Tol et al 2014) 283
Moderate stress relates to any kind of environmental conditions (warm temperature strong 284
irradiance reduced water availability) that cause only short term and slight changes in 285
photochemical and non-photochemical protections However c and fesc are known to vary 286
across ecosystems and LUEf changes under environmental stress In order to evaluate their 287
impacts on the SIF-GPP relationships as expressed in Eq (6) we carried out simulations with 288
the Soil-Canopy Observations of Photosynthesis and Energy balance model SCOPE version 289
153 (van der Tol et al 2009b) (see Section 29) The goodness of fit for the hyperbolic model 290
was quantified using non-linear regression analysis and was quantitatively described using the 291
root mean square error normalized by the mean of measured data (rRMSE) and the coefficient 292
of determination R2 defined as the correlation between data and the best fit-curve determined 293
by non-linear regression 294
295
29 SCOPE simulations 296
SCOPE uses semi-empirical models for LUEp (Collatz et al 1991) and LUEf (van der 297
Tol et al 2014) embedded in a radiative transfer scheme for the canopy (van der Tol et al 298
2009b) The radiative transfer model at leaf level (Fluspect) is an extension of PROSPECT 299
(Jacquemoud and Baret 1990) and includes a fluorescence component The radiative transfer 300
13
within the canopy is calculated following Verhoef (1984) in the optical domain (SAIL) 301
following Verhoef et al (2007) in the thermal domain and Miller et al (2005) for the 302
fluorescence emissions (FluorSAIL) SCOPE requires a number of vegetation structural and 303
physiological parameters as well as weather information as input The model simulates GPP 304
and spectrally distributes SIF with a spectral resolution and a spectral sampling interval of 10 305
nm each Simulated PPFD values (micromol m-2 s-1) were also converted to radiance units (PAR) 306
We carried out three simulations using SCOPE In the first simulation we calculated 307
leaf level LUEf and LUEp of a typical C3 cropland as function of varying APAR For the 308
second simulation at canopy level we calculated LUEf and LUEp as function of varying 309
APAR for differently structured canopies We took the standard SCOPE parameters for a 310
typical C3 cropland and varied APAR and the structural parameters LAI leaf inclination 311
angle (LIDF) and the fraction of brown pigments (Cs) Both simulation experiments provide 312
theoretical evidence on the relationships between LUEf and LUEp between SIF760 and GPP 313
and their respective relationships to APAR For the third canopy level simulation SCOPE 314
was initialized using time series of mid-day (solar noon) meteorological data (PAR air 315
temperature) a seasonal cycle of LAI and the modelrsquos default soil and vegetation parameters 316
for a C3 cropland (cf the SCOPE user manual) The purpose of this simulation was to 317
evaluate seasonal SIF760-GPP relationships at various temporal aggregation levels For better 318
readability we use the following notation through the manuscript SIF760 O for APEX-SIF 319
SIF760 L and SIF760 C for SCOPE simulated leaf and canopy SIF GPPEC for flux tower GPP 320
and GPPL GPPC to relate to simulated GPP at leaf and canopy level 321
322
3 Results 323
31 SIF760 maps 324
14
Two examples of SIF760 O maps obtained from APEX are shown in Figures 2 and 3 325
The appearance of SIF760 O emissions in vegetated areas demonstrates that measured SIF760 O 326
signals originated solely from vegetation and were not contaminated by non-fluorescent non-327
vegetation surfaces Retrieved SIF760 O values range between 0 and 3 mW m-2 sr-1 nm-1 and 328
showed a high agreement (r2 = 07 rRMSE = 289) with in-situ measured reference data 329
Details of the SIF760 O validation are discussed in Appendix-C 330
331
lt Figure 2 gt 332
lt Figure 3gt 333
334
32 Relationships of GPPEC with SIF760 O PRI and MCARI2 335
Relating instantaneous measurements of SIF760 O and GPPEC from several years 336
revealed an asymptotic relationship with saturating GPPEC in presence of moderate to high 337
SIF760 O (Figure 4A Table 3) This general behavior was consistent for all investigated 338
vegetation types The fitted hyperbolic model shows a moderate to high goodness of fit for the 339
grassland (R2 = 059 rRMSE = 271) cropland (R2 = 088 rRMSE = 35) and forest (R2 = 340
048 rRMSE = 1588) The saturation of GPPEC appeared earlier for the cropland (SIF760 O 341
~05 mW m-2 sr-1 nm-1) than for the grassland and forest (SIF760 O gt 10 mW m-2 sr-1 nm-1) An 342
independent assessment considering a linear model to describe the relationship between 343
SIF760 O and GPPEC revealed a consistently lower goodness of fit justifying the use of a 344
hyperbolic model (data not shown) 345
Statistical analysis showed that a hyperbolic model represents well the relationship 346
between both vegetation indices (PRI and MCARI2) and GPPEC for the grassland with a 347
notable variation in LAI (range between 05 and 48 m2 m-2) However a hyperbolic model 348
does not allow well representing the relationship between PRI and MCARI2 with GPPEC for 349
the forest and cropland both showing only a small variation in LAI (less than plusmn03 m2 m-2) 350
15
(Figure 4B-C Table 3) The goodness of fit for the hyperbolic model describing the PRI and 351
GPPEC data for grassland (R2 = 095 rRMSE = 86) was even higher compared to SIF760 O 352
but lower for forest (R2 = 009 rRMSE = 2179) and cropland (R2 = 0008 rRMSE = 353
1176) With MCARI2 the goodness of fit for the hyperbolic model for grassland was high 354
(R2 = 098 rRMSE = 55) but low for cropland (R2 = 0005 rRMSE = 1029) and forest 355
(R2 = 034 rRMSE = 1798) Again considering a linear relationship between both 356
vegetation indices and GPPEC revealed no consistent improvement compared to the use of a 357
hyperbolic model (data not shown) 358
359
lt Figure 4 gt 360
lt Table 3 gt 361
362
33 Assessment of factors determining SIF760 GPPEC relationships 363
The asymptotic relationship between SIF760 O and GPPEC (Figure 4A) represented 364
instantaneous measurements of different canopies at different times and days over several 365
years covering a range of different light conditions phenological stages of the forest and 366
various amounts of green biomass for both investigated grasslands (crosses in Figure 5A-C 367
that indicate EC measurements during APEX overpasses) Relationships between SIF760 O and 368
GPPEC are consequently a complex function of light absorption in the canopy (APAR) of the 369
efficiency of light utilization (ie expressed as photosynthetic capacity and quantum 370
efficiency of photosynthesis) and of structural effects including fractions of non-371
photosynthetic vegetation components Both grass canopies were measured before and after 372
mowing resulting in a large range in LAI (05-48 m2 m-2) and GPPEC (4-27 micromol m-2 s-1) for 373
similar PAR values The forest LAI of 50 m2 m-2 was more constant over the years due to the 374
consistent timing of flights however senescence (eg lower canopy chlorophyll content and 375
light absorption) might explain the decrease in GPPEC of 15 micromol m-2 s-1 in September for 376
16
comparable irradiance conditions (Figure 5C) Investigated crops (winter wheat barley and 377
pea) were characterized by small variations in LAI (22-25 m2 m-2) and chlorophyll contents 378
corresponding to small variations in GPPEC (5 micromol m-2 s-1) while observed under comparable 379
irradiance conditions During the time of observation the barley and wheat canopies were in 380
the ripening phase with a pronounced ear layer 381
382
lt Figure 5 gt 383
384
The validity of the asymptotic relationship between SIF760 O and GPPEC was tested 385
using simulations made with the SCOPE model We emphasize that the regression coefficient 386
b in Eq (6) includes terms that vary in the model (b= cmiddotLUEfmiddotfesc) the fluorescence efficiency 387
LUEf varies with irradiance conditions (predominantly APAR) the fraction fesc depends on 388
vegetation structure while c=GPPmaxLUEpmax varies between sites and over time during the 389
season We first analysed how LUEf and LUEp and consequently SIF760 and GPP vary at 390
leaf (ie SIF760 L and GPPL) and canopy levels (ie SIF760 C and GPPC) using the model of 391
van der Tol et al (2014) that is embedded in SCOPE For the leaf level Figure 6A shows a 392
decrease of LUEp with increasing APAR consistent with Eq (5) The relation between APAR 393
and LUEf appears more complex LUEf first increases with increasing APAR under low light 394
conditions reaches a climax at intermediate light and then decreases with increasing APAR 395
under higher APAR values (gt 50 mW m-2 sr-1 nm-1) (Figure 6B) The initial increase in LUEf 396
is caused by the decline in photochemical quenching of the excitons whereas the decrease of 397
LUEf is caused by the growing number of non-photochemical quenching traps that dissipate 398
light energy before it can be emitted as fluorescence light (van der Tol et al 2009a) It is 399
important to note that the range of LUEp is nearly an order of magnitude greater compared to 400
the range of LUEf (Figure 6C) Although LUEf is not constant we can still conclude that the 401
difference in both LUE terms causes an earlier saturation of leaf-level GPPL (Figure 6D) 402
17
compared to leaf-level SIF760 L (Figure 6E) with APAR leading to an asymptotic relationship 403
between SIF760 L and GPPL (Figure 6F) Our canopy level simulations confirm these trends 404
(Figure 7A-D) The in-field measured asymptotic relationships between SIF760 O and GPPEC 405
are consequently caused by the covariance of GPPEC and SIF760 O with APAR the 406
photosynthetic capacity with APAR and the different value ranges of LUEf and LUEp 407
Additionally our canopy level simulations suggest that structure impacts the SIF760 O - GPPEC 408
relationship Figure 7D shows an example that changing LAI leaf inclination angles or the 409
fraction of senescent plant material determine the curvature of the hyperbolic SIF760 C - GPPC 410
relationships 411
412
lt Figure 6 gt 413
lt Figure 7 gt 414
415
The modelled SIF760 LC - GPPLC curves (Figures 6D and 7D) also indicate that under 416
reduced light intensity GPP and SIF760 are almost linearly related while GPP tends to saturate 417
under higher light intensities Changes in APAR at canopy level are caused by either sun 418
elevation or in the case of a constant solar angle by canopy structure (ie shading fractional 419
vegetation cover) In complex structured canopies with many foliage layers the saturation of 420
GPP with APAR may not be observable because variations of APAR are less related to PAR 421
falling on the leaves but rather to the variation of leaf area exposed to light Model 422
simulations suggest that in complex canopies SIF760 saturates with APAR before GPP due to 423
fesc being lower with high APAR (data not shown) This structural effect reduces the curvature 424
of the hyperbolic leaf level GPPL- SIF760 L relationship at canopy level (compare Figures 6F 425
and 7F) Furthermore the effect of structure and APAR covary in time since canopy structure 426
(ie LAI) varies in concert with APAR during a seasonal cycle especially for crops We 427
18
expect that this covariance makes the relationship between GPP and SIF760 more linear at the 428
canopy level especially if observations are aggregated over time 429
To evaluate the structure related alleviation of the hyperbolic relationship between 430
SIF760 and GPP at canopy level in response to temporal aggregation we modelled an annual 431
course of GPPC and SIF760 C considering varying environmental conditions (Figure 8A-B) 432
ie PAR ranging from 0-500 mW m-2 sr-1 nm-1 air temperature ranging from 0-32degC using 433
data collected during 2009 at a Nitro-Europe flux tower site (Speulderbos The Netherlands) 434
and canopy properties ie LAI ranging from 15-30 m2 m-2 (Figure 8C) The LAI data are 435
synthetic but have a realistic seasonal cycle For daily noon values of modelled SIF760 C and 436
GPPC an asymptotic behaviour can be observed while GPPC tends to saturate compared to 437
SIF760 C The SIF760C-GPPC relationship tends to become linear when monthly or quarterly 438
averages are considered (Figure 8D) 439
440
lt Figure 8 gt 441
442
This visual trend can be confirmed by statistical measures for daily aggregated values 443
the hyperbolic model (rRMSE = 174 R2 = 070) performed slightly better than the linear 444
model (rRMSE = 185 r2 = 068) In case of monthly aggregated data both the hyperbolic 445
and linear models performed similarly while the linear model gave better results (RMSE = 446
90 r2 = 090) than the hyperbolic model (rRMSE = 94 R2 = 088) for quarterly aggregated 447
data 448
449
4 Discussion 450
Significant relationships between remotely measured SIF and ecosystem GPP have 451
been reported in the past (Frankenberg et al 2011 Guanter et al 2014) however sufficient 452
19
process understanding for using SIF as proxy for GPP across ecosystems is still limited 453
(Porcar-Castell et al 2014) Below we discuss how our observational and modeling 454
approaches help bridging the gap between mechanistic understanding at the leaf level and 455
ecosystem-specific observations and thus provide insights on mechanisms determining the 456
complex relationship between SIF and GPP 457
458
41 Insights from the observational approach 459
Our results showed ecosystem-specific asymptotic relationships between SIF760 O and 460
GPPEC for the three investigated ecosystems mixed temperate forest cropland and perennial 461
grassland The varying SIF-GPP relationships across ecosystems were consistent with results 462
recently reported from combined satellite observations and model predictions (Guanter et al 463
2012) Our results showed that the relationships of both tested vegetation indices PRI and 464
MCARI2 to GPPEC experienced a higher variability across ecosystems compared to SIF760 O 465
SIF760 O showed an ecosystem-specific and overall moderate to good relationship (R2 between 466
048 and 088) to GPPEC for the three ecosystems Both vegetation indices showed only strong 467
relationships for the grassland (R2 = 095 and 098) that notably changed in LAI during the 468
various observations It is important to note that we do not further elaborate on the underlying 469
mechanisms relating vegetation indices and GPPEC and that it is unclear if hyperbolic models 470
best describe their relationships to GPPEC based on mechanistic principles The intention of 471
evaluating the relationships between GPPEC and both vegetation indices was to provide a base 472
to judge the performance of SIF760 O in relation to these commonly used remote observations 473
The diversity of sampled conditions and used data sources provide further evidence on 474
the robustness of observed SIF760 O-GPPEC relationships Our measurements represent various 475
canopies characterized by different biomasses sampled over several years Although most 476
observations were acquired under similar light condition and physiological states a few 477
measurements represented lower light conditions and other physiological states This suggests 478
20
that observed relationships are rather robust across different representations of APAR LUEp 479
and LUEf Furthermore we use data from different sources ie four EC flux towers the 480
APEX imaging spectrometer and modeling at leaf and canopy levels to reduce the 481
uncertainties associated with each method of measurements and to get a better understanding 482
of the SIF760 O-GPPEC relationship at ecosystem level 483
Flux tower measurements are representative of a certain source area (footprint) from 484
the ecosystem which changes constantly based on wind direction and turbulent state of the 485
atmosphere Depending on the heterogeneity of the ecosystem GPPEC signals can vary in 486
response to changing footprints (Barcza et al 2009 Kljun et al 2004) although this variation 487
should be rather small if the vegetation is homogeneous Remote measurements of SIF760 are 488
likely representative of the upper layer of the ecosystem thus vertical canopy heterogeneity 489
potentially leads to a mismatch when compared to GPPEC which integrates over the different 490
layers of the ecosystems This is expected to be especially the case in structurally complex 491
ecosystems such as forests Although the upper layer in forest ecosystems substantially 492
contributes to the total rate of GPPEC there are still many layers of leaves or needles within 493
the canopy photosynthesizing at different rates depending on their sunshade exposure In 494
addition understory vegetation in forest ecosystems can significantly contribute to GPPEC at 495
different rates depending on the ecosystem and time of year Even homogeneous vegetation 496
canopies like crops or grasslands can show vertical heterogeneity This is especially the case 497
at peak biomass during ripening or senescence During such phenological stages the top layer 498
of cereal crops consists of less fluorescing components (ie ears) and cereal crops or 499
grasslands can contain a higher fraction of brown pigments resulting in low SIF760 O values 500
while the entire canopy can still produce high photosynthetic rates and thus GPPEC (Damm et 501
al 2010) Indeed most of the crops investigated in our study were in the ripening phase with a 502
pronounced ear layer 503
21
This resulted in relatively low SIF760 O values and in high GPPEC and thus in a more 504
pronounced asymptotic relationship (cf Figure 4A Figure 7F) compared to results reported 505
for other crops (Guanter et al 2013 Guanter et al 2014) Further research is needed to better 506
understand the impact of vertical heterogeneity on GPPEC and SIF760 observations and their 507
respective relationships 508
Despite the technical aspects causing variations in retrieved SIF760 O (refer to 509
Appendix-D for a detailed discussion) canopy structure causes inherent variations in 510
measured SIF760 values and thus impacts SIF760-GPP relationships The combination of 511
complex canopy architecture and the distribution of absorbing and scattering elements 512
determine vegetation canopies to act as photon traps (Knyazikhin et al 2013 Lewis and 513
Disney 2007) Parts of emitted SIF760 photons from inner-canopy leaves are re-absorbed 514
while others escape the canopy in direction of the sensor The probability of photons escaping 515
the canopy is a function of canopy structure which implies sensitivity to measured SIF760 516
intensities for canopy structure In Eq (2) this sensitivity was approximated with the term 517
fesc In our analysis we minimized the impact of fesc by observing always the same forest area 518
representative for the EC tower footprint In less complex structured crop and grass canopies 519
we expect fesc to be less important However future research is required to quantify the impact 520
of fesc and to propose strategies to compensate its influence on SIF760 retrievals 521
522
42 Insights from the modeling approach 523
From a theoretical point of view radiative energy loss competes with photochemistry 524
and non-radiative energy dissipation for absorbed photons Considering that GPP and SIF760 525
can be conceptualized according to Eqs (1) and (2) SIF760 must show under certain 526
environmental conditions a sensitivity to photochemistry (Porcar-Castell et al 2014 van der 527
Tol et al 2009a van der Tol et al 2009b) This relationship is confirmed by our observational 528
data and other studies at leaf (Amoros-Lopez et al 2008) and canopy levels (Damm et al 529
22
2010) Our modeling results however indicated that the relationship between LUEf and LUEp 530
is subject to change hence impacting the sensitivity of SIF760 to track changes in GPP 531
(Figures 6C and 7C) 532
The asymptotic relationship between SIF760 and GPP theoretically predicted and 533
observed at leaf and canopy levels can be related in particular to the different value ranges of 534
both efficiency terms (LUEp and LUEf) (Figures 6C and 7C) while a complex set of 535
mechanisms causes an ecosystem dependency for SIF760-GPP relationships The 536
photosynthetic capacity of the entire ecosystem in combination with its vertical heterogeneity 537
determines differences in GPP and SIF760 and thus the slope and curvature of their respective 538
relationships Furthermore the initial slope of the asymptotic SIF760 - GPP relationship which 539
has a value of LUEpmax(LUEfmiddotfesc) is determined by a combination of the photosynthetic 540
efficiency and canopy structure Canopy structure and related shadowing effects alter the 541
average light interception and quality at leaf level (Nobel et al 1993 Stewart et al 2003) and 542
consequently the overall productivity of the canopy In the case of reduced APAR caused by 543
canopy shadowing the overall apparent stress level in the canopy and consequently the rate 544
of certain photoprotective mechanisms such as non-radiative energy dissipation is reduced 545
(Cheng et al 2015 Demmig-Adams 1998 Niinemets et al 2003) and observed GPP and 546
SIF760 fall in a range where they are more linearly related (cf Figure 6F and 7F) In addition 547
canopy level simulations show that the fraction of senescent plant material impacts the 548
curvature of the hyperbolic relationship 549
Recent literature reports linear relationships between satellite-based SIF and modeled 550
GPP (Frankenberg et al 2011 Guanter et al 2012 Guanter et al 2014) while we found 551
asymptotic relationships Both results are not contradicting if one considers the temporal 552
aggregation applied to the data Our results are based on instantaneous measurements while 553
monthly averages were calculated for the satellite data to minimize noise effects (Frankenberg 554
et al 2011 Guanter et al 2014) It is known from previous research that temporal averaging 555
23
tends to linearize the response between GPP and APAR (Ruimy et al 1995) as saturating 556
light conditions tend to be only a small fraction of averaged diurnalmonthly data 557
Aggregating GPPEC and APAR over different time scales also showed this effect (data not 558
shown) Because of the rather linear relationship between SIF760 and APAR we expect that 559
temporal aggregation tends to linearize the SIF760-GPP relationship as well A recent study 560
presenting continuous measurements of GPP and SIF760 over a temperate deciduous forest 561
support this hypothesis (Yang et al 2015) The increasing number of experiments using 562
autonomous spectrometer systems in combination with flux towers (Balzarolo et al 2011) 563
will likely provide more experimental results that supports this finding Our simulations 564
provide further evidence that the covariance of structure and APAR during a seasonal cycle 565
additionally tends to linearize the relationship between GPP and SIF760 if observations are 566
aggregated over time 567
The dependency of SIF760-GPP relationships on temporal aggregation requires special 568
attention since it has implications on the usage of SIF to constrain GPP In principle 569
conclusions and results obtained from temporally aggregated and instantaneous measurements 570
are valid if consistently related to the underlying temporal aggregation level Generalizing 571
conclusions obtained at various aggregation levels bears the risk for mis-interpretations eg 572
when vegetation models are refined or empirically re-calibrated using observations or for 573
projections of GPP using observational SIF data 574
575
43 Requirements for the use of SIF to assess GPP across ecosystems 576
The changing relationship between SIF760 and GPPEC with vegetation type challenges 577
the usage of SIF760 as a robust constraint to estimate GPP Specific strategies are required to 578
account for ecosystem (or species) specific sensitivities of SIF in general and SIF760 in 579
particular This includes i) integration platforms to combine observations and process 580
24
understanding and ii) accurate observations of additional vegetation and environmental 581
variables 582
Process-based models as data integration platform in combination with comprehensive 583
observations to sufficiently measure important environmental factors and vegetation 584
properties are considered as flexible and powerful framework Parazoo et al (2014) for 585
example proposed the combination of ensemble dynamic global vegetation models (DGVMs) 586
in combination with SIF as observational constraint Lee et al (2015) suggest incorporating 587
SIF in a climate model to utilize SIF as observational constraint of photosynthesis simulations 588
and subsequent calculations of carbon water and energy cycle information Yet other studies 589
propose using SIF to obtain physiological vegetation parameters ie Vcmax for improved 590
parameterizations of photosynthesis models to eventually model GPP (Zhang et al 2014) The 591
European space agencys (ESA) Earth Explorer 8 opportunity mission Fluorescence Explorer 592
(FLEX) suggests a combination of comprehensive observations (ie SIF over the full 593
emission spectrum vegetation ecosystems and actual environmental conditions) and process-594
based models (Guanter et al 2012) 595
Additional information is required to use SIF in process-based models as one has to 596
account for varying photosynthetic efficiencies of plants and prevailing stress responses 597
According to the conceptualization of GPP and SIF as given in Eqs (1) and (2) extracting 598
and evaluating the exact relationship between LUEp and LUEf is essential but requires 599
normalizing APAR and calculating both yields (Damm et al 2010 Govindjee 2004 Louis et 600
al 2005) Retrievals of APAR can be considered challenging (Garbulsky et al 2010 Gitelson 601
and Gamon 2015 Hanan et al 2002) as available approaches often utilize a-priori knowledge 602
of prevailing land cover or plant distribution functions and rely on the inversion of physical-603
based models or simple band ratios (Hilker et al 2008) Research is required to provide high 604
quality information on APAR not perturbed by light absorption of non-photosynthetic active 605
25
canopy elements (stems branches twigs) cf Zhang et al (2013 2012) that demonstrate 606
attempts to improve estimates of APAR 607
Observed SIF760 O - GPPEC relationships are additionally confounded by non-radiative 608
energy dissipation The PRI was designed to monitor pigment changes related to the 609
xanthophyll cycle (Gamon et al 1992) and provides access to this superimposing process 610
However reported sensitivities of PRI for other effects ie structure (Barton and North 611
2001) pigment pool sizes (Gamon and Berry 2012) illumination effects (Damm et al 2015) 612
and the results obtained in this study question the applicability of the PRI at canopy level 613
Alternative approaches such as the development of a canopy PRI as suggested by several 614
groups (Hernandez-Clemente et al 2011 Kovac et al 2013 Wu et al 2010) or the usage of 615
pigment compositions and other functional plant traits might represent interesting strategies 616
and should be elaborated in future research 617
Structural sensitivities of canopy leaving SIF signals are critical and require further 618
research The application of spectrally invariant correction factors eg the directional area 619
scattering factor (Knyazikhin et al 2013) or more advanced physically-based retrieval 620
schemes using combined atmosphere-canopy models (Damm et al 2015 Laurent et al 2013) 621
might provide potential strategies to compensate for canopy structural effects on retrieved 622
SIF760 623
Another important source of information that allows improving the usage of SIF as 624
constraint of GPP is to consider SIF emissions over the entire emission spectrum between 625
approximately 600 and 800 nm Recent research successfully demonstrated the 626
complementary information content of red-fluorescence retrieved in the O2-B band at 688 nm 627
(SIF688) compared to SIF760 because of the different contributions from photosystem I and II 628
(Rossini et al 2015) Yet other studies highlighted the potential to improve predictions of 629
LUEp and GPP using both SIF688 and SIF760 (Cheng et al 2013) 630
631
26
5 Conclusions 632
Remote sensing of SIF provides a new observational approach to assess terrestrial 633
GPP Compared to traditional greenness-based remote sensing parameters we found SIF760 to 634
be more consistently related to GPPEC These results in combination with the more direct 635
mechanistic link between SIF760 and photosynthesis suggest that using SIF760 provides a 636
strategy to decrease uncertainty in estimating GPP across ecosystems 637
Our observational and modeling approaches revealed asymptotic and ecosystem-638
specific relationships for SIF760 and GPPEC We identified a set of interlinked mechanisms 639
determining SIF760-GPPEC relationships to be ecosystem specific ie the photosynthetic 640
capacity and efficiency of ecosystems the confounding impact of non-radiative energy 641
dissipation (NPQ) as well as ecosystem structure and the fraction of non-photosynthetic 642
vegetation components We demonstrated that SIF760-GPPEC relationships scale with temporal 643
aggregation due to a covariance of canopy structure and APAR over the seasonal cycle 644
We suggest going beyond empirical and ecosystem-specific relationships instead 645
using instantaneous observations comprehensively providing information on the full SIF 646
emission vegetation status and functioning as well as environmental conditions in 647
combination with process-based models Such approaches eg suggested for ESArsquos potential 648
ldquoFluorescence Explorerrdquo (FLEX) Earth Explorer mission provide a flexible framework to 649
account for the various influencing factors identified and to successfully apply SIF as 650
constraint of unbiased global GPP estimates 651
Furthermore research is required to improve the comparison between observations of 652
GPPEC and SIF Both observations stem from conceptually contrasting technologies ie 653
measurements of gas exchange vs plant-light interactions and provide independent and 654
complementary access to study ecosystem photosynthesis Despite the need to harmonize 655
horizontally differing footprints the vertical heterogeneity of ecosystems including the 656
27
varying contributions from different ecosystem layers must be better understood to harmonize 657
and successfully integrate both measurements 658
659
Acknowledgements 660
This work was supported by a grant of the Swiss University Conference and ETH-661
Board in frame of the Swiss Earth Observatory Network (SEON) project and by a grant of the 662
European Space Agency (ESA) in frame of the FLEX-PARCS E Paul-Limoges was 663
supported in part by the Natural Sciences and Engineering Research Council of Canada 664
through a postgraduate scholarship We would like to thank the APEX team for acquiring the 665
APEX data Authors sequence is listed following the FLAE approach (doi 666
101371journalpbio0050018) 667
28
References 668
Ammann C Flechard CR Leifeld J Neftel A amp Fuhrer J (2007) The carbon budget of 669
newly established temperate grassland depends on management intensity Agriculture 670
Ecosystems amp Environment 121 5-20 671
Amoros-Lopez J Gomez-Chova L Vila-Frances J Alonso L Calpe J Moreno J amp 672
del Valle-Tascon S (2008) Evaluation of remote sensing of vegetation fluorescence by 673
the analysis of diurnal cycles International Journal of Remote Sensing 29 5423-5436 674
Baker NR (2008) Chlorophyll Fluorescence A probe of photosynthesis in vivo Annual 675
Review of Plant Physiology and Plant Molecular Biology 59 89-113 676
Baldocchi D Falge E Gu LH Olson R Hollinger D Running S Anthoni P 677
Bernhofer C Davis K Evans R Fuentes J Goldstein A Katul G Law B Lee 678
XH Malhi Y Meyers T Munger W Oechel W U KTP Pilegaard K Schmid 679
HP Valentini R Verma S Vesala T Wilson K amp Wofsy S (2001) FLUXNET A 680
new tool to study the temporal and spatial variability of ecosystem-scale carbon dioxide 681
water vapor and energy flux densities Bulletin of the American Meteorological Society 682
82 2415-2434 683
Baldocchi DD (2003) Assessing the eddy covariance technique for evaluating carbon 684
dioxide exchange rates of ecosystems past present and future Global Change Biology 9 685
479-492 686
Balzarolo M Anderson K Nichol C Rossini M Vescovo L Arriga N Wohlfahrt G 687
Calvet J-C Carrara A Cerasoli S Cogliati S Daumard F Eklundh L Elbers JA 688
Evrendilek F Handcock RN Kaduk J Klumpp K Longdoz B Matteucci G 689
Meroni M Montagnani L Ourcival J-M Sanchez-Canete EP Pontailler J-Y 690
Juszczak R Scholes B amp Pilar Martin M (2011) Ground-Based Optical Measurements 691
at European Flux Sites A Review of Methods Instruments and Current Controversies 692
Sensors 11 7954-7981 693
Barcza Z Kern A Haszpra L amp Kljun N (2009) Spatial representativeness of tall tower 694
eddy covariance measurements using remote sensing and footprint analysis Agricultural 695
and Forest Meteorology 149 795-807 696
Barton CVM amp North PRJ (2001) Remote sensing of canopy light use efficiency using 697
the photochemical reflectance index - Model and sensitivity analysis Remote Sensing of 698
Environment 78 264-273 699
Beer C Reichstein M Tomelleri E Ciais P Jung M Carvalhais N Roedenbeck C 700
Arain MA Baldocchi D Bonan GB Bondeau A Cescatti A Lasslop G Lindroth 701
29
A Lomas M Luyssaert S Margolis H Oleson KW Roupsard O Veenendaal E 702
Viovy N Williams C Woodward FI amp Papale D (2010) Terrestrial Gross Carbon 703
Dioxide Uptake Global Distribution and Covariation with Climate Science 329 834-838 704
Berk A Anderson GP Acharya PK Bernstein LS Muratov L Lee J Fox M 705
Adler-Golden SM Chetwynd JH Hoke ML Lockwood RB Gardner JA Cooley 706
TW Borel CC amp Lewis PE (2005) MODTRAN5 A reformulated atmospheric band 707
model with auxiliary species and practical multiple scattering options Proceedings of the 708
Society of Photo-Optical Instrumentation Engineer 5655 662-667 709
Cheng SJ Bohrer G Steiner AL Hollinger DY Suyker A Phillips RP amp 710
Nadelhoffer KJ (2015) Variations in the influence of diffuse light on gross primary 711
productivity in temperate ecosystems Agricultural and Forest Meteorology 201 98-110 712
Cheng Y-B Middleton EM Zhang Q Huemmrich KF Campbell PKE Corp LA 713
Cook BD Kustas WP amp Daughtry CS (2013) Integrating Solar Induced 714
Fluorescence and the Photochemical Reflectance Index for Estimating Gross Primary 715
Production in a Cornfield Remote Sensing 5 6857-6879 716
Collatz GJ Ball JT Grivet C amp Berry JA (1991) Physiological and environmental-717
regulation of stomatal conductance photosynthesis and transpiration - a model that 718
includes a laminar boundary-layer Agricultural and Forest Meteorology 54 107-136 719
DOdorico P Alberti E amp Schaepman ME (2010) In-flight spectral performance 720
monitoring of the Airborne Prism Experiment Applied Optics 49 3082-3091 721
DOdorico P Guanter L Schaepman ME amp Schlaumlpfer D (2011) Performance 722
assessment of onboard and scene-based methods for Airborne Prism Experiment spectral 723
characterization Applied Optics 50 4755-4764 724
Damm A Erler A Gioli B Hamdi K Hutjes R Kosvancova M Meroni M 725
Miglietta F Moersch A Moreno J Schickling A Sonnenschein R Udelhoven T 726
Van der Linden S Hostert P amp Rascher U (2010) Remote sensing of sun induced 727
fluorescence yield to improve modelling of diurnal courses of Gross Primary Production 728
(GPP) Global Change Biology 16 171-186 729
Damm A Erler A Hillen W Meroni M Schaepman ME Verhoef W amp Rascher U 730
(2011) Modeling the impact of spectral sensor configurations on the FLD retrieval 731
accuracy of sun-induced chlorophyll fluorescence Remote Sensing of Environment 115 732
1882-1892 733
Damm A Guanter L Laurent VCE Schaepman ME Schickling A amp Rascher U 734
(2014) FLD-based retrieval of sun-induced chlorophyll fluorescence from medium 735
30
spectral resolution airborne spectroscopy data Remote Sensing of Environment 147 256-736
266 737
Damm A Guanter L Verhoef W Schlaumlpfer D Garbari S amp Schaepman ME (2015) 738
Impact of varying irradiance on vegetation indices and chlorophyll fluorescence derived 739
from spectroscopy data Remote Sensing of Environment 156 202-215 740
Demmig-Adams B (1998) Survey of thermal energy dissipation and pigment composition in 741
sun and shade leaves Plant and Cell Physiology 39 474-482 742
Drolet GG Middleton EM Huemmrich KF Hall FG Amiro BD Barr AG Black 743
TA McCaughey JH amp Margolis HA (2008) Regional mapping of gross light-use 744
efficiency using MODIS spectral indices Remote Sensing of Environment 112 3064-3078 745
Eugster W amp Senn W (1995) A cospectral correction model for measurement of turbulent 746
NO2 fluxes Boundary-Layer Meteorology 74 321-340 747
Eugster W Zeyer K Zeeman M Michna P Zingg A Buchmann N amp Emmenegger 748
L (2007) Methodical study of nitrous oxide eddy covariance measurements using 749
quantum cascade laser spectrometery over a Swiss forest Biogeosciences 4 927-939 750
Falge E Baldocchi D Olson R Anthoni P Aubinet M Bernhofer C Burba G 751
Ceulemans R Clement R Dolman H Granier A Gross P Grunwald T Hollinger 752
D Jensen NO Katul G Keronen P Kowalski A Lai CT Law BE Meyers T 753
Moncrieff H Moors E Munger JW Pilegaard K Rannik U Rebmann C Suyker 754
A Tenhunen J Tu K Verma S Vesala T Wilson K amp Wofsy S (2001) Gap 755
filling strategies for defensible annual sums of net ecosystem exchange Agricultural and 756
Forest Meteorology 107 43-69 757
Falloon P amp Betts R (2010) Climate impacts on European agriculture and water 758
management in the context of adaptation and mitigation-The importance of an integrated 759
approach Science of the Total Environment 408 5667-5687 760
Foken T amp Wichura B (1996) Tools for quality assessment of surface-based flux 761
measurements Agricultural and Forest Meteorology 78 83-105 762
Fournier A Daumard F Champagne S Ounis A Goulas Y amp Moya I (2012) Effect 763
of canopy structure on sun-induced chlorophyll fluorescence Isprs Journal of 764
Photogrammetry and Remote Sensing 68 112-120 765
Frankenberg C Fisher JB Worden J Badgley G Saatchi SS Lee JE Toon GC 766
Butz A Jung M Kuze A amp Yokota T (2011) New global observations of the 767
terrestrial carbon cycle from GOSAT Patterns of plant fluorescence with gross primary 768
productivity Geophysical Research Letters 38 769
31
Gamon JA amp Berry JA (2012) Facultative and constitutive pigment effects on the 770
Photochemical Reflectance Index (PRI) in sun and shade conifer needles Israel Journal of 771
Plant Sciences 60 85-95 772
Gamon JA Coburn C Flanagan LB Huemmrich KF Kiddle C Sanchez-Azofeifa 773
GA Thayer DR Vescovo L Gianelle D Sims DA Rahman AF amp Pastorello 774
GZ (2010) SpecNet revisited bridging flux and remote sensing communities Canadian 775
Journal of Remote Sensing 36 S376-S390 776
Gamon JA Penuelas J amp Field CB (1992) A narrow-waveband spectral index that 777
tracks diurnal changes in photosynthetic efficiency Remote Sensing of Environment 41 778
35-44 779
Garbulsky MF Filella I Verger A amp Penuelas J (2014) Photosynthetic light use 780
efficiency from satellite sensors From global to Mediterranean vegetation Environmental 781
and Experimental Botany 103 3-11 782
Garbulsky MF Penuelas J Papale D Ardo J Goulden ML Kiely G Richardson 783
AD Rotenberg E Veenendaal EM amp Filella I (2010) Patterns and controls of the 784
variability of radiation use efficiency and primary productivity across terrestrial 785
ecosystems Global Ecology and Biogeography 19 253-267 786
Gege P Fries J Haschberger P Schoumltz P Schwarzer H Strobl P Suhr B Ulbrich 787
G amp Vreeling WJ (2009) Calibration facility for airborne imaging spectrometers 788
ISPRS Journal of Photogrammetry amp Remote Sensing 64 387ndash397 789
Gitelson AA amp Gamon JA (2015) The need for a common basis for defining light-use 790
efficiency Implications for productivity estimation Remote Sensing of Environment 156 791
196-201 792
Goetz SJ amp Prince SD (1999) Modelling terrestrial carbon exchange and storage 793
Evidence and implications of functional convergence in light-use efficiency Advances in 794
Ecological Research Vol 28 (pp 57-92) 795
Govindjee (2004) Chlorophyll a fluorescence A bit of basics and history In GC 796
Papageorgiou amp Govindjee (Eds) Chlorophyll a Fluorescence A Signature of 797
Photosynthesis Advances in Photosynthesis and Respiration (pp 1-42) Dordrecht 798
Springer 799
Guanter L Alonso L Gomez-Chova L Amoros-Lopez J Vila J amp Moreno J (2007) 800
Estimation of solar-induced vegetation fluorescence from space measurements 801
Geophysical Research Letters 34 doi 1010292007GL029289 802
32
Guanter L Alonso L Gomez-Chova L Meroni M Preusker R Fischer J amp Moreno 803
J (2010) Developments for vegetation fluorescence retrieval from spaceborne high-804
resolution spectrometry in the O2-A and O2-B absorption bands Journal of Geophysical 805
Research-Atmospheres 115 806
Guanter L Frankenberg C Dudhia A Lewis PE Goacutemez-Dans J Kuze A Suto H amp 807
Grainger R (2012) Retrieval and global assessment of terrestrial chlorophyll fluorescence 808
from GOSAT space measurements Remote Sensing of Environment 121 236-251 809
Guanter L Rossini M Colombo R Meroni M Frankenberg C Lee J-E amp Joiner J 810
(2013) Using field spectroscopy to assess the potential of statistical approaches for the 811
retrieval of sun-induced chlorophyll fluorescence from ground and space Remote Sensing 812
of Environment 133 52-61 813
Guanter L Zhang Y Jung M Joiner J Voigt M Berry JA Frankenberg C Huete 814
AR Zarco-Tejada P Lee J-E Moran MS Ponce-Campos G Beer C Camps-815
Valls G Buchmann N Gianelle D Klumpp K Cescatti A Baker JM amp Griffis 816
TJ (2014) Global and time-resolved monitoring of crop photosynthesis with chlorophyll 817
fluorescence Proceedings of the National Academy of Sciences of the United States of 818
America 111 E1327-E1333 819
Haboudane D Miller JR Pattey E Zarco-Tejada PJ amp Strachan IB (2004) 820
Hyperspectral vegetation indices and novel algorithms for predicting green LAI of crop 821
canopies Modeling and validation in the context of precision agriculture Remote Sensing 822
of Environment 90 337-352 823
Hanan NP Burba G Verma SB Berry JA Suyker A amp Walter-Shea EA (2002) 824
Inversion of net ecosystem CO2 flux measurements for estimation of canopy PAR 825
absorption Global Change Biology 8 563-574 826
Hernandez-Clemente R Navarro-Cerrillo RM Suarez L Morales F amp Zarco-Tejada 827
PJ (2011) Assessing structural effects on PRI for stress detection in conifer forests 828
Remote Sensing of Environment 115 2360-2375 829
Hilker T Coops NC Wulder MA Black TA amp Guy RD (2008) The use of remote 830
sensing in light use efficiency based models of gross primary production A review of 831
current status and future requirements Science of the Total Environment 404 411-423 832
Hilker T Gitelson A Coops NC Hall FG amp Black TA (2011) Tracking plant 833
physiological properties from multi-angular tower-based remote sensing Oecologia 165 834
865-876 835
33
Hilker T Lyapustin A Hall FG Wang Y Coops NC Drolet G amp Black TA 836
(2009) An assessment of photosynthetic light use efficiency from space Modeling the 837
atmospheric and directional impacts on PRI reflectance Remote Sensing of Environment 838
113 2463-2475 839
Hueni A Biesemans J Meuleman K DellEndice F Schlaumlpfer D Adriaensen S 840
Kempenaers S Odermatt D Kneubuehler M Nieke J amp Itten K (2009) Structure 841
Components and Interfaces of the Airborne Prism Experiment (APEX) Processing and 842
Archiving Facility IEEE Transactions on Geoscience and Remote Sensing 47 29-43 843
Hueni A Lenhard K Baumgartner A amp Schaepman M (2013) The APEX (Airborne 844
Prism Experiment - Imaging Spectrometer) Calibration Information System IEEE 845
Transactions on Geoscience and Remote Sensing 51 5169-5180 846
Hueni A Schlaepfer D Jehle M amp Schaepman M (2015) Impacts of Dichroic Prism 847
Coatings on Radiometry of the Airborne Imaging Spectrometer APEX Applied Optics 53 848
5344-5352 849
Imhoff ML Bounoua L Ricketts T Loucks C Harriss R amp Lawrence WT (2004) 850
Global patterns in human consumption of net primary production Nature 429 870-873 851
IPCC (2013) Summary for policymakers Climate change 2013 the physical science basis 852
Cambridge University Press Cambridge United Kingdom and New York NY USA 853
Jacquemoud S amp Baret F (1990) PROSPECT A model of leaf optical properties spectra 854
Remote Sensing of Environment 34 75-91 855
Jehle M Hueni A Damm A DOdorico P Kneubuumlhler M Meuleman K Schlapfer 856
D Schaepman ME amp Weyermann J (2010) APEX - current status performance and 857
validation concept IEEE Sensors 2010 Conference 533-537 858
Joiner J Guanter L Lindstrot R Voigt M Vasilkov AP Middleton EM Huemmrich 859
KF Yoshida Y amp Frankenberg C (2013) Global monitoring of terrestrial chlorophyll 860
fluorescence from moderate spectral resolution near-infrared satellite measurements 861
methodology simulations and application to GOME-2 Atmos Meas Tech Discuss 6 862
3883-3930 863
Jung M Reichstein M Margolis HA Cescatti A Richardson AD Arain MA 864
Arneth A Bernhofer C Bonal D Chen J Gianelle D Gobron N Kiely G Kutsch 865
W Lasslop G Law BE Lindroth A Merbold L Montagnani L Moors EJ 866
Papale D Sottocornola M Vaccari F amp Williams C (2011) Global patterns of land-867
atmosphere fluxes of carbon dioxide latent heat and sensible heat derived from eddy 868
34
covariance satellite and meteorological observations Journal of Geophysical Research-869
Biogeosciences 116 870
Kljun N Kastner-Klein P Fedorovich E amp Rotach MW (2004) Evaluation of 871
Lagrangian footprint model using data from wind tunnel convective boundary layer 872
Agricultural and Forest Meteorology 127 189-201 873
Kljun N Rotach MW amp Schmid HP (2002) A three-dimensional backward lagrangian 874
footprint model for a wide range of boundary-layer stratifications Boundary-Layer 875
Meteorology 103 205-226 876
Knyazikhin Y Schull MA Stenberg P Mottus M Rautiainen M Yang Y Marshak 877
A Latorre Carmona P Kaufmann RK Lewis P Disney MI Vanderbilt V Davis 878
AB Baret F Jacquemoud S Lyapustin A amp Myneni RB (2013) Hyperspectral 879
remote sensing of foliar nitrogen content Proceedings of the National Academy of 880
Sciences of the United States of America 110 E185-E192 881
Kovac D Malenovsky Z Urban O Spunda V Kalina J Ac A Kaplan V amp Hanus 882
J (2013) Response of green reflectance continuum removal index to the xanthophyll de-883
epoxidation cycle in Norway spruce needles Journal of Experimental Botany 64 1817-884
1827 885
Krausmann F Erb K-H Gingrich S Haberl H Bondeau A Gaube V Lauk C 886
Plutzar C amp Searchinger TD (2013) Global human appropriation of net primary 887
production doubled in the 20th century Proceedings of the National Academy of Sciences 888
of the United States of America 110 10324-10329 889
Lasslop G Reichstein M Papale D Richardson AD Arneth A Barr A Stoy P amp 890
Wohlfahrt G (2010) Separation of net ecosystem exchange into assimilation and 891
respiration using a light response curve approach critical issues and global evaluation 892
Global Change Biology 16 187-208 893
Laurent VCE Verhoef W Damm A Schaepman ME amp Clevers JGPW (2013) A 894
Bayesian object-based approach for estimating vegetation biophysical variables from at-895
sensor APEX radiance data Remote Sensing of Environment 139 6-17 896
Lee JE Berry JA Van der Tol C Yang X Guanter L Damm A Baker I amp 897
Frankenberg C (2015) Simulations of chlorophyll fluorescence in corporated into the 898
Community Land Model version 4 Global Change Biology in print 899
Lewis P amp Disney M (2007) Spectral invariants and scattering across multiple scales from 900
within-leaf to canopy Remote Sensing of Environment 109 196-206 901
35
Liu LY amp Cheng ZH (2010) Detection of Vegetation Light-Use Efficiency Based on 902
Solar-Induced Chlorophyll Fluorescence Separated From Canopy Radiance Spectrum Ieee 903
Journal of Selected Topics in Applied Earth Observations and Remote Sensing 3 306-312 904
Louis J Ounis A Ducruet JM Evain S Laurila T Thum T Aurela M Wingsle G 905
Alonso L Pedros R amp Moya I (2005) Remote sensing of sunlight-induced chlorophyll 906
fluorescence and reflectance of Scots pine in the boreal forest during spring recovery 907
Remote Sensing of Environment 96 37-48 908
Maier SW Guumlnther KP amp Stellmes M (2003) Sun-Induced Fluorescence A New Tool 909
for Precision Farming In M McDonald J Schepers L Tartly T van Toai amp D Major 910
(Eds) Digital Imaging and Spectral Techniques Applications to Precision Agriculture 911
and Crop Physiology (pp 209-222) ASA Special Publication 912
Mauder M Foken T Clement R Elbers JA Eugster W Gruenwald T Heusinkveld 913
B amp Kolle O (2008) Quality control of CarboEurope flux data - Part 2 Inter-914
comparison of eddy-covariance software Biogeosciences 5 451-462 915
Meroni M Busetto L Guanter L Cogliati S Crosta GF Migliavacca M Panigada 916
C Rossini M amp Colombo R (2010) Characterization of fine resolution field 917
spectrometers using solar Fraunhofer lines and atmospheric absorption features Applied 918
Optics 49 2858-2871 919
Meroni M Picchi V Rossini M Cogliati S Panigada C Nali C Lorenzini G amp 920
Colombo R (2008) Leaf level early assessment of ozone injuries by passive fluorescence 921
and photochemical reflectance index International Journal of Remote Sensing 29 5409-922
5422 923
Meroni M Rossini M Guanter L Alonso L Rascher U Colombo R amp Moreno J 924
(2009) Remote sensing of solar induced chlorophyll fluorescence review of methods and 925
applications Remote Sensing of Environment doi101016jrse200905003 926
Michaelis L amp Menten ML (1913) The kenetics of the inversion effect Biochemische 927
Zeitschrift 49 333-369 928
Middleton E McMurtney JE Campbell PK Corp LA Butcher LM amp Chappelle 929
EW (2002) Optical and fluorescence properties of corn leaves from different nitrogen 930
regimes In M Owe G Durso amp L Toulios (Eds) Conference on Remote Sensing for 931
Agriculture Ecosystems and Hydrology IV (pp 72-83) Agia Pelagia Greece 932
Miller JR Berger M Goulas Y Jacquemoud S Louis J Moise N Mohammed G 933
Moreno J Moya I Pedroacutes R Verhoef W amp Zarco-Tejada PJ (2005) Development 934
36
of a vegetation fluorescence canopy model Final Report May 2005 In European Space 935
Research and Technology Centre (ESTEC) 936
Monteith JL (1972) Solar-radiation and productivity in tropical ecosystems Journal of 937
Applied Ecology 9 747-766 938
Niinemets U Kollist H Garcia-Plazaola JI Hernandez A amp Becerril JM (2003) Do 939
the capacity and kinetics for modification of xanthophyll cycle pool size depend on growth 940
irradiance in temperate trees Plant Cell and Environment 26 1787-1801 941
Nobel PS Forseth IN amp Long SP (1993) Canopy structure and light interception 942
Ozanne CMP Anhuf D Boulter SL Keller M Kitching RL Korner C Meinzer 943
FC Mitchell AW Nakashizuka T Dias PLS Stork NE Wright SJ amp 944
Yoshimura M (2003) Biodiversity meets the atmosphere A global view of forest 945
canopies Science 301 183-186 946
Parazoo NC Bowman K Fisher JB Frankenberg C Jones DBA Cescatti A Peacuterez-947
Priego Oacute Wohlfahrt G amp Montagnani L (2014) Terrestrial gross primary production 948
inferred from satellite fluorescence and vegetation models Global Change Biology na-na 949
Plascyk JA (1975) MK II Fraunhofer Line Dicsriminator (FLD-II) for airborne and orbital 950
remote-sensing of solar-stimulated luminescence Optical Engineering 14 339-346 951
Porcar-Castell A Tyystjaumlrvi E Atherton J Van der Tol C Flexas J EE P Moreno 952
J Frankenberg C amp Berry JA (2014) Linking chlorophyll a fluorescence to 953
photosynthesis for remote sensing applications mechanisms and challenges Journal of 954
Experimental Botany 65 4065-4095 955
Rascher U Agati G Alonso L Cecci G Champagne S Colombo R Damm A 956
Daumard F De Miguel E Fernandez G Franch B Franke J Gerbig C Gioli B 957
Gomez JA Goulas Y Guanter L Gutierrez-De-La-Camara O Hamdi K Hostert 958
P Jimenez M Kosvancova M Lognoli D Meroni M Miglietta F Moersch A 959
Moreno J Moya I Neininger B Okujeni A Ounis A Palombi L Raimondi V 960
Schickling A Sobrino JA Stellmes M Toci G Toscano P Udelhoven T Van der 961
Linden S amp Zaldei A (2009) CEFLES2 The remote sensing component to quantify 962
photosynthetic efficiency from the leaf to the region by measuring sun-induced 963
fluorescence in the oxygen absorption bands Biogeosciences 6 1181-1198 964
Richter R amp Schlaumlpfer D (2002) Geo-atmospheric processing of airborne imaging 965
spectrometry data Part 2 Atmospherictopographic correction International Journal of 966
Remote Sensing 23 2631-2649 967
37
Rossini M Meroni M Migliavacca M Manca G Cogliati S Busetto L Picchi V 968
Cescatti A Seufert G amp Colombo R (2010) High resolution field spectroscopy 969
measurements for estimating gross ecosystem production in a rice field Agricultural and 970
Forest Meteorology 150 1283-1296 971
Rossini M Nedbal L Guanter L Ač A Alonso L Burkart A Cogliati S Colombo 972
R Damm A Drusch M Hanus J Julitta T Kokkalis P Moreno J Panigada C 973
Pinto F Schickling A Schuumlttemeyer D Zemek F amp Rascher U (2015) Red and far-974
red sun-induced chlorophyll fluorescence as a measure of plant photosynthesis 975
Geophysical Research Letters (accepted for publication) 976
Ruimy A Jarvis PG Baldocchi DD amp B S (1995) CO2 Fluxes over Plant Canopies 977
and Solar Radiation A Review Advances in Ecological Research 26 1-68 978
Running SW Nemani RR Heinsch FA Zhao MS Reeves M amp Hashimoto H 979
(2004) A continuous satellite-derived measure of global terrestrial primary production 980
Bioscience 54 547-560 981
Schaepman ME M J Hueni A DrsquoOdorico P Damm A Weyermann J Schneider F 982
Laurent VCE C P Seidel F Lenhard K Gege P Kuechler C Brazile J Kohler 983
P De Vos L Meuleman K Meynart R Schlaepfer D Kneubuumlhler M amp Itten K 984
(2015) Advanced radiometry measurements and Earth science applications with the 985
Airborne Prism Experiment (APEX) Remote Sensing of Environment 158 207-219 986
Schimel D Pavlick R Fisher JB Asner GP Saatchi S Townsend P Miller C 987
Frankenberg C Hibbard K amp Cox P (2014) Observing terrestrial ecosystems and the 988
carbon cycle from space Global Change Biology na-na 989
Schlaumlpfer D amp Richter R (2002) Geo-atmospheric processing of airborne imaging 990
spectrometry data Part 1 Parametric orthorectification International Journal of Remote 991
Sensing 23 2609-2630 992
Schneider FD Leiterer R Morsdorf F Gastellu-Etchegorry J-P Lauret N Pfeifer N 993
amp Schaepman ME (2014) Simulating imaging spectrometer data 3D forest modeling 994
based on LiDAR and in situ data Remote Sensing of Environment 152 235-250 995
Schroter D Cramer W Leemans R Prentice IC Araujo MB Arnell NW Bondeau 996
A Bugmann H Carter TR Gracia CA de la Vega-Leinert AC Erhard M Ewert 997
F Glendining M House JI Kankaanpaa S Klein RJT Lavorel S Lindner M 998
Metzger MJ Meyer J Mitchell TD Reginster I Rounsevell M Sabate S Sitch 999
S Smith B Smith J Smith P Sykes MT Thonicke K Thuiller W Tuck G 1000
38
Zaehle S amp Zierl B (2005) Ecosystem service supply and vulnerability to global change 1001
in Europe Science 310 1333-1337 1002
Sitch S Smith B Prentice IC Arneth A Bondeau A Cramer W Kaplan JO Levis 1003
S Lucht W Sykes MT Thonicke K amp Venevsky S (2003) Evaluation of ecosystem 1004
dynamics plant geography and terrestrial carbon cycling in the LPJ dynamic global 1005
vegetation model Global Change Biology 9 161-185 1006
Stewart DW Costa C Dwyer LM Smith DL Hamilton RI amp Ma BL (2003) 1007
Canopy structure light interception and photosynthesis in maize Agronomy Journal 95 1008
1465-1474 1009
Trnka M Dubrovsky M amp Zalud Z (2004) Climate change impacts and adaptation 1010
strategies in spring barley production in the Czech Republic Climatic Change 64 227-1011
255 1012
Turner DP Ritts WD Cohen WB Maeirsperger TK Gower ST Kirschbaum AA 1013
Running SW Zhao MS Wofsy SC Dunn AL Law BE Campbell JL Oechel 1014
WC Kwon HJ Meyers TP Small EE Kurc SA amp Gamon JA (2005) Site-level 1015
evaluation of satellite-based global terrestrial gross primary production and net primary 1016
production monitoring Global Change Biology 11 666-684 1017
van der Tol C Berry J Campbell PKE amp Rascher U (2014) Models of fluorescence 1018
and photosynthesis for interpreting measurements of solar-induced chlorophyll 1019
fluorescence Journal of Geophysical Research Biogeosciences IN PRESS 1020
van der Tol C Verhoef W amp Rosema A (2009a) A model for chlorophyll fluorescence 1021
and photosynthesis at leaf scale Agricultural and Forest Meteorology 149 96-105 1022
van der Tol C Verhoef W Timmermans A Verhoef A amp Su Z (2009b) An integrated 1023
model of soil-canopy spectral radiances photosynthesis fluorescence temperature and 1024
energy balance Biogeosciences 6 3109-3129 1025
Verhoef W (1984) Light scattering by leaf layers with application to canopy reflectance 1026
modeling The SAIL model Remote Sensing of Environment 16 125-141 1027
Verhoef W amp Bach H (2003a) Remote sensing data assimilation using coupled radiative 1028
transfer models Physics and Chemistry of the Earth 28 3-13 1029
Verhoef W amp Bach H (2003b) Simulation of hyperspectral and directional radiance 1030
images using coupled biophysical and atmospheric radiative transfer models Remote 1031
Sensing of Environment 87 23-41 1032
39
Verhoef W amp Bach H (2007) Coupled soil-leaf-canopy and atmosphere radiative transfer 1033
modeling to simulate hyperspectral multi-angular surface reflectance and TOA radiance 1034
data Remote Sensing of Environment 109 166-182 1035
Verhoef W Jia L Xiao Q amp Su Z (2007) Unified optical-thermal four-stream radiative 1036
transfer theory for homogeneous vegetation canopies Ieee Transactions on Geoscience 1037
and Remote Sensing 45 1808-1822 1038
Webb EK Pearman GI amp Leuning R (1980) Correction of flux measurements for 1039
density effects due to heat and water-vapour transfer Quarterly Journal of the Royal 1040
Meteorological Society 106 85-100 1041
Wu C Niu Z Tang Q amp Huang W (2010) Revised photochemical reflectance index 1042
(PRI) for predicting light use efficiency of wheat in a growth cycle validation and 1043
comparison International Journal of Remote Sensing 31 2911-2924 1044
Yang X Tang J Mustard JF Lee JE Rossini M Joiner J Munger JW Kornfeld 1045
A amp Richardson AD (2015) Solar-induced chlorophyll fluorescence that correlates with 1046
canopy photosynthesis on diurnal and seasonal scales in a temperate deciduous forest 1047
Geophysical Research Letters 1048
Zarco-Tejada PJ Berni JAJ Suarez L Sepulcre-Canto G Morales F amp Miller JR 1049
(2009) Imaging chlorophyll fluorescence with an airborne narrow-band multispectral 1050
camera for vegetation stress detection Remote Sensing of Environment 113 1262-1275 1051
Zarco-Tejada PJ Gonzalez-Dugo V amp Berni JAJ (2012) Fluorescence temperature and 1052
narrow-band indices acquired from a UAV platform for water stress detection using a 1053
micro-hyperspectral imager and a thermal camera Remote Sensing of Environment 117 1054
322-337 1055
Zarco-Tejada PJ Morales A Testi L amp Villalobos FJ (2013) Spatio-temporal patterns 1056
of chlorophyll fluorescence and physiological and structural indices acquired from 1057
hyperspectral imagery as compared with carbon fluxes measured with eddy covariance 1058
Remote Sensing of Environment 133 102-115 1059
Zhang Q Middleton EM Cheng YB amp Landis DR (2013) Variations of foliage 1060
chlorophyll fAPAR and foliage non-chlorophyll fAPAR (fAPARchl fAPARnonchl) at the 1061
Harvard Forest Ieee Journal of Selected Topics in Applied Earth Observations and Remote 1062
Sensing 6 2254-2264 1063
Zhang Q Middleton EM Gao BC amp Cheng YB (2012) Using EO-1 hyperion to 1064
simulate HyspIRI products for a coniferous forest The fraction of par absorbed by 1065
40
chlorophyll (fAPAR chl) and leaf water content (LWC) Ieee Transactions on Geoscience 1066
and Remote Sensing 50 1844-1852 1067
Zhang Y Guanter L Berry JA Joiner J van der Tol C Huete A Gitelson A Voigt 1068
M amp Koumlhler P (2014) Estimation of vegetation photosynthetic capacity from space-1069
based measurements of chlorophyll fluorescence for terrestrial biosphere models Global 1070
Change Biology 20 3727-3742 1071
1072
41
Appendix-A APEX data calibration 1073
The calibration of APEX images is based on the APEX Processing and Archiving Facility 1074
(PAF) which is the combined software and hardware designed to generate calibrated level 1 1075
at-sensor radiances from APEX raw image streams (Hueni et al 2009) Calibration 1076
coefficients for the radiometric geometric and spectral calibrations are generated from system 1077
calibrations at the APEX Calibration Home Base (CHB) at DLR Oberpfaffenhofen (Gege et 1078
al 2009) These CHB data are stored and processed within the APEX Calibration Information 1079
System (CAL IS) producing the so-called calibration cubes holding coefficients for each 1080
spatio-spectral pixel (Hueni et al 2013) 1081
For the multi-temporal dataset employed within this study all flight lines were 1082
reprocessed from the original raw image streams to ensure that the same version of the 1083
processor was applied The APEX PAF and CAL IS have significantly evolved over the 1084
timeframe of the dataset with calibrations getting more accurate over the years To ensure 1085
consistency all data were calibrated using coefficients obtained in May 2013 1086
The processor was specifically configured to retain the highest information content in 1087
the VNIR channel including i) no spectral resampling to compensate for spectral shifts and 1088
misregistrations (DOdorico et al 2010 DOdorico et al 2011) ii) no compensation of 1089
spectral shift related changes in radiometry (Hueni et al 2015) and iii) no spatial 1090
misregistration correction The calibration was thus effectively reduced to a linear dark 1091
current correction over time a de-smearing of the visible-NIR channel to compensate for 1092
sensor smear effects the application of radiometric gains and offsets followed by a destriping 1093
routine working in the spatial dimension only to remove pushbroom related along track 1094
striping Calibrated radiance data were directly used for the fluorescence retrieval (see Section 1095
24) while the feasibility to use APEX for SIF760 retrievals was theoretically demonstrated in 1096
42
a study of Damm et al (2011) Resulting SIF760 maps were afterwards geo-rectified using a 1097
parametric geocoding approach (Schlaumlpfer and Richter 2002) 1098
43
Appendix-B Retrieval of SIF760 from airborne data 1099
The quantification of SIF measured with ground or airborne-based spectrometers 1100
requires separating emitted SIF from the reflected radiance flux The Fraunhofer Line Depth 1101
(FLD) approach introduced by Plascyk (1975) serves as a de facto standard for medium 1102
resolution instruments such as APEX (Meroni et al 2009) and was applied in our study The 1103
FLD method uses atmospheric absorption bands characterized by lower incident light 1104
compared to wavelength regions outside of these bands This configuration increases the 1105
spectral information and allows the separation of SIF from reflected radiation In this study 1106
we used the broad O2-A oxygen absorption band around 760 nm and quantified the infilling of 1107
SIF760 using radiance measurements inside (subscript i) and outside (subscript o) of the O2-A 1108
band 1109
For the airborne case only atmospheric components can be simulated with 1110
MODTRAN-5 assuming perfect knowledge of the acquisition conditions The reflectance 1111
terms for diffuse and direct irradiance as well as the SIF760 contribution are usually unknown 1112
Assuming Lambertian surface reflectance behavior which introduces some inaccuracies but 1113
allows formulating the radiative transfer (RT) for radiance measurements at sensor level (LAtS) 1114
to obtain SIF760 both measurements inside and outside of the absorption band can be 1115
expressed as 1116
E9FA lang3H IJK LMNrangP QlangRSE rang T UlangVWWH VXWH rang∙langVYYH VYXH rangZH
Hlang[XXH rang T ABCHUlangVWWH ranglangVXWH rangZHlang[XXH rang ] ^ _ (B1) 1117
where E0 is the top-of-atmosphere irradiance including diffuse and direct irradiance 1118
components θil is the illumination zenith angle ρso is the path scattered radiance τss is the 1119
direct transmittance for sunlight τoo is the direct transmittance in view direction τsd is the 1120
diffuse transmittance of the atmosphere for sunlight τdo is the hemispherical-directional 1121
transmittance in view direction and ρdd is the spherical albedo If these atmospheric 1122
44
components are obtained from MODTRAN-5 simulations (Damm et al 2015 Verhoef and 1123
Bach 2003a b 2007) the radiative transfer equation (Eq B1) only contains four unknowns 1124
namely Ri Ro SIFi and SIFo The 3FLD method (Maier et al 2003) which is an adaptation of 1125
the original FLD method proposed by (Plascyk 1975) was used to linearly relate R and SIF 1126
inside and outside of the O2-A absorption band SIF can be finally retrieved with 1127
13 -0 abcMUdWecWlangRff_ rangZghcWUdMecMlangRff^ rangZiUdWecWlangRff_ rangZghUdMecMlangRff^ rangZ j
langVWWM ranglangVXWM rang (B2) 1128
kE lE9FA m lang3HW IJK LMNrangP langRSE rangn ] ^ _ (B3) 1129
E lang3HW IJK LMNrangP langoSSE TopSE rang ∙ langoE opE rang qEprs T Eprt] ^ _ (B4) 1130
r S13rlangoSSr rang T langopSr rang v13S$langoSSS rang T langopSS rangw (B5) 1131
where B is the factor relating SIFi and SIFo and was fixed to a value of 08 justified by 1132
simulations and experiments (Rascher et al 2009 Alonso et al 2008) Xj equals the at-1133
sensor radiance (reflected plus emitted radiation) without path radiance contribution and Ej 1134
expresses surface irradiance as measured at the sensor level A is the factor relating Ri and Ro 1135
and was derived from linear interpolation of R of the left (758 nm) and right (771 nm) O2-A 1136
band shoulder with 1137
xx+ (B6) 1138
y ```-0```z and y `-0`z
```z (B7) 1139
1140
Because APEX suffered from slight spectral smile effects (DOdorico et al 2010) 1141
updated center wavelength positions were involved in the convolution approach The spectral 1142
shift quantification for each pixel across track was based on the Cr method as described in 1143
45
Meroni et al (2010) The method assumes a high correlation between a measured and a 1144
convolved spectrum and iteratively minimizes a cost function which is 1 minus the Pearson 1145
correlation coefficient (r) calculated for both signals Remaining artifacts of the spectral shift 1146
correction and slightly inaccurate estimates of atmospheric properties cause SIF760 retrieval 1147
uncertainties We therefore applied a semi-empirical correction as described in Damm et al 1148
(2014) for each scan line across the track This technique employs reference surfaces which 1149
are free of any SIF760 emission (eg bare soil) to adjust the upward transmittance term inside 1150
the absorption feature oSSr The retrieval of SIF760 from top-of-canopy radiance data measured 1151
on ground follows the same approach as described in Eqs B2-B7 under the assumption that 1152
the surface irradiance can be approximated with the measurement of a reference panel and 1153
that ρso τdo and τdo can be set to 0 Furthermore the spectral resolution of APEX can be 1154
considered suboptimal for SIF760 retrievals although Damm et al (2011) demonstrate that 1155
APEX with its spectral resolution of 54 nm at 760 nm is sensitive for SIF760 However 1156
retrieved SIF760 values are too high and in an absolute sense incorrect We used reference 1157
SIF760 data obtained in parallel to the airborne acquisitions using the ASD field spectrometers 1158
(Section 23) to estimate the actual offset The observed scaling factor of 193 was afterwards 1159
applied to the retrieved SIF760 values to transfer them to a realistic value range 1160
46
Appendix-C SIF retrieval accuracy 1161
We applied a quantitative accuracy evaluation of resulting SIF760 maps using ground 1162
measured SIF760 values (Figure C1) Considering all reference data acquired during five 1163
campaigns a good linear relationship was achieved between ground and airborne-based 1164
SIF760 values (r2 = 071) but with a proportionality factor much higher than 1 (Figure C1-A) 1165
This experimentally obtained systematic overestimation of APEX SIF760 is comparable to 1166
simulation results documented in Damm et al (2011) Further we found slightly changing 1167
correlations between the different years (several linear models in Figure C1-A) which are 1168
likely caused by canopy structural effects spectral and radiometric performances of used 1169
ground instruments or slight deviations of the performance of APEX over time 1170
To compensate for the overestimation of APEX SIF760 we applied an empirical correction 1171
factor of 193 derived from the comparison of reference data and APEX which resulted in a 1172
rRMSE of 289 (Figure C1-B) 1173
1174
lt Figure C1 gt 1175
1176
The Laegeren site was covered with three adjacent flight lines having an overlap of 1177
approximately 10 (cf Figure 3) This configuration provides the opportunity to 1178
quantitatively evaluate the consistency of SIF retrievals obtained from different measurements 1179
and view zenith angles (ie plusmn 135deg) The comparison of SIF760 retrievals obtained from flight 1180
lines 1 and 2 reveals a moderate linear relationship for homogeneous agricultural surfaces (r2 1181
= 081 rRMSE = 57) We observed a systematic underestimation of flight line 1 compared 1182
to flight line 2 (factor 06) for a view zenith angle difference of ~26deg for SIF760 indicating 1183
either a directionality of SIF760 emissions or an insufficient decoupling of surface HCRF 1184
affected by reflectance anisotropy With increasing surface heterogeneity scattering increases 1185
47
and the agreement of retrieved SIF from both flight lines slightly decreases (ie for forested 1186
areas r2 of 05 and rRMSE of 88) This lower correlation can be mainly associated to slight 1187
geometric mis-registrations (ie max 2 pixel ~ 40 m) in combination with surface 1188
heterogeneity (eg shaded and sunlit tree crowns) and emission anisotropy of SIF760 Also 1189
negative SIF760 values are present in the SIF760 maps and caused by sensor noise and 1190
especially for forests due to shadowing effects (Damm et al 2015) 1191
48
Appendix-D Technical aspects determining the SIF760 retrieval accuracy 1192
A rigorous evaluation of the SIF760 retrieval accuracy is crucial to judge the reliability 1193
of our assessment on the relationship between SIF760 and GPPEC across ecosystems 1194
Furthermore additional factors imposing variations on SIF760 retrieved from airborne 1195
spectroscopy data that cannot be related to the physiological origin of SIF760 needs to be 1196
critically discussed to justify the proposed approach 1197
Ground-based measurements of SIF760 were made using field spectrometers to validate 1198
the airborne retrievals Field spectroscopy provides a good reference for validating airborne 1199
retrievals as it is likely not affected by biases resulting from atmospheric composition 1200
estimates (eg aerosol load) due to the simultaneous measurement of irradiance fluxes at 1201
canopy level using a reference panel The reliability of the applied field spectroscopic 1202
approach to measure SIF760 was previously demonstrated using field studies (Damm et al 1203
2010 Liu and Cheng 2010 Meroni et al 2009 Rascher et al 2009) and theoretical 1204
assessments (Damm et al 2011) It must be noted that field spectroscopic approaches are 1205
subject to uncertainties particularly for heterogeneous vegetation canopies Damm et al 1206
(2015) discussed retrieval errors caused by illumination effects likely introducing slight 1207
errors in reference SIF760 This source of uncertainty must be considered when judging the 1208
accuracy of APEX SIF760 The nevertheless good agreement between ground and airborne 1209
observations indicated that atmospheric absorption and scattering effects could be sufficiently 1210
compensated and thus demonstrated the reliability of retrieved SIF760 measurements In 1211
particular the empirical correction applied making use of high spatial resolution airborne IS 1212
data in combination with reference surfaces not emitting SIF760 allowed to bypass retrieval 1213
uncertainties caused by atmospheric effects (Damm et al 2014) 1214
Instrumental effects in combination with retrieval methods were found to cause 1215
systematic differences in SIF760 retrievals (Damm et al 2011) the comparatively low 1216
49
resolution of APEX around the O2-A band used to retrieve SIF760 (ie ~54 nm) resulted in an 1217
overestimation of APEX SIF760 compared to retrievals from high resolution instruments 1218
Indeed maximum APEX SIF760 values are 6 mW m-2 sr-1 nm-1 while typical SIF760 values 1219
obtained from high resolution instruments range between 0 and 3 mW m-2 sr-1 nm-1 (Guanter 1220
et al 2013) Considering SIF760 values retrieved from ASD data in original resolution (3 nm) 1221
APEX showed an overestimation of 1102 which confirmed that low spectral resolution 1222
resulted in an overestimation of SIF760 The reasoning for this absolute error is given by the 1223
sub-optimal spectral resolution of APEX with 54 nm at 760 nm causing a reduced sensitivity 1224
for SIF760 on the one hand and a wider distance of the O2-A shoulder values used to 1225
parameterize the 3FLD approach on the other hand The bias was corrected using the ASD 1226
reference data and does not impact the results of our analysis Further the relative variation of 1227
SIF760 is unaffected by the bias 1228
Surface heterogeneity complicates the retrieval of SIF760 According to Damm et al 1229
(2015) SIF760 retrievals for forest sites are especially subject to uncertainties due to 1230
assumptions on surface irradiance Crown shapes and associated surface orientations 1231
determine the intensity and quality of irradiance including fractional amounts of diffuse and 1232
direct irradiance To account for pixel wise changes in surface irradiance high resolution 1233
digital object models (DOM) (eg derived from LiDAR observations) are required In 1234
absence of such a high resolution DOMrsquos crowns are assumed to be flat which results in 1235
uncertainties of up to 58 in case of cast shadows (Damm et al 2015) Since we used 1236
averaged observations over larger areas representing flux tower footprints and most of our 1237
data were flown under comparable illumination conditions (ie around solar noon) we 1238
expect these potential biases to be less influential in this analysis 1239
1
Tables 1
Table 1 Date and time of APEX flights and corresponding eddy covariance flux tower 2
measurements for the three investigated ecosystems (ie grassland cropland mixed 3
temperate forest) 4
Date Time [UTC] Location Ecosystem Flux tower
17062009 950 Laegeren forest 1 tower
17062009 1030 Oensingen cropland 1 tower
17062009 1030 Oensingen grassland 2 tower
25062010 1030 Oensingen cropland 1 tower
25062010 1030 Oensingen grassland 2 tower
26062010 1500 Laegeren forest 1 tower
26062010 1030 Oensingen cropland 1 tower
26062010 1030 Oensingen grassland 2 tower
29062010 1030 Laegeren forest 1 tower
26062011 1030 Laegeren forest 1 tower
28062011 1030 Oensingen cropland 1 tower
28062011 1030 Oensingen grassland 1 tower
16062012 1025 Laegeren forest 1 tower
16062012 900 Oensingen cropland 1 tower
16062012 1100 Oensingen cropland 1 tower
12072013 730 Laegeren forest 1 tower
03092013 1050 Laegeren forest 1 tower
5
2
Table 2 Availability of reference SIF760 data obtained from field spectroscopy measurements 6
to validate APEX based SIF760 retrievals 7
Date time [UTC] Location Measured crops Nr points
17062009 1030 Oensingen maize rye pea sugar beet wheat white clover 29 points
25062010 1030 Oensingen maize pea sugar beet wheat white clover 15 points
16062012 900 Oensingen carrot maize winter wheat 11 points
16062012 1100 Oensingen carrot maize winter wheat 10 points
8
3
Table 3 Goodness of fit for the hyperbolic model describing the relationship between GPPEC 9
and SIF760 O PRI and MCARI2 for the three ecosystem types perennial grassland cropland 10
and mixed temperate forest Calculated statistics are based on all data acquired from 2009-11
2013 as described in Table 1 12
Optical variable Ecosystem Regression coefficient Relative RMSE []
SIF crops 088 355
grass 059 2708
forest 048 1588
PRI crops 0008 1176
grass 095 860
forest 009 2179
MCARI2 crops 0005 1029
grass 098 550
forest 034 1798
13
1
Figures 1
2
Figure 1 Study sites A Oensingen agricultural site B Laegeren forest site The white 3
rectangles represent in A the boundary of investigated fields that comprise most of the flux-4
tower footprints and in B a coarse outline of the footprint area of the flux-tower The white 5
crosses show the locations of the flux-towers Background RGB images from Google-Earth 6
2
7
Figure 2 APEX reflectance and SIF760 image for the Oensingen site acquired on the 2606 8
2010 1030 UTC A top-of-canopy hemispherical-conical reflectance data as true color 9
composite B SIF760 map The white boxes indicate the approximate position of the flux 10
tower 11
3
12
Figure 3 APEX reflectance and SIF760 image for the Laegeren site acquired on the 2606 13
2010 1510 UTC A top-of-canopy hemispherical-conical reflectance data as true color 14
composite B SIF760 map The black arrows indicate the flight direction of flight line 1 to 3 15
(FL1-FL3) The white line marks a transect along the overlapping region of FL1 and FL2 The 16
white boxes indicate the approximate position of the flux tower 17
4
18
Figure 4 Relationships between GPPEC from the eddy-covariance measurements and SIF760 O 19
instantaneously measured between 2009 and 2013 (see Table 1) with the airborne 20
spectrometer APEX (A) PRI index (B) and MCARI2 index (C) for three vegetation types 21
(black dots perennial grassland dark grey rectangles cropland including winter wheat pea 22
and barley grey triangles mixed temperate forest) The solid curves correspond to a 23
hyperbolic model fitted to the measured data The dashed curves show the extrapolated 24
behavior 25
5
26
Figure 5 Daily light response curves from eddy flux measurements for A cropland B 27
perennial grassland and C mixed temperate forest Data were acquired between 2009 and 28
2013 (see Table 1) Grey curves represent a fitted hyperbolic model to approximate the 29
behavior of measured PAR-GPP values Crosses show GPPEC measurements that were used 30
for the SIF760 O - GPPEC comparison based on the time of APEX flights PAR values are 31
binned in 20 mW m-2
sr-1
nm-1
increments 32
6
33
Figure 6 Leaf level relationships between photosynthetic (LUEp) and fluorescence yield 34
(LUEf) for a typical C3 crop Dependency of LUEp (A) and LUEf (B) on APAR C 35
Relationship between LUEp and LUEf D Relationship between APAR and GPPL GPPL was 36
calculated as APARLUEp E Relationship between APAR and SIF760 SIF760 was calculated 37
as APARLUEf assuming a constant relationship between the SCOPE output SIFtotalL 38
(integral between 640-850nm) and SIF760L F Relationship between SIF760 L and GPPL All 39
data were simulated using SCOPE The grey areas indicate illumination conditions 40
comparable to APEX flights 41
7
42
Figure 7 Canopy level relationships between photosynthetic (LUEp) and fluorescence yield 43
(LUEf) for different canopy representations of a C3 cropland in SCOPE Dependency of 44
LUEp (A) and LUEf (B) on APAR LUEp was calculate as GPPCAPAR and LUEf was 45
directly obtained from SCOPE C Relationship between LUEp and LUEf D Relationship 46
between APAR and GPPC GPPC was directly obtained from SCOPE E Relationship 47
between APAR and SIF760C SIF760C was directly obtained from SCOPE F Relationship 48
between SIF760C and GPPC The black dashed line corresponds to a C3 cropland with LAI = 49
30 fraction of brown pigments (Cs) = 00 and a spherical (sp) leaf inclination distribution 50
function (LIDF) For the grey line Cs was changed to 20 for the black dashed line the LAI 51
was changed to 10 and for the grey dasheddotted line the LIDF was changed to plagiophile 52
(pg) The grey areas indicate illumination conditions comparable to APEX flights 53
8
54
Figure 8 Impact of temporal scaling on the SIF760C-GPPC relationship SIF760C and GPPC 55
data were simulated using SCOPE Model input parameters air temperature (A) PAR (B) and 56
LAI (C) were measured within the NitroEurope project (httpwwwnitroeuropeeu) at the 57
Speulderbos forest site Netherlands D Relationship between SIF760C and GPPC including a 58
fitted hyperbolic model for daily averages (grey dots and grey line) monthly averages (dark 59
grey triangles and line) and quarterly data (black dots and black dashed line) 60
9
61
Figure C1 Comparison of ground and airborne-based SIF760 retrievals from various crops 62
Data were acquired during four campaigns between 2009 and 2012 in the agricultural site 63
Oensingen (see Table 2) Left Fitted linear regression lines for the four considered campaigns 64
are overlaid in black The dashed line corresponds to the 11 line Right SIF retrievals from 65
APEX after applying an empirical correction factor (193) The black line represents the fitted 66
linear model the dashed line corresponds to the 11 line 67
13
within the canopy is calculated following Verhoef (1984) in the optical domain (SAIL) 301
following Verhoef et al (2007) in the thermal domain and Miller et al (2005) for the 302
fluorescence emissions (FluorSAIL) SCOPE requires a number of vegetation structural and 303
physiological parameters as well as weather information as input The model simulates GPP 304
and spectrally distributes SIF with a spectral resolution and a spectral sampling interval of 10 305
nm each Simulated PPFD values (micromol m-2 s-1) were also converted to radiance units (PAR) 306
We carried out three simulations using SCOPE In the first simulation we calculated 307
leaf level LUEf and LUEp of a typical C3 cropland as function of varying APAR For the 308
second simulation at canopy level we calculated LUEf and LUEp as function of varying 309
APAR for differently structured canopies We took the standard SCOPE parameters for a 310
typical C3 cropland and varied APAR and the structural parameters LAI leaf inclination 311
angle (LIDF) and the fraction of brown pigments (Cs) Both simulation experiments provide 312
theoretical evidence on the relationships between LUEf and LUEp between SIF760 and GPP 313
and their respective relationships to APAR For the third canopy level simulation SCOPE 314
was initialized using time series of mid-day (solar noon) meteorological data (PAR air 315
temperature) a seasonal cycle of LAI and the modelrsquos default soil and vegetation parameters 316
for a C3 cropland (cf the SCOPE user manual) The purpose of this simulation was to 317
evaluate seasonal SIF760-GPP relationships at various temporal aggregation levels For better 318
readability we use the following notation through the manuscript SIF760 O for APEX-SIF 319
SIF760 L and SIF760 C for SCOPE simulated leaf and canopy SIF GPPEC for flux tower GPP 320
and GPPL GPPC to relate to simulated GPP at leaf and canopy level 321
322
3 Results 323
31 SIF760 maps 324
14
Two examples of SIF760 O maps obtained from APEX are shown in Figures 2 and 3 325
The appearance of SIF760 O emissions in vegetated areas demonstrates that measured SIF760 O 326
signals originated solely from vegetation and were not contaminated by non-fluorescent non-327
vegetation surfaces Retrieved SIF760 O values range between 0 and 3 mW m-2 sr-1 nm-1 and 328
showed a high agreement (r2 = 07 rRMSE = 289) with in-situ measured reference data 329
Details of the SIF760 O validation are discussed in Appendix-C 330
331
lt Figure 2 gt 332
lt Figure 3gt 333
334
32 Relationships of GPPEC with SIF760 O PRI and MCARI2 335
Relating instantaneous measurements of SIF760 O and GPPEC from several years 336
revealed an asymptotic relationship with saturating GPPEC in presence of moderate to high 337
SIF760 O (Figure 4A Table 3) This general behavior was consistent for all investigated 338
vegetation types The fitted hyperbolic model shows a moderate to high goodness of fit for the 339
grassland (R2 = 059 rRMSE = 271) cropland (R2 = 088 rRMSE = 35) and forest (R2 = 340
048 rRMSE = 1588) The saturation of GPPEC appeared earlier for the cropland (SIF760 O 341
~05 mW m-2 sr-1 nm-1) than for the grassland and forest (SIF760 O gt 10 mW m-2 sr-1 nm-1) An 342
independent assessment considering a linear model to describe the relationship between 343
SIF760 O and GPPEC revealed a consistently lower goodness of fit justifying the use of a 344
hyperbolic model (data not shown) 345
Statistical analysis showed that a hyperbolic model represents well the relationship 346
between both vegetation indices (PRI and MCARI2) and GPPEC for the grassland with a 347
notable variation in LAI (range between 05 and 48 m2 m-2) However a hyperbolic model 348
does not allow well representing the relationship between PRI and MCARI2 with GPPEC for 349
the forest and cropland both showing only a small variation in LAI (less than plusmn03 m2 m-2) 350
15
(Figure 4B-C Table 3) The goodness of fit for the hyperbolic model describing the PRI and 351
GPPEC data for grassland (R2 = 095 rRMSE = 86) was even higher compared to SIF760 O 352
but lower for forest (R2 = 009 rRMSE = 2179) and cropland (R2 = 0008 rRMSE = 353
1176) With MCARI2 the goodness of fit for the hyperbolic model for grassland was high 354
(R2 = 098 rRMSE = 55) but low for cropland (R2 = 0005 rRMSE = 1029) and forest 355
(R2 = 034 rRMSE = 1798) Again considering a linear relationship between both 356
vegetation indices and GPPEC revealed no consistent improvement compared to the use of a 357
hyperbolic model (data not shown) 358
359
lt Figure 4 gt 360
lt Table 3 gt 361
362
33 Assessment of factors determining SIF760 GPPEC relationships 363
The asymptotic relationship between SIF760 O and GPPEC (Figure 4A) represented 364
instantaneous measurements of different canopies at different times and days over several 365
years covering a range of different light conditions phenological stages of the forest and 366
various amounts of green biomass for both investigated grasslands (crosses in Figure 5A-C 367
that indicate EC measurements during APEX overpasses) Relationships between SIF760 O and 368
GPPEC are consequently a complex function of light absorption in the canopy (APAR) of the 369
efficiency of light utilization (ie expressed as photosynthetic capacity and quantum 370
efficiency of photosynthesis) and of structural effects including fractions of non-371
photosynthetic vegetation components Both grass canopies were measured before and after 372
mowing resulting in a large range in LAI (05-48 m2 m-2) and GPPEC (4-27 micromol m-2 s-1) for 373
similar PAR values The forest LAI of 50 m2 m-2 was more constant over the years due to the 374
consistent timing of flights however senescence (eg lower canopy chlorophyll content and 375
light absorption) might explain the decrease in GPPEC of 15 micromol m-2 s-1 in September for 376
16
comparable irradiance conditions (Figure 5C) Investigated crops (winter wheat barley and 377
pea) were characterized by small variations in LAI (22-25 m2 m-2) and chlorophyll contents 378
corresponding to small variations in GPPEC (5 micromol m-2 s-1) while observed under comparable 379
irradiance conditions During the time of observation the barley and wheat canopies were in 380
the ripening phase with a pronounced ear layer 381
382
lt Figure 5 gt 383
384
The validity of the asymptotic relationship between SIF760 O and GPPEC was tested 385
using simulations made with the SCOPE model We emphasize that the regression coefficient 386
b in Eq (6) includes terms that vary in the model (b= cmiddotLUEfmiddotfesc) the fluorescence efficiency 387
LUEf varies with irradiance conditions (predominantly APAR) the fraction fesc depends on 388
vegetation structure while c=GPPmaxLUEpmax varies between sites and over time during the 389
season We first analysed how LUEf and LUEp and consequently SIF760 and GPP vary at 390
leaf (ie SIF760 L and GPPL) and canopy levels (ie SIF760 C and GPPC) using the model of 391
van der Tol et al (2014) that is embedded in SCOPE For the leaf level Figure 6A shows a 392
decrease of LUEp with increasing APAR consistent with Eq (5) The relation between APAR 393
and LUEf appears more complex LUEf first increases with increasing APAR under low light 394
conditions reaches a climax at intermediate light and then decreases with increasing APAR 395
under higher APAR values (gt 50 mW m-2 sr-1 nm-1) (Figure 6B) The initial increase in LUEf 396
is caused by the decline in photochemical quenching of the excitons whereas the decrease of 397
LUEf is caused by the growing number of non-photochemical quenching traps that dissipate 398
light energy before it can be emitted as fluorescence light (van der Tol et al 2009a) It is 399
important to note that the range of LUEp is nearly an order of magnitude greater compared to 400
the range of LUEf (Figure 6C) Although LUEf is not constant we can still conclude that the 401
difference in both LUE terms causes an earlier saturation of leaf-level GPPL (Figure 6D) 402
17
compared to leaf-level SIF760 L (Figure 6E) with APAR leading to an asymptotic relationship 403
between SIF760 L and GPPL (Figure 6F) Our canopy level simulations confirm these trends 404
(Figure 7A-D) The in-field measured asymptotic relationships between SIF760 O and GPPEC 405
are consequently caused by the covariance of GPPEC and SIF760 O with APAR the 406
photosynthetic capacity with APAR and the different value ranges of LUEf and LUEp 407
Additionally our canopy level simulations suggest that structure impacts the SIF760 O - GPPEC 408
relationship Figure 7D shows an example that changing LAI leaf inclination angles or the 409
fraction of senescent plant material determine the curvature of the hyperbolic SIF760 C - GPPC 410
relationships 411
412
lt Figure 6 gt 413
lt Figure 7 gt 414
415
The modelled SIF760 LC - GPPLC curves (Figures 6D and 7D) also indicate that under 416
reduced light intensity GPP and SIF760 are almost linearly related while GPP tends to saturate 417
under higher light intensities Changes in APAR at canopy level are caused by either sun 418
elevation or in the case of a constant solar angle by canopy structure (ie shading fractional 419
vegetation cover) In complex structured canopies with many foliage layers the saturation of 420
GPP with APAR may not be observable because variations of APAR are less related to PAR 421
falling on the leaves but rather to the variation of leaf area exposed to light Model 422
simulations suggest that in complex canopies SIF760 saturates with APAR before GPP due to 423
fesc being lower with high APAR (data not shown) This structural effect reduces the curvature 424
of the hyperbolic leaf level GPPL- SIF760 L relationship at canopy level (compare Figures 6F 425
and 7F) Furthermore the effect of structure and APAR covary in time since canopy structure 426
(ie LAI) varies in concert with APAR during a seasonal cycle especially for crops We 427
18
expect that this covariance makes the relationship between GPP and SIF760 more linear at the 428
canopy level especially if observations are aggregated over time 429
To evaluate the structure related alleviation of the hyperbolic relationship between 430
SIF760 and GPP at canopy level in response to temporal aggregation we modelled an annual 431
course of GPPC and SIF760 C considering varying environmental conditions (Figure 8A-B) 432
ie PAR ranging from 0-500 mW m-2 sr-1 nm-1 air temperature ranging from 0-32degC using 433
data collected during 2009 at a Nitro-Europe flux tower site (Speulderbos The Netherlands) 434
and canopy properties ie LAI ranging from 15-30 m2 m-2 (Figure 8C) The LAI data are 435
synthetic but have a realistic seasonal cycle For daily noon values of modelled SIF760 C and 436
GPPC an asymptotic behaviour can be observed while GPPC tends to saturate compared to 437
SIF760 C The SIF760C-GPPC relationship tends to become linear when monthly or quarterly 438
averages are considered (Figure 8D) 439
440
lt Figure 8 gt 441
442
This visual trend can be confirmed by statistical measures for daily aggregated values 443
the hyperbolic model (rRMSE = 174 R2 = 070) performed slightly better than the linear 444
model (rRMSE = 185 r2 = 068) In case of monthly aggregated data both the hyperbolic 445
and linear models performed similarly while the linear model gave better results (RMSE = 446
90 r2 = 090) than the hyperbolic model (rRMSE = 94 R2 = 088) for quarterly aggregated 447
data 448
449
4 Discussion 450
Significant relationships between remotely measured SIF and ecosystem GPP have 451
been reported in the past (Frankenberg et al 2011 Guanter et al 2014) however sufficient 452
19
process understanding for using SIF as proxy for GPP across ecosystems is still limited 453
(Porcar-Castell et al 2014) Below we discuss how our observational and modeling 454
approaches help bridging the gap between mechanistic understanding at the leaf level and 455
ecosystem-specific observations and thus provide insights on mechanisms determining the 456
complex relationship between SIF and GPP 457
458
41 Insights from the observational approach 459
Our results showed ecosystem-specific asymptotic relationships between SIF760 O and 460
GPPEC for the three investigated ecosystems mixed temperate forest cropland and perennial 461
grassland The varying SIF-GPP relationships across ecosystems were consistent with results 462
recently reported from combined satellite observations and model predictions (Guanter et al 463
2012) Our results showed that the relationships of both tested vegetation indices PRI and 464
MCARI2 to GPPEC experienced a higher variability across ecosystems compared to SIF760 O 465
SIF760 O showed an ecosystem-specific and overall moderate to good relationship (R2 between 466
048 and 088) to GPPEC for the three ecosystems Both vegetation indices showed only strong 467
relationships for the grassland (R2 = 095 and 098) that notably changed in LAI during the 468
various observations It is important to note that we do not further elaborate on the underlying 469
mechanisms relating vegetation indices and GPPEC and that it is unclear if hyperbolic models 470
best describe their relationships to GPPEC based on mechanistic principles The intention of 471
evaluating the relationships between GPPEC and both vegetation indices was to provide a base 472
to judge the performance of SIF760 O in relation to these commonly used remote observations 473
The diversity of sampled conditions and used data sources provide further evidence on 474
the robustness of observed SIF760 O-GPPEC relationships Our measurements represent various 475
canopies characterized by different biomasses sampled over several years Although most 476
observations were acquired under similar light condition and physiological states a few 477
measurements represented lower light conditions and other physiological states This suggests 478
20
that observed relationships are rather robust across different representations of APAR LUEp 479
and LUEf Furthermore we use data from different sources ie four EC flux towers the 480
APEX imaging spectrometer and modeling at leaf and canopy levels to reduce the 481
uncertainties associated with each method of measurements and to get a better understanding 482
of the SIF760 O-GPPEC relationship at ecosystem level 483
Flux tower measurements are representative of a certain source area (footprint) from 484
the ecosystem which changes constantly based on wind direction and turbulent state of the 485
atmosphere Depending on the heterogeneity of the ecosystem GPPEC signals can vary in 486
response to changing footprints (Barcza et al 2009 Kljun et al 2004) although this variation 487
should be rather small if the vegetation is homogeneous Remote measurements of SIF760 are 488
likely representative of the upper layer of the ecosystem thus vertical canopy heterogeneity 489
potentially leads to a mismatch when compared to GPPEC which integrates over the different 490
layers of the ecosystems This is expected to be especially the case in structurally complex 491
ecosystems such as forests Although the upper layer in forest ecosystems substantially 492
contributes to the total rate of GPPEC there are still many layers of leaves or needles within 493
the canopy photosynthesizing at different rates depending on their sunshade exposure In 494
addition understory vegetation in forest ecosystems can significantly contribute to GPPEC at 495
different rates depending on the ecosystem and time of year Even homogeneous vegetation 496
canopies like crops or grasslands can show vertical heterogeneity This is especially the case 497
at peak biomass during ripening or senescence During such phenological stages the top layer 498
of cereal crops consists of less fluorescing components (ie ears) and cereal crops or 499
grasslands can contain a higher fraction of brown pigments resulting in low SIF760 O values 500
while the entire canopy can still produce high photosynthetic rates and thus GPPEC (Damm et 501
al 2010) Indeed most of the crops investigated in our study were in the ripening phase with a 502
pronounced ear layer 503
21
This resulted in relatively low SIF760 O values and in high GPPEC and thus in a more 504
pronounced asymptotic relationship (cf Figure 4A Figure 7F) compared to results reported 505
for other crops (Guanter et al 2013 Guanter et al 2014) Further research is needed to better 506
understand the impact of vertical heterogeneity on GPPEC and SIF760 observations and their 507
respective relationships 508
Despite the technical aspects causing variations in retrieved SIF760 O (refer to 509
Appendix-D for a detailed discussion) canopy structure causes inherent variations in 510
measured SIF760 values and thus impacts SIF760-GPP relationships The combination of 511
complex canopy architecture and the distribution of absorbing and scattering elements 512
determine vegetation canopies to act as photon traps (Knyazikhin et al 2013 Lewis and 513
Disney 2007) Parts of emitted SIF760 photons from inner-canopy leaves are re-absorbed 514
while others escape the canopy in direction of the sensor The probability of photons escaping 515
the canopy is a function of canopy structure which implies sensitivity to measured SIF760 516
intensities for canopy structure In Eq (2) this sensitivity was approximated with the term 517
fesc In our analysis we minimized the impact of fesc by observing always the same forest area 518
representative for the EC tower footprint In less complex structured crop and grass canopies 519
we expect fesc to be less important However future research is required to quantify the impact 520
of fesc and to propose strategies to compensate its influence on SIF760 retrievals 521
522
42 Insights from the modeling approach 523
From a theoretical point of view radiative energy loss competes with photochemistry 524
and non-radiative energy dissipation for absorbed photons Considering that GPP and SIF760 525
can be conceptualized according to Eqs (1) and (2) SIF760 must show under certain 526
environmental conditions a sensitivity to photochemistry (Porcar-Castell et al 2014 van der 527
Tol et al 2009a van der Tol et al 2009b) This relationship is confirmed by our observational 528
data and other studies at leaf (Amoros-Lopez et al 2008) and canopy levels (Damm et al 529
22
2010) Our modeling results however indicated that the relationship between LUEf and LUEp 530
is subject to change hence impacting the sensitivity of SIF760 to track changes in GPP 531
(Figures 6C and 7C) 532
The asymptotic relationship between SIF760 and GPP theoretically predicted and 533
observed at leaf and canopy levels can be related in particular to the different value ranges of 534
both efficiency terms (LUEp and LUEf) (Figures 6C and 7C) while a complex set of 535
mechanisms causes an ecosystem dependency for SIF760-GPP relationships The 536
photosynthetic capacity of the entire ecosystem in combination with its vertical heterogeneity 537
determines differences in GPP and SIF760 and thus the slope and curvature of their respective 538
relationships Furthermore the initial slope of the asymptotic SIF760 - GPP relationship which 539
has a value of LUEpmax(LUEfmiddotfesc) is determined by a combination of the photosynthetic 540
efficiency and canopy structure Canopy structure and related shadowing effects alter the 541
average light interception and quality at leaf level (Nobel et al 1993 Stewart et al 2003) and 542
consequently the overall productivity of the canopy In the case of reduced APAR caused by 543
canopy shadowing the overall apparent stress level in the canopy and consequently the rate 544
of certain photoprotective mechanisms such as non-radiative energy dissipation is reduced 545
(Cheng et al 2015 Demmig-Adams 1998 Niinemets et al 2003) and observed GPP and 546
SIF760 fall in a range where they are more linearly related (cf Figure 6F and 7F) In addition 547
canopy level simulations show that the fraction of senescent plant material impacts the 548
curvature of the hyperbolic relationship 549
Recent literature reports linear relationships between satellite-based SIF and modeled 550
GPP (Frankenberg et al 2011 Guanter et al 2012 Guanter et al 2014) while we found 551
asymptotic relationships Both results are not contradicting if one considers the temporal 552
aggregation applied to the data Our results are based on instantaneous measurements while 553
monthly averages were calculated for the satellite data to minimize noise effects (Frankenberg 554
et al 2011 Guanter et al 2014) It is known from previous research that temporal averaging 555
23
tends to linearize the response between GPP and APAR (Ruimy et al 1995) as saturating 556
light conditions tend to be only a small fraction of averaged diurnalmonthly data 557
Aggregating GPPEC and APAR over different time scales also showed this effect (data not 558
shown) Because of the rather linear relationship between SIF760 and APAR we expect that 559
temporal aggregation tends to linearize the SIF760-GPP relationship as well A recent study 560
presenting continuous measurements of GPP and SIF760 over a temperate deciduous forest 561
support this hypothesis (Yang et al 2015) The increasing number of experiments using 562
autonomous spectrometer systems in combination with flux towers (Balzarolo et al 2011) 563
will likely provide more experimental results that supports this finding Our simulations 564
provide further evidence that the covariance of structure and APAR during a seasonal cycle 565
additionally tends to linearize the relationship between GPP and SIF760 if observations are 566
aggregated over time 567
The dependency of SIF760-GPP relationships on temporal aggregation requires special 568
attention since it has implications on the usage of SIF to constrain GPP In principle 569
conclusions and results obtained from temporally aggregated and instantaneous measurements 570
are valid if consistently related to the underlying temporal aggregation level Generalizing 571
conclusions obtained at various aggregation levels bears the risk for mis-interpretations eg 572
when vegetation models are refined or empirically re-calibrated using observations or for 573
projections of GPP using observational SIF data 574
575
43 Requirements for the use of SIF to assess GPP across ecosystems 576
The changing relationship between SIF760 and GPPEC with vegetation type challenges 577
the usage of SIF760 as a robust constraint to estimate GPP Specific strategies are required to 578
account for ecosystem (or species) specific sensitivities of SIF in general and SIF760 in 579
particular This includes i) integration platforms to combine observations and process 580
24
understanding and ii) accurate observations of additional vegetation and environmental 581
variables 582
Process-based models as data integration platform in combination with comprehensive 583
observations to sufficiently measure important environmental factors and vegetation 584
properties are considered as flexible and powerful framework Parazoo et al (2014) for 585
example proposed the combination of ensemble dynamic global vegetation models (DGVMs) 586
in combination with SIF as observational constraint Lee et al (2015) suggest incorporating 587
SIF in a climate model to utilize SIF as observational constraint of photosynthesis simulations 588
and subsequent calculations of carbon water and energy cycle information Yet other studies 589
propose using SIF to obtain physiological vegetation parameters ie Vcmax for improved 590
parameterizations of photosynthesis models to eventually model GPP (Zhang et al 2014) The 591
European space agencys (ESA) Earth Explorer 8 opportunity mission Fluorescence Explorer 592
(FLEX) suggests a combination of comprehensive observations (ie SIF over the full 593
emission spectrum vegetation ecosystems and actual environmental conditions) and process-594
based models (Guanter et al 2012) 595
Additional information is required to use SIF in process-based models as one has to 596
account for varying photosynthetic efficiencies of plants and prevailing stress responses 597
According to the conceptualization of GPP and SIF as given in Eqs (1) and (2) extracting 598
and evaluating the exact relationship between LUEp and LUEf is essential but requires 599
normalizing APAR and calculating both yields (Damm et al 2010 Govindjee 2004 Louis et 600
al 2005) Retrievals of APAR can be considered challenging (Garbulsky et al 2010 Gitelson 601
and Gamon 2015 Hanan et al 2002) as available approaches often utilize a-priori knowledge 602
of prevailing land cover or plant distribution functions and rely on the inversion of physical-603
based models or simple band ratios (Hilker et al 2008) Research is required to provide high 604
quality information on APAR not perturbed by light absorption of non-photosynthetic active 605
25
canopy elements (stems branches twigs) cf Zhang et al (2013 2012) that demonstrate 606
attempts to improve estimates of APAR 607
Observed SIF760 O - GPPEC relationships are additionally confounded by non-radiative 608
energy dissipation The PRI was designed to monitor pigment changes related to the 609
xanthophyll cycle (Gamon et al 1992) and provides access to this superimposing process 610
However reported sensitivities of PRI for other effects ie structure (Barton and North 611
2001) pigment pool sizes (Gamon and Berry 2012) illumination effects (Damm et al 2015) 612
and the results obtained in this study question the applicability of the PRI at canopy level 613
Alternative approaches such as the development of a canopy PRI as suggested by several 614
groups (Hernandez-Clemente et al 2011 Kovac et al 2013 Wu et al 2010) or the usage of 615
pigment compositions and other functional plant traits might represent interesting strategies 616
and should be elaborated in future research 617
Structural sensitivities of canopy leaving SIF signals are critical and require further 618
research The application of spectrally invariant correction factors eg the directional area 619
scattering factor (Knyazikhin et al 2013) or more advanced physically-based retrieval 620
schemes using combined atmosphere-canopy models (Damm et al 2015 Laurent et al 2013) 621
might provide potential strategies to compensate for canopy structural effects on retrieved 622
SIF760 623
Another important source of information that allows improving the usage of SIF as 624
constraint of GPP is to consider SIF emissions over the entire emission spectrum between 625
approximately 600 and 800 nm Recent research successfully demonstrated the 626
complementary information content of red-fluorescence retrieved in the O2-B band at 688 nm 627
(SIF688) compared to SIF760 because of the different contributions from photosystem I and II 628
(Rossini et al 2015) Yet other studies highlighted the potential to improve predictions of 629
LUEp and GPP using both SIF688 and SIF760 (Cheng et al 2013) 630
631
26
5 Conclusions 632
Remote sensing of SIF provides a new observational approach to assess terrestrial 633
GPP Compared to traditional greenness-based remote sensing parameters we found SIF760 to 634
be more consistently related to GPPEC These results in combination with the more direct 635
mechanistic link between SIF760 and photosynthesis suggest that using SIF760 provides a 636
strategy to decrease uncertainty in estimating GPP across ecosystems 637
Our observational and modeling approaches revealed asymptotic and ecosystem-638
specific relationships for SIF760 and GPPEC We identified a set of interlinked mechanisms 639
determining SIF760-GPPEC relationships to be ecosystem specific ie the photosynthetic 640
capacity and efficiency of ecosystems the confounding impact of non-radiative energy 641
dissipation (NPQ) as well as ecosystem structure and the fraction of non-photosynthetic 642
vegetation components We demonstrated that SIF760-GPPEC relationships scale with temporal 643
aggregation due to a covariance of canopy structure and APAR over the seasonal cycle 644
We suggest going beyond empirical and ecosystem-specific relationships instead 645
using instantaneous observations comprehensively providing information on the full SIF 646
emission vegetation status and functioning as well as environmental conditions in 647
combination with process-based models Such approaches eg suggested for ESArsquos potential 648
ldquoFluorescence Explorerrdquo (FLEX) Earth Explorer mission provide a flexible framework to 649
account for the various influencing factors identified and to successfully apply SIF as 650
constraint of unbiased global GPP estimates 651
Furthermore research is required to improve the comparison between observations of 652
GPPEC and SIF Both observations stem from conceptually contrasting technologies ie 653
measurements of gas exchange vs plant-light interactions and provide independent and 654
complementary access to study ecosystem photosynthesis Despite the need to harmonize 655
horizontally differing footprints the vertical heterogeneity of ecosystems including the 656
27
varying contributions from different ecosystem layers must be better understood to harmonize 657
and successfully integrate both measurements 658
659
Acknowledgements 660
This work was supported by a grant of the Swiss University Conference and ETH-661
Board in frame of the Swiss Earth Observatory Network (SEON) project and by a grant of the 662
European Space Agency (ESA) in frame of the FLEX-PARCS E Paul-Limoges was 663
supported in part by the Natural Sciences and Engineering Research Council of Canada 664
through a postgraduate scholarship We would like to thank the APEX team for acquiring the 665
APEX data Authors sequence is listed following the FLAE approach (doi 666
101371journalpbio0050018) 667
28
References 668
Ammann C Flechard CR Leifeld J Neftel A amp Fuhrer J (2007) The carbon budget of 669
newly established temperate grassland depends on management intensity Agriculture 670
Ecosystems amp Environment 121 5-20 671
Amoros-Lopez J Gomez-Chova L Vila-Frances J Alonso L Calpe J Moreno J amp 672
del Valle-Tascon S (2008) Evaluation of remote sensing of vegetation fluorescence by 673
the analysis of diurnal cycles International Journal of Remote Sensing 29 5423-5436 674
Baker NR (2008) Chlorophyll Fluorescence A probe of photosynthesis in vivo Annual 675
Review of Plant Physiology and Plant Molecular Biology 59 89-113 676
Baldocchi D Falge E Gu LH Olson R Hollinger D Running S Anthoni P 677
Bernhofer C Davis K Evans R Fuentes J Goldstein A Katul G Law B Lee 678
XH Malhi Y Meyers T Munger W Oechel W U KTP Pilegaard K Schmid 679
HP Valentini R Verma S Vesala T Wilson K amp Wofsy S (2001) FLUXNET A 680
new tool to study the temporal and spatial variability of ecosystem-scale carbon dioxide 681
water vapor and energy flux densities Bulletin of the American Meteorological Society 682
82 2415-2434 683
Baldocchi DD (2003) Assessing the eddy covariance technique for evaluating carbon 684
dioxide exchange rates of ecosystems past present and future Global Change Biology 9 685
479-492 686
Balzarolo M Anderson K Nichol C Rossini M Vescovo L Arriga N Wohlfahrt G 687
Calvet J-C Carrara A Cerasoli S Cogliati S Daumard F Eklundh L Elbers JA 688
Evrendilek F Handcock RN Kaduk J Klumpp K Longdoz B Matteucci G 689
Meroni M Montagnani L Ourcival J-M Sanchez-Canete EP Pontailler J-Y 690
Juszczak R Scholes B amp Pilar Martin M (2011) Ground-Based Optical Measurements 691
at European Flux Sites A Review of Methods Instruments and Current Controversies 692
Sensors 11 7954-7981 693
Barcza Z Kern A Haszpra L amp Kljun N (2009) Spatial representativeness of tall tower 694
eddy covariance measurements using remote sensing and footprint analysis Agricultural 695
and Forest Meteorology 149 795-807 696
Barton CVM amp North PRJ (2001) Remote sensing of canopy light use efficiency using 697
the photochemical reflectance index - Model and sensitivity analysis Remote Sensing of 698
Environment 78 264-273 699
Beer C Reichstein M Tomelleri E Ciais P Jung M Carvalhais N Roedenbeck C 700
Arain MA Baldocchi D Bonan GB Bondeau A Cescatti A Lasslop G Lindroth 701
29
A Lomas M Luyssaert S Margolis H Oleson KW Roupsard O Veenendaal E 702
Viovy N Williams C Woodward FI amp Papale D (2010) Terrestrial Gross Carbon 703
Dioxide Uptake Global Distribution and Covariation with Climate Science 329 834-838 704
Berk A Anderson GP Acharya PK Bernstein LS Muratov L Lee J Fox M 705
Adler-Golden SM Chetwynd JH Hoke ML Lockwood RB Gardner JA Cooley 706
TW Borel CC amp Lewis PE (2005) MODTRAN5 A reformulated atmospheric band 707
model with auxiliary species and practical multiple scattering options Proceedings of the 708
Society of Photo-Optical Instrumentation Engineer 5655 662-667 709
Cheng SJ Bohrer G Steiner AL Hollinger DY Suyker A Phillips RP amp 710
Nadelhoffer KJ (2015) Variations in the influence of diffuse light on gross primary 711
productivity in temperate ecosystems Agricultural and Forest Meteorology 201 98-110 712
Cheng Y-B Middleton EM Zhang Q Huemmrich KF Campbell PKE Corp LA 713
Cook BD Kustas WP amp Daughtry CS (2013) Integrating Solar Induced 714
Fluorescence and the Photochemical Reflectance Index for Estimating Gross Primary 715
Production in a Cornfield Remote Sensing 5 6857-6879 716
Collatz GJ Ball JT Grivet C amp Berry JA (1991) Physiological and environmental-717
regulation of stomatal conductance photosynthesis and transpiration - a model that 718
includes a laminar boundary-layer Agricultural and Forest Meteorology 54 107-136 719
DOdorico P Alberti E amp Schaepman ME (2010) In-flight spectral performance 720
monitoring of the Airborne Prism Experiment Applied Optics 49 3082-3091 721
DOdorico P Guanter L Schaepman ME amp Schlaumlpfer D (2011) Performance 722
assessment of onboard and scene-based methods for Airborne Prism Experiment spectral 723
characterization Applied Optics 50 4755-4764 724
Damm A Erler A Gioli B Hamdi K Hutjes R Kosvancova M Meroni M 725
Miglietta F Moersch A Moreno J Schickling A Sonnenschein R Udelhoven T 726
Van der Linden S Hostert P amp Rascher U (2010) Remote sensing of sun induced 727
fluorescence yield to improve modelling of diurnal courses of Gross Primary Production 728
(GPP) Global Change Biology 16 171-186 729
Damm A Erler A Hillen W Meroni M Schaepman ME Verhoef W amp Rascher U 730
(2011) Modeling the impact of spectral sensor configurations on the FLD retrieval 731
accuracy of sun-induced chlorophyll fluorescence Remote Sensing of Environment 115 732
1882-1892 733
Damm A Guanter L Laurent VCE Schaepman ME Schickling A amp Rascher U 734
(2014) FLD-based retrieval of sun-induced chlorophyll fluorescence from medium 735
30
spectral resolution airborne spectroscopy data Remote Sensing of Environment 147 256-736
266 737
Damm A Guanter L Verhoef W Schlaumlpfer D Garbari S amp Schaepman ME (2015) 738
Impact of varying irradiance on vegetation indices and chlorophyll fluorescence derived 739
from spectroscopy data Remote Sensing of Environment 156 202-215 740
Demmig-Adams B (1998) Survey of thermal energy dissipation and pigment composition in 741
sun and shade leaves Plant and Cell Physiology 39 474-482 742
Drolet GG Middleton EM Huemmrich KF Hall FG Amiro BD Barr AG Black 743
TA McCaughey JH amp Margolis HA (2008) Regional mapping of gross light-use 744
efficiency using MODIS spectral indices Remote Sensing of Environment 112 3064-3078 745
Eugster W amp Senn W (1995) A cospectral correction model for measurement of turbulent 746
NO2 fluxes Boundary-Layer Meteorology 74 321-340 747
Eugster W Zeyer K Zeeman M Michna P Zingg A Buchmann N amp Emmenegger 748
L (2007) Methodical study of nitrous oxide eddy covariance measurements using 749
quantum cascade laser spectrometery over a Swiss forest Biogeosciences 4 927-939 750
Falge E Baldocchi D Olson R Anthoni P Aubinet M Bernhofer C Burba G 751
Ceulemans R Clement R Dolman H Granier A Gross P Grunwald T Hollinger 752
D Jensen NO Katul G Keronen P Kowalski A Lai CT Law BE Meyers T 753
Moncrieff H Moors E Munger JW Pilegaard K Rannik U Rebmann C Suyker 754
A Tenhunen J Tu K Verma S Vesala T Wilson K amp Wofsy S (2001) Gap 755
filling strategies for defensible annual sums of net ecosystem exchange Agricultural and 756
Forest Meteorology 107 43-69 757
Falloon P amp Betts R (2010) Climate impacts on European agriculture and water 758
management in the context of adaptation and mitigation-The importance of an integrated 759
approach Science of the Total Environment 408 5667-5687 760
Foken T amp Wichura B (1996) Tools for quality assessment of surface-based flux 761
measurements Agricultural and Forest Meteorology 78 83-105 762
Fournier A Daumard F Champagne S Ounis A Goulas Y amp Moya I (2012) Effect 763
of canopy structure on sun-induced chlorophyll fluorescence Isprs Journal of 764
Photogrammetry and Remote Sensing 68 112-120 765
Frankenberg C Fisher JB Worden J Badgley G Saatchi SS Lee JE Toon GC 766
Butz A Jung M Kuze A amp Yokota T (2011) New global observations of the 767
terrestrial carbon cycle from GOSAT Patterns of plant fluorescence with gross primary 768
productivity Geophysical Research Letters 38 769
31
Gamon JA amp Berry JA (2012) Facultative and constitutive pigment effects on the 770
Photochemical Reflectance Index (PRI) in sun and shade conifer needles Israel Journal of 771
Plant Sciences 60 85-95 772
Gamon JA Coburn C Flanagan LB Huemmrich KF Kiddle C Sanchez-Azofeifa 773
GA Thayer DR Vescovo L Gianelle D Sims DA Rahman AF amp Pastorello 774
GZ (2010) SpecNet revisited bridging flux and remote sensing communities Canadian 775
Journal of Remote Sensing 36 S376-S390 776
Gamon JA Penuelas J amp Field CB (1992) A narrow-waveband spectral index that 777
tracks diurnal changes in photosynthetic efficiency Remote Sensing of Environment 41 778
35-44 779
Garbulsky MF Filella I Verger A amp Penuelas J (2014) Photosynthetic light use 780
efficiency from satellite sensors From global to Mediterranean vegetation Environmental 781
and Experimental Botany 103 3-11 782
Garbulsky MF Penuelas J Papale D Ardo J Goulden ML Kiely G Richardson 783
AD Rotenberg E Veenendaal EM amp Filella I (2010) Patterns and controls of the 784
variability of radiation use efficiency and primary productivity across terrestrial 785
ecosystems Global Ecology and Biogeography 19 253-267 786
Gege P Fries J Haschberger P Schoumltz P Schwarzer H Strobl P Suhr B Ulbrich 787
G amp Vreeling WJ (2009) Calibration facility for airborne imaging spectrometers 788
ISPRS Journal of Photogrammetry amp Remote Sensing 64 387ndash397 789
Gitelson AA amp Gamon JA (2015) The need for a common basis for defining light-use 790
efficiency Implications for productivity estimation Remote Sensing of Environment 156 791
196-201 792
Goetz SJ amp Prince SD (1999) Modelling terrestrial carbon exchange and storage 793
Evidence and implications of functional convergence in light-use efficiency Advances in 794
Ecological Research Vol 28 (pp 57-92) 795
Govindjee (2004) Chlorophyll a fluorescence A bit of basics and history In GC 796
Papageorgiou amp Govindjee (Eds) Chlorophyll a Fluorescence A Signature of 797
Photosynthesis Advances in Photosynthesis and Respiration (pp 1-42) Dordrecht 798
Springer 799
Guanter L Alonso L Gomez-Chova L Amoros-Lopez J Vila J amp Moreno J (2007) 800
Estimation of solar-induced vegetation fluorescence from space measurements 801
Geophysical Research Letters 34 doi 1010292007GL029289 802
32
Guanter L Alonso L Gomez-Chova L Meroni M Preusker R Fischer J amp Moreno 803
J (2010) Developments for vegetation fluorescence retrieval from spaceborne high-804
resolution spectrometry in the O2-A and O2-B absorption bands Journal of Geophysical 805
Research-Atmospheres 115 806
Guanter L Frankenberg C Dudhia A Lewis PE Goacutemez-Dans J Kuze A Suto H amp 807
Grainger R (2012) Retrieval and global assessment of terrestrial chlorophyll fluorescence 808
from GOSAT space measurements Remote Sensing of Environment 121 236-251 809
Guanter L Rossini M Colombo R Meroni M Frankenberg C Lee J-E amp Joiner J 810
(2013) Using field spectroscopy to assess the potential of statistical approaches for the 811
retrieval of sun-induced chlorophyll fluorescence from ground and space Remote Sensing 812
of Environment 133 52-61 813
Guanter L Zhang Y Jung M Joiner J Voigt M Berry JA Frankenberg C Huete 814
AR Zarco-Tejada P Lee J-E Moran MS Ponce-Campos G Beer C Camps-815
Valls G Buchmann N Gianelle D Klumpp K Cescatti A Baker JM amp Griffis 816
TJ (2014) Global and time-resolved monitoring of crop photosynthesis with chlorophyll 817
fluorescence Proceedings of the National Academy of Sciences of the United States of 818
America 111 E1327-E1333 819
Haboudane D Miller JR Pattey E Zarco-Tejada PJ amp Strachan IB (2004) 820
Hyperspectral vegetation indices and novel algorithms for predicting green LAI of crop 821
canopies Modeling and validation in the context of precision agriculture Remote Sensing 822
of Environment 90 337-352 823
Hanan NP Burba G Verma SB Berry JA Suyker A amp Walter-Shea EA (2002) 824
Inversion of net ecosystem CO2 flux measurements for estimation of canopy PAR 825
absorption Global Change Biology 8 563-574 826
Hernandez-Clemente R Navarro-Cerrillo RM Suarez L Morales F amp Zarco-Tejada 827
PJ (2011) Assessing structural effects on PRI for stress detection in conifer forests 828
Remote Sensing of Environment 115 2360-2375 829
Hilker T Coops NC Wulder MA Black TA amp Guy RD (2008) The use of remote 830
sensing in light use efficiency based models of gross primary production A review of 831
current status and future requirements Science of the Total Environment 404 411-423 832
Hilker T Gitelson A Coops NC Hall FG amp Black TA (2011) Tracking plant 833
physiological properties from multi-angular tower-based remote sensing Oecologia 165 834
865-876 835
33
Hilker T Lyapustin A Hall FG Wang Y Coops NC Drolet G amp Black TA 836
(2009) An assessment of photosynthetic light use efficiency from space Modeling the 837
atmospheric and directional impacts on PRI reflectance Remote Sensing of Environment 838
113 2463-2475 839
Hueni A Biesemans J Meuleman K DellEndice F Schlaumlpfer D Adriaensen S 840
Kempenaers S Odermatt D Kneubuehler M Nieke J amp Itten K (2009) Structure 841
Components and Interfaces of the Airborne Prism Experiment (APEX) Processing and 842
Archiving Facility IEEE Transactions on Geoscience and Remote Sensing 47 29-43 843
Hueni A Lenhard K Baumgartner A amp Schaepman M (2013) The APEX (Airborne 844
Prism Experiment - Imaging Spectrometer) Calibration Information System IEEE 845
Transactions on Geoscience and Remote Sensing 51 5169-5180 846
Hueni A Schlaepfer D Jehle M amp Schaepman M (2015) Impacts of Dichroic Prism 847
Coatings on Radiometry of the Airborne Imaging Spectrometer APEX Applied Optics 53 848
5344-5352 849
Imhoff ML Bounoua L Ricketts T Loucks C Harriss R amp Lawrence WT (2004) 850
Global patterns in human consumption of net primary production Nature 429 870-873 851
IPCC (2013) Summary for policymakers Climate change 2013 the physical science basis 852
Cambridge University Press Cambridge United Kingdom and New York NY USA 853
Jacquemoud S amp Baret F (1990) PROSPECT A model of leaf optical properties spectra 854
Remote Sensing of Environment 34 75-91 855
Jehle M Hueni A Damm A DOdorico P Kneubuumlhler M Meuleman K Schlapfer 856
D Schaepman ME amp Weyermann J (2010) APEX - current status performance and 857
validation concept IEEE Sensors 2010 Conference 533-537 858
Joiner J Guanter L Lindstrot R Voigt M Vasilkov AP Middleton EM Huemmrich 859
KF Yoshida Y amp Frankenberg C (2013) Global monitoring of terrestrial chlorophyll 860
fluorescence from moderate spectral resolution near-infrared satellite measurements 861
methodology simulations and application to GOME-2 Atmos Meas Tech Discuss 6 862
3883-3930 863
Jung M Reichstein M Margolis HA Cescatti A Richardson AD Arain MA 864
Arneth A Bernhofer C Bonal D Chen J Gianelle D Gobron N Kiely G Kutsch 865
W Lasslop G Law BE Lindroth A Merbold L Montagnani L Moors EJ 866
Papale D Sottocornola M Vaccari F amp Williams C (2011) Global patterns of land-867
atmosphere fluxes of carbon dioxide latent heat and sensible heat derived from eddy 868
34
covariance satellite and meteorological observations Journal of Geophysical Research-869
Biogeosciences 116 870
Kljun N Kastner-Klein P Fedorovich E amp Rotach MW (2004) Evaluation of 871
Lagrangian footprint model using data from wind tunnel convective boundary layer 872
Agricultural and Forest Meteorology 127 189-201 873
Kljun N Rotach MW amp Schmid HP (2002) A three-dimensional backward lagrangian 874
footprint model for a wide range of boundary-layer stratifications Boundary-Layer 875
Meteorology 103 205-226 876
Knyazikhin Y Schull MA Stenberg P Mottus M Rautiainen M Yang Y Marshak 877
A Latorre Carmona P Kaufmann RK Lewis P Disney MI Vanderbilt V Davis 878
AB Baret F Jacquemoud S Lyapustin A amp Myneni RB (2013) Hyperspectral 879
remote sensing of foliar nitrogen content Proceedings of the National Academy of 880
Sciences of the United States of America 110 E185-E192 881
Kovac D Malenovsky Z Urban O Spunda V Kalina J Ac A Kaplan V amp Hanus 882
J (2013) Response of green reflectance continuum removal index to the xanthophyll de-883
epoxidation cycle in Norway spruce needles Journal of Experimental Botany 64 1817-884
1827 885
Krausmann F Erb K-H Gingrich S Haberl H Bondeau A Gaube V Lauk C 886
Plutzar C amp Searchinger TD (2013) Global human appropriation of net primary 887
production doubled in the 20th century Proceedings of the National Academy of Sciences 888
of the United States of America 110 10324-10329 889
Lasslop G Reichstein M Papale D Richardson AD Arneth A Barr A Stoy P amp 890
Wohlfahrt G (2010) Separation of net ecosystem exchange into assimilation and 891
respiration using a light response curve approach critical issues and global evaluation 892
Global Change Biology 16 187-208 893
Laurent VCE Verhoef W Damm A Schaepman ME amp Clevers JGPW (2013) A 894
Bayesian object-based approach for estimating vegetation biophysical variables from at-895
sensor APEX radiance data Remote Sensing of Environment 139 6-17 896
Lee JE Berry JA Van der Tol C Yang X Guanter L Damm A Baker I amp 897
Frankenberg C (2015) Simulations of chlorophyll fluorescence in corporated into the 898
Community Land Model version 4 Global Change Biology in print 899
Lewis P amp Disney M (2007) Spectral invariants and scattering across multiple scales from 900
within-leaf to canopy Remote Sensing of Environment 109 196-206 901
35
Liu LY amp Cheng ZH (2010) Detection of Vegetation Light-Use Efficiency Based on 902
Solar-Induced Chlorophyll Fluorescence Separated From Canopy Radiance Spectrum Ieee 903
Journal of Selected Topics in Applied Earth Observations and Remote Sensing 3 306-312 904
Louis J Ounis A Ducruet JM Evain S Laurila T Thum T Aurela M Wingsle G 905
Alonso L Pedros R amp Moya I (2005) Remote sensing of sunlight-induced chlorophyll 906
fluorescence and reflectance of Scots pine in the boreal forest during spring recovery 907
Remote Sensing of Environment 96 37-48 908
Maier SW Guumlnther KP amp Stellmes M (2003) Sun-Induced Fluorescence A New Tool 909
for Precision Farming In M McDonald J Schepers L Tartly T van Toai amp D Major 910
(Eds) Digital Imaging and Spectral Techniques Applications to Precision Agriculture 911
and Crop Physiology (pp 209-222) ASA Special Publication 912
Mauder M Foken T Clement R Elbers JA Eugster W Gruenwald T Heusinkveld 913
B amp Kolle O (2008) Quality control of CarboEurope flux data - Part 2 Inter-914
comparison of eddy-covariance software Biogeosciences 5 451-462 915
Meroni M Busetto L Guanter L Cogliati S Crosta GF Migliavacca M Panigada 916
C Rossini M amp Colombo R (2010) Characterization of fine resolution field 917
spectrometers using solar Fraunhofer lines and atmospheric absorption features Applied 918
Optics 49 2858-2871 919
Meroni M Picchi V Rossini M Cogliati S Panigada C Nali C Lorenzini G amp 920
Colombo R (2008) Leaf level early assessment of ozone injuries by passive fluorescence 921
and photochemical reflectance index International Journal of Remote Sensing 29 5409-922
5422 923
Meroni M Rossini M Guanter L Alonso L Rascher U Colombo R amp Moreno J 924
(2009) Remote sensing of solar induced chlorophyll fluorescence review of methods and 925
applications Remote Sensing of Environment doi101016jrse200905003 926
Michaelis L amp Menten ML (1913) The kenetics of the inversion effect Biochemische 927
Zeitschrift 49 333-369 928
Middleton E McMurtney JE Campbell PK Corp LA Butcher LM amp Chappelle 929
EW (2002) Optical and fluorescence properties of corn leaves from different nitrogen 930
regimes In M Owe G Durso amp L Toulios (Eds) Conference on Remote Sensing for 931
Agriculture Ecosystems and Hydrology IV (pp 72-83) Agia Pelagia Greece 932
Miller JR Berger M Goulas Y Jacquemoud S Louis J Moise N Mohammed G 933
Moreno J Moya I Pedroacutes R Verhoef W amp Zarco-Tejada PJ (2005) Development 934
36
of a vegetation fluorescence canopy model Final Report May 2005 In European Space 935
Research and Technology Centre (ESTEC) 936
Monteith JL (1972) Solar-radiation and productivity in tropical ecosystems Journal of 937
Applied Ecology 9 747-766 938
Niinemets U Kollist H Garcia-Plazaola JI Hernandez A amp Becerril JM (2003) Do 939
the capacity and kinetics for modification of xanthophyll cycle pool size depend on growth 940
irradiance in temperate trees Plant Cell and Environment 26 1787-1801 941
Nobel PS Forseth IN amp Long SP (1993) Canopy structure and light interception 942
Ozanne CMP Anhuf D Boulter SL Keller M Kitching RL Korner C Meinzer 943
FC Mitchell AW Nakashizuka T Dias PLS Stork NE Wright SJ amp 944
Yoshimura M (2003) Biodiversity meets the atmosphere A global view of forest 945
canopies Science 301 183-186 946
Parazoo NC Bowman K Fisher JB Frankenberg C Jones DBA Cescatti A Peacuterez-947
Priego Oacute Wohlfahrt G amp Montagnani L (2014) Terrestrial gross primary production 948
inferred from satellite fluorescence and vegetation models Global Change Biology na-na 949
Plascyk JA (1975) MK II Fraunhofer Line Dicsriminator (FLD-II) for airborne and orbital 950
remote-sensing of solar-stimulated luminescence Optical Engineering 14 339-346 951
Porcar-Castell A Tyystjaumlrvi E Atherton J Van der Tol C Flexas J EE P Moreno 952
J Frankenberg C amp Berry JA (2014) Linking chlorophyll a fluorescence to 953
photosynthesis for remote sensing applications mechanisms and challenges Journal of 954
Experimental Botany 65 4065-4095 955
Rascher U Agati G Alonso L Cecci G Champagne S Colombo R Damm A 956
Daumard F De Miguel E Fernandez G Franch B Franke J Gerbig C Gioli B 957
Gomez JA Goulas Y Guanter L Gutierrez-De-La-Camara O Hamdi K Hostert 958
P Jimenez M Kosvancova M Lognoli D Meroni M Miglietta F Moersch A 959
Moreno J Moya I Neininger B Okujeni A Ounis A Palombi L Raimondi V 960
Schickling A Sobrino JA Stellmes M Toci G Toscano P Udelhoven T Van der 961
Linden S amp Zaldei A (2009) CEFLES2 The remote sensing component to quantify 962
photosynthetic efficiency from the leaf to the region by measuring sun-induced 963
fluorescence in the oxygen absorption bands Biogeosciences 6 1181-1198 964
Richter R amp Schlaumlpfer D (2002) Geo-atmospheric processing of airborne imaging 965
spectrometry data Part 2 Atmospherictopographic correction International Journal of 966
Remote Sensing 23 2631-2649 967
37
Rossini M Meroni M Migliavacca M Manca G Cogliati S Busetto L Picchi V 968
Cescatti A Seufert G amp Colombo R (2010) High resolution field spectroscopy 969
measurements for estimating gross ecosystem production in a rice field Agricultural and 970
Forest Meteorology 150 1283-1296 971
Rossini M Nedbal L Guanter L Ač A Alonso L Burkart A Cogliati S Colombo 972
R Damm A Drusch M Hanus J Julitta T Kokkalis P Moreno J Panigada C 973
Pinto F Schickling A Schuumlttemeyer D Zemek F amp Rascher U (2015) Red and far-974
red sun-induced chlorophyll fluorescence as a measure of plant photosynthesis 975
Geophysical Research Letters (accepted for publication) 976
Ruimy A Jarvis PG Baldocchi DD amp B S (1995) CO2 Fluxes over Plant Canopies 977
and Solar Radiation A Review Advances in Ecological Research 26 1-68 978
Running SW Nemani RR Heinsch FA Zhao MS Reeves M amp Hashimoto H 979
(2004) A continuous satellite-derived measure of global terrestrial primary production 980
Bioscience 54 547-560 981
Schaepman ME M J Hueni A DrsquoOdorico P Damm A Weyermann J Schneider F 982
Laurent VCE C P Seidel F Lenhard K Gege P Kuechler C Brazile J Kohler 983
P De Vos L Meuleman K Meynart R Schlaepfer D Kneubuumlhler M amp Itten K 984
(2015) Advanced radiometry measurements and Earth science applications with the 985
Airborne Prism Experiment (APEX) Remote Sensing of Environment 158 207-219 986
Schimel D Pavlick R Fisher JB Asner GP Saatchi S Townsend P Miller C 987
Frankenberg C Hibbard K amp Cox P (2014) Observing terrestrial ecosystems and the 988
carbon cycle from space Global Change Biology na-na 989
Schlaumlpfer D amp Richter R (2002) Geo-atmospheric processing of airborne imaging 990
spectrometry data Part 1 Parametric orthorectification International Journal of Remote 991
Sensing 23 2609-2630 992
Schneider FD Leiterer R Morsdorf F Gastellu-Etchegorry J-P Lauret N Pfeifer N 993
amp Schaepman ME (2014) Simulating imaging spectrometer data 3D forest modeling 994
based on LiDAR and in situ data Remote Sensing of Environment 152 235-250 995
Schroter D Cramer W Leemans R Prentice IC Araujo MB Arnell NW Bondeau 996
A Bugmann H Carter TR Gracia CA de la Vega-Leinert AC Erhard M Ewert 997
F Glendining M House JI Kankaanpaa S Klein RJT Lavorel S Lindner M 998
Metzger MJ Meyer J Mitchell TD Reginster I Rounsevell M Sabate S Sitch 999
S Smith B Smith J Smith P Sykes MT Thonicke K Thuiller W Tuck G 1000
38
Zaehle S amp Zierl B (2005) Ecosystem service supply and vulnerability to global change 1001
in Europe Science 310 1333-1337 1002
Sitch S Smith B Prentice IC Arneth A Bondeau A Cramer W Kaplan JO Levis 1003
S Lucht W Sykes MT Thonicke K amp Venevsky S (2003) Evaluation of ecosystem 1004
dynamics plant geography and terrestrial carbon cycling in the LPJ dynamic global 1005
vegetation model Global Change Biology 9 161-185 1006
Stewart DW Costa C Dwyer LM Smith DL Hamilton RI amp Ma BL (2003) 1007
Canopy structure light interception and photosynthesis in maize Agronomy Journal 95 1008
1465-1474 1009
Trnka M Dubrovsky M amp Zalud Z (2004) Climate change impacts and adaptation 1010
strategies in spring barley production in the Czech Republic Climatic Change 64 227-1011
255 1012
Turner DP Ritts WD Cohen WB Maeirsperger TK Gower ST Kirschbaum AA 1013
Running SW Zhao MS Wofsy SC Dunn AL Law BE Campbell JL Oechel 1014
WC Kwon HJ Meyers TP Small EE Kurc SA amp Gamon JA (2005) Site-level 1015
evaluation of satellite-based global terrestrial gross primary production and net primary 1016
production monitoring Global Change Biology 11 666-684 1017
van der Tol C Berry J Campbell PKE amp Rascher U (2014) Models of fluorescence 1018
and photosynthesis for interpreting measurements of solar-induced chlorophyll 1019
fluorescence Journal of Geophysical Research Biogeosciences IN PRESS 1020
van der Tol C Verhoef W amp Rosema A (2009a) A model for chlorophyll fluorescence 1021
and photosynthesis at leaf scale Agricultural and Forest Meteorology 149 96-105 1022
van der Tol C Verhoef W Timmermans A Verhoef A amp Su Z (2009b) An integrated 1023
model of soil-canopy spectral radiances photosynthesis fluorescence temperature and 1024
energy balance Biogeosciences 6 3109-3129 1025
Verhoef W (1984) Light scattering by leaf layers with application to canopy reflectance 1026
modeling The SAIL model Remote Sensing of Environment 16 125-141 1027
Verhoef W amp Bach H (2003a) Remote sensing data assimilation using coupled radiative 1028
transfer models Physics and Chemistry of the Earth 28 3-13 1029
Verhoef W amp Bach H (2003b) Simulation of hyperspectral and directional radiance 1030
images using coupled biophysical and atmospheric radiative transfer models Remote 1031
Sensing of Environment 87 23-41 1032
39
Verhoef W amp Bach H (2007) Coupled soil-leaf-canopy and atmosphere radiative transfer 1033
modeling to simulate hyperspectral multi-angular surface reflectance and TOA radiance 1034
data Remote Sensing of Environment 109 166-182 1035
Verhoef W Jia L Xiao Q amp Su Z (2007) Unified optical-thermal four-stream radiative 1036
transfer theory for homogeneous vegetation canopies Ieee Transactions on Geoscience 1037
and Remote Sensing 45 1808-1822 1038
Webb EK Pearman GI amp Leuning R (1980) Correction of flux measurements for 1039
density effects due to heat and water-vapour transfer Quarterly Journal of the Royal 1040
Meteorological Society 106 85-100 1041
Wu C Niu Z Tang Q amp Huang W (2010) Revised photochemical reflectance index 1042
(PRI) for predicting light use efficiency of wheat in a growth cycle validation and 1043
comparison International Journal of Remote Sensing 31 2911-2924 1044
Yang X Tang J Mustard JF Lee JE Rossini M Joiner J Munger JW Kornfeld 1045
A amp Richardson AD (2015) Solar-induced chlorophyll fluorescence that correlates with 1046
canopy photosynthesis on diurnal and seasonal scales in a temperate deciduous forest 1047
Geophysical Research Letters 1048
Zarco-Tejada PJ Berni JAJ Suarez L Sepulcre-Canto G Morales F amp Miller JR 1049
(2009) Imaging chlorophyll fluorescence with an airborne narrow-band multispectral 1050
camera for vegetation stress detection Remote Sensing of Environment 113 1262-1275 1051
Zarco-Tejada PJ Gonzalez-Dugo V amp Berni JAJ (2012) Fluorescence temperature and 1052
narrow-band indices acquired from a UAV platform for water stress detection using a 1053
micro-hyperspectral imager and a thermal camera Remote Sensing of Environment 117 1054
322-337 1055
Zarco-Tejada PJ Morales A Testi L amp Villalobos FJ (2013) Spatio-temporal patterns 1056
of chlorophyll fluorescence and physiological and structural indices acquired from 1057
hyperspectral imagery as compared with carbon fluxes measured with eddy covariance 1058
Remote Sensing of Environment 133 102-115 1059
Zhang Q Middleton EM Cheng YB amp Landis DR (2013) Variations of foliage 1060
chlorophyll fAPAR and foliage non-chlorophyll fAPAR (fAPARchl fAPARnonchl) at the 1061
Harvard Forest Ieee Journal of Selected Topics in Applied Earth Observations and Remote 1062
Sensing 6 2254-2264 1063
Zhang Q Middleton EM Gao BC amp Cheng YB (2012) Using EO-1 hyperion to 1064
simulate HyspIRI products for a coniferous forest The fraction of par absorbed by 1065
40
chlorophyll (fAPAR chl) and leaf water content (LWC) Ieee Transactions on Geoscience 1066
and Remote Sensing 50 1844-1852 1067
Zhang Y Guanter L Berry JA Joiner J van der Tol C Huete A Gitelson A Voigt 1068
M amp Koumlhler P (2014) Estimation of vegetation photosynthetic capacity from space-1069
based measurements of chlorophyll fluorescence for terrestrial biosphere models Global 1070
Change Biology 20 3727-3742 1071
1072
41
Appendix-A APEX data calibration 1073
The calibration of APEX images is based on the APEX Processing and Archiving Facility 1074
(PAF) which is the combined software and hardware designed to generate calibrated level 1 1075
at-sensor radiances from APEX raw image streams (Hueni et al 2009) Calibration 1076
coefficients for the radiometric geometric and spectral calibrations are generated from system 1077
calibrations at the APEX Calibration Home Base (CHB) at DLR Oberpfaffenhofen (Gege et 1078
al 2009) These CHB data are stored and processed within the APEX Calibration Information 1079
System (CAL IS) producing the so-called calibration cubes holding coefficients for each 1080
spatio-spectral pixel (Hueni et al 2013) 1081
For the multi-temporal dataset employed within this study all flight lines were 1082
reprocessed from the original raw image streams to ensure that the same version of the 1083
processor was applied The APEX PAF and CAL IS have significantly evolved over the 1084
timeframe of the dataset with calibrations getting more accurate over the years To ensure 1085
consistency all data were calibrated using coefficients obtained in May 2013 1086
The processor was specifically configured to retain the highest information content in 1087
the VNIR channel including i) no spectral resampling to compensate for spectral shifts and 1088
misregistrations (DOdorico et al 2010 DOdorico et al 2011) ii) no compensation of 1089
spectral shift related changes in radiometry (Hueni et al 2015) and iii) no spatial 1090
misregistration correction The calibration was thus effectively reduced to a linear dark 1091
current correction over time a de-smearing of the visible-NIR channel to compensate for 1092
sensor smear effects the application of radiometric gains and offsets followed by a destriping 1093
routine working in the spatial dimension only to remove pushbroom related along track 1094
striping Calibrated radiance data were directly used for the fluorescence retrieval (see Section 1095
24) while the feasibility to use APEX for SIF760 retrievals was theoretically demonstrated in 1096
42
a study of Damm et al (2011) Resulting SIF760 maps were afterwards geo-rectified using a 1097
parametric geocoding approach (Schlaumlpfer and Richter 2002) 1098
43
Appendix-B Retrieval of SIF760 from airborne data 1099
The quantification of SIF measured with ground or airborne-based spectrometers 1100
requires separating emitted SIF from the reflected radiance flux The Fraunhofer Line Depth 1101
(FLD) approach introduced by Plascyk (1975) serves as a de facto standard for medium 1102
resolution instruments such as APEX (Meroni et al 2009) and was applied in our study The 1103
FLD method uses atmospheric absorption bands characterized by lower incident light 1104
compared to wavelength regions outside of these bands This configuration increases the 1105
spectral information and allows the separation of SIF from reflected radiation In this study 1106
we used the broad O2-A oxygen absorption band around 760 nm and quantified the infilling of 1107
SIF760 using radiance measurements inside (subscript i) and outside (subscript o) of the O2-A 1108
band 1109
For the airborne case only atmospheric components can be simulated with 1110
MODTRAN-5 assuming perfect knowledge of the acquisition conditions The reflectance 1111
terms for diffuse and direct irradiance as well as the SIF760 contribution are usually unknown 1112
Assuming Lambertian surface reflectance behavior which introduces some inaccuracies but 1113
allows formulating the radiative transfer (RT) for radiance measurements at sensor level (LAtS) 1114
to obtain SIF760 both measurements inside and outside of the absorption band can be 1115
expressed as 1116
E9FA lang3H IJK LMNrangP QlangRSE rang T UlangVWWH VXWH rang∙langVYYH VYXH rangZH
Hlang[XXH rang T ABCHUlangVWWH ranglangVXWH rangZHlang[XXH rang ] ^ _ (B1) 1117
where E0 is the top-of-atmosphere irradiance including diffuse and direct irradiance 1118
components θil is the illumination zenith angle ρso is the path scattered radiance τss is the 1119
direct transmittance for sunlight τoo is the direct transmittance in view direction τsd is the 1120
diffuse transmittance of the atmosphere for sunlight τdo is the hemispherical-directional 1121
transmittance in view direction and ρdd is the spherical albedo If these atmospheric 1122
44
components are obtained from MODTRAN-5 simulations (Damm et al 2015 Verhoef and 1123
Bach 2003a b 2007) the radiative transfer equation (Eq B1) only contains four unknowns 1124
namely Ri Ro SIFi and SIFo The 3FLD method (Maier et al 2003) which is an adaptation of 1125
the original FLD method proposed by (Plascyk 1975) was used to linearly relate R and SIF 1126
inside and outside of the O2-A absorption band SIF can be finally retrieved with 1127
13 -0 abcMUdWecWlangRff_ rangZghcWUdMecMlangRff^ rangZiUdWecWlangRff_ rangZghUdMecMlangRff^ rangZ j
langVWWM ranglangVXWM rang (B2) 1128
kE lE9FA m lang3HW IJK LMNrangP langRSE rangn ] ^ _ (B3) 1129
E lang3HW IJK LMNrangP langoSSE TopSE rang ∙ langoE opE rang qEprs T Eprt] ^ _ (B4) 1130
r S13rlangoSSr rang T langopSr rang v13S$langoSSS rang T langopSS rangw (B5) 1131
where B is the factor relating SIFi and SIFo and was fixed to a value of 08 justified by 1132
simulations and experiments (Rascher et al 2009 Alonso et al 2008) Xj equals the at-1133
sensor radiance (reflected plus emitted radiation) without path radiance contribution and Ej 1134
expresses surface irradiance as measured at the sensor level A is the factor relating Ri and Ro 1135
and was derived from linear interpolation of R of the left (758 nm) and right (771 nm) O2-A 1136
band shoulder with 1137
xx+ (B6) 1138
y ```-0```z and y `-0`z
```z (B7) 1139
1140
Because APEX suffered from slight spectral smile effects (DOdorico et al 2010) 1141
updated center wavelength positions were involved in the convolution approach The spectral 1142
shift quantification for each pixel across track was based on the Cr method as described in 1143
45
Meroni et al (2010) The method assumes a high correlation between a measured and a 1144
convolved spectrum and iteratively minimizes a cost function which is 1 minus the Pearson 1145
correlation coefficient (r) calculated for both signals Remaining artifacts of the spectral shift 1146
correction and slightly inaccurate estimates of atmospheric properties cause SIF760 retrieval 1147
uncertainties We therefore applied a semi-empirical correction as described in Damm et al 1148
(2014) for each scan line across the track This technique employs reference surfaces which 1149
are free of any SIF760 emission (eg bare soil) to adjust the upward transmittance term inside 1150
the absorption feature oSSr The retrieval of SIF760 from top-of-canopy radiance data measured 1151
on ground follows the same approach as described in Eqs B2-B7 under the assumption that 1152
the surface irradiance can be approximated with the measurement of a reference panel and 1153
that ρso τdo and τdo can be set to 0 Furthermore the spectral resolution of APEX can be 1154
considered suboptimal for SIF760 retrievals although Damm et al (2011) demonstrate that 1155
APEX with its spectral resolution of 54 nm at 760 nm is sensitive for SIF760 However 1156
retrieved SIF760 values are too high and in an absolute sense incorrect We used reference 1157
SIF760 data obtained in parallel to the airborne acquisitions using the ASD field spectrometers 1158
(Section 23) to estimate the actual offset The observed scaling factor of 193 was afterwards 1159
applied to the retrieved SIF760 values to transfer them to a realistic value range 1160
46
Appendix-C SIF retrieval accuracy 1161
We applied a quantitative accuracy evaluation of resulting SIF760 maps using ground 1162
measured SIF760 values (Figure C1) Considering all reference data acquired during five 1163
campaigns a good linear relationship was achieved between ground and airborne-based 1164
SIF760 values (r2 = 071) but with a proportionality factor much higher than 1 (Figure C1-A) 1165
This experimentally obtained systematic overestimation of APEX SIF760 is comparable to 1166
simulation results documented in Damm et al (2011) Further we found slightly changing 1167
correlations between the different years (several linear models in Figure C1-A) which are 1168
likely caused by canopy structural effects spectral and radiometric performances of used 1169
ground instruments or slight deviations of the performance of APEX over time 1170
To compensate for the overestimation of APEX SIF760 we applied an empirical correction 1171
factor of 193 derived from the comparison of reference data and APEX which resulted in a 1172
rRMSE of 289 (Figure C1-B) 1173
1174
lt Figure C1 gt 1175
1176
The Laegeren site was covered with three adjacent flight lines having an overlap of 1177
approximately 10 (cf Figure 3) This configuration provides the opportunity to 1178
quantitatively evaluate the consistency of SIF retrievals obtained from different measurements 1179
and view zenith angles (ie plusmn 135deg) The comparison of SIF760 retrievals obtained from flight 1180
lines 1 and 2 reveals a moderate linear relationship for homogeneous agricultural surfaces (r2 1181
= 081 rRMSE = 57) We observed a systematic underestimation of flight line 1 compared 1182
to flight line 2 (factor 06) for a view zenith angle difference of ~26deg for SIF760 indicating 1183
either a directionality of SIF760 emissions or an insufficient decoupling of surface HCRF 1184
affected by reflectance anisotropy With increasing surface heterogeneity scattering increases 1185
47
and the agreement of retrieved SIF from both flight lines slightly decreases (ie for forested 1186
areas r2 of 05 and rRMSE of 88) This lower correlation can be mainly associated to slight 1187
geometric mis-registrations (ie max 2 pixel ~ 40 m) in combination with surface 1188
heterogeneity (eg shaded and sunlit tree crowns) and emission anisotropy of SIF760 Also 1189
negative SIF760 values are present in the SIF760 maps and caused by sensor noise and 1190
especially for forests due to shadowing effects (Damm et al 2015) 1191
48
Appendix-D Technical aspects determining the SIF760 retrieval accuracy 1192
A rigorous evaluation of the SIF760 retrieval accuracy is crucial to judge the reliability 1193
of our assessment on the relationship between SIF760 and GPPEC across ecosystems 1194
Furthermore additional factors imposing variations on SIF760 retrieved from airborne 1195
spectroscopy data that cannot be related to the physiological origin of SIF760 needs to be 1196
critically discussed to justify the proposed approach 1197
Ground-based measurements of SIF760 were made using field spectrometers to validate 1198
the airborne retrievals Field spectroscopy provides a good reference for validating airborne 1199
retrievals as it is likely not affected by biases resulting from atmospheric composition 1200
estimates (eg aerosol load) due to the simultaneous measurement of irradiance fluxes at 1201
canopy level using a reference panel The reliability of the applied field spectroscopic 1202
approach to measure SIF760 was previously demonstrated using field studies (Damm et al 1203
2010 Liu and Cheng 2010 Meroni et al 2009 Rascher et al 2009) and theoretical 1204
assessments (Damm et al 2011) It must be noted that field spectroscopic approaches are 1205
subject to uncertainties particularly for heterogeneous vegetation canopies Damm et al 1206
(2015) discussed retrieval errors caused by illumination effects likely introducing slight 1207
errors in reference SIF760 This source of uncertainty must be considered when judging the 1208
accuracy of APEX SIF760 The nevertheless good agreement between ground and airborne 1209
observations indicated that atmospheric absorption and scattering effects could be sufficiently 1210
compensated and thus demonstrated the reliability of retrieved SIF760 measurements In 1211
particular the empirical correction applied making use of high spatial resolution airborne IS 1212
data in combination with reference surfaces not emitting SIF760 allowed to bypass retrieval 1213
uncertainties caused by atmospheric effects (Damm et al 2014) 1214
Instrumental effects in combination with retrieval methods were found to cause 1215
systematic differences in SIF760 retrievals (Damm et al 2011) the comparatively low 1216
49
resolution of APEX around the O2-A band used to retrieve SIF760 (ie ~54 nm) resulted in an 1217
overestimation of APEX SIF760 compared to retrievals from high resolution instruments 1218
Indeed maximum APEX SIF760 values are 6 mW m-2 sr-1 nm-1 while typical SIF760 values 1219
obtained from high resolution instruments range between 0 and 3 mW m-2 sr-1 nm-1 (Guanter 1220
et al 2013) Considering SIF760 values retrieved from ASD data in original resolution (3 nm) 1221
APEX showed an overestimation of 1102 which confirmed that low spectral resolution 1222
resulted in an overestimation of SIF760 The reasoning for this absolute error is given by the 1223
sub-optimal spectral resolution of APEX with 54 nm at 760 nm causing a reduced sensitivity 1224
for SIF760 on the one hand and a wider distance of the O2-A shoulder values used to 1225
parameterize the 3FLD approach on the other hand The bias was corrected using the ASD 1226
reference data and does not impact the results of our analysis Further the relative variation of 1227
SIF760 is unaffected by the bias 1228
Surface heterogeneity complicates the retrieval of SIF760 According to Damm et al 1229
(2015) SIF760 retrievals for forest sites are especially subject to uncertainties due to 1230
assumptions on surface irradiance Crown shapes and associated surface orientations 1231
determine the intensity and quality of irradiance including fractional amounts of diffuse and 1232
direct irradiance To account for pixel wise changes in surface irradiance high resolution 1233
digital object models (DOM) (eg derived from LiDAR observations) are required In 1234
absence of such a high resolution DOMrsquos crowns are assumed to be flat which results in 1235
uncertainties of up to 58 in case of cast shadows (Damm et al 2015) Since we used 1236
averaged observations over larger areas representing flux tower footprints and most of our 1237
data were flown under comparable illumination conditions (ie around solar noon) we 1238
expect these potential biases to be less influential in this analysis 1239
1
Tables 1
Table 1 Date and time of APEX flights and corresponding eddy covariance flux tower 2
measurements for the three investigated ecosystems (ie grassland cropland mixed 3
temperate forest) 4
Date Time [UTC] Location Ecosystem Flux tower
17062009 950 Laegeren forest 1 tower
17062009 1030 Oensingen cropland 1 tower
17062009 1030 Oensingen grassland 2 tower
25062010 1030 Oensingen cropland 1 tower
25062010 1030 Oensingen grassland 2 tower
26062010 1500 Laegeren forest 1 tower
26062010 1030 Oensingen cropland 1 tower
26062010 1030 Oensingen grassland 2 tower
29062010 1030 Laegeren forest 1 tower
26062011 1030 Laegeren forest 1 tower
28062011 1030 Oensingen cropland 1 tower
28062011 1030 Oensingen grassland 1 tower
16062012 1025 Laegeren forest 1 tower
16062012 900 Oensingen cropland 1 tower
16062012 1100 Oensingen cropland 1 tower
12072013 730 Laegeren forest 1 tower
03092013 1050 Laegeren forest 1 tower
5
2
Table 2 Availability of reference SIF760 data obtained from field spectroscopy measurements 6
to validate APEX based SIF760 retrievals 7
Date time [UTC] Location Measured crops Nr points
17062009 1030 Oensingen maize rye pea sugar beet wheat white clover 29 points
25062010 1030 Oensingen maize pea sugar beet wheat white clover 15 points
16062012 900 Oensingen carrot maize winter wheat 11 points
16062012 1100 Oensingen carrot maize winter wheat 10 points
8
3
Table 3 Goodness of fit for the hyperbolic model describing the relationship between GPPEC 9
and SIF760 O PRI and MCARI2 for the three ecosystem types perennial grassland cropland 10
and mixed temperate forest Calculated statistics are based on all data acquired from 2009-11
2013 as described in Table 1 12
Optical variable Ecosystem Regression coefficient Relative RMSE []
SIF crops 088 355
grass 059 2708
forest 048 1588
PRI crops 0008 1176
grass 095 860
forest 009 2179
MCARI2 crops 0005 1029
grass 098 550
forest 034 1798
13
1
Figures 1
2
Figure 1 Study sites A Oensingen agricultural site B Laegeren forest site The white 3
rectangles represent in A the boundary of investigated fields that comprise most of the flux-4
tower footprints and in B a coarse outline of the footprint area of the flux-tower The white 5
crosses show the locations of the flux-towers Background RGB images from Google-Earth 6
2
7
Figure 2 APEX reflectance and SIF760 image for the Oensingen site acquired on the 2606 8
2010 1030 UTC A top-of-canopy hemispherical-conical reflectance data as true color 9
composite B SIF760 map The white boxes indicate the approximate position of the flux 10
tower 11
3
12
Figure 3 APEX reflectance and SIF760 image for the Laegeren site acquired on the 2606 13
2010 1510 UTC A top-of-canopy hemispherical-conical reflectance data as true color 14
composite B SIF760 map The black arrows indicate the flight direction of flight line 1 to 3 15
(FL1-FL3) The white line marks a transect along the overlapping region of FL1 and FL2 The 16
white boxes indicate the approximate position of the flux tower 17
4
18
Figure 4 Relationships between GPPEC from the eddy-covariance measurements and SIF760 O 19
instantaneously measured between 2009 and 2013 (see Table 1) with the airborne 20
spectrometer APEX (A) PRI index (B) and MCARI2 index (C) for three vegetation types 21
(black dots perennial grassland dark grey rectangles cropland including winter wheat pea 22
and barley grey triangles mixed temperate forest) The solid curves correspond to a 23
hyperbolic model fitted to the measured data The dashed curves show the extrapolated 24
behavior 25
5
26
Figure 5 Daily light response curves from eddy flux measurements for A cropland B 27
perennial grassland and C mixed temperate forest Data were acquired between 2009 and 28
2013 (see Table 1) Grey curves represent a fitted hyperbolic model to approximate the 29
behavior of measured PAR-GPP values Crosses show GPPEC measurements that were used 30
for the SIF760 O - GPPEC comparison based on the time of APEX flights PAR values are 31
binned in 20 mW m-2
sr-1
nm-1
increments 32
6
33
Figure 6 Leaf level relationships between photosynthetic (LUEp) and fluorescence yield 34
(LUEf) for a typical C3 crop Dependency of LUEp (A) and LUEf (B) on APAR C 35
Relationship between LUEp and LUEf D Relationship between APAR and GPPL GPPL was 36
calculated as APARLUEp E Relationship between APAR and SIF760 SIF760 was calculated 37
as APARLUEf assuming a constant relationship between the SCOPE output SIFtotalL 38
(integral between 640-850nm) and SIF760L F Relationship between SIF760 L and GPPL All 39
data were simulated using SCOPE The grey areas indicate illumination conditions 40
comparable to APEX flights 41
7
42
Figure 7 Canopy level relationships between photosynthetic (LUEp) and fluorescence yield 43
(LUEf) for different canopy representations of a C3 cropland in SCOPE Dependency of 44
LUEp (A) and LUEf (B) on APAR LUEp was calculate as GPPCAPAR and LUEf was 45
directly obtained from SCOPE C Relationship between LUEp and LUEf D Relationship 46
between APAR and GPPC GPPC was directly obtained from SCOPE E Relationship 47
between APAR and SIF760C SIF760C was directly obtained from SCOPE F Relationship 48
between SIF760C and GPPC The black dashed line corresponds to a C3 cropland with LAI = 49
30 fraction of brown pigments (Cs) = 00 and a spherical (sp) leaf inclination distribution 50
function (LIDF) For the grey line Cs was changed to 20 for the black dashed line the LAI 51
was changed to 10 and for the grey dasheddotted line the LIDF was changed to plagiophile 52
(pg) The grey areas indicate illumination conditions comparable to APEX flights 53
8
54
Figure 8 Impact of temporal scaling on the SIF760C-GPPC relationship SIF760C and GPPC 55
data were simulated using SCOPE Model input parameters air temperature (A) PAR (B) and 56
LAI (C) were measured within the NitroEurope project (httpwwwnitroeuropeeu) at the 57
Speulderbos forest site Netherlands D Relationship between SIF760C and GPPC including a 58
fitted hyperbolic model for daily averages (grey dots and grey line) monthly averages (dark 59
grey triangles and line) and quarterly data (black dots and black dashed line) 60
9
61
Figure C1 Comparison of ground and airborne-based SIF760 retrievals from various crops 62
Data were acquired during four campaigns between 2009 and 2012 in the agricultural site 63
Oensingen (see Table 2) Left Fitted linear regression lines for the four considered campaigns 64
are overlaid in black The dashed line corresponds to the 11 line Right SIF retrievals from 65
APEX after applying an empirical correction factor (193) The black line represents the fitted 66
linear model the dashed line corresponds to the 11 line 67
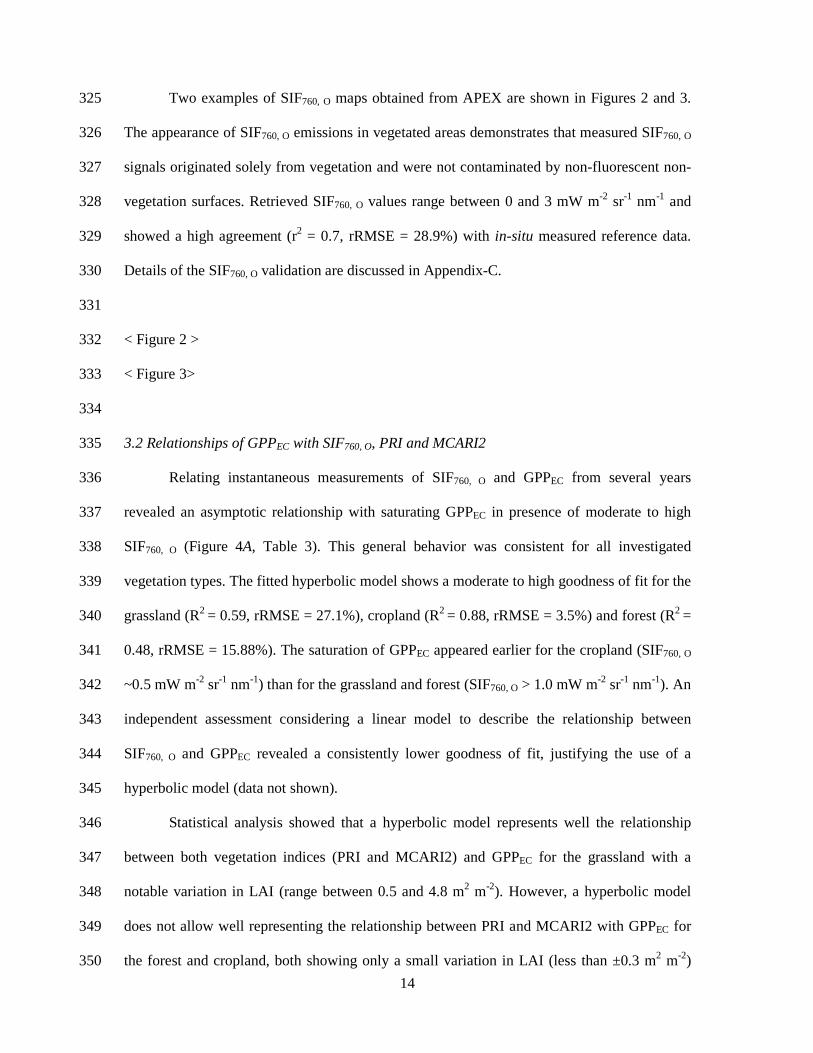
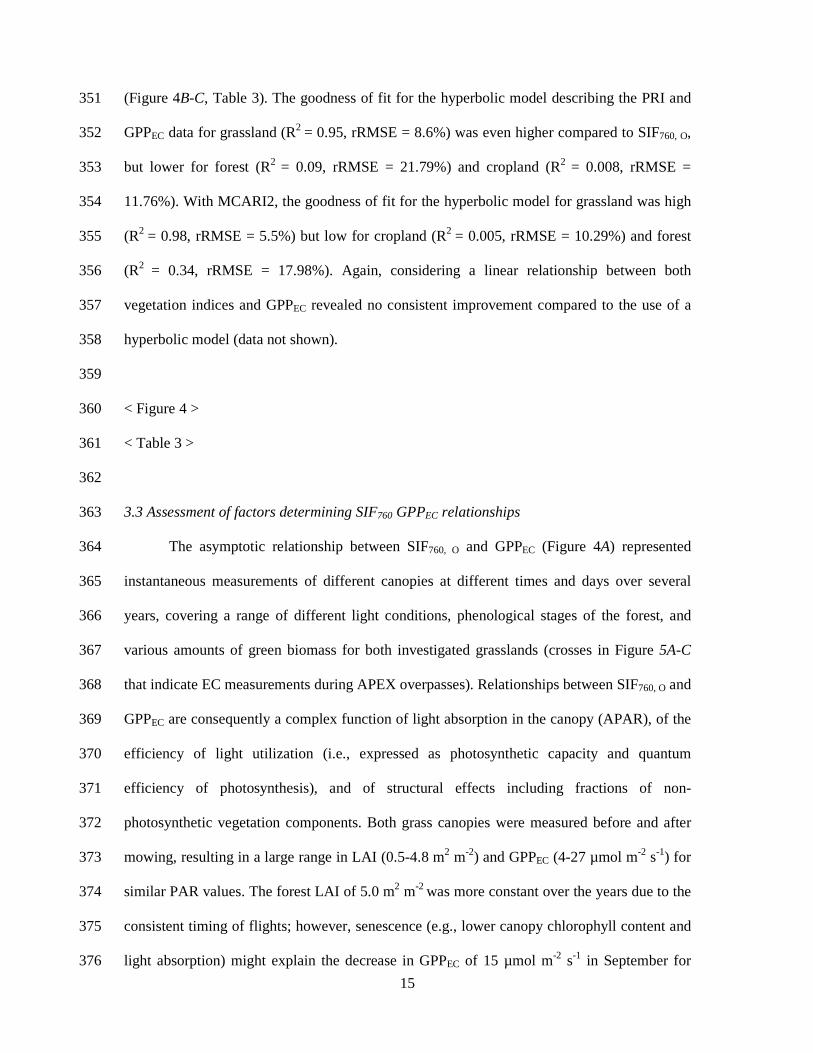
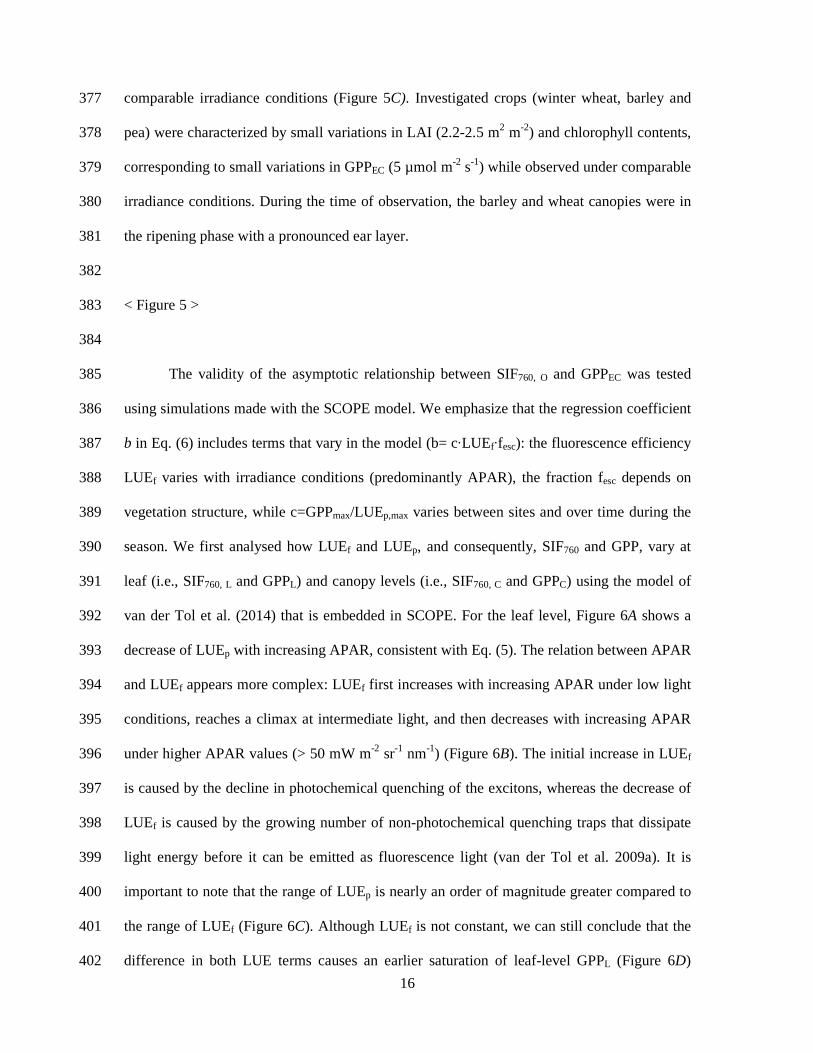
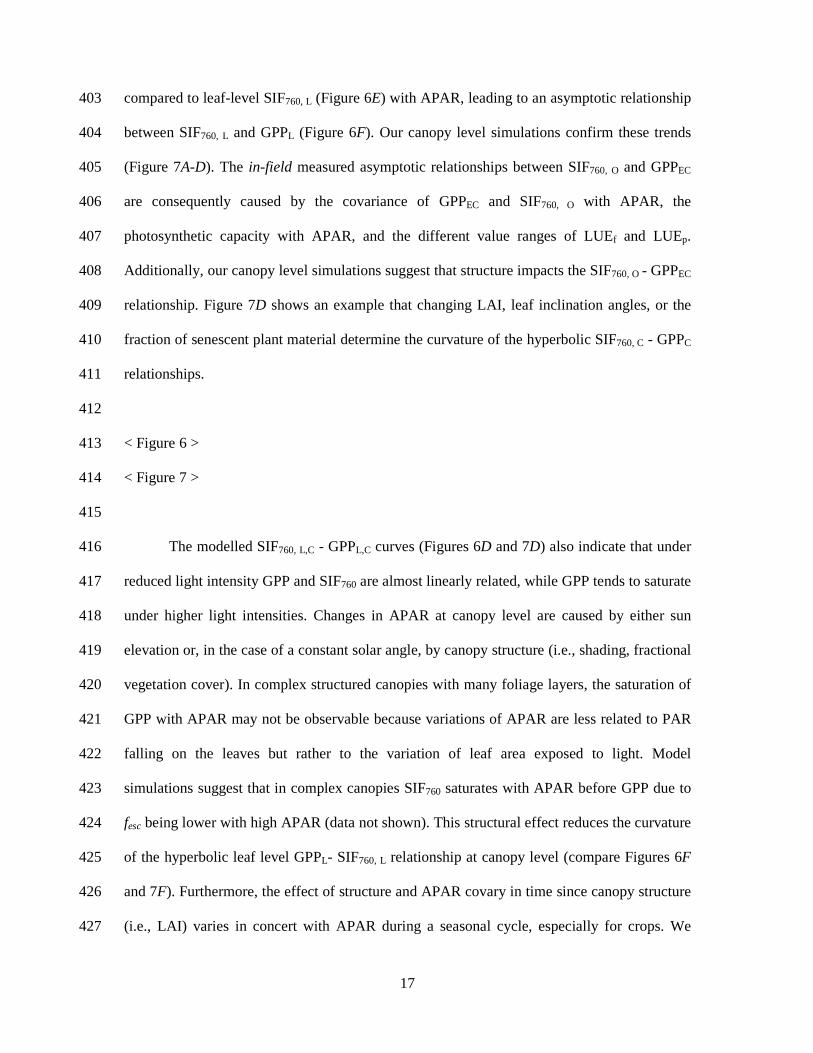
18
expect that this covariance makes the relationship between GPP and SIF760 more linear at the 428
canopy level especially if observations are aggregated over time 429
To evaluate the structure related alleviation of the hyperbolic relationship between 430
SIF760 and GPP at canopy level in response to temporal aggregation we modelled an annual 431
course of GPPC and SIF760 C considering varying environmental conditions (Figure 8A-B) 432
ie PAR ranging from 0-500 mW m-2 sr-1 nm-1 air temperature ranging from 0-32degC using 433
data collected during 2009 at a Nitro-Europe flux tower site (Speulderbos The Netherlands) 434
and canopy properties ie LAI ranging from 15-30 m2 m-2 (Figure 8C) The LAI data are 435
synthetic but have a realistic seasonal cycle For daily noon values of modelled SIF760 C and 436
GPPC an asymptotic behaviour can be observed while GPPC tends to saturate compared to 437
SIF760 C The SIF760C-GPPC relationship tends to become linear when monthly or quarterly 438
averages are considered (Figure 8D) 439
440
lt Figure 8 gt 441
442
This visual trend can be confirmed by statistical measures for daily aggregated values 443
the hyperbolic model (rRMSE = 174 R2 = 070) performed slightly better than the linear 444
model (rRMSE = 185 r2 = 068) In case of monthly aggregated data both the hyperbolic 445
and linear models performed similarly while the linear model gave better results (RMSE = 446
90 r2 = 090) than the hyperbolic model (rRMSE = 94 R2 = 088) for quarterly aggregated 447
data 448
449
4 Discussion 450
Significant relationships between remotely measured SIF and ecosystem GPP have 451
been reported in the past (Frankenberg et al 2011 Guanter et al 2014) however sufficient 452
19
process understanding for using SIF as proxy for GPP across ecosystems is still limited 453
(Porcar-Castell et al 2014) Below we discuss how our observational and modeling 454
approaches help bridging the gap between mechanistic understanding at the leaf level and 455
ecosystem-specific observations and thus provide insights on mechanisms determining the 456
complex relationship between SIF and GPP 457
458
41 Insights from the observational approach 459
Our results showed ecosystem-specific asymptotic relationships between SIF760 O and 460
GPPEC for the three investigated ecosystems mixed temperate forest cropland and perennial 461
grassland The varying SIF-GPP relationships across ecosystems were consistent with results 462
recently reported from combined satellite observations and model predictions (Guanter et al 463
2012) Our results showed that the relationships of both tested vegetation indices PRI and 464
MCARI2 to GPPEC experienced a higher variability across ecosystems compared to SIF760 O 465
SIF760 O showed an ecosystem-specific and overall moderate to good relationship (R2 between 466
048 and 088) to GPPEC for the three ecosystems Both vegetation indices showed only strong 467
relationships for the grassland (R2 = 095 and 098) that notably changed in LAI during the 468
various observations It is important to note that we do not further elaborate on the underlying 469
mechanisms relating vegetation indices and GPPEC and that it is unclear if hyperbolic models 470
best describe their relationships to GPPEC based on mechanistic principles The intention of 471
evaluating the relationships between GPPEC and both vegetation indices was to provide a base 472
to judge the performance of SIF760 O in relation to these commonly used remote observations 473
The diversity of sampled conditions and used data sources provide further evidence on 474
the robustness of observed SIF760 O-GPPEC relationships Our measurements represent various 475
canopies characterized by different biomasses sampled over several years Although most 476
observations were acquired under similar light condition and physiological states a few 477
measurements represented lower light conditions and other physiological states This suggests 478
20
that observed relationships are rather robust across different representations of APAR LUEp 479
and LUEf Furthermore we use data from different sources ie four EC flux towers the 480
APEX imaging spectrometer and modeling at leaf and canopy levels to reduce the 481
uncertainties associated with each method of measurements and to get a better understanding 482
of the SIF760 O-GPPEC relationship at ecosystem level 483
Flux tower measurements are representative of a certain source area (footprint) from 484
the ecosystem which changes constantly based on wind direction and turbulent state of the 485
atmosphere Depending on the heterogeneity of the ecosystem GPPEC signals can vary in 486
response to changing footprints (Barcza et al 2009 Kljun et al 2004) although this variation 487
should be rather small if the vegetation is homogeneous Remote measurements of SIF760 are 488
likely representative of the upper layer of the ecosystem thus vertical canopy heterogeneity 489
potentially leads to a mismatch when compared to GPPEC which integrates over the different 490
layers of the ecosystems This is expected to be especially the case in structurally complex 491
ecosystems such as forests Although the upper layer in forest ecosystems substantially 492
contributes to the total rate of GPPEC there are still many layers of leaves or needles within 493
the canopy photosynthesizing at different rates depending on their sunshade exposure In 494
addition understory vegetation in forest ecosystems can significantly contribute to GPPEC at 495
different rates depending on the ecosystem and time of year Even homogeneous vegetation 496
canopies like crops or grasslands can show vertical heterogeneity This is especially the case 497
at peak biomass during ripening or senescence During such phenological stages the top layer 498
of cereal crops consists of less fluorescing components (ie ears) and cereal crops or 499
grasslands can contain a higher fraction of brown pigments resulting in low SIF760 O values 500
while the entire canopy can still produce high photosynthetic rates and thus GPPEC (Damm et 501
al 2010) Indeed most of the crops investigated in our study were in the ripening phase with a 502
pronounced ear layer 503
21
This resulted in relatively low SIF760 O values and in high GPPEC and thus in a more 504
pronounced asymptotic relationship (cf Figure 4A Figure 7F) compared to results reported 505
for other crops (Guanter et al 2013 Guanter et al 2014) Further research is needed to better 506
understand the impact of vertical heterogeneity on GPPEC and SIF760 observations and their 507
respective relationships 508
Despite the technical aspects causing variations in retrieved SIF760 O (refer to 509
Appendix-D for a detailed discussion) canopy structure causes inherent variations in 510
measured SIF760 values and thus impacts SIF760-GPP relationships The combination of 511
complex canopy architecture and the distribution of absorbing and scattering elements 512
determine vegetation canopies to act as photon traps (Knyazikhin et al 2013 Lewis and 513
Disney 2007) Parts of emitted SIF760 photons from inner-canopy leaves are re-absorbed 514
while others escape the canopy in direction of the sensor The probability of photons escaping 515
the canopy is a function of canopy structure which implies sensitivity to measured SIF760 516
intensities for canopy structure In Eq (2) this sensitivity was approximated with the term 517
fesc In our analysis we minimized the impact of fesc by observing always the same forest area 518
representative for the EC tower footprint In less complex structured crop and grass canopies 519
we expect fesc to be less important However future research is required to quantify the impact 520
of fesc and to propose strategies to compensate its influence on SIF760 retrievals 521
522
42 Insights from the modeling approach 523
From a theoretical point of view radiative energy loss competes with photochemistry 524
and non-radiative energy dissipation for absorbed photons Considering that GPP and SIF760 525
can be conceptualized according to Eqs (1) and (2) SIF760 must show under certain 526
environmental conditions a sensitivity to photochemistry (Porcar-Castell et al 2014 van der 527
Tol et al 2009a van der Tol et al 2009b) This relationship is confirmed by our observational 528
data and other studies at leaf (Amoros-Lopez et al 2008) and canopy levels (Damm et al 529
22
2010) Our modeling results however indicated that the relationship between LUEf and LUEp 530
is subject to change hence impacting the sensitivity of SIF760 to track changes in GPP 531
(Figures 6C and 7C) 532
The asymptotic relationship between SIF760 and GPP theoretically predicted and 533
observed at leaf and canopy levels can be related in particular to the different value ranges of 534
both efficiency terms (LUEp and LUEf) (Figures 6C and 7C) while a complex set of 535
mechanisms causes an ecosystem dependency for SIF760-GPP relationships The 536
photosynthetic capacity of the entire ecosystem in combination with its vertical heterogeneity 537
determines differences in GPP and SIF760 and thus the slope and curvature of their respective 538
relationships Furthermore the initial slope of the asymptotic SIF760 - GPP relationship which 539
has a value of LUEpmax(LUEfmiddotfesc) is determined by a combination of the photosynthetic 540
efficiency and canopy structure Canopy structure and related shadowing effects alter the 541
average light interception and quality at leaf level (Nobel et al 1993 Stewart et al 2003) and 542
consequently the overall productivity of the canopy In the case of reduced APAR caused by 543
canopy shadowing the overall apparent stress level in the canopy and consequently the rate 544
of certain photoprotective mechanisms such as non-radiative energy dissipation is reduced 545
(Cheng et al 2015 Demmig-Adams 1998 Niinemets et al 2003) and observed GPP and 546
SIF760 fall in a range where they are more linearly related (cf Figure 6F and 7F) In addition 547
canopy level simulations show that the fraction of senescent plant material impacts the 548
curvature of the hyperbolic relationship 549
Recent literature reports linear relationships between satellite-based SIF and modeled 550
GPP (Frankenberg et al 2011 Guanter et al 2012 Guanter et al 2014) while we found 551
asymptotic relationships Both results are not contradicting if one considers the temporal 552
aggregation applied to the data Our results are based on instantaneous measurements while 553
monthly averages were calculated for the satellite data to minimize noise effects (Frankenberg 554
et al 2011 Guanter et al 2014) It is known from previous research that temporal averaging 555
23
tends to linearize the response between GPP and APAR (Ruimy et al 1995) as saturating 556
light conditions tend to be only a small fraction of averaged diurnalmonthly data 557
Aggregating GPPEC and APAR over different time scales also showed this effect (data not 558
shown) Because of the rather linear relationship between SIF760 and APAR we expect that 559
temporal aggregation tends to linearize the SIF760-GPP relationship as well A recent study 560
presenting continuous measurements of GPP and SIF760 over a temperate deciduous forest 561
support this hypothesis (Yang et al 2015) The increasing number of experiments using 562
autonomous spectrometer systems in combination with flux towers (Balzarolo et al 2011) 563
will likely provide more experimental results that supports this finding Our simulations 564
provide further evidence that the covariance of structure and APAR during a seasonal cycle 565
additionally tends to linearize the relationship between GPP and SIF760 if observations are 566
aggregated over time 567
The dependency of SIF760-GPP relationships on temporal aggregation requires special 568
attention since it has implications on the usage of SIF to constrain GPP In principle 569
conclusions and results obtained from temporally aggregated and instantaneous measurements 570
are valid if consistently related to the underlying temporal aggregation level Generalizing 571
conclusions obtained at various aggregation levels bears the risk for mis-interpretations eg 572
when vegetation models are refined or empirically re-calibrated using observations or for 573
projections of GPP using observational SIF data 574
575
43 Requirements for the use of SIF to assess GPP across ecosystems 576
The changing relationship between SIF760 and GPPEC with vegetation type challenges 577
the usage of SIF760 as a robust constraint to estimate GPP Specific strategies are required to 578
account for ecosystem (or species) specific sensitivities of SIF in general and SIF760 in 579
particular This includes i) integration platforms to combine observations and process 580
24
understanding and ii) accurate observations of additional vegetation and environmental 581
variables 582
Process-based models as data integration platform in combination with comprehensive 583
observations to sufficiently measure important environmental factors and vegetation 584
properties are considered as flexible and powerful framework Parazoo et al (2014) for 585
example proposed the combination of ensemble dynamic global vegetation models (DGVMs) 586
in combination with SIF as observational constraint Lee et al (2015) suggest incorporating 587
SIF in a climate model to utilize SIF as observational constraint of photosynthesis simulations 588
and subsequent calculations of carbon water and energy cycle information Yet other studies 589
propose using SIF to obtain physiological vegetation parameters ie Vcmax for improved 590
parameterizations of photosynthesis models to eventually model GPP (Zhang et al 2014) The 591
European space agencys (ESA) Earth Explorer 8 opportunity mission Fluorescence Explorer 592
(FLEX) suggests a combination of comprehensive observations (ie SIF over the full 593
emission spectrum vegetation ecosystems and actual environmental conditions) and process-594
based models (Guanter et al 2012) 595
Additional information is required to use SIF in process-based models as one has to 596
account for varying photosynthetic efficiencies of plants and prevailing stress responses 597
According to the conceptualization of GPP and SIF as given in Eqs (1) and (2) extracting 598
and evaluating the exact relationship between LUEp and LUEf is essential but requires 599
normalizing APAR and calculating both yields (Damm et al 2010 Govindjee 2004 Louis et 600
al 2005) Retrievals of APAR can be considered challenging (Garbulsky et al 2010 Gitelson 601
and Gamon 2015 Hanan et al 2002) as available approaches often utilize a-priori knowledge 602
of prevailing land cover or plant distribution functions and rely on the inversion of physical-603
based models or simple band ratios (Hilker et al 2008) Research is required to provide high 604
quality information on APAR not perturbed by light absorption of non-photosynthetic active 605
25
canopy elements (stems branches twigs) cf Zhang et al (2013 2012) that demonstrate 606
attempts to improve estimates of APAR 607
Observed SIF760 O - GPPEC relationships are additionally confounded by non-radiative 608
energy dissipation The PRI was designed to monitor pigment changes related to the 609
xanthophyll cycle (Gamon et al 1992) and provides access to this superimposing process 610
However reported sensitivities of PRI for other effects ie structure (Barton and North 611
2001) pigment pool sizes (Gamon and Berry 2012) illumination effects (Damm et al 2015) 612
and the results obtained in this study question the applicability of the PRI at canopy level 613
Alternative approaches such as the development of a canopy PRI as suggested by several 614
groups (Hernandez-Clemente et al 2011 Kovac et al 2013 Wu et al 2010) or the usage of 615
pigment compositions and other functional plant traits might represent interesting strategies 616
and should be elaborated in future research 617
Structural sensitivities of canopy leaving SIF signals are critical and require further 618
research The application of spectrally invariant correction factors eg the directional area 619
scattering factor (Knyazikhin et al 2013) or more advanced physically-based retrieval 620
schemes using combined atmosphere-canopy models (Damm et al 2015 Laurent et al 2013) 621
might provide potential strategies to compensate for canopy structural effects on retrieved 622
SIF760 623
Another important source of information that allows improving the usage of SIF as 624
constraint of GPP is to consider SIF emissions over the entire emission spectrum between 625
approximately 600 and 800 nm Recent research successfully demonstrated the 626
complementary information content of red-fluorescence retrieved in the O2-B band at 688 nm 627
(SIF688) compared to SIF760 because of the different contributions from photosystem I and II 628
(Rossini et al 2015) Yet other studies highlighted the potential to improve predictions of 629
LUEp and GPP using both SIF688 and SIF760 (Cheng et al 2013) 630
631
26
5 Conclusions 632
Remote sensing of SIF provides a new observational approach to assess terrestrial 633
GPP Compared to traditional greenness-based remote sensing parameters we found SIF760 to 634
be more consistently related to GPPEC These results in combination with the more direct 635
mechanistic link between SIF760 and photosynthesis suggest that using SIF760 provides a 636
strategy to decrease uncertainty in estimating GPP across ecosystems 637
Our observational and modeling approaches revealed asymptotic and ecosystem-638
specific relationships for SIF760 and GPPEC We identified a set of interlinked mechanisms 639
determining SIF760-GPPEC relationships to be ecosystem specific ie the photosynthetic 640
capacity and efficiency of ecosystems the confounding impact of non-radiative energy 641
dissipation (NPQ) as well as ecosystem structure and the fraction of non-photosynthetic 642
vegetation components We demonstrated that SIF760-GPPEC relationships scale with temporal 643
aggregation due to a covariance of canopy structure and APAR over the seasonal cycle 644
We suggest going beyond empirical and ecosystem-specific relationships instead 645
using instantaneous observations comprehensively providing information on the full SIF 646
emission vegetation status and functioning as well as environmental conditions in 647
combination with process-based models Such approaches eg suggested for ESArsquos potential 648
ldquoFluorescence Explorerrdquo (FLEX) Earth Explorer mission provide a flexible framework to 649
account for the various influencing factors identified and to successfully apply SIF as 650
constraint of unbiased global GPP estimates 651
Furthermore research is required to improve the comparison between observations of 652
GPPEC and SIF Both observations stem from conceptually contrasting technologies ie 653
measurements of gas exchange vs plant-light interactions and provide independent and 654
complementary access to study ecosystem photosynthesis Despite the need to harmonize 655
horizontally differing footprints the vertical heterogeneity of ecosystems including the 656
27
varying contributions from different ecosystem layers must be better understood to harmonize 657
and successfully integrate both measurements 658
659
Acknowledgements 660
This work was supported by a grant of the Swiss University Conference and ETH-661
Board in frame of the Swiss Earth Observatory Network (SEON) project and by a grant of the 662
European Space Agency (ESA) in frame of the FLEX-PARCS E Paul-Limoges was 663
supported in part by the Natural Sciences and Engineering Research Council of Canada 664
through a postgraduate scholarship We would like to thank the APEX team for acquiring the 665
APEX data Authors sequence is listed following the FLAE approach (doi 666
101371journalpbio0050018) 667
28
References 668
Ammann C Flechard CR Leifeld J Neftel A amp Fuhrer J (2007) The carbon budget of 669
newly established temperate grassland depends on management intensity Agriculture 670
Ecosystems amp Environment 121 5-20 671
Amoros-Lopez J Gomez-Chova L Vila-Frances J Alonso L Calpe J Moreno J amp 672
del Valle-Tascon S (2008) Evaluation of remote sensing of vegetation fluorescence by 673
the analysis of diurnal cycles International Journal of Remote Sensing 29 5423-5436 674
Baker NR (2008) Chlorophyll Fluorescence A probe of photosynthesis in vivo Annual 675
Review of Plant Physiology and Plant Molecular Biology 59 89-113 676
Baldocchi D Falge E Gu LH Olson R Hollinger D Running S Anthoni P 677
Bernhofer C Davis K Evans R Fuentes J Goldstein A Katul G Law B Lee 678
XH Malhi Y Meyers T Munger W Oechel W U KTP Pilegaard K Schmid 679
HP Valentini R Verma S Vesala T Wilson K amp Wofsy S (2001) FLUXNET A 680
new tool to study the temporal and spatial variability of ecosystem-scale carbon dioxide 681
water vapor and energy flux densities Bulletin of the American Meteorological Society 682
82 2415-2434 683
Baldocchi DD (2003) Assessing the eddy covariance technique for evaluating carbon 684
dioxide exchange rates of ecosystems past present and future Global Change Biology 9 685
479-492 686
Balzarolo M Anderson K Nichol C Rossini M Vescovo L Arriga N Wohlfahrt G 687
Calvet J-C Carrara A Cerasoli S Cogliati S Daumard F Eklundh L Elbers JA 688
Evrendilek F Handcock RN Kaduk J Klumpp K Longdoz B Matteucci G 689
Meroni M Montagnani L Ourcival J-M Sanchez-Canete EP Pontailler J-Y 690
Juszczak R Scholes B amp Pilar Martin M (2011) Ground-Based Optical Measurements 691
at European Flux Sites A Review of Methods Instruments and Current Controversies 692
Sensors 11 7954-7981 693
Barcza Z Kern A Haszpra L amp Kljun N (2009) Spatial representativeness of tall tower 694
eddy covariance measurements using remote sensing and footprint analysis Agricultural 695
and Forest Meteorology 149 795-807 696
Barton CVM amp North PRJ (2001) Remote sensing of canopy light use efficiency using 697
the photochemical reflectance index - Model and sensitivity analysis Remote Sensing of 698
Environment 78 264-273 699
Beer C Reichstein M Tomelleri E Ciais P Jung M Carvalhais N Roedenbeck C 700
Arain MA Baldocchi D Bonan GB Bondeau A Cescatti A Lasslop G Lindroth 701
29
A Lomas M Luyssaert S Margolis H Oleson KW Roupsard O Veenendaal E 702
Viovy N Williams C Woodward FI amp Papale D (2010) Terrestrial Gross Carbon 703
Dioxide Uptake Global Distribution and Covariation with Climate Science 329 834-838 704
Berk A Anderson GP Acharya PK Bernstein LS Muratov L Lee J Fox M 705
Adler-Golden SM Chetwynd JH Hoke ML Lockwood RB Gardner JA Cooley 706
TW Borel CC amp Lewis PE (2005) MODTRAN5 A reformulated atmospheric band 707
model with auxiliary species and practical multiple scattering options Proceedings of the 708
Society of Photo-Optical Instrumentation Engineer 5655 662-667 709
Cheng SJ Bohrer G Steiner AL Hollinger DY Suyker A Phillips RP amp 710
Nadelhoffer KJ (2015) Variations in the influence of diffuse light on gross primary 711
productivity in temperate ecosystems Agricultural and Forest Meteorology 201 98-110 712
Cheng Y-B Middleton EM Zhang Q Huemmrich KF Campbell PKE Corp LA 713
Cook BD Kustas WP amp Daughtry CS (2013) Integrating Solar Induced 714
Fluorescence and the Photochemical Reflectance Index for Estimating Gross Primary 715
Production in a Cornfield Remote Sensing 5 6857-6879 716
Collatz GJ Ball JT Grivet C amp Berry JA (1991) Physiological and environmental-717
regulation of stomatal conductance photosynthesis and transpiration - a model that 718
includes a laminar boundary-layer Agricultural and Forest Meteorology 54 107-136 719
DOdorico P Alberti E amp Schaepman ME (2010) In-flight spectral performance 720
monitoring of the Airborne Prism Experiment Applied Optics 49 3082-3091 721
DOdorico P Guanter L Schaepman ME amp Schlaumlpfer D (2011) Performance 722
assessment of onboard and scene-based methods for Airborne Prism Experiment spectral 723
characterization Applied Optics 50 4755-4764 724
Damm A Erler A Gioli B Hamdi K Hutjes R Kosvancova M Meroni M 725
Miglietta F Moersch A Moreno J Schickling A Sonnenschein R Udelhoven T 726
Van der Linden S Hostert P amp Rascher U (2010) Remote sensing of sun induced 727
fluorescence yield to improve modelling of diurnal courses of Gross Primary Production 728
(GPP) Global Change Biology 16 171-186 729
Damm A Erler A Hillen W Meroni M Schaepman ME Verhoef W amp Rascher U 730
(2011) Modeling the impact of spectral sensor configurations on the FLD retrieval 731
accuracy of sun-induced chlorophyll fluorescence Remote Sensing of Environment 115 732
1882-1892 733
Damm A Guanter L Laurent VCE Schaepman ME Schickling A amp Rascher U 734
(2014) FLD-based retrieval of sun-induced chlorophyll fluorescence from medium 735
30
spectral resolution airborne spectroscopy data Remote Sensing of Environment 147 256-736
266 737
Damm A Guanter L Verhoef W Schlaumlpfer D Garbari S amp Schaepman ME (2015) 738
Impact of varying irradiance on vegetation indices and chlorophyll fluorescence derived 739
from spectroscopy data Remote Sensing of Environment 156 202-215 740
Demmig-Adams B (1998) Survey of thermal energy dissipation and pigment composition in 741
sun and shade leaves Plant and Cell Physiology 39 474-482 742
Drolet GG Middleton EM Huemmrich KF Hall FG Amiro BD Barr AG Black 743
TA McCaughey JH amp Margolis HA (2008) Regional mapping of gross light-use 744
efficiency using MODIS spectral indices Remote Sensing of Environment 112 3064-3078 745
Eugster W amp Senn W (1995) A cospectral correction model for measurement of turbulent 746
NO2 fluxes Boundary-Layer Meteorology 74 321-340 747
Eugster W Zeyer K Zeeman M Michna P Zingg A Buchmann N amp Emmenegger 748
L (2007) Methodical study of nitrous oxide eddy covariance measurements using 749
quantum cascade laser spectrometery over a Swiss forest Biogeosciences 4 927-939 750
Falge E Baldocchi D Olson R Anthoni P Aubinet M Bernhofer C Burba G 751
Ceulemans R Clement R Dolman H Granier A Gross P Grunwald T Hollinger 752
D Jensen NO Katul G Keronen P Kowalski A Lai CT Law BE Meyers T 753
Moncrieff H Moors E Munger JW Pilegaard K Rannik U Rebmann C Suyker 754
A Tenhunen J Tu K Verma S Vesala T Wilson K amp Wofsy S (2001) Gap 755
filling strategies for defensible annual sums of net ecosystem exchange Agricultural and 756
Forest Meteorology 107 43-69 757
Falloon P amp Betts R (2010) Climate impacts on European agriculture and water 758
management in the context of adaptation and mitigation-The importance of an integrated 759
approach Science of the Total Environment 408 5667-5687 760
Foken T amp Wichura B (1996) Tools for quality assessment of surface-based flux 761
measurements Agricultural and Forest Meteorology 78 83-105 762
Fournier A Daumard F Champagne S Ounis A Goulas Y amp Moya I (2012) Effect 763
of canopy structure on sun-induced chlorophyll fluorescence Isprs Journal of 764
Photogrammetry and Remote Sensing 68 112-120 765
Frankenberg C Fisher JB Worden J Badgley G Saatchi SS Lee JE Toon GC 766
Butz A Jung M Kuze A amp Yokota T (2011) New global observations of the 767
terrestrial carbon cycle from GOSAT Patterns of plant fluorescence with gross primary 768
productivity Geophysical Research Letters 38 769
31
Gamon JA amp Berry JA (2012) Facultative and constitutive pigment effects on the 770
Photochemical Reflectance Index (PRI) in sun and shade conifer needles Israel Journal of 771
Plant Sciences 60 85-95 772
Gamon JA Coburn C Flanagan LB Huemmrich KF Kiddle C Sanchez-Azofeifa 773
GA Thayer DR Vescovo L Gianelle D Sims DA Rahman AF amp Pastorello 774
GZ (2010) SpecNet revisited bridging flux and remote sensing communities Canadian 775
Journal of Remote Sensing 36 S376-S390 776
Gamon JA Penuelas J amp Field CB (1992) A narrow-waveband spectral index that 777
tracks diurnal changes in photosynthetic efficiency Remote Sensing of Environment 41 778
35-44 779
Garbulsky MF Filella I Verger A amp Penuelas J (2014) Photosynthetic light use 780
efficiency from satellite sensors From global to Mediterranean vegetation Environmental 781
and Experimental Botany 103 3-11 782
Garbulsky MF Penuelas J Papale D Ardo J Goulden ML Kiely G Richardson 783
AD Rotenberg E Veenendaal EM amp Filella I (2010) Patterns and controls of the 784
variability of radiation use efficiency and primary productivity across terrestrial 785
ecosystems Global Ecology and Biogeography 19 253-267 786
Gege P Fries J Haschberger P Schoumltz P Schwarzer H Strobl P Suhr B Ulbrich 787
G amp Vreeling WJ (2009) Calibration facility for airborne imaging spectrometers 788
ISPRS Journal of Photogrammetry amp Remote Sensing 64 387ndash397 789
Gitelson AA amp Gamon JA (2015) The need for a common basis for defining light-use 790
efficiency Implications for productivity estimation Remote Sensing of Environment 156 791
196-201 792
Goetz SJ amp Prince SD (1999) Modelling terrestrial carbon exchange and storage 793
Evidence and implications of functional convergence in light-use efficiency Advances in 794
Ecological Research Vol 28 (pp 57-92) 795
Govindjee (2004) Chlorophyll a fluorescence A bit of basics and history In GC 796
Papageorgiou amp Govindjee (Eds) Chlorophyll a Fluorescence A Signature of 797
Photosynthesis Advances in Photosynthesis and Respiration (pp 1-42) Dordrecht 798
Springer 799
Guanter L Alonso L Gomez-Chova L Amoros-Lopez J Vila J amp Moreno J (2007) 800
Estimation of solar-induced vegetation fluorescence from space measurements 801
Geophysical Research Letters 34 doi 1010292007GL029289 802
32
Guanter L Alonso L Gomez-Chova L Meroni M Preusker R Fischer J amp Moreno 803
J (2010) Developments for vegetation fluorescence retrieval from spaceborne high-804
resolution spectrometry in the O2-A and O2-B absorption bands Journal of Geophysical 805
Research-Atmospheres 115 806
Guanter L Frankenberg C Dudhia A Lewis PE Goacutemez-Dans J Kuze A Suto H amp 807
Grainger R (2012) Retrieval and global assessment of terrestrial chlorophyll fluorescence 808
from GOSAT space measurements Remote Sensing of Environment 121 236-251 809
Guanter L Rossini M Colombo R Meroni M Frankenberg C Lee J-E amp Joiner J 810
(2013) Using field spectroscopy to assess the potential of statistical approaches for the 811
retrieval of sun-induced chlorophyll fluorescence from ground and space Remote Sensing 812
of Environment 133 52-61 813
Guanter L Zhang Y Jung M Joiner J Voigt M Berry JA Frankenberg C Huete 814
AR Zarco-Tejada P Lee J-E Moran MS Ponce-Campos G Beer C Camps-815
Valls G Buchmann N Gianelle D Klumpp K Cescatti A Baker JM amp Griffis 816
TJ (2014) Global and time-resolved monitoring of crop photosynthesis with chlorophyll 817
fluorescence Proceedings of the National Academy of Sciences of the United States of 818
America 111 E1327-E1333 819
Haboudane D Miller JR Pattey E Zarco-Tejada PJ amp Strachan IB (2004) 820
Hyperspectral vegetation indices and novel algorithms for predicting green LAI of crop 821
canopies Modeling and validation in the context of precision agriculture Remote Sensing 822
of Environment 90 337-352 823
Hanan NP Burba G Verma SB Berry JA Suyker A amp Walter-Shea EA (2002) 824
Inversion of net ecosystem CO2 flux measurements for estimation of canopy PAR 825
absorption Global Change Biology 8 563-574 826
Hernandez-Clemente R Navarro-Cerrillo RM Suarez L Morales F amp Zarco-Tejada 827
PJ (2011) Assessing structural effects on PRI for stress detection in conifer forests 828
Remote Sensing of Environment 115 2360-2375 829
Hilker T Coops NC Wulder MA Black TA amp Guy RD (2008) The use of remote 830
sensing in light use efficiency based models of gross primary production A review of 831
current status and future requirements Science of the Total Environment 404 411-423 832
Hilker T Gitelson A Coops NC Hall FG amp Black TA (2011) Tracking plant 833
physiological properties from multi-angular tower-based remote sensing Oecologia 165 834
865-876 835
33
Hilker T Lyapustin A Hall FG Wang Y Coops NC Drolet G amp Black TA 836
(2009) An assessment of photosynthetic light use efficiency from space Modeling the 837
atmospheric and directional impacts on PRI reflectance Remote Sensing of Environment 838
113 2463-2475 839
Hueni A Biesemans J Meuleman K DellEndice F Schlaumlpfer D Adriaensen S 840
Kempenaers S Odermatt D Kneubuehler M Nieke J amp Itten K (2009) Structure 841
Components and Interfaces of the Airborne Prism Experiment (APEX) Processing and 842
Archiving Facility IEEE Transactions on Geoscience and Remote Sensing 47 29-43 843
Hueni A Lenhard K Baumgartner A amp Schaepman M (2013) The APEX (Airborne 844
Prism Experiment - Imaging Spectrometer) Calibration Information System IEEE 845
Transactions on Geoscience and Remote Sensing 51 5169-5180 846
Hueni A Schlaepfer D Jehle M amp Schaepman M (2015) Impacts of Dichroic Prism 847
Coatings on Radiometry of the Airborne Imaging Spectrometer APEX Applied Optics 53 848
5344-5352 849
Imhoff ML Bounoua L Ricketts T Loucks C Harriss R amp Lawrence WT (2004) 850
Global patterns in human consumption of net primary production Nature 429 870-873 851
IPCC (2013) Summary for policymakers Climate change 2013 the physical science basis 852
Cambridge University Press Cambridge United Kingdom and New York NY USA 853
Jacquemoud S amp Baret F (1990) PROSPECT A model of leaf optical properties spectra 854
Remote Sensing of Environment 34 75-91 855
Jehle M Hueni A Damm A DOdorico P Kneubuumlhler M Meuleman K Schlapfer 856
D Schaepman ME amp Weyermann J (2010) APEX - current status performance and 857
validation concept IEEE Sensors 2010 Conference 533-537 858
Joiner J Guanter L Lindstrot R Voigt M Vasilkov AP Middleton EM Huemmrich 859
KF Yoshida Y amp Frankenberg C (2013) Global monitoring of terrestrial chlorophyll 860
fluorescence from moderate spectral resolution near-infrared satellite measurements 861
methodology simulations and application to GOME-2 Atmos Meas Tech Discuss 6 862
3883-3930 863
Jung M Reichstein M Margolis HA Cescatti A Richardson AD Arain MA 864
Arneth A Bernhofer C Bonal D Chen J Gianelle D Gobron N Kiely G Kutsch 865
W Lasslop G Law BE Lindroth A Merbold L Montagnani L Moors EJ 866
Papale D Sottocornola M Vaccari F amp Williams C (2011) Global patterns of land-867
atmosphere fluxes of carbon dioxide latent heat and sensible heat derived from eddy 868
34
covariance satellite and meteorological observations Journal of Geophysical Research-869
Biogeosciences 116 870
Kljun N Kastner-Klein P Fedorovich E amp Rotach MW (2004) Evaluation of 871
Lagrangian footprint model using data from wind tunnel convective boundary layer 872
Agricultural and Forest Meteorology 127 189-201 873
Kljun N Rotach MW amp Schmid HP (2002) A three-dimensional backward lagrangian 874
footprint model for a wide range of boundary-layer stratifications Boundary-Layer 875
Meteorology 103 205-226 876
Knyazikhin Y Schull MA Stenberg P Mottus M Rautiainen M Yang Y Marshak 877
A Latorre Carmona P Kaufmann RK Lewis P Disney MI Vanderbilt V Davis 878
AB Baret F Jacquemoud S Lyapustin A amp Myneni RB (2013) Hyperspectral 879
remote sensing of foliar nitrogen content Proceedings of the National Academy of 880
Sciences of the United States of America 110 E185-E192 881
Kovac D Malenovsky Z Urban O Spunda V Kalina J Ac A Kaplan V amp Hanus 882
J (2013) Response of green reflectance continuum removal index to the xanthophyll de-883
epoxidation cycle in Norway spruce needles Journal of Experimental Botany 64 1817-884
1827 885
Krausmann F Erb K-H Gingrich S Haberl H Bondeau A Gaube V Lauk C 886
Plutzar C amp Searchinger TD (2013) Global human appropriation of net primary 887
production doubled in the 20th century Proceedings of the National Academy of Sciences 888
of the United States of America 110 10324-10329 889
Lasslop G Reichstein M Papale D Richardson AD Arneth A Barr A Stoy P amp 890
Wohlfahrt G (2010) Separation of net ecosystem exchange into assimilation and 891
respiration using a light response curve approach critical issues and global evaluation 892
Global Change Biology 16 187-208 893
Laurent VCE Verhoef W Damm A Schaepman ME amp Clevers JGPW (2013) A 894
Bayesian object-based approach for estimating vegetation biophysical variables from at-895
sensor APEX radiance data Remote Sensing of Environment 139 6-17 896
Lee JE Berry JA Van der Tol C Yang X Guanter L Damm A Baker I amp 897
Frankenberg C (2015) Simulations of chlorophyll fluorescence in corporated into the 898
Community Land Model version 4 Global Change Biology in print 899
Lewis P amp Disney M (2007) Spectral invariants and scattering across multiple scales from 900
within-leaf to canopy Remote Sensing of Environment 109 196-206 901
35
Liu LY amp Cheng ZH (2010) Detection of Vegetation Light-Use Efficiency Based on 902
Solar-Induced Chlorophyll Fluorescence Separated From Canopy Radiance Spectrum Ieee 903
Journal of Selected Topics in Applied Earth Observations and Remote Sensing 3 306-312 904
Louis J Ounis A Ducruet JM Evain S Laurila T Thum T Aurela M Wingsle G 905
Alonso L Pedros R amp Moya I (2005) Remote sensing of sunlight-induced chlorophyll 906
fluorescence and reflectance of Scots pine in the boreal forest during spring recovery 907
Remote Sensing of Environment 96 37-48 908
Maier SW Guumlnther KP amp Stellmes M (2003) Sun-Induced Fluorescence A New Tool 909
for Precision Farming In M McDonald J Schepers L Tartly T van Toai amp D Major 910
(Eds) Digital Imaging and Spectral Techniques Applications to Precision Agriculture 911
and Crop Physiology (pp 209-222) ASA Special Publication 912
Mauder M Foken T Clement R Elbers JA Eugster W Gruenwald T Heusinkveld 913
B amp Kolle O (2008) Quality control of CarboEurope flux data - Part 2 Inter-914
comparison of eddy-covariance software Biogeosciences 5 451-462 915
Meroni M Busetto L Guanter L Cogliati S Crosta GF Migliavacca M Panigada 916
C Rossini M amp Colombo R (2010) Characterization of fine resolution field 917
spectrometers using solar Fraunhofer lines and atmospheric absorption features Applied 918
Optics 49 2858-2871 919
Meroni M Picchi V Rossini M Cogliati S Panigada C Nali C Lorenzini G amp 920
Colombo R (2008) Leaf level early assessment of ozone injuries by passive fluorescence 921
and photochemical reflectance index International Journal of Remote Sensing 29 5409-922
5422 923
Meroni M Rossini M Guanter L Alonso L Rascher U Colombo R amp Moreno J 924
(2009) Remote sensing of solar induced chlorophyll fluorescence review of methods and 925
applications Remote Sensing of Environment doi101016jrse200905003 926
Michaelis L amp Menten ML (1913) The kenetics of the inversion effect Biochemische 927
Zeitschrift 49 333-369 928
Middleton E McMurtney JE Campbell PK Corp LA Butcher LM amp Chappelle 929
EW (2002) Optical and fluorescence properties of corn leaves from different nitrogen 930
regimes In M Owe G Durso amp L Toulios (Eds) Conference on Remote Sensing for 931
Agriculture Ecosystems and Hydrology IV (pp 72-83) Agia Pelagia Greece 932
Miller JR Berger M Goulas Y Jacquemoud S Louis J Moise N Mohammed G 933
Moreno J Moya I Pedroacutes R Verhoef W amp Zarco-Tejada PJ (2005) Development 934
36
of a vegetation fluorescence canopy model Final Report May 2005 In European Space 935
Research and Technology Centre (ESTEC) 936
Monteith JL (1972) Solar-radiation and productivity in tropical ecosystems Journal of 937
Applied Ecology 9 747-766 938
Niinemets U Kollist H Garcia-Plazaola JI Hernandez A amp Becerril JM (2003) Do 939
the capacity and kinetics for modification of xanthophyll cycle pool size depend on growth 940
irradiance in temperate trees Plant Cell and Environment 26 1787-1801 941
Nobel PS Forseth IN amp Long SP (1993) Canopy structure and light interception 942
Ozanne CMP Anhuf D Boulter SL Keller M Kitching RL Korner C Meinzer 943
FC Mitchell AW Nakashizuka T Dias PLS Stork NE Wright SJ amp 944
Yoshimura M (2003) Biodiversity meets the atmosphere A global view of forest 945
canopies Science 301 183-186 946
Parazoo NC Bowman K Fisher JB Frankenberg C Jones DBA Cescatti A Peacuterez-947
Priego Oacute Wohlfahrt G amp Montagnani L (2014) Terrestrial gross primary production 948
inferred from satellite fluorescence and vegetation models Global Change Biology na-na 949
Plascyk JA (1975) MK II Fraunhofer Line Dicsriminator (FLD-II) for airborne and orbital 950
remote-sensing of solar-stimulated luminescence Optical Engineering 14 339-346 951
Porcar-Castell A Tyystjaumlrvi E Atherton J Van der Tol C Flexas J EE P Moreno 952
J Frankenberg C amp Berry JA (2014) Linking chlorophyll a fluorescence to 953
photosynthesis for remote sensing applications mechanisms and challenges Journal of 954
Experimental Botany 65 4065-4095 955
Rascher U Agati G Alonso L Cecci G Champagne S Colombo R Damm A 956
Daumard F De Miguel E Fernandez G Franch B Franke J Gerbig C Gioli B 957
Gomez JA Goulas Y Guanter L Gutierrez-De-La-Camara O Hamdi K Hostert 958
P Jimenez M Kosvancova M Lognoli D Meroni M Miglietta F Moersch A 959
Moreno J Moya I Neininger B Okujeni A Ounis A Palombi L Raimondi V 960
Schickling A Sobrino JA Stellmes M Toci G Toscano P Udelhoven T Van der 961
Linden S amp Zaldei A (2009) CEFLES2 The remote sensing component to quantify 962
photosynthetic efficiency from the leaf to the region by measuring sun-induced 963
fluorescence in the oxygen absorption bands Biogeosciences 6 1181-1198 964
Richter R amp Schlaumlpfer D (2002) Geo-atmospheric processing of airborne imaging 965
spectrometry data Part 2 Atmospherictopographic correction International Journal of 966
Remote Sensing 23 2631-2649 967
37
Rossini M Meroni M Migliavacca M Manca G Cogliati S Busetto L Picchi V 968
Cescatti A Seufert G amp Colombo R (2010) High resolution field spectroscopy 969
measurements for estimating gross ecosystem production in a rice field Agricultural and 970
Forest Meteorology 150 1283-1296 971
Rossini M Nedbal L Guanter L Ač A Alonso L Burkart A Cogliati S Colombo 972
R Damm A Drusch M Hanus J Julitta T Kokkalis P Moreno J Panigada C 973
Pinto F Schickling A Schuumlttemeyer D Zemek F amp Rascher U (2015) Red and far-974
red sun-induced chlorophyll fluorescence as a measure of plant photosynthesis 975
Geophysical Research Letters (accepted for publication) 976
Ruimy A Jarvis PG Baldocchi DD amp B S (1995) CO2 Fluxes over Plant Canopies 977
and Solar Radiation A Review Advances in Ecological Research 26 1-68 978
Running SW Nemani RR Heinsch FA Zhao MS Reeves M amp Hashimoto H 979
(2004) A continuous satellite-derived measure of global terrestrial primary production 980
Bioscience 54 547-560 981
Schaepman ME M J Hueni A DrsquoOdorico P Damm A Weyermann J Schneider F 982
Laurent VCE C P Seidel F Lenhard K Gege P Kuechler C Brazile J Kohler 983
P De Vos L Meuleman K Meynart R Schlaepfer D Kneubuumlhler M amp Itten K 984
(2015) Advanced radiometry measurements and Earth science applications with the 985
Airborne Prism Experiment (APEX) Remote Sensing of Environment 158 207-219 986
Schimel D Pavlick R Fisher JB Asner GP Saatchi S Townsend P Miller C 987
Frankenberg C Hibbard K amp Cox P (2014) Observing terrestrial ecosystems and the 988
carbon cycle from space Global Change Biology na-na 989
Schlaumlpfer D amp Richter R (2002) Geo-atmospheric processing of airborne imaging 990
spectrometry data Part 1 Parametric orthorectification International Journal of Remote 991
Sensing 23 2609-2630 992
Schneider FD Leiterer R Morsdorf F Gastellu-Etchegorry J-P Lauret N Pfeifer N 993
amp Schaepman ME (2014) Simulating imaging spectrometer data 3D forest modeling 994
based on LiDAR and in situ data Remote Sensing of Environment 152 235-250 995
Schroter D Cramer W Leemans R Prentice IC Araujo MB Arnell NW Bondeau 996
A Bugmann H Carter TR Gracia CA de la Vega-Leinert AC Erhard M Ewert 997
F Glendining M House JI Kankaanpaa S Klein RJT Lavorel S Lindner M 998
Metzger MJ Meyer J Mitchell TD Reginster I Rounsevell M Sabate S Sitch 999
S Smith B Smith J Smith P Sykes MT Thonicke K Thuiller W Tuck G 1000
38
Zaehle S amp Zierl B (2005) Ecosystem service supply and vulnerability to global change 1001
in Europe Science 310 1333-1337 1002
Sitch S Smith B Prentice IC Arneth A Bondeau A Cramer W Kaplan JO Levis 1003
S Lucht W Sykes MT Thonicke K amp Venevsky S (2003) Evaluation of ecosystem 1004
dynamics plant geography and terrestrial carbon cycling in the LPJ dynamic global 1005
vegetation model Global Change Biology 9 161-185 1006
Stewart DW Costa C Dwyer LM Smith DL Hamilton RI amp Ma BL (2003) 1007
Canopy structure light interception and photosynthesis in maize Agronomy Journal 95 1008
1465-1474 1009
Trnka M Dubrovsky M amp Zalud Z (2004) Climate change impacts and adaptation 1010
strategies in spring barley production in the Czech Republic Climatic Change 64 227-1011
255 1012
Turner DP Ritts WD Cohen WB Maeirsperger TK Gower ST Kirschbaum AA 1013
Running SW Zhao MS Wofsy SC Dunn AL Law BE Campbell JL Oechel 1014
WC Kwon HJ Meyers TP Small EE Kurc SA amp Gamon JA (2005) Site-level 1015
evaluation of satellite-based global terrestrial gross primary production and net primary 1016
production monitoring Global Change Biology 11 666-684 1017
van der Tol C Berry J Campbell PKE amp Rascher U (2014) Models of fluorescence 1018
and photosynthesis for interpreting measurements of solar-induced chlorophyll 1019
fluorescence Journal of Geophysical Research Biogeosciences IN PRESS 1020
van der Tol C Verhoef W amp Rosema A (2009a) A model for chlorophyll fluorescence 1021
and photosynthesis at leaf scale Agricultural and Forest Meteorology 149 96-105 1022
van der Tol C Verhoef W Timmermans A Verhoef A amp Su Z (2009b) An integrated 1023
model of soil-canopy spectral radiances photosynthesis fluorescence temperature and 1024
energy balance Biogeosciences 6 3109-3129 1025
Verhoef W (1984) Light scattering by leaf layers with application to canopy reflectance 1026
modeling The SAIL model Remote Sensing of Environment 16 125-141 1027
Verhoef W amp Bach H (2003a) Remote sensing data assimilation using coupled radiative 1028
transfer models Physics and Chemistry of the Earth 28 3-13 1029
Verhoef W amp Bach H (2003b) Simulation of hyperspectral and directional radiance 1030
images using coupled biophysical and atmospheric radiative transfer models Remote 1031
Sensing of Environment 87 23-41 1032
39
Verhoef W amp Bach H (2007) Coupled soil-leaf-canopy and atmosphere radiative transfer 1033
modeling to simulate hyperspectral multi-angular surface reflectance and TOA radiance 1034
data Remote Sensing of Environment 109 166-182 1035
Verhoef W Jia L Xiao Q amp Su Z (2007) Unified optical-thermal four-stream radiative 1036
transfer theory for homogeneous vegetation canopies Ieee Transactions on Geoscience 1037
and Remote Sensing 45 1808-1822 1038
Webb EK Pearman GI amp Leuning R (1980) Correction of flux measurements for 1039
density effects due to heat and water-vapour transfer Quarterly Journal of the Royal 1040
Meteorological Society 106 85-100 1041
Wu C Niu Z Tang Q amp Huang W (2010) Revised photochemical reflectance index 1042
(PRI) for predicting light use efficiency of wheat in a growth cycle validation and 1043
comparison International Journal of Remote Sensing 31 2911-2924 1044
Yang X Tang J Mustard JF Lee JE Rossini M Joiner J Munger JW Kornfeld 1045
A amp Richardson AD (2015) Solar-induced chlorophyll fluorescence that correlates with 1046
canopy photosynthesis on diurnal and seasonal scales in a temperate deciduous forest 1047
Geophysical Research Letters 1048
Zarco-Tejada PJ Berni JAJ Suarez L Sepulcre-Canto G Morales F amp Miller JR 1049
(2009) Imaging chlorophyll fluorescence with an airborne narrow-band multispectral 1050
camera for vegetation stress detection Remote Sensing of Environment 113 1262-1275 1051
Zarco-Tejada PJ Gonzalez-Dugo V amp Berni JAJ (2012) Fluorescence temperature and 1052
narrow-band indices acquired from a UAV platform for water stress detection using a 1053
micro-hyperspectral imager and a thermal camera Remote Sensing of Environment 117 1054
322-337 1055
Zarco-Tejada PJ Morales A Testi L amp Villalobos FJ (2013) Spatio-temporal patterns 1056
of chlorophyll fluorescence and physiological and structural indices acquired from 1057
hyperspectral imagery as compared with carbon fluxes measured with eddy covariance 1058
Remote Sensing of Environment 133 102-115 1059
Zhang Q Middleton EM Cheng YB amp Landis DR (2013) Variations of foliage 1060
chlorophyll fAPAR and foliage non-chlorophyll fAPAR (fAPARchl fAPARnonchl) at the 1061
Harvard Forest Ieee Journal of Selected Topics in Applied Earth Observations and Remote 1062
Sensing 6 2254-2264 1063
Zhang Q Middleton EM Gao BC amp Cheng YB (2012) Using EO-1 hyperion to 1064
simulate HyspIRI products for a coniferous forest The fraction of par absorbed by 1065
40
chlorophyll (fAPAR chl) and leaf water content (LWC) Ieee Transactions on Geoscience 1066
and Remote Sensing 50 1844-1852 1067
Zhang Y Guanter L Berry JA Joiner J van der Tol C Huete A Gitelson A Voigt 1068
M amp Koumlhler P (2014) Estimation of vegetation photosynthetic capacity from space-1069
based measurements of chlorophyll fluorescence for terrestrial biosphere models Global 1070
Change Biology 20 3727-3742 1071
1072
41
Appendix-A APEX data calibration 1073
The calibration of APEX images is based on the APEX Processing and Archiving Facility 1074
(PAF) which is the combined software and hardware designed to generate calibrated level 1 1075
at-sensor radiances from APEX raw image streams (Hueni et al 2009) Calibration 1076
coefficients for the radiometric geometric and spectral calibrations are generated from system 1077
calibrations at the APEX Calibration Home Base (CHB) at DLR Oberpfaffenhofen (Gege et 1078
al 2009) These CHB data are stored and processed within the APEX Calibration Information 1079
System (CAL IS) producing the so-called calibration cubes holding coefficients for each 1080
spatio-spectral pixel (Hueni et al 2013) 1081
For the multi-temporal dataset employed within this study all flight lines were 1082
reprocessed from the original raw image streams to ensure that the same version of the 1083
processor was applied The APEX PAF and CAL IS have significantly evolved over the 1084
timeframe of the dataset with calibrations getting more accurate over the years To ensure 1085
consistency all data were calibrated using coefficients obtained in May 2013 1086
The processor was specifically configured to retain the highest information content in 1087
the VNIR channel including i) no spectral resampling to compensate for spectral shifts and 1088
misregistrations (DOdorico et al 2010 DOdorico et al 2011) ii) no compensation of 1089
spectral shift related changes in radiometry (Hueni et al 2015) and iii) no spatial 1090
misregistration correction The calibration was thus effectively reduced to a linear dark 1091
current correction over time a de-smearing of the visible-NIR channel to compensate for 1092
sensor smear effects the application of radiometric gains and offsets followed by a destriping 1093
routine working in the spatial dimension only to remove pushbroom related along track 1094
striping Calibrated radiance data were directly used for the fluorescence retrieval (see Section 1095
24) while the feasibility to use APEX for SIF760 retrievals was theoretically demonstrated in 1096
42
a study of Damm et al (2011) Resulting SIF760 maps were afterwards geo-rectified using a 1097
parametric geocoding approach (Schlaumlpfer and Richter 2002) 1098
43
Appendix-B Retrieval of SIF760 from airborne data 1099
The quantification of SIF measured with ground or airborne-based spectrometers 1100
requires separating emitted SIF from the reflected radiance flux The Fraunhofer Line Depth 1101
(FLD) approach introduced by Plascyk (1975) serves as a de facto standard for medium 1102
resolution instruments such as APEX (Meroni et al 2009) and was applied in our study The 1103
FLD method uses atmospheric absorption bands characterized by lower incident light 1104
compared to wavelength regions outside of these bands This configuration increases the 1105
spectral information and allows the separation of SIF from reflected radiation In this study 1106
we used the broad O2-A oxygen absorption band around 760 nm and quantified the infilling of 1107
SIF760 using radiance measurements inside (subscript i) and outside (subscript o) of the O2-A 1108
band 1109
For the airborne case only atmospheric components can be simulated with 1110
MODTRAN-5 assuming perfect knowledge of the acquisition conditions The reflectance 1111
terms for diffuse and direct irradiance as well as the SIF760 contribution are usually unknown 1112
Assuming Lambertian surface reflectance behavior which introduces some inaccuracies but 1113
allows formulating the radiative transfer (RT) for radiance measurements at sensor level (LAtS) 1114
to obtain SIF760 both measurements inside and outside of the absorption band can be 1115
expressed as 1116
E9FA lang3H IJK LMNrangP QlangRSE rang T UlangVWWH VXWH rang∙langVYYH VYXH rangZH
Hlang[XXH rang T ABCHUlangVWWH ranglangVXWH rangZHlang[XXH rang ] ^ _ (B1) 1117
where E0 is the top-of-atmosphere irradiance including diffuse and direct irradiance 1118
components θil is the illumination zenith angle ρso is the path scattered radiance τss is the 1119
direct transmittance for sunlight τoo is the direct transmittance in view direction τsd is the 1120
diffuse transmittance of the atmosphere for sunlight τdo is the hemispherical-directional 1121
transmittance in view direction and ρdd is the spherical albedo If these atmospheric 1122
44
components are obtained from MODTRAN-5 simulations (Damm et al 2015 Verhoef and 1123
Bach 2003a b 2007) the radiative transfer equation (Eq B1) only contains four unknowns 1124
namely Ri Ro SIFi and SIFo The 3FLD method (Maier et al 2003) which is an adaptation of 1125
the original FLD method proposed by (Plascyk 1975) was used to linearly relate R and SIF 1126
inside and outside of the O2-A absorption band SIF can be finally retrieved with 1127
13 -0 abcMUdWecWlangRff_ rangZghcWUdMecMlangRff^ rangZiUdWecWlangRff_ rangZghUdMecMlangRff^ rangZ j
langVWWM ranglangVXWM rang (B2) 1128
kE lE9FA m lang3HW IJK LMNrangP langRSE rangn ] ^ _ (B3) 1129
E lang3HW IJK LMNrangP langoSSE TopSE rang ∙ langoE opE rang qEprs T Eprt] ^ _ (B4) 1130
r S13rlangoSSr rang T langopSr rang v13S$langoSSS rang T langopSS rangw (B5) 1131
where B is the factor relating SIFi and SIFo and was fixed to a value of 08 justified by 1132
simulations and experiments (Rascher et al 2009 Alonso et al 2008) Xj equals the at-1133
sensor radiance (reflected plus emitted radiation) without path radiance contribution and Ej 1134
expresses surface irradiance as measured at the sensor level A is the factor relating Ri and Ro 1135
and was derived from linear interpolation of R of the left (758 nm) and right (771 nm) O2-A 1136
band shoulder with 1137
xx+ (B6) 1138
y ```-0```z and y `-0`z
```z (B7) 1139
1140
Because APEX suffered from slight spectral smile effects (DOdorico et al 2010) 1141
updated center wavelength positions were involved in the convolution approach The spectral 1142
shift quantification for each pixel across track was based on the Cr method as described in 1143
45
Meroni et al (2010) The method assumes a high correlation between a measured and a 1144
convolved spectrum and iteratively minimizes a cost function which is 1 minus the Pearson 1145
correlation coefficient (r) calculated for both signals Remaining artifacts of the spectral shift 1146
correction and slightly inaccurate estimates of atmospheric properties cause SIF760 retrieval 1147
uncertainties We therefore applied a semi-empirical correction as described in Damm et al 1148
(2014) for each scan line across the track This technique employs reference surfaces which 1149
are free of any SIF760 emission (eg bare soil) to adjust the upward transmittance term inside 1150
the absorption feature oSSr The retrieval of SIF760 from top-of-canopy radiance data measured 1151
on ground follows the same approach as described in Eqs B2-B7 under the assumption that 1152
the surface irradiance can be approximated with the measurement of a reference panel and 1153
that ρso τdo and τdo can be set to 0 Furthermore the spectral resolution of APEX can be 1154
considered suboptimal for SIF760 retrievals although Damm et al (2011) demonstrate that 1155
APEX with its spectral resolution of 54 nm at 760 nm is sensitive for SIF760 However 1156
retrieved SIF760 values are too high and in an absolute sense incorrect We used reference 1157
SIF760 data obtained in parallel to the airborne acquisitions using the ASD field spectrometers 1158
(Section 23) to estimate the actual offset The observed scaling factor of 193 was afterwards 1159
applied to the retrieved SIF760 values to transfer them to a realistic value range 1160
46
Appendix-C SIF retrieval accuracy 1161
We applied a quantitative accuracy evaluation of resulting SIF760 maps using ground 1162
measured SIF760 values (Figure C1) Considering all reference data acquired during five 1163
campaigns a good linear relationship was achieved between ground and airborne-based 1164
SIF760 values (r2 = 071) but with a proportionality factor much higher than 1 (Figure C1-A) 1165
This experimentally obtained systematic overestimation of APEX SIF760 is comparable to 1166
simulation results documented in Damm et al (2011) Further we found slightly changing 1167
correlations between the different years (several linear models in Figure C1-A) which are 1168
likely caused by canopy structural effects spectral and radiometric performances of used 1169
ground instruments or slight deviations of the performance of APEX over time 1170
To compensate for the overestimation of APEX SIF760 we applied an empirical correction 1171
factor of 193 derived from the comparison of reference data and APEX which resulted in a 1172
rRMSE of 289 (Figure C1-B) 1173
1174
lt Figure C1 gt 1175
1176
The Laegeren site was covered with three adjacent flight lines having an overlap of 1177
approximately 10 (cf Figure 3) This configuration provides the opportunity to 1178
quantitatively evaluate the consistency of SIF retrievals obtained from different measurements 1179
and view zenith angles (ie plusmn 135deg) The comparison of SIF760 retrievals obtained from flight 1180
lines 1 and 2 reveals a moderate linear relationship for homogeneous agricultural surfaces (r2 1181
= 081 rRMSE = 57) We observed a systematic underestimation of flight line 1 compared 1182
to flight line 2 (factor 06) for a view zenith angle difference of ~26deg for SIF760 indicating 1183
either a directionality of SIF760 emissions or an insufficient decoupling of surface HCRF 1184
affected by reflectance anisotropy With increasing surface heterogeneity scattering increases 1185
47
and the agreement of retrieved SIF from both flight lines slightly decreases (ie for forested 1186
areas r2 of 05 and rRMSE of 88) This lower correlation can be mainly associated to slight 1187
geometric mis-registrations (ie max 2 pixel ~ 40 m) in combination with surface 1188
heterogeneity (eg shaded and sunlit tree crowns) and emission anisotropy of SIF760 Also 1189
negative SIF760 values are present in the SIF760 maps and caused by sensor noise and 1190
especially for forests due to shadowing effects (Damm et al 2015) 1191
48
Appendix-D Technical aspects determining the SIF760 retrieval accuracy 1192
A rigorous evaluation of the SIF760 retrieval accuracy is crucial to judge the reliability 1193
of our assessment on the relationship between SIF760 and GPPEC across ecosystems 1194
Furthermore additional factors imposing variations on SIF760 retrieved from airborne 1195
spectroscopy data that cannot be related to the physiological origin of SIF760 needs to be 1196
critically discussed to justify the proposed approach 1197
Ground-based measurements of SIF760 were made using field spectrometers to validate 1198
the airborne retrievals Field spectroscopy provides a good reference for validating airborne 1199
retrievals as it is likely not affected by biases resulting from atmospheric composition 1200
estimates (eg aerosol load) due to the simultaneous measurement of irradiance fluxes at 1201
canopy level using a reference panel The reliability of the applied field spectroscopic 1202
approach to measure SIF760 was previously demonstrated using field studies (Damm et al 1203
2010 Liu and Cheng 2010 Meroni et al 2009 Rascher et al 2009) and theoretical 1204
assessments (Damm et al 2011) It must be noted that field spectroscopic approaches are 1205
subject to uncertainties particularly for heterogeneous vegetation canopies Damm et al 1206
(2015) discussed retrieval errors caused by illumination effects likely introducing slight 1207
errors in reference SIF760 This source of uncertainty must be considered when judging the 1208
accuracy of APEX SIF760 The nevertheless good agreement between ground and airborne 1209
observations indicated that atmospheric absorption and scattering effects could be sufficiently 1210
compensated and thus demonstrated the reliability of retrieved SIF760 measurements In 1211
particular the empirical correction applied making use of high spatial resolution airborne IS 1212
data in combination with reference surfaces not emitting SIF760 allowed to bypass retrieval 1213
uncertainties caused by atmospheric effects (Damm et al 2014) 1214
Instrumental effects in combination with retrieval methods were found to cause 1215
systematic differences in SIF760 retrievals (Damm et al 2011) the comparatively low 1216
49
resolution of APEX around the O2-A band used to retrieve SIF760 (ie ~54 nm) resulted in an 1217
overestimation of APEX SIF760 compared to retrievals from high resolution instruments 1218
Indeed maximum APEX SIF760 values are 6 mW m-2 sr-1 nm-1 while typical SIF760 values 1219
obtained from high resolution instruments range between 0 and 3 mW m-2 sr-1 nm-1 (Guanter 1220
et al 2013) Considering SIF760 values retrieved from ASD data in original resolution (3 nm) 1221
APEX showed an overestimation of 1102 which confirmed that low spectral resolution 1222
resulted in an overestimation of SIF760 The reasoning for this absolute error is given by the 1223
sub-optimal spectral resolution of APEX with 54 nm at 760 nm causing a reduced sensitivity 1224
for SIF760 on the one hand and a wider distance of the O2-A shoulder values used to 1225
parameterize the 3FLD approach on the other hand The bias was corrected using the ASD 1226
reference data and does not impact the results of our analysis Further the relative variation of 1227
SIF760 is unaffected by the bias 1228
Surface heterogeneity complicates the retrieval of SIF760 According to Damm et al 1229
(2015) SIF760 retrievals for forest sites are especially subject to uncertainties due to 1230
assumptions on surface irradiance Crown shapes and associated surface orientations 1231
determine the intensity and quality of irradiance including fractional amounts of diffuse and 1232
direct irradiance To account for pixel wise changes in surface irradiance high resolution 1233
digital object models (DOM) (eg derived from LiDAR observations) are required In 1234
absence of such a high resolution DOMrsquos crowns are assumed to be flat which results in 1235
uncertainties of up to 58 in case of cast shadows (Damm et al 2015) Since we used 1236
averaged observations over larger areas representing flux tower footprints and most of our 1237
data were flown under comparable illumination conditions (ie around solar noon) we 1238
expect these potential biases to be less influential in this analysis 1239
1
Tables 1
Table 1 Date and time of APEX flights and corresponding eddy covariance flux tower 2
measurements for the three investigated ecosystems (ie grassland cropland mixed 3
temperate forest) 4
Date Time [UTC] Location Ecosystem Flux tower
17062009 950 Laegeren forest 1 tower
17062009 1030 Oensingen cropland 1 tower
17062009 1030 Oensingen grassland 2 tower
25062010 1030 Oensingen cropland 1 tower
25062010 1030 Oensingen grassland 2 tower
26062010 1500 Laegeren forest 1 tower
26062010 1030 Oensingen cropland 1 tower
26062010 1030 Oensingen grassland 2 tower
29062010 1030 Laegeren forest 1 tower
26062011 1030 Laegeren forest 1 tower
28062011 1030 Oensingen cropland 1 tower
28062011 1030 Oensingen grassland 1 tower
16062012 1025 Laegeren forest 1 tower
16062012 900 Oensingen cropland 1 tower
16062012 1100 Oensingen cropland 1 tower
12072013 730 Laegeren forest 1 tower
03092013 1050 Laegeren forest 1 tower
5
2
Table 2 Availability of reference SIF760 data obtained from field spectroscopy measurements 6
to validate APEX based SIF760 retrievals 7
Date time [UTC] Location Measured crops Nr points
17062009 1030 Oensingen maize rye pea sugar beet wheat white clover 29 points
25062010 1030 Oensingen maize pea sugar beet wheat white clover 15 points
16062012 900 Oensingen carrot maize winter wheat 11 points
16062012 1100 Oensingen carrot maize winter wheat 10 points
8
3
Table 3 Goodness of fit for the hyperbolic model describing the relationship between GPPEC 9
and SIF760 O PRI and MCARI2 for the three ecosystem types perennial grassland cropland 10
and mixed temperate forest Calculated statistics are based on all data acquired from 2009-11
2013 as described in Table 1 12
Optical variable Ecosystem Regression coefficient Relative RMSE []
SIF crops 088 355
grass 059 2708
forest 048 1588
PRI crops 0008 1176
grass 095 860
forest 009 2179
MCARI2 crops 0005 1029
grass 098 550
forest 034 1798
13
1
Figures 1
2
Figure 1 Study sites A Oensingen agricultural site B Laegeren forest site The white 3
rectangles represent in A the boundary of investigated fields that comprise most of the flux-4
tower footprints and in B a coarse outline of the footprint area of the flux-tower The white 5
crosses show the locations of the flux-towers Background RGB images from Google-Earth 6
2
7
Figure 2 APEX reflectance and SIF760 image for the Oensingen site acquired on the 2606 8
2010 1030 UTC A top-of-canopy hemispherical-conical reflectance data as true color 9
composite B SIF760 map The white boxes indicate the approximate position of the flux 10
tower 11
3
12
Figure 3 APEX reflectance and SIF760 image for the Laegeren site acquired on the 2606 13
2010 1510 UTC A top-of-canopy hemispherical-conical reflectance data as true color 14
composite B SIF760 map The black arrows indicate the flight direction of flight line 1 to 3 15
(FL1-FL3) The white line marks a transect along the overlapping region of FL1 and FL2 The 16
white boxes indicate the approximate position of the flux tower 17
4
18
Figure 4 Relationships between GPPEC from the eddy-covariance measurements and SIF760 O 19
instantaneously measured between 2009 and 2013 (see Table 1) with the airborne 20
spectrometer APEX (A) PRI index (B) and MCARI2 index (C) for three vegetation types 21
(black dots perennial grassland dark grey rectangles cropland including winter wheat pea 22
and barley grey triangles mixed temperate forest) The solid curves correspond to a 23
hyperbolic model fitted to the measured data The dashed curves show the extrapolated 24
behavior 25
5
26
Figure 5 Daily light response curves from eddy flux measurements for A cropland B 27
perennial grassland and C mixed temperate forest Data were acquired between 2009 and 28
2013 (see Table 1) Grey curves represent a fitted hyperbolic model to approximate the 29
behavior of measured PAR-GPP values Crosses show GPPEC measurements that were used 30
for the SIF760 O - GPPEC comparison based on the time of APEX flights PAR values are 31
binned in 20 mW m-2
sr-1
nm-1
increments 32
6
33
Figure 6 Leaf level relationships between photosynthetic (LUEp) and fluorescence yield 34
(LUEf) for a typical C3 crop Dependency of LUEp (A) and LUEf (B) on APAR C 35
Relationship between LUEp and LUEf D Relationship between APAR and GPPL GPPL was 36
calculated as APARLUEp E Relationship between APAR and SIF760 SIF760 was calculated 37
as APARLUEf assuming a constant relationship between the SCOPE output SIFtotalL 38
(integral between 640-850nm) and SIF760L F Relationship between SIF760 L and GPPL All 39
data were simulated using SCOPE The grey areas indicate illumination conditions 40
comparable to APEX flights 41
7
42
Figure 7 Canopy level relationships between photosynthetic (LUEp) and fluorescence yield 43
(LUEf) for different canopy representations of a C3 cropland in SCOPE Dependency of 44
LUEp (A) and LUEf (B) on APAR LUEp was calculate as GPPCAPAR and LUEf was 45
directly obtained from SCOPE C Relationship between LUEp and LUEf D Relationship 46
between APAR and GPPC GPPC was directly obtained from SCOPE E Relationship 47
between APAR and SIF760C SIF760C was directly obtained from SCOPE F Relationship 48
between SIF760C and GPPC The black dashed line corresponds to a C3 cropland with LAI = 49
30 fraction of brown pigments (Cs) = 00 and a spherical (sp) leaf inclination distribution 50
function (LIDF) For the grey line Cs was changed to 20 for the black dashed line the LAI 51
was changed to 10 and for the grey dasheddotted line the LIDF was changed to plagiophile 52
(pg) The grey areas indicate illumination conditions comparable to APEX flights 53
8
54
Figure 8 Impact of temporal scaling on the SIF760C-GPPC relationship SIF760C and GPPC 55
data were simulated using SCOPE Model input parameters air temperature (A) PAR (B) and 56
LAI (C) were measured within the NitroEurope project (httpwwwnitroeuropeeu) at the 57
Speulderbos forest site Netherlands D Relationship between SIF760C and GPPC including a 58
fitted hyperbolic model for daily averages (grey dots and grey line) monthly averages (dark 59
grey triangles and line) and quarterly data (black dots and black dashed line) 60
9
61
Figure C1 Comparison of ground and airborne-based SIF760 retrievals from various crops 62
Data were acquired during four campaigns between 2009 and 2012 in the agricultural site 63
Oensingen (see Table 2) Left Fitted linear regression lines for the four considered campaigns 64
are overlaid in black The dashed line corresponds to the 11 line Right SIF retrievals from 65
APEX after applying an empirical correction factor (193) The black line represents the fitted 66
linear model the dashed line corresponds to the 11 line 67
26
5 Conclusions 632
Remote sensing of SIF provides a new observational approach to assess terrestrial 633
GPP Compared to traditional greenness-based remote sensing parameters we found SIF760 to 634
be more consistently related to GPPEC These results in combination with the more direct 635
mechanistic link between SIF760 and photosynthesis suggest that using SIF760 provides a 636
strategy to decrease uncertainty in estimating GPP across ecosystems 637
Our observational and modeling approaches revealed asymptotic and ecosystem-638
specific relationships for SIF760 and GPPEC We identified a set of interlinked mechanisms 639
determining SIF760-GPPEC relationships to be ecosystem specific ie the photosynthetic 640
capacity and efficiency of ecosystems the confounding impact of non-radiative energy 641
dissipation (NPQ) as well as ecosystem structure and the fraction of non-photosynthetic 642
vegetation components We demonstrated that SIF760-GPPEC relationships scale with temporal 643
aggregation due to a covariance of canopy structure and APAR over the seasonal cycle 644
We suggest going beyond empirical and ecosystem-specific relationships instead 645
using instantaneous observations comprehensively providing information on the full SIF 646
emission vegetation status and functioning as well as environmental conditions in 647
combination with process-based models Such approaches eg suggested for ESArsquos potential 648
ldquoFluorescence Explorerrdquo (FLEX) Earth Explorer mission provide a flexible framework to 649
account for the various influencing factors identified and to successfully apply SIF as 650
constraint of unbiased global GPP estimates 651
Furthermore research is required to improve the comparison between observations of 652
GPPEC and SIF Both observations stem from conceptually contrasting technologies ie 653
measurements of gas exchange vs plant-light interactions and provide independent and 654
complementary access to study ecosystem photosynthesis Despite the need to harmonize 655
horizontally differing footprints the vertical heterogeneity of ecosystems including the 656
27
varying contributions from different ecosystem layers must be better understood to harmonize 657
and successfully integrate both measurements 658
659
Acknowledgements 660
This work was supported by a grant of the Swiss University Conference and ETH-661
Board in frame of the Swiss Earth Observatory Network (SEON) project and by a grant of the 662
European Space Agency (ESA) in frame of the FLEX-PARCS E Paul-Limoges was 663
supported in part by the Natural Sciences and Engineering Research Council of Canada 664
through a postgraduate scholarship We would like to thank the APEX team for acquiring the 665
APEX data Authors sequence is listed following the FLAE approach (doi 666
101371journalpbio0050018) 667
28
References 668
Ammann C Flechard CR Leifeld J Neftel A amp Fuhrer J (2007) The carbon budget of 669
newly established temperate grassland depends on management intensity Agriculture 670
Ecosystems amp Environment 121 5-20 671
Amoros-Lopez J Gomez-Chova L Vila-Frances J Alonso L Calpe J Moreno J amp 672
del Valle-Tascon S (2008) Evaluation of remote sensing of vegetation fluorescence by 673
the analysis of diurnal cycles International Journal of Remote Sensing 29 5423-5436 674
Baker NR (2008) Chlorophyll Fluorescence A probe of photosynthesis in vivo Annual 675
Review of Plant Physiology and Plant Molecular Biology 59 89-113 676
Baldocchi D Falge E Gu LH Olson R Hollinger D Running S Anthoni P 677
Bernhofer C Davis K Evans R Fuentes J Goldstein A Katul G Law B Lee 678
XH Malhi Y Meyers T Munger W Oechel W U KTP Pilegaard K Schmid 679
HP Valentini R Verma S Vesala T Wilson K amp Wofsy S (2001) FLUXNET A 680
new tool to study the temporal and spatial variability of ecosystem-scale carbon dioxide 681
water vapor and energy flux densities Bulletin of the American Meteorological Society 682
82 2415-2434 683
Baldocchi DD (2003) Assessing the eddy covariance technique for evaluating carbon 684
dioxide exchange rates of ecosystems past present and future Global Change Biology 9 685
479-492 686
Balzarolo M Anderson K Nichol C Rossini M Vescovo L Arriga N Wohlfahrt G 687
Calvet J-C Carrara A Cerasoli S Cogliati S Daumard F Eklundh L Elbers JA 688
Evrendilek F Handcock RN Kaduk J Klumpp K Longdoz B Matteucci G 689
Meroni M Montagnani L Ourcival J-M Sanchez-Canete EP Pontailler J-Y 690
Juszczak R Scholes B amp Pilar Martin M (2011) Ground-Based Optical Measurements 691
at European Flux Sites A Review of Methods Instruments and Current Controversies 692
Sensors 11 7954-7981 693
Barcza Z Kern A Haszpra L amp Kljun N (2009) Spatial representativeness of tall tower 694
eddy covariance measurements using remote sensing and footprint analysis Agricultural 695
and Forest Meteorology 149 795-807 696
Barton CVM amp North PRJ (2001) Remote sensing of canopy light use efficiency using 697
the photochemical reflectance index - Model and sensitivity analysis Remote Sensing of 698
Environment 78 264-273 699
Beer C Reichstein M Tomelleri E Ciais P Jung M Carvalhais N Roedenbeck C 700
Arain MA Baldocchi D Bonan GB Bondeau A Cescatti A Lasslop G Lindroth 701
29
A Lomas M Luyssaert S Margolis H Oleson KW Roupsard O Veenendaal E 702
Viovy N Williams C Woodward FI amp Papale D (2010) Terrestrial Gross Carbon 703
Dioxide Uptake Global Distribution and Covariation with Climate Science 329 834-838 704
Berk A Anderson GP Acharya PK Bernstein LS Muratov L Lee J Fox M 705
Adler-Golden SM Chetwynd JH Hoke ML Lockwood RB Gardner JA Cooley 706
TW Borel CC amp Lewis PE (2005) MODTRAN5 A reformulated atmospheric band 707
model with auxiliary species and practical multiple scattering options Proceedings of the 708
Society of Photo-Optical Instrumentation Engineer 5655 662-667 709
Cheng SJ Bohrer G Steiner AL Hollinger DY Suyker A Phillips RP amp 710
Nadelhoffer KJ (2015) Variations in the influence of diffuse light on gross primary 711
productivity in temperate ecosystems Agricultural and Forest Meteorology 201 98-110 712
Cheng Y-B Middleton EM Zhang Q Huemmrich KF Campbell PKE Corp LA 713
Cook BD Kustas WP amp Daughtry CS (2013) Integrating Solar Induced 714
Fluorescence and the Photochemical Reflectance Index for Estimating Gross Primary 715
Production in a Cornfield Remote Sensing 5 6857-6879 716
Collatz GJ Ball JT Grivet C amp Berry JA (1991) Physiological and environmental-717
regulation of stomatal conductance photosynthesis and transpiration - a model that 718
includes a laminar boundary-layer Agricultural and Forest Meteorology 54 107-136 719
DOdorico P Alberti E amp Schaepman ME (2010) In-flight spectral performance 720
monitoring of the Airborne Prism Experiment Applied Optics 49 3082-3091 721
DOdorico P Guanter L Schaepman ME amp Schlaumlpfer D (2011) Performance 722
assessment of onboard and scene-based methods for Airborne Prism Experiment spectral 723
characterization Applied Optics 50 4755-4764 724
Damm A Erler A Gioli B Hamdi K Hutjes R Kosvancova M Meroni M 725
Miglietta F Moersch A Moreno J Schickling A Sonnenschein R Udelhoven T 726
Van der Linden S Hostert P amp Rascher U (2010) Remote sensing of sun induced 727
fluorescence yield to improve modelling of diurnal courses of Gross Primary Production 728
(GPP) Global Change Biology 16 171-186 729
Damm A Erler A Hillen W Meroni M Schaepman ME Verhoef W amp Rascher U 730
(2011) Modeling the impact of spectral sensor configurations on the FLD retrieval 731
accuracy of sun-induced chlorophyll fluorescence Remote Sensing of Environment 115 732
1882-1892 733
Damm A Guanter L Laurent VCE Schaepman ME Schickling A amp Rascher U 734
(2014) FLD-based retrieval of sun-induced chlorophyll fluorescence from medium 735
30
spectral resolution airborne spectroscopy data Remote Sensing of Environment 147 256-736
266 737
Damm A Guanter L Verhoef W Schlaumlpfer D Garbari S amp Schaepman ME (2015) 738
Impact of varying irradiance on vegetation indices and chlorophyll fluorescence derived 739
from spectroscopy data Remote Sensing of Environment 156 202-215 740
Demmig-Adams B (1998) Survey of thermal energy dissipation and pigment composition in 741
sun and shade leaves Plant and Cell Physiology 39 474-482 742
Drolet GG Middleton EM Huemmrich KF Hall FG Amiro BD Barr AG Black 743
TA McCaughey JH amp Margolis HA (2008) Regional mapping of gross light-use 744
efficiency using MODIS spectral indices Remote Sensing of Environment 112 3064-3078 745
Eugster W amp Senn W (1995) A cospectral correction model for measurement of turbulent 746
NO2 fluxes Boundary-Layer Meteorology 74 321-340 747
Eugster W Zeyer K Zeeman M Michna P Zingg A Buchmann N amp Emmenegger 748
L (2007) Methodical study of nitrous oxide eddy covariance measurements using 749
quantum cascade laser spectrometery over a Swiss forest Biogeosciences 4 927-939 750
Falge E Baldocchi D Olson R Anthoni P Aubinet M Bernhofer C Burba G 751
Ceulemans R Clement R Dolman H Granier A Gross P Grunwald T Hollinger 752
D Jensen NO Katul G Keronen P Kowalski A Lai CT Law BE Meyers T 753
Moncrieff H Moors E Munger JW Pilegaard K Rannik U Rebmann C Suyker 754
A Tenhunen J Tu K Verma S Vesala T Wilson K amp Wofsy S (2001) Gap 755
filling strategies for defensible annual sums of net ecosystem exchange Agricultural and 756
Forest Meteorology 107 43-69 757
Falloon P amp Betts R (2010) Climate impacts on European agriculture and water 758
management in the context of adaptation and mitigation-The importance of an integrated 759
approach Science of the Total Environment 408 5667-5687 760
Foken T amp Wichura B (1996) Tools for quality assessment of surface-based flux 761
measurements Agricultural and Forest Meteorology 78 83-105 762
Fournier A Daumard F Champagne S Ounis A Goulas Y amp Moya I (2012) Effect 763
of canopy structure on sun-induced chlorophyll fluorescence Isprs Journal of 764
Photogrammetry and Remote Sensing 68 112-120 765
Frankenberg C Fisher JB Worden J Badgley G Saatchi SS Lee JE Toon GC 766
Butz A Jung M Kuze A amp Yokota T (2011) New global observations of the 767
terrestrial carbon cycle from GOSAT Patterns of plant fluorescence with gross primary 768
productivity Geophysical Research Letters 38 769
31
Gamon JA amp Berry JA (2012) Facultative and constitutive pigment effects on the 770
Photochemical Reflectance Index (PRI) in sun and shade conifer needles Israel Journal of 771
Plant Sciences 60 85-95 772
Gamon JA Coburn C Flanagan LB Huemmrich KF Kiddle C Sanchez-Azofeifa 773
GA Thayer DR Vescovo L Gianelle D Sims DA Rahman AF amp Pastorello 774
GZ (2010) SpecNet revisited bridging flux and remote sensing communities Canadian 775
Journal of Remote Sensing 36 S376-S390 776
Gamon JA Penuelas J amp Field CB (1992) A narrow-waveband spectral index that 777
tracks diurnal changes in photosynthetic efficiency Remote Sensing of Environment 41 778
35-44 779
Garbulsky MF Filella I Verger A amp Penuelas J (2014) Photosynthetic light use 780
efficiency from satellite sensors From global to Mediterranean vegetation Environmental 781
and Experimental Botany 103 3-11 782
Garbulsky MF Penuelas J Papale D Ardo J Goulden ML Kiely G Richardson 783
AD Rotenberg E Veenendaal EM amp Filella I (2010) Patterns and controls of the 784
variability of radiation use efficiency and primary productivity across terrestrial 785
ecosystems Global Ecology and Biogeography 19 253-267 786
Gege P Fries J Haschberger P Schoumltz P Schwarzer H Strobl P Suhr B Ulbrich 787
G amp Vreeling WJ (2009) Calibration facility for airborne imaging spectrometers 788
ISPRS Journal of Photogrammetry amp Remote Sensing 64 387ndash397 789
Gitelson AA amp Gamon JA (2015) The need for a common basis for defining light-use 790
efficiency Implications for productivity estimation Remote Sensing of Environment 156 791
196-201 792
Goetz SJ amp Prince SD (1999) Modelling terrestrial carbon exchange and storage 793
Evidence and implications of functional convergence in light-use efficiency Advances in 794
Ecological Research Vol 28 (pp 57-92) 795
Govindjee (2004) Chlorophyll a fluorescence A bit of basics and history In GC 796
Papageorgiou amp Govindjee (Eds) Chlorophyll a Fluorescence A Signature of 797
Photosynthesis Advances in Photosynthesis and Respiration (pp 1-42) Dordrecht 798
Springer 799
Guanter L Alonso L Gomez-Chova L Amoros-Lopez J Vila J amp Moreno J (2007) 800
Estimation of solar-induced vegetation fluorescence from space measurements 801
Geophysical Research Letters 34 doi 1010292007GL029289 802
32
Guanter L Alonso L Gomez-Chova L Meroni M Preusker R Fischer J amp Moreno 803
J (2010) Developments for vegetation fluorescence retrieval from spaceborne high-804
resolution spectrometry in the O2-A and O2-B absorption bands Journal of Geophysical 805
Research-Atmospheres 115 806
Guanter L Frankenberg C Dudhia A Lewis PE Goacutemez-Dans J Kuze A Suto H amp 807
Grainger R (2012) Retrieval and global assessment of terrestrial chlorophyll fluorescence 808
from GOSAT space measurements Remote Sensing of Environment 121 236-251 809
Guanter L Rossini M Colombo R Meroni M Frankenberg C Lee J-E amp Joiner J 810
(2013) Using field spectroscopy to assess the potential of statistical approaches for the 811
retrieval of sun-induced chlorophyll fluorescence from ground and space Remote Sensing 812
of Environment 133 52-61 813
Guanter L Zhang Y Jung M Joiner J Voigt M Berry JA Frankenberg C Huete 814
AR Zarco-Tejada P Lee J-E Moran MS Ponce-Campos G Beer C Camps-815
Valls G Buchmann N Gianelle D Klumpp K Cescatti A Baker JM amp Griffis 816
TJ (2014) Global and time-resolved monitoring of crop photosynthesis with chlorophyll 817
fluorescence Proceedings of the National Academy of Sciences of the United States of 818
America 111 E1327-E1333 819
Haboudane D Miller JR Pattey E Zarco-Tejada PJ amp Strachan IB (2004) 820
Hyperspectral vegetation indices and novel algorithms for predicting green LAI of crop 821
canopies Modeling and validation in the context of precision agriculture Remote Sensing 822
of Environment 90 337-352 823
Hanan NP Burba G Verma SB Berry JA Suyker A amp Walter-Shea EA (2002) 824
Inversion of net ecosystem CO2 flux measurements for estimation of canopy PAR 825
absorption Global Change Biology 8 563-574 826
Hernandez-Clemente R Navarro-Cerrillo RM Suarez L Morales F amp Zarco-Tejada 827
PJ (2011) Assessing structural effects on PRI for stress detection in conifer forests 828
Remote Sensing of Environment 115 2360-2375 829
Hilker T Coops NC Wulder MA Black TA amp Guy RD (2008) The use of remote 830
sensing in light use efficiency based models of gross primary production A review of 831
current status and future requirements Science of the Total Environment 404 411-423 832
Hilker T Gitelson A Coops NC Hall FG amp Black TA (2011) Tracking plant 833
physiological properties from multi-angular tower-based remote sensing Oecologia 165 834
865-876 835
33
Hilker T Lyapustin A Hall FG Wang Y Coops NC Drolet G amp Black TA 836
(2009) An assessment of photosynthetic light use efficiency from space Modeling the 837
atmospheric and directional impacts on PRI reflectance Remote Sensing of Environment 838
113 2463-2475 839
Hueni A Biesemans J Meuleman K DellEndice F Schlaumlpfer D Adriaensen S 840
Kempenaers S Odermatt D Kneubuehler M Nieke J amp Itten K (2009) Structure 841
Components and Interfaces of the Airborne Prism Experiment (APEX) Processing and 842
Archiving Facility IEEE Transactions on Geoscience and Remote Sensing 47 29-43 843
Hueni A Lenhard K Baumgartner A amp Schaepman M (2013) The APEX (Airborne 844
Prism Experiment - Imaging Spectrometer) Calibration Information System IEEE 845
Transactions on Geoscience and Remote Sensing 51 5169-5180 846
Hueni A Schlaepfer D Jehle M amp Schaepman M (2015) Impacts of Dichroic Prism 847
Coatings on Radiometry of the Airborne Imaging Spectrometer APEX Applied Optics 53 848
5344-5352 849
Imhoff ML Bounoua L Ricketts T Loucks C Harriss R amp Lawrence WT (2004) 850
Global patterns in human consumption of net primary production Nature 429 870-873 851
IPCC (2013) Summary for policymakers Climate change 2013 the physical science basis 852
Cambridge University Press Cambridge United Kingdom and New York NY USA 853
Jacquemoud S amp Baret F (1990) PROSPECT A model of leaf optical properties spectra 854
Remote Sensing of Environment 34 75-91 855
Jehle M Hueni A Damm A DOdorico P Kneubuumlhler M Meuleman K Schlapfer 856
D Schaepman ME amp Weyermann J (2010) APEX - current status performance and 857
validation concept IEEE Sensors 2010 Conference 533-537 858
Joiner J Guanter L Lindstrot R Voigt M Vasilkov AP Middleton EM Huemmrich 859
KF Yoshida Y amp Frankenberg C (2013) Global monitoring of terrestrial chlorophyll 860
fluorescence from moderate spectral resolution near-infrared satellite measurements 861
methodology simulations and application to GOME-2 Atmos Meas Tech Discuss 6 862
3883-3930 863
Jung M Reichstein M Margolis HA Cescatti A Richardson AD Arain MA 864
Arneth A Bernhofer C Bonal D Chen J Gianelle D Gobron N Kiely G Kutsch 865
W Lasslop G Law BE Lindroth A Merbold L Montagnani L Moors EJ 866
Papale D Sottocornola M Vaccari F amp Williams C (2011) Global patterns of land-867
atmosphere fluxes of carbon dioxide latent heat and sensible heat derived from eddy 868
34
covariance satellite and meteorological observations Journal of Geophysical Research-869
Biogeosciences 116 870
Kljun N Kastner-Klein P Fedorovich E amp Rotach MW (2004) Evaluation of 871
Lagrangian footprint model using data from wind tunnel convective boundary layer 872
Agricultural and Forest Meteorology 127 189-201 873
Kljun N Rotach MW amp Schmid HP (2002) A three-dimensional backward lagrangian 874
footprint model for a wide range of boundary-layer stratifications Boundary-Layer 875
Meteorology 103 205-226 876
Knyazikhin Y Schull MA Stenberg P Mottus M Rautiainen M Yang Y Marshak 877
A Latorre Carmona P Kaufmann RK Lewis P Disney MI Vanderbilt V Davis 878
AB Baret F Jacquemoud S Lyapustin A amp Myneni RB (2013) Hyperspectral 879
remote sensing of foliar nitrogen content Proceedings of the National Academy of 880
Sciences of the United States of America 110 E185-E192 881
Kovac D Malenovsky Z Urban O Spunda V Kalina J Ac A Kaplan V amp Hanus 882
J (2013) Response of green reflectance continuum removal index to the xanthophyll de-883
epoxidation cycle in Norway spruce needles Journal of Experimental Botany 64 1817-884
1827 885
Krausmann F Erb K-H Gingrich S Haberl H Bondeau A Gaube V Lauk C 886
Plutzar C amp Searchinger TD (2013) Global human appropriation of net primary 887
production doubled in the 20th century Proceedings of the National Academy of Sciences 888
of the United States of America 110 10324-10329 889
Lasslop G Reichstein M Papale D Richardson AD Arneth A Barr A Stoy P amp 890
Wohlfahrt G (2010) Separation of net ecosystem exchange into assimilation and 891
respiration using a light response curve approach critical issues and global evaluation 892
Global Change Biology 16 187-208 893
Laurent VCE Verhoef W Damm A Schaepman ME amp Clevers JGPW (2013) A 894
Bayesian object-based approach for estimating vegetation biophysical variables from at-895
sensor APEX radiance data Remote Sensing of Environment 139 6-17 896
Lee JE Berry JA Van der Tol C Yang X Guanter L Damm A Baker I amp 897
Frankenberg C (2015) Simulations of chlorophyll fluorescence in corporated into the 898
Community Land Model version 4 Global Change Biology in print 899
Lewis P amp Disney M (2007) Spectral invariants and scattering across multiple scales from 900
within-leaf to canopy Remote Sensing of Environment 109 196-206 901
35
Liu LY amp Cheng ZH (2010) Detection of Vegetation Light-Use Efficiency Based on 902
Solar-Induced Chlorophyll Fluorescence Separated From Canopy Radiance Spectrum Ieee 903
Journal of Selected Topics in Applied Earth Observations and Remote Sensing 3 306-312 904
Louis J Ounis A Ducruet JM Evain S Laurila T Thum T Aurela M Wingsle G 905
Alonso L Pedros R amp Moya I (2005) Remote sensing of sunlight-induced chlorophyll 906
fluorescence and reflectance of Scots pine in the boreal forest during spring recovery 907
Remote Sensing of Environment 96 37-48 908
Maier SW Guumlnther KP amp Stellmes M (2003) Sun-Induced Fluorescence A New Tool 909
for Precision Farming In M McDonald J Schepers L Tartly T van Toai amp D Major 910
(Eds) Digital Imaging and Spectral Techniques Applications to Precision Agriculture 911
and Crop Physiology (pp 209-222) ASA Special Publication 912
Mauder M Foken T Clement R Elbers JA Eugster W Gruenwald T Heusinkveld 913
B amp Kolle O (2008) Quality control of CarboEurope flux data - Part 2 Inter-914
comparison of eddy-covariance software Biogeosciences 5 451-462 915
Meroni M Busetto L Guanter L Cogliati S Crosta GF Migliavacca M Panigada 916
C Rossini M amp Colombo R (2010) Characterization of fine resolution field 917
spectrometers using solar Fraunhofer lines and atmospheric absorption features Applied 918
Optics 49 2858-2871 919
Meroni M Picchi V Rossini M Cogliati S Panigada C Nali C Lorenzini G amp 920
Colombo R (2008) Leaf level early assessment of ozone injuries by passive fluorescence 921
and photochemical reflectance index International Journal of Remote Sensing 29 5409-922
5422 923
Meroni M Rossini M Guanter L Alonso L Rascher U Colombo R amp Moreno J 924
(2009) Remote sensing of solar induced chlorophyll fluorescence review of methods and 925
applications Remote Sensing of Environment doi101016jrse200905003 926
Michaelis L amp Menten ML (1913) The kenetics of the inversion effect Biochemische 927
Zeitschrift 49 333-369 928
Middleton E McMurtney JE Campbell PK Corp LA Butcher LM amp Chappelle 929
EW (2002) Optical and fluorescence properties of corn leaves from different nitrogen 930
regimes In M Owe G Durso amp L Toulios (Eds) Conference on Remote Sensing for 931
Agriculture Ecosystems and Hydrology IV (pp 72-83) Agia Pelagia Greece 932
Miller JR Berger M Goulas Y Jacquemoud S Louis J Moise N Mohammed G 933
Moreno J Moya I Pedroacutes R Verhoef W amp Zarco-Tejada PJ (2005) Development 934
36
of a vegetation fluorescence canopy model Final Report May 2005 In European Space 935
Research and Technology Centre (ESTEC) 936
Monteith JL (1972) Solar-radiation and productivity in tropical ecosystems Journal of 937
Applied Ecology 9 747-766 938
Niinemets U Kollist H Garcia-Plazaola JI Hernandez A amp Becerril JM (2003) Do 939
the capacity and kinetics for modification of xanthophyll cycle pool size depend on growth 940
irradiance in temperate trees Plant Cell and Environment 26 1787-1801 941
Nobel PS Forseth IN amp Long SP (1993) Canopy structure and light interception 942
Ozanne CMP Anhuf D Boulter SL Keller M Kitching RL Korner C Meinzer 943
FC Mitchell AW Nakashizuka T Dias PLS Stork NE Wright SJ amp 944
Yoshimura M (2003) Biodiversity meets the atmosphere A global view of forest 945
canopies Science 301 183-186 946
Parazoo NC Bowman K Fisher JB Frankenberg C Jones DBA Cescatti A Peacuterez-947
Priego Oacute Wohlfahrt G amp Montagnani L (2014) Terrestrial gross primary production 948
inferred from satellite fluorescence and vegetation models Global Change Biology na-na 949
Plascyk JA (1975) MK II Fraunhofer Line Dicsriminator (FLD-II) for airborne and orbital 950
remote-sensing of solar-stimulated luminescence Optical Engineering 14 339-346 951
Porcar-Castell A Tyystjaumlrvi E Atherton J Van der Tol C Flexas J EE P Moreno 952
J Frankenberg C amp Berry JA (2014) Linking chlorophyll a fluorescence to 953
photosynthesis for remote sensing applications mechanisms and challenges Journal of 954
Experimental Botany 65 4065-4095 955
Rascher U Agati G Alonso L Cecci G Champagne S Colombo R Damm A 956
Daumard F De Miguel E Fernandez G Franch B Franke J Gerbig C Gioli B 957
Gomez JA Goulas Y Guanter L Gutierrez-De-La-Camara O Hamdi K Hostert 958
P Jimenez M Kosvancova M Lognoli D Meroni M Miglietta F Moersch A 959
Moreno J Moya I Neininger B Okujeni A Ounis A Palombi L Raimondi V 960
Schickling A Sobrino JA Stellmes M Toci G Toscano P Udelhoven T Van der 961
Linden S amp Zaldei A (2009) CEFLES2 The remote sensing component to quantify 962
photosynthetic efficiency from the leaf to the region by measuring sun-induced 963
fluorescence in the oxygen absorption bands Biogeosciences 6 1181-1198 964
Richter R amp Schlaumlpfer D (2002) Geo-atmospheric processing of airborne imaging 965
spectrometry data Part 2 Atmospherictopographic correction International Journal of 966
Remote Sensing 23 2631-2649 967
37
Rossini M Meroni M Migliavacca M Manca G Cogliati S Busetto L Picchi V 968
Cescatti A Seufert G amp Colombo R (2010) High resolution field spectroscopy 969
measurements for estimating gross ecosystem production in a rice field Agricultural and 970
Forest Meteorology 150 1283-1296 971
Rossini M Nedbal L Guanter L Ač A Alonso L Burkart A Cogliati S Colombo 972
R Damm A Drusch M Hanus J Julitta T Kokkalis P Moreno J Panigada C 973
Pinto F Schickling A Schuumlttemeyer D Zemek F amp Rascher U (2015) Red and far-974
red sun-induced chlorophyll fluorescence as a measure of plant photosynthesis 975
Geophysical Research Letters (accepted for publication) 976
Ruimy A Jarvis PG Baldocchi DD amp B S (1995) CO2 Fluxes over Plant Canopies 977
and Solar Radiation A Review Advances in Ecological Research 26 1-68 978
Running SW Nemani RR Heinsch FA Zhao MS Reeves M amp Hashimoto H 979
(2004) A continuous satellite-derived measure of global terrestrial primary production 980
Bioscience 54 547-560 981
Schaepman ME M J Hueni A DrsquoOdorico P Damm A Weyermann J Schneider F 982
Laurent VCE C P Seidel F Lenhard K Gege P Kuechler C Brazile J Kohler 983
P De Vos L Meuleman K Meynart R Schlaepfer D Kneubuumlhler M amp Itten K 984
(2015) Advanced radiometry measurements and Earth science applications with the 985
Airborne Prism Experiment (APEX) Remote Sensing of Environment 158 207-219 986
Schimel D Pavlick R Fisher JB Asner GP Saatchi S Townsend P Miller C 987
Frankenberg C Hibbard K amp Cox P (2014) Observing terrestrial ecosystems and the 988
carbon cycle from space Global Change Biology na-na 989
Schlaumlpfer D amp Richter R (2002) Geo-atmospheric processing of airborne imaging 990
spectrometry data Part 1 Parametric orthorectification International Journal of Remote 991
Sensing 23 2609-2630 992
Schneider FD Leiterer R Morsdorf F Gastellu-Etchegorry J-P Lauret N Pfeifer N 993
amp Schaepman ME (2014) Simulating imaging spectrometer data 3D forest modeling 994
based on LiDAR and in situ data Remote Sensing of Environment 152 235-250 995
Schroter D Cramer W Leemans R Prentice IC Araujo MB Arnell NW Bondeau 996
A Bugmann H Carter TR Gracia CA de la Vega-Leinert AC Erhard M Ewert 997
F Glendining M House JI Kankaanpaa S Klein RJT Lavorel S Lindner M 998
Metzger MJ Meyer J Mitchell TD Reginster I Rounsevell M Sabate S Sitch 999
S Smith B Smith J Smith P Sykes MT Thonicke K Thuiller W Tuck G 1000
38
Zaehle S amp Zierl B (2005) Ecosystem service supply and vulnerability to global change 1001
in Europe Science 310 1333-1337 1002
Sitch S Smith B Prentice IC Arneth A Bondeau A Cramer W Kaplan JO Levis 1003
S Lucht W Sykes MT Thonicke K amp Venevsky S (2003) Evaluation of ecosystem 1004
dynamics plant geography and terrestrial carbon cycling in the LPJ dynamic global 1005
vegetation model Global Change Biology 9 161-185 1006
Stewart DW Costa C Dwyer LM Smith DL Hamilton RI amp Ma BL (2003) 1007
Canopy structure light interception and photosynthesis in maize Agronomy Journal 95 1008
1465-1474 1009
Trnka M Dubrovsky M amp Zalud Z (2004) Climate change impacts and adaptation 1010
strategies in spring barley production in the Czech Republic Climatic Change 64 227-1011
255 1012
Turner DP Ritts WD Cohen WB Maeirsperger TK Gower ST Kirschbaum AA 1013
Running SW Zhao MS Wofsy SC Dunn AL Law BE Campbell JL Oechel 1014
WC Kwon HJ Meyers TP Small EE Kurc SA amp Gamon JA (2005) Site-level 1015
evaluation of satellite-based global terrestrial gross primary production and net primary 1016
production monitoring Global Change Biology 11 666-684 1017
van der Tol C Berry J Campbell PKE amp Rascher U (2014) Models of fluorescence 1018
and photosynthesis for interpreting measurements of solar-induced chlorophyll 1019
fluorescence Journal of Geophysical Research Biogeosciences IN PRESS 1020
van der Tol C Verhoef W amp Rosema A (2009a) A model for chlorophyll fluorescence 1021
and photosynthesis at leaf scale Agricultural and Forest Meteorology 149 96-105 1022
van der Tol C Verhoef W Timmermans A Verhoef A amp Su Z (2009b) An integrated 1023
model of soil-canopy spectral radiances photosynthesis fluorescence temperature and 1024
energy balance Biogeosciences 6 3109-3129 1025
Verhoef W (1984) Light scattering by leaf layers with application to canopy reflectance 1026
modeling The SAIL model Remote Sensing of Environment 16 125-141 1027
Verhoef W amp Bach H (2003a) Remote sensing data assimilation using coupled radiative 1028
transfer models Physics and Chemistry of the Earth 28 3-13 1029
Verhoef W amp Bach H (2003b) Simulation of hyperspectral and directional radiance 1030
images using coupled biophysical and atmospheric radiative transfer models Remote 1031
Sensing of Environment 87 23-41 1032
39
Verhoef W amp Bach H (2007) Coupled soil-leaf-canopy and atmosphere radiative transfer 1033
modeling to simulate hyperspectral multi-angular surface reflectance and TOA radiance 1034
data Remote Sensing of Environment 109 166-182 1035
Verhoef W Jia L Xiao Q amp Su Z (2007) Unified optical-thermal four-stream radiative 1036
transfer theory for homogeneous vegetation canopies Ieee Transactions on Geoscience 1037
and Remote Sensing 45 1808-1822 1038
Webb EK Pearman GI amp Leuning R (1980) Correction of flux measurements for 1039
density effects due to heat and water-vapour transfer Quarterly Journal of the Royal 1040
Meteorological Society 106 85-100 1041
Wu C Niu Z Tang Q amp Huang W (2010) Revised photochemical reflectance index 1042
(PRI) for predicting light use efficiency of wheat in a growth cycle validation and 1043
comparison International Journal of Remote Sensing 31 2911-2924 1044
Yang X Tang J Mustard JF Lee JE Rossini M Joiner J Munger JW Kornfeld 1045
A amp Richardson AD (2015) Solar-induced chlorophyll fluorescence that correlates with 1046
canopy photosynthesis on diurnal and seasonal scales in a temperate deciduous forest 1047
Geophysical Research Letters 1048
Zarco-Tejada PJ Berni JAJ Suarez L Sepulcre-Canto G Morales F amp Miller JR 1049
(2009) Imaging chlorophyll fluorescence with an airborne narrow-band multispectral 1050
camera for vegetation stress detection Remote Sensing of Environment 113 1262-1275 1051
Zarco-Tejada PJ Gonzalez-Dugo V amp Berni JAJ (2012) Fluorescence temperature and 1052
narrow-band indices acquired from a UAV platform for water stress detection using a 1053
micro-hyperspectral imager and a thermal camera Remote Sensing of Environment 117 1054
322-337 1055
Zarco-Tejada PJ Morales A Testi L amp Villalobos FJ (2013) Spatio-temporal patterns 1056
of chlorophyll fluorescence and physiological and structural indices acquired from 1057
hyperspectral imagery as compared with carbon fluxes measured with eddy covariance 1058
Remote Sensing of Environment 133 102-115 1059
Zhang Q Middleton EM Cheng YB amp Landis DR (2013) Variations of foliage 1060
chlorophyll fAPAR and foliage non-chlorophyll fAPAR (fAPARchl fAPARnonchl) at the 1061
Harvard Forest Ieee Journal of Selected Topics in Applied Earth Observations and Remote 1062
Sensing 6 2254-2264 1063
Zhang Q Middleton EM Gao BC amp Cheng YB (2012) Using EO-1 hyperion to 1064
simulate HyspIRI products for a coniferous forest The fraction of par absorbed by 1065
40
chlorophyll (fAPAR chl) and leaf water content (LWC) Ieee Transactions on Geoscience 1066
and Remote Sensing 50 1844-1852 1067
Zhang Y Guanter L Berry JA Joiner J van der Tol C Huete A Gitelson A Voigt 1068
M amp Koumlhler P (2014) Estimation of vegetation photosynthetic capacity from space-1069
based measurements of chlorophyll fluorescence for terrestrial biosphere models Global 1070
Change Biology 20 3727-3742 1071
1072
41
Appendix-A APEX data calibration 1073
The calibration of APEX images is based on the APEX Processing and Archiving Facility 1074
(PAF) which is the combined software and hardware designed to generate calibrated level 1 1075
at-sensor radiances from APEX raw image streams (Hueni et al 2009) Calibration 1076
coefficients for the radiometric geometric and spectral calibrations are generated from system 1077
calibrations at the APEX Calibration Home Base (CHB) at DLR Oberpfaffenhofen (Gege et 1078
al 2009) These CHB data are stored and processed within the APEX Calibration Information 1079
System (CAL IS) producing the so-called calibration cubes holding coefficients for each 1080
spatio-spectral pixel (Hueni et al 2013) 1081
For the multi-temporal dataset employed within this study all flight lines were 1082
reprocessed from the original raw image streams to ensure that the same version of the 1083
processor was applied The APEX PAF and CAL IS have significantly evolved over the 1084
timeframe of the dataset with calibrations getting more accurate over the years To ensure 1085
consistency all data were calibrated using coefficients obtained in May 2013 1086
The processor was specifically configured to retain the highest information content in 1087
the VNIR channel including i) no spectral resampling to compensate for spectral shifts and 1088
misregistrations (DOdorico et al 2010 DOdorico et al 2011) ii) no compensation of 1089
spectral shift related changes in radiometry (Hueni et al 2015) and iii) no spatial 1090
misregistration correction The calibration was thus effectively reduced to a linear dark 1091
current correction over time a de-smearing of the visible-NIR channel to compensate for 1092
sensor smear effects the application of radiometric gains and offsets followed by a destriping 1093
routine working in the spatial dimension only to remove pushbroom related along track 1094
striping Calibrated radiance data were directly used for the fluorescence retrieval (see Section 1095
24) while the feasibility to use APEX for SIF760 retrievals was theoretically demonstrated in 1096
42
a study of Damm et al (2011) Resulting SIF760 maps were afterwards geo-rectified using a 1097
parametric geocoding approach (Schlaumlpfer and Richter 2002) 1098
43
Appendix-B Retrieval of SIF760 from airborne data 1099
The quantification of SIF measured with ground or airborne-based spectrometers 1100
requires separating emitted SIF from the reflected radiance flux The Fraunhofer Line Depth 1101
(FLD) approach introduced by Plascyk (1975) serves as a de facto standard for medium 1102
resolution instruments such as APEX (Meroni et al 2009) and was applied in our study The 1103
FLD method uses atmospheric absorption bands characterized by lower incident light 1104
compared to wavelength regions outside of these bands This configuration increases the 1105
spectral information and allows the separation of SIF from reflected radiation In this study 1106
we used the broad O2-A oxygen absorption band around 760 nm and quantified the infilling of 1107
SIF760 using radiance measurements inside (subscript i) and outside (subscript o) of the O2-A 1108
band 1109
For the airborne case only atmospheric components can be simulated with 1110
MODTRAN-5 assuming perfect knowledge of the acquisition conditions The reflectance 1111
terms for diffuse and direct irradiance as well as the SIF760 contribution are usually unknown 1112
Assuming Lambertian surface reflectance behavior which introduces some inaccuracies but 1113
allows formulating the radiative transfer (RT) for radiance measurements at sensor level (LAtS) 1114
to obtain SIF760 both measurements inside and outside of the absorption band can be 1115
expressed as 1116
E9FA lang3H IJK LMNrangP QlangRSE rang T UlangVWWH VXWH rang∙langVYYH VYXH rangZH
Hlang[XXH rang T ABCHUlangVWWH ranglangVXWH rangZHlang[XXH rang ] ^ _ (B1) 1117
where E0 is the top-of-atmosphere irradiance including diffuse and direct irradiance 1118
components θil is the illumination zenith angle ρso is the path scattered radiance τss is the 1119
direct transmittance for sunlight τoo is the direct transmittance in view direction τsd is the 1120
diffuse transmittance of the atmosphere for sunlight τdo is the hemispherical-directional 1121
transmittance in view direction and ρdd is the spherical albedo If these atmospheric 1122
44
components are obtained from MODTRAN-5 simulations (Damm et al 2015 Verhoef and 1123
Bach 2003a b 2007) the radiative transfer equation (Eq B1) only contains four unknowns 1124
namely Ri Ro SIFi and SIFo The 3FLD method (Maier et al 2003) which is an adaptation of 1125
the original FLD method proposed by (Plascyk 1975) was used to linearly relate R and SIF 1126
inside and outside of the O2-A absorption band SIF can be finally retrieved with 1127
13 -0 abcMUdWecWlangRff_ rangZghcWUdMecMlangRff^ rangZiUdWecWlangRff_ rangZghUdMecMlangRff^ rangZ j
langVWWM ranglangVXWM rang (B2) 1128
kE lE9FA m lang3HW IJK LMNrangP langRSE rangn ] ^ _ (B3) 1129
E lang3HW IJK LMNrangP langoSSE TopSE rang ∙ langoE opE rang qEprs T Eprt] ^ _ (B4) 1130
r S13rlangoSSr rang T langopSr rang v13S$langoSSS rang T langopSS rangw (B5) 1131
where B is the factor relating SIFi and SIFo and was fixed to a value of 08 justified by 1132
simulations and experiments (Rascher et al 2009 Alonso et al 2008) Xj equals the at-1133
sensor radiance (reflected plus emitted radiation) without path radiance contribution and Ej 1134
expresses surface irradiance as measured at the sensor level A is the factor relating Ri and Ro 1135
and was derived from linear interpolation of R of the left (758 nm) and right (771 nm) O2-A 1136
band shoulder with 1137
xx+ (B6) 1138
y ```-0```z and y `-0`z
```z (B7) 1139
1140
Because APEX suffered from slight spectral smile effects (DOdorico et al 2010) 1141
updated center wavelength positions were involved in the convolution approach The spectral 1142
shift quantification for each pixel across track was based on the Cr method as described in 1143
45
Meroni et al (2010) The method assumes a high correlation between a measured and a 1144
convolved spectrum and iteratively minimizes a cost function which is 1 minus the Pearson 1145
correlation coefficient (r) calculated for both signals Remaining artifacts of the spectral shift 1146
correction and slightly inaccurate estimates of atmospheric properties cause SIF760 retrieval 1147
uncertainties We therefore applied a semi-empirical correction as described in Damm et al 1148
(2014) for each scan line across the track This technique employs reference surfaces which 1149
are free of any SIF760 emission (eg bare soil) to adjust the upward transmittance term inside 1150
the absorption feature oSSr The retrieval of SIF760 from top-of-canopy radiance data measured 1151
on ground follows the same approach as described in Eqs B2-B7 under the assumption that 1152
the surface irradiance can be approximated with the measurement of a reference panel and 1153
that ρso τdo and τdo can be set to 0 Furthermore the spectral resolution of APEX can be 1154
considered suboptimal for SIF760 retrievals although Damm et al (2011) demonstrate that 1155
APEX with its spectral resolution of 54 nm at 760 nm is sensitive for SIF760 However 1156
retrieved SIF760 values are too high and in an absolute sense incorrect We used reference 1157
SIF760 data obtained in parallel to the airborne acquisitions using the ASD field spectrometers 1158
(Section 23) to estimate the actual offset The observed scaling factor of 193 was afterwards 1159
applied to the retrieved SIF760 values to transfer them to a realistic value range 1160
46
Appendix-C SIF retrieval accuracy 1161
We applied a quantitative accuracy evaluation of resulting SIF760 maps using ground 1162
measured SIF760 values (Figure C1) Considering all reference data acquired during five 1163
campaigns a good linear relationship was achieved between ground and airborne-based 1164
SIF760 values (r2 = 071) but with a proportionality factor much higher than 1 (Figure C1-A) 1165
This experimentally obtained systematic overestimation of APEX SIF760 is comparable to 1166
simulation results documented in Damm et al (2011) Further we found slightly changing 1167
correlations between the different years (several linear models in Figure C1-A) which are 1168
likely caused by canopy structural effects spectral and radiometric performances of used 1169
ground instruments or slight deviations of the performance of APEX over time 1170
To compensate for the overestimation of APEX SIF760 we applied an empirical correction 1171
factor of 193 derived from the comparison of reference data and APEX which resulted in a 1172
rRMSE of 289 (Figure C1-B) 1173
1174
lt Figure C1 gt 1175
1176
The Laegeren site was covered with three adjacent flight lines having an overlap of 1177
approximately 10 (cf Figure 3) This configuration provides the opportunity to 1178
quantitatively evaluate the consistency of SIF retrievals obtained from different measurements 1179
and view zenith angles (ie plusmn 135deg) The comparison of SIF760 retrievals obtained from flight 1180
lines 1 and 2 reveals a moderate linear relationship for homogeneous agricultural surfaces (r2 1181
= 081 rRMSE = 57) We observed a systematic underestimation of flight line 1 compared 1182
to flight line 2 (factor 06) for a view zenith angle difference of ~26deg for SIF760 indicating 1183
either a directionality of SIF760 emissions or an insufficient decoupling of surface HCRF 1184
affected by reflectance anisotropy With increasing surface heterogeneity scattering increases 1185
47
and the agreement of retrieved SIF from both flight lines slightly decreases (ie for forested 1186
areas r2 of 05 and rRMSE of 88) This lower correlation can be mainly associated to slight 1187
geometric mis-registrations (ie max 2 pixel ~ 40 m) in combination with surface 1188
heterogeneity (eg shaded and sunlit tree crowns) and emission anisotropy of SIF760 Also 1189
negative SIF760 values are present in the SIF760 maps and caused by sensor noise and 1190
especially for forests due to shadowing effects (Damm et al 2015) 1191
48
Appendix-D Technical aspects determining the SIF760 retrieval accuracy 1192
A rigorous evaluation of the SIF760 retrieval accuracy is crucial to judge the reliability 1193
of our assessment on the relationship between SIF760 and GPPEC across ecosystems 1194
Furthermore additional factors imposing variations on SIF760 retrieved from airborne 1195
spectroscopy data that cannot be related to the physiological origin of SIF760 needs to be 1196
critically discussed to justify the proposed approach 1197
Ground-based measurements of SIF760 were made using field spectrometers to validate 1198
the airborne retrievals Field spectroscopy provides a good reference for validating airborne 1199
retrievals as it is likely not affected by biases resulting from atmospheric composition 1200
estimates (eg aerosol load) due to the simultaneous measurement of irradiance fluxes at 1201
canopy level using a reference panel The reliability of the applied field spectroscopic 1202
approach to measure SIF760 was previously demonstrated using field studies (Damm et al 1203
2010 Liu and Cheng 2010 Meroni et al 2009 Rascher et al 2009) and theoretical 1204
assessments (Damm et al 2011) It must be noted that field spectroscopic approaches are 1205
subject to uncertainties particularly for heterogeneous vegetation canopies Damm et al 1206
(2015) discussed retrieval errors caused by illumination effects likely introducing slight 1207
errors in reference SIF760 This source of uncertainty must be considered when judging the 1208
accuracy of APEX SIF760 The nevertheless good agreement between ground and airborne 1209
observations indicated that atmospheric absorption and scattering effects could be sufficiently 1210
compensated and thus demonstrated the reliability of retrieved SIF760 measurements In 1211
particular the empirical correction applied making use of high spatial resolution airborne IS 1212
data in combination with reference surfaces not emitting SIF760 allowed to bypass retrieval 1213
uncertainties caused by atmospheric effects (Damm et al 2014) 1214
Instrumental effects in combination with retrieval methods were found to cause 1215
systematic differences in SIF760 retrievals (Damm et al 2011) the comparatively low 1216
49
resolution of APEX around the O2-A band used to retrieve SIF760 (ie ~54 nm) resulted in an 1217
overestimation of APEX SIF760 compared to retrievals from high resolution instruments 1218
Indeed maximum APEX SIF760 values are 6 mW m-2 sr-1 nm-1 while typical SIF760 values 1219
obtained from high resolution instruments range between 0 and 3 mW m-2 sr-1 nm-1 (Guanter 1220
et al 2013) Considering SIF760 values retrieved from ASD data in original resolution (3 nm) 1221
APEX showed an overestimation of 1102 which confirmed that low spectral resolution 1222
resulted in an overestimation of SIF760 The reasoning for this absolute error is given by the 1223
sub-optimal spectral resolution of APEX with 54 nm at 760 nm causing a reduced sensitivity 1224
for SIF760 on the one hand and a wider distance of the O2-A shoulder values used to 1225
parameterize the 3FLD approach on the other hand The bias was corrected using the ASD 1226
reference data and does not impact the results of our analysis Further the relative variation of 1227
SIF760 is unaffected by the bias 1228
Surface heterogeneity complicates the retrieval of SIF760 According to Damm et al 1229
(2015) SIF760 retrievals for forest sites are especially subject to uncertainties due to 1230
assumptions on surface irradiance Crown shapes and associated surface orientations 1231
determine the intensity and quality of irradiance including fractional amounts of diffuse and 1232
direct irradiance To account for pixel wise changes in surface irradiance high resolution 1233
digital object models (DOM) (eg derived from LiDAR observations) are required In 1234
absence of such a high resolution DOMrsquos crowns are assumed to be flat which results in 1235
uncertainties of up to 58 in case of cast shadows (Damm et al 2015) Since we used 1236
averaged observations over larger areas representing flux tower footprints and most of our 1237
data were flown under comparable illumination conditions (ie around solar noon) we 1238
expect these potential biases to be less influential in this analysis 1239
1
Tables 1
Table 1 Date and time of APEX flights and corresponding eddy covariance flux tower 2
measurements for the three investigated ecosystems (ie grassland cropland mixed 3
temperate forest) 4
Date Time [UTC] Location Ecosystem Flux tower
17062009 950 Laegeren forest 1 tower
17062009 1030 Oensingen cropland 1 tower
17062009 1030 Oensingen grassland 2 tower
25062010 1030 Oensingen cropland 1 tower
25062010 1030 Oensingen grassland 2 tower
26062010 1500 Laegeren forest 1 tower
26062010 1030 Oensingen cropland 1 tower
26062010 1030 Oensingen grassland 2 tower
29062010 1030 Laegeren forest 1 tower
26062011 1030 Laegeren forest 1 tower
28062011 1030 Oensingen cropland 1 tower
28062011 1030 Oensingen grassland 1 tower
16062012 1025 Laegeren forest 1 tower
16062012 900 Oensingen cropland 1 tower
16062012 1100 Oensingen cropland 1 tower
12072013 730 Laegeren forest 1 tower
03092013 1050 Laegeren forest 1 tower
5
2
Table 2 Availability of reference SIF760 data obtained from field spectroscopy measurements 6
to validate APEX based SIF760 retrievals 7
Date time [UTC] Location Measured crops Nr points
17062009 1030 Oensingen maize rye pea sugar beet wheat white clover 29 points
25062010 1030 Oensingen maize pea sugar beet wheat white clover 15 points
16062012 900 Oensingen carrot maize winter wheat 11 points
16062012 1100 Oensingen carrot maize winter wheat 10 points
8
3
Table 3 Goodness of fit for the hyperbolic model describing the relationship between GPPEC 9
and SIF760 O PRI and MCARI2 for the three ecosystem types perennial grassland cropland 10
and mixed temperate forest Calculated statistics are based on all data acquired from 2009-11
2013 as described in Table 1 12
Optical variable Ecosystem Regression coefficient Relative RMSE []
SIF crops 088 355
grass 059 2708
forest 048 1588
PRI crops 0008 1176
grass 095 860
forest 009 2179
MCARI2 crops 0005 1029
grass 098 550
forest 034 1798
13
1
Figures 1
2
Figure 1 Study sites A Oensingen agricultural site B Laegeren forest site The white 3
rectangles represent in A the boundary of investigated fields that comprise most of the flux-4
tower footprints and in B a coarse outline of the footprint area of the flux-tower The white 5
crosses show the locations of the flux-towers Background RGB images from Google-Earth 6
2
7
Figure 2 APEX reflectance and SIF760 image for the Oensingen site acquired on the 2606 8
2010 1030 UTC A top-of-canopy hemispherical-conical reflectance data as true color 9
composite B SIF760 map The white boxes indicate the approximate position of the flux 10
tower 11
3
12
Figure 3 APEX reflectance and SIF760 image for the Laegeren site acquired on the 2606 13
2010 1510 UTC A top-of-canopy hemispherical-conical reflectance data as true color 14
composite B SIF760 map The black arrows indicate the flight direction of flight line 1 to 3 15
(FL1-FL3) The white line marks a transect along the overlapping region of FL1 and FL2 The 16
white boxes indicate the approximate position of the flux tower 17
4
18
Figure 4 Relationships between GPPEC from the eddy-covariance measurements and SIF760 O 19
instantaneously measured between 2009 and 2013 (see Table 1) with the airborne 20
spectrometer APEX (A) PRI index (B) and MCARI2 index (C) for three vegetation types 21
(black dots perennial grassland dark grey rectangles cropland including winter wheat pea 22
and barley grey triangles mixed temperate forest) The solid curves correspond to a 23
hyperbolic model fitted to the measured data The dashed curves show the extrapolated 24
behavior 25
5
26
Figure 5 Daily light response curves from eddy flux measurements for A cropland B 27
perennial grassland and C mixed temperate forest Data were acquired between 2009 and 28
2013 (see Table 1) Grey curves represent a fitted hyperbolic model to approximate the 29
behavior of measured PAR-GPP values Crosses show GPPEC measurements that were used 30
for the SIF760 O - GPPEC comparison based on the time of APEX flights PAR values are 31
binned in 20 mW m-2
sr-1
nm-1
increments 32
6
33
Figure 6 Leaf level relationships between photosynthetic (LUEp) and fluorescence yield 34
(LUEf) for a typical C3 crop Dependency of LUEp (A) and LUEf (B) on APAR C 35
Relationship between LUEp and LUEf D Relationship between APAR and GPPL GPPL was 36
calculated as APARLUEp E Relationship between APAR and SIF760 SIF760 was calculated 37
as APARLUEf assuming a constant relationship between the SCOPE output SIFtotalL 38
(integral between 640-850nm) and SIF760L F Relationship between SIF760 L and GPPL All 39
data were simulated using SCOPE The grey areas indicate illumination conditions 40
comparable to APEX flights 41
7
42
Figure 7 Canopy level relationships between photosynthetic (LUEp) and fluorescence yield 43
(LUEf) for different canopy representations of a C3 cropland in SCOPE Dependency of 44
LUEp (A) and LUEf (B) on APAR LUEp was calculate as GPPCAPAR and LUEf was 45
directly obtained from SCOPE C Relationship between LUEp and LUEf D Relationship 46
between APAR and GPPC GPPC was directly obtained from SCOPE E Relationship 47
between APAR and SIF760C SIF760C was directly obtained from SCOPE F Relationship 48
between SIF760C and GPPC The black dashed line corresponds to a C3 cropland with LAI = 49
30 fraction of brown pigments (Cs) = 00 and a spherical (sp) leaf inclination distribution 50
function (LIDF) For the grey line Cs was changed to 20 for the black dashed line the LAI 51
was changed to 10 and for the grey dasheddotted line the LIDF was changed to plagiophile 52
(pg) The grey areas indicate illumination conditions comparable to APEX flights 53
8
54
Figure 8 Impact of temporal scaling on the SIF760C-GPPC relationship SIF760C and GPPC 55
data were simulated using SCOPE Model input parameters air temperature (A) PAR (B) and 56
LAI (C) were measured within the NitroEurope project (httpwwwnitroeuropeeu) at the 57
Speulderbos forest site Netherlands D Relationship between SIF760C and GPPC including a 58
fitted hyperbolic model for daily averages (grey dots and grey line) monthly averages (dark 59
grey triangles and line) and quarterly data (black dots and black dashed line) 60
9
61
Figure C1 Comparison of ground and airborne-based SIF760 retrievals from various crops 62
Data were acquired during four campaigns between 2009 and 2012 in the agricultural site 63
Oensingen (see Table 2) Left Fitted linear regression lines for the four considered campaigns 64
are overlaid in black The dashed line corresponds to the 11 line Right SIF retrievals from 65
APEX after applying an empirical correction factor (193) The black line represents the fitted 66
linear model the dashed line corresponds to the 11 line 67
33
Hilker T Lyapustin A Hall FG Wang Y Coops NC Drolet G amp Black TA 836
(2009) An assessment of photosynthetic light use efficiency from space Modeling the 837
atmospheric and directional impacts on PRI reflectance Remote Sensing of Environment 838
113 2463-2475 839
Hueni A Biesemans J Meuleman K DellEndice F Schlaumlpfer D Adriaensen S 840
Kempenaers S Odermatt D Kneubuehler M Nieke J amp Itten K (2009) Structure 841
Components and Interfaces of the Airborne Prism Experiment (APEX) Processing and 842
Archiving Facility IEEE Transactions on Geoscience and Remote Sensing 47 29-43 843
Hueni A Lenhard K Baumgartner A amp Schaepman M (2013) The APEX (Airborne 844
Prism Experiment - Imaging Spectrometer) Calibration Information System IEEE 845
Transactions on Geoscience and Remote Sensing 51 5169-5180 846
Hueni A Schlaepfer D Jehle M amp Schaepman M (2015) Impacts of Dichroic Prism 847
Coatings on Radiometry of the Airborne Imaging Spectrometer APEX Applied Optics 53 848
5344-5352 849
Imhoff ML Bounoua L Ricketts T Loucks C Harriss R amp Lawrence WT (2004) 850
Global patterns in human consumption of net primary production Nature 429 870-873 851
IPCC (2013) Summary for policymakers Climate change 2013 the physical science basis 852
Cambridge University Press Cambridge United Kingdom and New York NY USA 853
Jacquemoud S amp Baret F (1990) PROSPECT A model of leaf optical properties spectra 854
Remote Sensing of Environment 34 75-91 855
Jehle M Hueni A Damm A DOdorico P Kneubuumlhler M Meuleman K Schlapfer 856
D Schaepman ME amp Weyermann J (2010) APEX - current status performance and 857
validation concept IEEE Sensors 2010 Conference 533-537 858
Joiner J Guanter L Lindstrot R Voigt M Vasilkov AP Middleton EM Huemmrich 859
KF Yoshida Y amp Frankenberg C (2013) Global monitoring of terrestrial chlorophyll 860
fluorescence from moderate spectral resolution near-infrared satellite measurements 861
methodology simulations and application to GOME-2 Atmos Meas Tech Discuss 6 862
3883-3930 863
Jung M Reichstein M Margolis HA Cescatti A Richardson AD Arain MA 864
Arneth A Bernhofer C Bonal D Chen J Gianelle D Gobron N Kiely G Kutsch 865
W Lasslop G Law BE Lindroth A Merbold L Montagnani L Moors EJ 866
Papale D Sottocornola M Vaccari F amp Williams C (2011) Global patterns of land-867
atmosphere fluxes of carbon dioxide latent heat and sensible heat derived from eddy 868
34
covariance satellite and meteorological observations Journal of Geophysical Research-869
Biogeosciences 116 870
Kljun N Kastner-Klein P Fedorovich E amp Rotach MW (2004) Evaluation of 871
Lagrangian footprint model using data from wind tunnel convective boundary layer 872
Agricultural and Forest Meteorology 127 189-201 873
Kljun N Rotach MW amp Schmid HP (2002) A three-dimensional backward lagrangian 874
footprint model for a wide range of boundary-layer stratifications Boundary-Layer 875
Meteorology 103 205-226 876
Knyazikhin Y Schull MA Stenberg P Mottus M Rautiainen M Yang Y Marshak 877
A Latorre Carmona P Kaufmann RK Lewis P Disney MI Vanderbilt V Davis 878
AB Baret F Jacquemoud S Lyapustin A amp Myneni RB (2013) Hyperspectral 879
remote sensing of foliar nitrogen content Proceedings of the National Academy of 880
Sciences of the United States of America 110 E185-E192 881
Kovac D Malenovsky Z Urban O Spunda V Kalina J Ac A Kaplan V amp Hanus 882
J (2013) Response of green reflectance continuum removal index to the xanthophyll de-883
epoxidation cycle in Norway spruce needles Journal of Experimental Botany 64 1817-884
1827 885
Krausmann F Erb K-H Gingrich S Haberl H Bondeau A Gaube V Lauk C 886
Plutzar C amp Searchinger TD (2013) Global human appropriation of net primary 887
production doubled in the 20th century Proceedings of the National Academy of Sciences 888
of the United States of America 110 10324-10329 889
Lasslop G Reichstein M Papale D Richardson AD Arneth A Barr A Stoy P amp 890
Wohlfahrt G (2010) Separation of net ecosystem exchange into assimilation and 891
respiration using a light response curve approach critical issues and global evaluation 892
Global Change Biology 16 187-208 893
Laurent VCE Verhoef W Damm A Schaepman ME amp Clevers JGPW (2013) A 894
Bayesian object-based approach for estimating vegetation biophysical variables from at-895
sensor APEX radiance data Remote Sensing of Environment 139 6-17 896
Lee JE Berry JA Van der Tol C Yang X Guanter L Damm A Baker I amp 897
Frankenberg C (2015) Simulations of chlorophyll fluorescence in corporated into the 898
Community Land Model version 4 Global Change Biology in print 899
Lewis P amp Disney M (2007) Spectral invariants and scattering across multiple scales from 900
within-leaf to canopy Remote Sensing of Environment 109 196-206 901
35
Liu LY amp Cheng ZH (2010) Detection of Vegetation Light-Use Efficiency Based on 902
Solar-Induced Chlorophyll Fluorescence Separated From Canopy Radiance Spectrum Ieee 903
Journal of Selected Topics in Applied Earth Observations and Remote Sensing 3 306-312 904
Louis J Ounis A Ducruet JM Evain S Laurila T Thum T Aurela M Wingsle G 905
Alonso L Pedros R amp Moya I (2005) Remote sensing of sunlight-induced chlorophyll 906
fluorescence and reflectance of Scots pine in the boreal forest during spring recovery 907
Remote Sensing of Environment 96 37-48 908
Maier SW Guumlnther KP amp Stellmes M (2003) Sun-Induced Fluorescence A New Tool 909
for Precision Farming In M McDonald J Schepers L Tartly T van Toai amp D Major 910
(Eds) Digital Imaging and Spectral Techniques Applications to Precision Agriculture 911
and Crop Physiology (pp 209-222) ASA Special Publication 912
Mauder M Foken T Clement R Elbers JA Eugster W Gruenwald T Heusinkveld 913
B amp Kolle O (2008) Quality control of CarboEurope flux data - Part 2 Inter-914
comparison of eddy-covariance software Biogeosciences 5 451-462 915
Meroni M Busetto L Guanter L Cogliati S Crosta GF Migliavacca M Panigada 916
C Rossini M amp Colombo R (2010) Characterization of fine resolution field 917
spectrometers using solar Fraunhofer lines and atmospheric absorption features Applied 918
Optics 49 2858-2871 919
Meroni M Picchi V Rossini M Cogliati S Panigada C Nali C Lorenzini G amp 920
Colombo R (2008) Leaf level early assessment of ozone injuries by passive fluorescence 921
and photochemical reflectance index International Journal of Remote Sensing 29 5409-922
5422 923
Meroni M Rossini M Guanter L Alonso L Rascher U Colombo R amp Moreno J 924
(2009) Remote sensing of solar induced chlorophyll fluorescence review of methods and 925
applications Remote Sensing of Environment doi101016jrse200905003 926
Michaelis L amp Menten ML (1913) The kenetics of the inversion effect Biochemische 927
Zeitschrift 49 333-369 928
Middleton E McMurtney JE Campbell PK Corp LA Butcher LM amp Chappelle 929
EW (2002) Optical and fluorescence properties of corn leaves from different nitrogen 930
regimes In M Owe G Durso amp L Toulios (Eds) Conference on Remote Sensing for 931
Agriculture Ecosystems and Hydrology IV (pp 72-83) Agia Pelagia Greece 932
Miller JR Berger M Goulas Y Jacquemoud S Louis J Moise N Mohammed G 933
Moreno J Moya I Pedroacutes R Verhoef W amp Zarco-Tejada PJ (2005) Development 934
36
of a vegetation fluorescence canopy model Final Report May 2005 In European Space 935
Research and Technology Centre (ESTEC) 936
Monteith JL (1972) Solar-radiation and productivity in tropical ecosystems Journal of 937
Applied Ecology 9 747-766 938
Niinemets U Kollist H Garcia-Plazaola JI Hernandez A amp Becerril JM (2003) Do 939
the capacity and kinetics for modification of xanthophyll cycle pool size depend on growth 940
irradiance in temperate trees Plant Cell and Environment 26 1787-1801 941
Nobel PS Forseth IN amp Long SP (1993) Canopy structure and light interception 942
Ozanne CMP Anhuf D Boulter SL Keller M Kitching RL Korner C Meinzer 943
FC Mitchell AW Nakashizuka T Dias PLS Stork NE Wright SJ amp 944
Yoshimura M (2003) Biodiversity meets the atmosphere A global view of forest 945
canopies Science 301 183-186 946
Parazoo NC Bowman K Fisher JB Frankenberg C Jones DBA Cescatti A Peacuterez-947
Priego Oacute Wohlfahrt G amp Montagnani L (2014) Terrestrial gross primary production 948
inferred from satellite fluorescence and vegetation models Global Change Biology na-na 949
Plascyk JA (1975) MK II Fraunhofer Line Dicsriminator (FLD-II) for airborne and orbital 950
remote-sensing of solar-stimulated luminescence Optical Engineering 14 339-346 951
Porcar-Castell A Tyystjaumlrvi E Atherton J Van der Tol C Flexas J EE P Moreno 952
J Frankenberg C amp Berry JA (2014) Linking chlorophyll a fluorescence to 953
photosynthesis for remote sensing applications mechanisms and challenges Journal of 954
Experimental Botany 65 4065-4095 955
Rascher U Agati G Alonso L Cecci G Champagne S Colombo R Damm A 956
Daumard F De Miguel E Fernandez G Franch B Franke J Gerbig C Gioli B 957
Gomez JA Goulas Y Guanter L Gutierrez-De-La-Camara O Hamdi K Hostert 958
P Jimenez M Kosvancova M Lognoli D Meroni M Miglietta F Moersch A 959
Moreno J Moya I Neininger B Okujeni A Ounis A Palombi L Raimondi V 960
Schickling A Sobrino JA Stellmes M Toci G Toscano P Udelhoven T Van der 961
Linden S amp Zaldei A (2009) CEFLES2 The remote sensing component to quantify 962
photosynthetic efficiency from the leaf to the region by measuring sun-induced 963
fluorescence in the oxygen absorption bands Biogeosciences 6 1181-1198 964
Richter R amp Schlaumlpfer D (2002) Geo-atmospheric processing of airborne imaging 965
spectrometry data Part 2 Atmospherictopographic correction International Journal of 966
Remote Sensing 23 2631-2649 967
37
Rossini M Meroni M Migliavacca M Manca G Cogliati S Busetto L Picchi V 968
Cescatti A Seufert G amp Colombo R (2010) High resolution field spectroscopy 969
measurements for estimating gross ecosystem production in a rice field Agricultural and 970
Forest Meteorology 150 1283-1296 971
Rossini M Nedbal L Guanter L Ač A Alonso L Burkart A Cogliati S Colombo 972
R Damm A Drusch M Hanus J Julitta T Kokkalis P Moreno J Panigada C 973
Pinto F Schickling A Schuumlttemeyer D Zemek F amp Rascher U (2015) Red and far-974
red sun-induced chlorophyll fluorescence as a measure of plant photosynthesis 975
Geophysical Research Letters (accepted for publication) 976
Ruimy A Jarvis PG Baldocchi DD amp B S (1995) CO2 Fluxes over Plant Canopies 977
and Solar Radiation A Review Advances in Ecological Research 26 1-68 978
Running SW Nemani RR Heinsch FA Zhao MS Reeves M amp Hashimoto H 979
(2004) A continuous satellite-derived measure of global terrestrial primary production 980
Bioscience 54 547-560 981
Schaepman ME M J Hueni A DrsquoOdorico P Damm A Weyermann J Schneider F 982
Laurent VCE C P Seidel F Lenhard K Gege P Kuechler C Brazile J Kohler 983
P De Vos L Meuleman K Meynart R Schlaepfer D Kneubuumlhler M amp Itten K 984
(2015) Advanced radiometry measurements and Earth science applications with the 985
Airborne Prism Experiment (APEX) Remote Sensing of Environment 158 207-219 986
Schimel D Pavlick R Fisher JB Asner GP Saatchi S Townsend P Miller C 987
Frankenberg C Hibbard K amp Cox P (2014) Observing terrestrial ecosystems and the 988
carbon cycle from space Global Change Biology na-na 989
Schlaumlpfer D amp Richter R (2002) Geo-atmospheric processing of airborne imaging 990
spectrometry data Part 1 Parametric orthorectification International Journal of Remote 991
Sensing 23 2609-2630 992
Schneider FD Leiterer R Morsdorf F Gastellu-Etchegorry J-P Lauret N Pfeifer N 993
amp Schaepman ME (2014) Simulating imaging spectrometer data 3D forest modeling 994
based on LiDAR and in situ data Remote Sensing of Environment 152 235-250 995
Schroter D Cramer W Leemans R Prentice IC Araujo MB Arnell NW Bondeau 996
A Bugmann H Carter TR Gracia CA de la Vega-Leinert AC Erhard M Ewert 997
F Glendining M House JI Kankaanpaa S Klein RJT Lavorel S Lindner M 998
Metzger MJ Meyer J Mitchell TD Reginster I Rounsevell M Sabate S Sitch 999
S Smith B Smith J Smith P Sykes MT Thonicke K Thuiller W Tuck G 1000
38
Zaehle S amp Zierl B (2005) Ecosystem service supply and vulnerability to global change 1001
in Europe Science 310 1333-1337 1002
Sitch S Smith B Prentice IC Arneth A Bondeau A Cramer W Kaplan JO Levis 1003
S Lucht W Sykes MT Thonicke K amp Venevsky S (2003) Evaluation of ecosystem 1004
dynamics plant geography and terrestrial carbon cycling in the LPJ dynamic global 1005
vegetation model Global Change Biology 9 161-185 1006
Stewart DW Costa C Dwyer LM Smith DL Hamilton RI amp Ma BL (2003) 1007
Canopy structure light interception and photosynthesis in maize Agronomy Journal 95 1008
1465-1474 1009
Trnka M Dubrovsky M amp Zalud Z (2004) Climate change impacts and adaptation 1010
strategies in spring barley production in the Czech Republic Climatic Change 64 227-1011
255 1012
Turner DP Ritts WD Cohen WB Maeirsperger TK Gower ST Kirschbaum AA 1013
Running SW Zhao MS Wofsy SC Dunn AL Law BE Campbell JL Oechel 1014
WC Kwon HJ Meyers TP Small EE Kurc SA amp Gamon JA (2005) Site-level 1015
evaluation of satellite-based global terrestrial gross primary production and net primary 1016
production monitoring Global Change Biology 11 666-684 1017
van der Tol C Berry J Campbell PKE amp Rascher U (2014) Models of fluorescence 1018
and photosynthesis for interpreting measurements of solar-induced chlorophyll 1019
fluorescence Journal of Geophysical Research Biogeosciences IN PRESS 1020
van der Tol C Verhoef W amp Rosema A (2009a) A model for chlorophyll fluorescence 1021
and photosynthesis at leaf scale Agricultural and Forest Meteorology 149 96-105 1022
van der Tol C Verhoef W Timmermans A Verhoef A amp Su Z (2009b) An integrated 1023
model of soil-canopy spectral radiances photosynthesis fluorescence temperature and 1024
energy balance Biogeosciences 6 3109-3129 1025
Verhoef W (1984) Light scattering by leaf layers with application to canopy reflectance 1026
modeling The SAIL model Remote Sensing of Environment 16 125-141 1027
Verhoef W amp Bach H (2003a) Remote sensing data assimilation using coupled radiative 1028
transfer models Physics and Chemistry of the Earth 28 3-13 1029
Verhoef W amp Bach H (2003b) Simulation of hyperspectral and directional radiance 1030
images using coupled biophysical and atmospheric radiative transfer models Remote 1031
Sensing of Environment 87 23-41 1032
39
Verhoef W amp Bach H (2007) Coupled soil-leaf-canopy and atmosphere radiative transfer 1033
modeling to simulate hyperspectral multi-angular surface reflectance and TOA radiance 1034
data Remote Sensing of Environment 109 166-182 1035
Verhoef W Jia L Xiao Q amp Su Z (2007) Unified optical-thermal four-stream radiative 1036
transfer theory for homogeneous vegetation canopies Ieee Transactions on Geoscience 1037
and Remote Sensing 45 1808-1822 1038
Webb EK Pearman GI amp Leuning R (1980) Correction of flux measurements for 1039
density effects due to heat and water-vapour transfer Quarterly Journal of the Royal 1040
Meteorological Society 106 85-100 1041
Wu C Niu Z Tang Q amp Huang W (2010) Revised photochemical reflectance index 1042
(PRI) for predicting light use efficiency of wheat in a growth cycle validation and 1043
comparison International Journal of Remote Sensing 31 2911-2924 1044
Yang X Tang J Mustard JF Lee JE Rossini M Joiner J Munger JW Kornfeld 1045
A amp Richardson AD (2015) Solar-induced chlorophyll fluorescence that correlates with 1046
canopy photosynthesis on diurnal and seasonal scales in a temperate deciduous forest 1047
Geophysical Research Letters 1048
Zarco-Tejada PJ Berni JAJ Suarez L Sepulcre-Canto G Morales F amp Miller JR 1049
(2009) Imaging chlorophyll fluorescence with an airborne narrow-band multispectral 1050
camera for vegetation stress detection Remote Sensing of Environment 113 1262-1275 1051
Zarco-Tejada PJ Gonzalez-Dugo V amp Berni JAJ (2012) Fluorescence temperature and 1052
narrow-band indices acquired from a UAV platform for water stress detection using a 1053
micro-hyperspectral imager and a thermal camera Remote Sensing of Environment 117 1054
322-337 1055
Zarco-Tejada PJ Morales A Testi L amp Villalobos FJ (2013) Spatio-temporal patterns 1056
of chlorophyll fluorescence and physiological and structural indices acquired from 1057
hyperspectral imagery as compared with carbon fluxes measured with eddy covariance 1058
Remote Sensing of Environment 133 102-115 1059
Zhang Q Middleton EM Cheng YB amp Landis DR (2013) Variations of foliage 1060
chlorophyll fAPAR and foliage non-chlorophyll fAPAR (fAPARchl fAPARnonchl) at the 1061
Harvard Forest Ieee Journal of Selected Topics in Applied Earth Observations and Remote 1062
Sensing 6 2254-2264 1063
Zhang Q Middleton EM Gao BC amp Cheng YB (2012) Using EO-1 hyperion to 1064
simulate HyspIRI products for a coniferous forest The fraction of par absorbed by 1065
40
chlorophyll (fAPAR chl) and leaf water content (LWC) Ieee Transactions on Geoscience 1066
and Remote Sensing 50 1844-1852 1067
Zhang Y Guanter L Berry JA Joiner J van der Tol C Huete A Gitelson A Voigt 1068
M amp Koumlhler P (2014) Estimation of vegetation photosynthetic capacity from space-1069
based measurements of chlorophyll fluorescence for terrestrial biosphere models Global 1070
Change Biology 20 3727-3742 1071
1072
41
Appendix-A APEX data calibration 1073
The calibration of APEX images is based on the APEX Processing and Archiving Facility 1074
(PAF) which is the combined software and hardware designed to generate calibrated level 1 1075
at-sensor radiances from APEX raw image streams (Hueni et al 2009) Calibration 1076
coefficients for the radiometric geometric and spectral calibrations are generated from system 1077
calibrations at the APEX Calibration Home Base (CHB) at DLR Oberpfaffenhofen (Gege et 1078
al 2009) These CHB data are stored and processed within the APEX Calibration Information 1079
System (CAL IS) producing the so-called calibration cubes holding coefficients for each 1080
spatio-spectral pixel (Hueni et al 2013) 1081
For the multi-temporal dataset employed within this study all flight lines were 1082
reprocessed from the original raw image streams to ensure that the same version of the 1083
processor was applied The APEX PAF and CAL IS have significantly evolved over the 1084
timeframe of the dataset with calibrations getting more accurate over the years To ensure 1085
consistency all data were calibrated using coefficients obtained in May 2013 1086
The processor was specifically configured to retain the highest information content in 1087
the VNIR channel including i) no spectral resampling to compensate for spectral shifts and 1088
misregistrations (DOdorico et al 2010 DOdorico et al 2011) ii) no compensation of 1089
spectral shift related changes in radiometry (Hueni et al 2015) and iii) no spatial 1090
misregistration correction The calibration was thus effectively reduced to a linear dark 1091
current correction over time a de-smearing of the visible-NIR channel to compensate for 1092
sensor smear effects the application of radiometric gains and offsets followed by a destriping 1093
routine working in the spatial dimension only to remove pushbroom related along track 1094
striping Calibrated radiance data were directly used for the fluorescence retrieval (see Section 1095
24) while the feasibility to use APEX for SIF760 retrievals was theoretically demonstrated in 1096
42
a study of Damm et al (2011) Resulting SIF760 maps were afterwards geo-rectified using a 1097
parametric geocoding approach (Schlaumlpfer and Richter 2002) 1098
43
Appendix-B Retrieval of SIF760 from airborne data 1099
The quantification of SIF measured with ground or airborne-based spectrometers 1100
requires separating emitted SIF from the reflected radiance flux The Fraunhofer Line Depth 1101
(FLD) approach introduced by Plascyk (1975) serves as a de facto standard for medium 1102
resolution instruments such as APEX (Meroni et al 2009) and was applied in our study The 1103
FLD method uses atmospheric absorption bands characterized by lower incident light 1104
compared to wavelength regions outside of these bands This configuration increases the 1105
spectral information and allows the separation of SIF from reflected radiation In this study 1106
we used the broad O2-A oxygen absorption band around 760 nm and quantified the infilling of 1107
SIF760 using radiance measurements inside (subscript i) and outside (subscript o) of the O2-A 1108
band 1109
For the airborne case only atmospheric components can be simulated with 1110
MODTRAN-5 assuming perfect knowledge of the acquisition conditions The reflectance 1111
terms for diffuse and direct irradiance as well as the SIF760 contribution are usually unknown 1112
Assuming Lambertian surface reflectance behavior which introduces some inaccuracies but 1113
allows formulating the radiative transfer (RT) for radiance measurements at sensor level (LAtS) 1114
to obtain SIF760 both measurements inside and outside of the absorption band can be 1115
expressed as 1116
E9FA lang3H IJK LMNrangP QlangRSE rang T UlangVWWH VXWH rang∙langVYYH VYXH rangZH
Hlang[XXH rang T ABCHUlangVWWH ranglangVXWH rangZHlang[XXH rang ] ^ _ (B1) 1117
where E0 is the top-of-atmosphere irradiance including diffuse and direct irradiance 1118
components θil is the illumination zenith angle ρso is the path scattered radiance τss is the 1119
direct transmittance for sunlight τoo is the direct transmittance in view direction τsd is the 1120
diffuse transmittance of the atmosphere for sunlight τdo is the hemispherical-directional 1121
transmittance in view direction and ρdd is the spherical albedo If these atmospheric 1122
44
components are obtained from MODTRAN-5 simulations (Damm et al 2015 Verhoef and 1123
Bach 2003a b 2007) the radiative transfer equation (Eq B1) only contains four unknowns 1124
namely Ri Ro SIFi and SIFo The 3FLD method (Maier et al 2003) which is an adaptation of 1125
the original FLD method proposed by (Plascyk 1975) was used to linearly relate R and SIF 1126
inside and outside of the O2-A absorption band SIF can be finally retrieved with 1127
13 -0 abcMUdWecWlangRff_ rangZghcWUdMecMlangRff^ rangZiUdWecWlangRff_ rangZghUdMecMlangRff^ rangZ j
langVWWM ranglangVXWM rang (B2) 1128
kE lE9FA m lang3HW IJK LMNrangP langRSE rangn ] ^ _ (B3) 1129
E lang3HW IJK LMNrangP langoSSE TopSE rang ∙ langoE opE rang qEprs T Eprt] ^ _ (B4) 1130
r S13rlangoSSr rang T langopSr rang v13S$langoSSS rang T langopSS rangw (B5) 1131
where B is the factor relating SIFi and SIFo and was fixed to a value of 08 justified by 1132
simulations and experiments (Rascher et al 2009 Alonso et al 2008) Xj equals the at-1133
sensor radiance (reflected plus emitted radiation) without path radiance contribution and Ej 1134
expresses surface irradiance as measured at the sensor level A is the factor relating Ri and Ro 1135
and was derived from linear interpolation of R of the left (758 nm) and right (771 nm) O2-A 1136
band shoulder with 1137
xx+ (B6) 1138
y ```-0```z and y `-0`z
```z (B7) 1139
1140
Because APEX suffered from slight spectral smile effects (DOdorico et al 2010) 1141
updated center wavelength positions were involved in the convolution approach The spectral 1142
shift quantification for each pixel across track was based on the Cr method as described in 1143
45
Meroni et al (2010) The method assumes a high correlation between a measured and a 1144
convolved spectrum and iteratively minimizes a cost function which is 1 minus the Pearson 1145
correlation coefficient (r) calculated for both signals Remaining artifacts of the spectral shift 1146
correction and slightly inaccurate estimates of atmospheric properties cause SIF760 retrieval 1147
uncertainties We therefore applied a semi-empirical correction as described in Damm et al 1148
(2014) for each scan line across the track This technique employs reference surfaces which 1149
are free of any SIF760 emission (eg bare soil) to adjust the upward transmittance term inside 1150
the absorption feature oSSr The retrieval of SIF760 from top-of-canopy radiance data measured 1151
on ground follows the same approach as described in Eqs B2-B7 under the assumption that 1152
the surface irradiance can be approximated with the measurement of a reference panel and 1153
that ρso τdo and τdo can be set to 0 Furthermore the spectral resolution of APEX can be 1154
considered suboptimal for SIF760 retrievals although Damm et al (2011) demonstrate that 1155
APEX with its spectral resolution of 54 nm at 760 nm is sensitive for SIF760 However 1156
retrieved SIF760 values are too high and in an absolute sense incorrect We used reference 1157
SIF760 data obtained in parallel to the airborne acquisitions using the ASD field spectrometers 1158
(Section 23) to estimate the actual offset The observed scaling factor of 193 was afterwards 1159
applied to the retrieved SIF760 values to transfer them to a realistic value range 1160
46
Appendix-C SIF retrieval accuracy 1161
We applied a quantitative accuracy evaluation of resulting SIF760 maps using ground 1162
measured SIF760 values (Figure C1) Considering all reference data acquired during five 1163
campaigns a good linear relationship was achieved between ground and airborne-based 1164
SIF760 values (r2 = 071) but with a proportionality factor much higher than 1 (Figure C1-A) 1165
This experimentally obtained systematic overestimation of APEX SIF760 is comparable to 1166
simulation results documented in Damm et al (2011) Further we found slightly changing 1167
correlations between the different years (several linear models in Figure C1-A) which are 1168
likely caused by canopy structural effects spectral and radiometric performances of used 1169
ground instruments or slight deviations of the performance of APEX over time 1170
To compensate for the overestimation of APEX SIF760 we applied an empirical correction 1171
factor of 193 derived from the comparison of reference data and APEX which resulted in a 1172
rRMSE of 289 (Figure C1-B) 1173
1174
lt Figure C1 gt 1175
1176
The Laegeren site was covered with three adjacent flight lines having an overlap of 1177
approximately 10 (cf Figure 3) This configuration provides the opportunity to 1178
quantitatively evaluate the consistency of SIF retrievals obtained from different measurements 1179
and view zenith angles (ie plusmn 135deg) The comparison of SIF760 retrievals obtained from flight 1180
lines 1 and 2 reveals a moderate linear relationship for homogeneous agricultural surfaces (r2 1181
= 081 rRMSE = 57) We observed a systematic underestimation of flight line 1 compared 1182
to flight line 2 (factor 06) for a view zenith angle difference of ~26deg for SIF760 indicating 1183
either a directionality of SIF760 emissions or an insufficient decoupling of surface HCRF 1184
affected by reflectance anisotropy With increasing surface heterogeneity scattering increases 1185
47
and the agreement of retrieved SIF from both flight lines slightly decreases (ie for forested 1186
areas r2 of 05 and rRMSE of 88) This lower correlation can be mainly associated to slight 1187
geometric mis-registrations (ie max 2 pixel ~ 40 m) in combination with surface 1188
heterogeneity (eg shaded and sunlit tree crowns) and emission anisotropy of SIF760 Also 1189
negative SIF760 values are present in the SIF760 maps and caused by sensor noise and 1190
especially for forests due to shadowing effects (Damm et al 2015) 1191
48
Appendix-D Technical aspects determining the SIF760 retrieval accuracy 1192
A rigorous evaluation of the SIF760 retrieval accuracy is crucial to judge the reliability 1193
of our assessment on the relationship between SIF760 and GPPEC across ecosystems 1194
Furthermore additional factors imposing variations on SIF760 retrieved from airborne 1195
spectroscopy data that cannot be related to the physiological origin of SIF760 needs to be 1196
critically discussed to justify the proposed approach 1197
Ground-based measurements of SIF760 were made using field spectrometers to validate 1198
the airborne retrievals Field spectroscopy provides a good reference for validating airborne 1199
retrievals as it is likely not affected by biases resulting from atmospheric composition 1200
estimates (eg aerosol load) due to the simultaneous measurement of irradiance fluxes at 1201
canopy level using a reference panel The reliability of the applied field spectroscopic 1202
approach to measure SIF760 was previously demonstrated using field studies (Damm et al 1203
2010 Liu and Cheng 2010 Meroni et al 2009 Rascher et al 2009) and theoretical 1204
assessments (Damm et al 2011) It must be noted that field spectroscopic approaches are 1205
subject to uncertainties particularly for heterogeneous vegetation canopies Damm et al 1206
(2015) discussed retrieval errors caused by illumination effects likely introducing slight 1207
errors in reference SIF760 This source of uncertainty must be considered when judging the 1208
accuracy of APEX SIF760 The nevertheless good agreement between ground and airborne 1209
observations indicated that atmospheric absorption and scattering effects could be sufficiently 1210
compensated and thus demonstrated the reliability of retrieved SIF760 measurements In 1211
particular the empirical correction applied making use of high spatial resolution airborne IS 1212
data in combination with reference surfaces not emitting SIF760 allowed to bypass retrieval 1213
uncertainties caused by atmospheric effects (Damm et al 2014) 1214
Instrumental effects in combination with retrieval methods were found to cause 1215
systematic differences in SIF760 retrievals (Damm et al 2011) the comparatively low 1216
49
resolution of APEX around the O2-A band used to retrieve SIF760 (ie ~54 nm) resulted in an 1217
overestimation of APEX SIF760 compared to retrievals from high resolution instruments 1218
Indeed maximum APEX SIF760 values are 6 mW m-2 sr-1 nm-1 while typical SIF760 values 1219
obtained from high resolution instruments range between 0 and 3 mW m-2 sr-1 nm-1 (Guanter 1220
et al 2013) Considering SIF760 values retrieved from ASD data in original resolution (3 nm) 1221
APEX showed an overestimation of 1102 which confirmed that low spectral resolution 1222
resulted in an overestimation of SIF760 The reasoning for this absolute error is given by the 1223
sub-optimal spectral resolution of APEX with 54 nm at 760 nm causing a reduced sensitivity 1224
for SIF760 on the one hand and a wider distance of the O2-A shoulder values used to 1225
parameterize the 3FLD approach on the other hand The bias was corrected using the ASD 1226
reference data and does not impact the results of our analysis Further the relative variation of 1227
SIF760 is unaffected by the bias 1228
Surface heterogeneity complicates the retrieval of SIF760 According to Damm et al 1229
(2015) SIF760 retrievals for forest sites are especially subject to uncertainties due to 1230
assumptions on surface irradiance Crown shapes and associated surface orientations 1231
determine the intensity and quality of irradiance including fractional amounts of diffuse and 1232
direct irradiance To account for pixel wise changes in surface irradiance high resolution 1233
digital object models (DOM) (eg derived from LiDAR observations) are required In 1234
absence of such a high resolution DOMrsquos crowns are assumed to be flat which results in 1235
uncertainties of up to 58 in case of cast shadows (Damm et al 2015) Since we used 1236
averaged observations over larger areas representing flux tower footprints and most of our 1237
data were flown under comparable illumination conditions (ie around solar noon) we 1238
expect these potential biases to be less influential in this analysis 1239
1
Tables 1
Table 1 Date and time of APEX flights and corresponding eddy covariance flux tower 2
measurements for the three investigated ecosystems (ie grassland cropland mixed 3
temperate forest) 4
Date Time [UTC] Location Ecosystem Flux tower
17062009 950 Laegeren forest 1 tower
17062009 1030 Oensingen cropland 1 tower
17062009 1030 Oensingen grassland 2 tower
25062010 1030 Oensingen cropland 1 tower
25062010 1030 Oensingen grassland 2 tower
26062010 1500 Laegeren forest 1 tower
26062010 1030 Oensingen cropland 1 tower
26062010 1030 Oensingen grassland 2 tower
29062010 1030 Laegeren forest 1 tower
26062011 1030 Laegeren forest 1 tower
28062011 1030 Oensingen cropland 1 tower
28062011 1030 Oensingen grassland 1 tower
16062012 1025 Laegeren forest 1 tower
16062012 900 Oensingen cropland 1 tower
16062012 1100 Oensingen cropland 1 tower
12072013 730 Laegeren forest 1 tower
03092013 1050 Laegeren forest 1 tower
5
2
Table 2 Availability of reference SIF760 data obtained from field spectroscopy measurements 6
to validate APEX based SIF760 retrievals 7
Date time [UTC] Location Measured crops Nr points
17062009 1030 Oensingen maize rye pea sugar beet wheat white clover 29 points
25062010 1030 Oensingen maize pea sugar beet wheat white clover 15 points
16062012 900 Oensingen carrot maize winter wheat 11 points
16062012 1100 Oensingen carrot maize winter wheat 10 points
8
3
Table 3 Goodness of fit for the hyperbolic model describing the relationship between GPPEC 9
and SIF760 O PRI and MCARI2 for the three ecosystem types perennial grassland cropland 10
and mixed temperate forest Calculated statistics are based on all data acquired from 2009-11
2013 as described in Table 1 12
Optical variable Ecosystem Regression coefficient Relative RMSE []
SIF crops 088 355
grass 059 2708
forest 048 1588
PRI crops 0008 1176
grass 095 860
forest 009 2179
MCARI2 crops 0005 1029
grass 098 550
forest 034 1798
13
1
Figures 1
2
Figure 1 Study sites A Oensingen agricultural site B Laegeren forest site The white 3
rectangles represent in A the boundary of investigated fields that comprise most of the flux-4
tower footprints and in B a coarse outline of the footprint area of the flux-tower The white 5
crosses show the locations of the flux-towers Background RGB images from Google-Earth 6
2
7
Figure 2 APEX reflectance and SIF760 image for the Oensingen site acquired on the 2606 8
2010 1030 UTC A top-of-canopy hemispherical-conical reflectance data as true color 9
composite B SIF760 map The white boxes indicate the approximate position of the flux 10
tower 11
3
12
Figure 3 APEX reflectance and SIF760 image for the Laegeren site acquired on the 2606 13
2010 1510 UTC A top-of-canopy hemispherical-conical reflectance data as true color 14
composite B SIF760 map The black arrows indicate the flight direction of flight line 1 to 3 15
(FL1-FL3) The white line marks a transect along the overlapping region of FL1 and FL2 The 16
white boxes indicate the approximate position of the flux tower 17
4
18
Figure 4 Relationships between GPPEC from the eddy-covariance measurements and SIF760 O 19
instantaneously measured between 2009 and 2013 (see Table 1) with the airborne 20
spectrometer APEX (A) PRI index (B) and MCARI2 index (C) for three vegetation types 21
(black dots perennial grassland dark grey rectangles cropland including winter wheat pea 22
and barley grey triangles mixed temperate forest) The solid curves correspond to a 23
hyperbolic model fitted to the measured data The dashed curves show the extrapolated 24
behavior 25
5
26
Figure 5 Daily light response curves from eddy flux measurements for A cropland B 27
perennial grassland and C mixed temperate forest Data were acquired between 2009 and 28
2013 (see Table 1) Grey curves represent a fitted hyperbolic model to approximate the 29
behavior of measured PAR-GPP values Crosses show GPPEC measurements that were used 30
for the SIF760 O - GPPEC comparison based on the time of APEX flights PAR values are 31
binned in 20 mW m-2
sr-1
nm-1
increments 32
6
33
Figure 6 Leaf level relationships between photosynthetic (LUEp) and fluorescence yield 34
(LUEf) for a typical C3 crop Dependency of LUEp (A) and LUEf (B) on APAR C 35
Relationship between LUEp and LUEf D Relationship between APAR and GPPL GPPL was 36
calculated as APARLUEp E Relationship between APAR and SIF760 SIF760 was calculated 37
as APARLUEf assuming a constant relationship between the SCOPE output SIFtotalL 38
(integral between 640-850nm) and SIF760L F Relationship between SIF760 L and GPPL All 39
data were simulated using SCOPE The grey areas indicate illumination conditions 40
comparable to APEX flights 41
7
42
Figure 7 Canopy level relationships between photosynthetic (LUEp) and fluorescence yield 43
(LUEf) for different canopy representations of a C3 cropland in SCOPE Dependency of 44
LUEp (A) and LUEf (B) on APAR LUEp was calculate as GPPCAPAR and LUEf was 45
directly obtained from SCOPE C Relationship between LUEp and LUEf D Relationship 46
between APAR and GPPC GPPC was directly obtained from SCOPE E Relationship 47
between APAR and SIF760C SIF760C was directly obtained from SCOPE F Relationship 48
between SIF760C and GPPC The black dashed line corresponds to a C3 cropland with LAI = 49
30 fraction of brown pigments (Cs) = 00 and a spherical (sp) leaf inclination distribution 50
function (LIDF) For the grey line Cs was changed to 20 for the black dashed line the LAI 51
was changed to 10 and for the grey dasheddotted line the LIDF was changed to plagiophile 52
(pg) The grey areas indicate illumination conditions comparable to APEX flights 53
8
54
Figure 8 Impact of temporal scaling on the SIF760C-GPPC relationship SIF760C and GPPC 55
data were simulated using SCOPE Model input parameters air temperature (A) PAR (B) and 56
LAI (C) were measured within the NitroEurope project (httpwwwnitroeuropeeu) at the 57
Speulderbos forest site Netherlands D Relationship between SIF760C and GPPC including a 58
fitted hyperbolic model for daily averages (grey dots and grey line) monthly averages (dark 59
grey triangles and line) and quarterly data (black dots and black dashed line) 60
9
61
Figure C1 Comparison of ground and airborne-based SIF760 retrievals from various crops 62
Data were acquired during four campaigns between 2009 and 2012 in the agricultural site 63
Oensingen (see Table 2) Left Fitted linear regression lines for the four considered campaigns 64
are overlaid in black The dashed line corresponds to the 11 line Right SIF retrievals from 65
APEX after applying an empirical correction factor (193) The black line represents the fitted 66
linear model the dashed line corresponds to the 11 line 67

42
a study of Damm et al (2011) Resulting SIF760 maps were afterwards geo-rectified using a 1097
parametric geocoding approach (Schlaumlpfer and Richter 2002) 1098
43
Appendix-B Retrieval of SIF760 from airborne data 1099
The quantification of SIF measured with ground or airborne-based spectrometers 1100
requires separating emitted SIF from the reflected radiance flux The Fraunhofer Line Depth 1101
(FLD) approach introduced by Plascyk (1975) serves as a de facto standard for medium 1102
resolution instruments such as APEX (Meroni et al 2009) and was applied in our study The 1103
FLD method uses atmospheric absorption bands characterized by lower incident light 1104
compared to wavelength regions outside of these bands This configuration increases the 1105
spectral information and allows the separation of SIF from reflected radiation In this study 1106
we used the broad O2-A oxygen absorption band around 760 nm and quantified the infilling of 1107
SIF760 using radiance measurements inside (subscript i) and outside (subscript o) of the O2-A 1108
band 1109
For the airborne case only atmospheric components can be simulated with 1110
MODTRAN-5 assuming perfect knowledge of the acquisition conditions The reflectance 1111
terms for diffuse and direct irradiance as well as the SIF760 contribution are usually unknown 1112
Assuming Lambertian surface reflectance behavior which introduces some inaccuracies but 1113
allows formulating the radiative transfer (RT) for radiance measurements at sensor level (LAtS) 1114
to obtain SIF760 both measurements inside and outside of the absorption band can be 1115
expressed as 1116
E9FA lang3H IJK LMNrangP QlangRSE rang T UlangVWWH VXWH rang∙langVYYH VYXH rangZH
Hlang[XXH rang T ABCHUlangVWWH ranglangVXWH rangZHlang[XXH rang ] ^ _ (B1) 1117
where E0 is the top-of-atmosphere irradiance including diffuse and direct irradiance 1118
components θil is the illumination zenith angle ρso is the path scattered radiance τss is the 1119
direct transmittance for sunlight τoo is the direct transmittance in view direction τsd is the 1120
diffuse transmittance of the atmosphere for sunlight τdo is the hemispherical-directional 1121
transmittance in view direction and ρdd is the spherical albedo If these atmospheric 1122
44
components are obtained from MODTRAN-5 simulations (Damm et al 2015 Verhoef and 1123
Bach 2003a b 2007) the radiative transfer equation (Eq B1) only contains four unknowns 1124
namely Ri Ro SIFi and SIFo The 3FLD method (Maier et al 2003) which is an adaptation of 1125
the original FLD method proposed by (Plascyk 1975) was used to linearly relate R and SIF 1126
inside and outside of the O2-A absorption band SIF can be finally retrieved with 1127
13 -0 abcMUdWecWlangRff_ rangZghcWUdMecMlangRff^ rangZiUdWecWlangRff_ rangZghUdMecMlangRff^ rangZ j
langVWWM ranglangVXWM rang (B2) 1128
kE lE9FA m lang3HW IJK LMNrangP langRSE rangn ] ^ _ (B3) 1129
E lang3HW IJK LMNrangP langoSSE TopSE rang ∙ langoE opE rang qEprs T Eprt] ^ _ (B4) 1130
r S13rlangoSSr rang T langopSr rang v13S$langoSSS rang T langopSS rangw (B5) 1131
where B is the factor relating SIFi and SIFo and was fixed to a value of 08 justified by 1132
simulations and experiments (Rascher et al 2009 Alonso et al 2008) Xj equals the at-1133
sensor radiance (reflected plus emitted radiation) without path radiance contribution and Ej 1134
expresses surface irradiance as measured at the sensor level A is the factor relating Ri and Ro 1135
and was derived from linear interpolation of R of the left (758 nm) and right (771 nm) O2-A 1136
band shoulder with 1137
xx+ (B6) 1138
y ```-0```z and y `-0`z
```z (B7) 1139
1140
Because APEX suffered from slight spectral smile effects (DOdorico et al 2010) 1141
updated center wavelength positions were involved in the convolution approach The spectral 1142
shift quantification for each pixel across track was based on the Cr method as described in 1143
45
Meroni et al (2010) The method assumes a high correlation between a measured and a 1144
convolved spectrum and iteratively minimizes a cost function which is 1 minus the Pearson 1145
correlation coefficient (r) calculated for both signals Remaining artifacts of the spectral shift 1146
correction and slightly inaccurate estimates of atmospheric properties cause SIF760 retrieval 1147
uncertainties We therefore applied a semi-empirical correction as described in Damm et al 1148
(2014) for each scan line across the track This technique employs reference surfaces which 1149
are free of any SIF760 emission (eg bare soil) to adjust the upward transmittance term inside 1150
the absorption feature oSSr The retrieval of SIF760 from top-of-canopy radiance data measured 1151
on ground follows the same approach as described in Eqs B2-B7 under the assumption that 1152
the surface irradiance can be approximated with the measurement of a reference panel and 1153
that ρso τdo and τdo can be set to 0 Furthermore the spectral resolution of APEX can be 1154
considered suboptimal for SIF760 retrievals although Damm et al (2011) demonstrate that 1155
APEX with its spectral resolution of 54 nm at 760 nm is sensitive for SIF760 However 1156
retrieved SIF760 values are too high and in an absolute sense incorrect We used reference 1157
SIF760 data obtained in parallel to the airborne acquisitions using the ASD field spectrometers 1158
(Section 23) to estimate the actual offset The observed scaling factor of 193 was afterwards 1159
applied to the retrieved SIF760 values to transfer them to a realistic value range 1160
46
Appendix-C SIF retrieval accuracy 1161
We applied a quantitative accuracy evaluation of resulting SIF760 maps using ground 1162
measured SIF760 values (Figure C1) Considering all reference data acquired during five 1163
campaigns a good linear relationship was achieved between ground and airborne-based 1164
SIF760 values (r2 = 071) but with a proportionality factor much higher than 1 (Figure C1-A) 1165
This experimentally obtained systematic overestimation of APEX SIF760 is comparable to 1166
simulation results documented in Damm et al (2011) Further we found slightly changing 1167
correlations between the different years (several linear models in Figure C1-A) which are 1168
likely caused by canopy structural effects spectral and radiometric performances of used 1169
ground instruments or slight deviations of the performance of APEX over time 1170
To compensate for the overestimation of APEX SIF760 we applied an empirical correction 1171
factor of 193 derived from the comparison of reference data and APEX which resulted in a 1172
rRMSE of 289 (Figure C1-B) 1173
1174
lt Figure C1 gt 1175
1176
The Laegeren site was covered with three adjacent flight lines having an overlap of 1177
approximately 10 (cf Figure 3) This configuration provides the opportunity to 1178
quantitatively evaluate the consistency of SIF retrievals obtained from different measurements 1179
and view zenith angles (ie plusmn 135deg) The comparison of SIF760 retrievals obtained from flight 1180
lines 1 and 2 reveals a moderate linear relationship for homogeneous agricultural surfaces (r2 1181
= 081 rRMSE = 57) We observed a systematic underestimation of flight line 1 compared 1182
to flight line 2 (factor 06) for a view zenith angle difference of ~26deg for SIF760 indicating 1183
either a directionality of SIF760 emissions or an insufficient decoupling of surface HCRF 1184
affected by reflectance anisotropy With increasing surface heterogeneity scattering increases 1185
47
and the agreement of retrieved SIF from both flight lines slightly decreases (ie for forested 1186
areas r2 of 05 and rRMSE of 88) This lower correlation can be mainly associated to slight 1187
geometric mis-registrations (ie max 2 pixel ~ 40 m) in combination with surface 1188
heterogeneity (eg shaded and sunlit tree crowns) and emission anisotropy of SIF760 Also 1189
negative SIF760 values are present in the SIF760 maps and caused by sensor noise and 1190
especially for forests due to shadowing effects (Damm et al 2015) 1191
48
Appendix-D Technical aspects determining the SIF760 retrieval accuracy 1192
A rigorous evaluation of the SIF760 retrieval accuracy is crucial to judge the reliability 1193
of our assessment on the relationship between SIF760 and GPPEC across ecosystems 1194
Furthermore additional factors imposing variations on SIF760 retrieved from airborne 1195
spectroscopy data that cannot be related to the physiological origin of SIF760 needs to be 1196
critically discussed to justify the proposed approach 1197
Ground-based measurements of SIF760 were made using field spectrometers to validate 1198
the airborne retrievals Field spectroscopy provides a good reference for validating airborne 1199
retrievals as it is likely not affected by biases resulting from atmospheric composition 1200
estimates (eg aerosol load) due to the simultaneous measurement of irradiance fluxes at 1201
canopy level using a reference panel The reliability of the applied field spectroscopic 1202
approach to measure SIF760 was previously demonstrated using field studies (Damm et al 1203
2010 Liu and Cheng 2010 Meroni et al 2009 Rascher et al 2009) and theoretical 1204
assessments (Damm et al 2011) It must be noted that field spectroscopic approaches are 1205
subject to uncertainties particularly for heterogeneous vegetation canopies Damm et al 1206
(2015) discussed retrieval errors caused by illumination effects likely introducing slight 1207
errors in reference SIF760 This source of uncertainty must be considered when judging the 1208
accuracy of APEX SIF760 The nevertheless good agreement between ground and airborne 1209
observations indicated that atmospheric absorption and scattering effects could be sufficiently 1210
compensated and thus demonstrated the reliability of retrieved SIF760 measurements In 1211
particular the empirical correction applied making use of high spatial resolution airborne IS 1212
data in combination with reference surfaces not emitting SIF760 allowed to bypass retrieval 1213
uncertainties caused by atmospheric effects (Damm et al 2014) 1214
Instrumental effects in combination with retrieval methods were found to cause 1215
systematic differences in SIF760 retrievals (Damm et al 2011) the comparatively low 1216
49
resolution of APEX around the O2-A band used to retrieve SIF760 (ie ~54 nm) resulted in an 1217
overestimation of APEX SIF760 compared to retrievals from high resolution instruments 1218
Indeed maximum APEX SIF760 values are 6 mW m-2 sr-1 nm-1 while typical SIF760 values 1219
obtained from high resolution instruments range between 0 and 3 mW m-2 sr-1 nm-1 (Guanter 1220
et al 2013) Considering SIF760 values retrieved from ASD data in original resolution (3 nm) 1221
APEX showed an overestimation of 1102 which confirmed that low spectral resolution 1222
resulted in an overestimation of SIF760 The reasoning for this absolute error is given by the 1223
sub-optimal spectral resolution of APEX with 54 nm at 760 nm causing a reduced sensitivity 1224
for SIF760 on the one hand and a wider distance of the O2-A shoulder values used to 1225
parameterize the 3FLD approach on the other hand The bias was corrected using the ASD 1226
reference data and does not impact the results of our analysis Further the relative variation of 1227
SIF760 is unaffected by the bias 1228
Surface heterogeneity complicates the retrieval of SIF760 According to Damm et al 1229
(2015) SIF760 retrievals for forest sites are especially subject to uncertainties due to 1230
assumptions on surface irradiance Crown shapes and associated surface orientations 1231
determine the intensity and quality of irradiance including fractional amounts of diffuse and 1232
direct irradiance To account for pixel wise changes in surface irradiance high resolution 1233
digital object models (DOM) (eg derived from LiDAR observations) are required In 1234
absence of such a high resolution DOMrsquos crowns are assumed to be flat which results in 1235
uncertainties of up to 58 in case of cast shadows (Damm et al 2015) Since we used 1236
averaged observations over larger areas representing flux tower footprints and most of our 1237
data were flown under comparable illumination conditions (ie around solar noon) we 1238
expect these potential biases to be less influential in this analysis 1239
1
Tables 1
Table 1 Date and time of APEX flights and corresponding eddy covariance flux tower 2
measurements for the three investigated ecosystems (ie grassland cropland mixed 3
temperate forest) 4
Date Time [UTC] Location Ecosystem Flux tower
17062009 950 Laegeren forest 1 tower
17062009 1030 Oensingen cropland 1 tower
17062009 1030 Oensingen grassland 2 tower
25062010 1030 Oensingen cropland 1 tower
25062010 1030 Oensingen grassland 2 tower
26062010 1500 Laegeren forest 1 tower
26062010 1030 Oensingen cropland 1 tower
26062010 1030 Oensingen grassland 2 tower
29062010 1030 Laegeren forest 1 tower
26062011 1030 Laegeren forest 1 tower
28062011 1030 Oensingen cropland 1 tower
28062011 1030 Oensingen grassland 1 tower
16062012 1025 Laegeren forest 1 tower
16062012 900 Oensingen cropland 1 tower
16062012 1100 Oensingen cropland 1 tower
12072013 730 Laegeren forest 1 tower
03092013 1050 Laegeren forest 1 tower
5
2
Table 2 Availability of reference SIF760 data obtained from field spectroscopy measurements 6
to validate APEX based SIF760 retrievals 7
Date time [UTC] Location Measured crops Nr points
17062009 1030 Oensingen maize rye pea sugar beet wheat white clover 29 points
25062010 1030 Oensingen maize pea sugar beet wheat white clover 15 points
16062012 900 Oensingen carrot maize winter wheat 11 points
16062012 1100 Oensingen carrot maize winter wheat 10 points
8
3
Table 3 Goodness of fit for the hyperbolic model describing the relationship between GPPEC 9
and SIF760 O PRI and MCARI2 for the three ecosystem types perennial grassland cropland 10
and mixed temperate forest Calculated statistics are based on all data acquired from 2009-11
2013 as described in Table 1 12
Optical variable Ecosystem Regression coefficient Relative RMSE []
SIF crops 088 355
grass 059 2708
forest 048 1588
PRI crops 0008 1176
grass 095 860
forest 009 2179
MCARI2 crops 0005 1029
grass 098 550
forest 034 1798
13
1
Figures 1
2
Figure 1 Study sites A Oensingen agricultural site B Laegeren forest site The white 3
rectangles represent in A the boundary of investigated fields that comprise most of the flux-4
tower footprints and in B a coarse outline of the footprint area of the flux-tower The white 5
crosses show the locations of the flux-towers Background RGB images from Google-Earth 6
2
7
Figure 2 APEX reflectance and SIF760 image for the Oensingen site acquired on the 2606 8
2010 1030 UTC A top-of-canopy hemispherical-conical reflectance data as true color 9
composite B SIF760 map The white boxes indicate the approximate position of the flux 10
tower 11
3
12
Figure 3 APEX reflectance and SIF760 image for the Laegeren site acquired on the 2606 13
2010 1510 UTC A top-of-canopy hemispherical-conical reflectance data as true color 14
composite B SIF760 map The black arrows indicate the flight direction of flight line 1 to 3 15
(FL1-FL3) The white line marks a transect along the overlapping region of FL1 and FL2 The 16
white boxes indicate the approximate position of the flux tower 17
4
18
Figure 4 Relationships between GPPEC from the eddy-covariance measurements and SIF760 O 19
instantaneously measured between 2009 and 2013 (see Table 1) with the airborne 20
spectrometer APEX (A) PRI index (B) and MCARI2 index (C) for three vegetation types 21
(black dots perennial grassland dark grey rectangles cropland including winter wheat pea 22
and barley grey triangles mixed temperate forest) The solid curves correspond to a 23
hyperbolic model fitted to the measured data The dashed curves show the extrapolated 24
behavior 25
5
26
Figure 5 Daily light response curves from eddy flux measurements for A cropland B 27
perennial grassland and C mixed temperate forest Data were acquired between 2009 and 28
2013 (see Table 1) Grey curves represent a fitted hyperbolic model to approximate the 29
behavior of measured PAR-GPP values Crosses show GPPEC measurements that were used 30
for the SIF760 O - GPPEC comparison based on the time of APEX flights PAR values are 31
binned in 20 mW m-2
sr-1
nm-1
increments 32
6
33
Figure 6 Leaf level relationships between photosynthetic (LUEp) and fluorescence yield 34
(LUEf) for a typical C3 crop Dependency of LUEp (A) and LUEf (B) on APAR C 35
Relationship between LUEp and LUEf D Relationship between APAR and GPPL GPPL was 36
calculated as APARLUEp E Relationship between APAR and SIF760 SIF760 was calculated 37
as APARLUEf assuming a constant relationship between the SCOPE output SIFtotalL 38
(integral between 640-850nm) and SIF760L F Relationship between SIF760 L and GPPL All 39
data were simulated using SCOPE The grey areas indicate illumination conditions 40
comparable to APEX flights 41
7
42
Figure 7 Canopy level relationships between photosynthetic (LUEp) and fluorescence yield 43
(LUEf) for different canopy representations of a C3 cropland in SCOPE Dependency of 44
LUEp (A) and LUEf (B) on APAR LUEp was calculate as GPPCAPAR and LUEf was 45
directly obtained from SCOPE C Relationship between LUEp and LUEf D Relationship 46
between APAR and GPPC GPPC was directly obtained from SCOPE E Relationship 47
between APAR and SIF760C SIF760C was directly obtained from SCOPE F Relationship 48
between SIF760C and GPPC The black dashed line corresponds to a C3 cropland with LAI = 49
30 fraction of brown pigments (Cs) = 00 and a spherical (sp) leaf inclination distribution 50
function (LIDF) For the grey line Cs was changed to 20 for the black dashed line the LAI 51
was changed to 10 and for the grey dasheddotted line the LIDF was changed to plagiophile 52
(pg) The grey areas indicate illumination conditions comparable to APEX flights 53
8
54
Figure 8 Impact of temporal scaling on the SIF760C-GPPC relationship SIF760C and GPPC 55
data were simulated using SCOPE Model input parameters air temperature (A) PAR (B) and 56
LAI (C) were measured within the NitroEurope project (httpwwwnitroeuropeeu) at the 57
Speulderbos forest site Netherlands D Relationship between SIF760C and GPPC including a 58
fitted hyperbolic model for daily averages (grey dots and grey line) monthly averages (dark 59
grey triangles and line) and quarterly data (black dots and black dashed line) 60
9
61
Figure C1 Comparison of ground and airborne-based SIF760 retrievals from various crops 62
Data were acquired during four campaigns between 2009 and 2012 in the agricultural site 63
Oensingen (see Table 2) Left Fitted linear regression lines for the four considered campaigns 64
are overlaid in black The dashed line corresponds to the 11 line Right SIF retrievals from 65
APEX after applying an empirical correction factor (193) The black line represents the fitted 66
linear model the dashed line corresponds to the 11 line 67
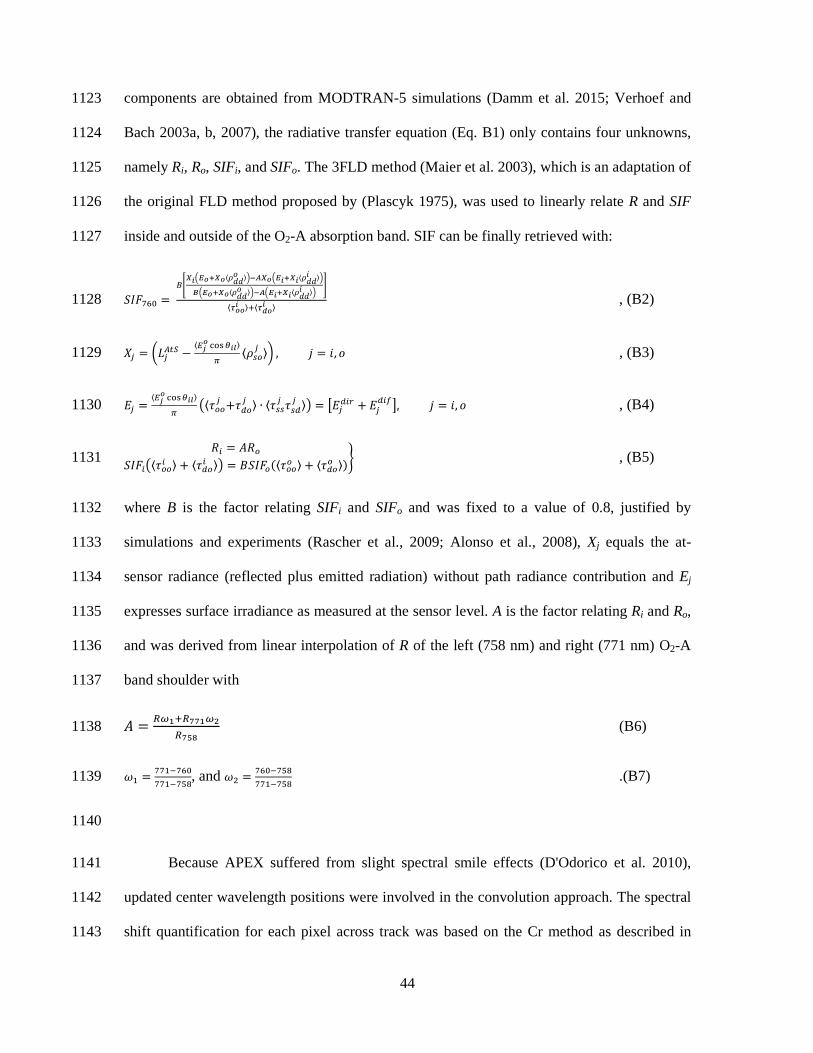
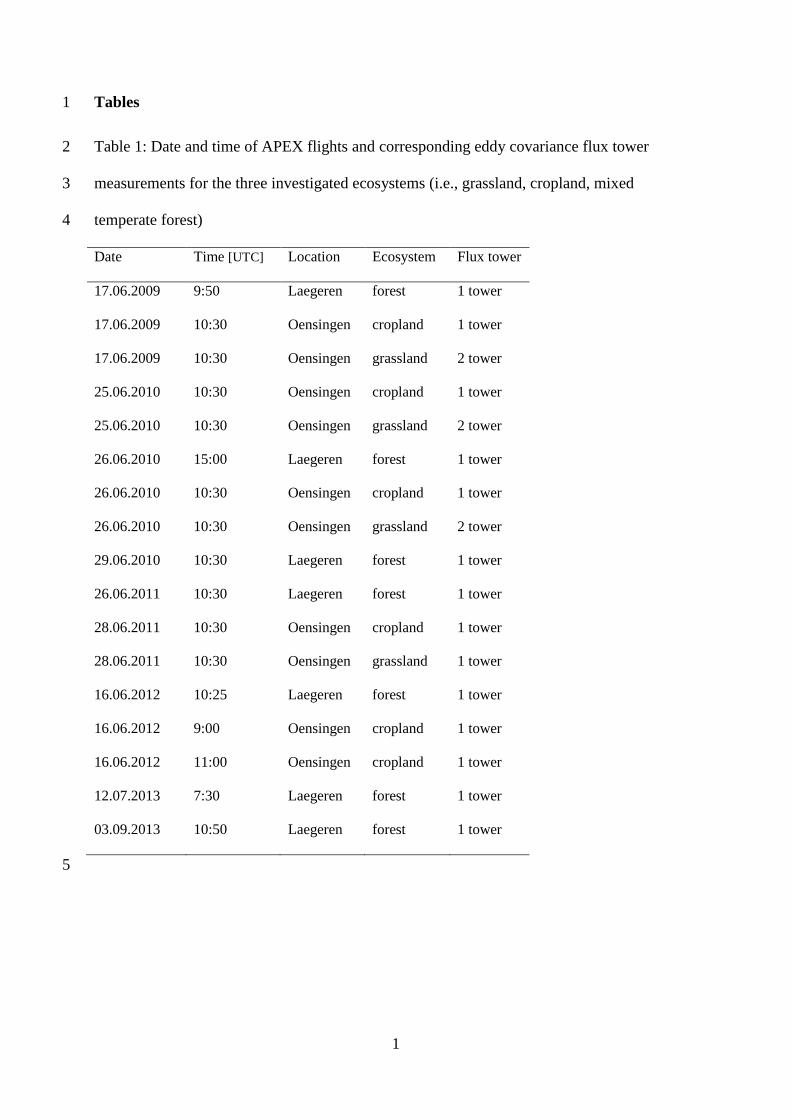
1
Tables 1
Table 1 Date and time of APEX flights and corresponding eddy covariance flux tower 2
measurements for the three investigated ecosystems (ie grassland cropland mixed 3
temperate forest) 4
Date Time [UTC] Location Ecosystem Flux tower
17062009 950 Laegeren forest 1 tower
17062009 1030 Oensingen cropland 1 tower
17062009 1030 Oensingen grassland 2 tower
25062010 1030 Oensingen cropland 1 tower
25062010 1030 Oensingen grassland 2 tower
26062010 1500 Laegeren forest 1 tower
26062010 1030 Oensingen cropland 1 tower
26062010 1030 Oensingen grassland 2 tower
29062010 1030 Laegeren forest 1 tower
26062011 1030 Laegeren forest 1 tower
28062011 1030 Oensingen cropland 1 tower
28062011 1030 Oensingen grassland 1 tower
16062012 1025 Laegeren forest 1 tower
16062012 900 Oensingen cropland 1 tower
16062012 1100 Oensingen cropland 1 tower
12072013 730 Laegeren forest 1 tower
03092013 1050 Laegeren forest 1 tower
5
2
Table 2 Availability of reference SIF760 data obtained from field spectroscopy measurements 6
to validate APEX based SIF760 retrievals 7
Date time [UTC] Location Measured crops Nr points
17062009 1030 Oensingen maize rye pea sugar beet wheat white clover 29 points
25062010 1030 Oensingen maize pea sugar beet wheat white clover 15 points
16062012 900 Oensingen carrot maize winter wheat 11 points
16062012 1100 Oensingen carrot maize winter wheat 10 points
8
3
Table 3 Goodness of fit for the hyperbolic model describing the relationship between GPPEC 9
and SIF760 O PRI and MCARI2 for the three ecosystem types perennial grassland cropland 10
and mixed temperate forest Calculated statistics are based on all data acquired from 2009-11
2013 as described in Table 1 12
Optical variable Ecosystem Regression coefficient Relative RMSE []
SIF crops 088 355
grass 059 2708
forest 048 1588
PRI crops 0008 1176
grass 095 860
forest 009 2179
MCARI2 crops 0005 1029
grass 098 550
forest 034 1798
13
1
Figures 1
2
Figure 1 Study sites A Oensingen agricultural site B Laegeren forest site The white 3
rectangles represent in A the boundary of investigated fields that comprise most of the flux-4
tower footprints and in B a coarse outline of the footprint area of the flux-tower The white 5
crosses show the locations of the flux-towers Background RGB images from Google-Earth 6
2
7
Figure 2 APEX reflectance and SIF760 image for the Oensingen site acquired on the 2606 8
2010 1030 UTC A top-of-canopy hemispherical-conical reflectance data as true color 9
composite B SIF760 map The white boxes indicate the approximate position of the flux 10
tower 11
3
12
Figure 3 APEX reflectance and SIF760 image for the Laegeren site acquired on the 2606 13
2010 1510 UTC A top-of-canopy hemispherical-conical reflectance data as true color 14
composite B SIF760 map The black arrows indicate the flight direction of flight line 1 to 3 15
(FL1-FL3) The white line marks a transect along the overlapping region of FL1 and FL2 The 16
white boxes indicate the approximate position of the flux tower 17
4
18
Figure 4 Relationships between GPPEC from the eddy-covariance measurements and SIF760 O 19
instantaneously measured between 2009 and 2013 (see Table 1) with the airborne 20
spectrometer APEX (A) PRI index (B) and MCARI2 index (C) for three vegetation types 21
(black dots perennial grassland dark grey rectangles cropland including winter wheat pea 22
and barley grey triangles mixed temperate forest) The solid curves correspond to a 23
hyperbolic model fitted to the measured data The dashed curves show the extrapolated 24
behavior 25
5
26
Figure 5 Daily light response curves from eddy flux measurements for A cropland B 27
perennial grassland and C mixed temperate forest Data were acquired between 2009 and 28
2013 (see Table 1) Grey curves represent a fitted hyperbolic model to approximate the 29
behavior of measured PAR-GPP values Crosses show GPPEC measurements that were used 30
for the SIF760 O - GPPEC comparison based on the time of APEX flights PAR values are 31
binned in 20 mW m-2
sr-1
nm-1
increments 32
6
33
Figure 6 Leaf level relationships between photosynthetic (LUEp) and fluorescence yield 34
(LUEf) for a typical C3 crop Dependency of LUEp (A) and LUEf (B) on APAR C 35
Relationship between LUEp and LUEf D Relationship between APAR and GPPL GPPL was 36
calculated as APARLUEp E Relationship between APAR and SIF760 SIF760 was calculated 37
as APARLUEf assuming a constant relationship between the SCOPE output SIFtotalL 38
(integral between 640-850nm) and SIF760L F Relationship between SIF760 L and GPPL All 39
data were simulated using SCOPE The grey areas indicate illumination conditions 40
comparable to APEX flights 41
7
42
Figure 7 Canopy level relationships between photosynthetic (LUEp) and fluorescence yield 43
(LUEf) for different canopy representations of a C3 cropland in SCOPE Dependency of 44
LUEp (A) and LUEf (B) on APAR LUEp was calculate as GPPCAPAR and LUEf was 45
directly obtained from SCOPE C Relationship between LUEp and LUEf D Relationship 46
between APAR and GPPC GPPC was directly obtained from SCOPE E Relationship 47
between APAR and SIF760C SIF760C was directly obtained from SCOPE F Relationship 48
between SIF760C and GPPC The black dashed line corresponds to a C3 cropland with LAI = 49
30 fraction of brown pigments (Cs) = 00 and a spherical (sp) leaf inclination distribution 50
function (LIDF) For the grey line Cs was changed to 20 for the black dashed line the LAI 51
was changed to 10 and for the grey dasheddotted line the LIDF was changed to plagiophile 52
(pg) The grey areas indicate illumination conditions comparable to APEX flights 53
8
54
Figure 8 Impact of temporal scaling on the SIF760C-GPPC relationship SIF760C and GPPC 55
data were simulated using SCOPE Model input parameters air temperature (A) PAR (B) and 56
LAI (C) were measured within the NitroEurope project (httpwwwnitroeuropeeu) at the 57
Speulderbos forest site Netherlands D Relationship between SIF760C and GPPC including a 58
fitted hyperbolic model for daily averages (grey dots and grey line) monthly averages (dark 59
grey triangles and line) and quarterly data (black dots and black dashed line) 60
9
61
Figure C1 Comparison of ground and airborne-based SIF760 retrievals from various crops 62
Data were acquired during four campaigns between 2009 and 2012 in the agricultural site 63
Oensingen (see Table 2) Left Fitted linear regression lines for the four considered campaigns 64
are overlaid in black The dashed line corresponds to the 11 line Right SIF retrievals from 65
APEX after applying an empirical correction factor (193) The black line represents the fitted 66
linear model the dashed line corresponds to the 11 line 67

2
Table 2 Availability of reference SIF760 data obtained from field spectroscopy measurements 6
to validate APEX based SIF760 retrievals 7
Date time [UTC] Location Measured crops Nr points
17062009 1030 Oensingen maize rye pea sugar beet wheat white clover 29 points
25062010 1030 Oensingen maize pea sugar beet wheat white clover 15 points
16062012 900 Oensingen carrot maize winter wheat 11 points
16062012 1100 Oensingen carrot maize winter wheat 10 points
8
3
Table 3 Goodness of fit for the hyperbolic model describing the relationship between GPPEC 9
and SIF760 O PRI and MCARI2 for the three ecosystem types perennial grassland cropland 10
and mixed temperate forest Calculated statistics are based on all data acquired from 2009-11
2013 as described in Table 1 12
Optical variable Ecosystem Regression coefficient Relative RMSE []
SIF crops 088 355
grass 059 2708
forest 048 1588
PRI crops 0008 1176
grass 095 860
forest 009 2179
MCARI2 crops 0005 1029
grass 098 550
forest 034 1798
13
1
Figures 1
2
Figure 1 Study sites A Oensingen agricultural site B Laegeren forest site The white 3
rectangles represent in A the boundary of investigated fields that comprise most of the flux-4
tower footprints and in B a coarse outline of the footprint area of the flux-tower The white 5
crosses show the locations of the flux-towers Background RGB images from Google-Earth 6
2
7
Figure 2 APEX reflectance and SIF760 image for the Oensingen site acquired on the 2606 8
2010 1030 UTC A top-of-canopy hemispherical-conical reflectance data as true color 9
composite B SIF760 map The white boxes indicate the approximate position of the flux 10
tower 11
3
12
Figure 3 APEX reflectance and SIF760 image for the Laegeren site acquired on the 2606 13
2010 1510 UTC A top-of-canopy hemispherical-conical reflectance data as true color 14
composite B SIF760 map The black arrows indicate the flight direction of flight line 1 to 3 15
(FL1-FL3) The white line marks a transect along the overlapping region of FL1 and FL2 The 16
white boxes indicate the approximate position of the flux tower 17
4
18
Figure 4 Relationships between GPPEC from the eddy-covariance measurements and SIF760 O 19
instantaneously measured between 2009 and 2013 (see Table 1) with the airborne 20
spectrometer APEX (A) PRI index (B) and MCARI2 index (C) for three vegetation types 21
(black dots perennial grassland dark grey rectangles cropland including winter wheat pea 22
and barley grey triangles mixed temperate forest) The solid curves correspond to a 23
hyperbolic model fitted to the measured data The dashed curves show the extrapolated 24
behavior 25
5
26
Figure 5 Daily light response curves from eddy flux measurements for A cropland B 27
perennial grassland and C mixed temperate forest Data were acquired between 2009 and 28
2013 (see Table 1) Grey curves represent a fitted hyperbolic model to approximate the 29
behavior of measured PAR-GPP values Crosses show GPPEC measurements that were used 30
for the SIF760 O - GPPEC comparison based on the time of APEX flights PAR values are 31
binned in 20 mW m-2
sr-1
nm-1
increments 32
6
33
Figure 6 Leaf level relationships between photosynthetic (LUEp) and fluorescence yield 34
(LUEf) for a typical C3 crop Dependency of LUEp (A) and LUEf (B) on APAR C 35
Relationship between LUEp and LUEf D Relationship between APAR and GPPL GPPL was 36
calculated as APARLUEp E Relationship between APAR and SIF760 SIF760 was calculated 37
as APARLUEf assuming a constant relationship between the SCOPE output SIFtotalL 38
(integral between 640-850nm) and SIF760L F Relationship between SIF760 L and GPPL All 39
data were simulated using SCOPE The grey areas indicate illumination conditions 40
comparable to APEX flights 41
7
42
Figure 7 Canopy level relationships between photosynthetic (LUEp) and fluorescence yield 43
(LUEf) for different canopy representations of a C3 cropland in SCOPE Dependency of 44
LUEp (A) and LUEf (B) on APAR LUEp was calculate as GPPCAPAR and LUEf was 45
directly obtained from SCOPE C Relationship between LUEp and LUEf D Relationship 46
between APAR and GPPC GPPC was directly obtained from SCOPE E Relationship 47
between APAR and SIF760C SIF760C was directly obtained from SCOPE F Relationship 48
between SIF760C and GPPC The black dashed line corresponds to a C3 cropland with LAI = 49
30 fraction of brown pigments (Cs) = 00 and a spherical (sp) leaf inclination distribution 50
function (LIDF) For the grey line Cs was changed to 20 for the black dashed line the LAI 51
was changed to 10 and for the grey dasheddotted line the LIDF was changed to plagiophile 52
(pg) The grey areas indicate illumination conditions comparable to APEX flights 53
8
54
Figure 8 Impact of temporal scaling on the SIF760C-GPPC relationship SIF760C and GPPC 55
data were simulated using SCOPE Model input parameters air temperature (A) PAR (B) and 56
LAI (C) were measured within the NitroEurope project (httpwwwnitroeuropeeu) at the 57
Speulderbos forest site Netherlands D Relationship between SIF760C and GPPC including a 58
fitted hyperbolic model for daily averages (grey dots and grey line) monthly averages (dark 59
grey triangles and line) and quarterly data (black dots and black dashed line) 60
9
61
Figure C1 Comparison of ground and airborne-based SIF760 retrievals from various crops 62
Data were acquired during four campaigns between 2009 and 2012 in the agricultural site 63
Oensingen (see Table 2) Left Fitted linear regression lines for the four considered campaigns 64
are overlaid in black The dashed line corresponds to the 11 line Right SIF retrievals from 65
APEX after applying an empirical correction factor (193) The black line represents the fitted 66
linear model the dashed line corresponds to the 11 line 67
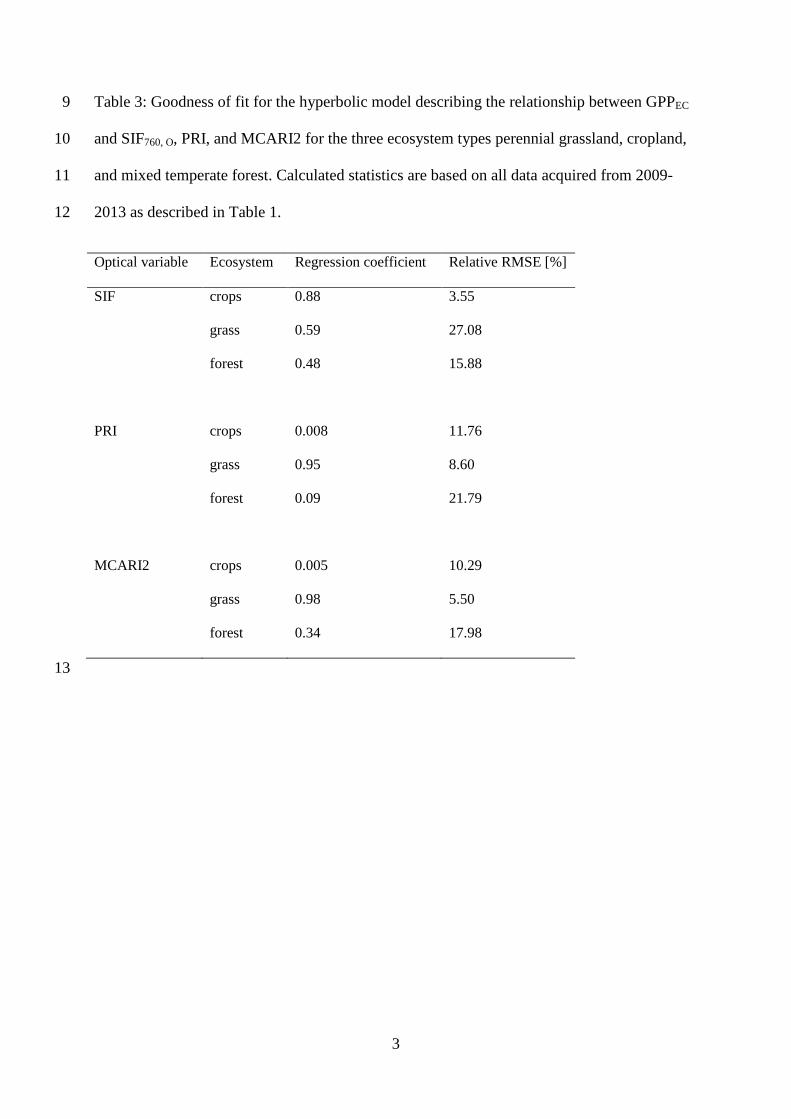
3
Table 3 Goodness of fit for the hyperbolic model describing the relationship between GPPEC 9
and SIF760 O PRI and MCARI2 for the three ecosystem types perennial grassland cropland 10
and mixed temperate forest Calculated statistics are based on all data acquired from 2009-11
2013 as described in Table 1 12
Optical variable Ecosystem Regression coefficient Relative RMSE []
SIF crops 088 355
grass 059 2708
forest 048 1588
PRI crops 0008 1176
grass 095 860
forest 009 2179
MCARI2 crops 0005 1029
grass 098 550
forest 034 1798
13
1
Figures 1
2
Figure 1 Study sites A Oensingen agricultural site B Laegeren forest site The white 3
rectangles represent in A the boundary of investigated fields that comprise most of the flux-4
tower footprints and in B a coarse outline of the footprint area of the flux-tower The white 5
crosses show the locations of the flux-towers Background RGB images from Google-Earth 6
2
7
Figure 2 APEX reflectance and SIF760 image for the Oensingen site acquired on the 2606 8
2010 1030 UTC A top-of-canopy hemispherical-conical reflectance data as true color 9
composite B SIF760 map The white boxes indicate the approximate position of the flux 10
tower 11
3
12
Figure 3 APEX reflectance and SIF760 image for the Laegeren site acquired on the 2606 13
2010 1510 UTC A top-of-canopy hemispherical-conical reflectance data as true color 14
composite B SIF760 map The black arrows indicate the flight direction of flight line 1 to 3 15
(FL1-FL3) The white line marks a transect along the overlapping region of FL1 and FL2 The 16
white boxes indicate the approximate position of the flux tower 17
4
18
Figure 4 Relationships between GPPEC from the eddy-covariance measurements and SIF760 O 19
instantaneously measured between 2009 and 2013 (see Table 1) with the airborne 20
spectrometer APEX (A) PRI index (B) and MCARI2 index (C) for three vegetation types 21
(black dots perennial grassland dark grey rectangles cropland including winter wheat pea 22
and barley grey triangles mixed temperate forest) The solid curves correspond to a 23
hyperbolic model fitted to the measured data The dashed curves show the extrapolated 24
behavior 25
5
26
Figure 5 Daily light response curves from eddy flux measurements for A cropland B 27
perennial grassland and C mixed temperate forest Data were acquired between 2009 and 28
2013 (see Table 1) Grey curves represent a fitted hyperbolic model to approximate the 29
behavior of measured PAR-GPP values Crosses show GPPEC measurements that were used 30
for the SIF760 O - GPPEC comparison based on the time of APEX flights PAR values are 31
binned in 20 mW m-2
sr-1
nm-1
increments 32
6
33
Figure 6 Leaf level relationships between photosynthetic (LUEp) and fluorescence yield 34
(LUEf) for a typical C3 crop Dependency of LUEp (A) and LUEf (B) on APAR C 35
Relationship between LUEp and LUEf D Relationship between APAR and GPPL GPPL was 36
calculated as APARLUEp E Relationship between APAR and SIF760 SIF760 was calculated 37
as APARLUEf assuming a constant relationship between the SCOPE output SIFtotalL 38
(integral between 640-850nm) and SIF760L F Relationship between SIF760 L and GPPL All 39
data were simulated using SCOPE The grey areas indicate illumination conditions 40
comparable to APEX flights 41
7
42
Figure 7 Canopy level relationships between photosynthetic (LUEp) and fluorescence yield 43
(LUEf) for different canopy representations of a C3 cropland in SCOPE Dependency of 44
LUEp (A) and LUEf (B) on APAR LUEp was calculate as GPPCAPAR and LUEf was 45
directly obtained from SCOPE C Relationship between LUEp and LUEf D Relationship 46
between APAR and GPPC GPPC was directly obtained from SCOPE E Relationship 47
between APAR and SIF760C SIF760C was directly obtained from SCOPE F Relationship 48
between SIF760C and GPPC The black dashed line corresponds to a C3 cropland with LAI = 49
30 fraction of brown pigments (Cs) = 00 and a spherical (sp) leaf inclination distribution 50
function (LIDF) For the grey line Cs was changed to 20 for the black dashed line the LAI 51
was changed to 10 and for the grey dasheddotted line the LIDF was changed to plagiophile 52
(pg) The grey areas indicate illumination conditions comparable to APEX flights 53
8
54
Figure 8 Impact of temporal scaling on the SIF760C-GPPC relationship SIF760C and GPPC 55
data were simulated using SCOPE Model input parameters air temperature (A) PAR (B) and 56
LAI (C) were measured within the NitroEurope project (httpwwwnitroeuropeeu) at the 57
Speulderbos forest site Netherlands D Relationship between SIF760C and GPPC including a 58
fitted hyperbolic model for daily averages (grey dots and grey line) monthly averages (dark 59
grey triangles and line) and quarterly data (black dots and black dashed line) 60
9
61
Figure C1 Comparison of ground and airborne-based SIF760 retrievals from various crops 62
Data were acquired during four campaigns between 2009 and 2012 in the agricultural site 63
Oensingen (see Table 2) Left Fitted linear regression lines for the four considered campaigns 64
are overlaid in black The dashed line corresponds to the 11 line Right SIF retrievals from 65
APEX after applying an empirical correction factor (193) The black line represents the fitted 66
linear model the dashed line corresponds to the 11 line 67
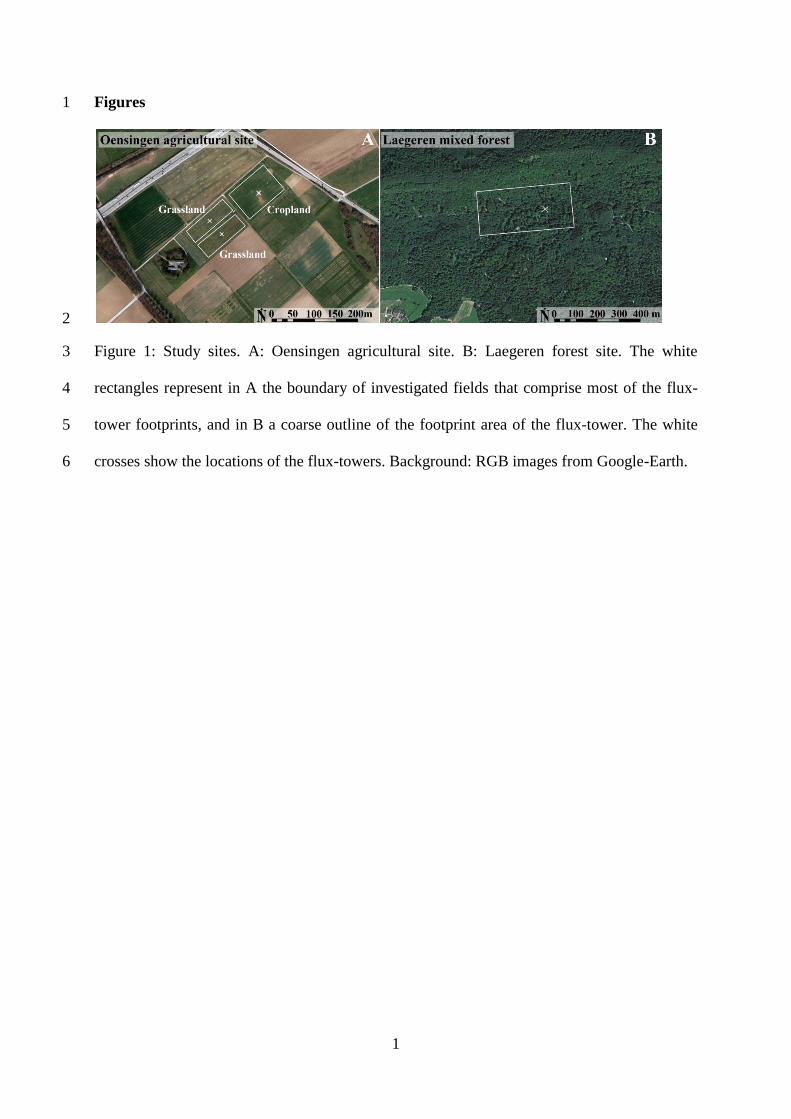
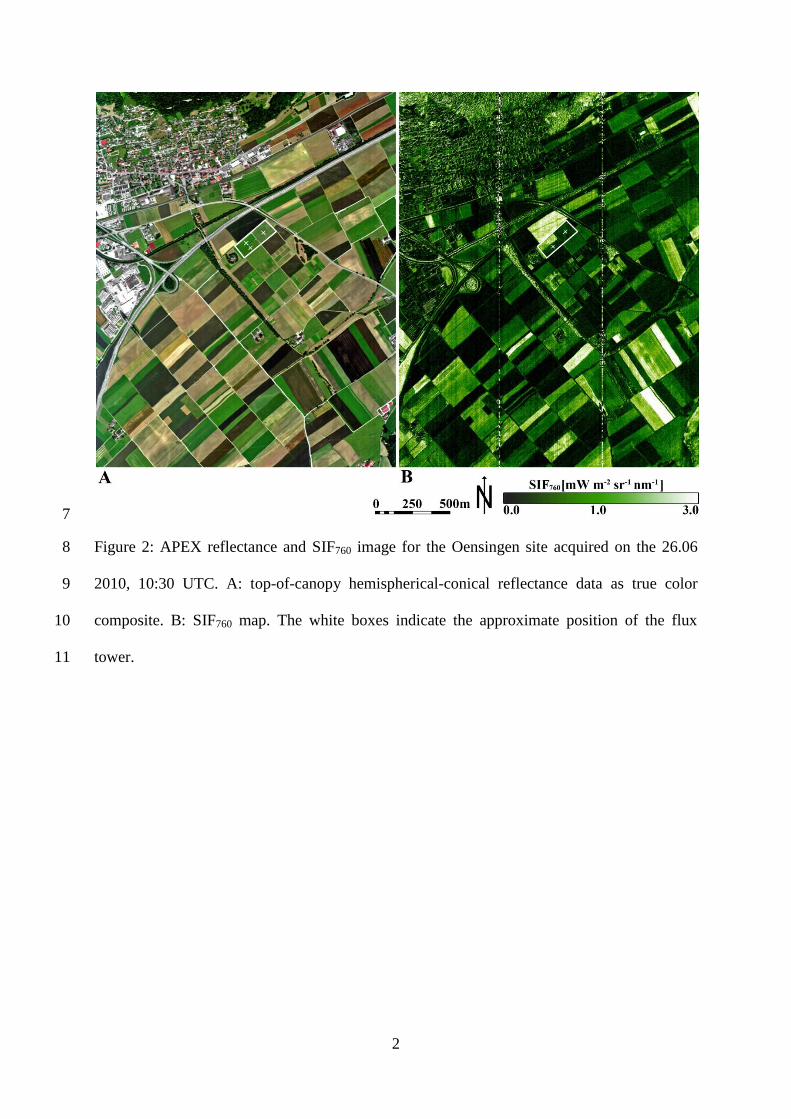
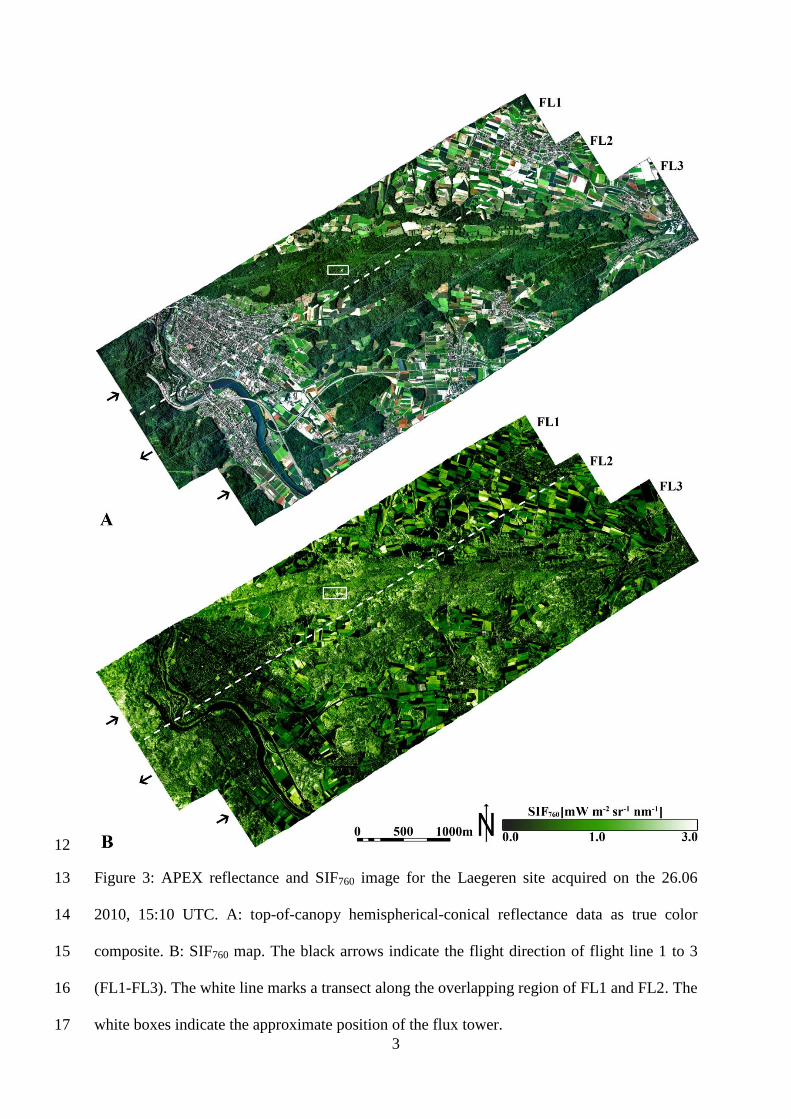
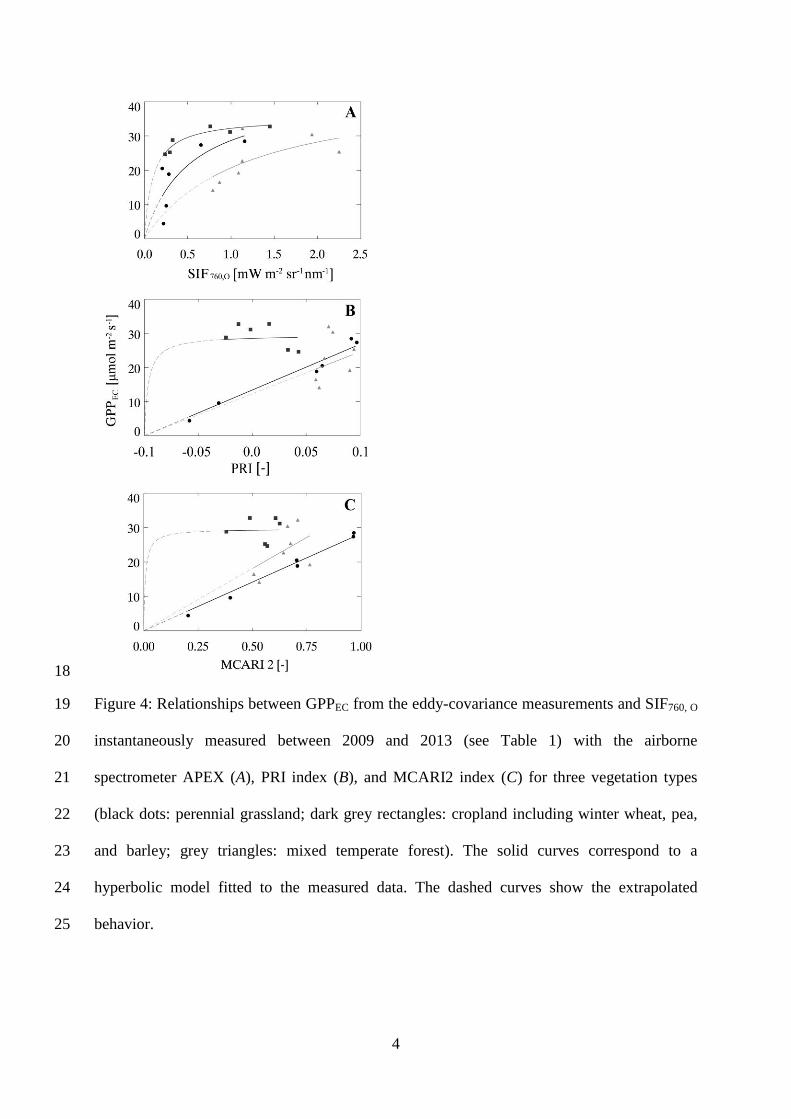
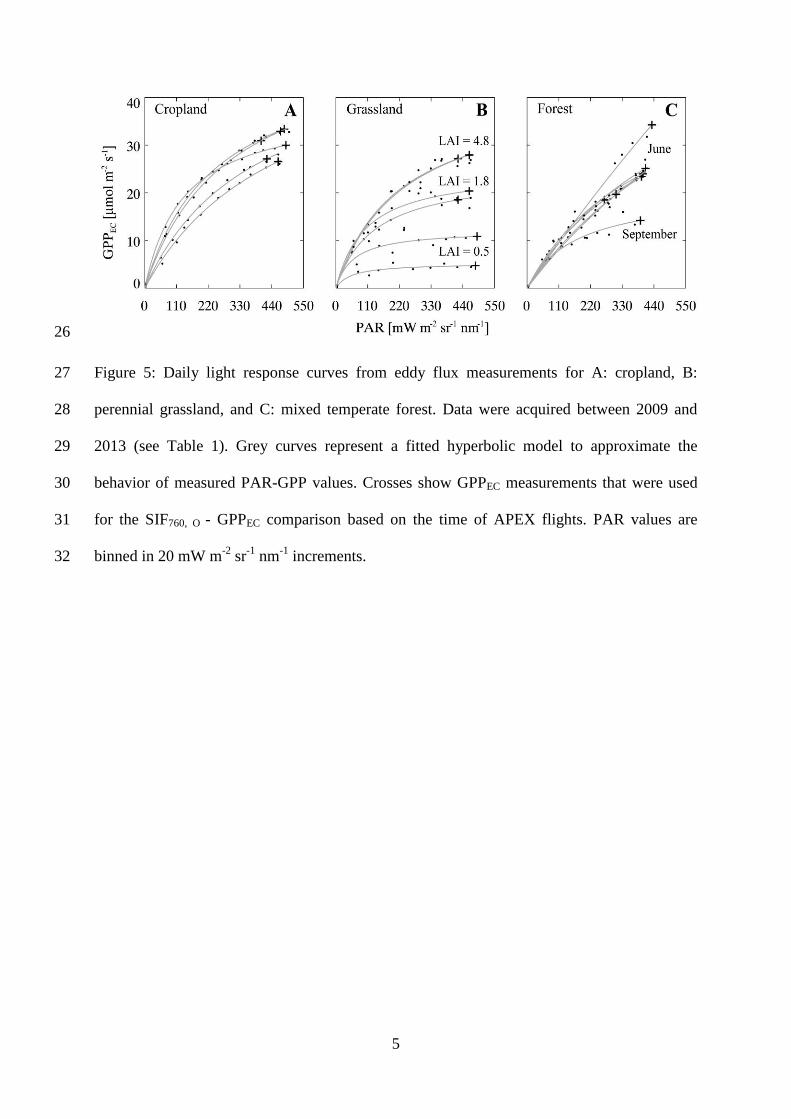
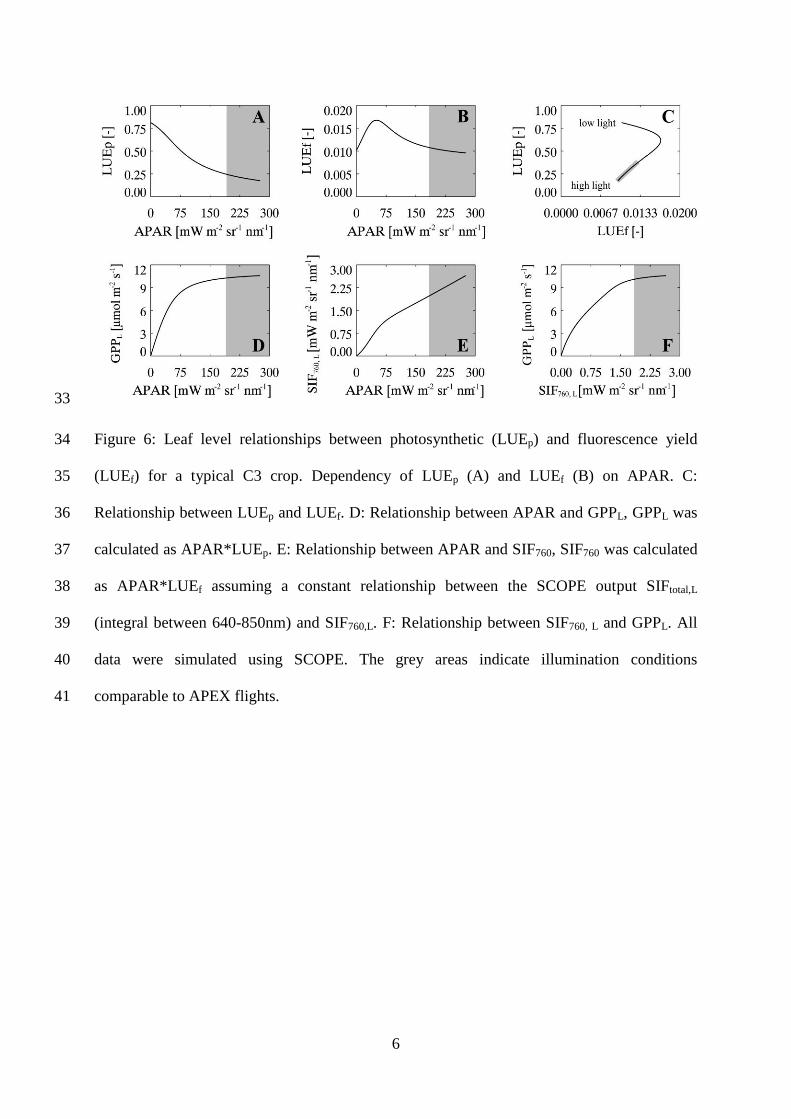
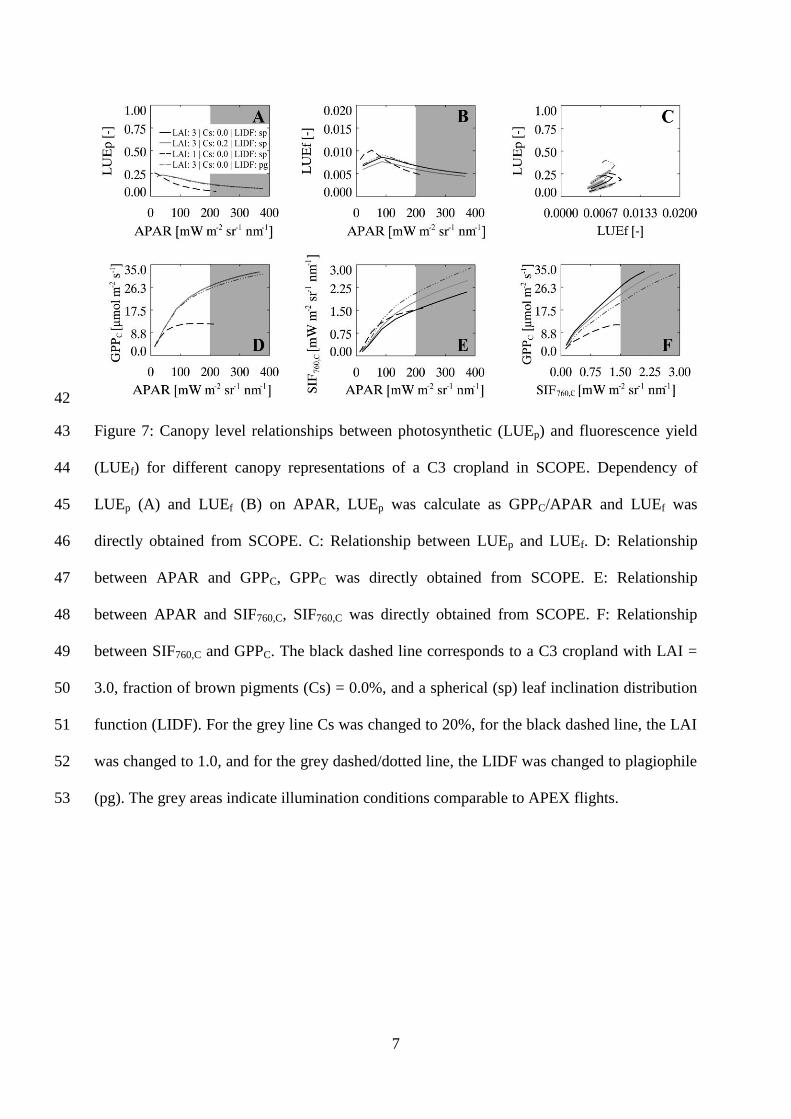
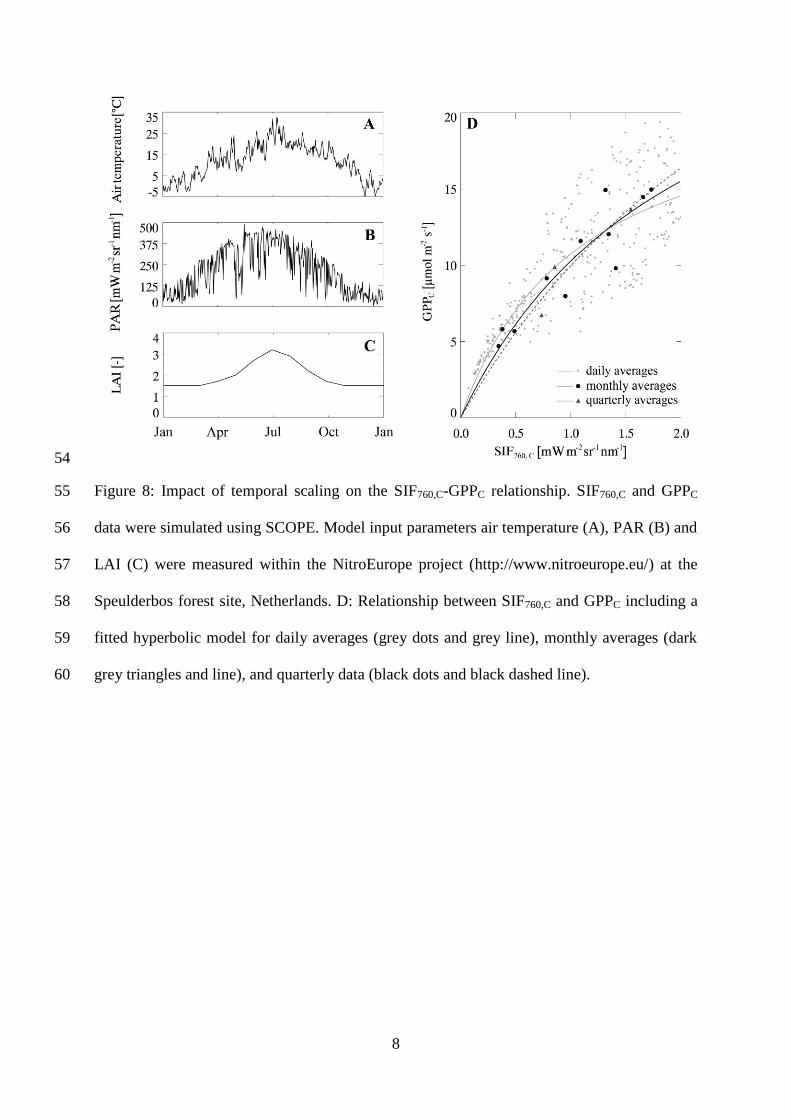
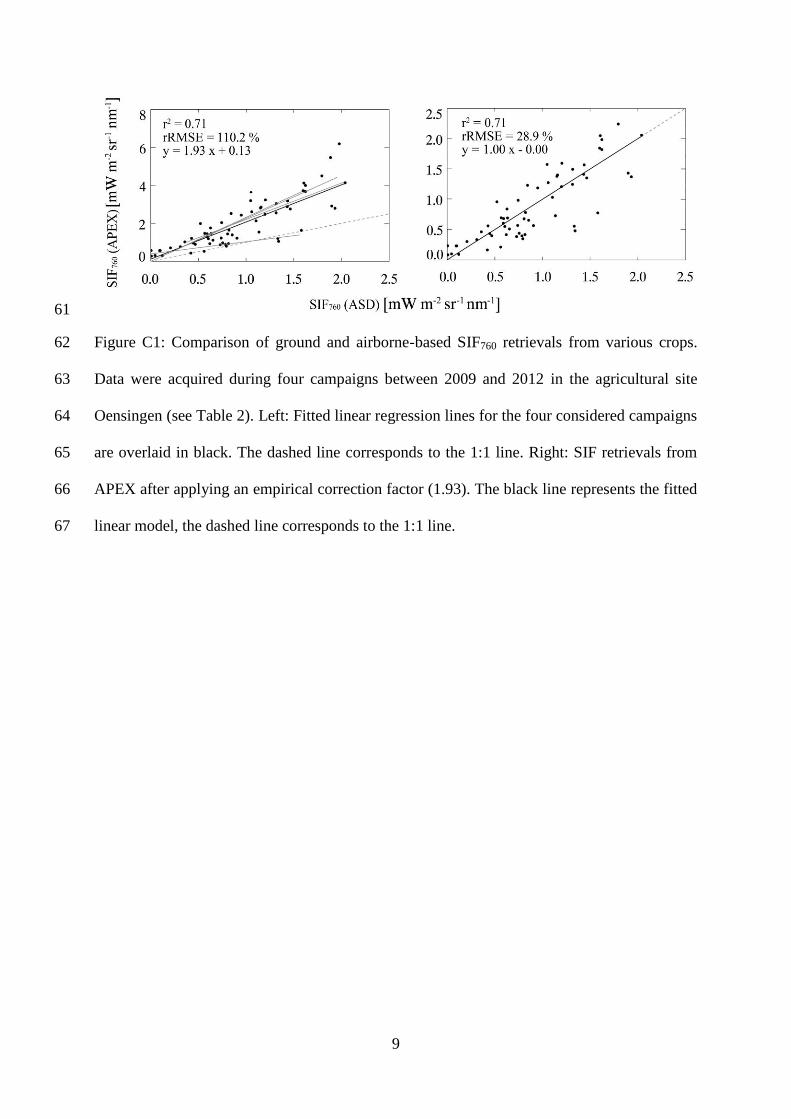