Embed Size (px)
Citation preview
Access to Success: Patterns of Advanced Placement Participation in U.S. High Schools
Policy Information Report
®
®
Table of Contents
Preface.............................................................................................................2
Acknowledgments...........................................................................................2
Executive.Summary........................................................................................3
Introduction....................................................................................................6
The.Advanced.Placement.Program®........................................................7
AP®.Performance.and.Academic.Success................................................8
Efforts.to.Boost.Participation..................................................................8
The.Growth.in.the.AP.Program.and.Equity.of.Access............................8
Research.Questions.......................................................................................10
Methodology..................................................................................................11
Cluster.Analysis.......................................................................................11
Cluster.Summaries.................................................................................12
Merging.CCD.and.AP.Data.....................................................................12
What.Is.the.Availability.of.the.AP.Program.in.the.Nation’s..High.Schools?...............................................................................................15
What.Proportion.of.High.School.Students.Participate.in..the.AP.Program?...........................................................................................17
What.is.the.Level.of.Student.Performance.on..AP.Exams.in.the.Nation’s.High.Schools?......................................................20
Conclusions...................................................................................................23
Implications..................................................................................................24
Appendix.A:.Cluster.Analysis.Methodology.................................................25
Appendix.B:.School.Type.Codes.and.Definitions........................................27
This.report.was.written.by:
Philip Handwerk
Law School Admissions Council
Namrata Tognatta
Richard J. Coley
Drew H. Gitomer
Educational Testing Service
The.views.expressed.in.this.report.
are.those.of.the.authors.and.do.not.
necessarily.reflect.the.views.of.the.
officers.and.trustees.of.Educational.
Testing.Service.
Additional.copies.of.this.report.can.be.
ordered.for.$15.(prepaid).from:
Policy.Information.Center.
Mail.Stop.19-R.
Educational.Testing.Service.
Rosedale.Road.
Princeton,.NJ.08541-0001.
609-734-5212.
Copies.can.be.downloaded.from:.
www.ets.org/research/pic.
Copyright.©.2008.by.Educational.
Testing.Service..All.rights.reserved..
ETS,.the.ETS.logo.and.LISTENING..
LEARNING..LEADING..are.registered.
trademarks.of.Educational.Testing.
Service.(ETS)..AP.and.Advanced.
Placement.Program.are.registered.
trademarks.of.the.College.Board..
PSAT/NMSQT.is.a.registered.
trademark.of.the.College.Board.
and.the.National.Merit.Scholarship.
Corporation..International.
Baccalaureate.is.a.registered.
trademark.of.the.International.
Baccalaureate.Organization..8006
July.2008.
Policy.Evaluation.and.
..Research.Center.
Policy.Information.Center.
Educational.Testing.Service
�
Preface
Acknowledgments
As.part.of.the.movement.for.more.rigorous.high.school.curricula,.national.and.state.leaders,.along.with..education.policymakers.and.organizations.like.the.College.Board,.have.advocated.for.expanded.access.to.Advanced.Placement.Program®.(AP®).courses..The.need.for.more.rigorous.coursework.like.the.AP.program.is.particularly.acute.for.underrepresented.students,.including.students.from.low-income.families.and.students.from.racial/ethnic.minorities..The.AP.program.and.other.rigorous.courses.are.often.considered.to.be.essential.for.students,.regardless.of.social.class.and.race/ethnicity,.who.are.aiming.to.attend.selective.colleges.and.universities..But.for.many.underrepresented.students.attending.less.selective.institutions,.such.courses.may.be.the.best,.if.not.the.only,.opportunity.to.participate.in.meaningful.and.productive.high.school.curricula.
The.College.Board,.the.sponsor.of.the.AP.program,.provides.annual,.comprehensive.reports.on.AP.program.participation.and.performance.at.the.national.and.state.levels.and.for.different.racial/ethnic.groups..These.reports.show.steady.growth.in.the.program,.although.students.in.the.largest.racial/ethnic.minority.groups.continue.to.participate.at.much.lower.rates.
To.obtain.a.different.view.of.patterns.of.access.to.the.AP.program,.Handwerk,.Tognatta,.Coley,.and.Gitomer.used.a.novel.approach.to.examining.these.data..They.merged.College.Board.data.on.AP.program.participation.with.a.national.database.that.contains.extensive.information.on.all.U.S..public.high.schools..
By.matching.the.students.with.their.high.schools,.Handwerk.and.his.colleagues.were.able.to.view.AP.program.participation.and.performance.in.the.context.of.important.high.school.characteristics,.including.such.factors.as.school.size,.locale,.and.socioeconomic.status..This.unique.view.provides.a.snapshot.of.AP.program.activity.in.the.2003-04.school.year.
The.view.the.authors.provide.is.more.sobering.than.the.one.provided.by.typical.data.analyses..Although.most.students.attend.a.high.school.at.which.the.AP.program.is.available,.few.students.actually.take.an.AP.exam.even.after.taking.an.AP.course,.and.only.a.fraction.of.those.who.do.take.a.test.score.high.enough.to.qualify.for.college.credit.or.placement.in.the.colleges.and.universities.that.offer.such.opportunities..Patterns.of.participation.for.low-income.and.underrepresented.minority.students.and.for.students.attending.small,.rural.high.schools.are.particularly.troubling..As.national.and.state.leaders.emphasize.the.need.to.expand.opportunities.for.more.students.to.participate.in.advanced.coursework,.this.report.creates.a.better.understanding.of.the.challenges.that.remain.in.promoting.access.to.such.opportunities.for.all.students..
Michael.T..Nettles.Senior.Vice.President.Policy.Evaluation.and.Research.Center.
The.authors.wish.to.thank.the.College.Board.for.providing.access.to.the.Advanced.Placement.Program.data..The.authors.wish.to.acknowledge.the.following.individuals.who.provided.comments.and.feedback.on.drafts.of.this.report:.Clifford.Adelman,.Paul.Barton,.Brent.Bridgeman,.Wayne.Camara,.Maureen.Ewing,..
Margaret.Goertz,.Rick.Morgan,.Joann.Rock,.Greg.Vafis,.Cathy.Wendler,.and.Holly.Yettick..Rich.Pliskin.was.the.editor,.Marita.Gray.provided.desktop..publishing.and.designed.the.cover,.and.Jessica.Balsavage.coordinated.production..Errors.of.fact.or.interpretation,.however,.are.those.of.the.authors.
�
Executive Summary
Providing.high.school.students.access.to.advanced.coursework.has.long.been.considered.an.important.means.of.preparing.students.for.success.after.high.school..The.College.Board’s.Advanced.Placement.Program.(AP).is.among.the.largest.of.several.programs.providing.advanced.curricula.to.high.school.students.today..For.many.years,.the.College.Board.has.generated.extensive.data.on.AP.program.participation.and.performance.at.national.and.state.levels.and.has.provided.these.data.for.different.racial/ethnic.groups.of.students..This.study.offers.a.broader.and.deeper.perspective.by.merging.the.College.Board’s.AP.program.data.for.the.2003-2004.school.year.with.data.from.the.U.S..Department.of.Education.for.all.U.S..public.high.schools..Thus,.for.the.first.time.we.can.answer.the.following.three.questions.about.students.in.grades.9.through.12:
1.WhatistheavailabilityoftheAPprograminthenation’spublichighschools?What.typically.has.been.reported.is.the.number.of.schools.offering.the.AP.program..This.report.examines.how.AP.offerings.differ.across.public.schools.that.share.important.dimensions.as.determined.by.cluster.analysis..This.report.also.examines.the.intensity.of.AP.offerings.in.these.public.schools.—.that.is,.the.breadth.of.their.AP.offerings.
2.HowmanystudentsparticipateinAP?What.typically.have.been.reported.are.overall.counts.of.students.and.counts.of.students.disaggregated.by.subgroups..This.report.looks.at.participation.patterns.in.public.schools.with.different.socioeconomic,.racial/ethnic,.and.geographic.characteristics.
3.Howmanystudentsareeligibleforadvancedplacementorcollegecredit?What.typically.have.been.reported.are.overall.AP.grade.distributions.by.subject.and.student.subgroups..This.report.examines.AP.grade.information.for.public.schools.with.different.socioeconomic,.racial/ethnic,.and.geographic.characteristics.
We.took.this.approach.because.examining.data.on.overall.average.rates.of.participation.and.performance.in.the.AP.program.can.mask.important.differences..in.the.availability.of.educational.opportunity.to.
students.attending.different.types.of.schools..The.data.in.this.report.allow.a.richer.and.more.detailed.understanding.of.how.different.types.of.public.schools.and.students.differ.in.their.access.to,.and.performance.in,.the.AP.program.1
We.present.brief.highlights.of.the.study’s.findings.below..In.the.body.of.the.report,.we.show.how.access.to.the.AP.program,.participation.in.the.AP.program,.and.performance.in.the.AP.program.were.defined.in.this.study.and.the.methods.(cluster.analysis).used.to.group.American.high.schools.into.clusters.based.on.their.similarities.
WhatistheAPprogramavailabilityacrossthenation’spublichighschools?High schools were defined as “offering” the AP program if at least one student in that high school took an AP examination in the 2003-2004 school year.
•. Fifty-eight.percent.of.U.S..public.high.schools,.enrolling.85.percent.of.all.students,.offered.some.type.of.AP.program..For.the.purpose.of.this.paper,.schools’.AP.offerings.were.categorized.on.the.basis.of.the.intensity.of.their.AP.offerings.—.those.offering.at.least.one.AP.mathematics.exam,.at.least.one.AP.science.exam,.and.at.least.one.AP.English.exam.were.defined.as.“High.AP”.schools..Schools.that.offered.at.least.one.AP.exam.but.did.not.meet.the.“High.AP”.thr.eshold.were.defined.as.“Low.AP”.schools..Twenty-four.percent.of.high.schools.offered.at.least.one.AP.exam.(“Low.AP”.schools).while.34.percent.offered.a.fuller.complement.of.exams.(“High.AP”.schools).
•. There.is.unequal.access.to.the.AP.program.among.racial/ethnic.groups..While.94.percent.of.Asian.American.students.attend.public.schools.where.at.least.one.student.is.taking.an.AP.exam,.only.81.percent.of.African.American.students.attend.such.schools..Further,.when.the.AP.program.is.available,.African.American.students.are.more.likely.to.attend.schools.classified.as.“Low.AP”.and.are.the.least.likely.to.attend.“High.AP”.schools..
1.To.accomplish.this,.this.study.uses.a.methodology.that.results.in.different.AP.participation.rates.than.those.reported.by.the.College.Board’s.Advanced Placement Report to the Nation..This.report.provides.a.snapshot.of.AP.participation.within.one.calendar.year,.while.the.College.Board.data.report.on.students’.AP.participation.accumulated.over.all.of.their.high.school.years..The.result.of.this.difference.is.that.the.pres-ent.study.reports.less.AP.participation.than.reported.in.the.College.Board’s.annual.AP.report.since.some.of.the.high.school.underclassmen.who.are.not.identified.as.AP.participants.may.ultimately.participate.in.the.program.by.the.time.they.graduate..The.College.Board’s.Advanced Placement Report to the Nation.is.available.at.www.collegeboard.com/prod_downloads/about/news_info/ap/2005/ap-report-nation.pdf..See.pages.11.to.14.of.this.report.for.a.discussion.of.the.data.used.in.this.study.
�
•. Low-income.students.were.less.likely.than.other.students.to.attend.public.schools.offering.the.AP.program.(81.percent.vs..88.percent)..When.they.did.attend.AP.schools,.the.program.was.more.likely.to.offer.limited.AP.course.options.
•. Large,.suburban.public.schools.with.predominantly.nonminority.populations.were.the.most.likely.to.have.the.AP.program.available..Small,.rural,.low-income.public.schools.in.the.Midwest.were.the.least.likely.to.have.the.AP.program.available.
HowmanystudentsparticipateintheAPprogram?.A student is defined as participating in AP if he or she took any AP exam during the 2003-2004 year regardless of AP grade.
•. Overall,.a.median.of.5.percent.of.public.high.school.students.who.attended.schools.that.provided.the.AP.program.participated.in.the.AP.program.
•. Participation.across.clusters.of.high.schools.ranges.from.5.percent.to.8.percent.in.“High.AP”.schools.to.less.than.3.percent.in.“Low.AP”.schools.
•. In.public.schools.offering.the.AP.program.as.defined.in.this.study,.females.were.more.likely..than.males.to.participate.in.the.program.(6.1.percent.vs..4.3.percent)..This.finding.held.across..all.school.clusters.and.for.both.“High.AP”.and..“Low.AP”.schools.
•. There.were.major.racial/ethnic.differences.in.participation.in.the.AP.program.—.10.3.percent.of.Asian.American,.5.3.percent.of.White,.2.4.percent.of.Hispanic,.and.0.5.percent.of.African.American.students.took.an.AP.exam.
•. Less.than.1.percent.of.low-income.students.(as.measured.by.eligibility.for.free.and.reduced.price.lunch).took.an.AP.exam.in.schools.that.offered..AP.exams.
Howmanystudentsareeligibleforadvancedplacementorcollegecredit?A student is defined as “eligible for advanced placement or college credit” if he or she received a grade of 3 or higher on any AP exam during the 2003-2004 year.
•. Overall,.a.median.of.2.4.percent.of.public.high.school.students.earned.a.grade.of.3.or.better.on.at.least.one.AP.exam..For.females,.the.rate.was.2.7.percent,.compared.with.2.1.percent.for.males.
•. A.grade.of.3.or.higher.ranges.from.a.median.of.4.percent.of.Asian.American.students,.to.2.8.percent.of.White.students,.to.0.6.percent.of.Hispanic.students..The.median.percentage.for.African.American.students.is.zero.
•. Eligibility.for.advanced.placement.or.college.credit.is.related.to.the.intensity.of.the.AP.program.in.the.school..In.“High.AP”.schools,.a.median.of.4.percent.of.students.achieve.a.grade.of.3.or.higher.and.thus.are.eligible.for.AP.credit,.compared.with.less.than.1.percent.in.“Low.AP”.schools.
•. Eligibility.for.advanced.placement.or.college.credit.is.also.related.to.income.status..While.3.percent.of.non-low-income.students.received.a.grade.of.3.or.higher.in.an.AP.exam,.the.median.percentage.for.low-income.students.was.zero.
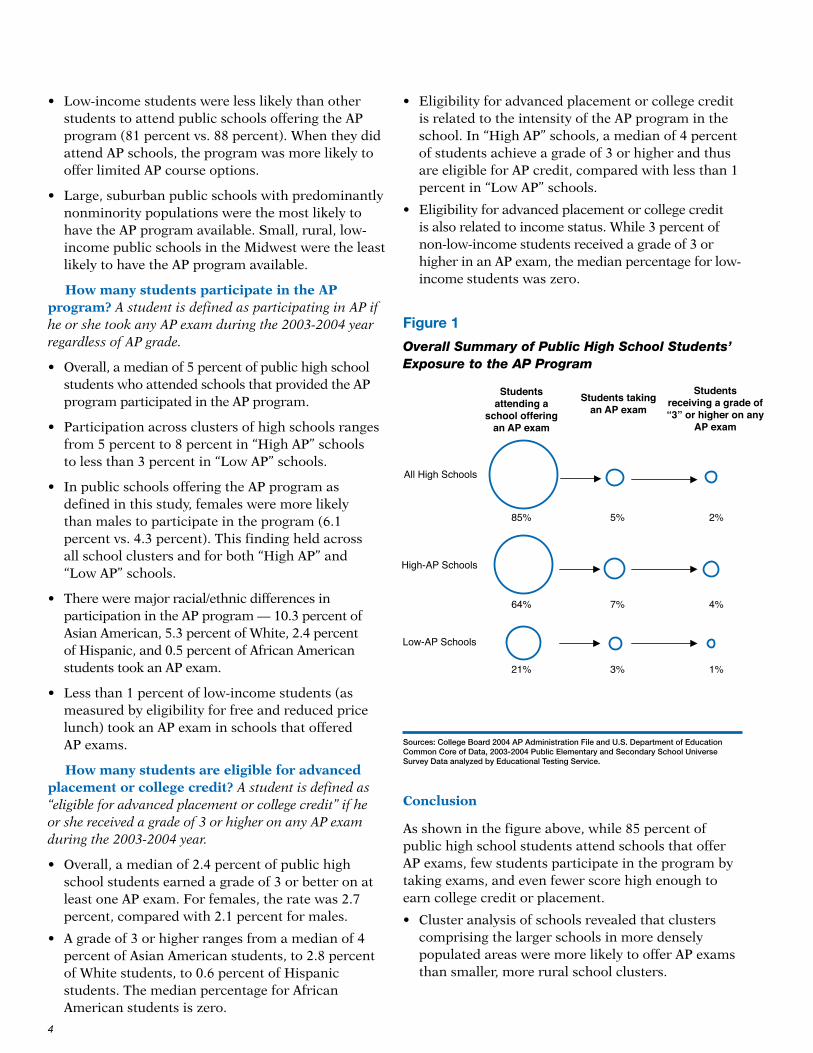
Students attending a
school offering an AP exam
Students taking an AP exam
All High Schools
High-AP Schools
Low-AP Schools
85% 5% 2%
64% 7% 4%
21% 3% 1%
Students receiving a grade of “3” or higher on any
AP exam
Figure 1
Overall Summary of Public High School Students’ Exposure to the AP Program
Sources: College Board 2004 AP Administration File and U.S. Department of Education Common Core of Data, 2003-2004 Public Elementary and Secondary School Universe Survey Data analyzed by Educational Testing Service.
Conclusion
As.shown.in.the.figure.above,.while.85.percent.of.public.high.school.students.attend.schools.that.offer.AP.exams,.few.students.participate.in.the.program.by.taking.exams,.and.even.fewer.score.high.enough.to.earn.college.credit.or.placement.
•. Cluster.analysis.of.schools.revealed.that.clusters.comprising.the.larger.schools.in.more.densely.populated.areas.were.more.likely.to.offer.AP.exams.than.smaller,.more.rural.school.clusters..
�
•. Across.all.clusters,.public.high.schools.are.similar.with.regard.to.patterns.of.AP.exam.participation.and.grades.earned.across.all.racial/ethnic.categories..Even.in.schools.that.have.high.overall.participation.rates,.African.American.students.are.much.less.likely.to.participate.in.the.program.by.taking.an.exam.than.are.students.in.other.racial/ethnic.groups.
•. Low-income.and.underrepresented.minority..students.consistently.lag.behind.their.peers.in..AP.exam.participation.and.performance.2
Implications
•. Although.the.data.show.that.the.AP.program.is.available.in.most.public.high.schools,.this.report.identifies.major.opportunities.for.expanding..the.program.
•. For.more.students.to.reap.the.benefits.of.AP.program.participation.by.taking.and.doing.well.on.the.exam.in.addition.to.taking.the.course,.schools.need.to.do.more.to.broaden.their.programs.and.create.an.“AP.culture”.within.their.schools..Underrepresented.students.in.particular.are.more.likely.to.participate.in.the.AP.program.in.schools.that.offer.more.AP.courses.
•. Some.segments.of.the.high.school.population.may.especially.benefit.from.efforts.to.expand.the.breadth.and.depth.of.advanced.academic.coursework...These.include.small,.rural,.low-income.schools.that.are.less.likely.than.other.types.of.high.schools.to.participate.in.the.AP.program,.and.underrepre-sented.minority.and.low-income.students.who.are.particularly.underserved.by.the.program..
•. The.availability.of.the.AP.program.in.a.school.is.a.necessary.but.insufficient.factor.in.promoting.student.participation..Even.in.schools.offering.the.program.(where.at.least.one.student.takes.an.AP.exam).and.among.those.classified.as.“High.AP,”.few.students.are.actually.taking.the.AP.exam..
The.“Conclusions”.section.of.this.report.provides.recommendations.for.further.research.
2.These.low.rates.of.AP.program.participation,.particularly.among.low-income.and.underrepresented.minority.group.students,.are.generally.consistent.with.Clifford.Adelman’s.unpublished.analysis.of.data.from.NELS:88/2000.based.on.both.high.school.and.postsecondary.transcripts.for.students.who.were.high.school.seniors.in.1992..Adelman.reports.no.AP.participation.for.92.percent.of.all.high.schools.students,.91.percent.of.White.students,.97.percent.of.African.American.students,.97.percent.of.Latino.students,.and.79.percent.of.Asian.students..Rates.of.participation.ranged.from.4.percent.in.the.lowest.third.of.family.income.to.14.percent.in.the.highest.third..Among.socioeconomic.status.quintiles,.participation.ranged.from.2.percent.in.the.lowest.quintile.to.20.percent.in.the.highest.quintile..Source:.Personal.communication,.May.31,.2007.
�
Providing.high.school.students.with.access.to.advanced.coursework.has.long.been.held.as.an.important.means.of.preparing.students.for.academic.and.professional.success.after.high.school..In.1983,.the.landmark.report.A Nation at Risk articulated.the.country’s.weakening.“preeminence.in.commerce,.industry,.science.and.technological.innovation,”.and.inferred.that.a.strengthening.of.high.school.instruction.was.required.3.
More.recently,.a.1999.U.S..Department.of.Education.report, Answers in the Tool Box,.supported.the.view.that.college.readiness.and.completion.depend.most.on.the.“quality.and.intensity.of.one’s.high.school.curriculum.”4.That.study.was.replicated.in.2006.in.The Toolbox Revisited,.which.reaffirmed.the.finding.that.the.academic.intensity.of.the.high.school.curriculum.is.the.most.significant.contributor.to.college.completion,.and.that.AP.intensity.is.most.clearly.indicated.by.successful.performance.on.AP.exams.5
In.2007,.the.National.Academy.of.Sciences.issued.a.report.that.addresses.several.critical.challenges.that.the.United.States.faces.in.the.global.marketplace.and.in.science.and.technology..One.of.the.report’s.recommendations.calls.for.widening.the.pipeline.for.students.who.are.prepared.to.enter.higher.education.by.providing.opportunities.and.incentives.for.more.students.to.take.advanced.coursework.in.high.school.�
Though.research.has.underscored.the.value.of..academic.rigor.to.predict.future.success.time.and.again,.research.also.shows.that.the.high.school.educational..experience.is.often.different.among.racial/ethnic.groups..Newly.collected.data.from.the.National.Assessment.of.Educational.Progress.(NAEP).provides.a.picture.of.this.differential.high.school.experience.for.the.high.school.class.of.2005..The.NAEP.data.revealed.some.progress.as.well.as.some.lingering.gaps.in.narrowing.the.differences.in.academic.experiences.among.students.of.different.racial/ethnic.backgrounds..Since.1990,.African.American.high.school.graduates.have.closed.a.six-point.gap.with.White.graduates.in.the.percent.
completing.at.least.a.midlevel.curriculum.—-.by.2005.there.was.no.significant.difference.between.White.and.Black.graduates..However,.the.corresponding.White-Hispanic.gap.in.2005.was.not.significantly.different.from.that.in.1990..In.addition,.African.American.and.Hispanic.graduates.were.less.likely.than.their.White.classmates.to.have.completed.calculus.or.advanced.science.courses..7
The.U.S..Department.of.Education’s Condition of Education 20078.highlights.similar.gaps.in.patterns.of.AP.course.taking.and.performance.by.race/ethnicity..The.report.examines.the.trend.in.AP.mathematics,.science,.English,.and.foreign.language.courses..It.finds.that.although.the.total.number.of.students.taking.AP.exams.more.than.doubled.between.1997.and.2005,.there.was.a.decline.in.the.percent.of.students.earning.a.qualifying.grade.of.3.or.above.(from.65.percent.to.59.percent)..In.the.same.period,.the.participation.of.minority.students.increased.from.27.percent.to.33.percent..The.report.also.notes.that.there.was.a.decline.in.the.average.performance.of.minority.group.students,.while.the.average.grades.of.White.and.Asian.students.remained.relatively.constant..The.report.suggests.that.in.the.past.few.years,.“female.students.have.been.more.likely.than.males.to.complete.some.advanced.science.coursework.”
Research.studies.show.that.academic.placement..in.secondary.school.influences.achievement.and.the..likelihood.of.high.school.graduation.for.students.of..different.socioeconomic.backgrounds.9.Standardized.test.scores.and.grades.in.English.and.mathematics.in.middle.school.have.both.been.shown.to.determine.track.placement.in.high.school..Researchers.also.have.found.that.student.placement.during.the.middle.school.years.is.directly.related.to.tracking.decisions.made.in.high.school..And.studies.have.shown.that.students’.“social.origins,”.such.as.soecioeconomic.status.and.race/ethnicity,.influence.their.track.placement.and.subsequent.academic.achievement.10.Therefore,.when..schools.exclude.students.with.certain.background.
Introduction
3.National.Commission.on.Excellence.in.Education,.A Nation at Risk: The Imperative for Educational Reform,.Washington,.D.C.,.April.1983.4.Clifford.Adelman,.Answers in the Tool Box: Academic Intensity, Attendance Patterns, and Bachelor’s Degree Attainment,.U.S..Department.of.Education,.Washington,.D.C.,.June.1999.5.Clifford.Adelman,.The Tool Box Revisited: Paths to Completion from High School Through College,.U.S..Department.of.Education,..Washington,.D.C.,.February.2006.6.National.Academy.of.Sciences,.Rising Above the Gathering Storm: Energizing and Employing America for a Brighter Economic Future,.Committee.on.Science,.Engineering,.and.Public.Policy,.2007.7.C..Shettle.et.al.,.The Nation’s Report Card: America’s High School Graduates,.U.S..Department.of.Education,.National.Center.for.Education.Statistics,.Washington,.D.C.,.2007..Midlevel.curriculum.is.defined.as.meeting.a.standard.curriculum.(at.least.four.credits.of.English.and.three.each.in.social.studies,.mathematics,.and.science).plus.completion.of.geometry.and.algebra.II;.at.least.two.courses.in.biology,.chemistry,.and.physics;.and.at.least.one.credit.of.a.foreign.language.8.High School Course Taking – Findings from The Condition of Education 2007,.National.Center.for.Education.Statistics,.Institute.of.Education.Sciences,.U.S..Department.of.Education,.NCES.2007-065..Report.retrieved.on.September.18,.2007.from.http://nces.ed.gov/pubs2007/2007065.pdf..9.Adam.Gamoran.and.Robert.D..Mare,.“Secondary.School.Tracking.and.Educational.Inequality:.Compensation,.Reinforcement,.or..Neutrality,”.American Journal of Sociology,.v94.n5,.pp.1146-83;.March.5,.1989.10.Maureen.T..Hallinan,.“School.Differences.in.Tracking.Effects.on.Achievement,”.Social Forces,.72.(3),.March.1994,.pp.799-820.
�
characteristics.from.academically.rigorous.course-work,.by.way.of.academic.placement.or.access.to.an.AP.course,.they.are.inadvertently.worsening.the.achievement.and.graduation.gaps.among.students.of.different.backgrounds.
So,.while.there.is.consensus.on.the.importance.of.a.rigorous.high.school.curriculum,.questions.remain.about.the.extent.to.which.all.students.have.access.to.a.strong.high.school.program.
TheAdvancedPlacementProgram
In.recognition.of.the.strong.evidence.that.an..academically.enriched.high.school.experience.contrib-utes.to.college.readiness.and.college.graduation,..several.programs.to.provide.advanced.curriculum.to.high.school.students.exist.today..For.example,.high.schools.and.two-.and.four-year.colleges.collaborate.in.dual.enrollment.courses,.and.the.International..Baccalaureate®.Programme.(IB).provides.university.preparation..This.report.will.focus.exclusively.on.the.largest.of.these.programs,.the.College.Board’s.Advanced.Placement.Program.(AP).11
The.AP.program.is.a.collaborative.effort.between.secondary.and.postsecondary.institutions.that.provides.students.opportunities.to.take.freshman-level.courses.while.still.in.high.school..These.courses.
are.designed.by.committees.of.college.faculty.and.experienced.AP.teachers.based.on.a.set.of.publicly.available.standards.with.an.end-of-course.assessment..Regular.surveys.and.research.efforts.are.designed.to.ensure.that.the.course.content.is.congruent.with.the.curriculum.and.the.best.practices.of.corresponding.college.courses.12.Apart.from.helping.to.create.the.challenging.course.content,.AP.teachers.participate.in.professional.development.workshops.intended.to.enhance.their.students’.learning.experiences..The.AP.exam.typically.includes.a.series.of.multiple-choice.questions.and.an.essay.section,.scored.electronically.and.by.human.readers,.respectively..Performance.on.the.assessment.may.imply.eligibility.to.receive.college.credit.and/or.placement.from.the.institution.of.the.student’s.choice..Students.are.graded.on.a.five-point.scale,.in.which.a.score.of.5.reflects.the.highest.level.of.mastery.of.the.AP.course.content..A.grade.of.3.on.an.AP.exam.often.qualifies.a.student.to.receive.course.credit.or.advanced.placement.from.participating.institutions,.though.the.decision.to.award.credit.varies.across.institutions.and.subjects.within.institutions.
Table.1.lists.the.34.AP.examinations.across.six.discipline.areas.available.in.2004.(the.basis.for.this.study)..Currently,.the.College.Board.develops.and.publishes.guidelines.for.37.courses.in.20.subject.areas.
11.Recent.figures.indicate.that.AP.exams.were.administered.in.over.15,000.U.S..high.schools.(http://www.collegeboard.com/prod_downloads/about/news_info/ap/2007/2007_ap-report-nation.pdf).while.IB’s.Diploma.Programme.is.offered.in.approximately.500.U.S..high.schools.(http://www.ibo.org/facts/schoolstats/progsbycountry.cfm)..“Overall,.approximately.813,000.high.school.students.took.college-level.courses.through.postsecondary.institutions,.either.within.or.outside.of.dual.enrollment.programs,.during.the.2002-03.12-month.academic.year...This.number.represents.about.5.percent.of.all.high.school.students.”.(http://nces.ed.gov/pubs2005/2005008.pdf).12.In.2005,.the.College.Board.announced.an.audit.of.AP.courses.involving.a.review.by.college.professors.of.individual.teachers’.syllabi.in.the.37.subject.areas.covered.in.AP.classes.
Discipline Area AP Exams
Arts Music Theory; Studio Art: 2-D Design, Studio Art: 3-D Design, Studio Art: Drawing
English English Language and Composition, English Literature and Composition
Foreign LanguagesFrench Language, French Literature, German Language, Latin Literature, Latin: Virgil, Spanish Language, Spanish Literature
Math Calculus AB, Calculus BC, Statistics
Science/Computer ScienceBiology, Chemistry, Computer Science A, Computer Science AB, Environmental Science, Physics B, Physics C – Electricity and Magnetism, Physics C – Mechanics
Social SciencesArt History, European History, Government and Politics: Comparative, Government and Politics: United States, Human Geography, Macroeconomics, Microeconomics, Psychology, United States History, World History
Table 1
AP Exams by Disciplinary Area, 2004
Source: The College Board.
�
APPerformanceandAcademicSuccess
While.not.all.research.has.been.clear.as.to.the.benefits.of.the.AP.program,.numerous.studies.have.explored.the.link.between.success.in.the.AP.program.and.later.success.in.higher.education..One.study.examined.the.relationship.between.AP.participation.and.performance.on.the.one.hand.and.college.graduation.rates.on.the.other..Like.Adelman’s.findings.described.earlier,.the.study.shows.that.students.who.take.AP.courses.and.earn.AP.grades.of.3.or.higher.are.more.likely.to.graduate.from.college.than.students.who.take.the.course.but.do.not.take.the.exam,.who.in.turn.are.more.likely.to.graduate.than.students.who.do.not.participate.in.an.AP.course.at.all.13.Another.study.found.that.the.percentage.of.students.in.a.high.school.with.at.least.one.student.who.scored.an.AP.grade.of.3.or.better.was.a.much.stronger.predictor.of.college.graduation.rates.than.was.the.percent.of.students.taking.AP.courses.but.not.passing.the.exams.14.Research.conducted.by.professors.at.the.University.of.Austin,.Texas,.and.the.College.Board.reported.that.students.who.earned.credit.for.their.AP.scores.tend.to.do.at.least.as.well.—.and.sometimes.better.—.than.their.peers.in.subsequent.college.courses..15.However,.other.researchers.claim.that.studies.showing.positive.effects.of.the.AP.program.—.specifically.its.high.predictive.validity.of.college.grades.and.retention.—.are.more.a.result.of.students’.non-AP.coursework.in.math.and.science.16
EffortstoBoostParticipation.
As.the.diversity.of.the.K-12.school.population.increases,.it.is.important.to.examine.the.distribution.of.student.access.to.the.most.rigorous.high.school.programs..This.is.especially.so.if.the.segments.of.the.population.that.are.growing.fastest.(namely,.“under-represented”.or.non-White.and.non-Asian.minorities).are.left.out.from.valuable.and.rigorous.coursework.17
Concerns.regarding.the.participation.and.performance.of.low-income.and.underrepresented.students.in.the.AP.program,18.and.in.advanced.coursework.in.general,.have.prompted.various.stakeholders.to.invest.in.initiatives.to.increase.participation.in.the.AP.program,.and.improve.performance.on.AP.exams..The.College.Board.has.worked.at.increasing.access.since.the.early.days.of.the.AP.program.19.The.most.popular,.and.probably.the.flagship.program.in.its.pool.of.access.initiatives,.is.the.AP.Test.Fee.Program,.in.which.students.meeting.the.“financial.need”.criterion.are.given.discounted.test.fees.
The.increase.in.the.AP.participation.of.economically.disadvantaged.and.minority.students.over.the.past..decade.may.also.be.attributed.to.the.Advanced.Placement.Incentive.Program.(APIP).and.the.Advanced.Placement.Test.Fee.Grant.program.sanctioned.by.the.U.S..Department.of.Education..The.recipients.of.these.monetary.awards.(national,.state,.or.local.education.agencies).must.meet.eligibility.requirements.of.serving.students.in.schools.where.at.least.40.percent.of.the.student.body.is.low.income.
States.and.local.districts.offer.their.own.AP.program.strategies:.test-fee.reduction.policies;.start-up.grants;.teacher.professional.development;.and.incentives.for.student.and.teacher.performance..Many.of.the.policies.are.targeted.directly.at.specific.disadvantaged.groups,.often.low-SES.and/or.underrepresented.minority.students.20..
TheGrowthintheAPProgramandEquityofAccess
We.now.explore.summary.national.data.that..report.the.substantial.growth.in.the.AP.program.across.the.United.States,.along.with.data.on.participation.in.the.AP.program.among.students.of.different.racial/ethnic.groups..
13.Chris.Dougherty,.Lynn.Mellor,.and.Shuling.Jian,.Orange Juice or Orange Drink? Ensuring That “Advanced Courses” Live Up to Their Labels,.NCEA.Policy.Brief.No..1,.Austin,.TX:.National.Center.for.Educational.Accountability,.2006.14.Saul.Geiser.and.Veronica.Santilices,.The Role of Advanced Placement and Honors Courses in College Admissions, Paper.CSHE-4-04,..Center.for.Studies.in.Higher.Education,.2004..Retrieved.12/20/2006.from.http://repositories.cdlib.org/cshe/CSHE-4-04/.15.Barbara.G..Dodd.et.al.,.An Investigation of Validity of AP Grades of 3 and a Comparison of AP and Non-AP Student Groups,.College.Board.Research.Report.No..2002-9,.New.York:.The.College.Board,.2002..For.more.AP.research.published.by.the.College.Board.see:.http://apcentral.collegeboard.com/apc/public/colleges/research/index.html.16.Kristin.Klopfenstein.and.M..Kathleen.Thomas,.The Link Between College Success, Advanced Placement Experience and College Success,.unpublished.paper,.retrieved.June.21,.2007.from.http://www.utdallas.edu/research/tsp/pdfpapers/newpaper1b.pdf.17.U.S..Census.Bureau,.U.S. Interim Projections by Age, Sex, Race, and Hispanic Origin,.http://www.census.gov/ipc/www/usinterimproj/.18.Sam.Dillon,.“Advanced.Placement.Tests.Are.Leaving.Some.Behind,”.The New York Times,.February.7,.2007..Retrieved.on.February.7,.2007.from.http://www.nytimes.com/2007/02/07/education/07ap.html.19.For.more.information.on.College.Board.AP.Equity.programs.see:.http://apcentral.collegeboard.com/apc/public/program/initiatives/2200html.20.The.Education.Commission.of.the.States.provides.an.exhaustive.list.of.current.policies.across.the.50-states.designed.to.increase.AP..participation.and.performance..http://www.ecs.org/ecsmain.asp?page=/html/statesTerritories/state_map.htm.
�
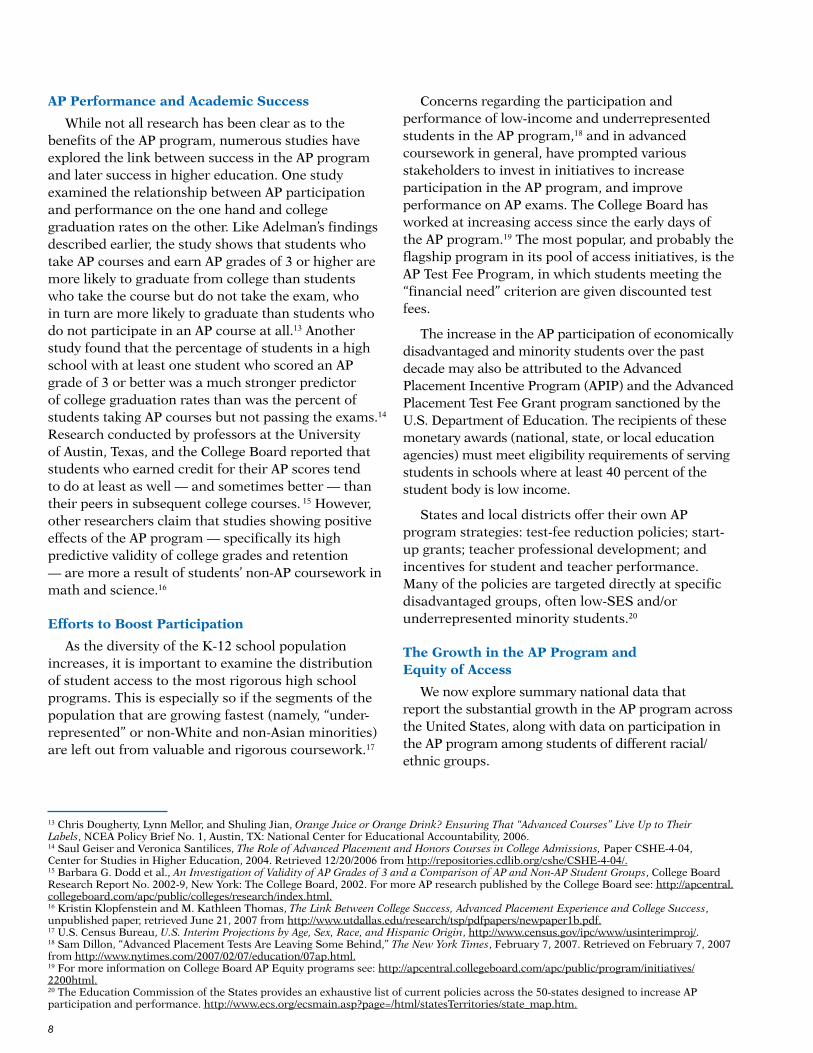
Figure.1.shows.the.rise.over.the.past.several.years.not.only.in.the.number.of.AP.exams.taken.in.U.S..public.schools,.but.also.the.growth.in.the.number.of.examinees..Between.1997.and.2006,.the.number.of..examinees.increased.by.142.percent.and.the.number.of.exams.taken.increased.by.165.percent..The..divergence.between.the.lines.in.Figure.1.reflects.both.an.increase.in.the.number.of.examinees.and.in.the.number.who.take.more.than.one.AP.exam.
Figure.2.compares.the.relative.racial/ethnic.proportional.composition.of.the.entire.cohort.of.graduating.seniors.in.U.S..public.high.schools.with.the.proportional.composition.of.the.participating.AP.population.for.that.same.group..The.figure.also.shows.the.gap,.expressed.as.the.difference,.in.percentage.points,.between.the.proportions.of.the.entire.graduating.population.and.the.AP.examinee.population..Of.course,.the.fact.that.these.groups.also.have.different.high.school.graduation.rates.means.that.these.differences.really.represent.a.lower-bound.estimate.of.the.gap.in.AP.exam.taking..
Recent.data.show.that.African.American,.White,.and.American.Indian.or.Alaska.Native.students.are.underrepresented.in.the.AP.program..For.example,.while.African.American.high.school.seniors.comprised.almost.14.percent.of.all.public.high.school.seniors,.they.comprise.only.about.7.percent.of.the.AP.examinee.population..Hispanic.or.Latino.students.are.evenly.represented.among.both.populations,.at.14.percent..The.only.group.that.is.overrepresented.in.the.AP.program.relative.to.their.share.of.the.high.school.senior.population.consists.of.individuals.who.categorize.themselves.as.Asian.or.Pacific.Islander..This.highly.diverse.group.surpassed.its.representation.in.the.high.school.senior.population.by.5.percentage.points.
Figure 1
Trends in the Number of AP Examinations and Examinees, U.S. Public Schools
Source: College Board AP Summary Reports.
Figure 2
Percentage of AP Examinees Compared to Graduating Senior Population, U.S. Public Schools, 2006
Source: College Board AP Summary Reports.
10
This.report.provides.a.national.picture.of.the.AP.program.as.it.exists.in.the.nation’s.high.schools..We.present.the.report.against.the.backdrop.of.a.national.focus.on.curricular.intensity,.continued.expansion.of.the.AP.program.over.the.last.several.years,.and.substantial.funding.for.AP.program.expansion.at.multiple.levels.
Historically,.extensive.national.and.state.data.have.been.available.from.the.College.Board.on.student.participation.in.the.AP.program..The.College.Board.provides.AP.grade.distributions.for.each.examination.for.racial/ethnic.groups.and.for.males.and.females..These.data,.however,.are.not.linked.to.the.total.universe.of.high.schools.that.exist.in.the.United.States,.since.the.data.only.pertain.to.those.students.who.actually.participate.in.the.AP.program.by.taking.an.AP.exam..We.gain.a.clearer.understanding.of.the.characteristics.of.students.who.take.AP.exams.when.we.also.take.into.account.the.high.schools.they.attend..By.linking.data.on.students.from.the.AP.file.to.data.on.their.high.schools.obtained.from.the.U.S..Department.of.Education,.we.are.able,.for.the.first.time,.to.answer.three.essential.questions.for.the.2003-04.school.year:
1.WhatistheavailabilityoftheAPprograminthenation’spublichighschools?
Definition: The AP program is considered to be available in a public high school if at least one student in that school took an AP examination.
Typically.reported.by.the.College.Board.is.the.number.or.percentage.of.schools.offering.an.AP.exam..Given.that.universe,.this.report.examines.how.AP..offerings.differ.among.public.schools.that.share..important.characteristics..This.report.also.examines.the.intensity21.of.AP.offerings.in.these.schools.
2.Whatproportionofthenation’spublichighschoolstudentsparticipateintheAPprogram?..
Definition: A student is considered to have participated in the AP program if he or she took any one of the 34 AP examinations offered by the College Board in 2003-2004.
Typically.reported.are.overall.counts.of.students.disaggregated.by.subgroups..This.report.looks..at.participation.patterns.in.public.schools.with..different.socioeconomic,.racial/ethnic,.and.geographic.characteristics.
3.WhatisthelevelofstudentperformanceonAPexamsamongthenation’spublichighschoolstudents?
Definition: Student performance is defined by AP grades. Students may be eligible for advanced placement or college credit if they earned a grade of 3 or higher on any AP exam.(AP exams are graded from a low of 1 to a high of 5).
Typically.reported.are.overall.AP.grade.distributions.by.subject.and.student.subgroups..This.report.examines..AP.performance.for.public.schools.with.different.socio-economic,.racial/ethnic,.and.geographic.characteristics.
Examining.data.on.average.rates.of.participation.in.and.performance.on.AP.exams.can.mask.important.differences.in.the.availability.of.educational.opportunity.to.students.attending.different.types.of.schools..For.all.three.of.these.questions,.we.are.interested.in.what.the.data.reveal.for.different.groups.of.high.schools.and.for.different.groups.of.students.within.those.high.schools..Obviously,.U.S..public.high.schools.differ.on.many.dimensions,.including.size,.student/teacher.ratios,.socioeconomic.status,.and.geographic.locale..For.this.report.we.sought.to.categorize.this.large.number.of.schools.into.smaller,.more.meaningful.groups.based.on.the.extent.to.which.particular.features.were.common.across.the.schools..This.report.uses.a.clustering.methodology,.described.in.the.following.section,.to.group.the.nation’s.high.schools.on.the.basis.of.important.characteristics..
In.addition,.the.analyses.disaggregate.the.data.for.males.and.females,.for.racial/ethnic.groups.of.stu-dents,.and.for.students.eligible.and.not.eligible.for.free.and.reduced-price.lunch.(a.proxy.for.socioeconomic.status.or.low.income)..Thus,.the.data.provided.in.this.report.allow.a.richer.and.more.detailed.understanding.of.how.different.types.of.public.schools.and.students.differ.in.their.access.to.the.AP.program.
Research Questions
21.For.the.purpose.of.this.report,.schools.offering.at.least.one.AP.exam.were.defined.as.“Low.AP”.schools.while.those.offering.at.least.one.AP.mathematics.course,.at.least.one.AP.science.course,.and.at.least.one.AP.English.course.were.defined.as.“High.AP”.schools.
11
ClusterAnalysis
To.answer.the.three.research.questions,.we.used.data.from.the.U.S..Department.of.Education.to..classify.the.nation’s.schools.into.a.limited.but..meaningful.set.of.categories,.each.category.sharing.important.characteristics..We.then.added.data.on.AP.participation.and.performance.for.2004.that.was.supplied.by.the.College.Board..This.section.provides.additional.details.on.the.cluster.analysis.and.on.the.merging.of.the.databases.
For.the.cluster.analysis,.we.used.the.U.S..Department.of.Education’s.Common.Core.of.Data,.2003-2004.Public.Elementary.and.Secondary.School.Universe.Survey.Data.(CCD)..CCD.is.a.comprehensive,.annual,.national.statistical.database.of.all.public.elementary.and.secondary.schools.and.school.districts.and.contains.data.that.are.designed.to.be.comparable.across.all.states..The.annual.survey.provides.general.
information.about.each.responding.school.(name,..location,.type.of.school,.etc.),.information.about..students.(demographic.breakdowns,.grade.levels,.etc.),.as.well.as.number.of.teachers.per.school..This.data.set.yielded.22,037.public.high.schools.located.in.the.50.states.and.Washington,.D.C..in.2004.
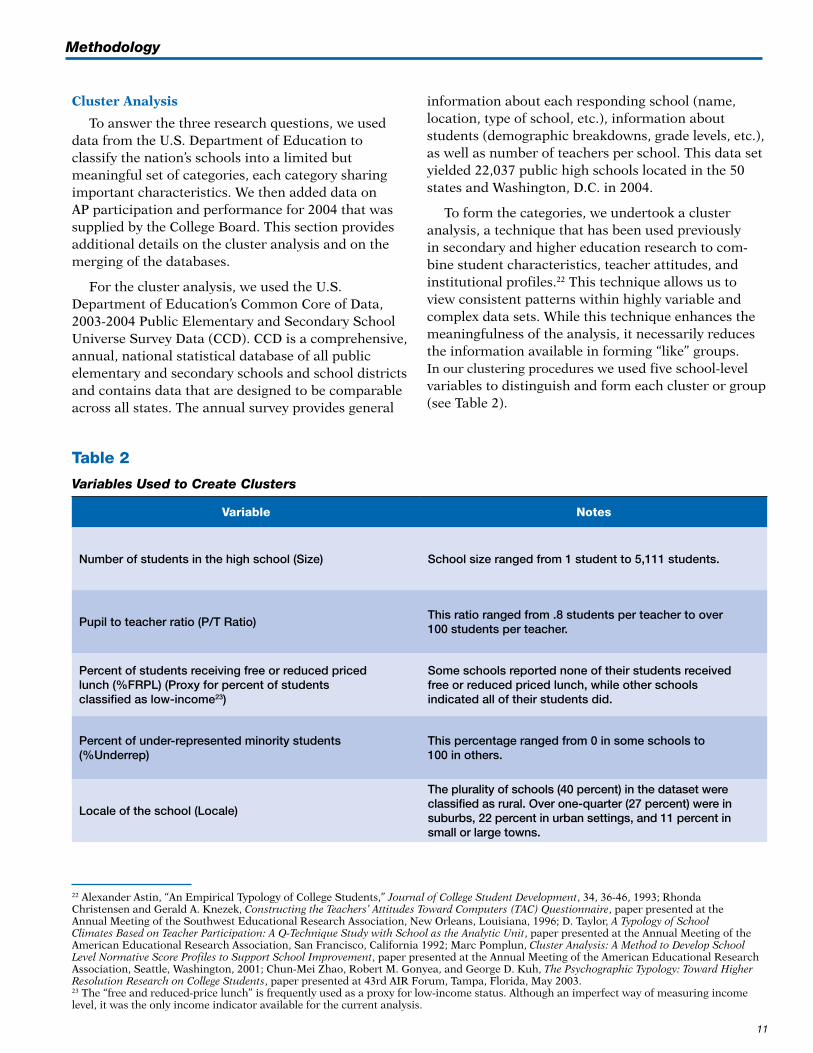
To.form.the.categories,.we.undertook.a.cluster.analysis,.a.technique.that.has.been.used.previously.in.secondary.and.higher.education.research.to.com-bine.student.characteristics,.teacher.attitudes,.and.institutional.profiles.22.This.technique.allows.us.to.view.consistent.patterns.within.highly.variable.and.complex.data.sets..While.this.technique.enhances.the.meaningfulness.of.the.analysis,.it.necessarily.reduces.the.information.available.in.forming.“like”.groups..In.our.clustering.procedures.we.used.five.school-level.variables.to.distinguish.and.form.each.cluster.or.group.(see.Table.2)..
22.Alexander.Astin,.“An.Empirical.Typology.of.College.Students,”.Journal of College Student Development,.34,.36-46,.1993;.Rhonda..Christensen.and.Gerald.A..Knezek,.Constructing the Teachers’ Attitudes Toward Computers (TAC) Questionnaire,.paper.presented.at.the..Annual.Meeting.of.the.Southwest.Educational.Research.Association,.New.Orleans,.Louisiana,.1996;.D..Taylor,.A Typology of School Climates Based on Teacher Participation: A Q-Technique Study with School as the Analytic Unit,.paper.presented.at.the.Annual.Meeting.of.the.American.Educational.Research.Association,.San.Francisco,.California.1992;.Marc.Pomplun,.Cluster Analysis: A Method to Develop School Level Normative Score Profiles to Support School Improvement,.paper.presented.at.the.Annual.Meeting.of.the.American.Educational.Research.Association,.Seattle,.Washington,.2001;.Chun-Mei.Zhao,.Robert.M..Gonyea,.and.George.D..Kuh,.The Psychographic Typology: Toward Higher Resolution Research on College Students,.paper.presented.at.43rd.AIR.Forum,.Tampa,.Florida,.May.2003.23.The.“free.and.reduced-price.lunch”.is.frequently.used.as.a.proxy.for.low-income.status..Although.an.imperfect.way.of.measuring.income.level,.it.was.the.only.income.indicator.available.for.the.current.analysis.
Methodology
Variable Notes
Number of students in the high school (Size) School size ranged from 1 student to 5,111 students.
Pupil to teacher ratio (P/T Ratio)This ratio ranged from .8 students per teacher to over 100 students per teacher.
Percent of students receiving free or reduced priced lunch (%FRPL) (Proxy for percent of students classified as low-income23)
Some schools reported none of their students received free or reduced priced lunch, while other schools indicated all of their students did.
Percent of under-represented minority students (%Underrep)
This percentage ranged from 0 in some schools to 100 in others.
Locale of the school (Locale)
The plurality of schools (40 percent) in the dataset were classified as rural. Over one-quarter (27 percent) were in suburbs, 22 percent in urban settings, and 11 percent in small or large towns.
Table 2
Variables Used to Create Clusters
1�
The.cluster.analysis.revealed.six.meaningful.clusters..These.six.clusters.accounted.for.about.half.of.the.variation.(variance.=..54).in.the.five.school-level.variables.among.the.22,037.public.schools..(See..Appendix.A.for.more.information.about.cluster.analysis.methodology.and.resulting.statistics.).Four.of.the.six.clusters.accounted.for.98.percent.of.the.high.school.student.population;.for.clarity,.we.include.only.these.four.clusters.throughout.the.rest.of.this.report.
ClusterSummaries
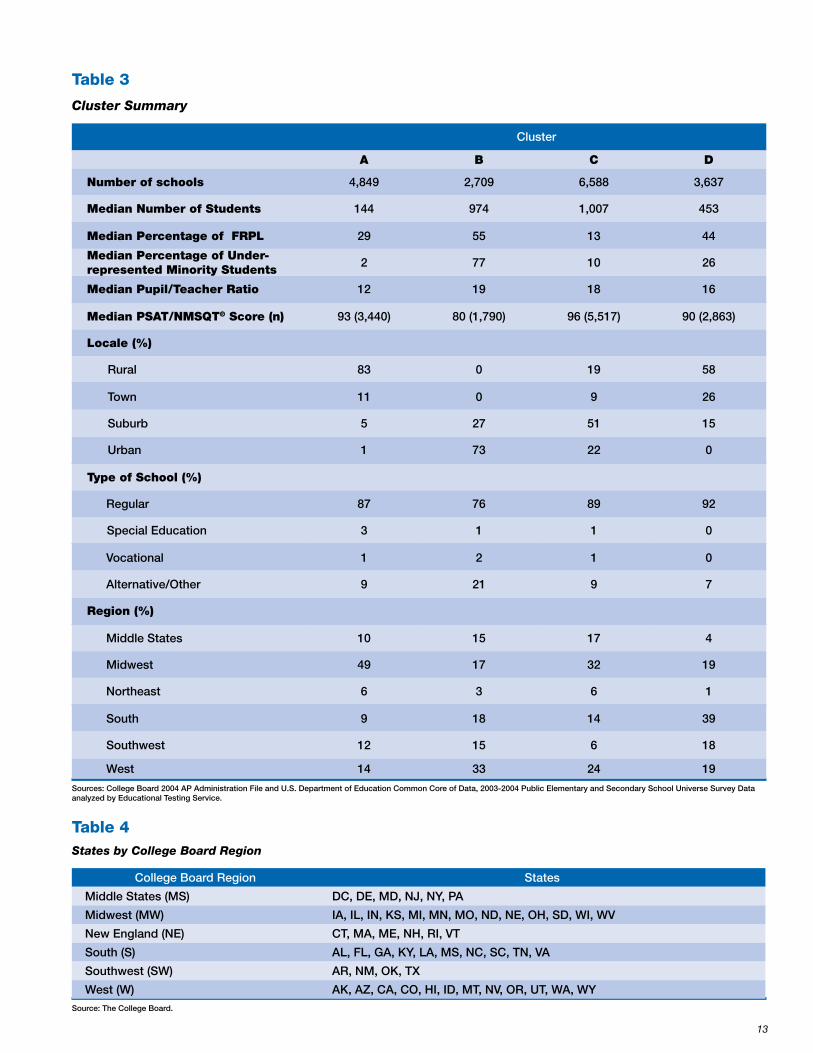
Table.3.provides.descriptive.information.on.all.of.the.variables.used.in.the.clustering..In.addition,.we.include.median.PSAT/NMSQT®.scores.from.the.schools.in.the.particular.category.for.which.such.scores.are.available.24.This.information.is.included.as.a.rough.proxy.for.overall.school.academic.achievement.level..The.number.of.schools.with.PSAT/NMSQT.scores.is.noted.in.the.table,.indicating.that.a.sizable.number.of.schools.in.the.analysis.do.not.have.PSAT/NMSQT.scores.25.The.table.also.indicates.the.school.type,.which.is.broken.down.into.four.categories:.regular,.special.education,.vocational,.and.alternative/other.(see.Table.B1.for.definitions)..Also.in.Table.3,.we.report.cluster.distributions.by.the.College.Board.geographic.regions.(see.Table.4).
Cluster A:.Schools.in.Cluster.A.enroll.8.percent.of.all.U.S..public.high.school.students..Typically,.the.schools.are.small,.with.small.class.sizes,.very.few..underrepresented.minority.students,.while.approxi-mately.one-third.of.the.students.are.from.low-income.backgrounds..Median.PSAT/NMSQT.scores.are..moderate..These.schools.are.predominantly.rural,.with.nearly.half.in.the.Midwestern.United.States.
Cluster B:.Cluster.B.enrolls.22.percent.of.the.nation’s.public.high.school.students..These.schools.tend.to.be.very.large,.with.large.class.sizes,.many.low-income.students,.and.a.large.underrepresented.minority.population..Their.median.PSAT/NMSQT.
scores.are.the.lowest.among.the.four.clusters..Most.Cluster.B.schools.are.in.urban.areas.throughout.the.nation..One-fifth.of.the.schools.are.categorized.as.“alternative/other.”
Cluster C:.More.than.half.(53.percent).of.U.S..public.high.school.students.are.enrolled.in.Cluster.C.schools..These.schools.tend.to.be.very.large,.with.relatively.
low.proportions.of.low-income.and.underrepresented.minority.students..Schools.in.this.category.tend.to.have.the.highest.median.PSAT/NMSQT.scores..About.half.of.the.schools.are.located.in.suburban.areas.across.the.country..
Cluster D:.Schools.in.Cluster.D.enroll.15.percent..of.U.S..public.high.school.students..Typically.these..predominantly.rural,.medium-sized.schools.have.about.one-quarter.of.their.student.body.comprising.underrepresented.minority.students,.almost.half.of.whom.are.from.low-income.backgrounds..Their.median.PSAT/NMSQT.scores.are.moderate..These.schools.are.in.areas.of.the.country.where.large.numbers.of.underrepresented.minorities.live.outside.of.urban.areas.
MergingCCDandAPData
Since.the.purpose.of.this.report.is.to.examine.AP.participation.and.performance.data.within.the.context.of.important.school-level.characteristics,.we.needed.to.merge.the.CCD.data.with.AP.data..To.provide.the.AP.data,.we.used.the.College.Board’s.2004.AP.administration.file.that.includes.all examinees.in.grades.nine.to.12..This.file.also.lists.individual.student.performance.by.exam,.student.characteristics.(race,.sex,.exam-fee.reduction,.etc.).as.well.as.the.school.the.student.attended..In.2004,.11,130.U.S..public.high.schools.were.identified.as.administering.AP.exams.to.877,848.students.
Because.the.2004.AP.administration.file.identifies.the.high.school.that.each.AP.student.attended,.we.matched.that.file.with.the.2004.CCD.file,.creating.a.new.data.base.containing,.for.each.school,.both.AP.data.and.data.on.school.characteristics..
While.this.merged.database.allows.us.to.examine.AP.participation.within.the.context.of.school.characteristics,.it.underestimates.AP.participation.to.the.extent.that.some.students.who.are.not.identified.as.AP.participants.in.their.high.schools.may.ultimately..participate.in.the.program.—.for.example,.a.ninth-grader.in.2004.who.participates.as.a.12th-grader.in.2007..One.alternative.would.be.to.include.data.only..for.12th-graders.in.2004..But.because.we.know.that.fewer.than.half.of.all.AP.examinees.in.2004.were..12th-graders,.this.also.would.result.in.an.underestimate..In.addition,.the.College.Board,.in.
24.The.PSAT/NMSQT.exam,.owned.by.the.College.Board.and.the.National.Merit.Scholarship.Corporation,.is.designed.to.measure.students’.critical.reading.and.math.problem-solving.skills..Each.of.the.sections.range.in.score.from.20.to.80.points..It.is.reported.that.the.average.score.for.juniors.is.around.49.on.each.section.(http://www.collegeboard.com/student/testing/psat/scores.html).25.PSAT/NMSQT.scores.were.not.one.of.the.variables.used.in.creating.the.clusters..We.included.the.information.only.to.provide.a.more.detailed.picture.of.the.clusters.
1�
Table 3
Cluster Summary
Cluster
A B C D
Number of schools 4,849 2,709 6,588 3,637
Median Number of Students 144 974 1,007 453
Median Percentage of FRPL 29 55 13 44
Median Percentage of Under- represented Minority Students
2 77 10 26
Median Pupil/Teacher Ratio 12 19 18 16
Median PSAT/NMSQT® Score (n) 93 (3,440) 80 (1,790) 96 (5,517) 90 (2,863)
Locale (%)
Rural 83 0 19 58
Town 11 0 9 26
Suburb 5 27 51 15
Urban 1 73 22 0
Type of School (%)
Regular 87 76 89 92
Special Education 3 1 1 0
Vocational 1 2 1 0
Alternative/Other 9 21 9 7
Region (%)
Middle States 10 15 17 4
Midwest 49 17 32 19
Northeast 6 3 6 1
South 9 18 14 39
Southwest 12 15 6 18
West 14 33 24 19
Sources: College Board 2004 AP Administration File and U.S. Department of Education Common Core of Data, 2003-2004 Public Elementary and Secondary School Universe Survey Data analyzed by Educational Testing Service.
Table 4States by College Board Region
College Board Region States
Middle States (MS) DC, DE, MD, NJ, NY, PA
Midwest (MW) IA, IL, IN, KS, MI, MN, MO, ND, NE, OH, SD, WI, WV
New England (NE) CT, MA, ME, NH, RI, VT
South (S) AL, FL, GA, KY, LA, MS, NC, SC, TN, VA
Southwest (SW) AR, NM, OK, TX
West (W) AK, AZ, CA, CO, HI, ID, MT, NV, OR, UT, WA, WYSource: The College Board.
1�
its.annual.Advanced Placement Report to the Nation,.reports.on.the.accumulated.AP.experiences.of.graduating.high.school.seniors.over.their.academic.careers..These.data.provide.an.important.summary.of.AP.participation.at.the.national.and.state.levels..However,.since.the.focus.of.this.study.is.relative.AP.participation.within.the.context.of.important.school.characteristics,.we.chose.the.AP.2004.Administration.File.as.the.best.match.for.the.CCD.file.because.both.files.provide.a.snapshot.of.public.high.school.students.in.the.same.year..
After.we.merged.the.databases,.we.conducted.a.series.of.descriptive.analyses.that.first.related.school.clusters.to.the.outcome.measures.of.AP.availability,.participation,.and.performance..We.also.analyzed.participation.and.performance.of.students.with.different.characteristics.within.and.across.school.clusters..
1�
26.Adelman,.2006;.National.Academy.of.Sciences,.2007.27.Often,.the.“Low.AP”.schools.administered.exams.in.more.than.one.AP.course..The.median.number.of.courses.offered.across.the.clusters.for.“Low.AP”.schools.ranged.from.two.to.three.courses,.while.the.“High.AP”.schools’.median.number.of.courses.ranged.from.five.to.12,.depending.on.the.cluster.
The.first.question.we.address.is.the.availability.of.the.AP.program.at.the.school.level..We.identify.a.high.school.as.“offering”.the.AP.program.if.at.least.one.student.in.the.school.took.an.AP.examination,.regard-less.of.the.subject..However,.schools.can.differ.in.their.intensity.of.AP.course.offerings.—.from.one.or.two.AP.exams.in.one.discipline.area,.to.offerings.that.include.a.significant.portion.of.courses.from.each.disciplinary.area..Several.reports.have.discussed.the.importance.of.offering.a.portfolio.of.courses..It.is.often.recommended.that.courses.be.available.in.English-language.arts,.mathematics,.and.science/computer.science.26.There-fore,.our.analyses.separated.public.schools.that.offer.AP.courses.into.“High.AP”.and.“Low.AP”.schools..We.identified.a.“High.AP”.school.as.one.administering.at.least.one.AP.English.exam,.at.least.one.AP.math.exam,.and.one.of.the.AP.Sciences/Computer.Sciences.exams..Those.that.failed.to.meet.the.preceding.criteria.but.that.administered.at.least.one.AP.exam.in.2004.were.classified.as.“Low.AP.”27.It.is.important.to.understand.that.our.definition.of.AP.availability.refers.only.to.the.presence.of.AP.in.the.school,.as.evidenced.by.at.least.one.AP.exam..This.does.not.imply,.however,.that.the.courses.are,.in.practice,.available.to.all.students.
Within.clusters,.the.main.difference.between.“High.AP”.and.“Low.AP”.schools.is.the.size.of.the.student..population;.the.former.are.typically.1.6.to.2.0.times.larger.than.the.latter..The.other.characteristics.upon.which.the.clusters.were.built.(percent.of.low-income.students,.percent.of.underrepresented.minority..students,.etc.).do.not.tend.to.vary.within.cluster.to.a.significant.degree.across.AP.intensity.
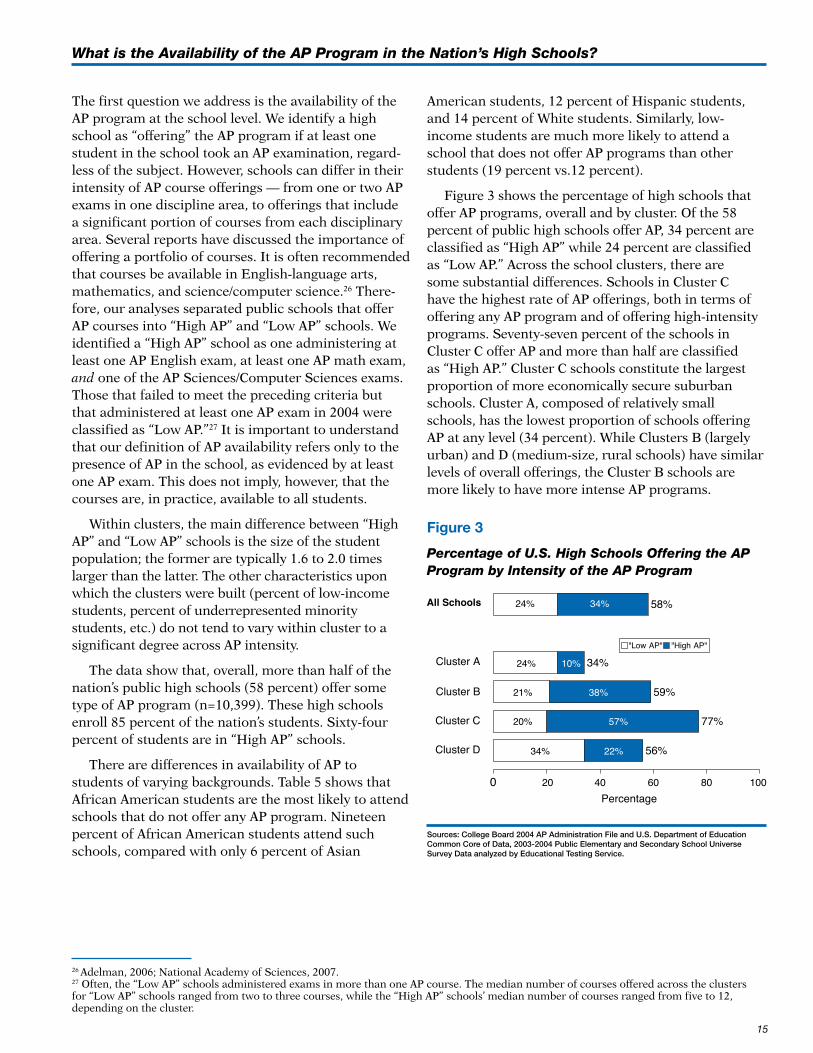
The.data.show.that,.overall,.more.than.half.of.the.nation’s.public.high.schools.(58.percent).offer.some.type.of.AP.program.(n=10,399)..These.high.schools.enroll.85.percent.of.the.nation’s.students..Sixty-four.percent.of.students.are.in.“High.AP”.schools..
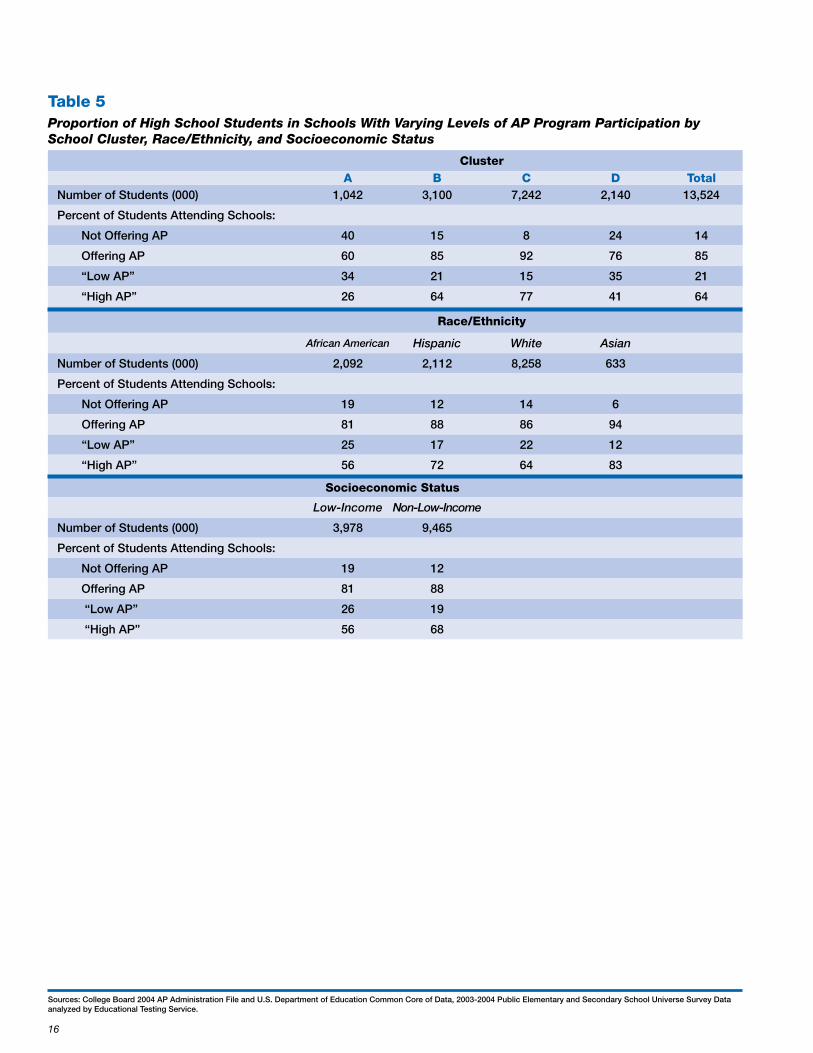
There.are.differences.in.availability.of.AP.to.students.of.varying.backgrounds..Table.5.shows.that.African.American.students.are.the.most.likely.to.attend.schools.that.do.not.offer.any.AP.program..Nineteen.percent.of.African.American.students.attend.such.schools,.compared.with.only.6.percent.of.Asian......
American.students,.12.percent.of.Hispanic.students,.and.14.percent.of.White.students..Similarly,.low-.income.students.are.much.more.likely.to.attend.a.school.that.does.not.offer.AP.programs.than.other.students.(19.percent.vs.12.percent).
Figure.3.shows.the.percentage.of.high.schools.that.offer.AP.programs,.overall.and.by.cluster..Of.the.58.percent.of.public.high.schools.offer.AP,.34.percent.are.classified.as.“High.AP”.while.24.percent.are.classified.as.“Low.AP.”.Across.the.school.clusters,.there.are.some.substantial.differences..Schools.in.Cluster.C.have.the.highest.rate.of.AP.offerings,.both.in.terms.of.offering.any.AP.program.and.of.offering.high-intensity.programs..Seventy-seven.percent.of.the.schools.in.Cluster.C.offer.AP.and.more.than.half.are.classified.as.“High.AP.”.Cluster.C.schools.constitute.the.largest.proportion.of.more.economically.secure.suburban.schools..Cluster.A,.composed.of.relatively.small.schools,.has.the.lowest.proportion.of.schools.offering.AP.at.any.level.(34.percent)..While.Clusters.B.(largely.urban).and.D.(medium-size,.rural.schools).have.similar.levels.of.overall.offerings,.the.Cluster.B.schools.are.more.likely.to.have.more.intense.AP.programs.
Figure 3
Percentage of U.S. High Schools Offering the AP Program by Intensity of the AP Program
Sources: College Board 2004 AP Administration File and U.S. Department of Education Common Core of Data, 2003-2004 Public Elementary and Secondary School Universe Survey Data analyzed by Educational Testing Service.
What is the Availability of the AP Program in the Nation’s High Schools?
1�
Cluster A B C D Total
Number of Students (000) 1,042 3,100 7,242 2,140 13,524
Percent of Students Attending Schools:
Not Offering AP 40 15 8 24 14
Offering AP 60 85 92 76 85
“Low AP” 34 21 15 35 21
“High AP” 26 64 77 41 64
Race/Ethnicity
African American Hispanic White Asian
Number of Students (000) 2,092 2,112 8,258 633
Percent of Students Attending Schools:
Not Offering AP 19 12 14 6
Offering AP 81 88 86 94
“Low AP” 25 17 22 12
“High AP” 56 72 64 83
Socioeconomic Status
Low-Income Non-Low-Income
Number of Students (000) 3,978 9,465
Percent of Students Attending Schools:
Not Offering AP 19 12
Offering AP 81 88
“Low AP” 26 19
“High AP” 56 68
Table 5 Proportion of High School Students in Schools With Varying Levels of AP Program Participation by School Cluster, Race/Ethnicity, and Socioeconomic Status
Sources: College Board 2004 AP Administration File and U.S. Department of Education Common Core of Data, 2003-2004 Public Elementary and Secondary School Universe Survey Data analyzed by Educational Testing Service.
1�
28.In.measuring.student.participation.in.AP,.median.percentages.are.reported..The.median.is.a.measure.of.central.tendency.defined.as.the.value.in.a.distribution.that.occupies.the.middle.position.in.a.rank.order.of.values,.separating.the.top.half.and.the.bottom.half.of.the.distri-bution..The.median.was.chosen.because.the.distributions.of.AP.participation.were.skewed..The.5.percent.statistic.reported.here.means.that.half.of.public.high.schools.offering.AP.have.5.percent.or.fewer.of.the.students.taking.an.AP.exam,.while.the.other.half.of.public.high.schools.offering.AP.have.5.percent.of.more.of.the.students.taking.an.AP.exam.
We.previously.described.the.availability.of.the.AP.program.across.public.high.schools..The.fact.that.students.attend.schools.that.offer.the.AP.program.does.not,.however,.mean.that.students.in.these.schools.participate.equally.in.these.courses..This.section.of.the.report.examines.participation.of.students.within.schools..For.the.purpose.of.the.study,.a.student.is.con-sidered.to.have.participated.in.the.AP.program.if.they.took.any.AP.exam,.regardless.of.the.grade.earned.on.the.AP.exam.taken..
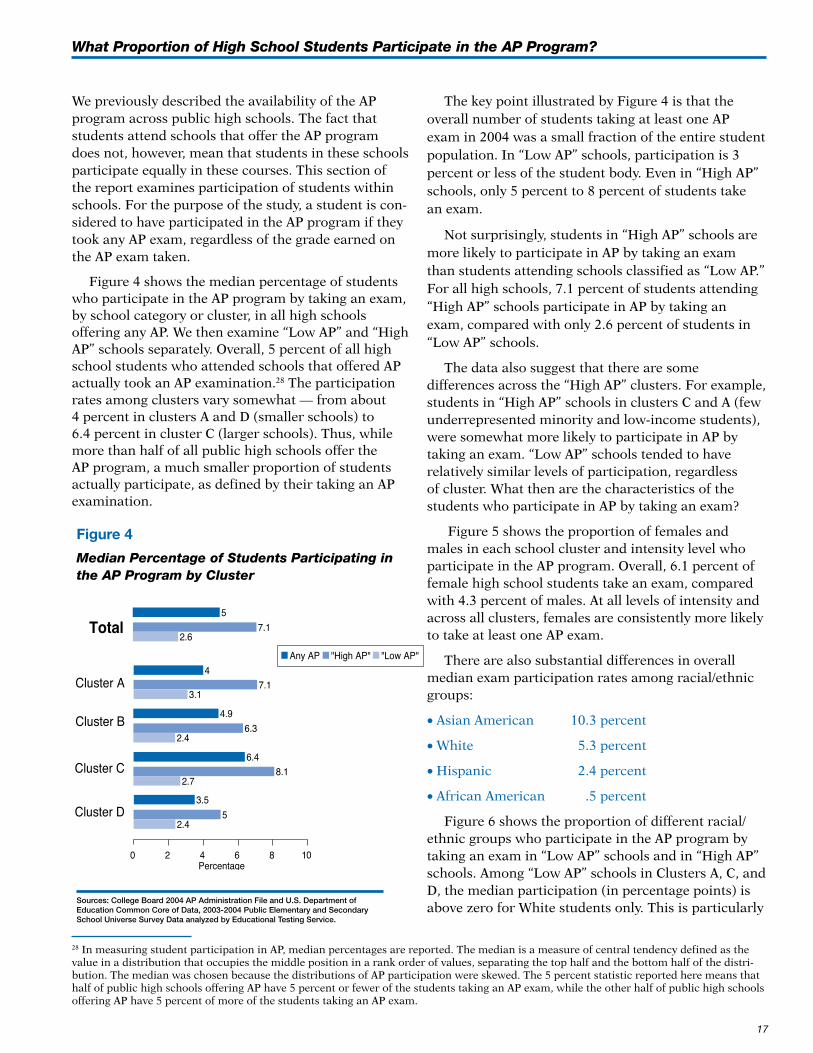
Figure.4.shows.the.median.percentage.of.students.who.participate.in.the.AP.program.by.taking.an.exam,.by.school.category.or.cluster,.in.all.high.schools..offering.any.AP..We.then.examine.“Low.AP”.and.“High.AP”.schools.separately..Overall,.5.percent.of.all.high.school.students.who.attended.schools.that.offered.AP.actually.took.an.AP.examination.28.The.participation.rates.among.clusters.vary.somewhat.—.from.about..4.percent.in.clusters.A.and.D.(smaller.schools).to.6.4.percent.in.cluster.C.(larger.schools)..Thus,.while.more.than.half.of.all.public.high.schools.offer.the.AP.program,.a.much.smaller.proportion.of.students.actually.participate,.as.defined.by.their.taking.an.AP.examination.
The.key.point.illustrated.by.Figure.4.is.that.the.overall.number.of.students.taking.at.least.one.AP.exam.in.2004.was.a.small.fraction.of.the.entire.student.population..In.“Low.AP”.schools,.participation.is.3.percent.or.less.of.the.student.body..Even.in.“High.AP”.schools,.only.5.percent.to.8.percent.of.students.take..an.exam..
Not.surprisingly,.students.in.“High.AP”.schools.are.more.likely.to.participate.in.AP.by.taking.an.exam.than.students.attending.schools.classified.as.“Low.AP.”.For.all.high.schools,.7.1.percent.of.students.attending.“High.AP”.schools.participate.in.AP.by.taking.an.exam,.compared.with.only.2.6.percent.of.students.in.“Low.AP”.schools..
The.data.also.suggest.that.there.are.some..differences.across.the.“High.AP”.clusters..For.example,.students.in.“High.AP”.schools.in.clusters.C.and.A.(few.underrepresented.minority.and.low-income.students),.were.somewhat.more.likely.to.participate.in.AP.by..taking.an.exam..“Low.AP”.schools.tended.to.have..relatively.similar.levels.of.participation,.regardless..of.cluster..What.then.are.the.characteristics.of.the..students.who.participate.in.AP.by.taking.an.exam?..
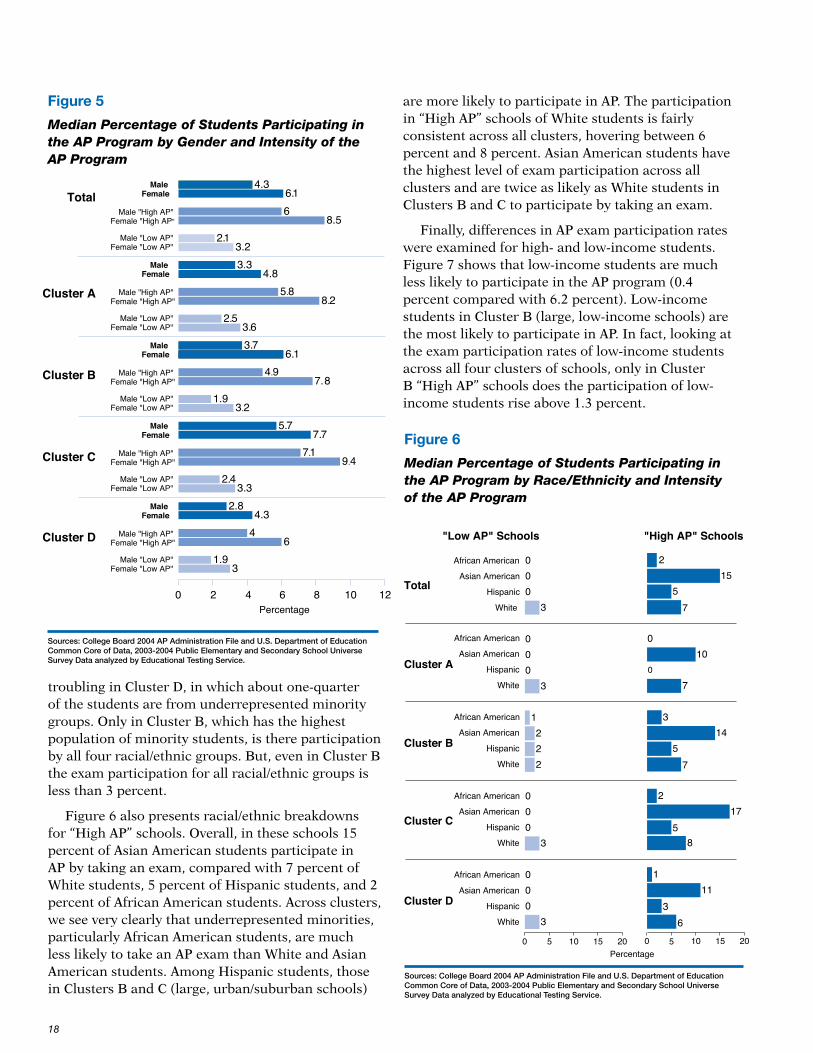
.Figure.5.shows.the.proportion.of.females.and.males.in.each.school.cluster.and.intensity.level.who.participate.in.the.AP.program..Overall,.6.1.percent.of.female.high.school.students.take.an.exam,.compared.with.4.3.percent.of.males..At.all.levels.of.intensity.and.across.all.clusters,.females.are.consistently.more.likely.to.take.at.least.one.AP.exam..
There.are.also.substantial.differences.in.overall..median.exam.participation.rates.among.racial/ethnic.groups:
• Asian.American. 10.3.percent
• White.. . ..5.3.percent
• Hispanic. . ..2.4.percent
• African.American. .....5.percent
Figure.6.shows.the.proportion.of.different.racial/ethnic.groups.who.participate.in.the.AP.program.by.taking.an.exam.in.“Low.AP”.schools.and.in.“High.AP”.schools..Among.“Low.AP”.schools.in.Clusters.A,.C,.and.D,.the.median.participation.(in.percentage.points).is.above.zero.for.White.students.only..This.is.particularly.
Figure 4
Median Percentage of Students Participating in the AP Program by Cluster
Sources: College Board 2004 AP Administration File and U.S. Department of Education Common Core of Data, 2003-2004 Public Elementary and Secondary School Universe Survey Data analyzed by Educational Testing Service.
What Proportion of High School Students Participate in the AP Program?
1�
troubling.in.Cluster.D,.in.which.about.one-quarter.of.the.students.are.from.underrepresented.minority.groups..Only.in.Cluster.B,.which.has.the.highest.population.of.minority.students,.is.there.participation.by.all.four.racial/ethnic.groups..But,.even.in.Cluster.B.the.exam.participation.for.all.racial/ethnic.groups.is.less.than.3.percent.
Figure.6.also.presents.racial/ethnic.breakdowns.for.“High.AP”.schools..Overall,.in.these.schools.15.percent.of.Asian.American.students.participate.in.AP.by.taking.an.exam,.compared.with.7.percent.of.White.students,.5.percent.of.Hispanic.students,.and.2.percent.of.African.American.students..Across.clusters,.we.see.very.clearly.that.underrepresented.minorities,.particularly.African.American.students,.are.much.less.likely.to.take.an.AP.exam.than.White.and.Asian.American.students..Among.Hispanic.students,.those.in.Clusters.B.and.C.(large,.urban/suburban.schools).
are.more.likely.to.participate.in.AP..The.participation.in.“High.AP”.schools.of.White.students.is.fairly.consistent.across.all.clusters,.hovering.between.6.percent.and.8.percent..Asian.American.students.have.the.highest.level.of.exam.participation.across.all.clusters.and.are.twice.as.likely.as.White.students.in.Clusters.B.and.C.to.participate.by.taking.an.exam.
Finally,.differences.in.AP.exam.participation.rates.were.examined.for.high-.and.low-income.students..Figure.7.shows.that.low-income.students.are.much.less.likely.to.participate.in.the.AP.program.(0.4.percent.compared.with.6.2.percent)..Low-income.students.in.Cluster.B.(large,.low-income.schools).are.the.most.likely.to.participate.in.AP..In.fact,.looking.at.the.exam.participation.rates.of.low-income.students.across.all.four.clusters.of.schools,.only.in.Cluster.B.“High.AP”.schools.does.the.participation.of.low-income.students.rise.above.1.3.percent..
Sources: College Board 2004 AP Administration File and U.S. Department of Education Common Core of Data, 2003-2004 Public Elementary and Secondary School Universe Survey Data analyzed by Educational Testing Service.
Figure 6
Median Percentage of Students Participating in the AP Program by Race/Ethnicity and Intensity of the AP Program
Sources: College Board 2004 AP Administration File and U.S. Department of Education Common Core of Data, 2003-2004 Public Elementary and Secondary School Universe Survey Data analyzed by Educational Testing Service.
Figure 5
Median Percentage of Students Participating in the AP Program by Gender and Intensity of the AP Program

1�
Though.the.AP.program.has.expanded.to.the.point.that.85.percent.of.students.attend.schools.that.offer.AP,.when.we.look.inside.those.schools,.it.becomes.clear.that.there.remains.a.tremendous.gap.in.who.participates.by.taking.an.AP.exam..African.American,.Hispanic,.and.low-income.students.are.less.likely.to.participate,.even.when.they.come.from.schools.in.which.they.are.in.the.majority..Indeed,.these.patterns.of.unequal.access.are.consistent.across.all.categories..of.schools.
Figure 7
Median Percentage of Students Participating in the AP Program by Low-Income Status and Intensity of the AP Program
Sources: College Board 2004 AP Administration File and U.S. Department of Education Common Core of Data, 2003-2004 Public Elementary and Secondary School Universe Survey Data analyzed by Educational Testing Service.
�0
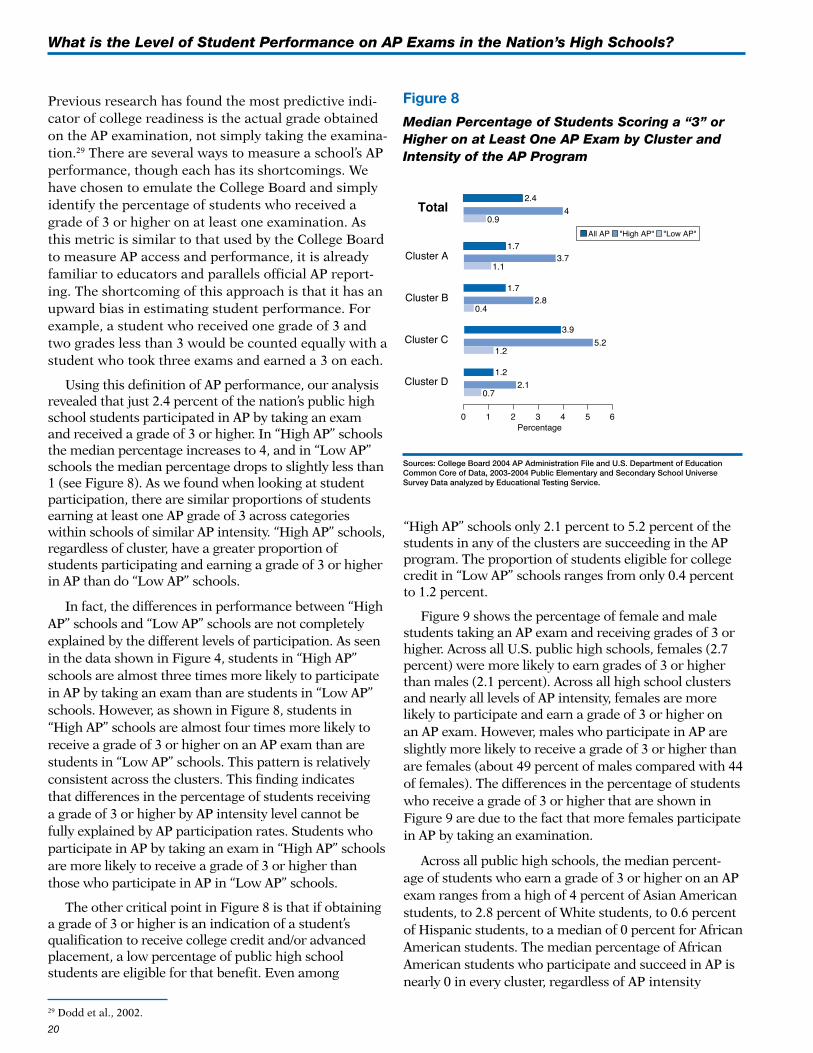
Previous.research.has.found.the.most.predictive.indi-cator.of.college.readiness.is.the.actual.grade.obtained.on.the.AP.examination,.not.simply.taking.the.examina-tion.29.There.are.several.ways.to.measure.a.school’s.AP.performance,.though.each.has.its.shortcomings..We.have.chosen.to.emulate.the.College.Board.and.simply.identify.the.percentage.of.students.who.received.a.grade.of.3.or.higher.on.at.least.one.examination..As.this.metric.is.similar.to.that.used.by.the.College.Board.to.measure.AP.access.and.performance,.it.is.already.familiar.to.educators.and.parallels.official.AP.report-ing..The.shortcoming.of.this.approach.is.that.it.has.an.upward.bias.in.estimating.student.performance..For.example,.a.student.who.received.one.grade.of.3.and.two.grades.less.than.3.would.be.counted.equally.with.a.student.who.took.three.exams.and.earned.a.3.on.each.
Using.this.definition.of.AP.performance,.our.analysis.revealed.that.just.2.4.percent.of.the.nation’s.public.high.school.students.participated.in.AP.by.taking.an.exam.and.received.a.grade.of.3.or.higher..In.“High.AP”.schools.the.median.percentage.increases.to.4,.and.in.“Low.AP”.schools.the.median.percentage.drops.to.slightly.less.than.1.(see.Figure.8)..As.we.found.when.looking.at.student.participation,.there.are.similar.proportions.of.students.earning.at.least.one.AP.grade.of.3.across.categories.within.schools.of.similar.AP.intensity..“High.AP”.schools,.regardless.of.cluster,.have.a.greater.proportion.of.students.participating.and.earning.a.grade.of.3.or.higher.in.AP.than.do.“Low.AP”.schools.
In.fact,.the.differences.in.performance.between.“High.AP”.schools.and.“Low.AP”.schools.are.not.completely.explained.by.the.different.levels.of.participation..As.seen.in.the.data.shown.in.Figure.4,.students.in.“High.AP”.schools.are.almost.three.times.more.likely.to.participate.in.AP.by.taking.an.exam.than.are.students.in.“Low.AP”.schools..However,.as.shown.in.Figure.8,.students.in.“High.AP”.schools.are.almost.four.times.more.likely.to.receive.a.grade.of.3.or.higher.on.an.AP.exam.than.are.students.in.“Low.AP”.schools..This.pattern.is.relatively.consistent.across.the.clusters..This.finding.indicates.that.differences.in.the.percentage.of.students.receiving.a.grade.of.3.or.higher.by.AP.intensity.level.cannot.be.fully.explained.by.AP.participation.rates..Students.who.participate.in.AP.by.taking.an.exam.in.“High.AP”.schools.are.more.likely.to.receive.a.grade.of.3.or.higher.than.those.who.participate.in.AP.in.“Low.AP”.schools.
The.other.critical.point.in.Figure.8.is.that.if.obtaining.a.grade.of.3.or.higher.is.an.indication.of.a.student’s.qualification.to.receive.college.credit.and/or.advanced.placement,.a.low.percentage.of.public.high.school.students.are.eligible.for.that.benefit..Even.among.....
.
.
.
.
.
.
.
.
.
.
.
.
.
.
.
.
.
.
.
.
.
.
.
.
.
.“High.AP”.schools.only.2.1.percent.to.5.2.percent.of.the.students.in.any.of.the.clusters.are.succeeding.in.the.AP.program..The.proportion.of.students.eligible.for.college.credit.in.“Low.AP”.schools.ranges.from.only.0.4.percent.to.1.2.percent.
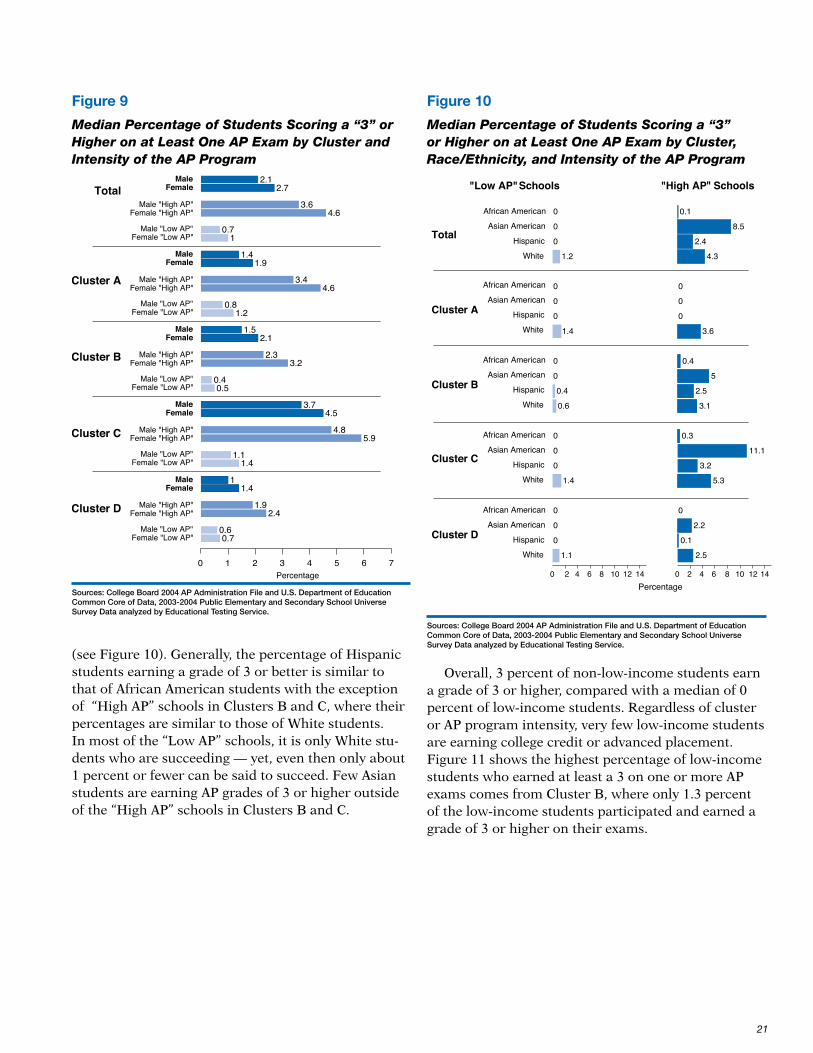
Figure.9.shows.the.percentage.of.female.and.male.students.taking.an.AP.exam.and.receiving.grades.of.3.or.higher..Across.all.U.S..public.high.schools,.females.(2.7.percent).were.more.likely.to.earn.grades.of.3.or.higher.than.males.(2.1.percent)..Across.all.high.school.clusters.and.nearly.all.levels.of.AP.intensity,.females.are.more.likely.to.participate.and.earn.a.grade.of.3.or.higher.on.an.AP.exam..However,.males.who.participate.in.AP.are.slightly.more.likely.to.receive.a.grade.of.3.or.higher.than.are.females.(about.49.percent.of.males.compared.with.44.of.females)..The.differences.in.the.percentage.of.students.who.receive.a.grade.of.3.or.higher.that.are.shown.in.Figure.9.are.due.to.the.fact.that.more.females.participate.in.AP.by.taking.an.examination.
Across.all.public.high.schools,.the.median.percent-age.of.students.who.earn.a.grade.of.3.or.higher.on.an.AP.exam.ranges.from.a.high.of.4.percent.of.Asian.American.students,.to.2.8.percent.of.White.students,.to.0.6.percent.of.Hispanic.students,.to.a.median.of.0.percent.for.African.American.students..The.median.percentage.of.African.American.students.who.participate.and.succeed.in.AP.is.nearly.0.in.every.cluster,.regardless.of.AP.intensity
Figure 8
Median Percentage of Students Scoring a “3” or Higher on at Least One AP Exam by Cluster and Intensity of the AP Program
29.Dodd.et.al.,.2002.
Sources: College Board 2004 AP Administration File and U.S. Department of Education Common Core of Data, 2003-2004 Public Elementary and Secondary School Universe Survey Data analyzed by Educational Testing Service.
What is the Level of Student Performance on AP Exams in the Nation’s High Schools?
�1
Figure 9
Median Percentage of Students Scoring a “3” or Higher on at Least One AP Exam by Cluster and Intensity of the AP Program
Sources: College Board 2004 AP Administration File and U.S. Department of Education Common Core of Data, 2003-2004 Public Elementary and Secondary School Universe Survey Data analyzed by Educational Testing Service.
.
(see.Figure.10)..Generally,.the.percentage.of.Hispanic.students.earning.a.grade.of.3.or.better.is.similar.to.that.of.African.American.students.with.the.exception.of..“High.AP”.schools.in.Clusters.B.and.C,.where.their.percentages.are.similar.to.those.of.White.students...In.most.of.the.“Low.AP”.schools,.it.is.only.White.stu-dents.who.are.succeeding.—.yet,.even.then.only.about.1.percent.or.fewer.can.be.said.to.succeed..Few.Asian.students.are.earning.AP.grades.of.3.or.higher.outside.of.the.“High.AP”.schools.in.Clusters.B.and.C..
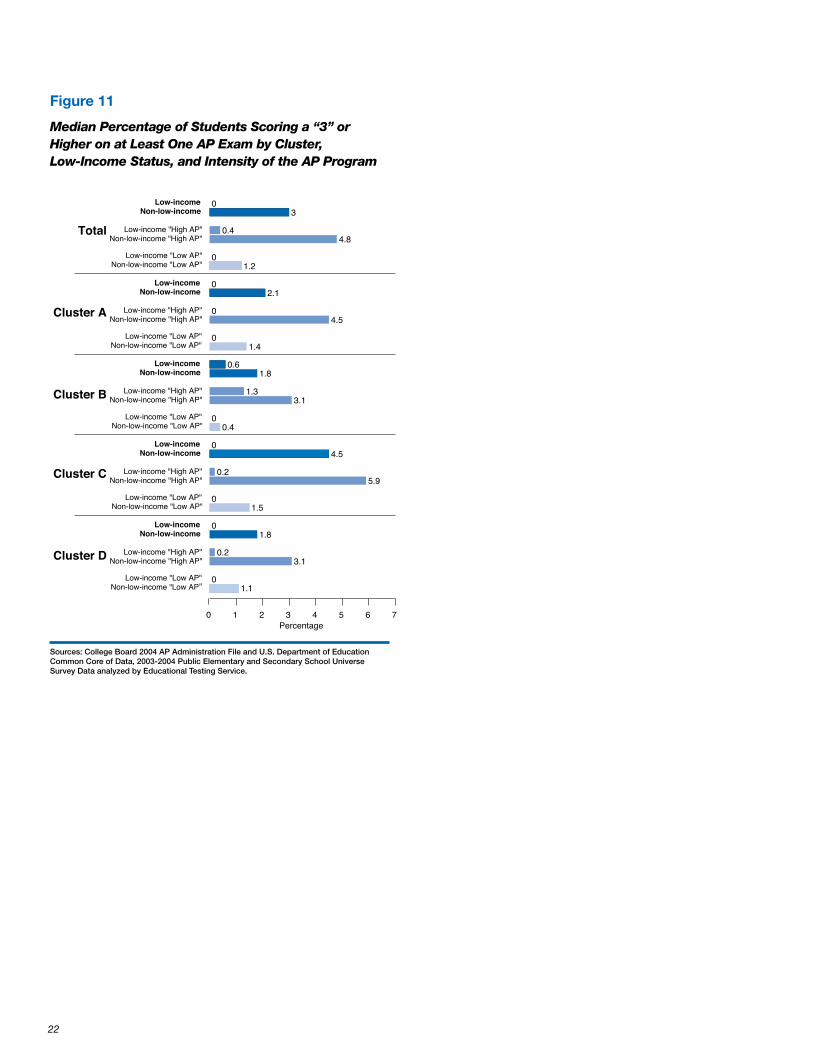
Overall,.3.percent.of.non-low-income.students.earn.a.grade.of.3.or.higher,.compared.with.a.median.of.0.percent.of.low-income.students..Regardless.of.cluster.or.AP.program.intensity,.very.few.low-income.students.are.earning.college.credit.or.advanced.placement..Figure.11.shows.the.highest.percentage.of.low-income.students.who.earned.at.least.a.3.on.one.or.more.AP.exams.comes.from.Cluster.B,.where.only.1.3.percent.of.the.low-income.students.participated.and.earned.a.grade.of.3.or.higher.on.their.exams.
Sources: College Board 2004 AP Administration File and U.S. Department of Education Common Core of Data, 2003-2004 Public Elementary and Secondary School Universe Survey Data analyzed by Educational Testing Service.
Figure 10
Median Percentage of Students Scoring a “3” or Higher on at Least One AP Exam by Cluster, Race/Ethnicity, and Intensity of the AP Program
��
Figure 11
Median Percentage of Students Scoring a “3” or Higher on at Least One AP Exam by Cluster, Low-Income Status, and Intensity of the AP Program
Sources: College Board 2004 AP Administration File and U.S. Department of Education Common Core of Data, 2003-2004 Public Elementary and Secondary School Universe Survey Data analyzed by Educational Testing Service.
��
Previous.studies.have.found.that.high.school.students.who.take.and.succeed.in.rigorous.academic.coursework.are.more.likely.to.enjoy.later.academic.and.professional.success..For.the.nation.to.prosper.in.a.global.economy,.we.need.to.focus.on.making.sure.that.all.groups.of.students.achieve.academic.success.—.not.just.some.groups..With.that.goal.in.mind,.this.study.has.examined.one.of.the.largest.providers.of.rigorous.high.school.curriculum,.one.that.is.also.research.supported.—.the.College.Board’s.AP.Program.
Combining.data.from.two.national.datasets.and.clustering.more.than.22,000.U.S..public.high.schools.into.four.categories.based.on.school.characteristics.has.allowed.for.a.unique,.national.analysis.at.the.school.level.of.AP.program.availability,.participation,.and.performance..Our.analysis.found.several.gaps.between.schools.and.students.with.regard.to.these.outcomes.
School types vary in the degree to which they offer AP. Clusters.made.up.of.the.larger.schools.in.more.densely.populated.areas.were.more.likely.to.offer.an.AP.program.than.smaller,.more.rural.school.clusters..The.large,.low-poverty,.low-underrepresented.minority.schools.in.Cluster.C.were.the.clear.leaders,.with.more.than.three-quarters.of.their.schools.offering.some.AP.programs,.most.offering.programs.at.a.high.intensity..The.next.highest.cluster.with.regard.to.offering.AP.was.the.large,.much.more.racially.and.financially.diverse.Cluster.B,.in.which.about.half.of.the.schools.offer.AP.
Once differences among schools in AP program intensity are taken into account, public high schools are similar with regard to AP exam participation and student performance..Despite.differences.in.school.clusters,.the.results.show.similarly.low.proportions.of.students.both.taking.at.least.one.AP.exam.and.earning.at.least.one.AP.grade.of.3.or.better..The.“High.AP”.schools.were.similar.across.clusters,.as.were.the.“Low.AP”.schools..The.greatest.differences.were.among.the.“High.AP”.and.“Low.AP”.schools.within.the.clusters.
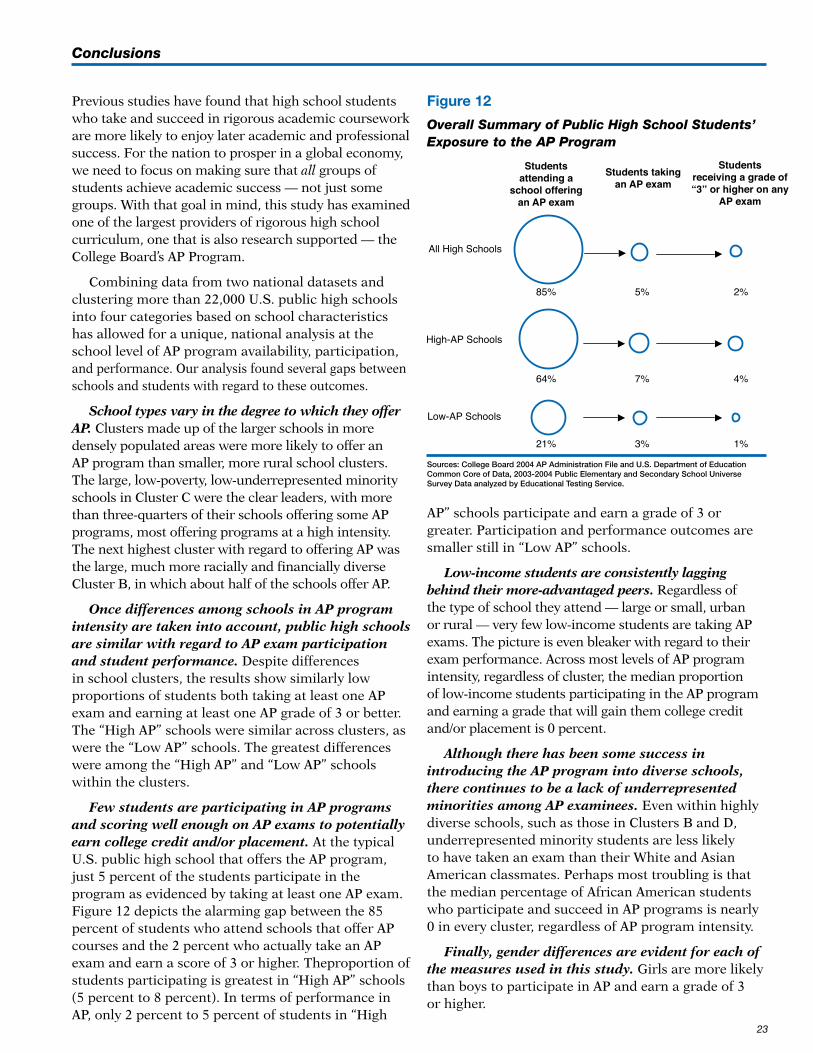
Few students are participating in AP programs and scoring well enough on AP exams to potentially earn college credit and/or placement..At.the.typical.U.S..public.high.school.that.offers.the.AP.program,.just.5.percent.of.the.students.participate.in.the.program.as.evidenced.by.taking.at.least.one.AP.exam..Figure.12.depicts.the.alarming.gap.between.the.85.percent.of.students.who.attend.schools.that.offer.AP.courses.and.the.2.percent.who.actually.take.an.AP.exam.and.earn.a.score.of.3.or.higher..Theproportion.of.students.participating.is.greatest.in.“High.AP”.schools.(5.percent.to.8.percent)..In.terms.of.performance.in.AP,.only.2.percent.to.5.percent.of.students.in.“High.
AP”.schools.participate.and.earn.a.grade.of.3.or.greater..Participation.and.performance.outcomes.are.smaller.still.in.“Low.AP”.schools..
Low-income students are consistently lagging behind their more-advantaged peers..Regardless.of.the.type.of.school.they.attend.—.large.or.small,.urban.or.rural.—.very.few.low-income.students.are.taking.AP.exams..The.picture.is.even.bleaker.with.regard.to.their.exam.performance..Across.most.levels.of.AP.program.intensity,.regardless.of.cluster,.the.median.proportion.of.low-income.students.participating.in.the.AP.program.and.earning.a.grade.that.will.gain.them.college.credit.and/or.placement.is.0.percent.
Although there has been some success in introducing the AP program into diverse schools, there continues to be a lack of underrepresented minorities among AP examinees..Even.within.highly.diverse.schools,.such.as.those.in.Clusters.B.and.D,.underrepresented.minority.students.are.less.likely.to.have.taken.an.exam.than.their.White.and.Asian.American.classmates..Perhaps.most.troubling.is.that.the.median.percentage.of.African.American.students.who.participate.and.succeed.in.AP.programs.is.nearly.0.in.every.cluster,.regardless.of.AP.program.intensity.
Finally, gender differences are evident for each of the measures used in this study. Girls.are.more.likely.than.boys.to.participate.in.AP.and.earn.a.grade.of.3..or.higher.
Conclusions
Students attending a
school offering an AP exam
Students taking an AP exam
All High Schools
High-AP Schools
Low-AP Schools
85% 5% 2%
64% 7% 4%
21% 3% 1%
Students receiving a grade of “3” or higher on any
AP exam
Figure 12
Overall Summary of Public High School Students’ Exposure to the AP Program
Sources: College Board 2004 AP Administration File and U.S. Department of Education Common Core of Data, 2003-2004 Public Elementary and Secondary School Universe Survey Data analyzed by Educational Testing Service.
��
The.data.assembled.in.this.report.indicate.that.the.AP.program.is.available.in.most.public.high.schools..Yet.the.results.also.show.that.very.few.students.take.AP.exams.and.score.3.or.higher..Further,.AP.program.participation.remains.relatively.rare.among.low-income.and.minority.students..Thus,.there.are.significant.challenges.to.ensuring.that.rigorous.academic.offerings.are.available.to.all.students.
The.percentage.of.students.taking.at.least.one.AP.exam.is.minimal,.and.at.or.close.to.zero.for.African.American.and.low-income.students..The.AP.program.is.a.means.of.introducing.students.to.academic.rigor,.which.in.turn.is.believed.to.be.an.important.determinant.of.future.academic.success..But.our.data.reveal.that.a.very.small.percentage.of.high.school.students,.mostly.consisting.of.majority.group.and.Asian.American.students,.participate.in.the.program..
For.more.students.to.reap.the.benefits.of.AP.program.participation,.public.schools.need.to.make.greater.efforts.at.broadening.their.programs.and.creating.a.culture.of.academic.rigor.within.their.schools.—.a.culture.that.paves.the.way.for.successful.AP.program.participation.for.large.numbers.of.students..Students.in.general.and.students.in.underrepresented.subgroups.in.particular.are.more.likely.to.participate.in.AP.programs.in.schools.that.offer.more.high-intensity.programs.
Some.segments.of.the.public.high.school.population.may.especially.benefit.from.efforts.to.expand.the.level.of.advanced.academic.coursework..For.example,.small,.rural,.low-income.schools.are.less.likely.than.other.types.of.high.schools.to.participate.in.the.AP.program..In.addition,.underrepresented.minority.and.low-income.students.are.particularly.underserved.by.the.program.
.The.availability.of.an.AP.program.in.a.school.is,.of.course,.necessary.for.student.participation..But.it.is.insufficient.on.its.own;.even.in.many.schools.classified.as.“High.AP,”.few.students.take.at.least.one.AP.exam.
Recommendations for Future Research
To.understand.the.factors.that.limit.participation,.research.should.focus.on:
• Identifying.and.providing.the.educational.experiences.that.students.need.in.order.to.be.prepared.for.advanced.coursework.
• Policies.for.student.placement.into.academic.tracks.or.programs.
• Ways.to.encourage.students.to.prepare.for.and.participate.in.advanced.academic.programs..Both.underrepresented.minority.students.and.males.tend.to.take.fewer.AP.courses,.even.when.an.AP.program.is.available.in.their.schools..There.are.programs.designed.to.encourage.underrepresented.minority.students.to.consider.AP.and.advanced.coursework.early.in.their.school.careers..But.more.knowledge.is.needed.about.which.of.these.programs.are.having.an.impact.and,.more.importantly,.why.they.are.succeeding,.if.in.fact.they.are.
• Identifying.the.issues.keeping.low-income.students.from.AP.participation.even.when.opportunities.and.fee-reduction.opportunities.are.present..The.number.of.fee-reduced.exams.increased.from.nearly.83,000.in.1999.to.more.than.190,000.in.2004,.a.growth.of.129.percent..This.growth.far.outpaced.the.growth.(60.percent).in.non-fee-reduced.exams.during.the.same.period..Though.there.is.no.doubt.that.these.popular.test-fee-reduction.programs.have.had.a.positive.impact.on.student.participation.among.low-income.students,.the.2004.data.suggest.that.reducing.AP.exam.fees.may.not.be.enough.
• Providing.the.resources.necessary.to.ensure.that.AP.courses.are.available.for.all.students.who.wish.to.take.them.
• Identifying.teacher.quality.issues.and.staff.development.needs.to.ensure.that.students.have.access.to.appropriate.instruction.
Unless.the.opportunity.for.advanced.coursework.is.made.available.to.growing.segments.of.our.underserved.student.populations,.many.students.will.be.unable.to.avail.themselves.of.opportunities.for.higher.education.and.for.successful.participation.in.the.workforce.
Implications
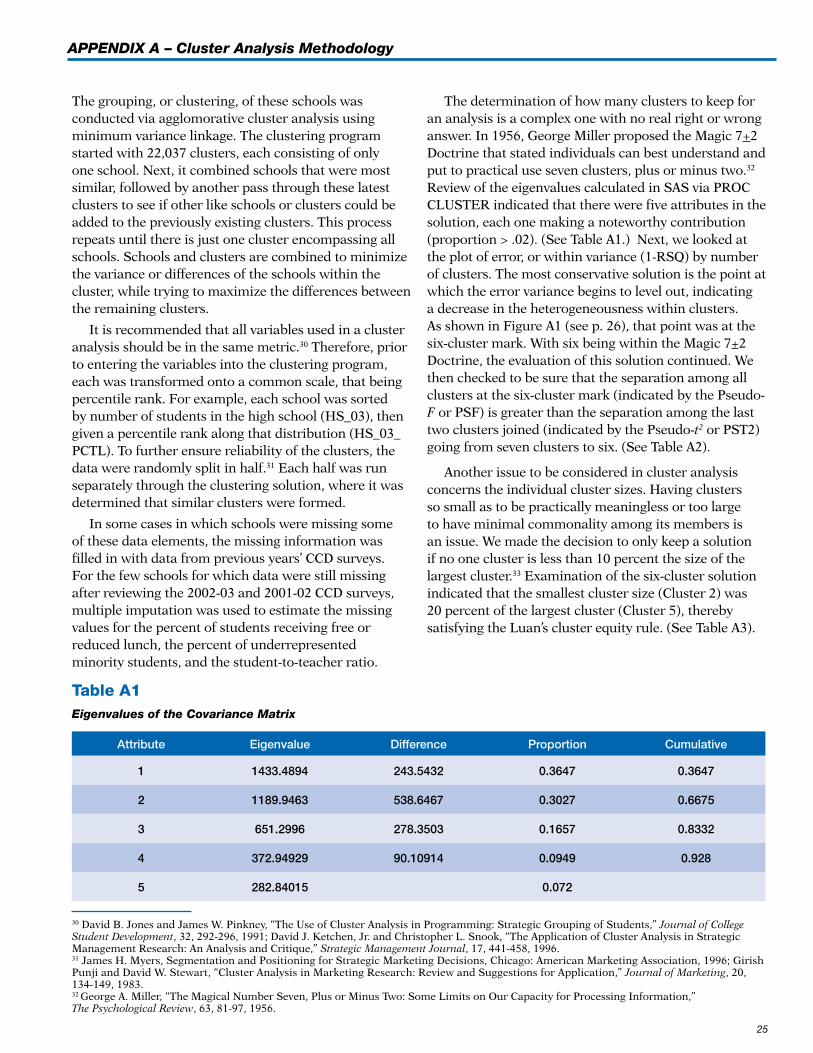
��
The.grouping,.or.clustering,.of.these.schools.was..conducted.via.agglomorative.cluster.analysis.using.minimum.variance.linkage..The.clustering.program.started.with.22,037.clusters,.each.consisting.of.only.one.school..Next,.it.combined.schools.that.were.most.similar,.followed.by.another.pass.through.these.latest.clusters.to.see.if.other.like.schools.or.clusters.could.be.added.to.the.previously.existing.clusters..This.process.repeats.until.there.is.just.one.cluster.encompassing.all.schools..Schools.and.clusters.are.combined.to.minimize.the.variance.or.differences.of.the.schools.within.the.cluster,.while.trying.to.maximize.the.differences.between.the.remaining.clusters.
It.is.recommended.that.all.variables.used.in.a.cluster.analysis.should.be.in.the.same.metric.30.Therefore,.prior.to.entering.the.variables.into.the.clustering.program,.each.was.transformed.onto.a.common.scale,.that.being.percentile.rank..For.example,.each.school.was.sorted.by.number.of.students.in.the.high.school.(HS_03),.then.given.a.percentile.rank.along.that.distribution.(HS_03_PCTL)..To.further.ensure.reliability.of.the.clusters,.the.data.were.randomly.split.in.half.31.Each.half.was.run.separately.through.the.clustering.solution,.where.it.was.determined.that.similar.clusters.were.formed.
In.some.cases.in.which.schools.were.missing.some..of.these.data.elements,.the.missing.information.was.filled.in.with.data.from.previous.years’.CCD.surveys...For.the.few.schools.for.which.data.were.still.missing.after.reviewing.the.2002-03.and.2001-02.CCD.surveys,.multiple.imputation.was.used.to.estimate.the.missing.values.for.the.percent.of.students.receiving.free.or.reduced.lunch,.the.percent.of.underrepresented.minority.students,.and.the.student-to-teacher.ratio.
The.determination.of.how.many.clusters.to.keep.for.an.analysis.is.a.complex.one.with.no.real.right.or.wrong.answer..In.1956,.George.Miller.proposed.the.Magic.7+2.Doctrine.that.stated.individuals.can.best.understand.and.put.to.practical.use.seven.clusters,.plus.or.minus.two.32..Review.of.the.eigenvalues.calculated.in.SAS.via.PROC.CLUSTER.indicated.that.there.were.five.attributes.in.the.solution,.each.one.making.a.noteworthy.contribution.(proportion.>..02)..(See.Table.A1.)..Next,.we.looked.at.the.plot.of.error,.or.within.variance.(1-RSQ).by.number.of.clusters..The.most.conservative.solution.is.the.point.at.which.the.error.variance.begins.to.level.out,.indicating.a.decrease.in.the.heterogeneousness.within.clusters..As.shown.in.Figure.A1.(see.p..26),.that.point.was.at.the.six-cluster.mark..With.six.being.within.the.Magic.7+2.Doctrine,.the.evaluation.of.this.solution.continued..We.then.checked.to.be.sure.that.the.separation.among.all.clusters.at.the.six-cluster.mark.(indicated.by.the.Pseudo-F.or.PSF).is.greater.than.the.separation.among.the.last.two.clusters.joined.(indicated.by.the.Pseudo-t2.or.PST2).going.from.seven.clusters.to.six..(See.Table.A2).
Another.issue.to.be.considered.in.cluster.analysis.concerns.the.individual.cluster.sizes..Having.clusters.so.small.as.to.be.practically.meaningless.or.too.large.to.have.minimal.commonality.among.its.members.is.an.issue..We.made.the.decision.to.only.keep.a.solution.if.no.one.cluster.is.less.than.10.percent.the.size.of.the.largest.cluster.33.Examination.of.the.six-cluster.solution.indicated.that.the.smallest.cluster.size.(Cluster.2).was.20.percent.of.the.largest.cluster.(Cluster.5),.thereby.satisfying.the.Luan’s.cluster.equity.rule..(See.Table.A3).
APPENDIX A – Cluster Analysis Methodology
Table A1 Eigenvalues of the Covariance Matrix
Attribute Eigenvalue Difference Proportion Cumulative
1 1433.4894 243.5432 0.3647 0.3647
2 1189.9463 538.6467 0.3027 0.6675
3 651.2996 278.3503 0.1657 0.8332
4 372.94929 90.10914 0.0949 0.928
5 282.84015 0.072
30.David.B..Jones.and.James.W..Pinkney,.“The.Use.of.Cluster.Analysis.in.Programming:.Strategic.Grouping.of.Students,”.Journal of College Student Development,.32,.292-296,.1991;.David.J..Ketchen,.Jr..and.Christopher.L..Snook,.“The.Application.of.Cluster.Analysis.in.Strategic..Management.Research:.An.Analysis.and.Critique,”.Strategic Management Journal,.17,.441-458,.1996.31.James.H..Myers,.Segmentation.and.Positioning.for.Strategic.Marketing.Decisions,.Chicago:.American.Marketing.Association,.1996;.Girish.Punji.and.David.W..Stewart,.“Cluster.Analysis.in.Marketing.Research:.Review.and.Suggestions.for.Application,”.Journal of Marketing,.20,.134-149,.1983.32.George.A..Miller,.“The.Magical.Number.Seven,.Plus.or.Minus.Two:.Some.Limits.on.Our.Capacity.for.Processing.Information,”..The Psychological Review,.63,.81-97,.1956.
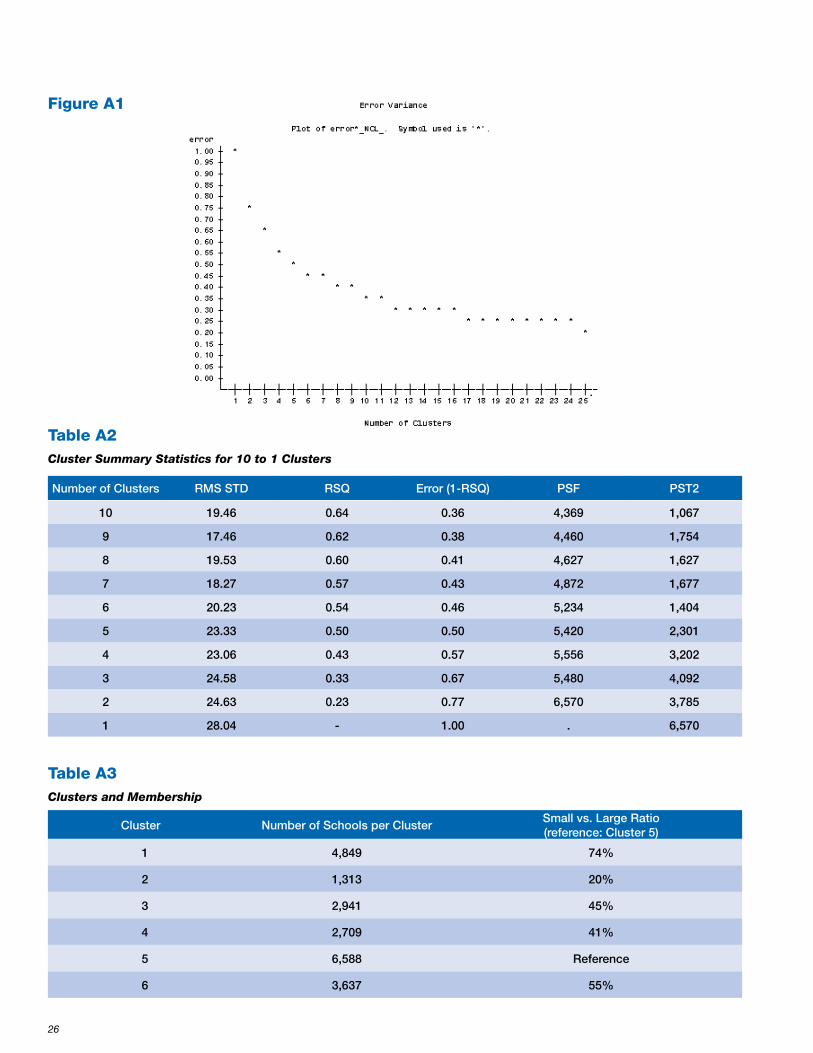
��
Table A2 Cluster Summary Statistics for 10 to 1 Clusters
Table A3 Clusters and Membership
Number of Clusters RMS STD RSQ Error (1-RSQ) PSF PST2
10 19.46 0.64 0.36 4,369 1,067
9 17.46 0.62 0.38 4,460 1,754
8 19.53 0.60 0.41 4,627 1,627
7 18.27 0.57 0.43 4,872 1,677
6 20.23 0.54 0.46 5,234 1,404
5 23.33 0.50 0.50 5,420 2,301
4 23.06 0.43 0.57 5,556 3,202
3 24.58 0.33 0.67 5,480 4,092
2 24.63 0.23 0.77 6,570 3,785
1 28.04 - 1.00 . 6,570
Cluster Number of Schools per ClusterSmall vs. Large Ratio (reference: Cluster 5)
1 4,849 74%
2 1,313 20%
3 2,941 45%
4 2,709 41%
5 6,588 Reference
6 3,637 55%
Figure A1
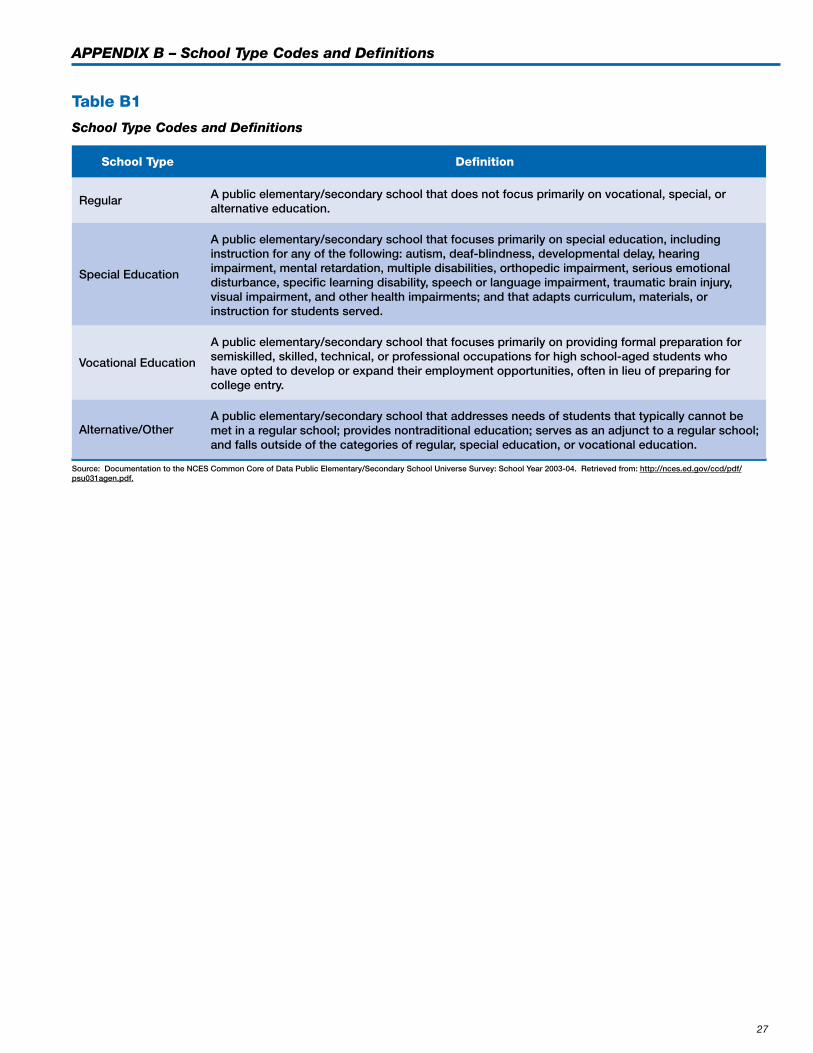
��
Table B1
School Type Codes and Definitions
School Type Definition
Regular A public elementary/secondary school that does not focus primarily on vocational, special, or alternative education.
Special Education
A public elementary/secondary school that focuses primarily on special education, including instruction for any of the following: autism, deaf-blindness, developmental delay, hearing impairment, mental retardation, multiple disabilities, orthopedic impairment, serious emotional disturbance, specific learning disability, speech or language impairment, traumatic brain injury, visual impairment, and other health impairments; and that adapts curriculum, materials, or instruction for students served.
Vocational Education
A public elementary/secondary school that focuses primarily on providing formal preparation for semiskilled, skilled, technical, or professional occupations for high school-aged students who have opted to develop or expand their employment opportunities, often in lieu of preparing for college entry.
Alternative/OtherA public elementary/secondary school that addresses needs of students that typically cannot be met in a regular school; provides nontraditional education; serves as an adjunct to a regular school; and falls outside of the categories of regular, special education, or vocational education.
Source: Documentation to the NCES Common Core of Data Public Elementary/Secondary School Universe Survey: School Year 2003-04. Retrieved from: http://nces.ed.gov/ccd/pdf/psu031agen.pdf.
APPENDIX B – School Type Codes and Definitions

��
8006
About ETS
ETS is a nonprofit institution with the mission to advance quality
and equity in education by providing fair and valid assessments,
research and related services for all people worldwide. In serving
individuals, educational institutions and government agencies
around the world, ETS customizes solutions to meet the need
for teacher professional development products and services,
classroom and end-of-course assessments, and research-based
teaching and learning tools. Founded in 1947, ETS today develops,
administers and scores more than 30 million tests annually in
more than 180 countries, at over 9,000 locations worldwide.
®