Embed Size (px)
Citation preview
Patterns of performance degradation and restoration duringsleep restriction and subsequent recovery:a sleep dose-response study
GREGORY BELENKY , NANCY J . WESENSTEN , DAV ID R . THORNE ,MAR IA L . THOMAS , HELEN C . S ING , DAN IEL P . REDMOND ,M ICHAEL B . RUS SO and THOMAS J . BALK INDivision of Neuropsychiatry, Walter Reed Army Institute of Research, Silver Spring, MD, USA
Accepted in revised form 11 December 2002; received 28 June 2002
SUMMARY Daytime performance changes were examined during chronic sleep restriction oraugmentation and following subsequent recovery sleep. Sixty-six normal volunteersspent either 3 (n ¼ 18), 5 (n¼ 16), 7 (n ¼ 16), or 9 h (n ¼ 16) daily time in bed (TIB) for7 days (restriction ⁄augmentation) followed by 3 days with 8 h daily TIB (recovery). Inthe 3-h group, speed (mean and fastest 10% of responses) on the psychomotor vigilancetask (PVT) declined, and PVT lapses (reaction times greater than 500 ms) increasedsteadily across the 7 days of sleep restriction. In the 7- and 5-h groups speed initiallydeclined, then appeared to stabilize at a reduced level; lapses were increased only inthe 5-h group. In the 9-h group, speed and lapses remained at baseline levels.During recovery, PVT speed in the 7- and 5-h groups (and lapses in the 5-h group)remained at the stable, but reduced levels seen during the last days of the experimentalphase, with no evidence of recovery. Speed and lapses in the 3-h group recoveredrapidly following the first night of recovery sleep; however, recovery was incompletewith speed and lapses stabilizing at a level comparable with the 7- and 5-h groups.Performance in the 9-h group remained at baseline levels during the recovery phase.These results suggest that the brain adapts to chronic sleep restriction. In mild tomoderate sleep restriction this adaptation is sufficient to stabilize performance,although at a reduced level. These adaptive changes are hypothesized to restrict brainoperational capacity and to persist for several days after normal sleep duration isrestored, delaying recovery.
k e yword s chronic sleep restriction, modeling, partial sleep deprivation, perform-ance, recovery, sleep deprivation, sleep restriction, sleep
INTRODUCTION
Chronic sleep restriction is endemic in modern society.
Americans are sleeping less (Bliwise et al. 1992; Webb and
Agnew 1975) and, in absolute terms, a large fraction is
reporting daily sleep substantially below the recommended
optimum of 8 h per night (National Sleep Foundation 2002;
Sleep in America Poll), although the true optimum may be
higher (Coren 1997; Palinkas et al. 1995) or lower (Harrison
and Horne 1995; Kripke et al. 2002). Sleep deprivation and
chronic sleep restriction degrade health, safety, productivity
(individual and societal) and quality of life (Bonnet and
Arand 1995; Leger 1994; Mitler et al. 1988; Pilcher and
Huffcutt 1996; Spiegel et al. 1999). In contrast to the
apparent endemic nature of chronic sleep restriction, acute
total sleep deprivation (TSD) occurs infrequently outside of
the sleep laboratory.
Despite the prevalence of sleep restriction in modern
society, few studies have evaluated the performance effects
Correspondence: Gregory Belenky, MD, Colonel, Medical Corps, U.S.Army, Division of Neuropsychiatry, Walter Reed Army Institute ofResearch, 503 Robert Grant Avenue, Silver Spring, MD 20910-7500,USA. Tel.: +1-301-319-9085; fax: +1-301-319-9255; e-mail:[email protected]
J. Sleep Res. (2003) 12, 1–12
! 2003 European Sleep Research Society 1

of chronic sleep restriction (e.g. Carskadon and Dement 1981;
Dinges et al. 1997, 1999; Friedman et al. 1977; Horne and
Wilkinson 1985; Kuo et al. 1998; Mullaney et al. 1977; Webb
and Agnew 1974). Most studies to determine the behavioral
effects of sleep loss have used acute TSD as the experimental
manipulation. TSD studies are more efficient than chronic
sleep restriction studies as the former produce larger behavi-
oral decrements over a shorter period of time. Because of the
paucity of well-controlled sleep restriction studies, findings
from acute TSD studies, and specifically findings with respect
to the accumulation and discharge of pressure for electroen-
cephalographic (EEG) slow wave activity, have generally
been used in the development of mathematical models to
predict performance on the basis of prior sleep–wake history
(Achermann et al. 1993; Akerstedt and Folkard 1995, 1996,
1997; Borbely 1982; Borbely et al. 1989; Folkard and
Akerstedt 1991; Jewett and Kronauer 1999; Jewett et al.
1999). These models, both in terms of degradation and
recovery functions, are anchored at the extremes of normal
sleep on the one hand and TSD on the other with little
objective data on what goes on in between (i.e. during
restricted sleep). In sum, little is known about the effect of
chronic sleep restriction on objectively measured alertness
and performance and on the time course of subsequent
recovery.
The purpose of the present study was to empirically
determine the effects of several levels of restricted and one
level of augmented sleep over seven consecutive days on
objective and subjective alertness and objective performance,
and to determine the extent to which 3 days of subsequent
recovery sleep restored performance and alertness to baseline
levels – a sleep dose–response study.
The data reported here are a subset of data collected in a
larger study analysed and published as a US Department of
Transportation Report (Balkin et al. 2000). In the present
paper we report findings for psychomotor vigilance task
performance (PVT), sleep latency, and subjective sleepiness.
Of the measures taken in the larger study, the PVT was
chosen for this paper because it was the most sensitive to the
effects of sleep restriction and was the least subject to
learning effects (Balkin et al. 2000).
METHODS
Subjects
Sixty-six volunteers (16 women, age 24–55, mean ¼ 43 years;
and 50 men, age 24–62, mean ¼ 37 years) participated. All
subjects held valid Commercial Motor Vehicle (CMV) drivers’
licenses. Subjects were in good general health as determined by
medical history and medical examination and were free of
neurological diseases, psychiatric disorders, sleep disorders,
and drug or alcohol addiction. They did not use nicotine in any
form and reported consuming no more than 300–400 mg
caffeine per day. Subjects were medication-free (including
over-the-counter medications) beginning 48 h prior to the
study, with the exception that female subjects could continue
birth control medications.
Design
Volunteers spent 14 days in-residence in the laboratory
(Fig. 1); a !day" is defined as the time from the beginning of
one scheduled sleep period to the beginning of the next. The
first 3 days (T1, T2 and B) were adaptation and training (T1
and T2) and baseline (B) and subjects were required to be in
bed from 23:00 to 07:00 h [8 h required time in bed (TIB)]. On
the third day (B), baseline measures were taken. Beginning on
the fourth day and continuing for a total of 7 days (E1–E7)
subjects were in one of four sleep conditions [9 h required TIB
(22:00–07:00 h), 7 h required TIB (24:00–07:00 h), 5 h
required TIB (02:00–07:00 h), or 3 h required TIB (04:00–
07:00 h)], effectively one sleep augmentation condition, and
three sleep restriction conditions. The purpose of these
conditions was to produce differing levels of sleep restric-
tion ⁄ augmentation relative to the adaptation and training and
baseline days. Beginning on the eleventh day and continuing
for a total of 3 days (R1–R3) subjects were again required to
be in bed from 23:00 to 07:00 h (8 h required TIB). These last
3 days constituted recovery. Subjects obtained a final night of
8 h TIB prior to release from the study; however, no testing
occurred following this fourth night of recovery sleep.
Throughout all phases of the study, lights on for all subjects
was 07:00 h. Subjects were not permitted any other time in bed
T1 T2 B E1 E2 E3 E4 E5 E6 E7 R1 R2 R3
8 (h) TIB 8 (h) TIB
Adaptation and training
Sleeprestriction/augmentation
Final recovery night(no testing the next day)
3, 5, 7, or 9 (h) TIB
Recovery
Days
Figure 1. Study experimental design,showing nightly time in bed across days(adaptation ⁄ training, baseline, experimentalphase, recovery phase).
2 G. Belenky et al.
! 2003 European Sleep Research Society, J. Sleep Res., 12, 1–12
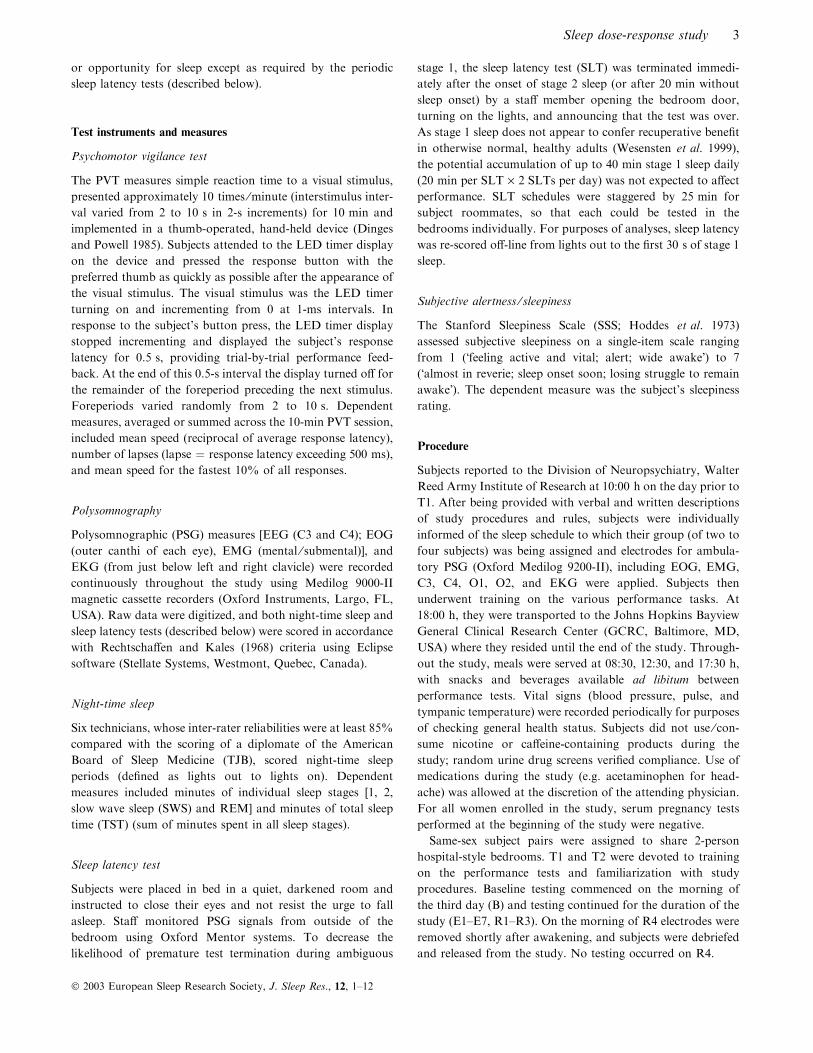
or opportunity for sleep except as required by the periodic
sleep latency tests (described below).
Test instruments and measures
Psychomotor vigilance test
The PVT measures simple reaction time to a visual stimulus,
presented approximately 10 times ⁄minute (interstimulus inter-
val varied from 2 to 10 s in 2-s increments) for 10 min and
implemented in a thumb-operated, hand-held device (Dinges
and Powell 1985). Subjects attended to the LED timer display
on the device and pressed the response button with the
preferred thumb as quickly as possible after the appearance of
the visual stimulus. The visual stimulus was the LED timer
turning on and incrementing from 0 at 1-ms intervals. In
response to the subject’s button press, the LED timer display
stopped incrementing and displayed the subject’s response
latency for 0.5 s, providing trial-by-trial performance feed-
back. At the end of this 0.5-s interval the display turned off for
the remainder of the foreperiod preceding the next stimulus.
Foreperiods varied randomly from 2 to 10 s. Dependent
measures, averaged or summed across the 10-min PVT session,
included mean speed (reciprocal of average response latency),
number of lapses (lapse ¼ response latency exceeding 500 ms),
and mean speed for the fastest 10% of all responses.
Polysomnography
Polysomnographic (PSG) measures [EEG (C3 and C4); EOG
(outer canthi of each eye), EMG (mental ⁄ submental)], and
EKG (from just below left and right clavicle) were recorded
continuously throughout the study using Medilog 9000-II
magnetic cassette recorders (Oxford Instruments, Largo, FL,
USA). Raw data were digitized, and both night-time sleep and
sleep latency tests (described below) were scored in accordance
with Rechtschaffen and Kales (1968) criteria using Eclipse
software (Stellate Systems, Westmont, Quebec, Canada).
Night-time sleep
Six technicians, whose inter-rater reliabilities were at least 85%
compared with the scoring of a diplomate of the American
Board of Sleep Medicine (TJB), scored night-time sleep
periods (defined as lights out to lights on). Dependent
measures included minutes of individual sleep stages [1, 2,
slow wave sleep (SWS) and REM] and minutes of total sleep
time (TST) (sum of minutes spent in all sleep stages).
Sleep latency test
Subjects were placed in bed in a quiet, darkened room and
instructed to close their eyes and not resist the urge to fall
asleep. Staff monitored PSG signals from outside of the
bedroom using Oxford Mentor systems. To decrease the
likelihood of premature test termination during ambiguous
stage 1, the sleep latency test (SLT) was terminated immedi-
ately after the onset of stage 2 sleep (or after 20 min without
sleep onset) by a staff member opening the bedroom door,
turning on the lights, and announcing that the test was over.
As stage 1 sleep does not appear to confer recuperative benefit
in otherwise normal, healthy adults (Wesensten et al. 1999),
the potential accumulation of up to 40 min stage 1 sleep daily
(20 min per SLT · 2 SLTs per day) was not expected to affect
performance. SLT schedules were staggered by 25 min for
subject roommates, so that each could be tested in the
bedrooms individually. For purposes of analyses, sleep latency
was re-scored off-line from lights out to the first 30 s of stage 1
sleep.
Subjective alertness ⁄ sleepiness
The Stanford Sleepiness Scale (SSS; Hoddes et al. 1973)
assessed subjective sleepiness on a single-item scale ranging
from 1 (!feeling active and vital; alert; wide awake") to 7
(!almost in reverie; sleep onset soon; losing struggle to remain
awake"). The dependent measure was the subject’s sleepiness
rating.
Procedure
Subjects reported to the Division of Neuropsychiatry, Walter
Reed Army Institute of Research at 10:00 h on the day prior to
T1. After being provided with verbal and written descriptions
of study procedures and rules, subjects were individually
informed of the sleep schedule to which their group (of two to
four subjects) was being assigned and electrodes for ambula-
tory PSG (Oxford Medilog 9200-II), including EOG, EMG,
C3, C4, O1, O2, and EKG were applied. Subjects then
underwent training on the various performance tasks. At
18:00 h, they were transported to the Johns Hopkins Bayview
General Clinical Research Center (GCRC, Baltimore, MD,
USA) where they resided until the end of the study. Through-
out the study, meals were served at 08:30, 12:30, and 17:30 h,
with snacks and beverages available ad libitum between
performance tests. Vital signs (blood pressure, pulse, and
tympanic temperature) were recorded periodically for purposes
of checking general health status. Subjects did not use ⁄ con-sume nicotine or caffeine-containing products during the
study; random urine drug screens verified compliance. Use of
medications during the study (e.g. acetaminophen for head-
ache) was allowed at the discretion of the attending physician.
For all women enrolled in the study, serum pregnancy tests
performed at the beginning of the study were negative.
Same-sex subject pairs were assigned to share 2-person
hospital-style bedrooms. T1 and T2 were devoted to training
on the performance tests and familiarization with study
procedures. Baseline testing commenced on the morning of
the third day (B) and testing continued for the duration of the
study (E1–E7, R1–R3). On the morning of R4 electrodes were
removed shortly after awakening, and subjects were debriefed
and released from the study. No testing occurred on R4.
Sleep dose-response study 3
! 2003 European Sleep Research Society, J. Sleep Res., 12, 1–12
Test schedule
The PVT and SSS were administered together as a battery four
times per day (09:00, 12:00, 15:00, and 21:00 h); the battery
included other tests not reported here (see Balkin et al. 2000).
The sleep latency test was administered at 09:40 and 15:30 h
for all groups.
Subjects in the 3- and 5-h TIB groups performed an
additional battery at 00:00 h and 02:00 h to occupy their
additional time awake. The PVT and SSS were administered in
this battery; however, as data from the 00:00 and 02:00 h
sessions were not common to all TIB groups, these data were
not included in the statistical analyses reported below.
Statistical analyses
The PVT, SLT, and SSS data were analysed using a mixed
analysis of variance (anova) for TIB group (3-, 5-, 7-, or 9-h),
day (B, E1, E2, E3, E4, E5, E6, E7, R1, R2, and R3), and
time of day [09:00, 12:00, 15:00, and 21:00 h for PVT and
SSS; 09:30 and 15:40 h for multiple sleep latency test
(MSLT)] with repeated measures on the latter two factors.
The time of day factor was included to help determine
whether sleep group-specific changes across days were medi-
ated by phase shifts in the circadian rhythm of performance,
and to help determine whether sleep restriction effects were
primarily manifested at particular times of day. These
possibilities would be suggested by a three-way Sleep
Group · Day · Time of Day interaction. Therefore, in
results reported below, only significant three-way interactions
are reported (two-way interactions and main effects for time
of day are not reported). Night-time sleep data were analysed
using a two-way mixed anova for TIB group and day, with
repeated measures on the day factor. Procedures outlined by
Kirk (1995) were followed for interpretation of interactions –
first, simple main effects analyses were applied to all
significant Sleep Group–Day interactions (i.e. simple main
effects of day separately for each sleep group, and simple
main effects of sleep group separately for each day). Next,
post hoc comparisons (Tukey’s Honestly Significant Differ-
ence procedure or !HSD" – Kirk 1995) were conducted for
each significant simple main effect to specify differences
among mean values. Greenhouse–Geisser corrections (Kirk
1995) were applied to all repeated measures effects. Unless
otherwise noted, a significance level of P £ 0.05 was used for
all statistical analyses.
RESULTS
Due to technical difficulties, one or more sessions of PVT
performance data were lost for some subjects from each sleep
group. The final n for each sleep group and demographic data
are reported in Table 1. Neither the distribution of females and
males (chi-square analyses) nor the mean age (one-way
analyses of variance) differed among TIB groups (both
analyses P > 0.05).
Night-time sleep
Total sleep time
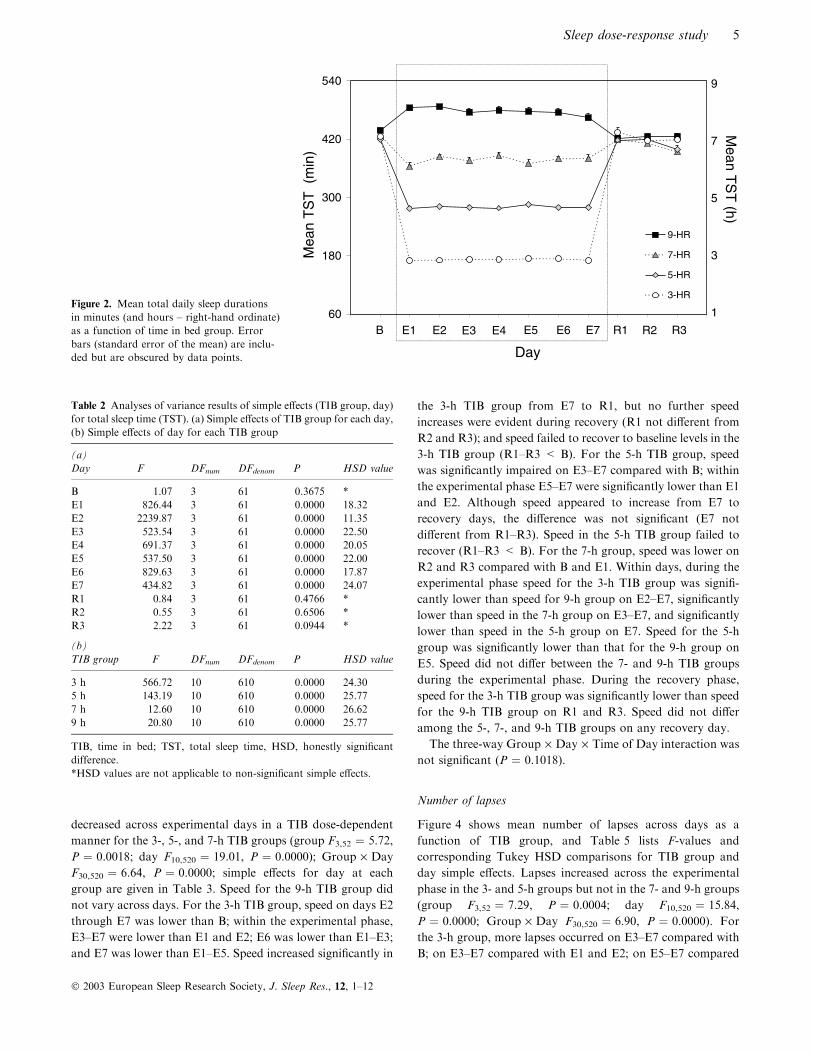
Figure 2 shows mean TST (TST ¼ sum of stages 1, 2, SWS and
REM) for each group across B, E1–E7, and R1–R3. TST
increased significantly in the 9-h group and decreased signifi-
cantly in the 3-, 5- and 7-h groups across the sleep restric-
tion ⁄ augmentation phase (E1–E7) compared with baseline (B)
(group, F3,61 ¼ 486.53, P ¼ 0.0000; night, F10,610 ¼ 281.10,
P ¼ 0.0000; Group · Night, F(30, 610) ¼ 141.83, P ¼ 0.0000).
Average TST over the 7 days of sleep restriction ⁄ augmentation
were 7.93 h for the 9-h TIB group, 6.28 h for the 7-h TIB group,
4.66 h for the 5-h TIB group, and 2.87 h for the 3-h TIB group.
Table 2 lists F-values and corresponding Tukey HSD
comparisons for group and day simple effects. TST signifi-
cantly differed among all TIB groups on nights E1–E7 but not
on B or R1–R3. Within each TIB group, nightly sleep amounts
did not change across E1–E7. For all groups, TST amounts
appeared to return to baseline values during recovery, i.e.
B was not different from R1–R3 for any group.
Sleep stages
Amounts of stage 1, 2 and REM sleep changed in a dose-
dependent fashion during the experimental phase (E1–E7);
stages 1, 2, and REM significantly decreased in the 3- and 5-h
TIB groups while stages REM and 1 significantly increased in
the 9-h TIB group (group simple effects, P < 0.05). Amounts
of stages 1 and 2 also decreased in the 7-h TIB group, albeit
non-significantly (P > 0.05). Sleep stage amounts returned to
baseline values during recovery for all groups (B not different
from R1–R3; Tukey HSD, P > 0.05). There were no group
differences on B or R1–R3 (group simple effects, P > 0.05).
The SWS amounts failed to vary significantly across experi-
mental days as a function of TIB group (P > 0.05).
Psychomotor vigilance test
Mean speed
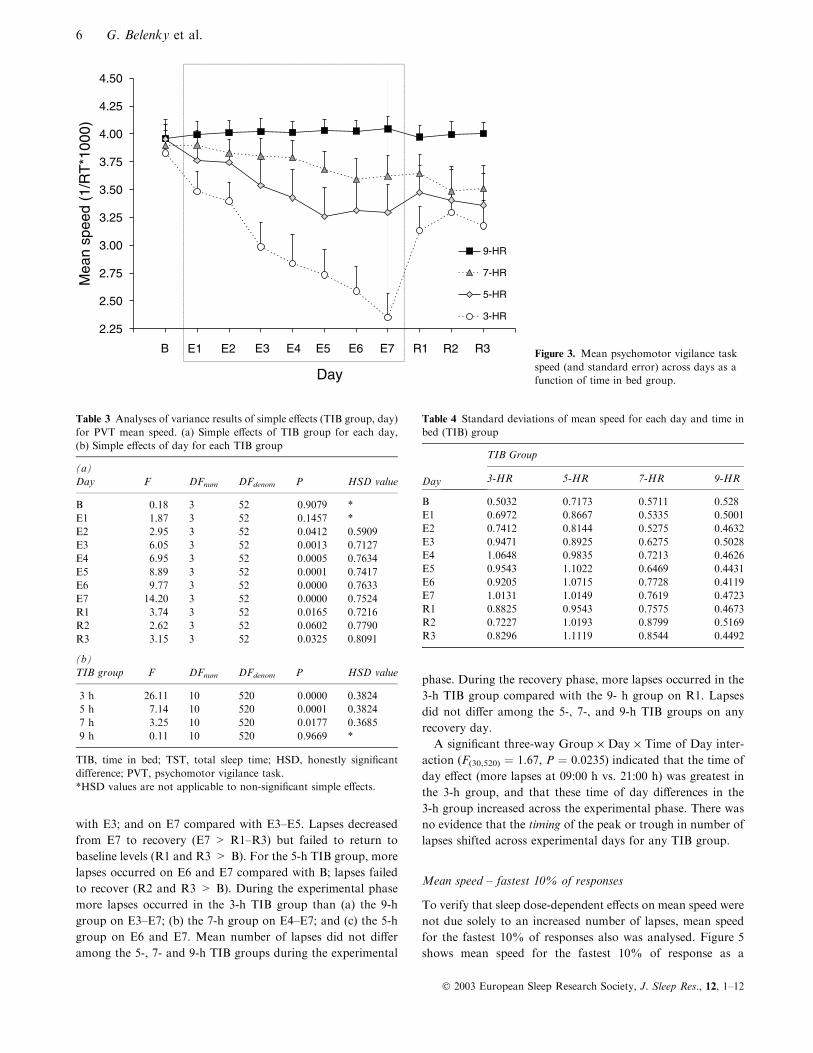
Figure 3 shows mean PVT response speed {[1 ⁄mean reaction
time (RT)] · 1000} as a function of TIB group and day
(collapsed across time of day), and Table 3 lists F-values and
corresponding Tukey HSD comparisons for TIB group and
day simple effects. Table 4 lists standard deviations for mean
speed as a function of day and TIB group. Response speed
Table 1 Demographic data for each time in bed (TIB) group
TIB groupNo. of females ⁄mean age (year)
No. of males ⁄mean age (year)
3 h (n ¼ 13) 5 ⁄ 39.2 8 ⁄ 39.65 h (n ¼ 13) 2 ⁄ 45.5 11 ⁄ 32.57 h (n ¼ 14) 4 ⁄ 43.8 10 ⁄ 38.69 h (n ¼ 16) 4 ⁄ 47.0 12 ⁄ 37.4
4 G. Belenky et al.
! 2003 European Sleep Research Society, J. Sleep Res., 12, 1–12
decreased across experimental days in a TIB dose-dependent
manner for the 3-, 5-, and 7-h TIB groups (group F3,52 ¼ 5.72,
P ¼ 0.0018; day F10,520 ¼ 19.01, P ¼ 0.0000); Group · Day
F30,520 ¼ 6.64, P ¼ 0.0000; simple effects for day at each
group are given in Table 3. Speed for the 9-h TIB group did
not vary across days. For the 3-h TIB group, speed on days E2
through E7 was lower than B; within the experimental phase,
E3–E7 were lower than E1 and E2; E6 was lower than E1–E3;
and E7 was lower than E1–E5. Speed increased significantly in
the 3-h TIB group from E7 to R1, but no further speed
increases were evident during recovery (R1 not different from
R2 and R3); and speed failed to recover to baseline levels in the
3-h TIB group (R1–R3 < B). For the 5-h TIB group, speed
was significantly impaired on E3–E7 compared with B; within
the experimental phase E5–E7 were significantly lower than E1
and E2. Although speed appeared to increase from E7 to
recovery days, the difference was not significant (E7 not
different from R1–R3). Speed in the 5-h TIB group failed to
recover (R1–R3 < B). For the 7-h group, speed was lower on
R2 and R3 compared with B and E1. Within days, during the
experimental phase speed for the 3-h TIB group was signifi-
cantly lower than speed for 9-h group on E2–E7, significantly
lower than speed in the 7-h group on E3–E7, and significantly
lower than speed in the 5-h group on E7. Speed for the 5-h
group was significantly lower than that for the 9-h group on
E5. Speed did not differ between the 7- and 9-h TIB groups
during the experimental phase. During the recovery phase,
speed for the 3-h TIB group was significantly lower than speed
for the 9-h TIB group on R1 and R3. Speed did not differ
among the 5-, 7-, and 9-h TIB groups on any recovery day.
The three-way Group · Day · Time of Day interaction was
not significant (P ¼ 0.1018).
Number of lapses
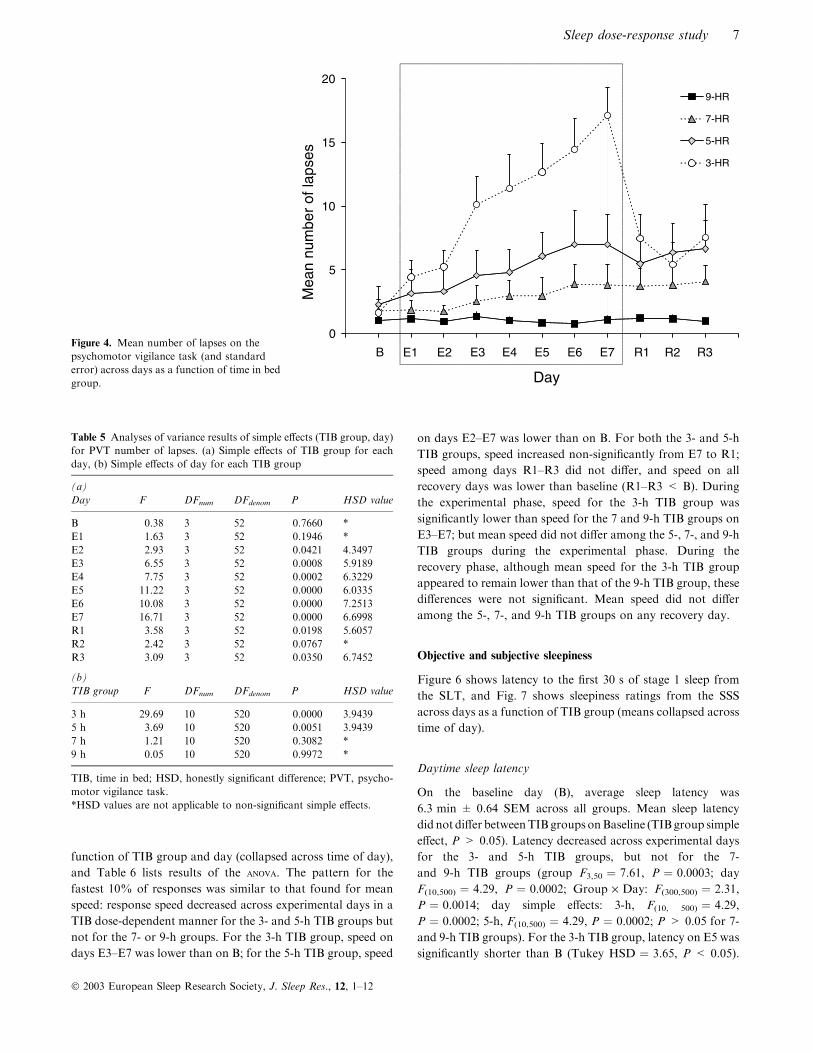
Figure 4 shows mean number of lapses across days as a
function of TIB group, and Table 5 lists F-values and
corresponding Tukey HSD comparisons for TIB group and
day simple effects. Lapses increased across the experimental
phase in the 3- and 5-h groups but not in the 7- and 9-h groups
(group F3,52 ¼ 7.29, P ¼ 0.0004; day F10,520 ¼ 15.84,
P ¼ 0.0000; Group · Day F30,520 ¼ 6.90, P ¼ 0.0000). For
the 3-h group, more lapses occurred on E3–E7 compared with
B; on E3–E7 compared with E1 and E2; on E5–E7 compared
60
180
300
420
540
9-HR
7-HR
5-HR
3-HR
Mea
n T
ST
(m
in)
Mean T
ST
(h)
Day
9
7
5
3
1B E1 E2 E3 E4 E5 E6 E7 R1 R2 R3
Figure 2. Mean total daily sleep durationsin minutes (and hours – right-hand ordinate)as a function of time in bed group. Errorbars (standard error of the mean) are inclu-ded but are obscured by data points.
Table 2 Analyses of variance results of simple effects (TIB group, day)for total sleep time (TST). (a) Simple effects of TIB group for each day,(b) Simple effects of day for each TIB group
(a)Day F DFnum DFdenom P HSD value
B 1.07 3 61 0.3675 *E1 826.44 3 61 0.0000 18.32E2 2239.87 3 61 0.0000 11.35E3 523.54 3 61 0.0000 22.50E4 691.37 3 61 0.0000 20.05E5 537.50 3 61 0.0000 22.00E6 829.63 3 61 0.0000 17.87E7 434.82 3 61 0.0000 24.07R1 0.84 3 61 0.4766 *R2 0.55 3 61 0.6506 *R3 2.22 3 61 0.0944 *
(b)TIB group F DFnum DFdenom P HSD value
3 h 566.72 10 610 0.0000 24.305 h 143.19 10 610 0.0000 25.777 h 12.60 10 610 0.0000 26.629 h 20.80 10 610 0.0000 25.77
TIB, time in bed; TST, total sleep time, HSD, honestly significantdifference.*HSD values are not applicable to non-significant simple effects.
Sleep dose-response study 5
! 2003 European Sleep Research Society, J. Sleep Res., 12, 1–12
with E3; and on E7 compared with E3–E5. Lapses decreased
from E7 to recovery (E7 > R1–R3) but failed to return to
baseline levels (R1 and R3 > B). For the 5-h TIB group, more
lapses occurred on E6 and E7 compared with B; lapses failed
to recover (R2 and R3 > B). During the experimental phase
more lapses occurred in the 3-h TIB group than (a) the 9-h
group on E3–E7; (b) the 7-h group on E4–E7; and (c) the 5-h
group on E6 and E7. Mean number of lapses did not differ
among the 5-, 7- and 9-h TIB groups during the experimental
phase. During the recovery phase, more lapses occurred in the
3-h TIB group compared with the 9- h group on R1. Lapses
did not differ among the 5-, 7-, and 9-h TIB groups on any
recovery day.
A significant three-way Group · Day · Time of Day inter-
action (F(30,520) ¼ 1.67, P ¼ 0.0235) indicated that the time of
day effect (more lapses at 09:00 h vs. 21:00 h) was greatest in
the 3-h group, and that these time of day differences in the
3-h group increased across the experimental phase. There was
no evidence that the timing of the peak or trough in number of
lapses shifted across experimental days for any TIB group.
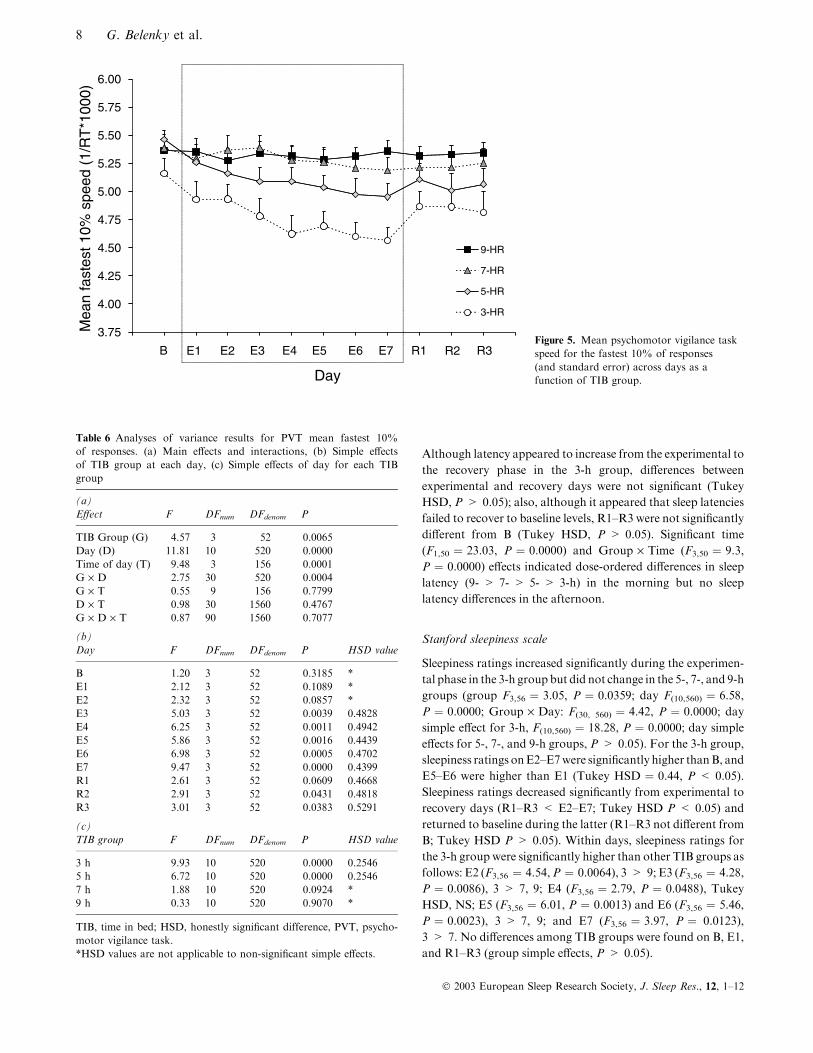
Mean speed – fastest 10% of responses
To verify that sleep dose-dependent effects on mean speed were
not due solely to an increased number of lapses, mean speed
for the fastest 10% of responses also was analysed. Figure 5
shows mean speed for the fastest 10% of response as a
2.25
2.50
2.75
3.00
3.25
3.50
3.75
4.00
4.25
4.50
9-HR
7-HR
5-HR
3-HR
Mea
n sp
eed
(1/R
T*1
000)
Day
B E1 E2 E3 E4 E5 E6 E7 R1 R2 R3 Figure 3. Mean psychomotor vigilance taskspeed (and standard error) across days as afunction of time in bed group.
Table 3 Analyses of variance results of simple effects (TIB group, day)for PVT mean speed. (a) Simple effects of TIB group for each day,(b) Simple effects of day for each TIB group
(a)Day F DFnum DFdenom P HSD value
B 0.18 3 52 0.9079 *E1 1.87 3 52 0.1457 *E2 2.95 3 52 0.0412 0.5909E3 6.05 3 52 0.0013 0.7127E4 6.95 3 52 0.0005 0.7634E5 8.89 3 52 0.0001 0.7417E6 9.77 3 52 0.0000 0.7633E7 14.20 3 52 0.0000 0.7524R1 3.74 3 52 0.0165 0.7216R2 2.62 3 52 0.0602 0.7790R3 3.15 3 52 0.0325 0.8091
(b)TIB group F DFnum DFdenom P HSD value
3 h 26.11 10 520 0.0000 0.38245 h 7.14 10 520 0.0001 0.38247 h 3.25 10 520 0.0177 0.36859 h 0.11 10 520 0.9669 *
TIB, time in bed; TST, total sleep time; HSD, honestly significantdifference; PVT, psychomotor vigilance task.*HSD values are not applicable to non-significant simple effects.
Table 4 Standard deviations of mean speed for each day and time inbed (TIB) group
Day
TIB Group
3-HR 5-HR 7-HR 9-HR
B 0.5032 0.7173 0.5711 0.528E1 0.6972 0.8667 0.5335 0.5001E2 0.7412 0.8144 0.5275 0.4632E3 0.9471 0.8925 0.6275 0.5028E4 1.0648 0.9835 0.7213 0.4626E5 0.9543 1.1022 0.6469 0.4431E6 0.9205 1.0715 0.7728 0.4119E7 1.0131 1.0149 0.7619 0.4723R1 0.8825 0.9543 0.7575 0.4673R2 0.7227 1.0193 0.8799 0.5169R3 0.8296 1.1119 0.8544 0.4492
6 G. Belenky et al.
! 2003 European Sleep Research Society, J. Sleep Res., 12, 1–12
function of TIB group and day (collapsed across time of day),
and Table 6 lists results of the anova. The pattern for the
fastest 10% of responses was similar to that found for mean
speed: response speed decreased across experimental days in a
TIB dose-dependent manner for the 3- and 5-h TIB groups but
not for the 7- or 9-h groups. For the 3-h TIB group, speed on
days E3–E7 was lower than on B; for the 5-h TIB group, speed
on days E2–E7 was lower than on B. For both the 3- and 5-h
TIB groups, speed increased non-significantly from E7 to R1;
speed among days R1–R3 did not differ, and speed on all
recovery days was lower than baseline (R1–R3 < B). During
the experimental phase, speed for the 3-h TIB group was
significantly lower than speed for the 7 and 9-h TIB groups on
E3–E7; but mean speed did not differ among the 5-, 7-, and 9-h
TIB groups during the experimental phase. During the
recovery phase, although mean speed for the 3-h TIB group
appeared to remain lower than that of the 9-h TIB group, these
differences were not significant. Mean speed did not differ
among the 5-, 7-, and 9-h TIB groups on any recovery day.
Objective and subjective sleepiness
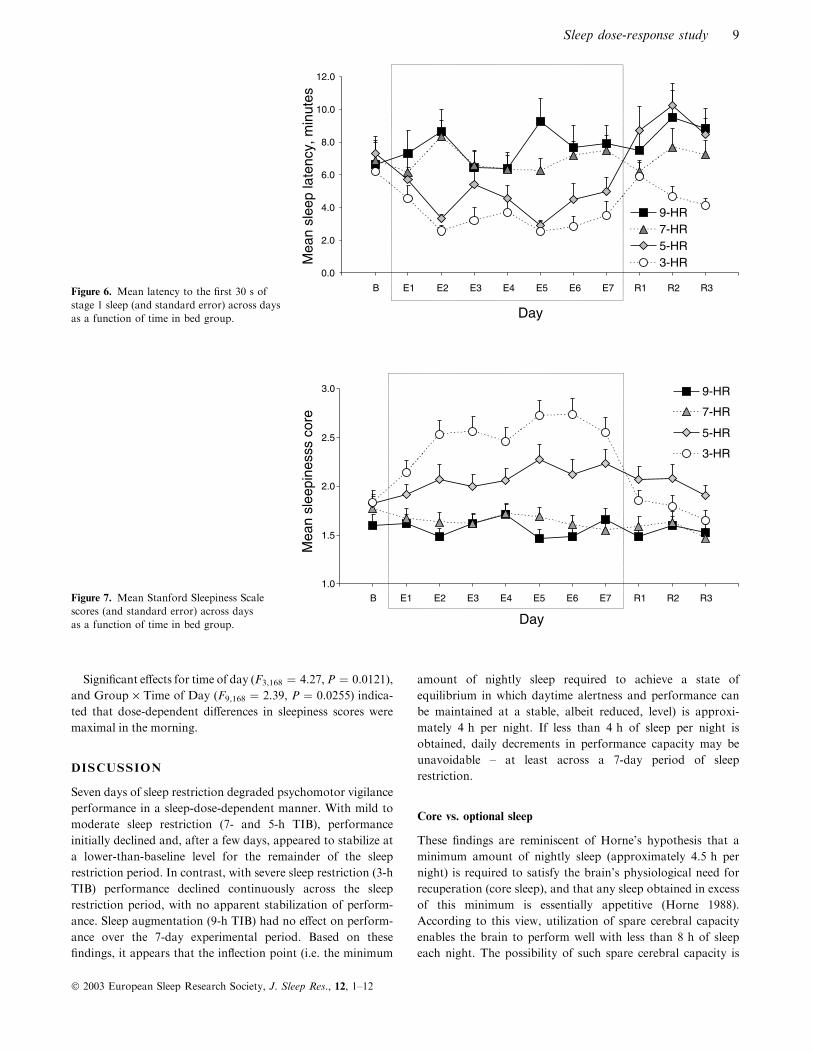
Figure 6 shows latency to the first 30 s of stage 1 sleep from
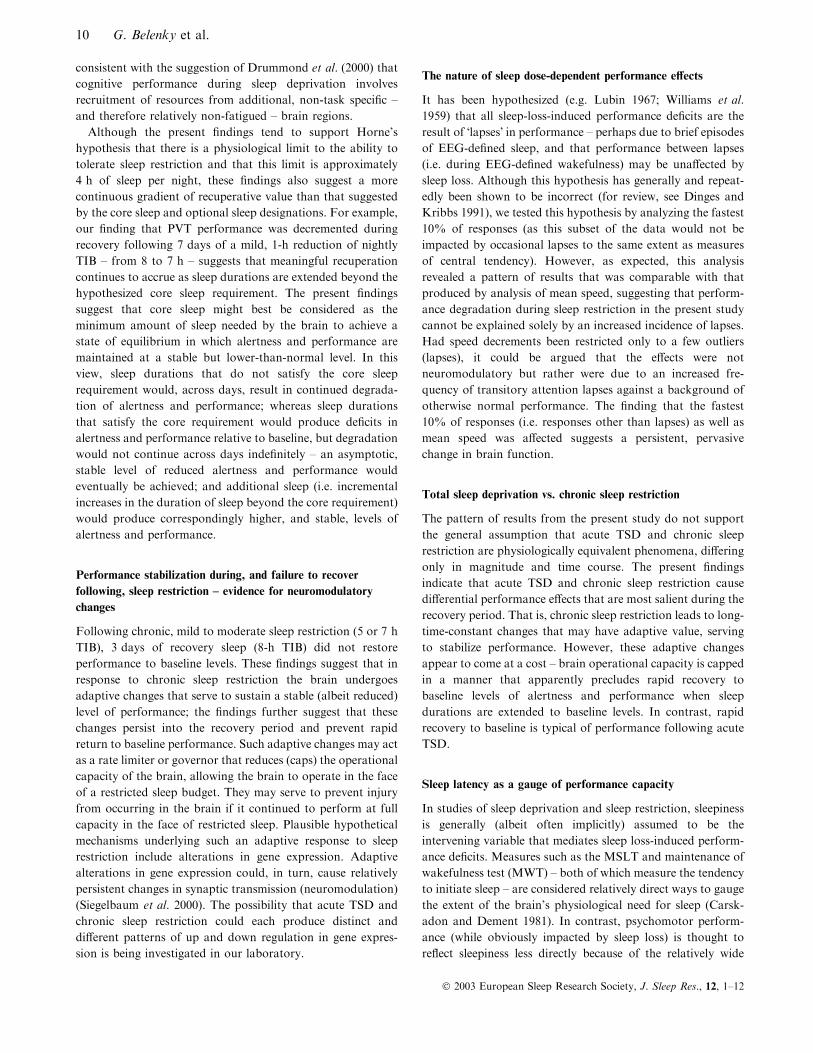
the SLT, and Fig. 7 shows sleepiness ratings from the SSS
across days as a function of TIB group (means collapsed across
time of day).
Daytime sleep latency
On the baseline day (B), average sleep latency was
6.3 min ± 0.64 SEM across all groups. Mean sleep latency
did not differ betweenTIBgroups onBaseline (TIBgroup simple
effect, P > 0.05). Latency decreased across experimental days
for the 3- and 5-h TIB groups, but not for the 7-
and 9-h TIB groups (group F3,50 ¼ 7.61, P ¼ 0.0003; day
F(10,500) ¼ 4.29, P ¼ 0.0002; Group · Day: F(300,500) ¼ 2.31,
P ¼ 0.0014; day simple effects: 3-h, F(10, 500) ¼ 4.29,
P ¼ 0.0002; 5-h, F(10,500) ¼ 4.29, P ¼ 0.0002; P > 0.05 for 7-
and 9-h TIB groups). For the 3-h TIB group, latency on E5 was
significantly shorter than B (Tukey HSD ¼ 3.65, P < 0.05).
0
5
10
15
209-HR
7-HR
5-HR
3-HR
Mea
n nu
mbe
r of
laps
es
Day
B E1 E2 E3 E4 E5 E6 E7 R1 R2 R3Figure 4. Mean number of lapses on thepsychomotor vigilance task (and standarderror) across days as a function of time in bedgroup.
Table 5 Analyses of variance results of simple effects (TIB group, day)for PVT number of lapses. (a) Simple effects of TIB group for eachday, (b) Simple effects of day for each TIB group
(a)Day F DFnum DFdenom P HSD value
B 0.38 3 52 0.7660 *E1 1.63 3 52 0.1946 *E2 2.93 3 52 0.0421 4.3497E3 6.55 3 52 0.0008 5.9189E4 7.75 3 52 0.0002 6.3229E5 11.22 3 52 0.0000 6.0335E6 10.08 3 52 0.0000 7.2513E7 16.71 3 52 0.0000 6.6998R1 3.58 3 52 0.0198 5.6057R2 2.42 3 52 0.0767 *R3 3.09 3 52 0.0350 6.7452
(b)TIB group F DFnum DFdenom P HSD value
3 h 29.69 10 520 0.0000 3.94395 h 3.69 10 520 0.0051 3.94397 h 1.21 10 520 0.3082 *9 h 0.05 10 520 0.9972 *
TIB, time in bed; HSD, honestly significant difference; PVT, psycho-motor vigilance task.*HSD values are not applicable to non-significant simple effects.
Sleep dose-response study 7
! 2003 European Sleep Research Society, J. Sleep Res., 12, 1–12
Although latency appeared to increase from the experimental to
the recovery phase in the 3-h group, differences between
experimental and recovery days were not significant (Tukey
HSD, P > 0.05); also, although it appeared that sleep latencies
failed to recover to baseline levels, R1–R3 were not significantly
different from B (Tukey HSD, P > 0.05). Significant time
(F1,50 ¼ 23.03, P ¼ 0.0000) and Group · Time (F3,50 ¼ 9.3,
P ¼ 0.0000) effects indicated dose-ordered differences in sleep
latency (9- > 7- > 5- > 3-h) in the morning but no sleep
latency differences in the afternoon.
Stanford sleepiness scale
Sleepiness ratings increased significantly during the experimen-
tal phase in the 3-h group but did not change in the 5-, 7-, and 9-h
groups (group F3,56 ¼ 3.05, P ¼ 0.0359; day F(10,560) ¼ 6.58,
P ¼ 0.0000; Group · Day: F(30, 560) ¼ 4.42, P ¼ 0.0000; day
simple effect for 3-h, F(10,560) ¼ 18.28, P ¼ 0.0000; day simple
effects for 5-, 7-, and 9-h groups, P > 0.05). For the 3-h group,
sleepiness ratings onE2–E7were significantly higher thanB, and
E5–E6 were higher than E1 (Tukey HSD ¼ 0.44, P < 0.05).
Sleepiness ratings decreased significantly from experimental to
recovery days (R1–R3 < E2–E7; Tukey HSD P < 0.05) and
returned to baseline during the latter (R1–R3 not different from
B; Tukey HSD P > 0.05). Within days, sleepiness ratings for
the 3-h group were significantly higher than other TIB groups as
follows: E2 (F3,56 ¼ 4.54,P ¼ 0.0064), 3 > 9; E3 (F3,56 ¼ 4.28,
P ¼ 0.0086), 3 > 7, 9; E4 (F3,56 ¼ 2.79, P ¼ 0.0488), Tukey
HSD, NS; E5 (F3,56 ¼ 6.01, P ¼ 0.0013) and E6 (F3,56 ¼ 5.46,
P ¼ 0.0023), 3 > 7, 9; and E7 (F3,56 ¼ 3.97, P ¼ 0.0123),
3 > 7. No differences among TIB groups were found on B, E1,
and R1–R3 (group simple effects, P > 0.05).
3.75
4.00
4.25
4.50
4.75
5.00
5.25
5.50
5.75
6.00
9-HR
7-HR
5-HR
3-HR
Mea
n fa
stes
t 10%
spe
ed (
1/R
T*1
000)
Day
B E1 E2 E3 E4 E5 E6 E7 R1 R2 R3Figure 5. Mean psychomotor vigilance taskspeed for the fastest 10% of responses(and standard error) across days as afunction of TIB group.
Table 6 Analyses of variance results for PVT mean fastest 10%of responses. (a) Main effects and interactions, (b) Simple effectsof TIB group at each day, (c) Simple effects of day for each TIBgroup
(a)Effect F DFnum DFdenom P
TIB Group (G) 4.57 3 52 0.0065Day (D) 11.81 10 520 0.0000Time of day (T) 9.48 3 156 0.0001G · D 2.75 30 520 0.0004G · T 0.55 9 156 0.7799D · T 0.98 30 1560 0.4767G · D · T 0.87 90 1560 0.7077
(b)Day F DFnum DFdenom P HSD value
B 1.20 3 52 0.3185 *E1 2.12 3 52 0.1089 *E2 2.32 3 52 0.0857 *E3 5.03 3 52 0.0039 0.4828E4 6.25 3 52 0.0011 0.4942E5 5.86 3 52 0.0016 0.4439E6 6.98 3 52 0.0005 0.4702E7 9.47 3 52 0.0000 0.4399R1 2.61 3 52 0.0609 0.4668R2 2.91 3 52 0.0431 0.4818R3 3.01 3 52 0.0383 0.5291
(c)TIB group F DFnum DFdenom P HSD value
3 h 9.93 10 520 0.0000 0.25465 h 6.72 10 520 0.0000 0.25467 h 1.88 10 520 0.0924 *9 h 0.33 10 520 0.9070 *
TIB, time in bed; HSD, honestly significant difference, PVT, psycho-motor vigilance task.*HSD values are not applicable to non-significant simple effects.
8 G. Belenky et al.
! 2003 European Sleep Research Society, J. Sleep Res., 12, 1–12
Significant effects for time of day (F3,168 ¼ 4.27,P ¼ 0.0121),
and Group · Time of Day (F9,168 ¼ 2.39, P ¼ 0.0255) indica-
ted that dose-dependent differences in sleepiness scores were
maximal in the morning.
DISCUSSION
Seven days of sleep restriction degraded psychomotor vigilance
performance in a sleep-dose-dependent manner. With mild to
moderate sleep restriction (7- and 5-h TIB), performance
initially declined and, after a few days, appeared to stabilize at
a lower-than-baseline level for the remainder of the sleep
restriction period. In contrast, with severe sleep restriction (3-h
TIB) performance declined continuously across the sleep
restriction period, with no apparent stabilization of perform-
ance. Sleep augmentation (9-h TIB) had no effect on perform-
ance over the 7-day experimental period. Based on these
findings, it appears that the inflection point (i.e. the minimum
amount of nightly sleep required to achieve a state of
equilibrium in which daytime alertness and performance can
be maintained at a stable, albeit reduced, level) is approxi-
mately 4 h per night. If less than 4 h of sleep per night is
obtained, daily decrements in performance capacity may be
unavoidable – at least across a 7-day period of sleep
restriction.
Core vs. optional sleep
These findings are reminiscent of Horne’s hypothesis that a
minimum amount of nightly sleep (approximately 4.5 h per
night) is required to satisfy the brain’s physiological need for
recuperation (core sleep), and that any sleep obtained in excess
of this minimum is essentially appetitive (Horne 1988).
According to this view, utilization of spare cerebral capacity
enables the brain to perform well with less than 8 h of sleep
each night. The possibility of such spare cerebral capacity is
Mea
n sl
eep
late
ncy,
min
utes
Day
0.0
2.0
4.0
6.0
8.0
10.0
12.0
9-HR7-HR5-HR3-HR
B E1 E2 E3 E4 E5 E6 E7 R1 R2 R3Figure 6. Mean latency to the first 30 s ofstage 1 sleep (and standard error) across daysas a function of time in bed group.
Mea
n sl
eepi
ness
s co
re
Day
1.0
1.5
2.0
2.5
3.0
B E1 E2 E3 E4 E5 E6 E7 R1 R2 R3
9-HR
7-HR
5-HR
3-HR
Figure 7. Mean Stanford Sleepiness Scalescores (and standard error) across daysas a function of time in bed group.
Sleep dose-response study 9
! 2003 European Sleep Research Society, J. Sleep Res., 12, 1–12
consistent with the suggestion of Drummond et al. (2000) that
cognitive performance during sleep deprivation involves
recruitment of resources from additional, non-task specific –
and therefore relatively non-fatigued – brain regions.
Although the present findings tend to support Horne’s
hypothesis that there is a physiological limit to the ability to
tolerate sleep restriction and that this limit is approximately
4 h of sleep per night, these findings also suggest a more
continuous gradient of recuperative value than that suggested
by the core sleep and optional sleep designations. For example,
our finding that PVT performance was decremented during
recovery following 7 days of a mild, 1-h reduction of nightly
TIB – from 8 to 7 h – suggests that meaningful recuperation
continues to accrue as sleep durations are extended beyond the
hypothesized core sleep requirement. The present findings
suggest that core sleep might best be considered as the
minimum amount of sleep needed by the brain to achieve a
state of equilibrium in which alertness and performance are
maintained at a stable but lower-than-normal level. In this
view, sleep durations that do not satisfy the core sleep
requirement would, across days, result in continued degrada-
tion of alertness and performance; whereas sleep durations
that satisfy the core requirement would produce deficits in
alertness and performance relative to baseline, but degradation
would not continue across days indefinitely – an asymptotic,
stable level of reduced alertness and performance would
eventually be achieved; and additional sleep (i.e. incremental
increases in the duration of sleep beyond the core requirement)
would produce correspondingly higher, and stable, levels of
alertness and performance.
Performance stabilization during, and failure to recover
following, sleep restriction – evidence for neuromodulatory
changes
Following chronic, mild to moderate sleep restriction (5 or 7 h
TIB), 3 days of recovery sleep (8-h TIB) did not restore
performance to baseline levels. These findings suggest that in
response to chronic sleep restriction the brain undergoes
adaptive changes that serve to sustain a stable (albeit reduced)
level of performance; the findings further suggest that these
changes persist into the recovery period and prevent rapid
return to baseline performance. Such adaptive changes may act
as a rate limiter or governor that reduces (caps) the operational
capacity of the brain, allowing the brain to operate in the face
of a restricted sleep budget. They may serve to prevent injury
from occurring in the brain if it continued to perform at full
capacity in the face of restricted sleep. Plausible hypothetical
mechanisms underlying such an adaptive response to sleep
restriction include alterations in gene expression. Adaptive
alterations in gene expression could, in turn, cause relatively
persistent changes in synaptic transmission (neuromodulation)
(Siegelbaum et al. 2000). The possibility that acute TSD and
chronic sleep restriction could each produce distinct and
different patterns of up and down regulation in gene expres-
sion is being investigated in our laboratory.
The nature of sleep dose-dependent performance effects
It has been hypothesized (e.g. Lubin 1967; Williams et al.
1959) that all sleep-loss-induced performance deficits are the
result of !lapses" in performance – perhaps due to brief episodes
of EEG-defined sleep, and that performance between lapses
(i.e. during EEG-defined wakefulness) may be unaffected by
sleep loss. Although this hypothesis has generally and repeat-
edly been shown to be incorrect (for review, see Dinges and
Kribbs 1991), we tested this hypothesis by analyzing the fastest
10% of responses (as this subset of the data would not be
impacted by occasional lapses to the same extent as measures
of central tendency). However, as expected, this analysis
revealed a pattern of results that was comparable with that
produced by analysis of mean speed, suggesting that perform-
ance degradation during sleep restriction in the present study
cannot be explained solely by an increased incidence of lapses.
Had speed decrements been restricted only to a few outliers
(lapses), it could be argued that the effects were not
neuromodulatory but rather were due to an increased fre-
quency of transitory attention lapses against a background of
otherwise normal performance. The finding that the fastest
10% of responses (i.e. responses other than lapses) as well as
mean speed was affected suggests a persistent, pervasive
change in brain function.
Total sleep deprivation vs. chronic sleep restriction
The pattern of results from the present study do not support
the general assumption that acute TSD and chronic sleep
restriction are physiologically equivalent phenomena, differing
only in magnitude and time course. The present findings
indicate that acute TSD and chronic sleep restriction cause
differential performance effects that are most salient during the
recovery period. That is, chronic sleep restriction leads to long-
time-constant changes that may have adaptive value, serving
to stabilize performance. However, these adaptive changes
appear to come at a cost – brain operational capacity is capped
in a manner that apparently precludes rapid recovery to
baseline levels of alertness and performance when sleep
durations are extended to baseline levels. In contrast, rapid
recovery to baseline is typical of performance following acute
TSD.
Sleep latency as a gauge of performance capacity
In studies of sleep deprivation and sleep restriction, sleepiness
is generally (albeit often implicitly) assumed to be the
intervening variable that mediates sleep loss-induced perform-
ance deficits. Measures such as the MSLT and maintenance of
wakefulness test (MWT) – both of which measure the tendency
to initiate sleep – are considered relatively direct ways to gauge
the extent of the brain’s physiological need for sleep (Carsk-
adon and Dement 1981). In contrast, psychomotor perform-
ance (while obviously impacted by sleep loss) is thought to
reflect sleepiness less directly because of the relatively wide
10 G. Belenky et al.
! 2003 European Sleep Research Society, J. Sleep Res., 12, 1–12
array of additional, non-sleep-related factors known to impact
performance. Therefore, it is interesting to note that in the
present study TIB groups were more reliably distinguished by
PVT performance than by sleep latency scores. This may have
been due in part to sleep latency floor effects and ⁄or relativelyreduced statistical power (because SLTs were administered
half as often as PVTs). However, it may also have been due to
the fact that sleep latency scores were somewhat restricted,
with a mean sleep onset latency of 6.3 min (i.e. near the
pathological range) on the baseline day (despite spending 8 h
TIB on the previous three nights). This finding is consistent
with those of Harrison and Horne (1996) who reported that
sleep latencies for a large portion of their normal subjects were
within the pathological range – prompting them to hypothesize
that individuals vary considerably with respect to !sleepabil-ity" – the capacity to initiate sleep regardless of sleep need. A
crucial implication of these findings is that human perform-
ance capacity cannot be reliably inferred from sleep latency
data and as it is ultimately human performance capacity (not
tendency to initiate sleep) that determines safety and produc-
tivity in the operational environment as well as quality of life
for sleep disordered patients, greater efforts to define fitness for
duty and severity of sleep-related disorders on the basis of
measured performance capacity are warranted.
Implications for modeling and performance prediction
Extant mathematical models predicting alertness and perform-
ance from preceding sleep–wake history typically involve three
factors – sleep homeostasis, circadian rhythm, and sleep inertia
(Akerstedt and Folkard 1997). These three-factor models are
relatively successful in predicting the effects of acute TSD on
alertness and performance and the time course of subsequent
recovery. They are less successful in predicting the effects of
chronic sleep restriction on alertness and performance and the
time course of subsequent recovery (Van Dongen and Dinges
2002; Van Dongen et al. 2002). It appears that this failure
cannot be remedied by better model parameterization. Rather,
this failure likely represents a basic structural inadequacy of
three-factor models in predicting the effects of chronic sleep
restriction. The present findings suggest that incorporation of
a fourth factor would substantially improve prediction – a
factor (presumably reflecting neuromodulatory changes) rep-
resenting slow (days, weeks) adaptation to chronic sleep
restriction and slow de-adaptation following restoration of
normal sleep amounts.
Is there an !optimum" sleep amount?
With respect to the question of what constitutes optimum
sleep, our findings that performance tracked sleep in a dose-
dependent manner across the range of sleep restriction ⁄ aug-mentation suggests that humans benefit from progressively
greater nightly amounts of sleep (although the amount of
benefit accrued with progressively greater sleep amounts may
be asymptotic; Harrison and Horne 1995). Future work will
replicate and extend these and other findings in chronic sleep
restriction, describe the time course of performance degrada-
tion and recovery in both acute TSD and chronic sleep
restriction, and characterize individual differences in tolerance
to sleep deprivation and sleep restriction. The present results
highlight the need for careful attention to the sleep–wake
history of subjects for the weeks (or even months) preceding
the actual experimental observations. Further studies of sleep
restriction will facilitate the development of mathematical
models with greater power and generality for the prediction of
alertness and performance based on sleep–wake history.
ACKNOWLEDGMENTS
This work was supported by the US Army Medical Research
and Materiel Command and the US Department of Trans-
portation (Contract ⁄Grant No. DTFH61-94-Y-00090). We
thank Ms Deborah Freund and Mr Neill Thomas of the US
Department of Transportation for their support of this work
and the staff of the General Clinical Research Center, Johns
Hopkins University School of Medicine, Bayview Campus, for
providing a continuously staffed 24-h per day venue for this
study. We thank the two anonymous reviewers for their
thoughtful and constructive comments on this paper.
This material has been reviewed by the Walter Reed Army
Institute of Research, and there is no objection to its
presentation and ⁄or publication. The opinions or assertions
contained herein are the private views of the authors and are
not to be construed as official or as reflecting the position of
the Department of the Army or the Department of Defense.
This study was approved by the Walter Reed Army Institute of
Research Human Use Committee and the United States Army
Medical Research and Materiel Command Human Subjects
Review Board of the Army Surgeon General and was
performed in accordance with the ethical standards laid down
in the 1964 Declaration of Helsinki.
REFERENCES
Achermann, P., Dijk, D. J., Brunner, D. P. and Borbely, A. A.A model of human sleep homeostasis based on EEG slow-waveactivity: quantatative comparison of data and simulations. BrainRes. Bull., 1993, 31: 91–113.
Akerstedt, T. and Folkard, S. Predicting duration of sleep from thethree-process model of alertness regulation. Occup. Environ. Med.,1996, 53: 136–141.
Akerstedt, T. and Folkard, S. Validation of the S and C components ofthe three-process model of alertness regulation. Sleep, 1995, 18: 1–6.
Akerstedt. T. and Folkard, S. The three-process model of alertness andits extension to performance, sleep latency, and sleep length.Chronobiol. Int., 1997, 14: 115–123.
Balkin, T., Thorne, D., Sing, H., Thomas, M., Redmond, D.,Wesensten, N., Russo, M., Williams, J., Hall, S. and Belenky, G.Effects of Sleep Schedules on Commercial Motor Vehicle DriverPerformance. Report MC-00–133, National Technical InformationService, U.S. Department of Transportation, Springfield, VA, 2000.
Bliwise, D. L., King, A. C., Harris, R. B. and Haskell, W. L.Prevalence of self-reported poor sleep in a healthy population aged50–65. Soc. Sci. Med., 1992, 34: 49–55.
Sleep dose-response study 11
! 2003 European Sleep Research Society, J. Sleep Res., 12, 1–12
Bonnet, M. H. and Arand, D. L. We are chronically sleep deprived.Sleep, 1995, 18: 908–911.
Borbely, A. A., Achermann, P., Trachsel, L. and Tobler, I.A two-process model of sleep regulation. Hum. Neurobiol., 1982,1: 195–204.
Borbely, A. A. et al. Sleep initiation and initial sleep intensity:interactions of homeostatic and circadian mechanism. J. Biol.Rhythms., 1989, 4: 149–160.
Carskadon, M. A. and Dement, W. C. Cumulative effects of sleeprestriction on daytime sleepiness. Psychophysiology, 1981, 18: 107–113.
Coren, S. Sleep Thieves. Free Press, New York, 1997.Dinges, D. F. and Kribbs, N. B. Performing while sleepy: effects of
experimentally-induced sleepiness. In: T. H. Monk (Eds) Sleep,Sleepiness, and Performance. John Wiley & Sons, Chichester, UK,1991: 97–128.
Dinges, D. F., Maislin, G., Kuo, A., Carlin, M. M., Powell, J. W., VanDongen, H. and Mullington, J. Chronic sleep restriction: neu-robehavioral effects of 4, 6 and 8 h TIB. Sleep, 1999, 22 (1 Suppl.):115.
Dinges, D. F., Pack, F., Williams, K., Gillen, K. A., Powell, J. W., Ott,G. E., Aptowica, C. and Pack, A. I. Cumulative sleepiness, mooddisturbance, and psychomotor vigilance performance decrementsduring a week of sleep restricted to 4–5 hours per night. Sleep, 1997,20: 267–277.
Dinges, D. F. and Powell, J. W. Microcomputer analyses of perform-ance on a portable, simple, visual RT task during sustainedoperations. Behav. Res. Meth. Instrum. Comput., 1985, 17: 652–655.
Drummond, S. P., Brown, C. G., Gillin, J. C., Stricker, J. L., Wong, E.C. and Buxton, R. B. Altered brain response to verbal learningfollowing sleep deprivation. Nature, 2000, 403: 655–657.
Folkard, S. and Akerstedt, T. A. Three-process model of the regulationof alertness and sleepiness. In: R. Ogilvie and R. Broughton (Eds)Sleep, Arousal and Performance: Problems and Promises. Birkhauser,Boston, 1991: 11–26.
Friedman, J., Globus, G., Huntley, A., Mullaney, P., Naitoh, P. andJohnson, L. Performance and mood during and after gradual sleepreduction. Psychophysiology, 1977, 14: 245–250.
Harrison, Y. and Horne, J. A. !High sleepability without sleepiness".The ability to fall asleep rapidly without other signs of sleepiness.Neurophysiol. Clin., 1996, 26: 15–20.
Harrison, Y. and Horne, J. A. Should we be taking more sleep? Sleep,1995, 18: 901–907.
Hoddes, E., Zarcone, V. P., Smythe, H., Phillips, R. and Dement, W.C. Quantification of sleepiness: a new approach. Psychophysiology,1973, 10: 431–436.
Horne, J. A.WhyWe Sleep. Oxford University Press, New York, 1988.Horne, J. A. and Wilkinson, S. Chronic sleep reduction: daytime
vigilance performance and EEG measures of sleepiness withparticular reference to !practice" effects. Psychophysiology, 1985,22: 69–78.
Jewett, M. E., Dijk, D. J., Kronauer, R. E. and Dinges, D. F.Dose–response relationship between sleep duration and humanpsychomotor vigilance and subjective alertness. Sleep, 1999, 22:171–179.
Jewett, M. E. and Kronauer, R. E. Interactive mathematical models ofsubjective alertness and cognitive throughout in humans. J. Biol.Rhythms, 1999, 14: 588–597.
Kirk, R. E. Experimental Design: Procedures for the BehavioralSciences, 3rd edn. Brooks ⁄Cole, Pacific Grove, California, 1995.
Kripke, D. F., Garfinkel, L., Wingard, D. L., Klauber, M. R. andMarler, M. R. Mortality associated with sleep duration andinsomnia. Arch. Gen. Psychiatry, 2002, 59: 137–138.
Kuo, A., Carlin, M., Powell, J. and Dinges, D. Chronic restriction ofsleep to 4 hours per night for 14 nights changes performance linearlybut not subjective sleepiness. Sleep, 1998, 21 (3 Suppl.): 241.
Leger, D. The cost of sleep-related accidents: a report for the. Natl.Commission Sleep Disord. Res. Sleep, 1994, 1994, 17: 84–93.
Lubin, A. Performance under sleep loss and fatigue. In: S. S. Kety, E.V. Evarts and H. L. Williams (Eds). Sleep and Altered States ofConsciousness. Williams & Wilkins, Baltimore, 1967: 506–513.
Mitler, M. M., Carskadon, M. A., Czeisler, C. A., Dement, W. C.,Dinges, D. F. and Graeber, R. C. Catastrophes, sleep, and publicpolicy. Consensus Rep. Sleep, 1988, 11: 100–109.
Mullaney, D. J., Johnson, L. C., Naitoh, P., Friedmann, J. K. andGlobus, G. G. Sleep during gradual sleep reduction. Psychophysi-ology, 1977, 14: 237–244.
National Sleep Foundation. Sleep in America Poll. http://www.sleep-foundation.org.
Palinkas, L. A., Suedfeld P. and Steel G. D. Psychological functioningamong members of a small polar expedition. Avia. Space Environ.Med., 1995, 66: 943–950.
Pilcher, J. J. and Huffcutt, A. I. Effects of sleep deprivation onperformance: a meta-analysis. Sleep, 1996, 19: 318–326.
Rechtschaffen, A. and Kales, A. A Manual of Standardized Techniquesand Scoring System for Sleep Stages of Human Subjects. BrainInformation Service and Brain Research Institute, Los Angeles, CA,1968.
Siegelbaum, S. A., Schwartz, J. H. and Kandel, E. R. Modulation ofsynaptic transmission: second messengers. In: E. R. Kandel, J. H.Schwarz and T. M. Jessell (Eds) Principles of Neural Science.McGraw-Hill, New York, NY, 2000: 229–252.
Spiegel, K., Leproult, R. and Van Cauter, E. Impact of sleep debt onmetabolic and endocrine function. Lancet, 1999, 354: 1435–1439.
Van Dongen, H. P. A. and Dinges, D. F. Chronic partial sleepdeprivation data point to a novel process regulating wakingbehavioural alertness. Sleep, 2002, 11 (Suppl. 1): 232.
Van Dongen, H. P. A., Shah, A. D., de Brunier, A. B. and Dinges, D.F. Behavioural alertness and the two-process model of sleepregulation during chronic partial sleep deprivation. Sleep, 2002,11 (Suppl. 1): 233.
Webb, W. B. and Agnew, H. W. The effects of chronic limitation ofsleep length. Psychophysiology, 1974, 11: 265–274.
Webb, W. B. and Agnew, H. W. Are we chronically sleep deprived?Bull. Psychonomic Soc., 1975, 6: 47–48.
Wesensten, N. J., Balkin, T. J. and Belenky, G. Does sleep fragmen-tation impact recuperation? A review and reanalysis. J. Sleep Res.,1999, 8: 237–245.
Williams, H. L., Lubin, A. and Goodnow, J. J. Impaired performancewith acute sleep loss. Psychol. Monographs, 1959, 73: 1–26.
12 G. Belenky et al.
! 2003 European Sleep Research Society, J. Sleep Res., 12, 1–12