Embed Size (px)
Citation preview
Microeconomics Third Edition
Chapter 14 Oligopoly
Copyright © 2013 by Worth Publishers
Paul Krugman and Robin Wells
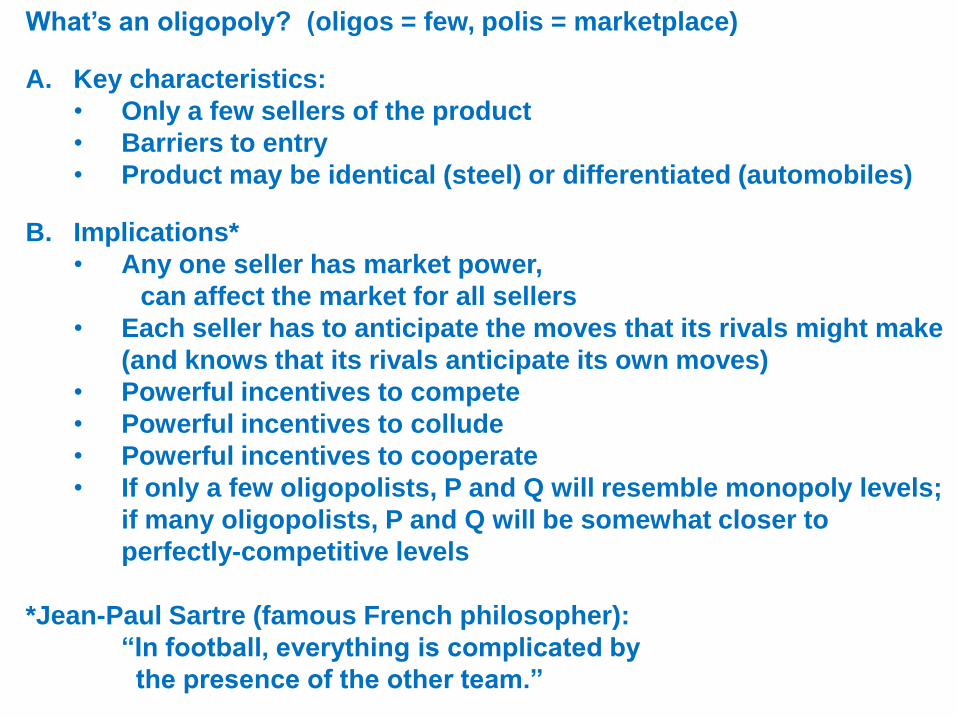
What’s an oligopoly? (oligos = few, polis = marketplace)
A. Key characteristics:
• Only a few sellers of the product
• Barriers to entry
• Product may be identical (steel) or differentiated (automobiles)
B. Implications*
• Any one seller has market power,
can affect the market for all sellers
• Each seller has to anticipate the moves that its rivals might make
(and knows that its rivals anticipate its own moves)
• Powerful incentives to compete
• Powerful incentives to collude
• Powerful incentives to cooperate
• If only a few oligopolists, P and Q will resemble monopoly levels;
if many oligopolists, P and Q will be somewhat closer to
perfectly-competitive levels
*Jean-Paul Sartre (famous French philosopher):
“In football, everything is complicated by
the presence of the other team.”
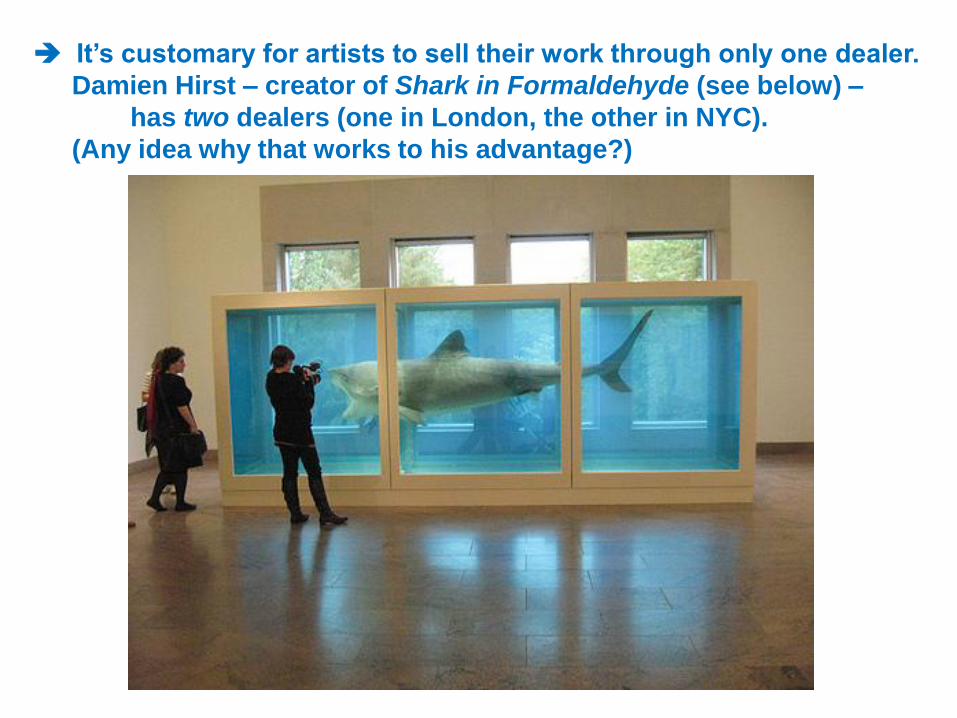
It’s customary for artists to sell their work through only one dealer.
Damien Hirst – creator of Shark in Formaldehyde (see below) –
has two dealers (one in London, the other in NYC).
(Any idea why that works to his advantage?)
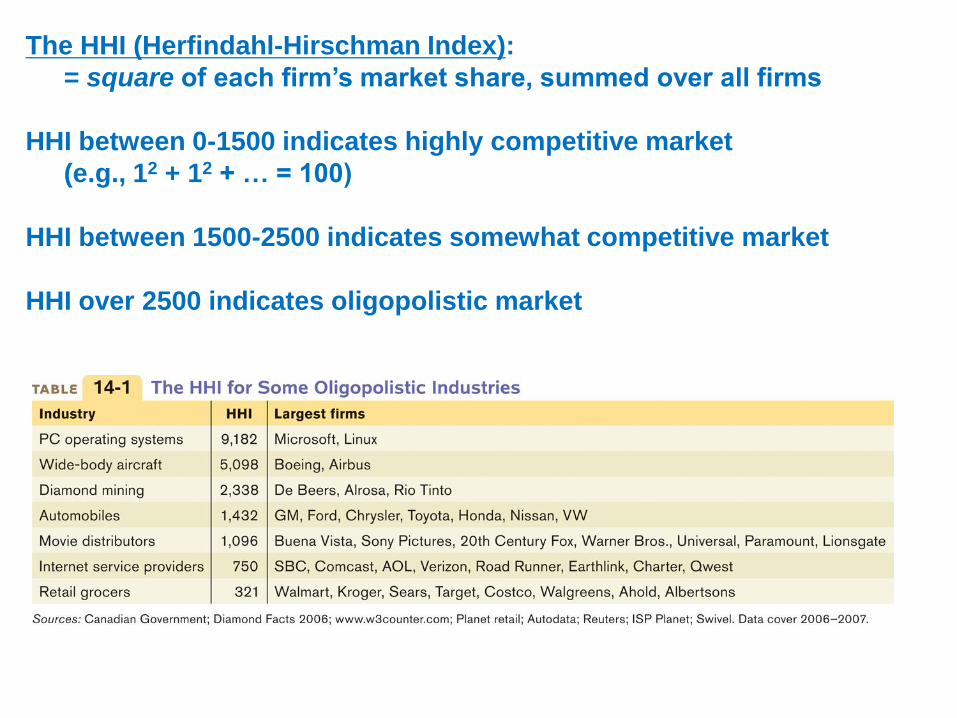
The HHI (Herfindahl-Hirschman Index):
= square of each firm’s market share, summed over all firms
HHI between 0-1500 indicates highly competitive market
(e.g., 12 + 12 + … = 100)
HHI between 1500-2500 indicates somewhat competitive market
HHI over 2500 indicates oligopolistic market
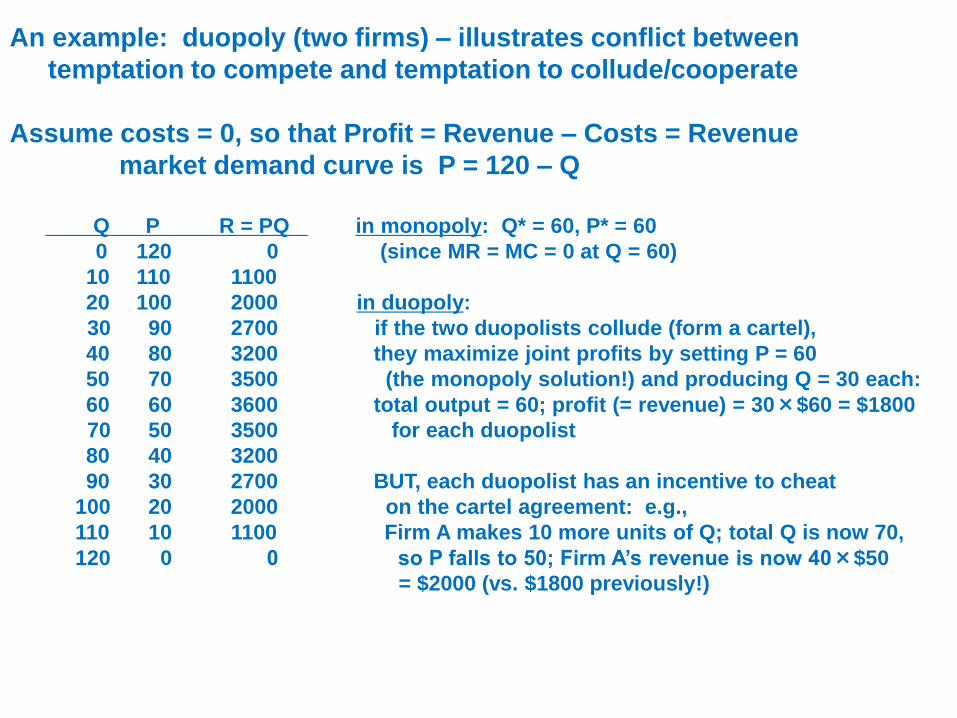
An example: duopoly (two firms) – illustrates conflict between
temptation to compete and temptation to collude/cooperate
Assume costs = 0, so that Profit = Revenue – Costs = Revenue
market demand curve is P = 120 – Q
Q P R = PQ in monopoly: Q* = 60, P* = 60
0 120 0 (since MR = MC = 0 at Q = 60)
10 110 1100
20 100 2000 in duopoly:
30 90 2700 if the two duopolists collude (form a cartel),
40 80 3200 they maximize joint profits by setting P = 60
50 70 3500 (the monopoly solution!) and producing Q = 30 each:
60 60 3600 total output = 60; profit (= revenue) = 30×$60 = $1800
70 50 3500 for each duopolist
80 40 3200
90 30 2700 BUT, each duopolist has an incentive to cheat
100 20 2000 on the cartel agreement: e.g.,
110 10 1100 Firm A makes 10 more units of Q; total Q is now 70,
120 0 0 so P falls to 50; Firm A’s revenue is now 40×$50
= $2000 (vs. $1800 previously!)
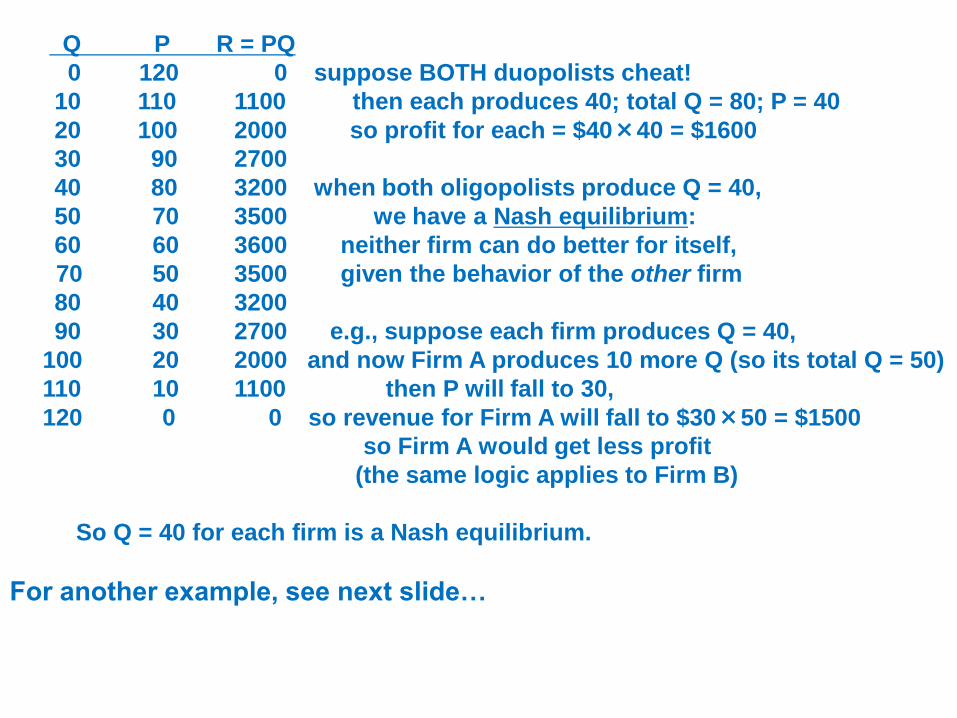
Q P R = PQ
0 120 0 suppose BOTH duopolists cheat!
10 110 1100 then each produces 40; total Q = 80; P = 40
20 100 2000 so profit for each = $40×40 = $1600
30 90 2700
40 80 3200 when both oligopolists produce Q = 40,
50 70 3500 we have a Nash equilibrium:
60 60 3600 neither firm can do better for itself,
70 50 3500 given the behavior of the other firm
80 40 3200
90 30 2700 e.g., suppose each firm produces Q = 40,
100 20 2000 and now Firm A produces 10 more Q (so its total Q = 50)
110 10 1100 then P will fall to 30,
120 0 0 so revenue for Firm A will fall to $30×50 = $1500
so Firm A would get less profit
(the same logic applies to Firm B)
So Q = 40 for each firm is a Nash equilibrium.
For another example, see next slide…
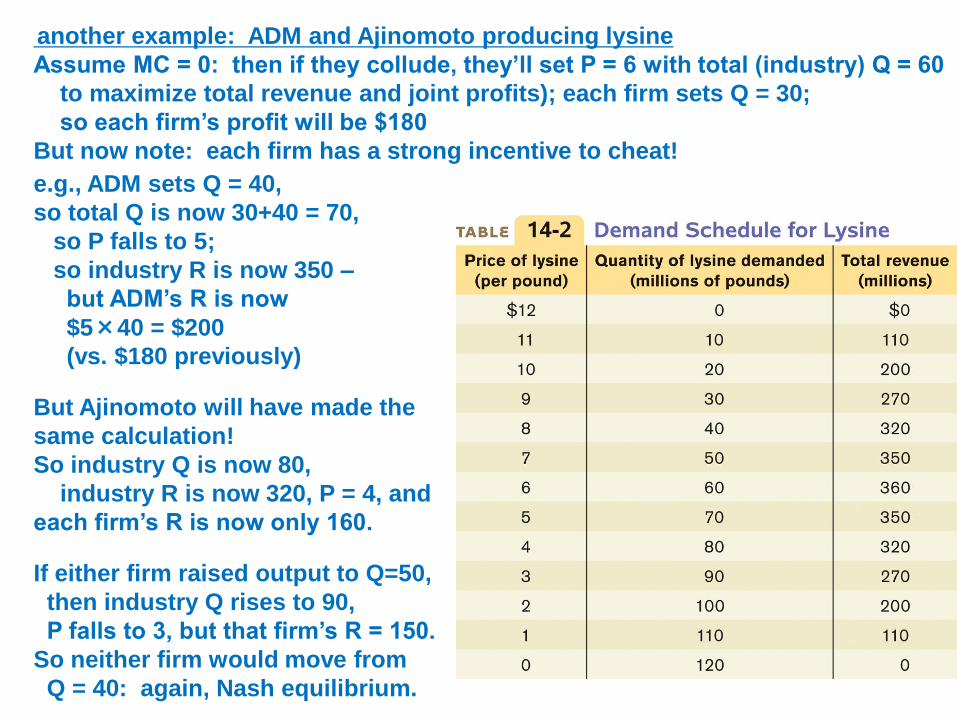
another example: ADM and Ajinomoto producing lysine
Assume MC = 0: then if they collude, they’ll set P = 6 with total (industry) Q = 60
to maximize total revenue and joint profits); each firm sets Q = 30;
so each firm’s profit will be $180
But now note: each firm has a strong incentive to cheat!
e.g., ADM sets Q = 40,
so total Q is now 30+40 = 70,
so P falls to 5;
so industry R is now 350 –
but ADM’s R is now
$5×40 = $200
(vs. $180 previously)
But Ajinomoto will have made the
same calculation!
So industry Q is now 80,
industry R is now 320, P = 4, and
each firm’s R is now only 160.
If either firm raised output to Q=50,
then industry Q rises to 90,
P falls to 3, but that firm’s R = 150.
So neither firm would move from
Q = 40: again, Nash equilibrium.

demand curve:
Q1+Q2
line Q1 Q2 = Q P PQ1 PQ2
1 30 30 60 60 1800 1800
2 40 30 70 50 2000 1500
3 40 40 80 40 1600 1600
4 50 40 90 30 1500 1200 Market demand curve is given by the middle two columns, for Q and P.
Each line shows what happens if the two duopolists produce the indicated amounts (Q1 or Q2).
Again, to simplify, we assume that TC = MC = 0, so that profit is the same as revenue (= PQ).
Line 1: Both firms set Q = 30; total Q = 60; P = 60.
Industry revenues (and profits) are maximized.
Line 2: Firm 2 produces Q = 40. If Firm 2 doesn’t react, total Q = 40 + 30 = 70,
so P falls to 50. Firm 1’s revenue rises; Firm 2’s revenue falls.
Line 3: So Firm 2 counterattacks! If Firm 1 doesn’t react, it still has Q=40.
Firm 2 produces 40, so total Q = 80 and so P = 40.
Firm 1’s revenue falls; Firm 2’s revenue rises.
Line 4: Check for yourself that neither firm can gain by raising its own Q
from 40 to 50 (revenues for each firm would fall).
So line 3 is a Nash equilibrium!
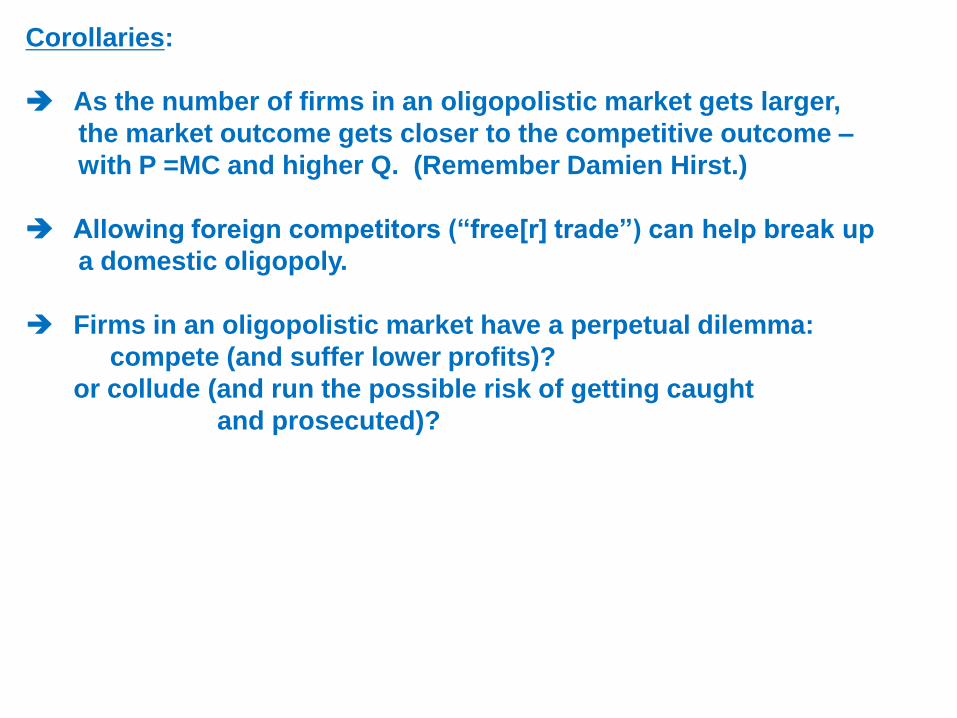
Corollaries:
As the number of firms in an oligopolistic market gets larger,
the market outcome gets closer to the competitive outcome –
with P =MC and higher Q. (Remember Damien Hirst.)
Allowing foreign competitors (“free[r] trade”) can help break up
a domestic oligopoly.
Firms in an oligopolistic market have a perpetual dilemma:
compete (and suffer lower profits)?
or collude (and run the possible risk of getting caught
and prosecuted)?

Robert Crandall (president, American Airlines) calling
Howard Putnam (president, Braniff Airways):
Crandall: I think it’s dumb as hell… to sit here and pound the #%@
out of each other and neither one of us making a #W@% dime!
Putnam: Do you have a suggestion for me?
Crandall: Yes, I have a suggestion for you. Raise your $%^#@ fares
20 percent. I’ll raise mine the next morning.
Putnam: Robert, we…
Crandall: You’ll make more money, and I will, too.
Putnam: We can’t talk about pricing!
Crandall: Oh #$%&, Howard. We can talk about any @%&** thing
we want to talk about.
(Putnam gave a tape of this conversation to the Department of Justice, which sued
Crandall. Two years later, Crandall settled with DoJ.)
Game theory and the prisoner’s dilemma: Models of oligopolistic behavior
“Dilemma” is whether to cooperate/collude, or to compete
“Prisoners’ dilemma” shows why cooperation is hard to maintain,
even when it benefits both parties.
(many applications: the arms race, cartel behavior, advertising, etc.)
key elements in the prisoners’ dilemma “game”:
• payoff matrix (showing what will happen under different choices
• dominant strategy (the strategy that is best, regardless of the
strategy chosen by the other player(s) in the game)
(Note: a particular game may not always have a dominant strategy.
But if it does, it is always the way to go!)
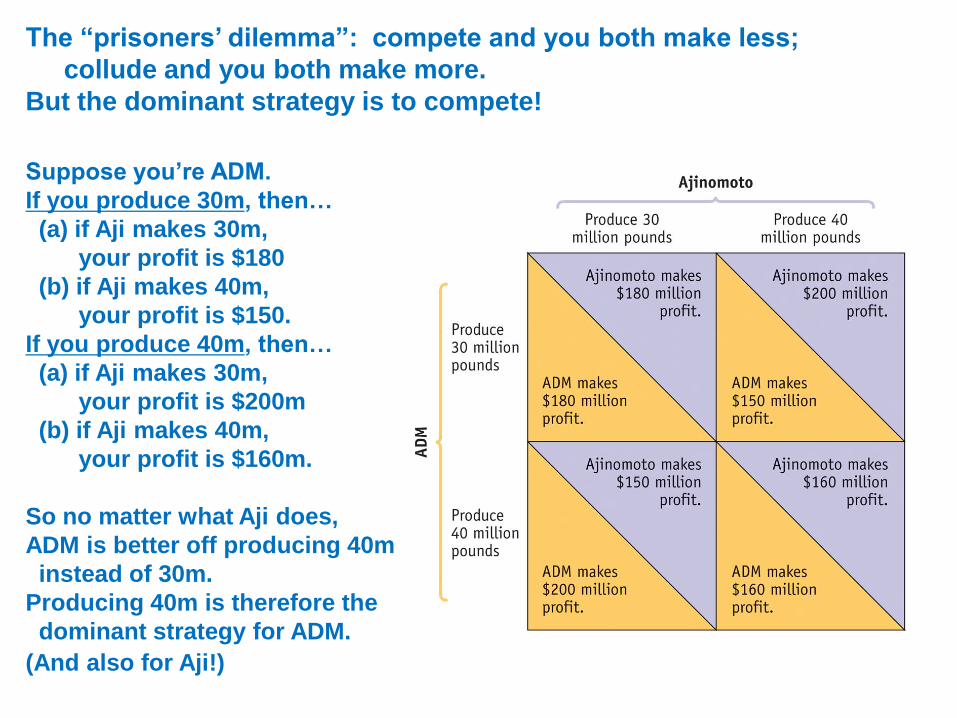
The “prisoners’ dilemma”: compete and you both make less;
collude and you both make more.
But the dominant strategy is to compete!
Suppose you’re ADM.
If you produce 30m, then…
(a) if Aji makes 30m,
your profit is $180
(b) if Aji makes 40m,
your profit is $150.
If you produce 40m, then…
(a) if Aji makes 30m,
your profit is $200m
(b) if Aji makes 40m,
your profit is $160m.
So no matter what Aji does,
ADM is better off producing 40m
instead of 30m.
Producing 40m is therefore the
dominant strategy for ADM.
(And also for Aji!)
What does this example show?
Even when firms would do better by cooperating/colluding,
there can be strong incentives for them to compete: e.g.,
by colluding, both firms would make $4b; but by competing,
both firms make only $3b.
(Not surprising: competition would be expected to yield lower profits than collusion.)
Cooperation can be good for firms, but bad for society.
Competition can be bad for society, cooperation can be good.
But society may need a rule-maker (and enforcer)
to limit competition.
Applications:
the arms race (spending more $ on arms doesn’t make us safer,
it just makes us poorer) – need a disarmament agreement
the university athletics arms race – NCAA to the rescue?
some hockey players (“enforcers”) don’t wear helmets –
should the league require players to wear a helmet?
Extensions of the simple model
A repeated game has both a past (“memory”) and a future
so players will think ahead instead of playing on a one-shot basis
This may create more incentives to collude/cooperate
“Tit-for-tat” policy: start out by cooperating,
then just do whatever the other person does
(“measure for measure”: a moral principle?
“I’ll do unto you what you did unto me”?)
problem: can produce endless, destructive cycle of retaliation –
or, it could lead to tacit collusion/cooperation
“Generous” policy: randomly but periodically forget the opponent’s
last move – don’t retaliate; make a fresh start

How “tit-for-tat” can lead to tacit collusion
if both play tit-for-tat, then ADM (and Aji) makes $180m profit each year
If ADM always cheats and Aji plays tit-for-tat,
ADM makes $200m first year but only $160m thereafter
If ADM plays tit-for-tat but Aji always cheats,
ADM makes $150m in first year and $160m thereafter
If ADM always cheats and Aji does too,
ADM makes $160m each years
So what should ADM do?
If it expects to be in the business
a long time, AND if it thinks
Aji would like to pay tit-for-tat,
then ADM should play tit-for-tat too!
(Then both make $180m/year.)
But if ADM wil be out of the business
after one year, it should cheat –
“do unto others before they do
unto you”!
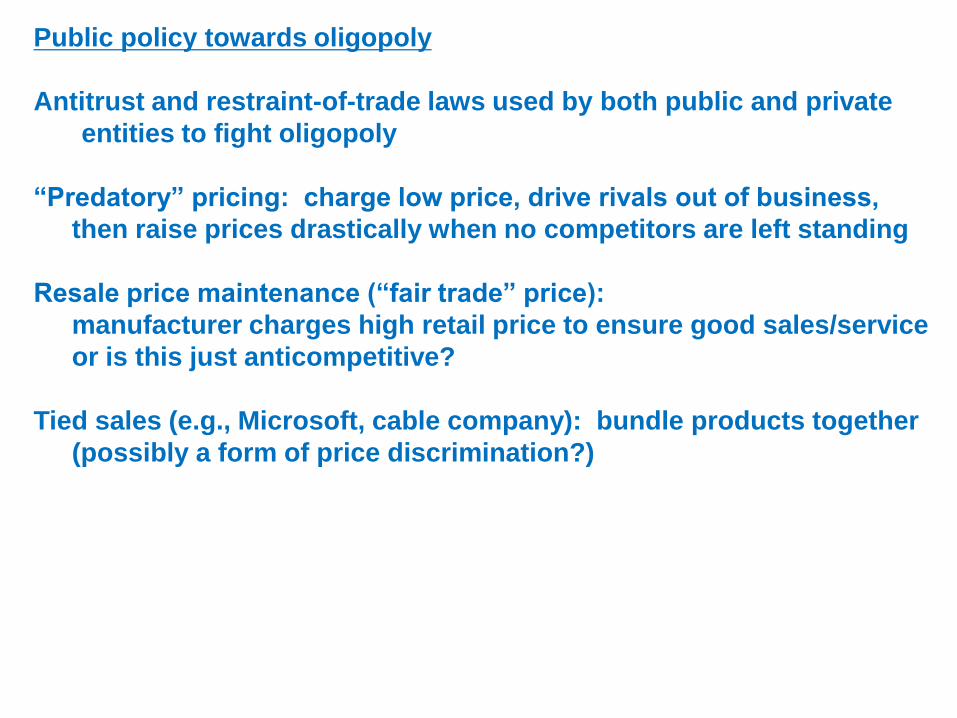
Public policy towards oligopoly
Antitrust and restraint-of-trade laws used by both public and private
entities to fight oligopoly
“Predatory” pricing: charge low price, drive rivals out of business,
then raise prices drastically when no competitors are left standing
Resale price maintenance (“fair trade” price):
manufacturer charges high retail price to ensure good sales/service
or is this just anticompetitive?
Tied sales (e.g., Microsoft, cable company): bundle products together
(possibly a form of price discrimination?)
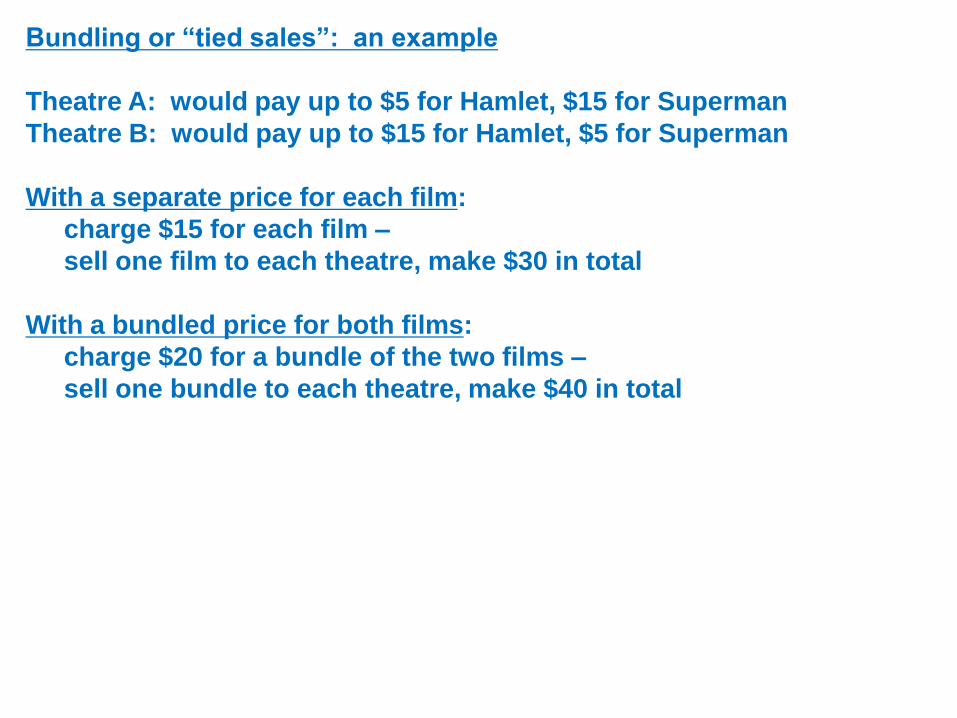
Bundling or “tied sales”: an example
Theatre A: would pay up to $5 for Hamlet, $15 for Superman
Theatre B: would pay up to $15 for Hamlet, $5 for Superman
With a separate price for each film:
charge $15 for each film –
sell one film to each theatre, make $30 in total
With a bundled price for both films:
charge $20 for a bundle of the two films –
sell one bundle to each theatre, make $40 in total
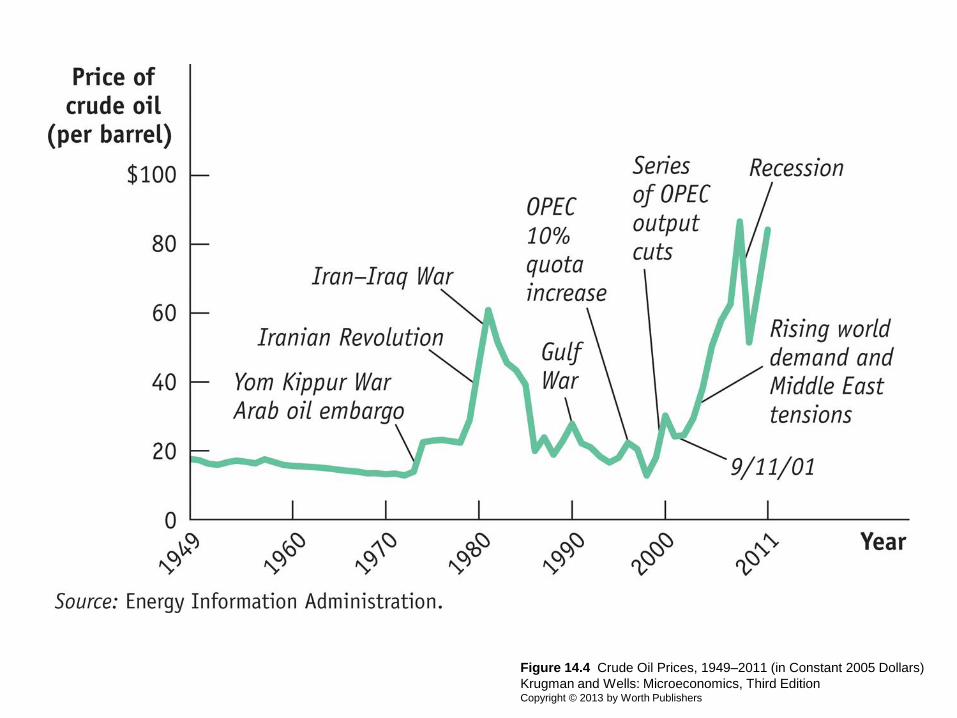
Figure 14.4 Crude Oil Prices, 1949–2011 (in Constant 2005 Dollars)
Krugman and Wells: Microeconomics, Third Edition Copyright © 2013 by Worth Publishers
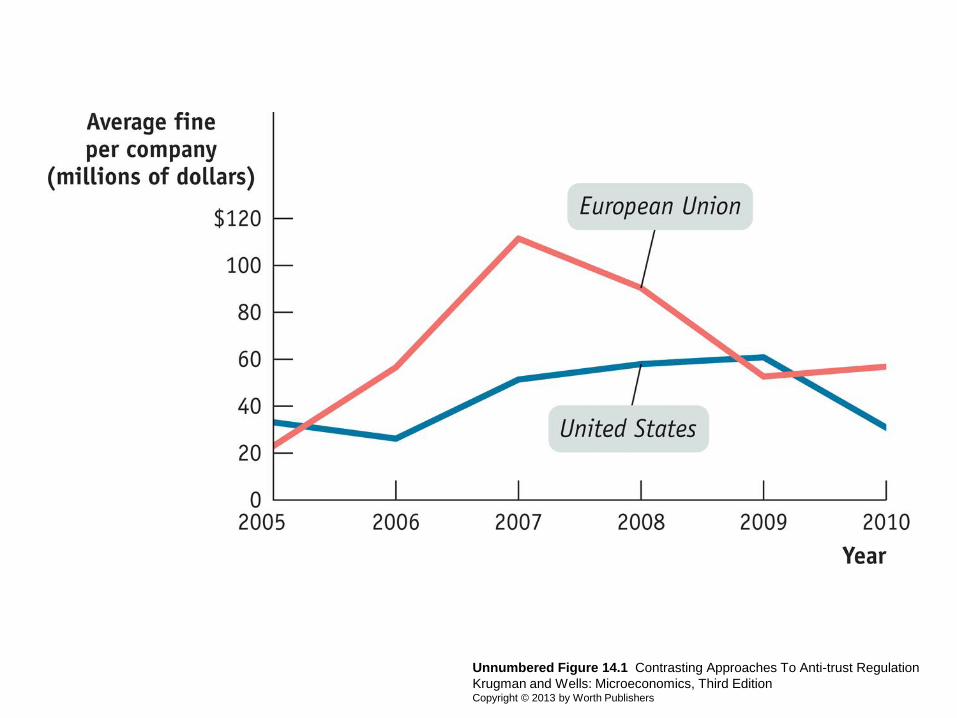
Unnumbered Figure 14.1 Contrasting Approaches To Anti-trust Regulation
Krugman and Wells: Microeconomics, Third Edition Copyright © 2013 by Worth Publishers