Embed Size (px)
Citation preview
Paying More for Less: Older Adultsin the Individual Insurance MarketFindings from the Commonwealth Fund
Survey of Older Adults
Sara R. Collins, Cathy Schoen, Michelle M. Doty,
Alyssa L. Holmgren, and Sabrina K. How
ABSTRACT: The Commonwealth Fund Survey of Older Adults reveals that adultsages 50 to 70 who rely on the individual insurance market for health coverage paymuch higher premiums than their counterparts with employer coverage or Medicare.The survey found that in 2004, more than half (54%) of older adults with individualcoverage spent $3,600 or more annually on premiums. A quarter (26%) spent $6,000or more a year. In contrast, only 17 percent of older adults with employer coverageand 6 percent of those covered by Medicare spent $3,600 or more on premiums.Moreover, individual coverage often provides poor access to care and entails highout-of-pocket expenses for older adults, making it a particularly unaffordable optionfor people who are older, have low incomes, or who have chronic health problems.
* * * * *
OverviewMost working-age older adults receive health insurance coverage through anemployer. But many older adults who do not have access to employer-basedcoverage seek coverage on the individual market.1 The CommonwealthFund Survey of Older Adults, conducted in late 2004, reveals that adults ages50 to 70 who rely on individual market insurance pay much higher premi-ums than their counterparts with employer coverage or Medicare.2 This isbecause older adults have greater health care needs and are at greater risk ofcatastrophic illness—characteristics that, in most states, underwriters areallowed to take into consideration when writing individual insurance poli-cies.3 Yet, despite the fact that older adults with individual coverage pay morein premiums, the survey finds they have far less comprehensive coverage andare more likely to face insurance restrictions and administrative complications.
For more information about this
study, please contact:
Sara R. Collins, Ph.D.
Senior Program Officer
The Commonwealth Fund
Tel 212.606.3838
E-mail [email protected]
Additional copies of this and
other Commonwealth Fund
publications are available online
at www.cmwf.org.
To learn about new Fund
publications when they appear, visit
the Fund’s Web site and register to
receive e-mail alerts.
Commonwealth Fund pub. #841
TASK FORCE ON THE FUTURE OF HEALTH INSURANCE
Issue BriefJUNE 2005
2 The Commonwealth Fund
As a result of gaps in coverage, older adults withindividual coverage are significantly more likelythan those with employer coverage to report prob-lems accessing needed care and paying medicalbills.The extent of such problems is particularlynotable since, as a group, those with individualinsurance tend to be healthier and wealthier thanthe average for this age group.
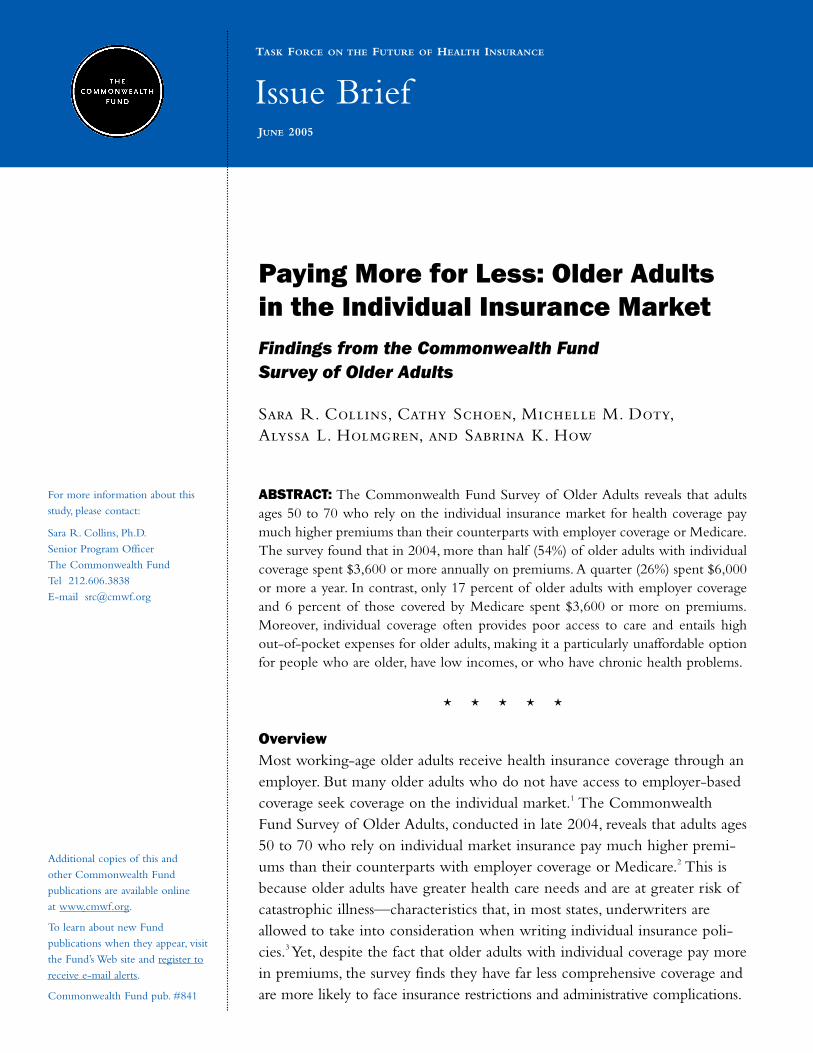
Higher PremiumsThe survey found that in 2004 more than half(54%) of older adults with coverage on the indi-vidual market spent $300 or more per month onhealth insurance premiums, or $3,600 or moreannually (Figure 1). A quarter (26%) spent $500 ormore a month, or $6,000 or more a year. In con-trast, only 17 percent of older adults withemployer coverage and 6 percent of those coveredby Medicare spent $3,600 or more per year onpremiums.
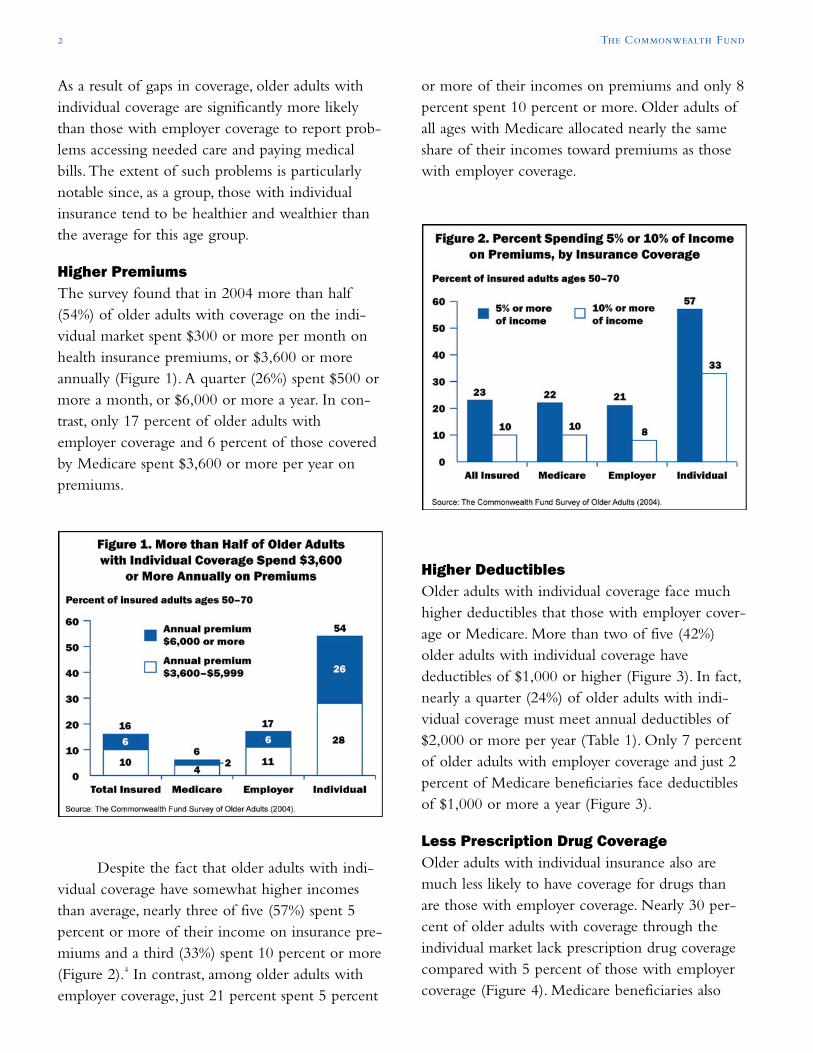
Despite the fact that older adults with indi-vidual coverage have somewhat higher incomesthan average, nearly three of five (57%) spent 5percent or more of their income on insurance pre-miums and a third (33%) spent 10 percent or more(Figure 2).4 In contrast, among older adults withemployer coverage, just 21 percent spent 5 percent
or more of their incomes on premiums and only 8percent spent 10 percent or more. Older adults ofall ages with Medicare allocated nearly the sameshare of their incomes toward premiums as thosewith employer coverage.
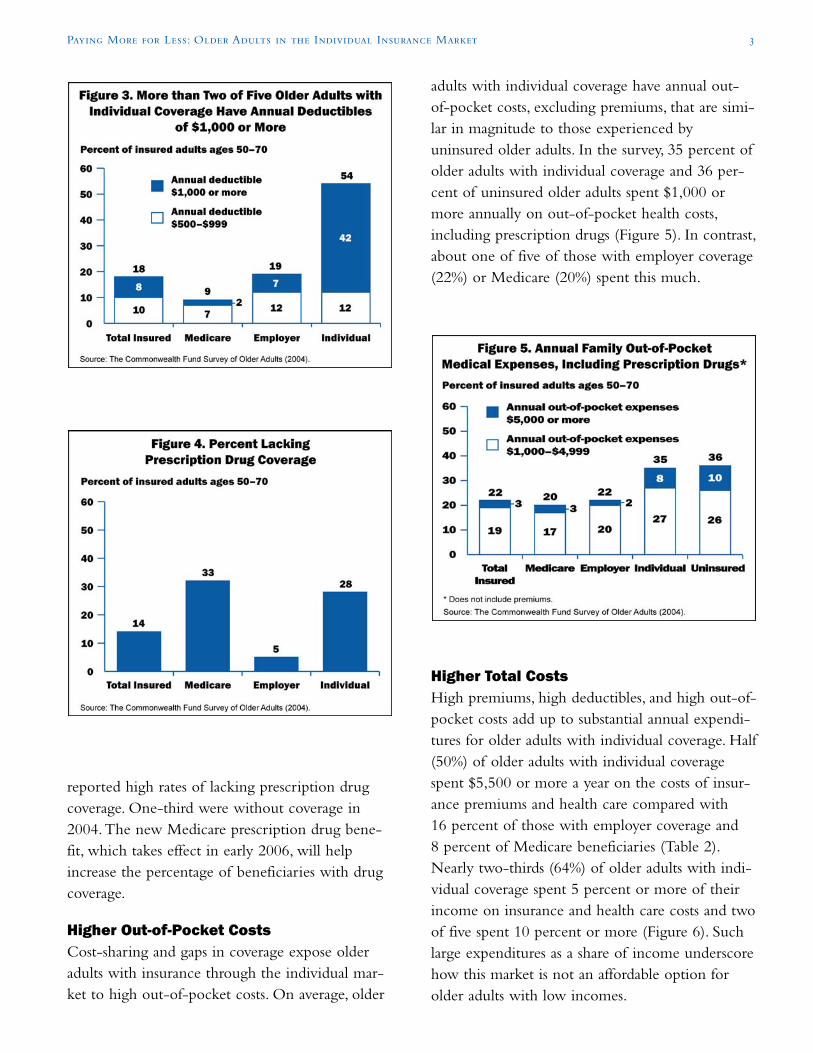
Higher DeductiblesOlder adults with individual coverage face muchhigher deductibles that those with employer cover-age or Medicare. More than two of five (42%)older adults with individual coverage havedeductibles of $1,000 or higher (Figure 3). In fact,nearly a quarter (24%) of older adults with indi-vidual coverage must meet annual deductibles of$2,000 or more per year (Table 1). Only 7 percentof older adults with employer coverage and just 2percent of Medicare beneficiaries face deductiblesof $1,000 or more a year (Figure 3).
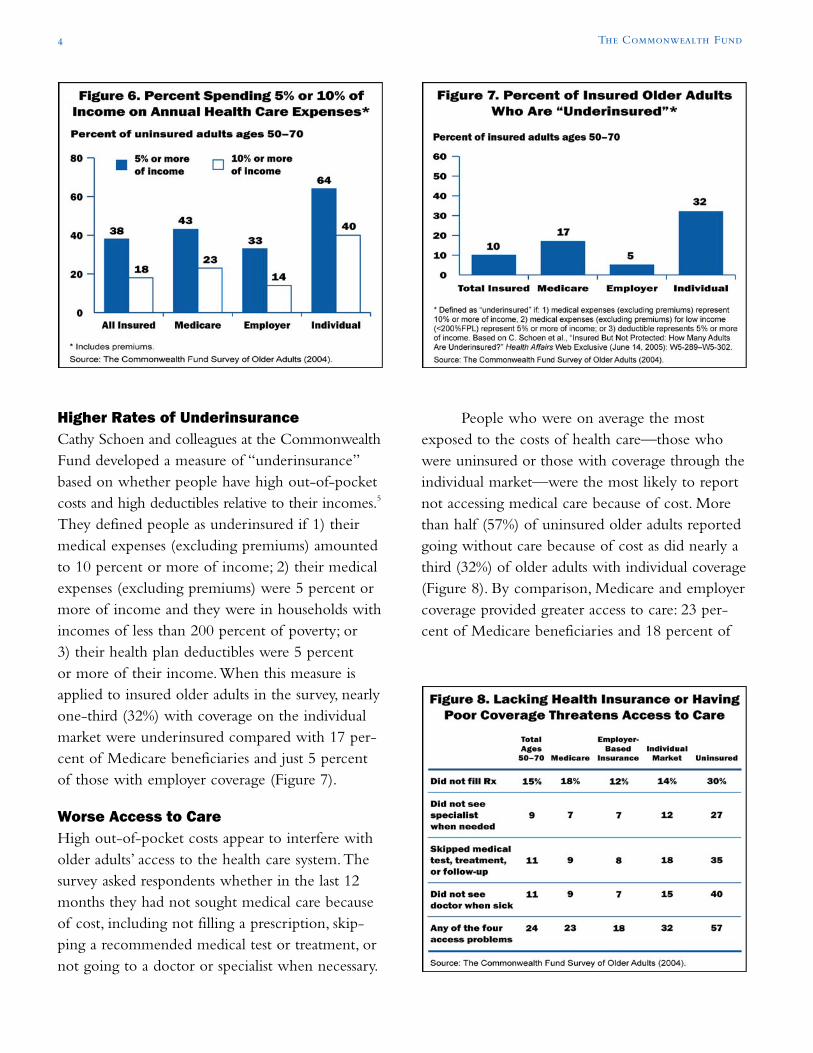
Less Prescription Drug CoverageOlder adults with individual insurance also aremuch less likely to have coverage for drugs thanare those with employer coverage. Nearly 30 per-cent of older adults with coverage through theindividual market lack prescription drug coveragecompared with 5 percent of those with employercoverage (Figure 4). Medicare beneficiaries also
Paying More for Less: Older Adults in the Individual Insurance Market 3
reported high rates of lacking prescription drugcoverage. One-third were without coverage in2004.The new Medicare prescription drug bene-fit, which takes effect in early 2006, will helpincrease the percentage of beneficiaries with drugcoverage.
Higher Out-of-Pocket CostsCost-sharing and gaps in coverage expose olderadults with insurance through the individual mar-ket to high out-of-pocket costs. On average, older
adults with individual coverage have annual out-of-pocket costs, excluding premiums, that are simi-lar in magnitude to those experienced byuninsured older adults. In the survey, 35 percent ofolder adults with individual coverage and 36 per-cent of uninsured older adults spent $1,000 ormore annually on out-of-pocket health costs,including prescription drugs (Figure 5). In contrast,about one of five of those with employer coverage(22%) or Medicare (20%) spent this much.
Higher Total CostsHigh premiums, high deductibles, and high out-of-pocket costs add up to substantial annual expendi-tures for older adults with individual coverage. Half(50%) of older adults with individual coveragespent $5,500 or more a year on the costs of insur-ance premiums and health care compared with16 percent of those with employer coverage and8 percent of Medicare beneficiaries (Table 2).Nearly two-thirds (64%) of older adults with indi-vidual coverage spent 5 percent or more of theirincome on insurance and health care costs and twoof five spent 10 percent or more (Figure 6). Suchlarge expenditures as a share of income underscorehow this market is not an affordable option forolder adults with low incomes.
Higher Rates of UnderinsuranceCathy Schoen and colleagues at the CommonwealthFund developed a measure of “underinsurance”based on whether people have high out-of-pocketcosts and high deductibles relative to their incomes.5
They defined people as underinsured if 1) theirmedical expenses (excluding premiums) amountedto 10 percent or more of income; 2) their medicalexpenses (excluding premiums) were 5 percent ormore of income and they were in households withincomes of less than 200 percent of poverty; or3) their health plan deductibles were 5 percentor more of their income.When this measure isapplied to insured older adults in the survey, nearlyone-third (32%) with coverage on the individualmarket were underinsured compared with 17 per-cent of Medicare beneficiaries and just 5 percentof those with employer coverage (Figure 7).
Worse Access to CareHigh out-of-pocket costs appear to interfere witholder adults’ access to the health care system.Thesurvey asked respondents whether in the last 12months they had not sought medical care becauseof cost, including not filling a prescription, skip-ping a recommended medical test or treatment, ornot going to a doctor or specialist when necessary.
People who were on average the mostexposed to the costs of health care—those whowere uninsured or those with coverage through theindividual market—were the most likely to reportnot accessing medical care because of cost. Morethan half (57%) of uninsured older adults reportedgoing without care because of cost as did nearly athird (32%) of older adults with individual coverage(Figure 8). By comparison, Medicare and employercoverage provided greater access to care: 23 per-cent of Medicare beneficiaries and 18 percent of
4 The Commonwealth Fund
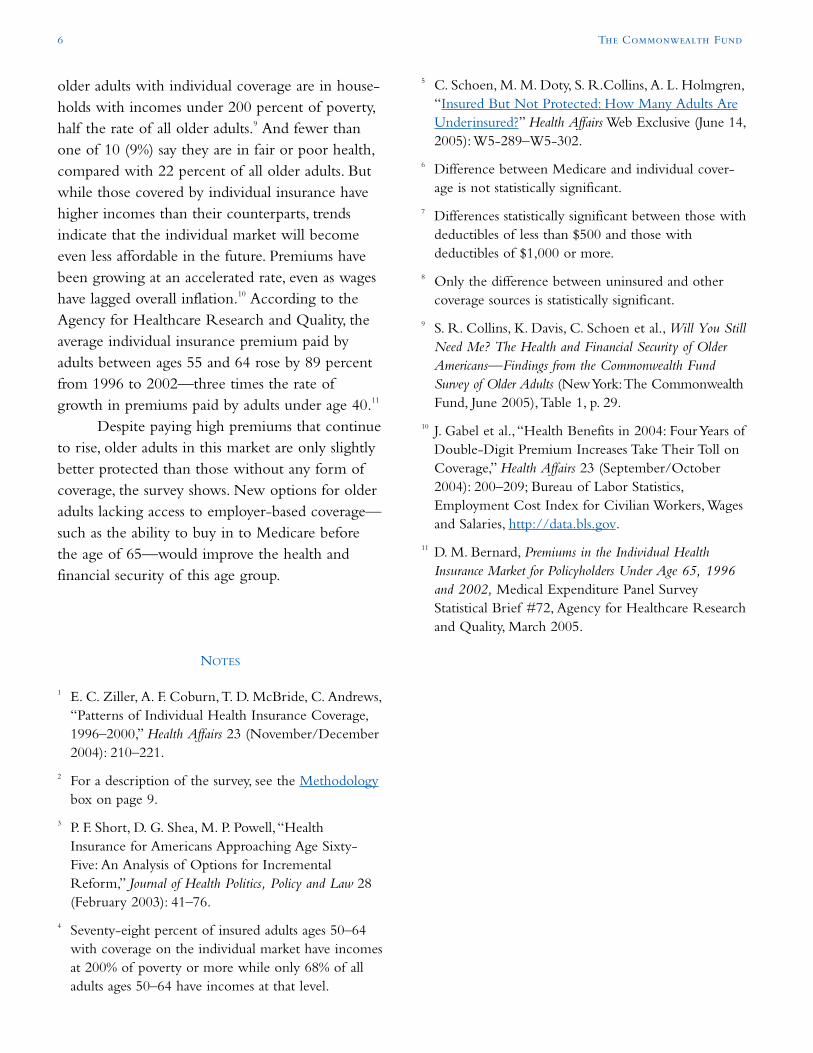
(Figure 10). Nearly two of five (39%) older adultswith individual coverage reported problems withmedical bills and debt compared with 30 percentof those with employer coverage and 35 percent ofMedicare beneficiaries.8 Disabled Medicare benefi-ciaries under age 65 are particularly vulnerable tomedical bill problems since they are poorer, usemore health care services, and are more likely tohave been uninsured in the years prior to becom-ing eligible for Medicare. Fifty-seven percent ofdisabled beneficiaries reported a payment problemor accrued debt compared with 27 percent of ben-eficiaries 65 and older (data not shown).
ConclusionFindings from the Commonwealth Fund Survey ofOlder Adults indicate that older adults who relyon the individual insurance market for coveragepay high premiums for coverage that often pro-vides poor access to care and entails high out-of-pocket expenses.The high costs make this marketa particularly unaffordable option for people whoare older, have low incomes, and/or who havechronic health problems.
Older Americans in the individual markettoday tend to be wealthier and healthier, on average,than others in their age group. Only 12 percent of
Paying More for Less: Older Adults in the Individual Insurance Market 5
older adults with employer coverage reported anyof these problems.6
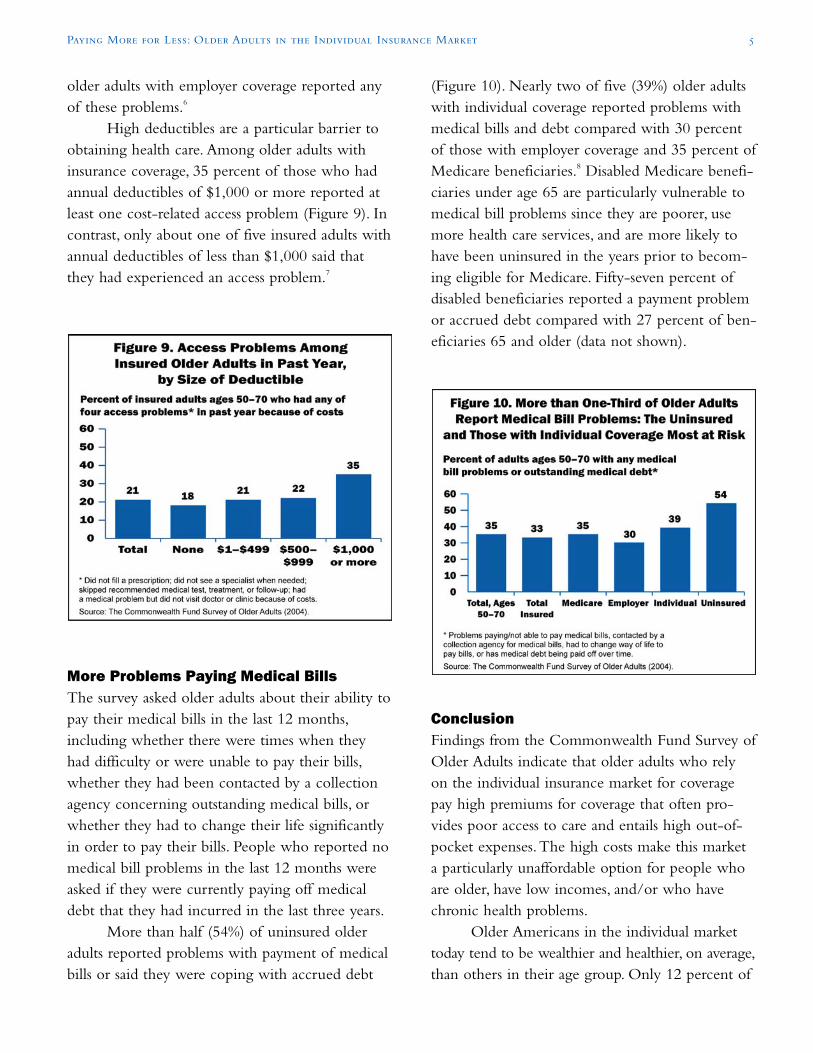
High deductibles are a particular barrier toobtaining health care. Among older adults withinsurance coverage, 35 percent of those who hadannual deductibles of $1,000 or more reported atleast one cost-related access problem (Figure 9). Incontrast, only about one of five insured adults withannual deductibles of less than $1,000 said thatthey had experienced an access problem.7
More Problems Paying Medical BillsThe survey asked older adults about their ability topay their medical bills in the last 12 months,including whether there were times when theyhad difficulty or were unable to pay their bills,whether they had been contacted by a collectionagency concerning outstanding medical bills, orwhether they had to change their life significantlyin order to pay their bills. People who reported nomedical bill problems in the last 12 months wereasked if they were currently paying off medicaldebt that they had incurred in the last three years.
More than half (54%) of uninsured olderadults reported problems with payment of medicalbills or said they were coping with accrued debt
older adults with individual coverage are in house-holds with incomes under 200 percent of poverty,half the rate of all older adults.9 And fewer thanone of 10 (9%) say they are in fair or poor health,compared with 22 percent of all older adults. Butwhile those covered by individual insurance havehigher incomes than their counterparts, trendsindicate that the individual market will becomeeven less affordable in the future. Premiums havebeen growing at an accelerated rate, even as wageshave lagged overall inflation.10 According to theAgency for Healthcare Research and Quality, theaverage individual insurance premium paid byadults between ages 55 and 64 rose by 89 percentfrom 1996 to 2002—three times the rate ofgrowth in premiums paid by adults under age 40.11
Despite paying high premiums that continueto rise, older adults in this market are only slightlybetter protected than those without any form ofcoverage, the survey shows. New options for olderadults lacking access to employer-based coverage—such as the ability to buy in to Medicare beforethe age of 65—would improve the health andfinancial security of this age group.
NOTES
1 E. C. Ziller, A. F. Coburn,T. D. McBride, C. Andrews,“Patterns of Individual Health Insurance Coverage,1996–2000,” Health Affairs 23 (November/December2004): 210–221.
2 For a description of the survey, see the Methodologybox on page 9.
3 P. F. Short, D. G. Shea, M. P. Powell,“HealthInsurance for Americans Approaching Age Sixty-Five: An Analysis of Options for IncrementalReform,” Journal of Health Politics, Policy and Law 28(February 2003): 41–76.
4 Seventy-eight percent of insured adults ages 50–64with coverage on the individual market have incomesat 200% of poverty or more while only 68% of alladults ages 50–64 have incomes at that level.
5 C. Schoen, M. M. Doty, S. R.Collins, A. L. Holmgren,“Insured But Not Protected: How Many Adults AreUnderinsured?” Health Affairs Web Exclusive (June 14,2005):W5-289–W5-302.
6 Difference between Medicare and individual cover-age is not statistically significant.
7 Differences statistically significant between those withdeductibles of less than $500 and those withdeductibles of $1,000 or more.
8 Only the difference between uninsured and othercoverage sources is statistically significant.
9 S. R. Collins, K. Davis, C. Schoen et al., Will You StillNeed Me? The Health and Financial Security of OlderAmericans—Findings from the Commonwealth FundSurvey of Older Adults (New York:The CommonwealthFund, June 2005),Table 1, p. 29.
10 J. Gabel et al.,“Health Benefits in 2004: Four Years ofDouble-Digit Premium Increases Take Their Toll onCoverage,” Health Affairs 23 (September/October2004): 200–209; Bureau of Labor Statistics,Employment Cost Index for Civilian Workers,Wagesand Salaries, http://data.bls.gov.
11 D. M. Bernard, Premiums in the Individual HealthInsurance Market for Policyholders Under Age 65, 1996and 2002, Medical Expenditure Panel SurveyStatistical Brief #72, Agency for Healthcare Researchand Quality, March 2005.
6 The Commonwealth Fund
Paying More for Less: Older Adults in the Individual Insurance Market 7
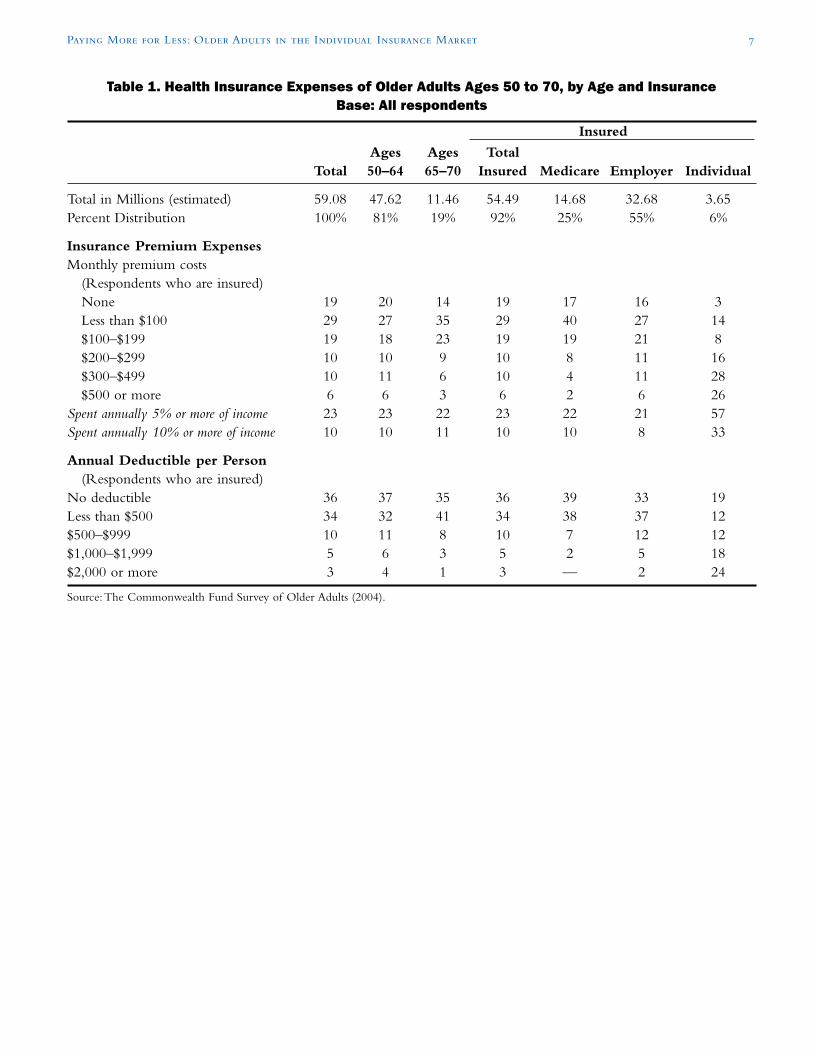
Table 1. Health Insurance Expenses of Older Adults Ages 50 to 70, by Age and InsuranceBase: All respondents
Insured
Ages Ages TotalTotal 50–64 65–70 Insured Medicare Employer Individual
Total in Millions (estimated) 59.08 47.62 11.46 54.49 14.68 32.68 3.65Percent Distribution 100% 81% 19% 92% 25% 55% 6%
Insurance Premium ExpensesMonthly premium costs
(Respondents who are insured)None 19 20 14 19 17 16 3Less than $100 29 27 35 29 40 27 14$100–$199 19 18 23 19 19 21 8$200–$299 10 10 9 10 8 11 16$300–$499 10 11 6 10 4 11 28$500 or more 6 6 3 6 2 6 26
Spent annually 5% or more of income 23 23 22 23 22 21 57Spent annually 10% or more of income 10 10 11 10 10 8 33
Annual Deductible per Person(Respondents who are insured)
No deductible 36 37 35 36 39 33 19Less than $500 34 32 41 34 38 37 12$500–$999 10 11 8 10 7 12 12$1,000–$1,999 5 6 3 5 2 5 18$2,000 or more 3 4 1 3 — 2 24
Source:The Commonwealth Fund Survey of Older Adults (2004).
8 The Commonwealth Fund
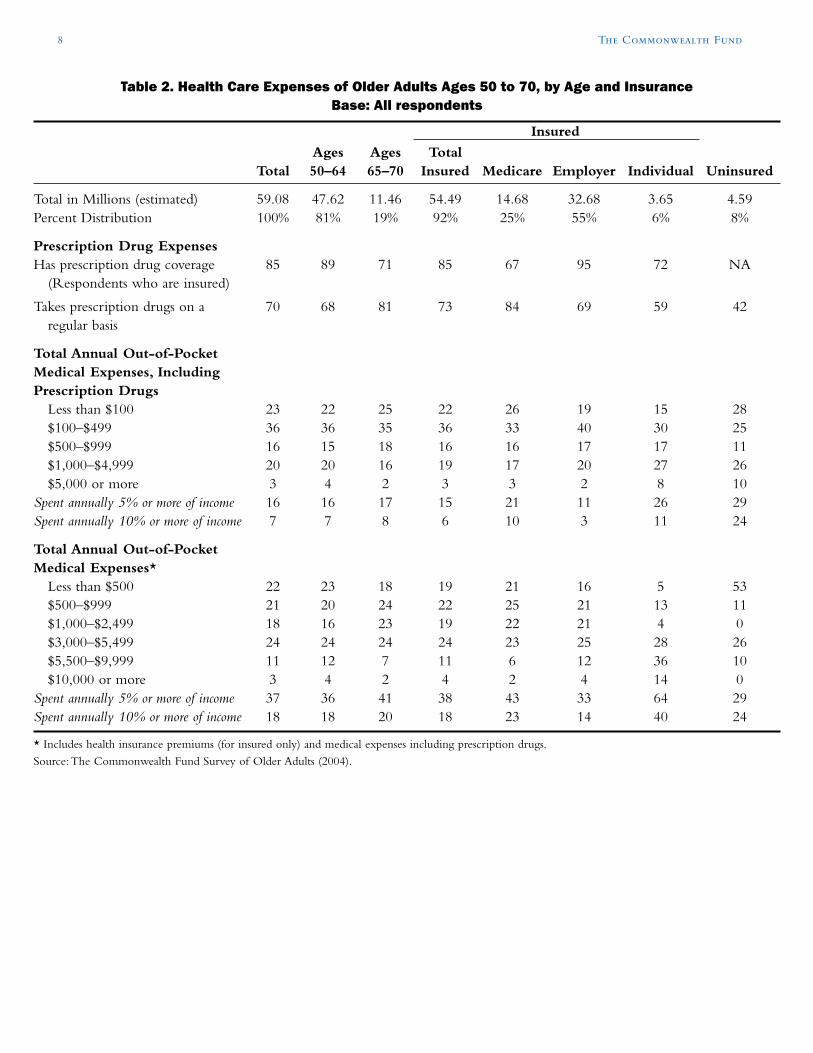
Table 2. Health Care Expenses of Older Adults Ages 50 to 70, by Age and InsuranceBase: All respondents
Insured
Ages Ages TotalTotal 50–64 65–70 Insured Medicare Employer Individual Uninsured
Total in Millions (estimated) 59.08 47.62 11.46 54.49 14.68 32.68 3.65 4.59Percent Distribution 100% 81% 19% 92% 25% 55% 6% 8%
Prescription Drug ExpensesHas prescription drug coverage 85 89 71 85 67 95 72 NA
(Respondents who are insured)
Takes prescription drugs on a 70 68 81 73 84 69 59 42regular basis
Total Annual Out-of-PocketMedical Expenses, IncludingPrescription Drugs
Less than $100 23 22 25 22 26 19 15 28$100–$499 36 36 35 36 33 40 30 25$500–$999 16 15 18 16 16 17 17 11$1,000–$4,999 20 20 16 19 17 20 27 26$5,000 or more 3 4 2 3 3 2 8 10
Spent annually 5% or more of income 16 16 17 15 21 11 26 29Spent annually 10% or more of income 7 7 8 6 10 3 11 24
Total Annual Out-of-PocketMedical Expenses*
Less than $500 22 23 18 19 21 16 5 53$500–$999 21 20 24 22 25 21 13 11$1,000–$2,499 18 16 23 19 22 21 4 0$3,000–$5,499 24 24 24 24 23 25 28 26$5,500–$9,999 11 12 7 11 6 12 36 10$10,000 or more 3 4 2 4 2 4 14 0
Spent annually 5% or more of income 37 36 41 38 43 33 64 29Spent annually 10% or more of income 18 18 20 18 23 14 40 24
* Includes health insurance premiums (for insured only) and medical expenses including prescription drugs.
Source:The Commonwealth Fund Survey of Older Adults (2004).
Paying More for Less: Older Adults in the Individual Insurance Market 9
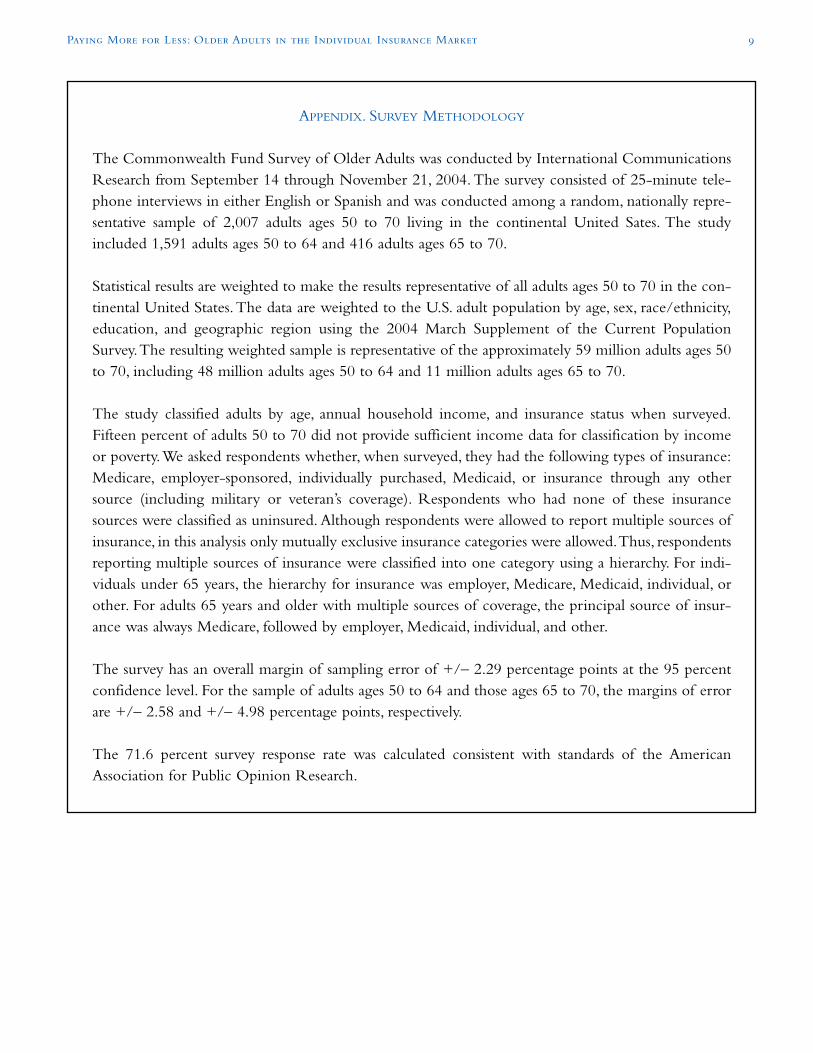
APPENDIX. SURVEY METHODOLOGY
The Commonwealth Fund Survey of Older Adults was conducted by International CommunicationsResearch from September 14 through November 21, 2004. The survey consisted of 25-minute tele-phone interviews in either English or Spanish and was conducted among a random, nationally repre-sentative sample of 2,007 adults ages 50 to 70 living in the continental United Sates. The studyincluded 1,591 adults ages 50 to 64 and 416 adults ages 65 to 70.
Statistical results are weighted to make the results representative of all adults ages 50 to 70 in the con-tinental United States.The data are weighted to the U.S. adult population by age, sex, race/ethnicity,education, and geographic region using the 2004 March Supplement of the Current PopulationSurvey.The resulting weighted sample is representative of the approximately 59 million adults ages 50to 70, including 48 million adults ages 50 to 64 and 11 million adults ages 65 to 70.
The study classified adults by age, annual household income, and insurance status when surveyed.Fifteen percent of adults 50 to 70 did not provide sufficient income data for classification by incomeor poverty.We asked respondents whether, when surveyed, they had the following types of insurance:Medicare, employer-sponsored, individually purchased, Medicaid, or insurance through any othersource (including military or veteran’s coverage). Respondents who had none of these insurancesources were classified as uninsured. Although respondents were allowed to report multiple sources ofinsurance, in this analysis only mutually exclusive insurance categories were allowed.Thus, respondentsreporting multiple sources of insurance were classified into one category using a hierarchy. For indi-viduals under 65 years, the hierarchy for insurance was employer, Medicare, Medicaid, individual, orother. For adults 65 years and older with multiple sources of coverage, the principal source of insur-ance was always Medicare, followed by employer, Medicaid, individual, and other.
The survey has an overall margin of sampling error of +/– 2.29 percentage points at the 95 percentconfidence level. For the sample of adults ages 50 to 64 and those ages 65 to 70, the margins of errorare +/– 2.58 and +/– 4.98 percentage points, respectively.
The 71.6 percent survey response rate was calculated consistent with standards of the AmericanAssociation for Public Opinion Research.
10 The Commonwealth Fund
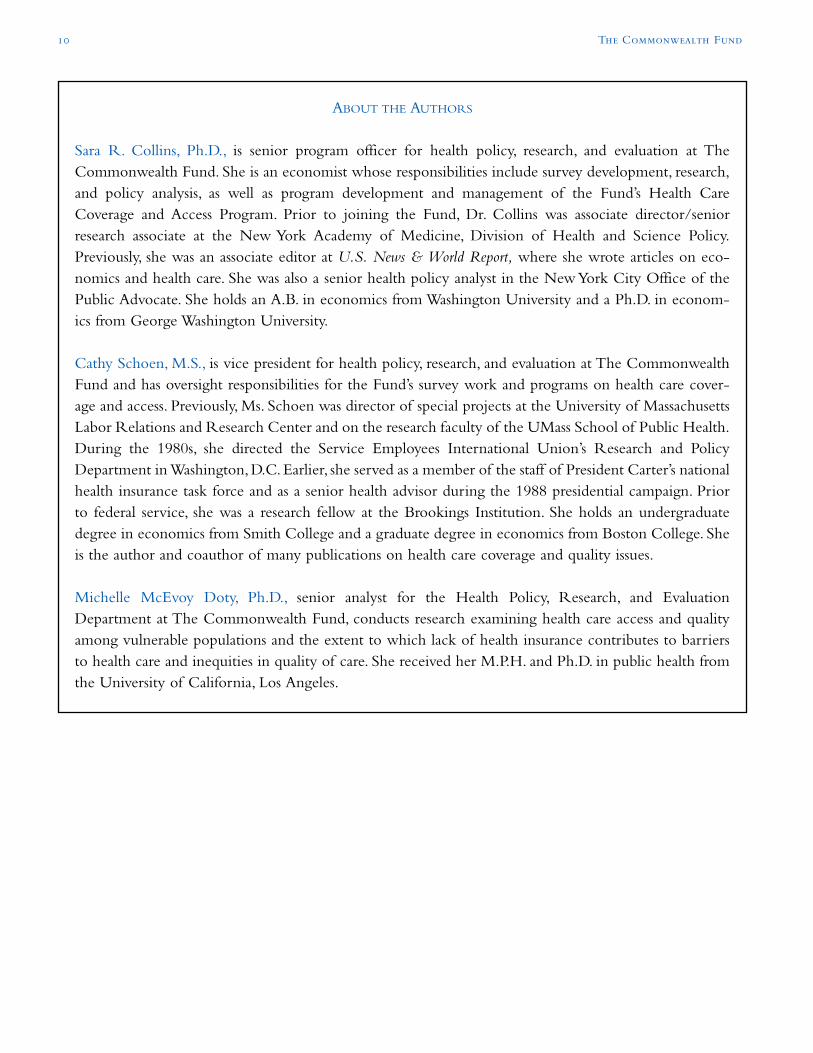
ABOUT THE AUTHORS
Sara R. Collins, Ph.D., is senior program officer for health policy, research, and evaluation at TheCommonwealth Fund. She is an economist whose responsibilities include survey development, research,and policy analysis, as well as program development and management of the Fund’s Health CareCoverage and Access Program. Prior to joining the Fund, Dr. Collins was associate director/seniorresearch associate at the New York Academy of Medicine, Division of Health and Science Policy.Previously, she was an associate editor at U.S. News & World Report, where she wrote articles on eco-nomics and health care. She was also a senior health policy analyst in the New York City Office of thePublic Advocate. She holds an A.B. in economics from Washington University and a Ph.D. in econom-ics from George Washington University.
Cathy Schoen, M.S., is vice president for health policy, research, and evaluation at The CommonwealthFund and has oversight responsibilities for the Fund’s survey work and programs on health care cover-age and access. Previously, Ms. Schoen was director of special projects at the University of MassachusettsLabor Relations and Research Center and on the research faculty of the UMass School of Public Health.During the 1980s, she directed the Service Employees International Union’s Research and PolicyDepartment in Washington, D.C. Earlier, she served as a member of the staff of President Carter’s nationalhealth insurance task force and as a senior health advisor during the 1988 presidential campaign. Priorto federal service, she was a research fellow at the Brookings Institution. She holds an undergraduatedegree in economics from Smith College and a graduate degree in economics from Boston College. Sheis the author and coauthor of many publications on health care coverage and quality issues.
Michelle McEvoy Doty, Ph.D., senior analyst for the Health Policy, Research, and EvaluationDepartment at The Commonwealth Fund, conducts research examining health care access and qualityamong vulnerable populations and the extent to which lack of health insurance contributes to barriersto health care and inequities in quality of care. She received her M.P.H. and Ph.D. in public health fromthe University of California, Los Angeles.
Paying More for Less: Older Adults in the Individual Insurance Market 11
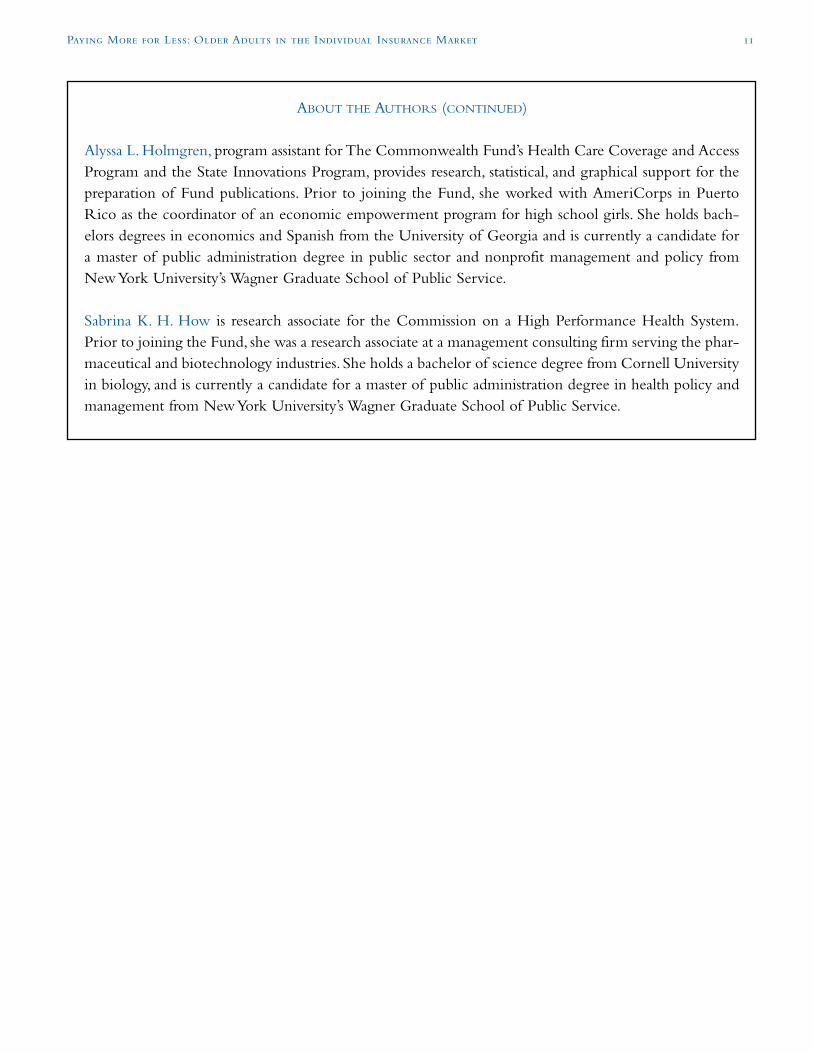
ABOUT THE AUTHORS (CONTINUED)
Alyssa L. Holmgren, program assistant for The Commonwealth Fund’s Health Care Coverage and AccessProgram and the State Innovations Program, provides research, statistical, and graphical support for thepreparation of Fund publications. Prior to joining the Fund, she worked with AmeriCorps in PuertoRico as the coordinator of an economic empowerment program for high school girls. She holds bach-elors degrees in economics and Spanish from the University of Georgia and is currently a candidate fora master of public administration degree in public sector and nonprofit management and policy fromNew York University’s Wagner Graduate School of Public Service.
Sabrina K. H. How is research associate for the Commission on a High Performance Health System.Prior to joining the Fund, she was a research associate at a management consulting firm serving the phar-maceutical and biotechnology industries. She holds a bachelor of science degree from Cornell Universityin biology, and is currently a candidate for a master of public administration degree in health policy andmanagement from New York University’s Wagner Graduate School of Public Service.
The Commonwealth Fund is a private foundation supporting independent research on health andsocial issues.The views presented here are those of the authors and not necessarily those of TheCommonwealth Fund or its directors, officers, or staff.