Embed Size (px)
Citation preview
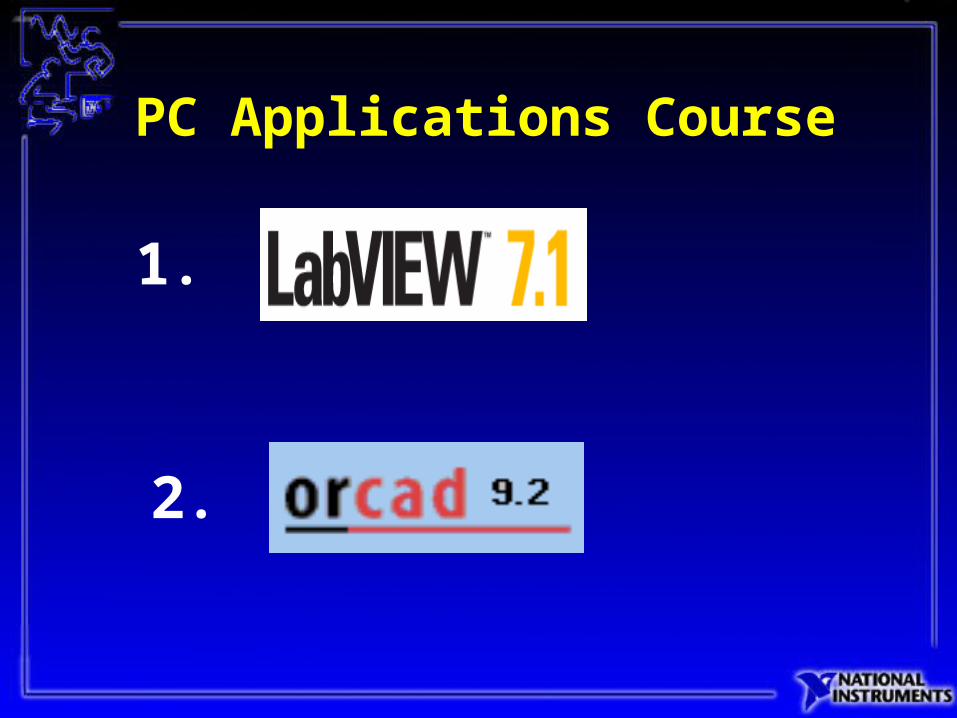
PC Applications Course
2.
1.
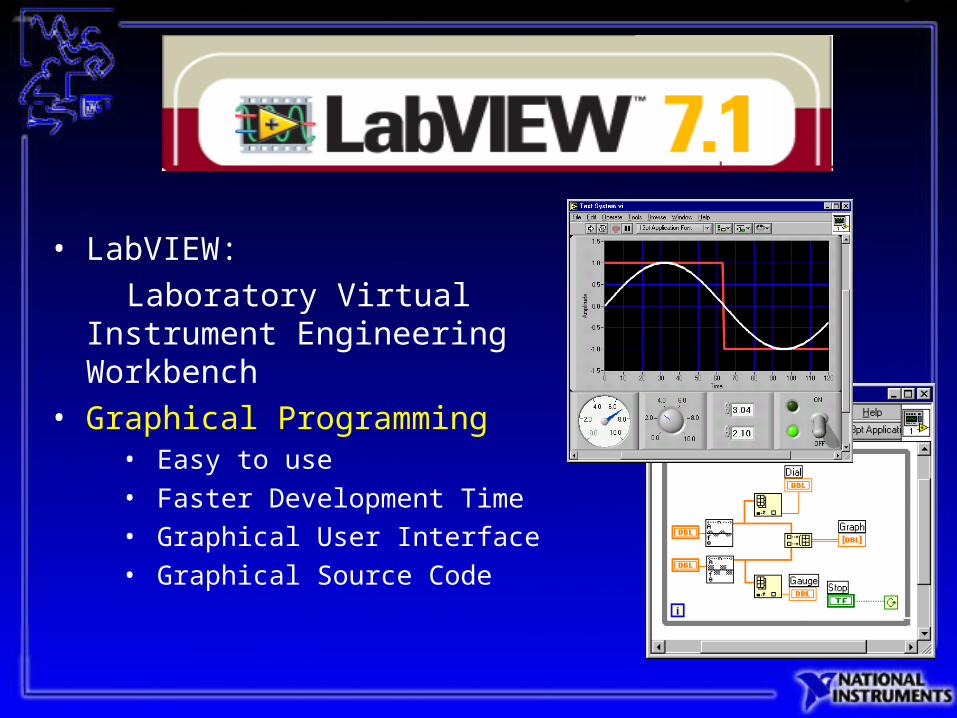
• LabVIEW:
Laboratory Virtual Instrument Engineering Workbench
• Graphical Programming• Easy to use• Faster Development Time• Graphical User Interface• Graphical Source Code
LabVIEW programs are called virtual instruments, or VIs, because their appearance and operation imitate physical instruments, such as oscilloscopes and multimeters.
LabVIEW contains a comprehensive set of tools for acquiring, analyzing, displaying, and storing data, as well as tools to help you troubleshoot your code.
In LabVIEW, you build a user interface, or front panel, with controls and indicators.
After you build the user interface, you add code using VIs and structures to control the front panelobjects..
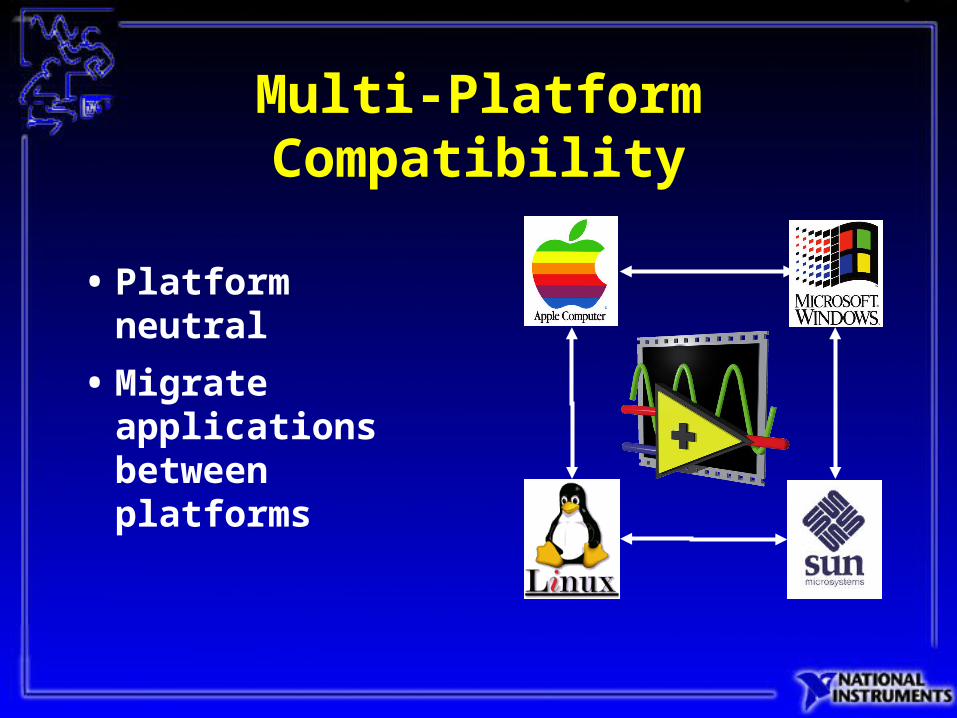
Multi-Platform Compatibility
• Platform neutral
• Migrate applications between platforms
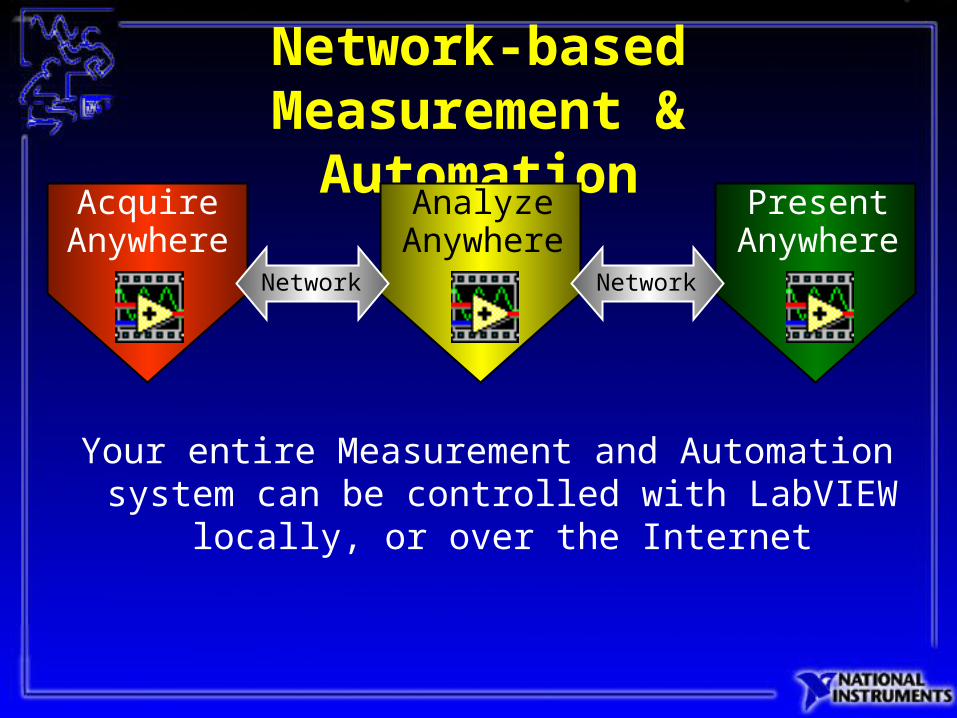
Network-based Measurement & Automation
AcquireAnywhere
AnalyzeAnywhere
PresentAnywhere
Your entire Measurement and Automation system can be controlled with LabVIEW
locally, or over the Internet
Network Network
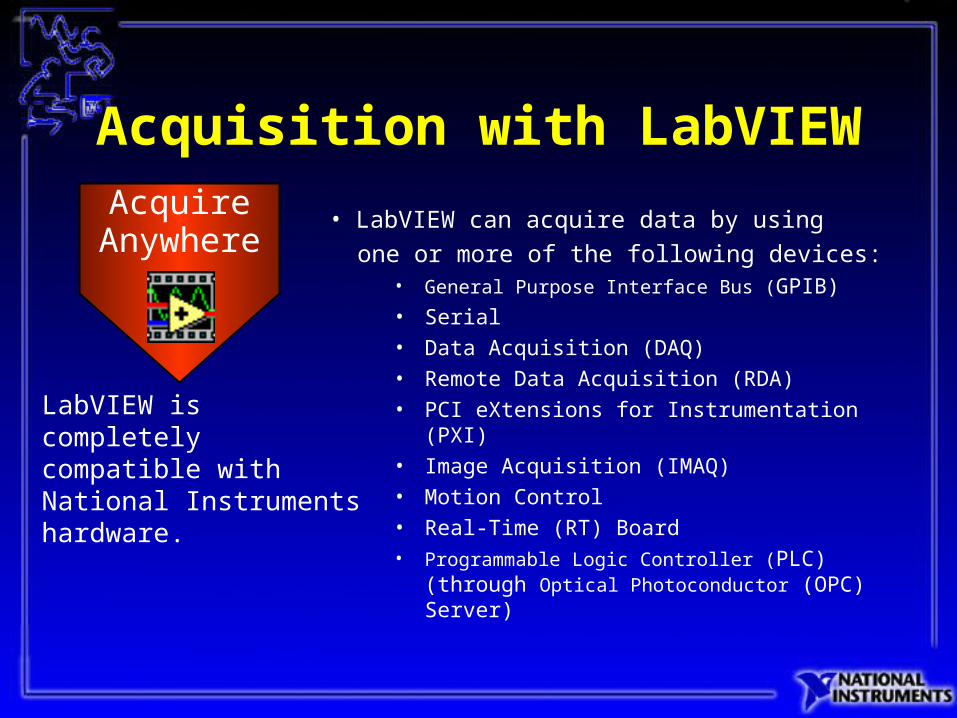
Acquisition with LabVIEW
• LabVIEW can acquire data by using
one or more of the following devices:• General Purpose Interface Bus (GPIB)
• Serial
• Data Acquisition (DAQ)
• Remote Data Acquisition (RDA)
• PCI eXtensions for Instrumentation (PXI)
• Image Acquisition (IMAQ)
• Motion Control
• Real-Time (RT) Board• Programmable Logic Controller (PLC) (through
Optical Photoconductor (OPC) Server)
LabVIEW is completely compatible with National Instruments hardware.
AcquireAnywhere
AnalyzeAnywhere
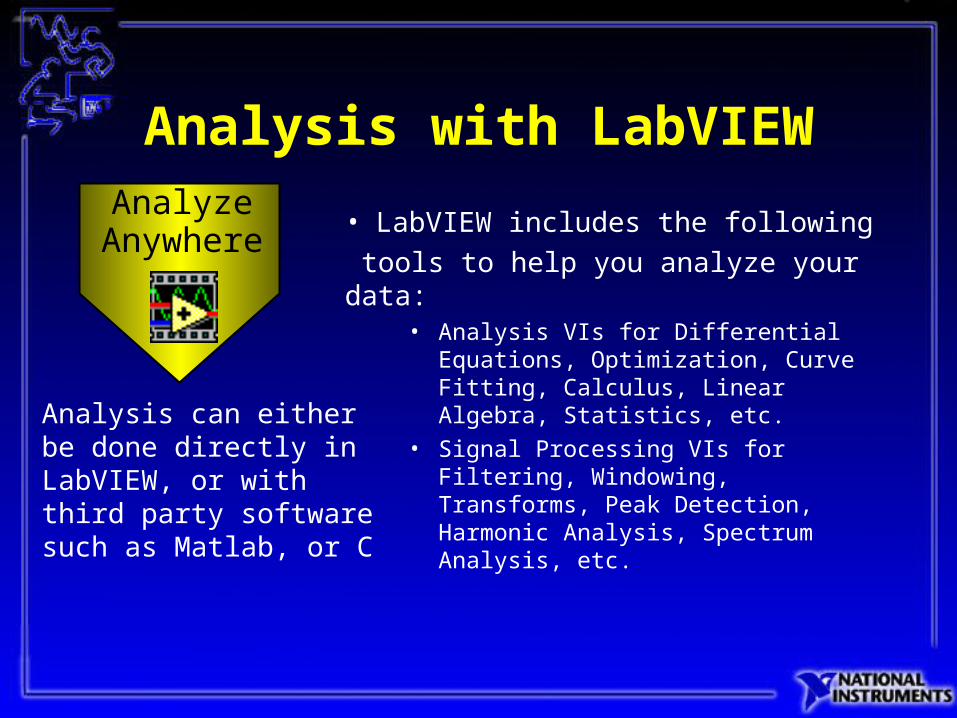
Analysis with LabVIEW
• LabVIEW includes the following
tools to help you analyze your data:• Analysis VIs for Differential
Equations, Optimization, Curve Fitting, Calculus, Linear Algebra, Statistics, etc.
• Signal Processing VIs for Filtering, Windowing, Transforms, Peak Detection, Harmonic Analysis, Spectrum Analysis, etc.
Analysis can either be done directly in LabVIEW, or with third party software such as Matlab, or C
PresentAnywhere
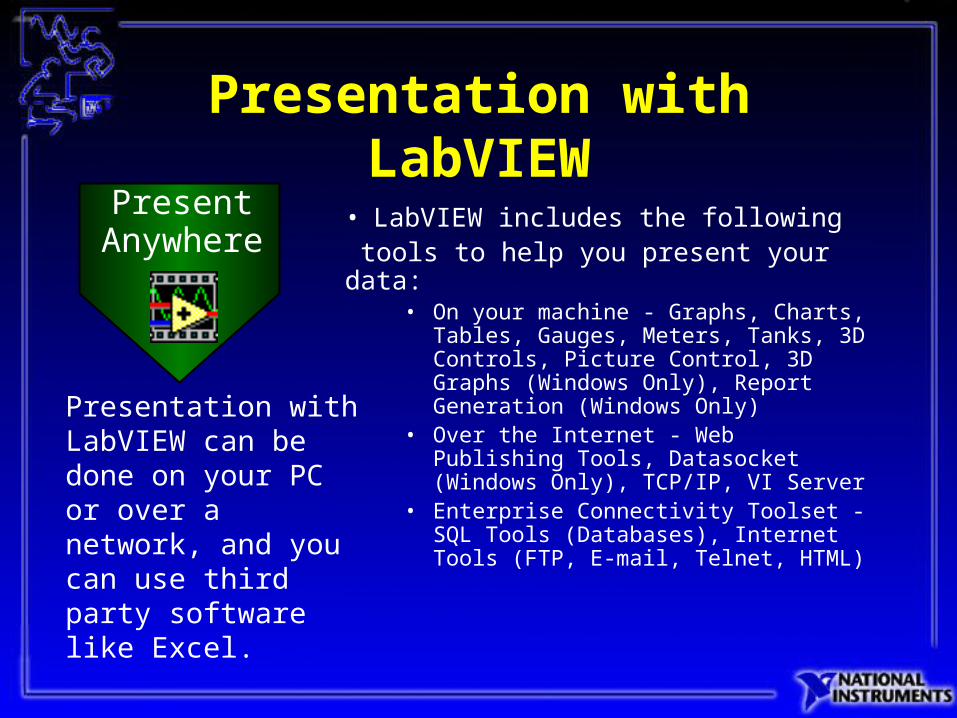
Presentation with LabVIEW
• LabVIEW includes the following tools to help you present your data:
• On your machine - Graphs, Charts, Tables, Gauges, Meters, Tanks, 3D Controls, Picture Control, 3D Graphs (Windows Only), Report Generation (Windows Only)
• Over the Internet - Web Publishing Tools, Datasocket (Windows Only), TCP/IP, VI Server
• Enterprise Connectivity Toolset - SQL Tools (Databases), Internet Tools (FTP, E-mail, Telnet, HTML)
Presentation with LabVIEW can be done on your PC or over a network, and you can use third party software like Excel.
LabVIEW Course Goals
• Use LabVIEW to create your applications• Use various debugging techniques• Understand front panels, block diagrams, and
connectors/ icons • Use both built-in LabVIEW functions and library VIs• Create and save your own VIs so you can use them
as subVIs• Create applications that use plug-in data acquisition
(DAQ) boards • Create applications that use GPIB and serial, parallel
ports instruments
This course prepares you to:
Introduction to LabVIEW
You Will Learn:
A. What a virtual instrument (VI) is
B. The LabVIEW environment
C. LabVIEW Help Options
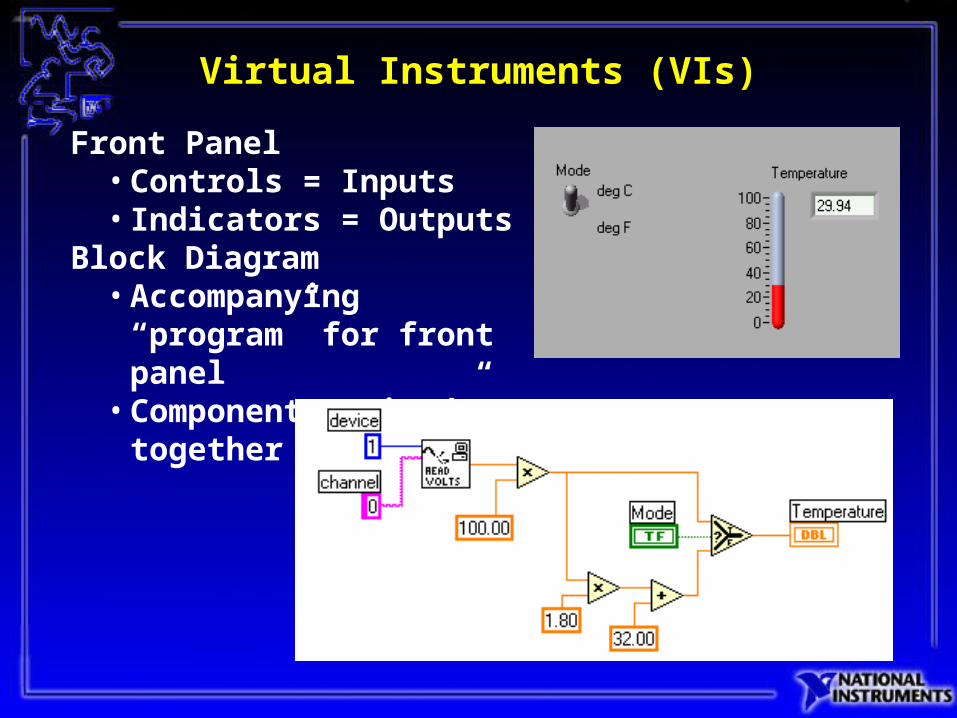
Virtual Instruments (VIs)
Front Panel• Controls = Inputs• Indicators = Outputs
Block Diagram• Accompanying “program”
for front panel• Components “wired”
together
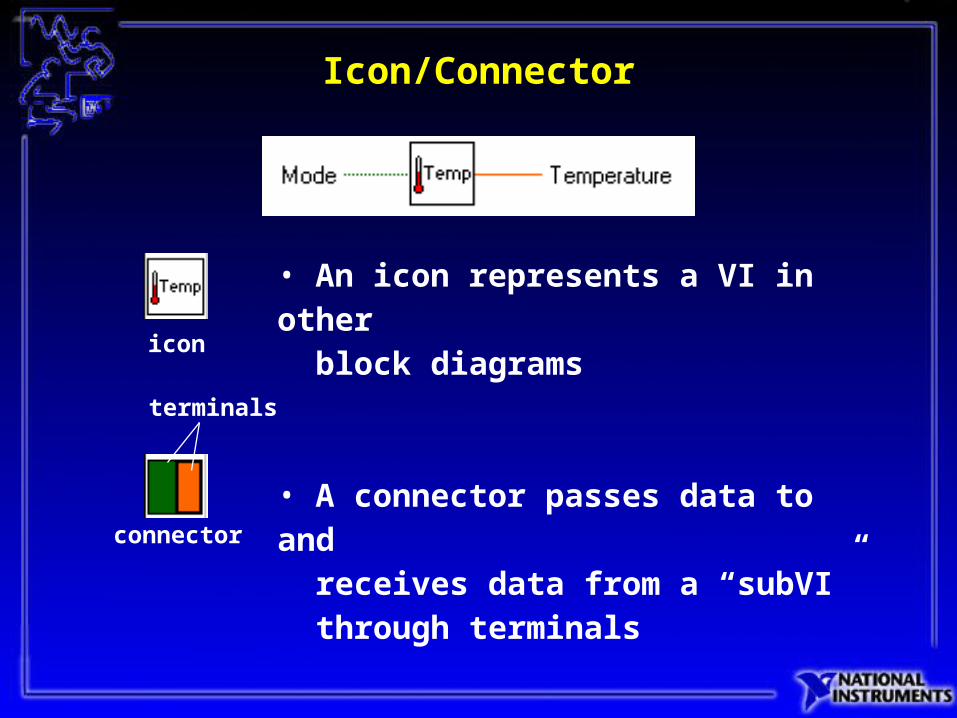
Icon/Connector
• An icon represents a VI in other block diagrams
• A connector passes data to and receives data from a “subVI” through terminals
icon
connector
terminals
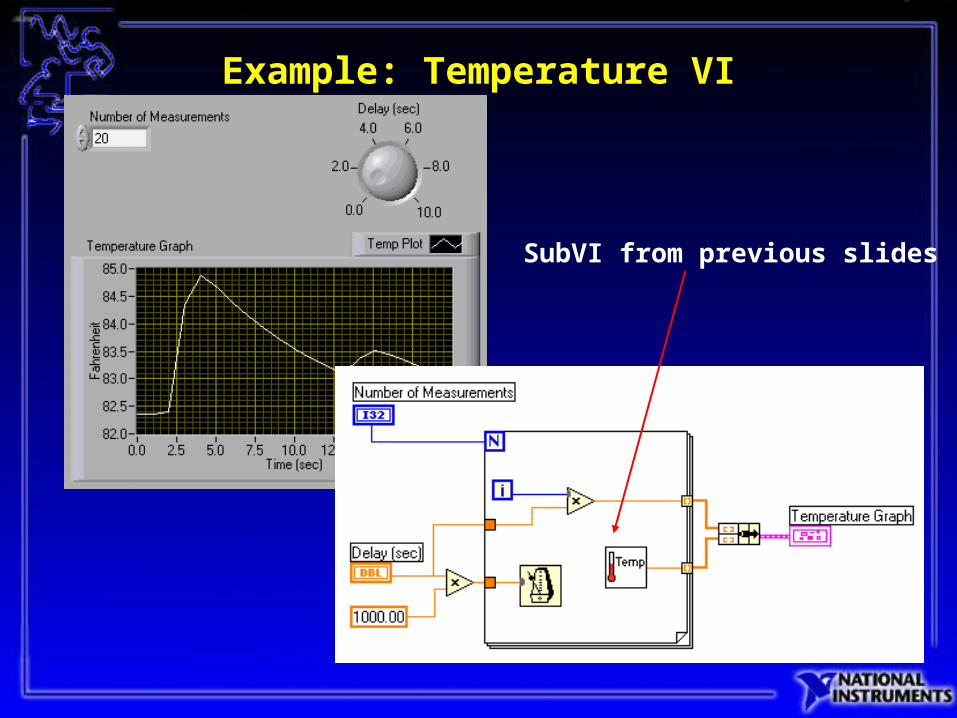
Example: Temperature VI
SubVI from previous slides
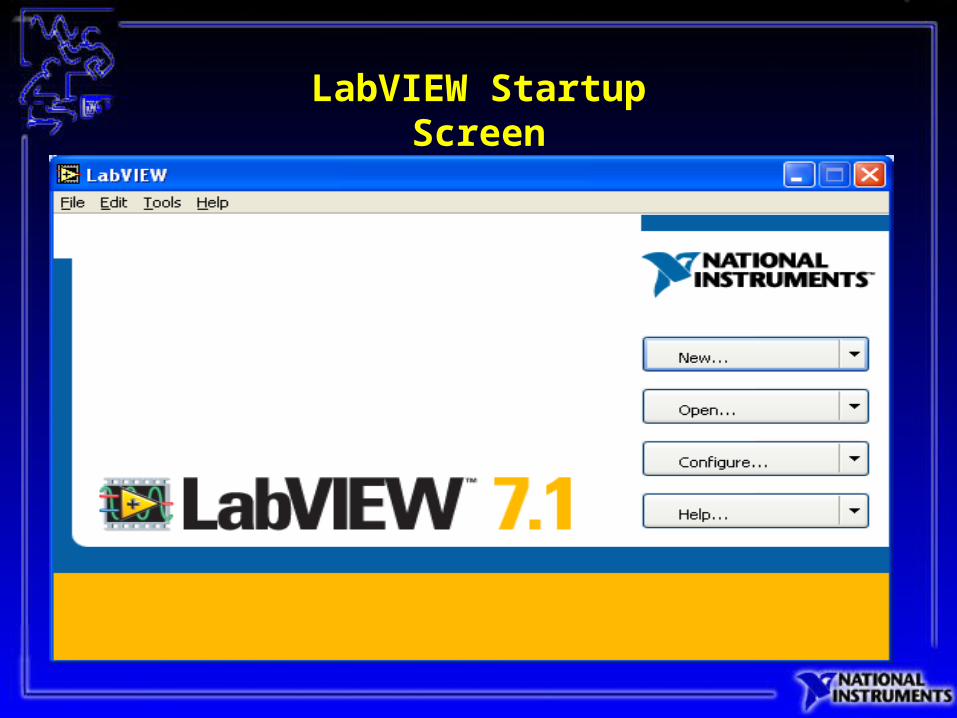
LabVIEW Startup Screen
Front Panel Window
The front panel is the user interface of a VI. You build the front panel by using controls and indicators, which are the interactive input and output terminals of the VI, respectively.
Controls are knobs, push buttons. Controls simulate the input devices on a physical instrument and supply data to the block diagram of the VI.
Indicators are graphs, LEDs. Indicators simulate the output devices on a physical instrument and display data the block diagram acquires or generates.
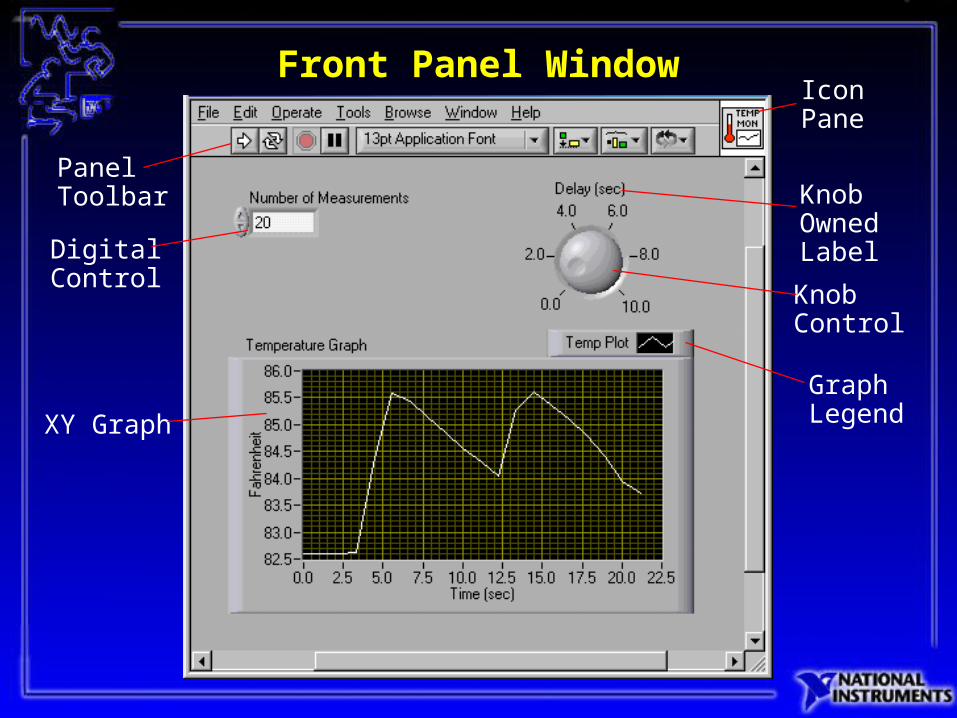
Front Panel Window
Panel Toolbar
IconPane
Digital Control
KnobOwned Label
KnobControl
GraphLegendXY Graph
Block Diagram Window
The block diagram contains the graphical source code for how the VI runs.
Front panel objects appear as icon/terminals on the block diagram.
Wires connect control and indicator terminals to Express VIs.
Data flows from controls to Express VIs, and from Express VIs to indicators through the wires.
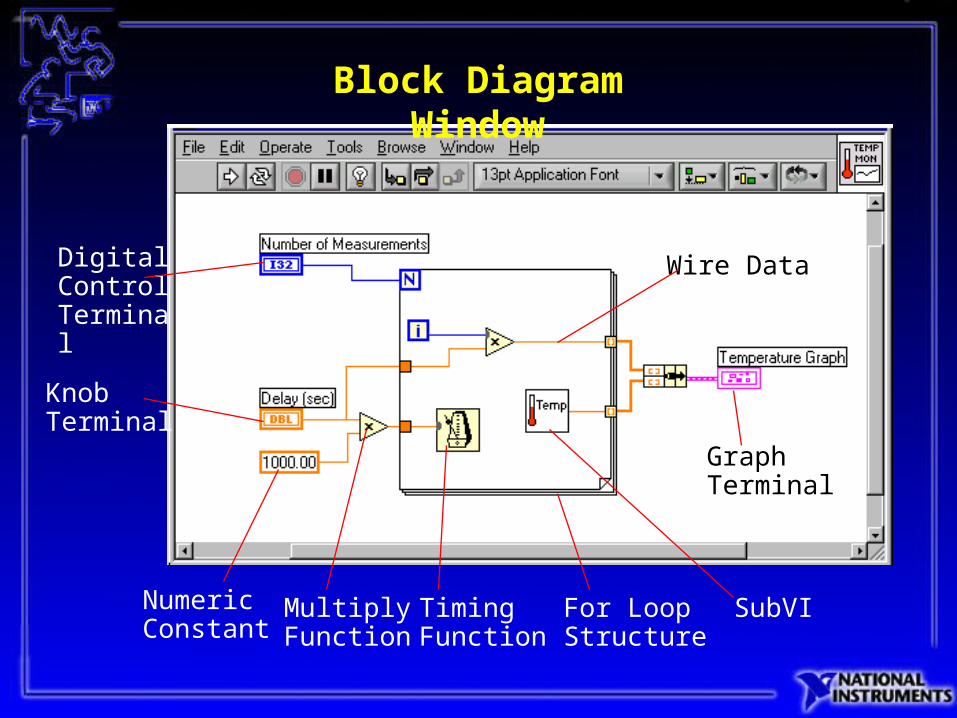
Block Diagram Window
Wire Data
GraphTerminal
SubVIFor LoopStructure
Digital ControlTerminal
MultiplyFunction
Numeric Constant
Knob Terminal
Timing Function
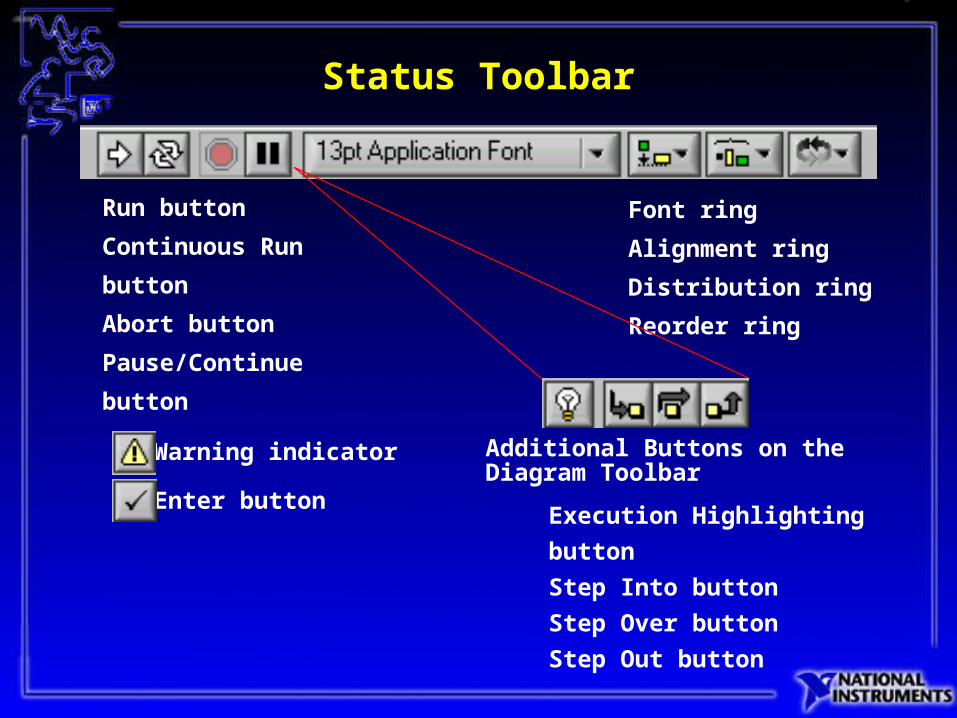
Status Toolbar
Run button
Continuous Run button
Abort button
Pause/Continue button
Execution Highlighting button
Step Into button
Step Over button
Step Out button
Warning indicator
Enter button
Additional Buttons on the Diagram Toolbar
Font ring
Alignment ring
Distribution ring
Reorder ring
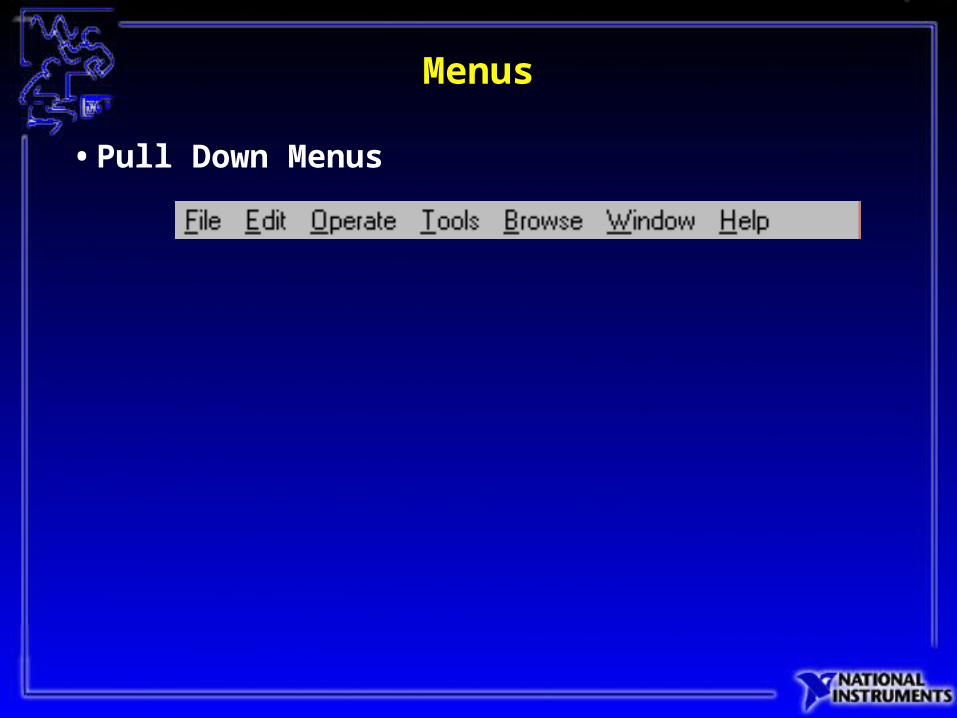
Menus
• Pull Down Menus
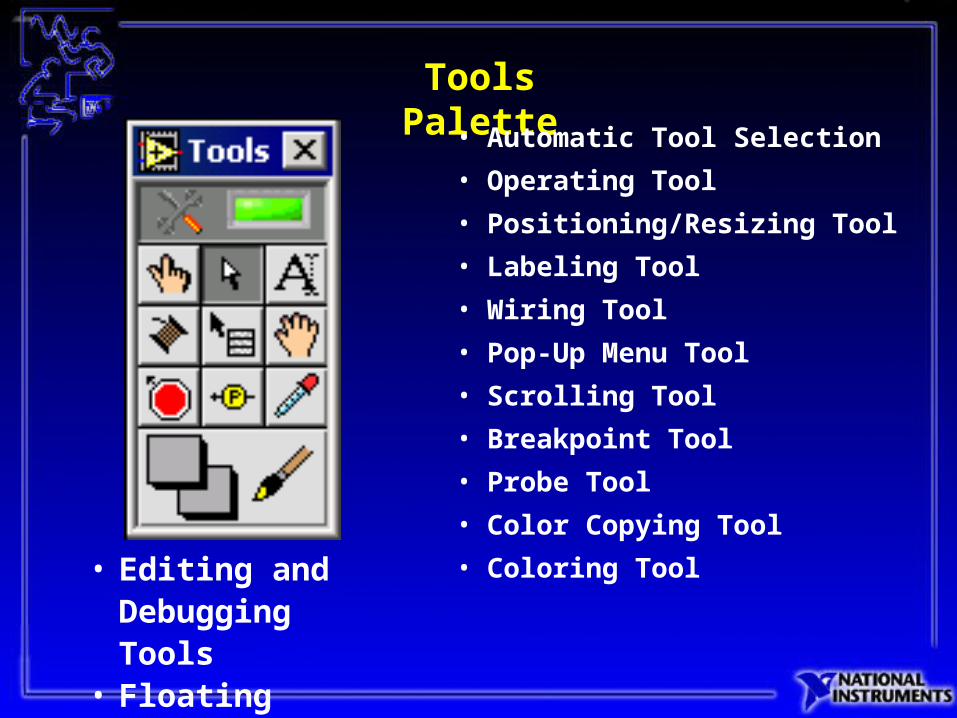
Tools Palette
• Automatic Tool Selection
• Operating Tool
• Positioning/Resizing Tool
• Labeling Tool
• Wiring Tool
• Pop-Up Menu Tool
• Scrolling Tool
• Breakpoint Tool
• Probe Tool
• Color Copying Tool
• Coloring Tool• Editing and
Debugging Tools• Floating Palette
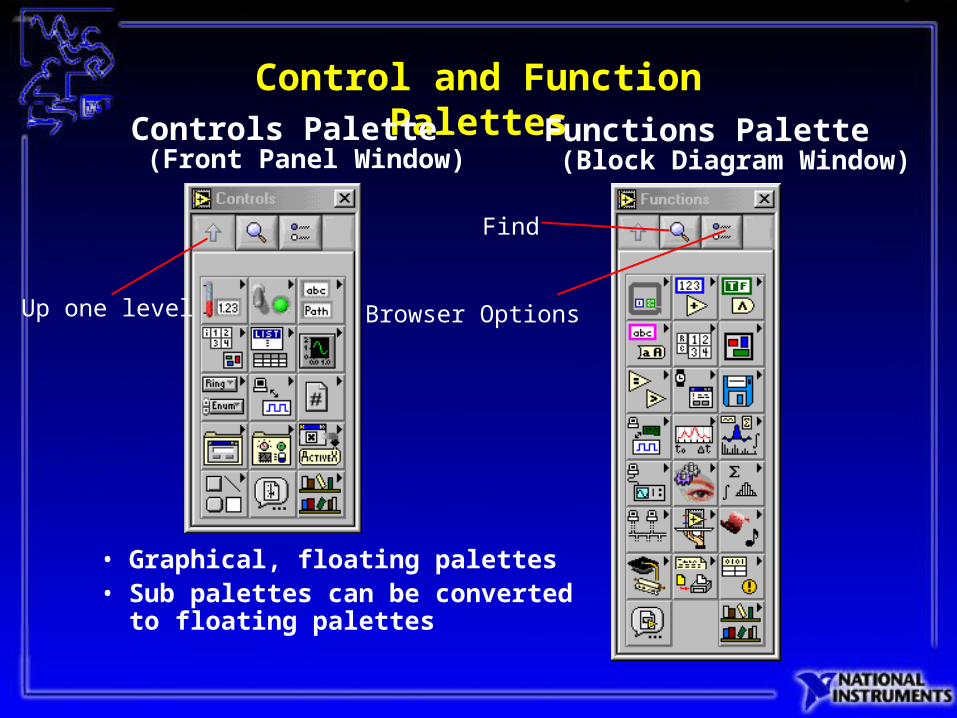
Control and Function Palettes
• Graphical, floating palettes • Sub palettes can be converted
to floating palettes
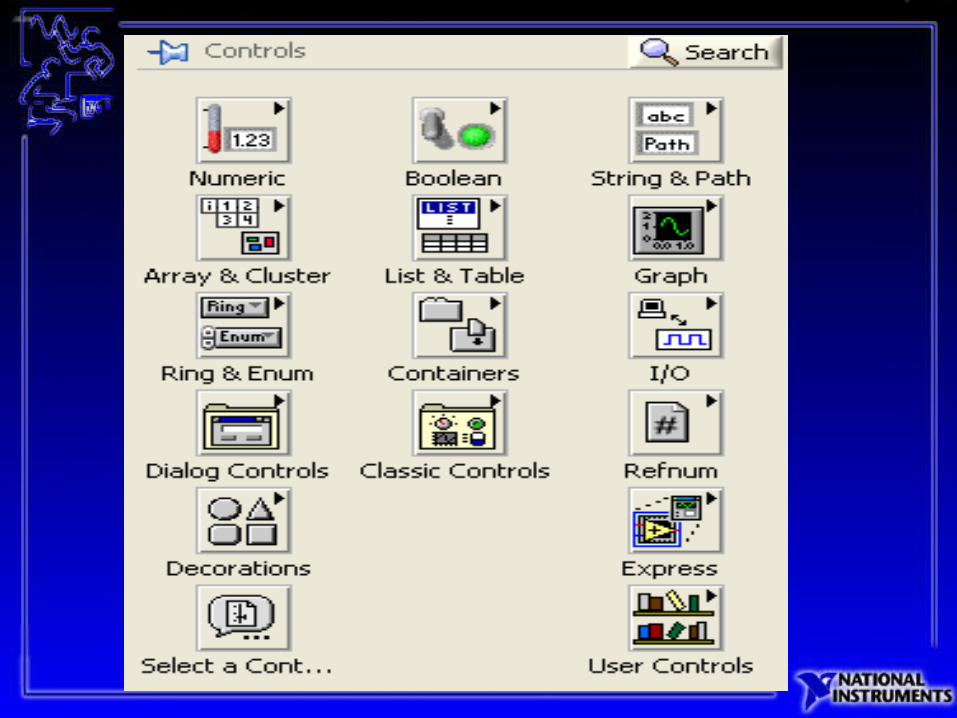
Controls Palette (Front Panel Window)
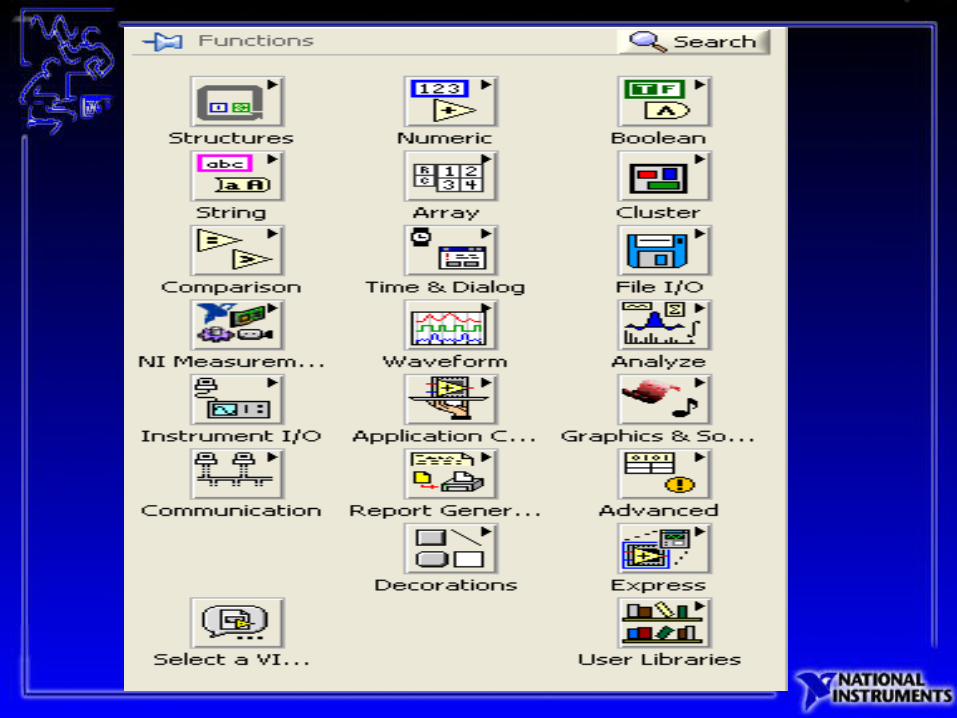
Functions Palette (Block Diagram Window)
Find
Browser OptionsUp one level
Help Options
Show Context Help (Help menu)
• Simple/Detailed Diagram Help
Contents and Index (Help menu)• All menus online• Right-click on functions in diagram to
access online info directly
Summary
• Virtual instruments (VIs) have three main parts: the front panel, the block diagram, and the icon/connector
• The front panel is the user interface of a LabVIEW program and the block diagram is the executable code
• Menu options allow you to access different features in LabVIEW
• Floating Palettes
• Tools Palette • Controls Palette (only when Panel Window is active)• Functions Palette (only when Diagram Window is
active)• There are help utilities including the Context Help
Window and Contents and Index...