Embed Size (px)
Citation preview
PCMH 2017:What’s Next?
William Golden MD MACP
Medical Director, AR Medicaid
UAMS Prof. of Medicine and Public Health
Agenda
• Primary Care Payment Reform
• PCMH 2016
• CPC+ vs PCMH
• Quality Measures
• Medical Neighborhood Report
PRIMARY CARE PAYMENT MODEL (PCPM) WORK GROUPMAY 2016
Primary Care Payment Reform
• LAN white paper
• Insurance Risk vs Small Practice Participation
5
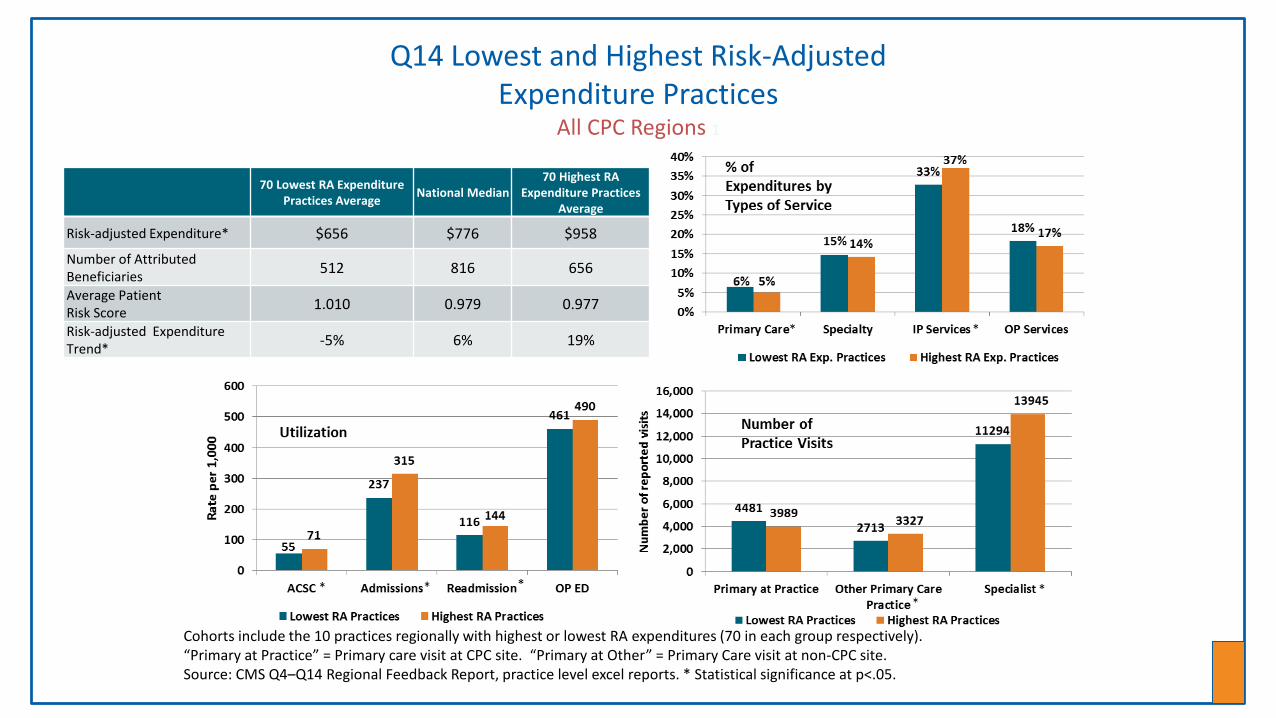
Q14 Lowest and Highest Risk-Adjusted Expenditure Practices
All CPC Regions 1
70 Lowest RA Expenditure Practices Average
National Median70 Highest RA
Expenditure Practices Average
Risk-adjusted Expenditure* $656 $776 $958
Number of Attributed Beneficiaries 512 816 656
Average Patient Risk Score 1.010 0.979 0.977
Risk-adjusted Expenditure Trend* -5% 6% 19%
6
Cohorts include the 10 practices regionally with highest or lowest RA expenditures (70 in each group respectively). “Primary at Practice” = Primary care visit at CPC site. “Primary at Other” = Primary Care visit at non-CPC site.Source: CMS Q4–Q14 Regional Feedback Report, practice level excel reports. * Statistical significance at p<.05.
7
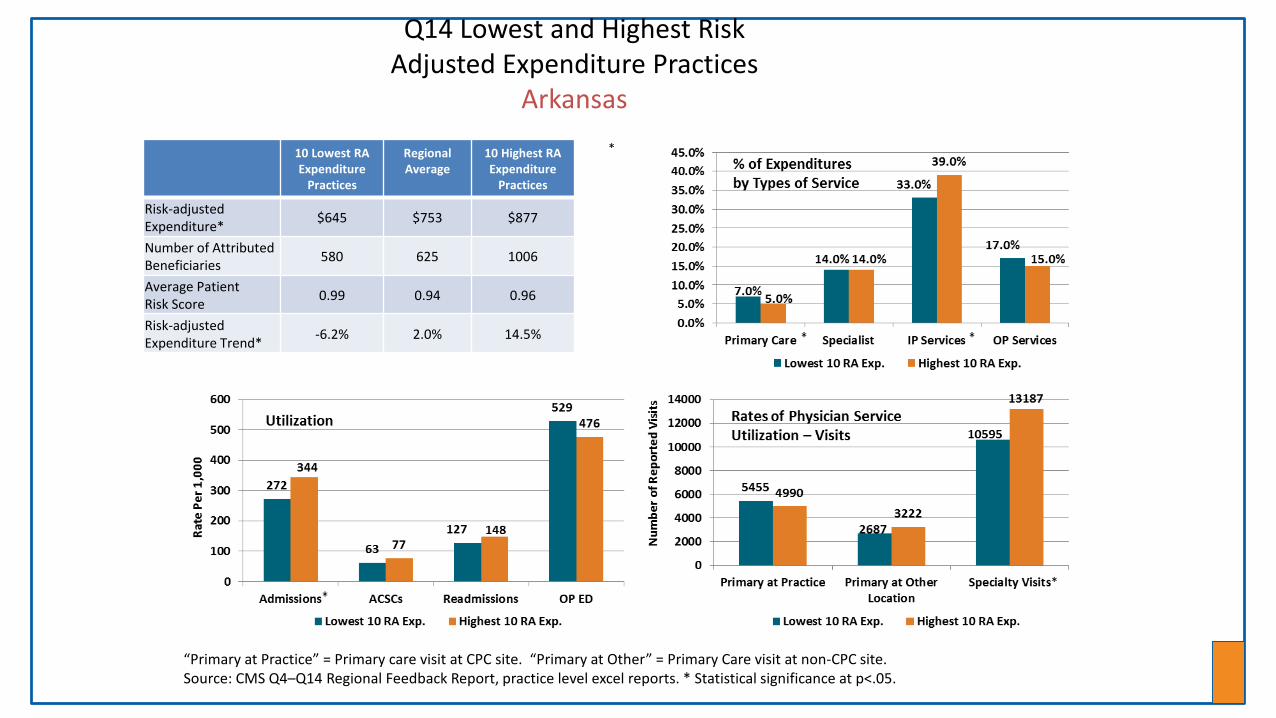
Q14 Lowest and Highest Risk Adjusted Expenditure Practices
Arkansas
10 Lowest RA Expenditure
Practices
RegionalAverage
10 Highest RA Expenditure
Practices
Risk-adjusted Expenditure*
$645 $753 $877
Number of Attributed Beneficiaries
580 625 1006
Average Patient Risk Score
0.99 0.94 0.96
Risk-adjusted Expenditure Trend*
-6.2% 2.0% 14.5%
*
“Primary at Practice” = Primary care visit at CPC site. “Primary at Other” = Primary Care visit at non-CPC site.Source: CMS Q4–Q14 Regional Feedback Report, practice level excel reports. * Statistical significance at p<.05.
8
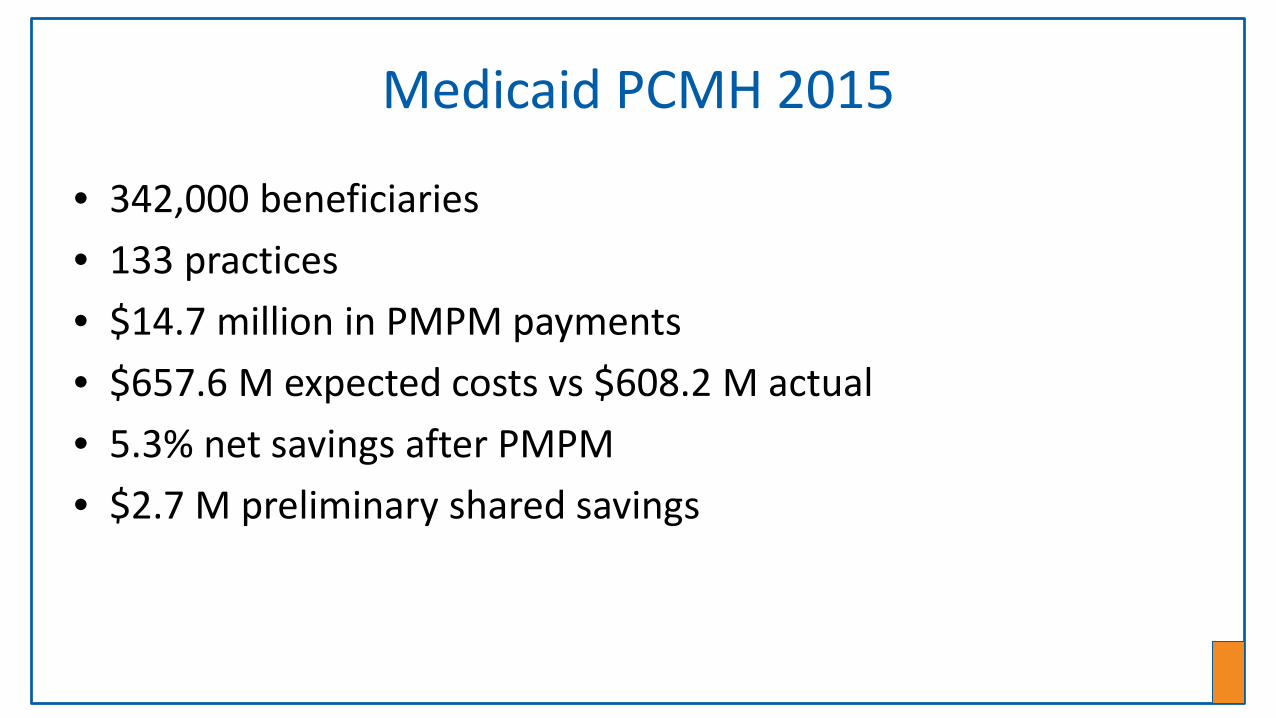
Medicaid PCMH 2015
• 342,000 beneficiaries
• 133 practices
• $14.7 million in PMPM payments
• $657.6 M expected costs vs $608.2 M actual
• 5.3% net savings after PMPM
• $2.7 M preliminary shared savings
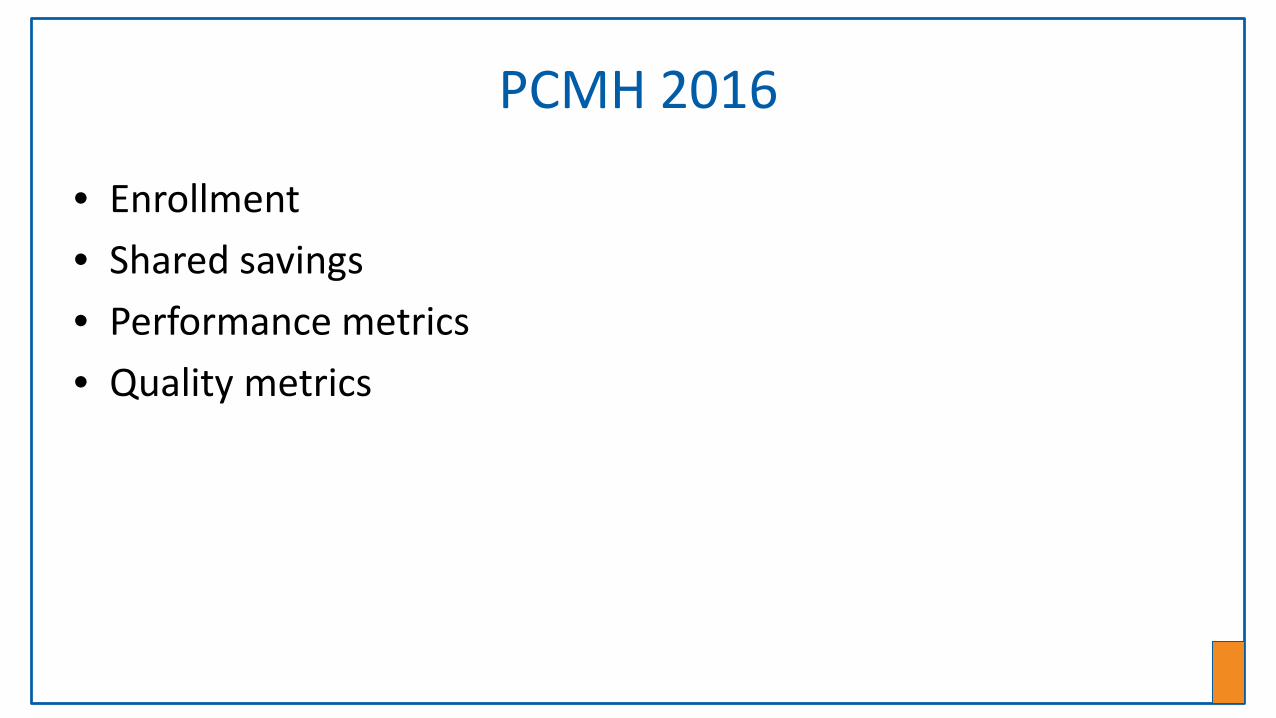
PCMH 2016
• Enrollment
• Shared savings
• Performance metrics
• Quality metrics
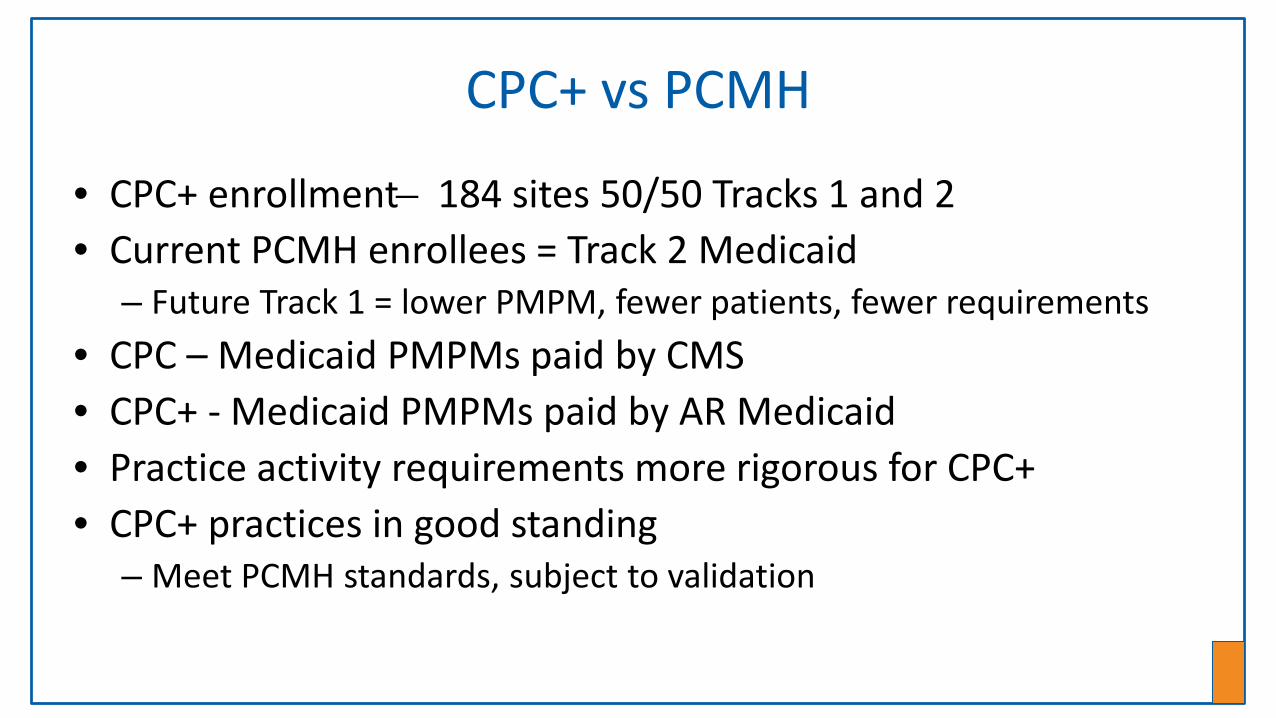
CPC+ vs PCMH
• CPC+ enrollment ̶ 184 sites 50/50 Tracks 1 and 2• Current PCMH enrollees = Track 2 Medicaid
– Future Track 1 = lower PMPM, fewer patients, fewer requirements
• CPC – Medicaid PMPMs paid by CMS• CPC+ - Medicaid PMPMs paid by AR Medicaid• Practice activity requirements more rigorous for CPC+• CPC+ practices in good standing
– Meet PCMH standards, subject to validation
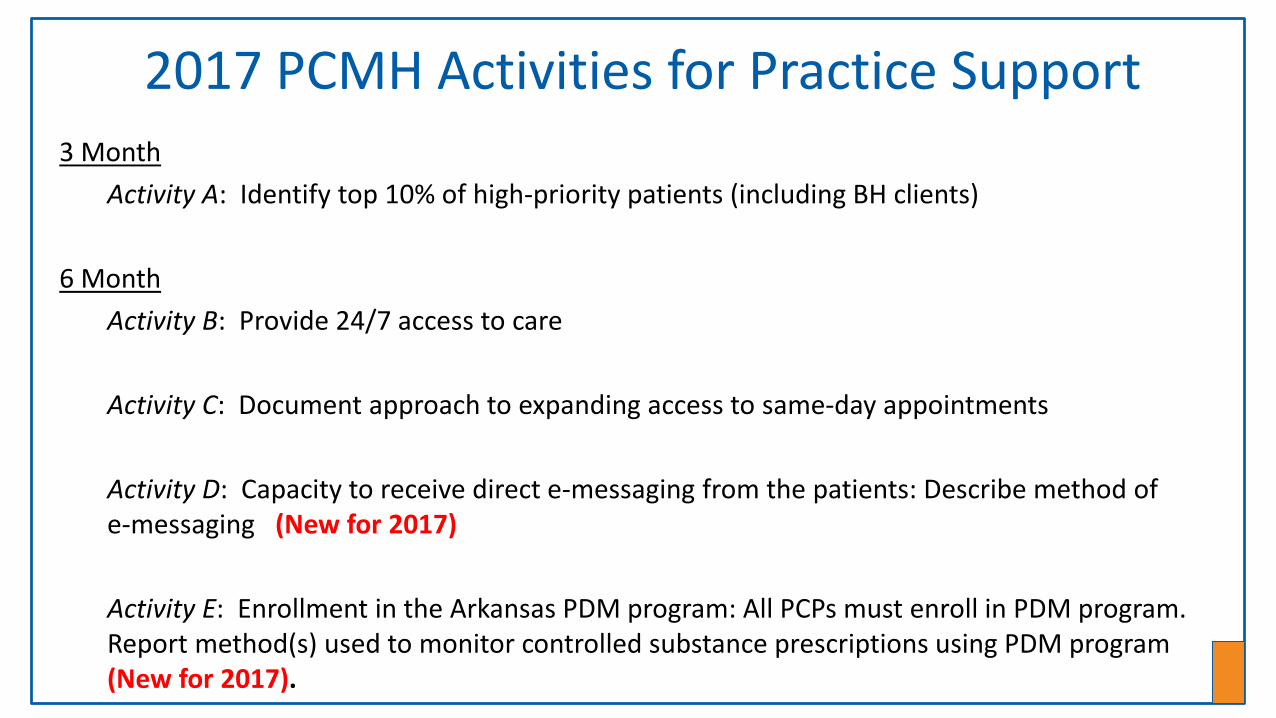
2017 PCMH Activities for Practice Support3 Month
Activity A: Identify top 10% of high-priority patients (including BH clients)
6 Month
Activity B: Provide 24/7 access to care
Activity C: Document approach to expanding access to same-day appointments
Activity D: Capacity to receive direct e-messaging from the patients: Describe method of e-messaging (New for 2017)
Activity E: Enrollment in the Arkansas PDM program: All PCPs must enroll in PDM program. Report method(s) used to monitor controlled substance prescriptions using PDM program (New for 2017).
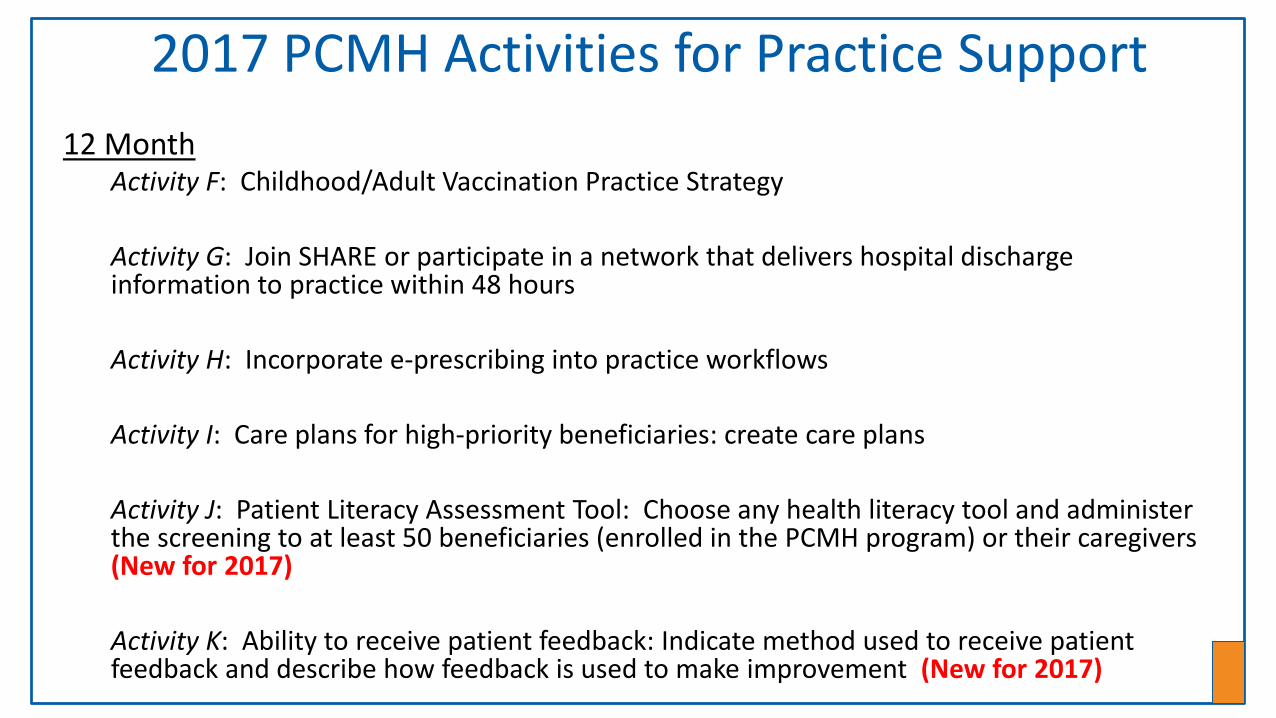
2017 PCMH Activities for Practice Support12 Month
Activity F: Childhood/Adult Vaccination Practice Strategy
Activity G: Join SHARE or participate in a network that delivers hospital discharge information to practice within 48 hours
Activity H: Incorporate e-prescribing into practice workflows
Activity I: Care plans for high-priority beneficiaries: create care plans
Activity J: Patient Literacy Assessment Tool: Choose any health literacy tool and administer the screening to at least 50 beneficiaries (enrolled in the PCMH program) or their caregivers (New for 2017)
Activity K: Ability to receive patient feedback: Indicate method used to receive patient feedback and describe how feedback is used to make improvement (New for 2017)
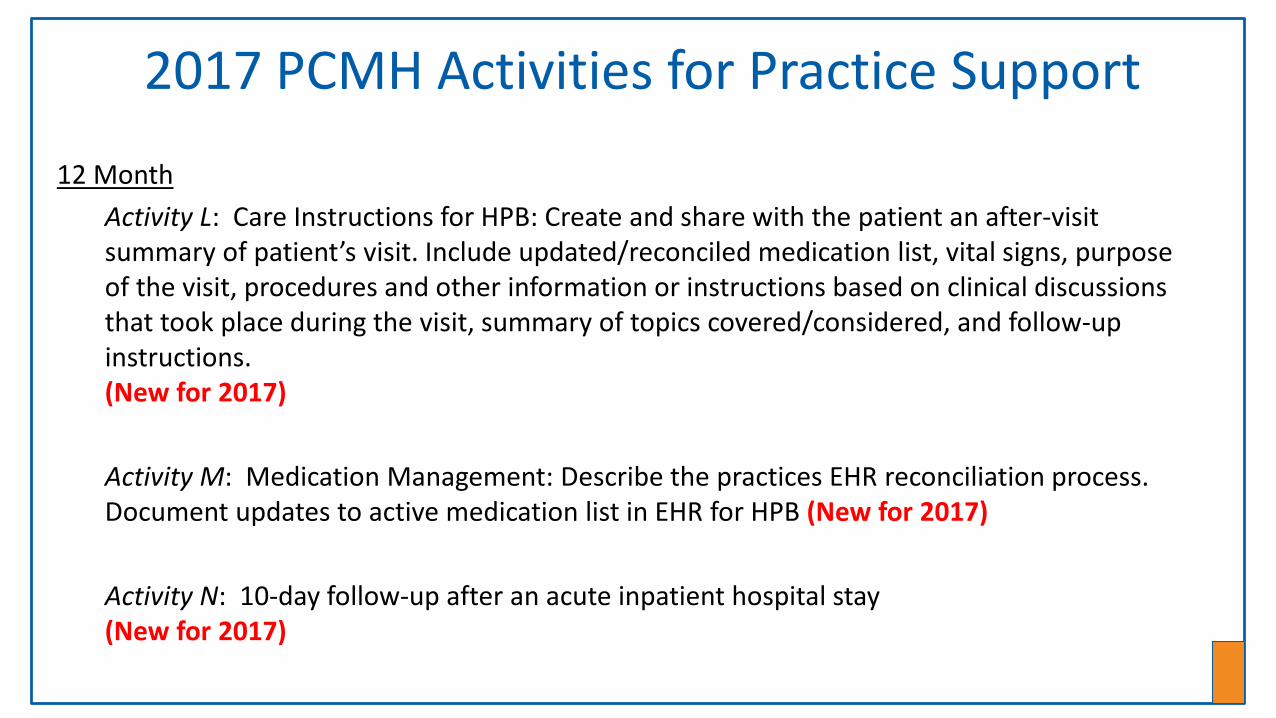
2017 PCMH Activities for Practice Support
12 Month
Activity L: Care Instructions for HPB: Create and share with the patient an after-visit summary of patient’s visit. Include updated/reconciled medication list, vital signs, purpose of the visit, procedures and other information or instructions based on clinical discussions that took place during the visit, summary of topics covered/considered, and follow-up instructions. (New for 2017)
Activity M: Medication Management: Describe the practices EHR reconciliation process. Document updates to active medication list in EHR for HPB (New for 2017)
Activity N: 10-day follow-up after an acute inpatient hospital stay (New for 2017)
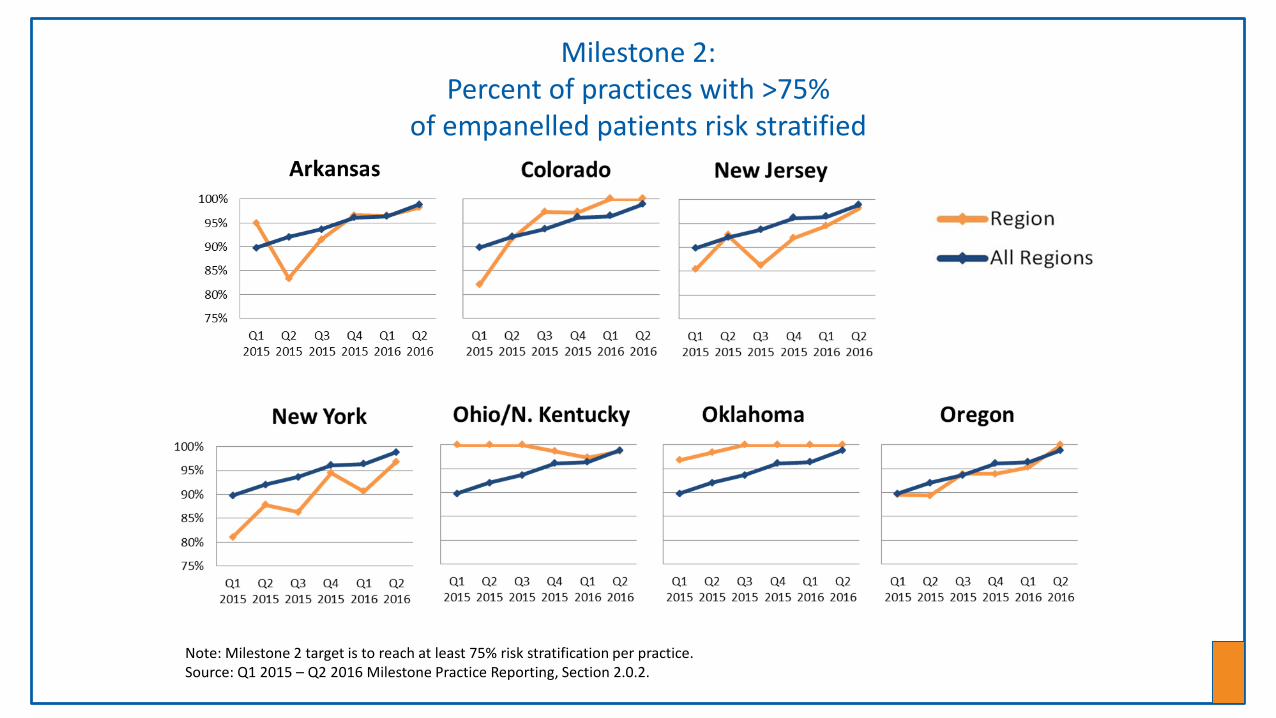
Milestone 2: Percent of practices with >75%
of empanelled patients risk stratified
17
Note: Milestone 2 target is to reach at least 75% risk stratification per practice.Source: Q1 2015 – Q2 2016 Milestone Practice Reporting, Section 2.0.2.
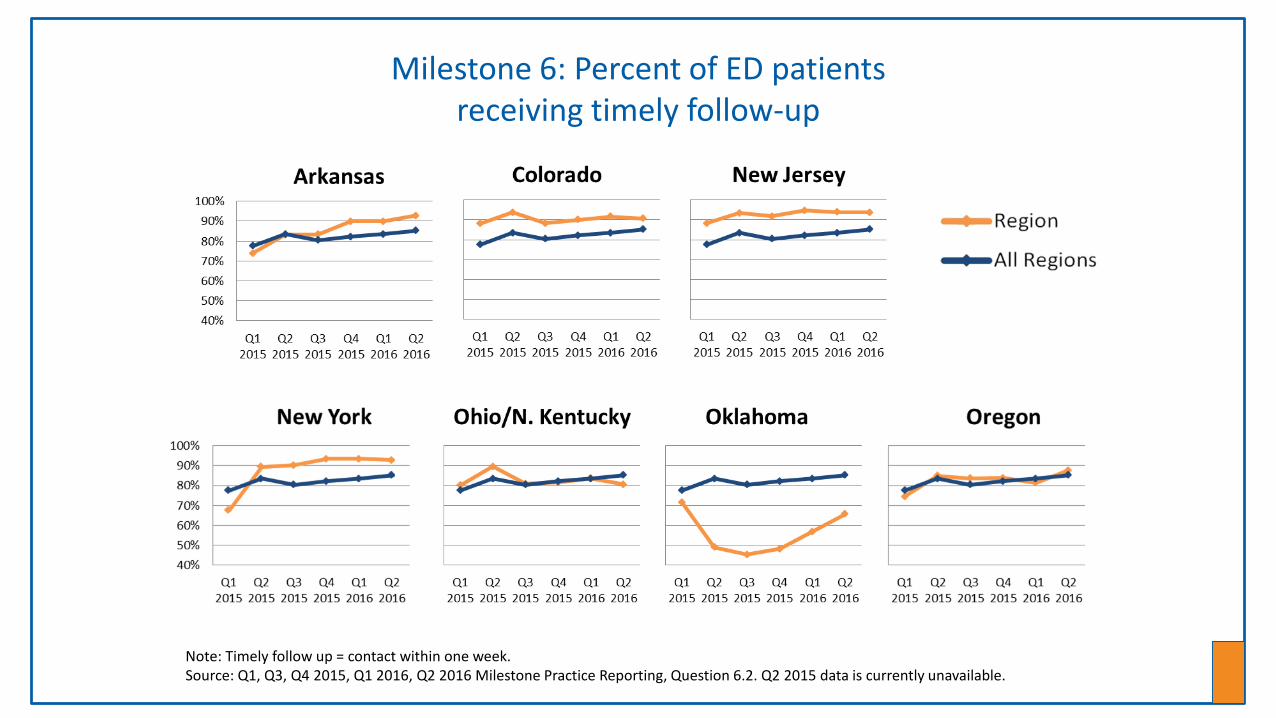
Milestone 6: Percent of ED patients receiving timely follow-up
18
Note: Timely follow up = contact within one week. Source: Q1, Q3, Q4 2015, Q1 2016, Q2 2016 Milestone Practice Reporting, Question 6.2. Q2 2015 data is currently unavailable.
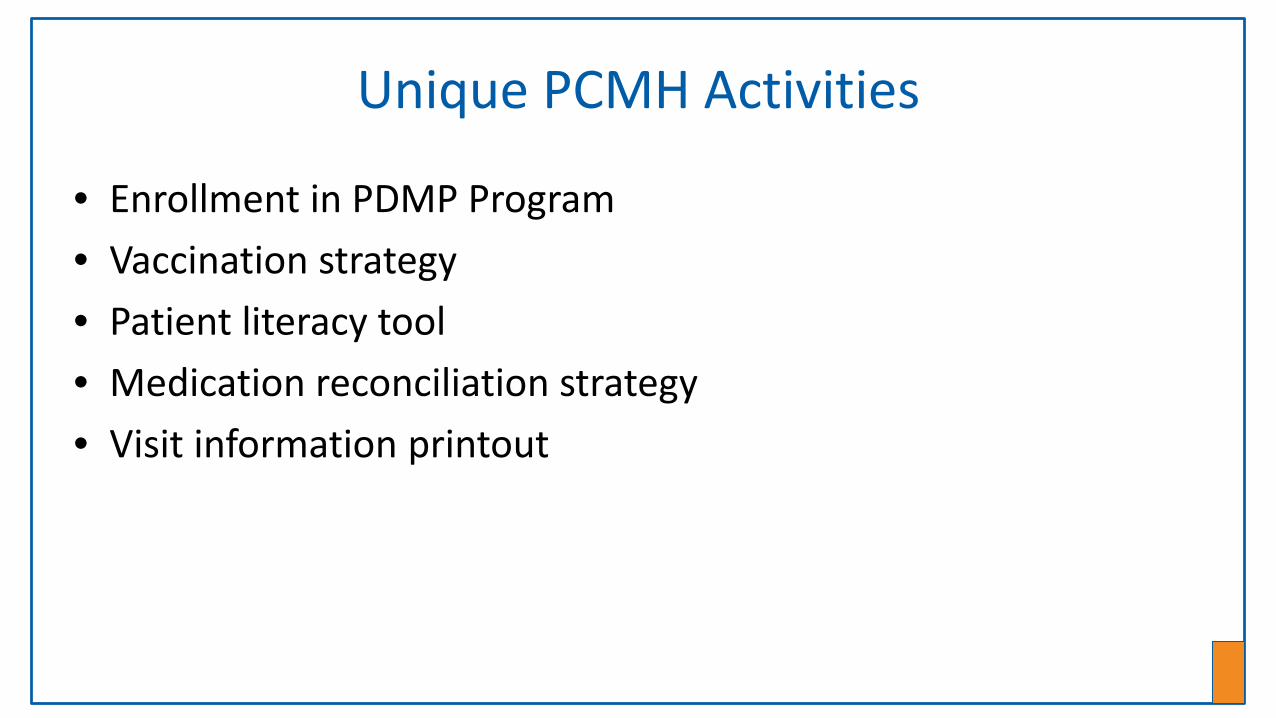
Unique PCMH Activities
• Enrollment in PDMP Program
• Vaccination strategy
• Patient literacy tool
• Medication reconciliation strategy
• Visit information printout
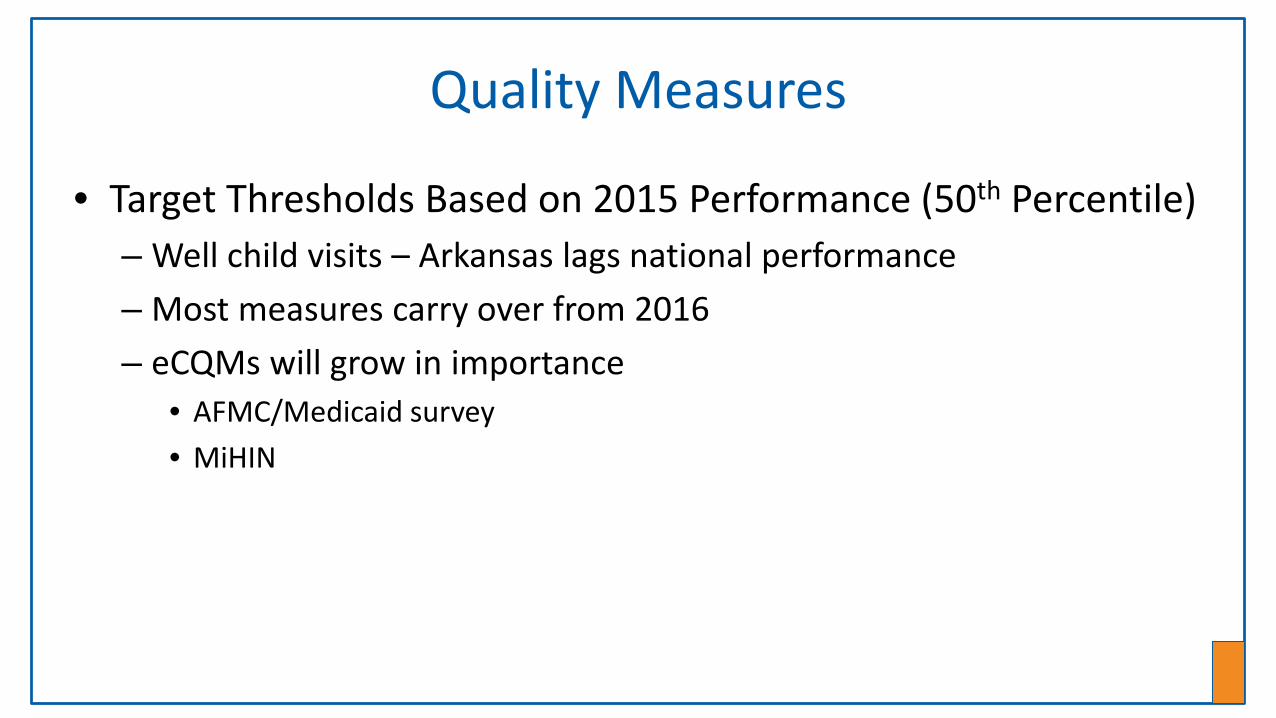
Quality Measures
• Target Thresholds Based on 2015 Performance (50th Percentile)– Well child visits – Arkansas lags national performance
– Most measures carry over from 2016
– eCQMs will grow in importance• AFMC/Medicaid survey
• MiHIN
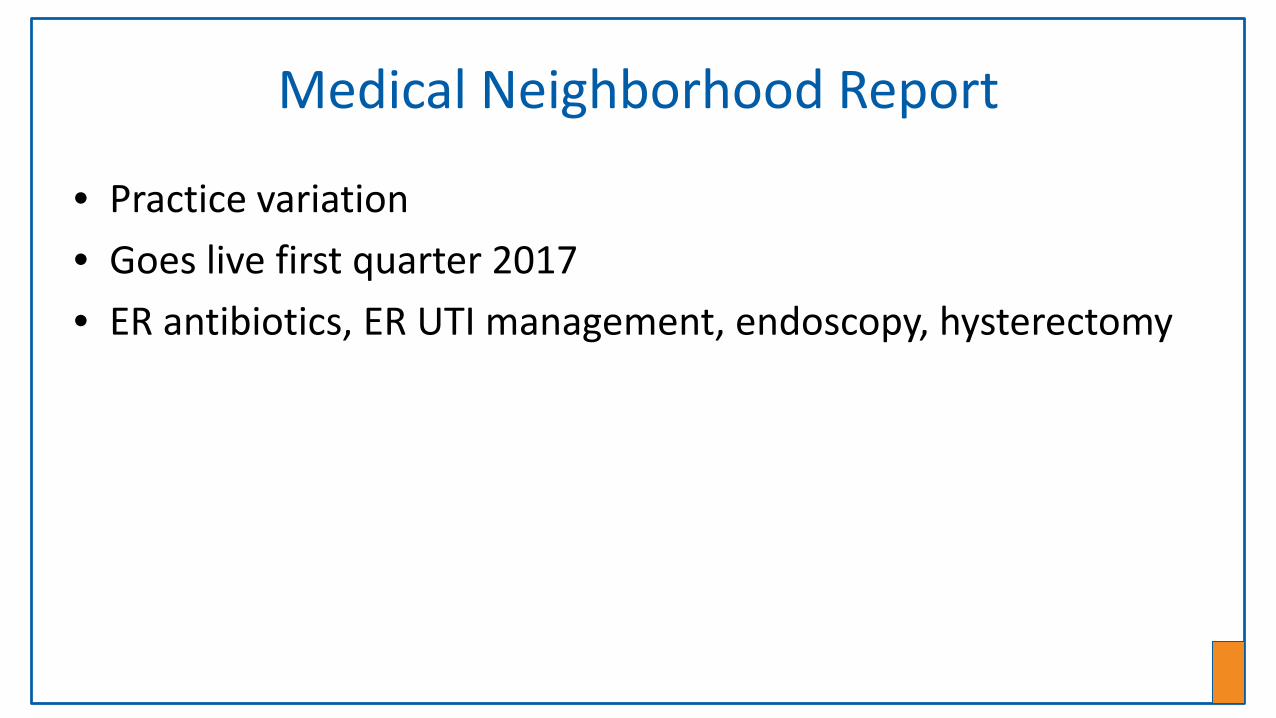
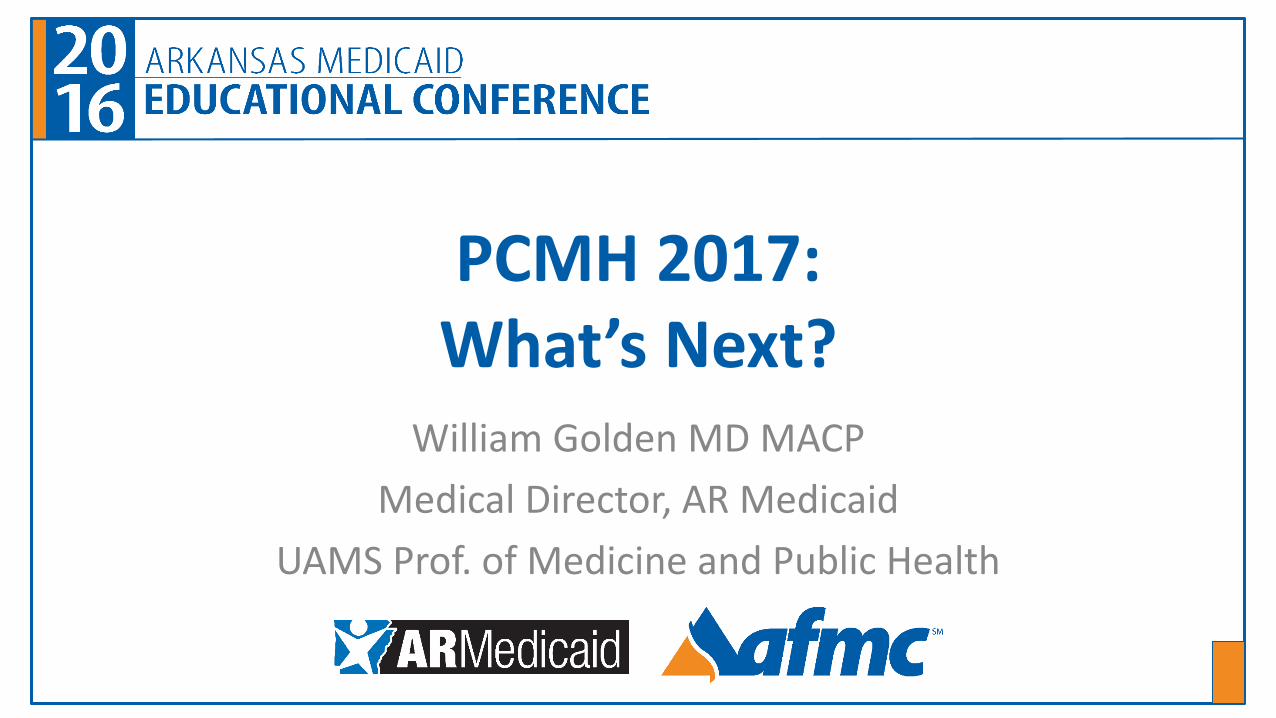
Medical Neighborhood Report
• Practice variation
• Goes live first quarter 2017
• ER antibiotics, ER UTI management, endoscopy, hysterectomy
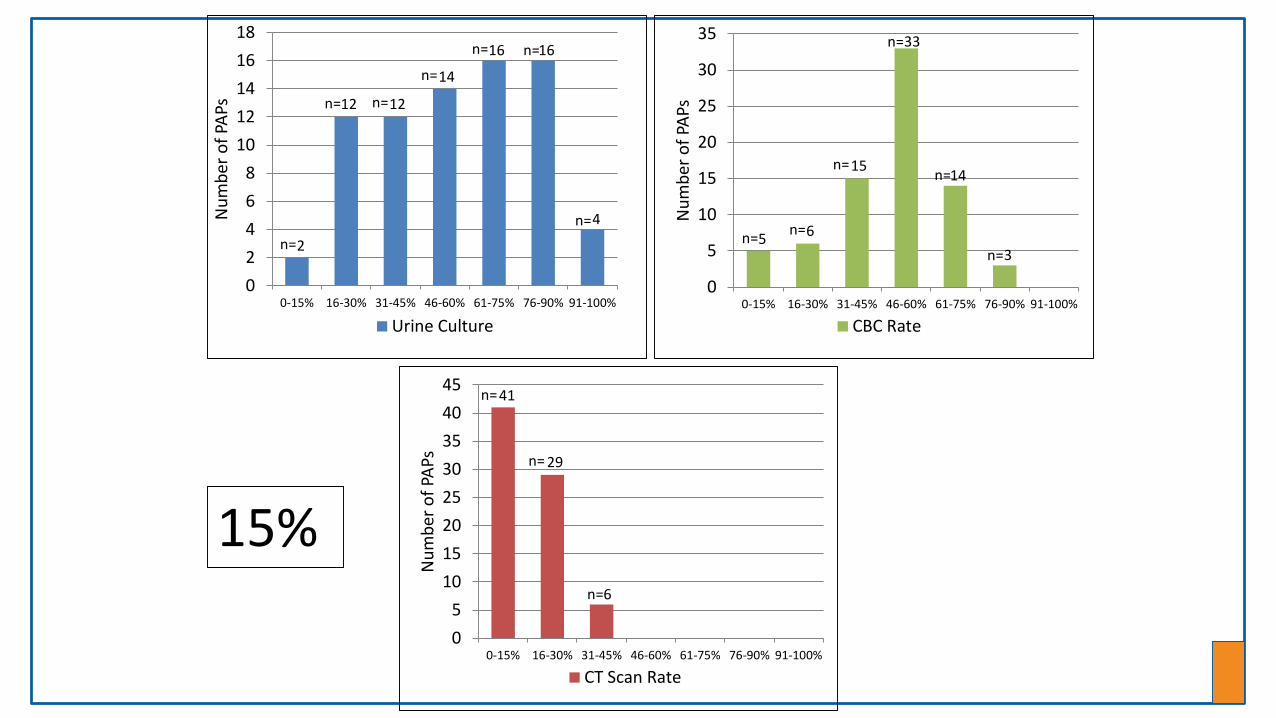
5 6
15
33
14
3
0
5
10
15
20
25
30
35
0-15% 16-30% 31-45% 46-60% 61-75% 76-90% 91-100%
Num
ber o
f PA
Ps
CBC Rate
n=
n=
n=
n=
n= n= 2
12 12
14
16 16
4
0
2
4
6
8
10
12
14
16
18
0-15% 16-30% 31-45% 46-60% 61-75% 76-90% 91-100%
Num
ber o
f PA
Ps
Urine Culture
n=
n= n=
n=
n= n=
n=
41
29
6
0
5
10
15
20
25
30
35
40
45
0-15% 16-30% 31-45% 46-60% 61-75% 76-90% 91-100%
Num
ber o
f PA
Ps
CT Scan Rate
n=
n=
n=
15%
Questions?Comments!