Embed Size (px)
Citation preview

DES MOINES PUBLIC SCHOOLS
Classification and Compensation Study: Final Report December 2013
Attachment 13-078

Table of Content
• Project Summary • Classification Study
– Process – Classification Structure & Class Descriptions
• Job Evaluation Study – Methodology
• Compensation Study – Survey Process – Survey Results – Salary Structure Development & Implementation – Budget & Cost Implications
• Recommendations • Final Report
2

Project Summary
• Des Moines Public Schools (DMPS) contracted with Fox Lawson & Associates (FLA) to conduct a classification and compensation study covering all DMPS positions
• The objectives of the study were to: – Develop a classification structure – Evaluate all classifications to ensure internal equity – Assign jobs to the correct pay grade based on duties
and responsibilities – Collect market salary data – Develop a salary structure that is market competitive – Develop job descriptions – Identify an implementation plan
3

Project Summary
• The project consisted of five phases: – Study Initiation and Administration – Job Analysis & Classification – Job Evaluation – Compensation – Recommendations & Final Report
4

Study Initiation
• Presented project to employees and management • Reviewed current systems to understand issues and
needs • Developed the approach and strategy for the
project, which included: – Moderately broad classification structure – Use of the Decision BandTM Method job evaluation
methodology – Use of market data from comparable school districts
and nearby geographic area
5

Job Analysis and Classification
• Reviewed position description questionnaires completed by DMPS employees to ensure our understanding of the functional area, levels of responsibilities, and job duties
• Developed a classification structure covering all DMPS positions that included: – Classification Series – Classification Titles – Nature of Work – Minimum Qualifications
6

Job Analysis and Classification
• The position description questionnaires were continually referenced as the basis for the structure
• The classification structure and allocation of employees have been reviewed with Senior Management for feedback
• The total number of classifications is 84 after the classification process was completed; 268 job titles are currently in use
• Many original position titles were consolidated into one of the 84 new classifications based on the similarity of duties, responsibilities, as well as the nature and level of work performed. New, consistent job titles were developed
7
Job Evaluation Study
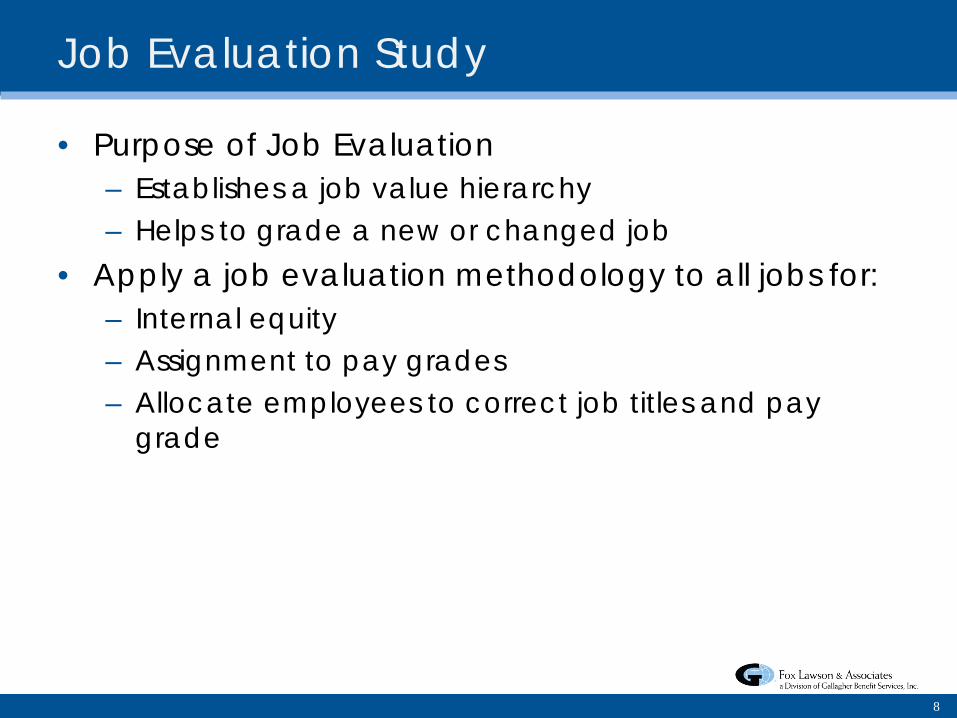
• Purpose of Job Evaluation – Establishes a job value hierarchy – Helps to grade a new or changed job
• Apply a job evaluation methodology to all jobs for: – Internal equity – Assignment to pay grades – Allocate employees to correct job titles and pay
grade
8

Job Evaluation Study
• Evaluate all proposed job classifications utilizing the Decision BandTM Method under the primary criteria: – Decision making – Supervision – Complexity and difficulty of job responsibilities
• Proposed System – Broader Classification series & Classifications that allow for
management flexibility in staffing and assignments – Transparent career paths that enable employees and
managers to manage career development – Connection between the assigned salary range and the
market • Evaluations were reviewed and verified by DMPS
Leadership
9

Job Evaluation Study Step 1: Determine appropriate band
Band A defined
Determine manner and
speed to perform defined steps of
an operation
Band B operational
Determines how and when to
perform steps of processes
Band C process
Develops and Selects
appropriate process to
accomplish operations of
programs
Band D interpretive
Interprets programs into
operational plans and deploys
resources
Band E programming
Plans strategies, programs and
allocates resources to meet goals
Band F policy
Organization scope, direction,
and goals
Step 2: Determine appropriate grade
Step 3: Determine appropriate subgrade
•Jobs with coordinating or supervisory responsibility within the same band are placed in the higher grade •Jobs without this responsibility within the same band are placed in the lower grade
Grade Assignment
Is determined by:
Is affected by:
Primary Criteria Job Difficulty
Task Complexity
Number of Tasks
Diversity of Tasks
Task Occurrence
Task Frequency
Percent of Time
10

Compensation Study – Survey Process
• Select benchmarks – identified 73 comparable positions for the 84 classifications
• FLA developed a customized data collection instrument. • The Data Collection Form (DCF) was distributed to comparable
school districts based on sizes and location. Follow-up calls and emails were made to encourage survey participation.
• We asked organizations to make a match for only those jobs that reflected at least 70% of the duties as outlined in the benchmark summaries.
• We compiled, reviewed and entered the data collected from participants.
• We followed-up directly with the participants to clarify and validate missing or questionable information reported.
• Data were adjusted for the Des Moines, IA labor market using data from the Economic Research Institute Geographic Assessor.
11

• Market data from the comparable organizations were collected for the 73 benchmark positions:
Compensation Study – Survey Process
12
No. Benchmark Title No. Benchmark Title No. Benchmark Title
1 Accountant 26 Director of Facility Services 51 Payroll Manager 2 Accounting Manager 27 Director of Federal Programs and Grants 52 Physical Therapist 3 Accounting Specialist 28 Director of Food & Nutrition Management 53 Preschool Associate 4 Administrative Support Supervisor 29 Director of Technology Operations 54 Principal 5 Assessment Coordinator 30 District Coordinator 55 Purchasing Agent 6 Assistant/Associate Principal 31 Driver 56 Registered Nurse 7 Assistant/Associate Superintendent 32 Early Childhood Associate 57 Registrar 8 Assistive Technology Specialist 33 EEO Coordinator 58 School Improvement Leader 9 Audiologist 34 Food & Nutrition Specialist 59 School Psychologist
10 Autism Strategist 35 Food Service Cook 60 Sign Language Interpreter 11 Benefit Specialist 36 Food Service Head Cook 61 Special Education Associate 12 Bilingual Community Outreach Worker 37 General Counsel 62 Special Education Consultant 13 Campus Monitor 38 Grants Writer 63 Special Education Supervisor 14 Career Advisor 39 Head Start Associate 64 Special Education Teacher 15 Chief Academic Officer 40 Instructional Technology Coordinator 65 Student Counselor 16 Chief Financial Officer 41 Internal Auditor 66 Student Support Manager 17 Chief Human Resource Officer 42 IT Application System Analyst 67 Superintendent 18 Chief Operations Officer 43 IT Help Desk Support 68 Suspension Associate 19 Compliance Support Teacher 44 IT Network Architect 69 Teacher 20 Construction Project Facilitator 45 IT Support Technician 70 Teacher Associate 21 Craft Specialist 46 Librarian 71 Trades Technician 22 Curriculum Coordinator 47 Library Assistant 72 Transportation Manager 23 Custodian 48 Occupational Therapist 73 Warehouse Assistant 24 Custodian Supervisor 49 Occupational Therapist Assistant 25 Dean of Students 50 Office Clerk

Compensation Study – Survey Process
• The survey was distributed to the 30 organizations:
13
No. School District Enrollment No. School District Enrollment
1 Buffalo Public Schools, NY 34,500 16 Richmond County School District, GA 32,700 2 Cincinnati Public Schools, OH 35,300 17 Rochester City School District, NY 32,500 3 Indianapolis Public Schools, IN 34,100 18 San Jose Unified School District, CA 31,900 4 Jackson Public School District, MS 30,600 19 Spokane School District, WA 29,700 5 Johnson County Schools, NC 31,500 20 Spring Branch Independent School District, TX 32,400 6 Leon County School, FL 32,500 21 St Paul Public Schools, MN 39,000 7 Lincoln Public Schools, NE 34,100 22 Ankeny Community School District, IA 9,250 8 Little Rock School District, AR 25,800 23 Cedar Rapids Community Schools , IA 16,080 9 Minneapolis Public Schools, MN 35,300 24 Council Bluffs Community School District, IA 8,510
10 Montgomery Public School, AL 31,300 25 Davenport Community School District, IA 15,550 11 Norfolk Public School, VA 34,400 26 Dubuque Community School District, IA 10,430 12 Orange Unified School District, CA 30,200 27 Iowa City Community School District, IA 12,490 13 Pittsburgh Public Schools, PA 27,900 28 Sioux City Community School District, IA 13,660 14 Portland School District, OR 43,700 29 Waterloo Community School, IA 10,450 15 Richardson Independent School District, TX 34,400 30 West Des Moines Community Schools, IA 9,040
• We received completed survey from these participants:
School Districts Job Match Rate
Lincoln Public Schools, NE 62%
Portland School District, OR 96%
Richmond County School District, GA 51%
Ankeny Community School District, IA 71%
Iowa City Community School District, IA 59%
West Des Moines Community Schools, IA 52%

Compensation Study – Survey Process
• We’re able to obtain salary schedule information from the websites of the 15 school districts:
• We also used published survey sources including Towers Watson,
Mercer, and ERI for the positions that didn’t have sufficient school district data.
• We follow the U.S. Department of Justice and Federal Trade Commission guidelines that state five job matches should exist per job in order to conduct statistical analyses or for drawing conclusions. Three positions, did not match this criteria:
- Chief Academic Officer - Curriculum Coordinator - Special Education Teacher
14
School Districts School Districts
Buffalo Public Schools, NY Richardson Independent School District, TX Indianapolis Public Schools, IN San Jose Unified School District, CA Jackson Public School District, MS Kansas City Public Schools, MO Johnson County Schools, NC Spokane School District, WA Leon County School, FL Spring Branch Independent School District, TX Little Rock School District, AR Waterloo Community School, IA Norfolk Public School, VA School District U-46, IL Orange Unified School District, CA

Compensation Study – Market Data
• The following guidelines are used when determining the competitive nature of current actual compensation: – +/- 5% (Highly Competitive) – +/- 10% (Competitive) – +/- 11-15% (Possible misalignment with the market) – > 15% (Significant misalignment with the market)
• For each benchmark comparison, the percentage difference has been calculated between the DMPS salary figure and the market salary figure in terms of the DMPS salary: – Positive (+) figure indicates that the DMPS pays above the market – Negative (-) figure indicates that the DMPS pays below the market
• Salary data were adjusted to reflect daily and annual rates and adjusted for DMPS’s labor market, as well as aged to January1, 2013.
15

Compensation Study – Market Data
• The overall difference between DMPS and the market: – This is the cumulative difference between all the benchmark jobs,
not an average of the average differences
• According to this chart, DMPS is considered competitive with the
market using the referenced guidelines: – Actual Salaries – Competitive – Salary Range Minimum – Competitive – Salary Range Midpoint – Highly Competitive – Salary Range Maximum – Competitive
16
Compared to the Market (Actual Pay) 25th Percentile 50th Percentile 75th Percentile
DMPS Difference +12.99% +6.29% -3.27%
Compared to the Market (Salary Structure) Minimum Midpoint Maximum
DMPS Difference +6.01% +1.18% -4.11%

Compensation Study – Salary Structure
• We next combined the market data with the DBM evaluations to develop a salary structure through regression analysis. This process creates an internally equitable and market competitive salary structure
• FLA developed trend lines or ‘lines of best fit’ for market median data points using the regression equation shown on the graph
• The R2 value represents the percentage of a trend line that can be explained by referenced data points, and the closer the R2 is to 1.00, the better fit of the trend line to the data points
• The following graph compares the market data to DMPS salaries
17

Compensation Study – Salary Structure
18
$0
$100
$200
$300
$400
$500
$600
$700
$800
$900
0 1000 2000 3000 4000 5000 6000 7000 8000 9000 10000
DMPS Actual Daily Market 50th Daily
A1 B2 B3 C4 C5 D6 D7 E8 E9
Market 50th Daily DMPS Actual Daily

Compensation Study – Salary Structure
• The salary regression analysis confirms the overall difference between DMPS and the market. DMPS is 6.29% above the market
• Both R2 values: 0.86 (linear) & 0.83 (exponential) describe a very close relationship between the regression pay trend and the market data
• While there are individual positions above and below the market medians, the overall trend of DMPS actual salaries and the market medians are very comparable
• The linear regression and exponential regression trend lines intersect at D63. Based on the overall consideration of DMPS current salary rate and the market data, we determined that a combination of the linear and the exponential regression functions would provide the best salary structure for DMPS
– Apply linear regression function to classifications lower than or equal to D63 – Apply exponential regression function to classifications higher than D63
19

Compensation Study – Salary Structure
20
DBM Rating Minimum Hourly Midpoint Hourly Maximum Hourly Range Spread
A11 $7.93 $9.11 $10.30 30%
A12 $9.86 $11.34 $12.82 30%
A13 $11.79 $13.56 $15.33 30%
B21 $13.55 $15.79 $18.03 33%
B22 $15.46 $18.01 $20.56 33%
B23 $17.37 $20.24 $23.10 33%
B31 or B24 $19.51 $23.02 $26.53 36%
B32 or B25 $22.34 $26.36 $30.38 36%
C41 $24.38 $29.14 $33.89 39%
C42 $26.24 $31.36 $36.48 39%
C43 $28.10 $33.59 $39.07 39%
C51 or C44 $30.06 $36.37 $42.68 42%
C52 or C45 $32.82 $39.71 $46.60 42%
D61 $33.99 $42.49 $50.99 50%
D62 $35.77 $44.71 $53.66 50%
D63 $37.55 $46.94 $56.32 50%
D71 or D64 $39.24 $50.03 $60.82 55%
D72 or D65 $43.59 $55.57 $67.56 55%
E81 $46.66 $60.66 $74.66 60%
E82 $50.05 $65.06 $80.08 60%
E83 $53.68 $69.78 $85.88 60%
E91 $56.42 $76.17 $95.92 70%
E92 $62.68 $84.61 $106.55 70%
F101 $68.42 $92.36 $116.31 70%
F102 $73.38 $99.06 $124.74 70%
F103 $78.70 $106.24 $133.79 70%

Compensation Study – Salary Structure
• By utilizing a combination of the market data and the job evaluation results, we are proposing a salary structure that is competitive with the market and internally equitable
• We also created a Step Structure within each pay grade based on seniority. This method provides an option to place employees at the correct steps within the assigned pay grades, and could be used as a guideline for future salary increases
21

Compensation Study – Salary Structure - Step
22
Step (Seniority)
Step 0 Min Step 1 Step 2 Step 3
Mid Step 4 Step 5 Step 6 Max Range
A11 $7.9 $8.3 $8.7 $9.1 $9.5 $9.9 $10.3 30% A12 $9.9 $10.4 $10.8 $11.3 $11.8 $12.3 $12.8 30% A13 $11.8 $12.4 $13.0 $13.6 $14.1 $14.7 $15.3 30%
Increase 5.0% 4.8% 4.5% 4.3% 4.2% 4.0% Step
(Seniority) Step 0
Min Step 1 Step 2 Step 3 Step 4 Step 5 Mid Step 6 Step 7 Step 8 Step 9 Step 10
Max Range
B21 $13.6 $14.0 $14.4 $14.9 $15.3 $15.8 $16.2 $16.7 $17.1 $17.6 $18.0 33% B22 $15.5 $16.0 $16.5 $17.0 $17.5 $18.0 $18.5 $19.0 $19.5 $20.1 $20.6 33% B23 $17.4 $17.9 $18.5 $19.1 $19.7 $20.2 $20.8 $21.4 $22.0 $22.5 $23.1 33%
Increase 3.3% 3.2% 3.1% 3.0% 2.9% 2.8% 2.8% 2.7% 2.6% 2.5% B31 or B24 $19.5 $20.2 $20.9 $21.6 $22.3 $23.0 $23.7 $24.4 $25.1 $25.8 $26.5 36% B32 or B25 $22.3 $23.1 $23.9 $24.7 $25.6 $26.4 $27.2 $28.0 $28.8 $29.6 $30.4 36% Increase 3.6% 3.5% 3.4% 3.2% 3.1% 3.1% 3.0% 2.9% 2.8% 2.7%
Step (Seniority)
Step 0 Min Step 1 Step 2 Step 3 Step 4 Step 5 Step 6 Step 7
Mid Step 8 Step 9 Step 10 Step 11 Step 12 Step 13 Step 14 Max Range
C41 $24.4 $25.1 $25.7 $26.4 $27.1 $27.8 $28.5 $29.1 $29.8 $30.5 $31.2 $31.9 $32.5 $33.2 $33.9 39% C42 $26.2 $27.0 $27.7 $28.4 $29.2 $29.9 $30.6 $31.4 $32.1 $32.8 $33.6 $34.3 $35.0 $35.7 $36.5 39% C43 $28.1 $28.9 $29.7 $30.5 $31.2 $32.0 $32.8 $33.6 $34.4 $35.2 $35.9 $36.7 $37.5 $38.3 $39.1 39%
Increase 2.8% 2.7% 2.6% 2.6% 2.5% 2.4% 2.4% 2.3% 2.3% 2.2% 2.2% 2.1% 2.1% 2.0% C51 or C44 $30.1 $31.0 $31.9 $32.8 $33.7 $34.6 $35.5 $36.4 $37.3 $38.2 $39.1 $40.0 $40.9 $41.8 $42.7 42% C52 or C45 $32.8 $33.8 $34.8 $35.8 $36.8 $37.7 $38.7 $39.7 $40.7 $41.7 $42.7 $43.6 $44.6 $45.6 $46.6 42%
Increase 3.0% 2.9% 2.8% 2.8% 2.7% 2.6% 2.5% 2.5% 2.4% 2.4% 2.3% 2.3% 2.2% 2.2% Step
(Seniority) Step 0
Min Step 1 Step 2 Step 3 Step 4 Step 5 Step 6 Step 7 Step 8 Step 9 Mid Step 10 Step 11 Step 12 Step 13 Step 14 Step 15 Step 16 Step 17 Step 18
Max Range
D61 $34.0 $34.9 $35.9 $36.8 $37.8 $38.7 $39.7 $40.6 $41.5 $42.5 $43.4 $44.4 $45.3 $46.3 $47.2 $48.2 $49.1 $50.0 $51.0 50% D62 $35.8 $36.8 $37.8 $38.8 $39.7 $40.7 $41.7 $42.7 $43.7 $44.7 $45.7 $46.7 $47.7 $48.7 $49.7 $50.7 $51.7 $52.7 $53.7 50% D63 $37.5 $38.6 $39.6 $40.7 $41.7 $42.8 $43.8 $44.8 $45.9 $46.9 $48.0 $49.0 $50.1 $51.1 $52.2 $53.2 $54.2 $55.3 $56.3 50%
Increase 2.8% 2.7% 2.6% 2.6% 2.5% 2.4% 2.4% 2.3% 2.3% 2.2% 2.2% 2.1% 2.1% 2.0% 2.0% 2.0% 1.9% 1.9% D71 or D64 $39.2 $40.4 $41.6 $42.8 $44.0 $45.2 $46.4 $47.6 $48.8 $50.0 $51.2 $52.4 $53.6 $54.8 $56.0 $57.2 $58.4 $59.6 $60.8 55% D72 or D65 $43.6 $44.9 $46.2 $47.6 $48.9 $50.2 $51.6 $52.9 $54.2 $55.6 $56.9 $58.2 $59.6 $60.9 $62.2 $63.6 $64.9 $66.2 $67.6 55% Increase 3.1% 3.0% 2.9% 2.8% 2.7% 2.7% 2.6% 2.5% 2.5% 2.4% 2.3% 2.3% 2.2% 2.2% 2.1% 2.1% 2.1% 2.0%
Step (Seniority)
Step 0 Min Step 1 Step 2 Step 3 Step 4 Step 5 Step 6 Step 7 Step 8 Step 9 Step 10 Step 11
Mid Step 12 Step 13 Step 14 Step 15 Step 16 Step 17 Step 18 Step 19 Step 20 Step 21 Step 22 Max Range
E81 $46.7 $47.9 $49.2 $50.5 $51.8 $53.0 $54.3 $55.6 $56.8 $58.1 $59.4 $60.7 $61.9 $63.2 $64.5 $65.8 $67.0 $68.3 $69.6 $70.8 $72.1 $73.4 $74.7 60% E82 $50.0 $51.4 $52.8 $54.1 $55.5 $56.9 $58.2 $59.6 $61.0 $62.3 $63.7 $65.1 $66.4 $67.8 $69.2 $70.5 $71.9 $73.3 $74.6 $76.0 $77.3 $78.7 $80.1 60% E83 $53.7 $55.1 $56.6 $58.1 $59.5 $61.0 $62.5 $63.9 $65.4 $66.9 $68.3 $69.8 $71.2 $72.7 $74.2 $75.6 $77.1 $78.6 $80.0 $81.5 $83.0 $84.4 $85.9 60%
Increase 2.7% 2.7% 2.6% 2.5% 2.5% 2.4% 2.3% 2.3% 2.2% 2.2% 2.1% 2.1% 2.1% 2.0% 2.0% 1.9% 1.9% 1.9% 1.8% 1.8% 1.8% 1.7% E91 $56.4 $58.2 $60.0 $61.8 $63.6 $65.4 $67.2 $69.0 $70.8 $72.6 $74.4 $76.2 $78.0 $79.8 $81.6 $83.4 $85.1 $86.9 $88.7 $90.5 $92.3 $94.1 $95.9 70% E92 $62.7 $64.7 $66.7 $68.7 $70.7 $72.6 $74.6 $76.6 $78.6 $80.6 $82.6 $84.6 $86.6 $88.6 $90.6 $92.6 $94.6 $96.6 $98.6 $100.6 $102.6 $104.6 $106.5 70% F101 $68.4 $70.6 $72.8 $74.9 $77.1 $79.3 $81.5 $83.7 $85.8 $88.0 $90.2 $92.4 $94.5 $96.7 $98.9 $101.1 $103.2 $105.4 $107.6 $109.8 $112.0 $114.1 $116.3 70% F102 $73.4 $75.7 $78.0 $80.4 $82.7 $85.1 $87.4 $89.7 $92.1 $94.4 $96.7 $99.1 $101.4 $103.7 $106.1 $108.4 $110.7 $113.1 $115.4 $117.7 $120.1 $122.4 $124.7 70% F103 $78.7 $81.2 $83.7 $86.2 $88.7 $91.2 $93.7 $96.2 $98.7 $101.2 $103.7 $106.2 $108.7 $111.3 $113.8 $116.3 $118.8 $121.3 $123.8 $126.3 $128.8 $131.3 $133.8 70%
Increase 3.2% 3.1% 3.0% 2.9% 2.8% 2.7% 2.7% 2.6% 2.5% 2.5% 2.4% 2.4% 2.3% 2.3% 2.2% 2.2% 2.1% 2.1% 2.0% 2.0% 1.9% 1.9%

Compensation Study – Salary Structure – Teachers
Step BA % Increase BA+15 % Increase BA+30 % Increase MA % Increase MA+15 % Increase MA+30 % Increase
1 35,076 N/A 36,430 3.86% 36,903 1.30% 38,187 3.48% 39,540 3.54% 40,892 3.42%
2 35,685 1.73% 37,811 3.79% 38,119 3.30% 38,863 1.77% 40,216 1.71% 41,569 1.65%
3 36,903 3.41% 39,196 3.66% 39,337 3.19% 40,216 3.48% 41,569 3.36% 42,921 3.25%
4 38,119 3.30% 40,588 3.55% 40,554 3.09% 41,569 3.36% 42,921 3.25% 44,273 3.15%
5 39,337 3.19% 41,983 3.44% 41,772 3.00% 42,921 3.25% 44,273 3.15% 45,626 3.06%
6 40,554 3.09% 43,383 3.33% 42,988 2.91% 44,273 3.15% 45,626 3.06% 46,978 2.96%
7 41,772 3.00% 44,787 3.24% 44,205 2.83% 45,626 3.06% 46,978 2.96% 48,330 2.88%
8 42,988 2.91% 46,196 3.15% 45,491 2.91% 46,978 2.96% 48,330 2.88% 49,683 2.80%
9 44,273 2.99% 47,608 3.06% 46,843 2.97% 48,398 3.02% 49,683 2.80% 51,036 2.72%
10 45,626 3.06% 49,019 2.96% 48,195 2.89% 49,886 3.07% 51,036 2.72% 52,388 2.65%
11 46,978 2.96% 50,430 2.88% 49,548 2.81% 51,373 2.98% 52,456 2.78% 53,740 2.58%
12 48,330 2.88% 51,841 2.80% 50,224 1.36% 52,861 2.90% 53,943 2.84% 55,092 2.52%
13 54,349 2.81% 55,431 2.76% 56,513 2.58%
14 58,001 2.63%
23
• We proposed a teacher’s salary schedule based on the market 50th percentile of the minimums of teacher's salary schedule data, and used the same step & lane increase rate of DMPS’s current schedule • Data indicates Annual salary rate

Non-Bargaining Jobs
Implementation
Recommendations
24

Compensation Study - Implementation
• FLA reviewed several implementation options for DMPS
• Our recommended approach will affect an estimated 165, out of 496 employees non-bargaining unit employees, or 33.3%
25

Compensation Study - Implementation
• It will ensure that employees are paid at a relatively equal level in their respective salary ranges taking into account both job value and market value
• The cost to implement is estimated to be no more than $777,584
26

Compensation Study - Implementation
• How DMPS implements our recommendations for any specific employee should be based on a combination of such things, including – Responsibility – Experience – Performance – Seniority – Anticipated changes to the District organization – Other factors
27

Compensation Study - Implementation
• These decisions should be made by the Superintendent and Senior Management
• We believe that now is a good time to implement the changes necessary to cover any pay issues due to the recent changes in administration and senior level staff
28

Recommendation
• Adopt the proposed classification that allows flexibility and transparent potential career paths
• Utilize the Decision BandTM Method to evaluate new or changed positions to ensure internal equity
• Implement the proposed salary structure to ensure competitive salary ranges for the recruitment and retention of employees per the determined implementation method
29

• Pay administration guidelines should be implemented for placing and moving employees through the structure, we recommend the following: – The hiring range should be from the range minimum
for minimally acceptable qualified individuals to the first quartile (25th percentile) for well qualified individuals. Under the Step Structure, new hires will be allocated to the step that is closest to their pay, and increased by the Step Increase Rate according to their seniority
Recommendation
30

– Appointment above the first quartile should require the approval of Human Resources, and appointment above the midpoint should require the approval of the Senior Management and the Superintendent
– Salary advancement through the structure should be based on competent performance in the job class
– The salary structure should be adjusted by a structure movement trend factor every year to remain competitive with the market. This adjustment may be different than any salary adjustments for employees
Recommendation
31

Recommendation
– In addition to adjusting the salary structure each year to keep pace with the market, DMPS should conduct a comprehensive market compensation study similar to the salary study part of the project at least every three to four years to make sure the salary structure is market competitive
– DMPS should annually review its internal alignment and classification of jobs to ensure proper leveling between the supervisors and managers
32