Embed Size (px)
Citation preview
(ER-200831)
April 2015
Demonstration and Validation of a Fractured Rock Passive Flux Meter

This report was prepared under contract to the Department of Defense Strategic Environmental Research and Development Program (SERDP). The publication of this report does not indicate endorsement by the Department of Defense, nor should the contents be construed as reflecting the official policy or position of the Department of Defense. Reference herein to any specific commercial product, process, or service by trade name, trademark, manufacturer, or otherwise, does not necessarily constitute or imply its endorsement, recommendation, or favoring by the Department of Defense.
Standard Form 298 (Rev. 8/98)
REPORT DOCUMENTATION PAGE
Prescribed by ANSI Std. Z39.18
Form Approved OMB No. 0704-0188
The public reporting burden for this collection of information is estimated to average 1 hour per response, including the time for reviewing instructions, searching existing data sources, gathering and maintaining the data needed, and completing and reviewing the collection of information. Send comments regarding this burden estimate or any other aspect of this collection of information, including suggestions for reducing the burden, to Department of Defense, Washington Headquarters Services, Directorate for Information Operations and Reports (0704-0188), 1215 Jefferson Davis Highway, Suite 1204, Arlington, VA 22202-4302. Respondents should be aware that notwithstanding any other provision of law, no person shall be subject to any penalty for failing to comply with a collection of information if it does not display a currently valid OMB control number. PLEASE DO NOT RETURN YOUR FORM TO THE ABOVE ADDRESS. 1. REPORT DATE (DD-MM-YYYY) 2. REPORT TYPE 3. DATES COVERED (From - To)
4. TITLE AND SUBTITLE 5a. CONTRACT NUMBER
5b. GRANT NUMBER
5c. PROGRAM ELEMENT NUMBER
5d. PROJECT NUMBER
5e. TASK NUMBER
5f. WORK UNIT NUMBER
6. AUTHOR(S)
7. PERFORMING ORGANIZATION NAME(S) AND ADDRESS(ES) 8. PERFORMING ORGANIZATION REPORT NUMBER
9. SPONSORING/MONITORING AGENCY NAME(S) AND ADDRESS(ES) 10. SPONSOR/MONITOR'S ACRONYM(S)
11. SPONSOR/MONITOR'S REPORT NUMBER(S)
12. DISTRIBUTION/AVAILABILITY STATEMENT
13. SUPPLEMENTARY NOTES
14. ABSTRACT
15. SUBJECT TERMS
16. SECURITY CLASSIFICATION OF: a. REPORT b. ABSTRACT c. THIS PAGE
17. LIMITATION OF ABSTRACT
18. NUMBER OF PAGES
19a. NAME OF RESPONSIBLE PERSON
19b. TELEPHONE NUMBER (Include area code)
30-03-2015 Cost & Performance Report 04/2008-03/2015
Demonstration and Validation of a Fractured Rock Passive Flux Meter (FRPFM)
W912HQ-08-C-0012
ER-200831Kirk Hatfield
University of Florida PO Box 116580 365 Weil Hall Gainesville, FL 32611
C&P-ER-200831
Andrea Leeson 4800 Mark Center Drive, Suite 17D08 Alexandria, VA 22350-3605
ESTCP
Unlimited
The overall objective of this project was to demonstrate and validate a new closed-hole passive sensing technology for fractured media: the Fractured Rock Passive Fluxmeter (FRPFM). The FRPFM provides simultaneous measurement of (1) the presence of flowing fractures, (2) the location of active or flowing fractures; (3) active fracture orientation i.e., dip and azimuth; (4) direction of groundwater flow in each fracture; (5) cumulative magnitude of groundwater flux in each fracture; and (6) cumulative magnitude of contaminant flux in each fracture. Various technologies exist to measure (1), (2) and (3) above; however, the FRPFM is the only technology that also measures (4), (5) and (6).
U U U None66
Kirk Hatfield
352-392-9537
Reset
i
COST & PERFORMANCE REPORT Project: WP-200831
TABLE OF CONTENTS
Page
EXECUTIVE SUMMARY ...................................................................................................... ES-1
1.0 INTRODUCTION .............................................................................................................. 1 1.1 BACKGROUND .................................................................................................... 1 1.2 OBJECTIVE OF THE DEMONSTRATION ......................................................... 2 1.3 REGULATORY DRIVERS ................................................................................... 2
2.0 TECHNOLOGY ................................................................................................................. 3 2.1 TECHNOLOGY DESCRIPTION .......................................................................... 3
2.1.1 Technology Overview ................................................................................. 4 2.1.2 Field Implementation and Groundwater and Contaminant Flux
Interpretation ............................................................................................... 6 2.1.3 Groundwater and Contaminant Discharges Interpretations ........................ 7
2.2 TECHNOLOGY DEVELOPMENT ....................................................................... 8 2.3 ADVANTAGES AND LIMITATIONS OF THE TECHNOLOGY...................... 8
3.0 PERFORMANCE OBJECTIVES .................................................................................... 11
4.0 SITE DESCRIPTION ....................................................................................................... 13 4.1 GUELPH TOOL SITE .......................................................................................... 13
4.1.1 GTS: SITE LOCATION AND HISTORY ............................................... 13 4.1.2 GTS: SITE GEOLOGY/HYDROLOGY .................................................. 13 4.1.3 GTS: CONTAMINANT DISTRIBUTION .............................................. 14
4.2 NAVAL AIR WARFARE CENTER.................................................................... 14 4.2.1 NAWC: SITE LOCATION AND HISTORY .......................................... 14 4.2.2 NAWC: SITE GEOLOGY/HYDROLOGY ............................................. 15 4.2.3 NAWC: CONTAMINANT DISTRIBUTION ......................................... 16
5.0 TEST DESIGN ................................................................................................................. 17 5.1 CONCEPTUAL EXPERIMENTAL DESIGN ..................................................... 17 5.2 BASELINE CHARACTERIZATION .................................................................. 17
5.2.1 LABORATORY STUDY RESULTS ...................................................... 18 5.3 FIELD TESTING.................................................................................................. 18 5.4 SAMPLING METHODS ...................................................................................... 21 5.5 SAMPLING RESULTS ........................................................................................ 22
6.0 PERFORMANCE ASSESSMENT .................................................................................. 41 6.1 SUMMARY OF DATA TYPES AND PERFORMANCE OBJECTIVES .......... 41 6.2 FIELD DEMONSTRATION RESULTS ............................................................. 42
TABLE OF CONTENTS (continued)
Page
ii
7.0 COST ASSESSMENT ...................................................................................................... 45 7.1 COST MODEL ..................................................................................................... 45 7.2 COST DRIVERS .................................................................................................. 45
7.2.1 Cost Element: Mobilization ...................................................................... 45 7.2.2 Cost Element: Baseline Characterization.................................................. 45 7.2.3 Cost Element: FRPFM .............................................................................. 46 7.2.4 Cost Element: Alternative Technologies .................................................. 46 7.2.5 Cost Element: Demobilization .................................................................. 46
7.3 COST ANALYSIS................................................................................................ 46
8.0 IMPLEMENTATION ISSUES ........................................................................................ 51 8.1 ENVIRONMENTAL CHECKLIST ..................................................................... 51 8.2 OTHER REGULATORY ISSUES ....................................................................... 51 8.3 END-USER ISSUES ............................................................................................ 51
9.0 REFERENCES ................................................................................................................. 53 APPENDIX A POINTS OF CONTACT......................................................................... A-1
iii
LIST OF FIGURES
Page Figure 1. A profile view of an unscreened borehole containing a FRPFM............................ 5 Figure 2. Horizontal cross-section of an FRPFM in an unscreened borehole. ....................... 5 Figure 3. FRPFM designed with an inflatable core and separate upper and
lower end packers. .................................................................................................. 6 Figure 4. Transects defining the general boundaries of the source zone and plume. ........... 14 Figure 5. The NAWC site..................................................................................................... 15 Figure 6. The location of Site 1 and Site 3 TCE plumes interpreted at a depth of 100
ft below land surface at the NAWC, West Trenton, NJ in May 2004. ................. 16 Figure 7. Summary of flux measurements and visual results for Tests F, G, and H
comparing vertical distribution of water flux (specific discharge), contaminant flux and presence of flowing fractures. ............................................ 27
Figure 8. Test J imagery of visual flow indications compared to ATV log at same depth. ..................................................................................................................... 30
Figure 9. Test K: (A) black and white image of visual features from a portion of the FRPFM sock. (B) Centroids of individual features referenced to the FRPFM accelerometer directional orientation. ................................................................... 31
Figure 10. Test K: (A) Black and white image of visual features from a portion of the FRPFM sock. (B) Visual features with fitted sine function traces, which are used to estimate fracture depth, azimuth and dip. ................................................. 32
Figure 11. Test K: Histograms of fracture depth, dip, orientation (azimuth) and centroid angles. ..................................................................................................... 32
Figure 12. Test O comparison of ATV, OTV, and FRPFM visual tracer with inferred flow direction. ....................................................................................................... 34
Figure 13. Test O comparison of ATV, OTV, FRPFM visual tracer and FRPFM fluxes. .... 35 Figure 14. Test Q inferred general flow direction from faint visual features on FRPFM
sock. ...................................................................................................................... 37 Figure 15. Test R Comparison of ATV/OTV with FRPFM visual indications of
flowing circular feature intersecting two high-angle fractures. ............................ 38 Figure 16. Test R inferred general flow direction from visual features on FRPFM sock
(Figure 15). ........................................................................................................... 39 Figure 17. Test R vertical distribution of water and contaminant fluxes within FRPFM
interrogation zone. ................................................................................................ 39
iv
LIST OF TABLES
Page Table 1. Performance objectives. ........................................................................................ 11 Table 2. Scheduled activities for FRPFM demonstration at GTS....................................... 19 Table 3. Scheduled activities for FRPFM demonstration at the NAWC site. .................... 19 Table 4. Matrix of test results—provides general summary of data collected by
FRPFM and comparative technology for all field tests. ....................................... 20 Table 5. Matrix of flux results for comparative technologies (HRTP/TVP and BHD). ..... 23 Table 6. Matrix of flux results for FRPFM technologies (visual tracer, alcohol tracer,
and sorbent). .......................................................................................................... 24 Table 7. Summary of data type comparisons for all technologies used to evaluate
FRPFM performance. ........................................................................................... 42 Table 8. Summary of quantitative performance objectives with comparative results. ....... 43 Table 9. FRPFM deployment cost. ..................................................................................... 47 Table 10. FRPFM construction cost. .................................................................................... 48 Table 11. BHD cost. .............................................................................................................. 48 Table 12. HRTP/TVP cost. ................................................................................................... 49
v
ACRONYMS AND ABBREVIATIONS ATV acoustic televiewer bgs below ground surface BHD borehole dilution cm2/day square centimeters per day DCE cis-1,2-dichloroethene DNAPL dense nonaqueous phase liquid DoD Department of Defense EPA Environmental Protection Agency ESTCP Environmental Security Technology Certification Program FRPFM Fractured Rock Passive Fluxmeter GTS Guelph Tool Site HRTP high resolution temperature profile IFL impermeable flexible liner µg/L microgram per liter MNA monitored natural attenuation NAWC Naval Air Warfare Center OTV optical televiewer PFM passive fluxmeter PI Principal Investigator PVC polyvinyl chloride SERDP Strategic Environmental Research and Development Program TCE trichloroethylene TVP temperature vector probe USGS U.S. Geological Survey VC vinyl chloride

This page left blank intentionally.
Technical material contained in this report has been approved for public release. Mention of trade names or commercial products in this report is for informational purposes only;
no endorsement or recommendation is implied.
vii
ACKNOWLEDGEMENTS We gratefully acknowledge the financial and technical support provided by the Environmental Security Technology Certification Program (ESTCP) including the guidance provided by Dr. Andrea Leeson (Environmental Restoration Program Manager). We would also like to thank all individuals and organizations that provided extensive guidance and support for this project.

This page left blank intentionally.
ES-1
EXECUTIVE SUMMARY
Complex hydrogeologic conditions such as fractured and karst bedrock settings pose substantial economic and technical challenges both to the characterization and remediation of dense nonaqueous phase liquid (DNAPL) source zones. The Army Environmental Center lists 34 installations where restoration may be technically impractical, even with a budget of $3 billion (approximately 50% of the Army’s total projected environmental restoration budget). Of the 34 installations, 26 are underlain by complex fractured rock or karst aquifers. To reduce the cost of characterization and remediation of fractured rock sites, it is critical to identify candidate sites for Monitored Natural Attenuation (MNA) and prioritize the remaining sites for remediation. To assist in this endeavor, cost-effective monitoring tools are needed that can be used in concert with existing borehole technologies to directly measure groundwater and contaminant flux in fractured rock. These flux measurements combined with data gathered from other available borehole technologies will bring the Department of Defense (DoD) much closer to estimating contaminant mass discharge from source zones and in turn expedite assessments of environmental risks and benefits associated with natural attenuation, source removal, or remediation at complex sites.
OBJECTIVE OF THE DEMONSTRATION
The overall objective of this project was to demonstrate and validate a new closed-hole passive sensing technology for fractured media: the Fractured Rock Passive Fluxmeter (FRPFM). The FRPFM provides simultaneous measurement of: (1) the presence of flowing fractures; (2) the location of active or flowing fractures; (3) active fracture orientation, i.e., dip and azimuth; (4) direction of groundwater flow in each fracture; (5) cumulative magnitude of groundwater flux in each fracture; and (6) cumulative magnitude of contaminant flux in each fracture. Various technologies exist to measure (1), (2), and (3) above; however, the FRPFM is the only technology that also measures (4), (5), and (6).
The specific objectives of this demonstration were:
1. Demonstrate and validate an innovative technology for the direct in situ measurement of cumulative water and contaminant fluxes in fractured media;
2. Formulate and demonstrate methodologies for interpreting contaminant discharge from point-wise measurements of cumulative contaminant flux in fractured rock; and
3. Enable the technology to receive regulatory and end user acceptance.
TECHNOLOGY DESCRIPTION
The FRPFM is designed with an inflatable core and separate upper and lower end packers. The core is simply a packer (or flexible inflatable liner) covered with an internal nonreactive layer of permeable mesh that is wrapped in a permeable layer of material derived from activated carbon, ion exchange resin, or similar sorbent material impregnated with tracers. Then, all of this is encased in a thin external permeable layer of cloth material impregnated with a visible dye. The core inflates separately from the two end packers to provide a mechanism for holding the one or
ES-2
more reactive fabrics against the face of the borehole and any fracture intersecting that borehole, while the end packers isolate the zone of interest from vertical hydraulic gradients within the borehole. As currently designed, the FRPFM provides high resolution measurements over a specified interrogation zone (typically 1 meter).
Deploying the FRPFM in a borehole and exposing it to flowing groundwater for duration t [T] gradually leaches visible dyes and tracers from the internal and external sorbent layers and produces residual dye and tracer distributions. Visual inspection of the external layer impregnated with a visible dye leads to estimates of the following for active or flowing fractures alone: (1) locations along the borehole; (2) number; (3) individual fracture orientations in terms of strike, dip, and orientation of dip (direction of falling dip, e.g., southwest); (4) cumulative groundwater flux; and (5) groundwater flow direction. Fracture characteristics (1) through (3) can be obtained through existing borehole imaging technologies as long as those fractures possess apertures ≥1mm; however, these commercially available technologies cannot distinguish active from inactive fractures or measure the magnitude or direction of fracture flow. Further analytical analysis of the FRPFM internal sorbent layer at indicated locations of active fractures yields: (1) additional estimates of cumulative groundwater flux in fractures; and (2) cumulative contaminant flux in those fractures. Thus, the in situ measurements of direction and magnitude of water and contaminant fluxes in active fractures are innovations given by the FRPFM alone.
DEMONSTRATION RESULTS
In support of the first demonstration objective listed above, this report defines six specific technology performance objectives and establishes metrics to compare FRPFM measures (contaminant and groundwater fluxes, flow direction, detection of active flowing fractures, fracture location and orientation) to those obtained from five different competing/comparative technologies: high resolution temperature profiling (HRTP), acoustic televiewer (ATV), optical televiewer (OTV), temperature vector probe (TVP), and borehole dilution (BHD). Field tests were conducted at two chlorinated solvent contaminated fractured rock sites. This report presents 16 separate field tests and their results. A total of nine down-hole tests were executed in 4- and 6-inch rock wells at the Guelph Tool Site in Ontario Canada and another seven tests were conducted in one 6-inch rock well located on the premises of the former Naval Air Warfare Center in West Trenton, New Jersey. Based upon the results of the 16 field tests, the FRPFM achieved the standard in each of the six quantitative performance objectives.
In support of the second demonstration objective, methodologies were formulated and demonstrated for interpreting contaminant discharge from point-wise measurements of cumulative contaminant flux in fractured rock. Those methods were published in a highly ranked peer-reviewed journal Water Resources Research (Acar et al., 2013).
In support of the third project objective, Enviroflux Inc. assumed exclusive rights to commercialize the FRPFM technology (patented in 2008). At this time, Enviroflux Inc. is engaged in discussions to deploy FRPFMs for a major client of a large environmental firm. The Environmental Protection Agency (EPA) has also shown interest in continued field testing and site selection is under way.
ES-3
IMPLEMENTATION ISSUES
The FRPFM technology currently functions through deployment of custom-built prototypes designed with a specified interrogation zone (typically 1 meter). Currently, prototypes exist for application in 4-inch and 6-inch fractured rock wells. Deployment, retrieval, and sampling is straightforward and has been demonstrated to field technicians from the University of Guelph and U.S. Geological Survey (USGS) who experienced minimal issues with methodology transfer.
Depending on site conditions, permits may be required for permission to release small quantities of food-grade tracers into the aquifer. A standard list of tracers is available, and no issues have been experienced with previous permit requests.
As technology development continues, refinements will be made and applied to future prototypes (such as expanded interrogation zone). Site specific refinements can be made as needed.

This page left blank intentionally.
1
1.0 INTRODUCTION
1.1 BACKGROUND
Complex hydrogeologic conditions such as fractured and karst bedrock settings pose substantial economic and technical challenges both to the characterization and remediation of dense nonaqueous phase liquid (DNAPL) source zones. The Army Environmental Center lists 34 installations where restoration may be technically impractical, even with a budget of $3 billion (approximately 50% of the Army’s total projected environmental restoration budget). Of the 34 installations, 26 are underlain by complex fractured rock or karst aquifers.
The challenge of estimating cross-sectional discharge (integrated flux) in fractured media is quite different and perhaps much more difficult than granular media for various reasons. One of which is variations in fracture aperture between borehole (Novakowski et al., 2006), and another being some fractures are large and perhaps important hydraulically, while others are small and significant in the context of controlling plume structure. It is also important to keep in mind that contaminant flux in fractures can be approximated as the product of fracture flow and contaminant concentration. Some fractures can possess high contaminant concentrations but produce low fluxes because flow is negligible; whereas, in others concentrations can be low, but the fluxes high because flow is significant. Thus, it is not possible to identify fractures producing significant contaminant fluxes viewing concentration without flow and vice-versa. Finally, with respect to estimating contaminant discharge, it is pertinent to recognize the importance of fracture density. Small fractures, that individually produce low contaminant fluxes, can generate large contaminant discharges at the transect scale if fracture density is significant.
This report presents results of a technology demonstration/validation study where cumulative or time-averaged water and contaminant fluxes were measured in fractured rock aquifers under ambient closed-hole conditions. Usually water and contaminant fluxes are estimated from observed contaminant concentrations in fractured rock boreholes and depth-average groundwater flows calculated or measured under open-hole conditions. This approach typically requires extensive aquifer characterization and costly flow and water quality monitoring in open boreholes. Hydrophysical logging, pulse flow meters (Model 40 GEOFLO), acoustic Doppler velocimeters, and colloidal borescopes are tools typically used that reveal much about fractured flows towards an open borehole (Wilson et al., 2001). Unfortunately, open borehole techniques are not likely to produce accurate estimates of ambient contaminant discharge for at least two reasons. First, open boreholes induce magnitude and directional changes in water and contaminant fluxes in fractures and between fractures that do not exist naturally as in the absence of a borehole. Hence, flows that do not occur under natural aquifer conditions are not likely to produce concentrations and depth-average discharges that represent ambient conditions. Second, water and contaminant fluxes vary significantly between fractures and over time; therefore, typical short-term or instantaneous measurements of flow and concentration do not generate representative long-term projections of flow, concentration, and contaminant discharge.
Closed-hole conditions are preferred for making ambient water and contaminant flux measurements. These conditions are closely approximated using FLUTe™ and packers to isolate borehole sections (Cherry et al., 2007). These devices eliminate the exchange of water and contaminant between fractures that occurs in open boreholes and in turn restore nature flows in
2
fractures. FLUTe™ has been used with high resolution temperature logging techniques to locate and rank active (flowing) fractures under closed-hole conditions. Beyond this study and to the best of our knowledge, individual fractured flows have not been measured under closed-hole conditions; however, isolated and depth-integrated fracture flows have been measured over isolated sections of a borehole using the point or borehole dilution method (Guitierrez et al., 1977; Xu et al., 1997; and Novakowski et al., 2006). Furthermore, direct measures of contaminant fluxes in fractures have not been reported. As a result, measurement and/or calculation of flux at the fracture scale are somewhat novel. Hence, published accounts of water or contaminant discharge estimated over fractured transects are almost non-existent (Acar et al., 2013; Plett, 2006; and Novakowski et al., 2006).
1.2 OBJECTIVE OF THE DEMONSTRATION
The objective of this project was to demonstrate and validate the fractured rock passive flux meter (FRPFM) as new technology that measures the magnitudes and directions of cumulative water and contaminant fluxes in fractured rock aquifers. The specific project objectives were:
1. Demonstrate and validate an innovative technology for the direct in situ measurement of cumulative water and contaminant fluxes in fractured media;
2. Formulate and demonstrate methodologies for interpreting contaminant discharge from point-wise measurements of cumulative contaminant flux in fractured rock; and
3. Enable the technology to receive regulatory and end user acceptance.
1.3 REGULATORY DRIVERS
To reduce the cost of characterization and remediation of fractured rock sites, it is critical to identify candidate sites for Monitored Natural Attenuation (MNA) and prioritize the remaining sites for remediation. To assist in this endeavor, cost-effective monitoring tools are needed that can be used in concert with existing borehole technologies to directly measure groundwater and contaminant flux in fractured rock. These flux measurements combined with data gathered from other available borehole technologies will bring the Department of Defense (DoD) much closer to estimating contaminant mass discharge from source zones and in turn expedite assessments of environmental risks and benefits associated with natural attenuation, source removal, or remediation at complex sites. For fracture bedrock sites, a significant cost savings to DoD could be realized if certain sites were quantitatively found to pose little off-site risk due to natural attenuation. Based upon projected remediation costs of approximately $3 billion per 34 difficult installations, it was estimated that approximately $2.3 billion could be spent on 26 sites underlain by fractured rock and karst aquifers (SERDP and ESTCP Workshop, 2006). The greatest cost savings could be realized in less than 5 years, if FRPFM monitoring determined at any one site, natural attenuation was sufficient and active remediation could be avoided.
3
2.0 TECHNOLOGY
The technology demonstrated and validated in this project is a new closed-hole passive sensing technology for fractured media: the FRPFM. The FRPFM provides simultaneous measurement of: (1) the presence of flowing fractures; (2) the location of active or flowing fractures; (3) active fracture orientation, i.e., dip and azimuth; (4) direction of groundwater flow in each fracture; (5) cumulative magnitude of groundwater flux in each fracture; and (6) cumulative magnitude of contaminant flux in each fracture. Various technologies exist to measure (1), (2), and (3) above; however, the FRPFM is the only technology that also measures (4), (5), and (6). The FRPFM is essentially an inflatable packer or flute that holds one or more reactive fabrics against the wall of a borehole and to any water-filled fractures intersected by a borehole. These reactive fabrics are designed to intercept and retain target groundwater contaminants (i.e., trichloroethylene [TCE], cis-1,2-dichloroethene [DCE], vinyl chloride [VC]); in addition, these fabric release non-toxic tracers, some of which visibly indicate active fracture location, orientation, and direction of fracture flow along a borehole, while others quantify cumulative groundwater discharge in these fractures. Demonstration and validation studies were conducted at two sites where available field facilities permitted FRPFM testing in well-characterized rock wells and underlying fractured rock aquifers were contaminated with chlorinated solvents. Direct FRPFM measures of active fracture location, orientation, direction and magnitude of water and contaminant fluxes were compared to results generated using competing technologies (e.g., borehole imaging tools, high resolution temperature logging, and borehole dilution). The project demonstrated that the FRPFM was particularly cost-effective for fractured rock characterization and monitoring when used in concert with other borehole technologies (e.g., high resolution temperature logging). The project also demonstrated methods for interpreting water and contaminant discharge from a single well or transect of multiple boreholes (Acar et al., 2013).
2.1 TECHNOLOGY DESCRIPTION
Complex hydrogeologic conditions such as fractured bedrock and karst settings pose substantial challenges both to the characterization and remediation of DNAPL source zones. Cost-effective quantification of contaminant discharge is critical at complex sites in order to assess long term risk, evaluating remedial performance, and achieving regulatory compliance. For fracture bedrock sites, a significant cost savings to DoD can be realized if certain sites are quantitatively found to pose little off-site risk, or they do not require active remediation because contaminant mass discharge is low and can be attenuated by natural processes. Various open-hole technologies exist to locate fractures, measure fracture apertures, and determine fracture orientations in terms of strike, dip, and dip orientation (direction of falling dip, e.g., southwest), and other technologies exist that measure fracture flows under open-hole conditions. Unfortunately, as stated above, open boreholes induce fracture flows that are not natural or ambient; consequently, open-borehole techniques are not likely to produce accurate estimates of ambient contaminant discharge. Monitoring tools that function in closed boreholes are needed to measure ambient water and contaminant flux in fractured rock. To be cost-effective in the field, these novel tools must generate complementary data to existing borehole technologies.
4
2.1.1 Technology Overview
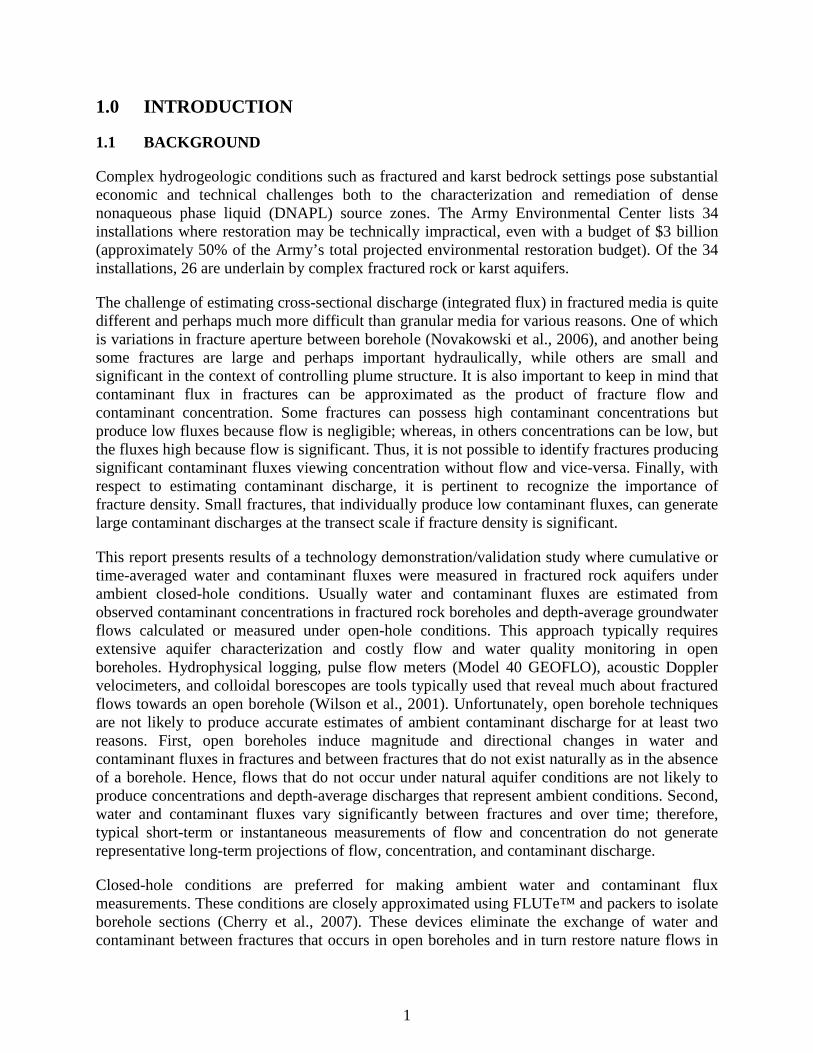
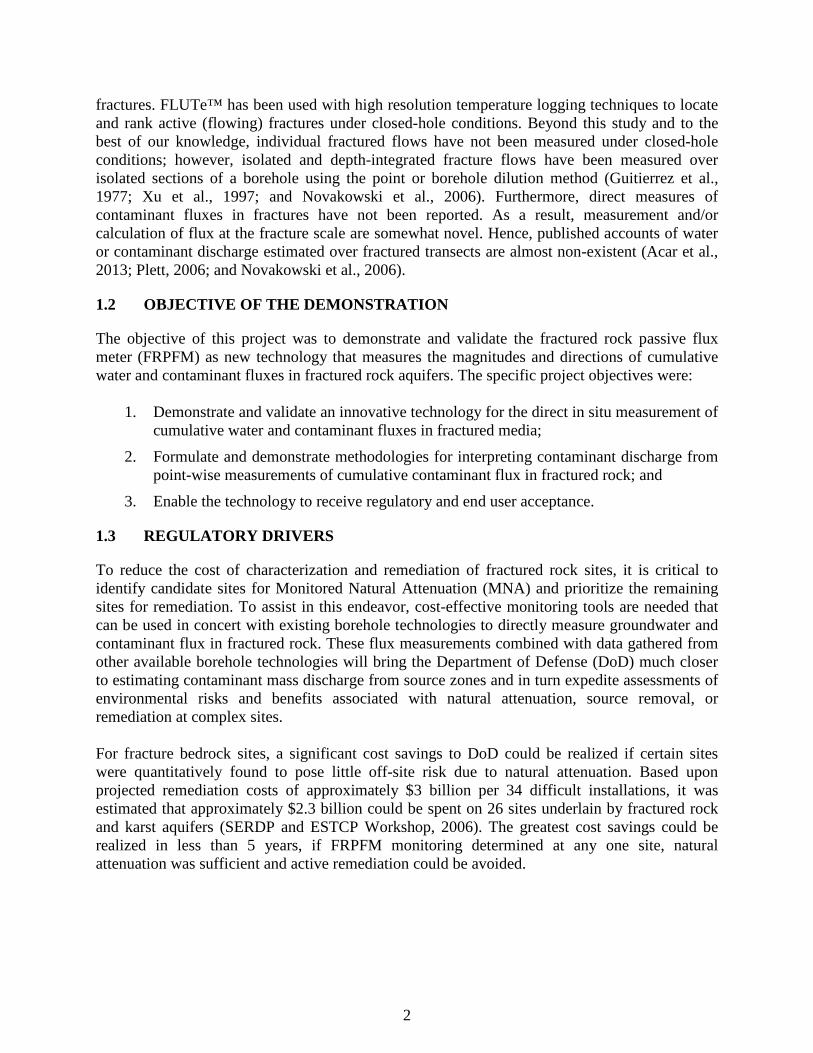
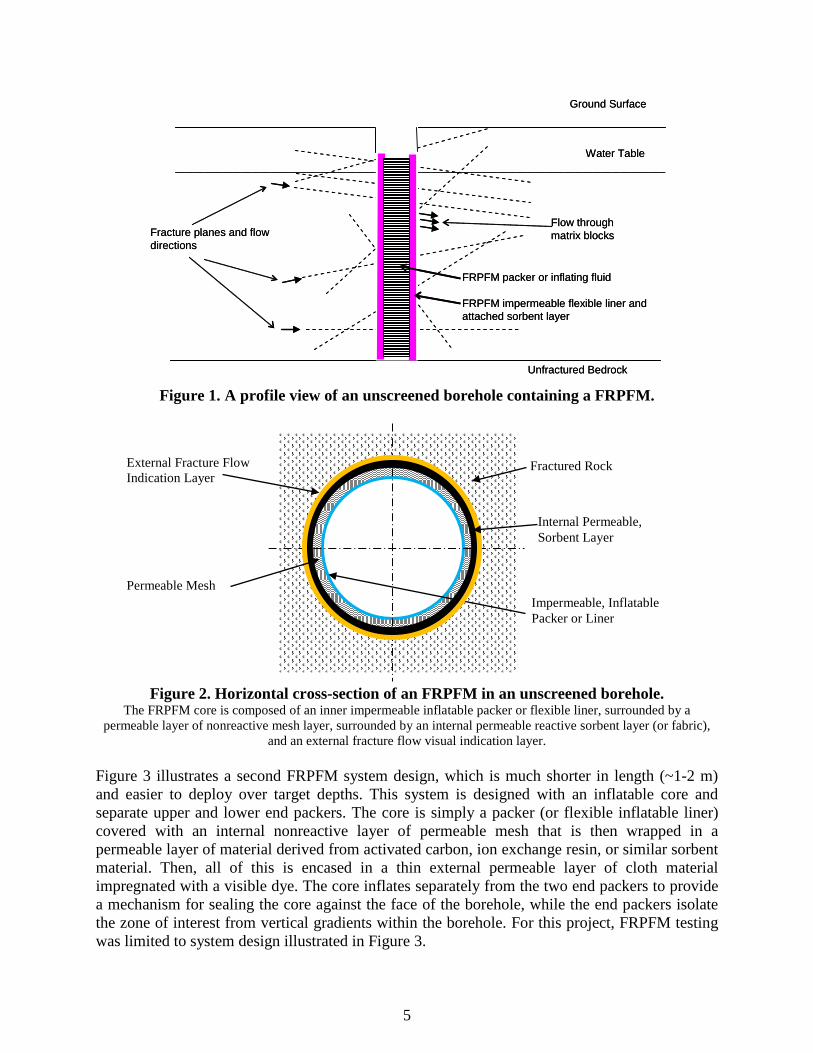
The FRPFM constitutes a new closed-hole passive sensing technology for fractured media. The sensor can be deployed at any depth provided that the unit is placed in a saturated flow system. The FRPFM functions like an inflatable (or mechanically expandable) packer or an impermeable flexible liner that holds one or more reactive permeable fabrics against the wall of the borehole and to any water-filled fractures intersected by the borehole. The FRPFM incorporates novel methods for measuring DNAPL and water fluxes in fractures, but also retains many of the field-tested concepts of the passive fluxmeter (PFM) developed under Environmental Security Technology Certification Program (ESTCP) project ER-0114 (Hatfield et al., 2004; Annable et al., 2005; and Klammler et al., 2007). For example, reactive fabrics function to intercept and retain target groundwater contaminants (i.e., TCE, DCE, VC) and release non-toxic resident tracers (e.g., visible dyes and branch alcohols). The original PFM was design for use in screened wells; however, installations in deep screened wells can be difficult. In addition, this original system was not designed to preclude the unwanted vertical exchange of flow between fractures in rock wells. Thus, a new PFM design was needed that functions under closed-hole conditions in fractured rock wells and is easily installed in deep wells. Figure 1 illustrates an idealized profile view of a FRPFM intercepting fractures and matrix fluid flow over a given borehole depth. Figure 2 represents a plan view or horizontal cross-sectional view of the same FRPFM in a borehole. Both figures clearly show the device composed of an impermeable flexible liner (IFL), such as the commercially available technology sold under the brand name FLUTeTM (Keller et al., 2007), and permeable reactive sorbent layers (or fabric) sandwiched between the IFL and the borehole circumference. The sorbent is a permeable fabric derived from activated carbon, ion exchange resin, etc. The IFL is made of a fluid impermeable flexible material typically available in a tube or sock design that is easily fitted into a borehole or equivalent aperture in a formation. Once inserted, it is inflated with a fluid to cause it to conform to the shape of the borehole. Hence, the FRPFM is essentially a sampling device with thin permeable layers of one or more removable sorbents attached to the outside surface of an IFL. Such a configuration allows the permeable sorbent layers to be pressed against the well screen or borehole wall when the fluxmeter is inserted and inflated. The sorptive layers passively intercept portions of both fracture and matrix flows in order to simultaneously measure local cumulative solute fluxes and groundwater fluxes. Because the IFL itself is impermeable, fracture flow does not enter the borehole, but is instead diverted around the IFL.
5
Figure 1. A profile view of an unscreened borehole containing a FRPFM.
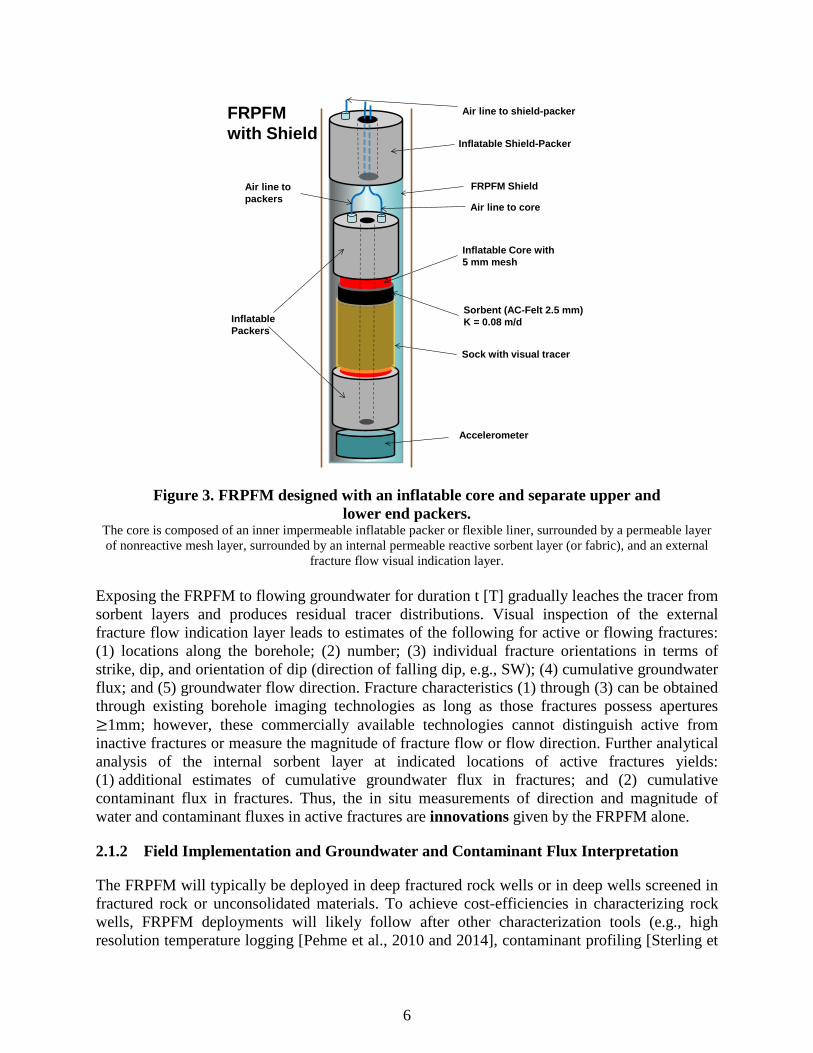
Figure 2. Horizontal cross-section of an FRPFM in an unscreened borehole.
The FRPFM core is composed of an inner impermeable inflatable packer or flexible liner, surrounded by a permeable layer of nonreactive mesh layer, surrounded by an internal permeable reactive sorbent layer (or fabric),
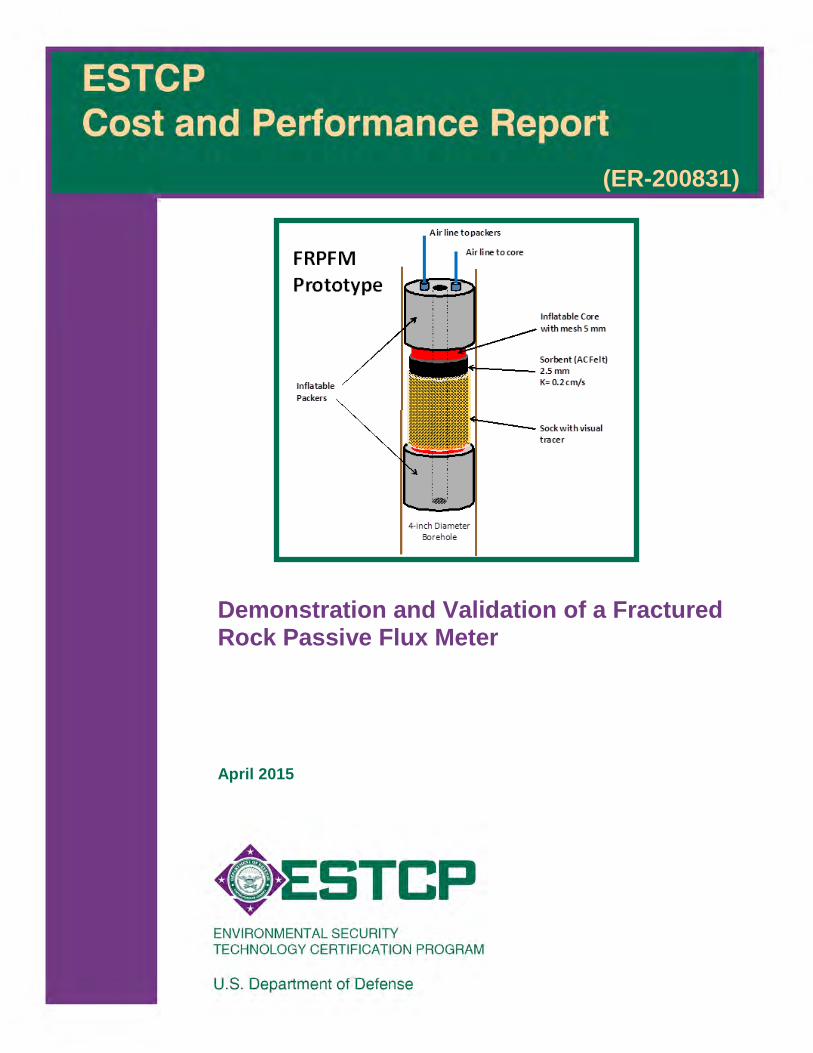
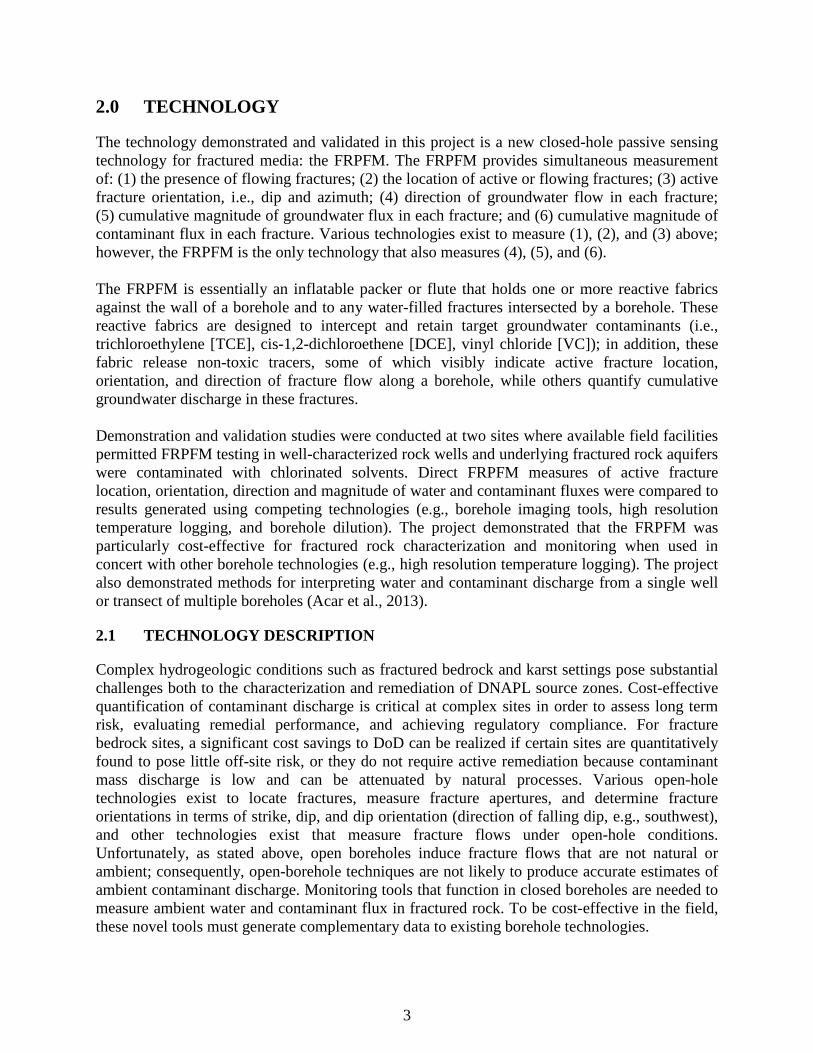
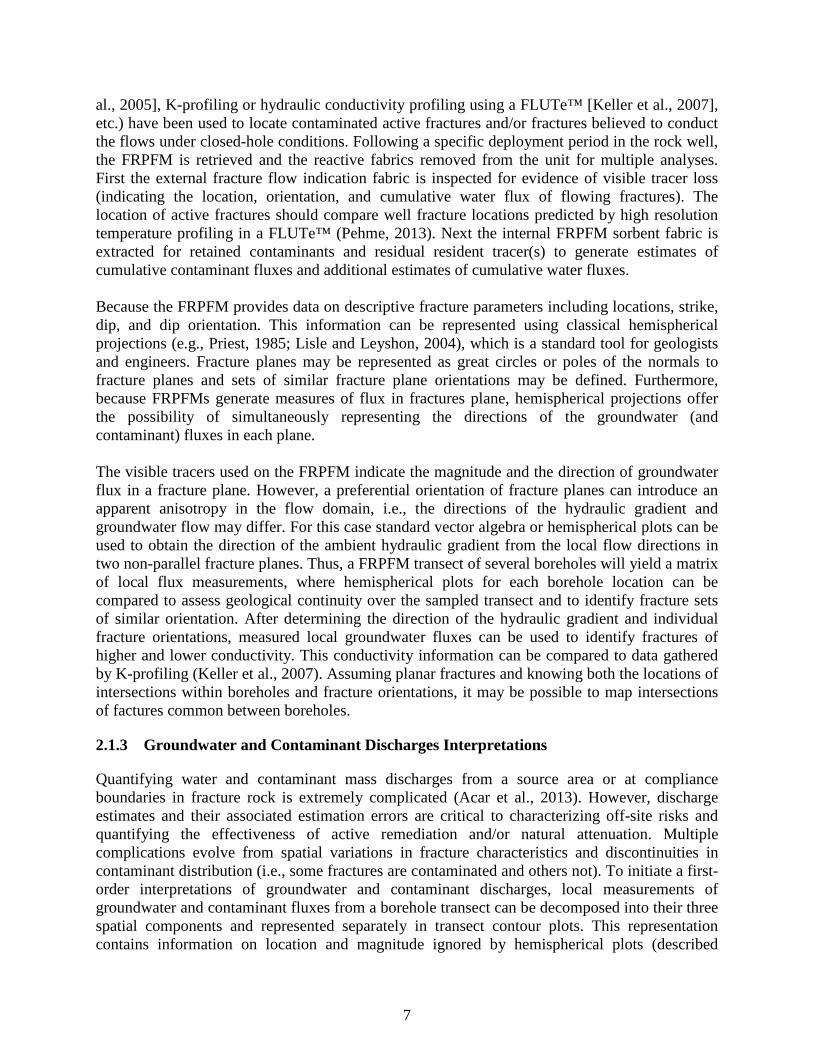
and an external fracture flow visual indication layer. Figure 3 illustrates a second FRPFM system design, which is much shorter in length (~1-2 m) and easier to deploy over target depths. This system is designed with an inflatable core and separate upper and lower end packers. The core is simply a packer (or flexible inflatable liner) covered with an internal nonreactive layer of permeable mesh that is then wrapped in a permeable layer of material derived from activated carbon, ion exchange resin, or similar sorbent material. Then, all of this is encased in a thin external permeable layer of cloth material impregnated with a visible dye. The core inflates separately from the two end packers to provide a mechanism for sealing the core against the face of the borehole, while the end packers isolate the zone of interest from vertical gradients within the borehole. For this project, FRPFM testing was limited to system design illustrated in Figure 3.
Unfractured Bedrock
Ground Surface
Water Table
Fracture planes and flow directions
FRPFM packer or inflating fluid
FRPFM impermeable flexible liner and attached sorbent layer
Flow through matrix blocks
Unfractured Bedrock
Ground Surface
Water Table
Fracture planes and flow directions
FRPFM packer or inflating fluid
FRPFM impermeable flexible liner and attached sorbent layer
Flow through matrix blocks
Fractured Rock
Internal Permeable, Sorbent Layer
External Fracture Flow Indication Layer Permeable Mesh
Impermeable, Inflatable Packer or Liner
6
Figure 3. FRPFM designed with an inflatable core and separate upper and lower end packers.
The core is composed of an inner impermeable inflatable packer or flexible liner, surrounded by a permeable layer of nonreactive mesh layer, surrounded by an internal permeable reactive sorbent layer (or fabric), and an external
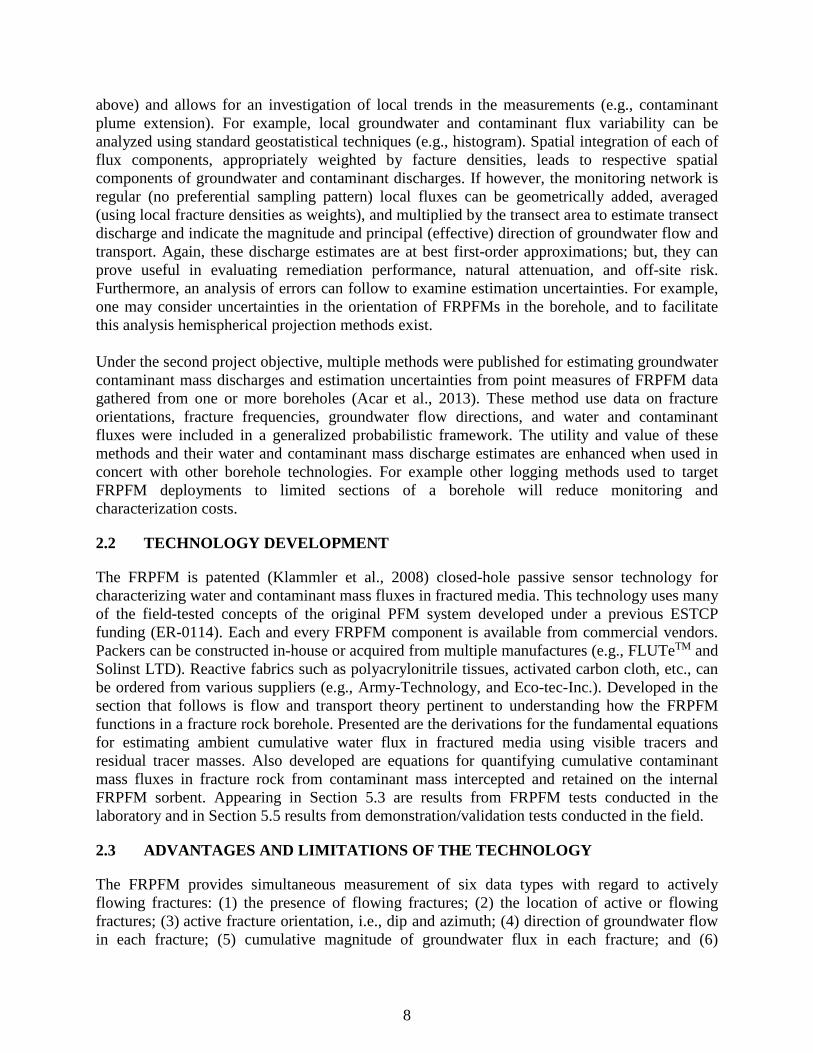
fracture flow visual indication layer. Exposing the FRPFM to flowing groundwater for duration t [T] gradually leaches the tracer from sorbent layers and produces residual tracer distributions. Visual inspection of the external fracture flow indication layer leads to estimates of the following for active or flowing fractures: (1) locations along the borehole; (2) number; (3) individual fracture orientations in terms of strike, dip, and orientation of dip (direction of falling dip, e.g., SW); (4) cumulative groundwater flux; and (5) groundwater flow direction. Fracture characteristics (1) through (3) can be obtained through existing borehole imaging technologies as long as those fractures possess apertures ≥1mm; however, these commercially available technologies cannot distinguish active from inactive fractures or measure the magnitude of fracture flow or flow direction. Further analytical analysis of the internal sorbent layer at indicated locations of active fractures yields: (1) additional estimates of cumulative groundwater flux in fractures; and (2) cumulative contaminant flux in fractures. Thus, the in situ measurements of direction and magnitude of water and contaminant fluxes in active fractures are innovations given by the FRPFM alone.
2.1.2 Field Implementation and Groundwater and Contaminant Flux Interpretation
The FRPFM will typically be deployed in deep fractured rock wells or in deep wells screened in fractured rock or unconsolidated materials. To achieve cost-efficiencies in characterizing rock wells, FRPFM deployments will likely follow after other characterization tools (e.g., high resolution temperature logging [Pehme et al., 2010 and 2014], contaminant profiling [Sterling et
Inflatable Packers
Inflatable Core with 5 mm mesh
Sorbent (AC-Felt 2.5 mm)K = 0.08 m/d
Sock with visual tracer
Air line to packers
Air line to core
Inflatable Shield-Packer
FRPFM Shield
Air line to shield-packer
Accelerometer
FRPFM with Shield
7
al., 2005], K-profiling or hydraulic conductivity profiling using a FLUTe™ [Keller et al., 2007], etc.) have been used to locate contaminated active fractures and/or fractures believed to conduct the flows under closed-hole conditions. Following a specific deployment period in the rock well, the FRPFM is retrieved and the reactive fabrics removed from the unit for multiple analyses. First the external fracture flow indication fabric is inspected for evidence of visible tracer loss (indicating the location, orientation, and cumulative water flux of flowing fractures). The location of active fractures should compare well fracture locations predicted by high resolution temperature profiling in a FLUTe™ (Pehme, 2013). Next the internal FRPFM sorbent fabric is extracted for retained contaminants and residual resident tracer(s) to generate estimates of cumulative contaminant fluxes and additional estimates of cumulative water fluxes. Because the FRPFM provides data on descriptive fracture parameters including locations, strike, dip, and dip orientation. This information can be represented using classical hemispherical projections (e.g., Priest, 1985; Lisle and Leyshon, 2004), which is a standard tool for geologists and engineers. Fracture planes may be represented as great circles or poles of the normals to fracture planes and sets of similar fracture plane orientations may be defined. Furthermore, because FRPFMs generate measures of flux in fractures plane, hemispherical projections offer the possibility of simultaneously representing the directions of the groundwater (and contaminant) fluxes in each plane. The visible tracers used on the FRPFM indicate the magnitude and the direction of groundwater flux in a fracture plane. However, a preferential orientation of fracture planes can introduce an apparent anisotropy in the flow domain, i.e., the directions of the hydraulic gradient and groundwater flow may differ. For this case standard vector algebra or hemispherical plots can be used to obtain the direction of the ambient hydraulic gradient from the local flow directions in two non-parallel fracture planes. Thus, a FRPFM transect of several boreholes will yield a matrix of local flux measurements, where hemispherical plots for each borehole location can be compared to assess geological continuity over the sampled transect and to identify fracture sets of similar orientation. After determining the direction of the hydraulic gradient and individual fracture orientations, measured local groundwater fluxes can be used to identify fractures of higher and lower conductivity. This conductivity information can be compared to data gathered by K-profiling (Keller et al., 2007). Assuming planar fractures and knowing both the locations of intersections within boreholes and fracture orientations, it may be possible to map intersections of factures common between boreholes.
2.1.3 Groundwater and Contaminant Discharges Interpretations
Quantifying water and contaminant mass discharges from a source area or at compliance boundaries in fracture rock is extremely complicated (Acar et al., 2013). However, discharge estimates and their associated estimation errors are critical to characterizing off-site risks and quantifying the effectiveness of active remediation and/or natural attenuation. Multiple complications evolve from spatial variations in fracture characteristics and discontinuities in contaminant distribution (i.e., some fractures are contaminated and others not). To initiate a first-order interpretations of groundwater and contaminant discharges, local measurements of groundwater and contaminant fluxes from a borehole transect can be decomposed into their three spatial components and represented separately in transect contour plots. This representation contains information on location and magnitude ignored by hemispherical plots (described
8
above) and allows for an investigation of local trends in the measurements (e.g., contaminant plume extension). For example, local groundwater and contaminant flux variability can be analyzed using standard geostatistical techniques (e.g., histogram). Spatial integration of each of flux components, appropriately weighted by facture densities, leads to respective spatial components of groundwater and contaminant discharges. If however, the monitoring network is regular (no preferential sampling pattern) local fluxes can be geometrically added, averaged (using local fracture densities as weights), and multiplied by the transect area to estimate transect discharge and indicate the magnitude and principal (effective) direction of groundwater flow and transport. Again, these discharge estimates are at best first-order approximations; but, they can prove useful in evaluating remediation performance, natural attenuation, and off-site risk. Furthermore, an analysis of errors can follow to examine estimation uncertainties. For example, one may consider uncertainties in the orientation of FRPFMs in the borehole, and to facilitate this analysis hemispherical projection methods exist. Under the second project objective, multiple methods were published for estimating groundwater contaminant mass discharges and estimation uncertainties from point measures of FRPFM data gathered from one or more boreholes (Acar et al., 2013). These method use data on fracture orientations, fracture frequencies, groundwater flow directions, and water and contaminant fluxes were included in a generalized probabilistic framework. The utility and value of these methods and their water and contaminant mass discharge estimates are enhanced when used in concert with other borehole technologies. For example other logging methods used to target FRPFM deployments to limited sections of a borehole will reduce monitoring and characterization costs.
2.2 TECHNOLOGY DEVELOPMENT
The FRPFM is patented (Klammler et al., 2008) closed-hole passive sensor technology for characterizing water and contaminant mass fluxes in fractured media. This technology uses many of the field-tested concepts of the original PFM system developed under a previous ESTCP funding (ER-0114). Each and every FRPFM component is available from commercial vendors. Packers can be constructed in-house or acquired from multiple manufactures (e.g., FLUTeTM and Solinst LTD). Reactive fabrics such as polyacrylonitrile tissues, activated carbon cloth, etc., can be ordered from various suppliers (e.g., Army-Technology, and Eco-tec-Inc.). Developed in the section that follows is flow and transport theory pertinent to understanding how the FRPFM functions in a fracture rock borehole. Presented are the derivations for the fundamental equations for estimating ambient cumulative water flux in fractured media using visible tracers and residual tracer masses. Also developed are equations for quantifying cumulative contaminant mass fluxes in fracture rock from contaminant mass intercepted and retained on the internal FRPFM sorbent. Appearing in Section 5.3 are results from FRPFM tests conducted in the laboratory and in Section 5.5 results from demonstration/validation tests conducted in the field.
2.3 ADVANTAGES AND LIMITATIONS OF THE TECHNOLOGY
The FRPFM provides simultaneous measurement of six data types with regard to actively flowing fractures: (1) the presence of flowing fractures; (2) the location of active or flowing fractures; (3) active fracture orientation, i.e., dip and azimuth; (4) direction of groundwater flow in each fracture; (5) cumulative magnitude of groundwater flux in each fracture; and (6)
9
cumulative magnitude of contaminant flux in each fracture. Various technologies exist to measure (1), (2), and (3) above; however, the FRPFM is the only technology that also measures (4), (5), and (6).
Deploying the FRPFM in a borehole and exposing it to flowing groundwater for duration t [T] gradually leaches visible dyes and tracers from the internal and external sorbent layers and produces residual dye and tracer distributions. Visual inspection of the external layer impregnated with a visible dye leads to estimates of five types of information for actively flowing fractures: (1) locations along the borehole; (2) number; (3) individual fracture orientations in terms of strike, dip, and orientation of dip (direction of falling dip, e.g., southwest); (4) cumulative groundwater flux; and (5) groundwater flow direction. Fracture characteristics (1) through (3) can be obtained through existing borehole imaging technologies as long as those fractures possess apertures ≥1mm; however, these commercially available technologies cannot distinguish active from inactive fractures or measure the magnitude or direction of fracture flow. Further analytical analysis of the FRPFM internal sorbent layer at indicated locations of active fractures yields: (1) additional estimates of cumulative groundwater flux in fractures; and (2) cumulative contaminant flux in those fractures. Thus, the in situ measurements of direction and magnitude of water and contaminant fluxes in active fractures are innovations given by the FRPFM alone.
As currently designed, the FRPFM provides high resolution measurements over a specified interrogation zone (typically 1 meter). Due to the high resolution nature of the FRPFM technology, its optimum application would be for characterizing targeted borehole depth intervals and not for screening conditions over an entire borehole. FRPFM prototypes tested in this project were used to interrogate 1 meter depth intervals in 4-inch and 6-inch fractured rock wells.

This page left blank intentionally.
11
3.0 PERFORMANCE OBJECTIVES
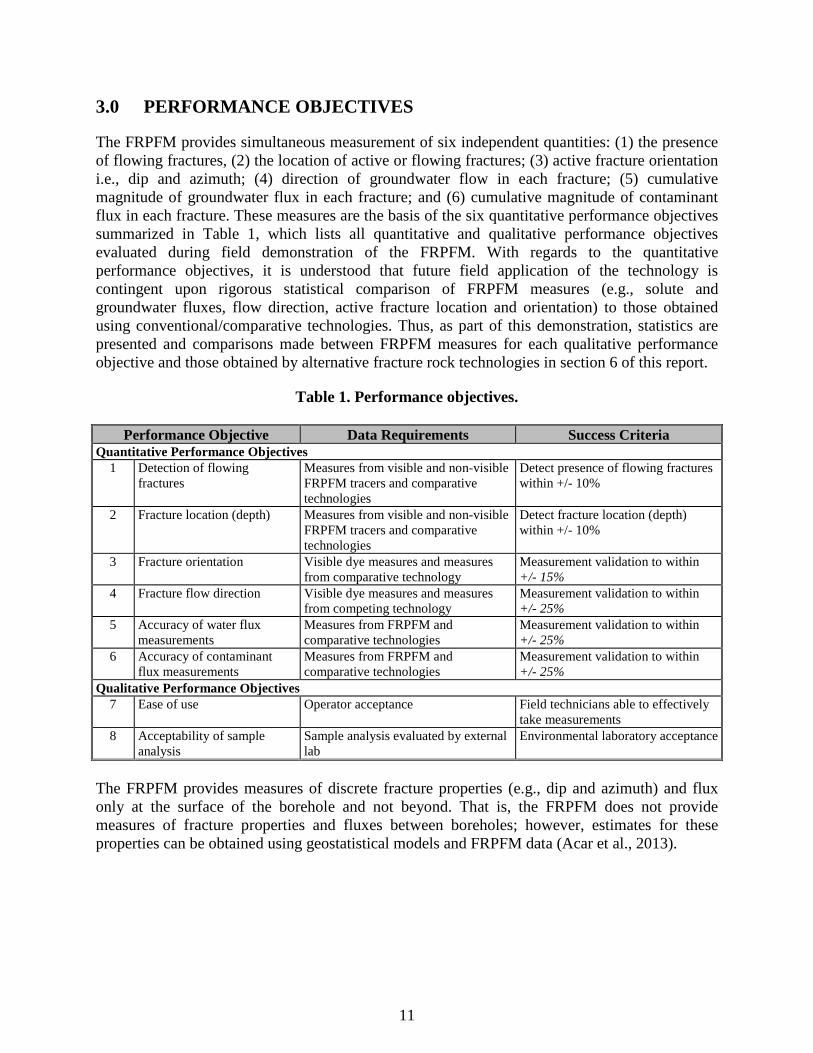
The FRPFM provides simultaneous measurement of six independent quantities: (1) the presence of flowing fractures, (2) the location of active or flowing fractures; (3) active fracture orientation i.e., dip and azimuth; (4) direction of groundwater flow in each fracture; (5) cumulative magnitude of groundwater flux in each fracture; and (6) cumulative magnitude of contaminant flux in each fracture. These measures are the basis of the six quantitative performance objectives summarized in Table 1, which lists all quantitative and qualitative performance objectives evaluated during field demonstration of the FRPFM. With regards to the quantitative performance objectives, it is understood that future field application of the technology is contingent upon rigorous statistical comparison of FRPFM measures (e.g., solute and groundwater fluxes, flow direction, active fracture location and orientation) to those obtained using conventional/comparative technologies. Thus, as part of this demonstration, statistics are presented and comparisons made between FRPFM measures for each qualitative performance objective and those obtained by alternative fracture rock technologies in section 6 of this report.
Table 1. Performance objectives.
Performance Objective Data Requirements Success Criteria Quantitative Performance Objectives
1 Detection of flowing fractures
Measures from visible and non-visible FRPFM tracers and comparative technologies
Detect presence of flowing fractures within +/- 10%
2 Fracture location (depth) Measures from visible and non-visible FRPFM tracers and comparative technologies
Detect fracture location (depth) within +/- 10%
3 Fracture orientation Visible dye measures and measures from comparative technology
Measurement validation to within +/- 15%
4 Fracture flow direction Visible dye measures and measures from competing technology
Measurement validation to within +/- 25%
5 Accuracy of water flux measurements
Measures from FRPFM and comparative technologies
Measurement validation to within +/- 25%
6 Accuracy of contaminant flux measurements
Measures from FRPFM and comparative technologies
Measurement validation to within +/- 25%
Qualitative Performance Objectives 7 Ease of use Operator acceptance Field technicians able to effectively
take measurements 8 Acceptability of sample
analysis Sample analysis evaluated by external lab
Environmental laboratory acceptance
The FRPFM provides measures of discrete fracture properties (e.g., dip and azimuth) and flux only at the surface of the borehole and not beyond. That is, the FRPFM does not provide measures of fracture properties and fluxes between boreholes; however, estimates for these properties can be obtained using geostatistical models and FRPFM data (Acar et al., 2013).

This page left blank intentionally.
13
4.0 SITE DESCRIPTION
Over the duration of this project, a total of 18 FRPFM deployments were performed at two sites: the Guelph Tool Site (GTS) in Ontario, Canada, and the former Naval Air Warfare Center (NAWC) in West Trenton, New Jersey. Both sites had previously existing networks of well characterized fractured frock wells.
4.1 GUELPH TOOL SITE
4.1.1 GTS: SITE LOCATION AND HISTORY
Guelph Tool Inc. is an automotive parts manufacturing company in the City of Guelph that overlies known TCE contamination in the underlying dolostone aquifer. The criteria used in selecting the GTS were the following:
a. The site has an excellent existing infrastructure to support the demonstration.
b. The site is well-characterized.
c. The site has several well-characterized shallow boreholes in fracture rock (dolostone) of high bulk conductivity.
d. The site has rock fractures that range from visually undetectable (<1 mm) to large apertures (>1 mm).
e. The site has chlorinated solvent contamination.
f. The site has natural-gradient flow conditions.
The GTS is located ~1 mile from the G360 Centre for Applied Groundwater Research at the University of Guelph in Guelph, Ontario. Dr. Parker (one of the project Principal Investigators [PI]) is the director of G360. The site’s proximity to G360 and on-site infrastructure enabled the research team to demonstrate detailed characterization of fracture flux variations in multiple well-characterized boreholes. In addition, Dr. Parker’s group performed high resolution temperature profiling that enabled the team to demonstrate that the FRPFM detects flow in fractures that are not detectable using optical or acoustic techniques.
4.1.2 GTS: SITE GEOLOGY/HYDROLOGY
The bedrock in the Guelph area corresponds to Paleozoic sedimentary rocks of Middle Silurian age. In the vicinity of the GTS, these are the dolostones of the Guelph Formation, which are underlain by dolostones of the Amabel Formation. Flow within the bedrock is expected to be predominantly to the south and east, based on limited water level data. The permeability of the Guelph Amabel aquifer is due primarily to the chemical dissolution of dolostone along fractures and bedding planes. The permeability is variable due to the large differences in opening sizes and patterns caused by fracturing. Due to weathering processes, the upper 5 meters of the aquifer is generally the most permeable.
14
4.1.3 GTS: CONTAMINANT DISTRIBUTION
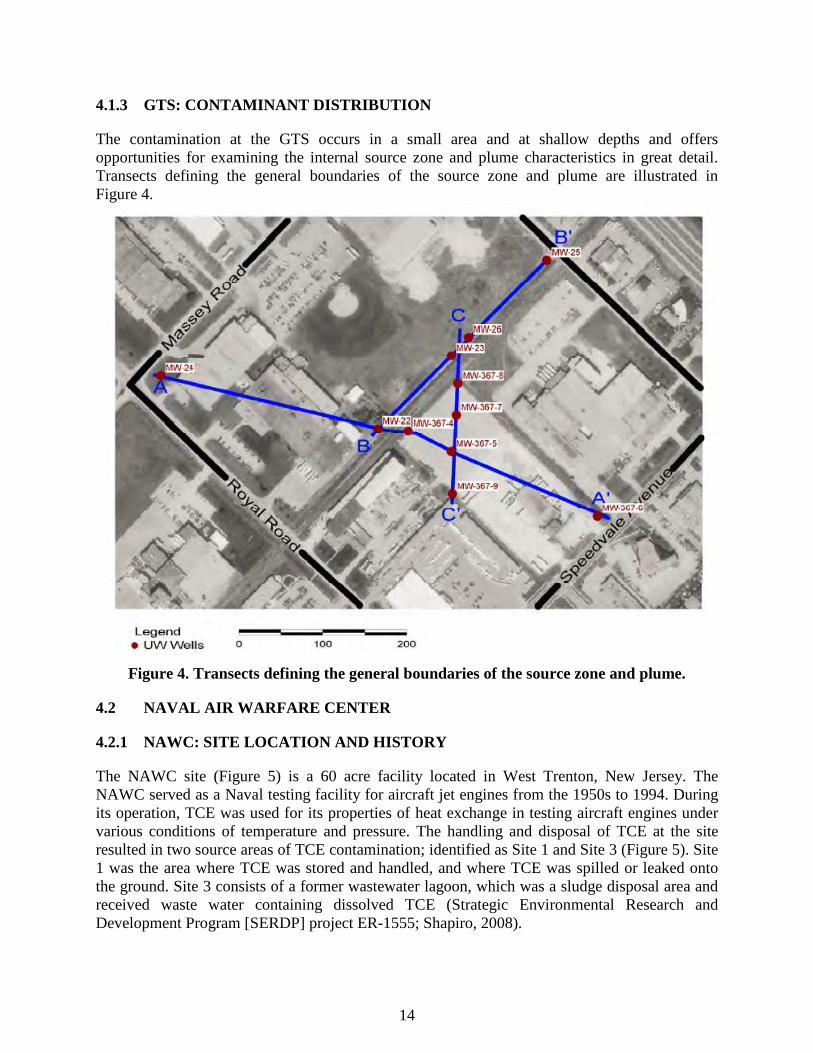
The contamination at the GTS occurs in a small area and at shallow depths and offers opportunities for examining the internal source zone and plume characteristics in great detail. Transects defining the general boundaries of the source zone and plume are illustrated in Figure 4.
Figure 4. Transects defining the general boundaries of the source zone and plume.
4.2 NAVAL AIR WARFARE CENTER
4.2.1 NAWC: SITE LOCATION AND HISTORY
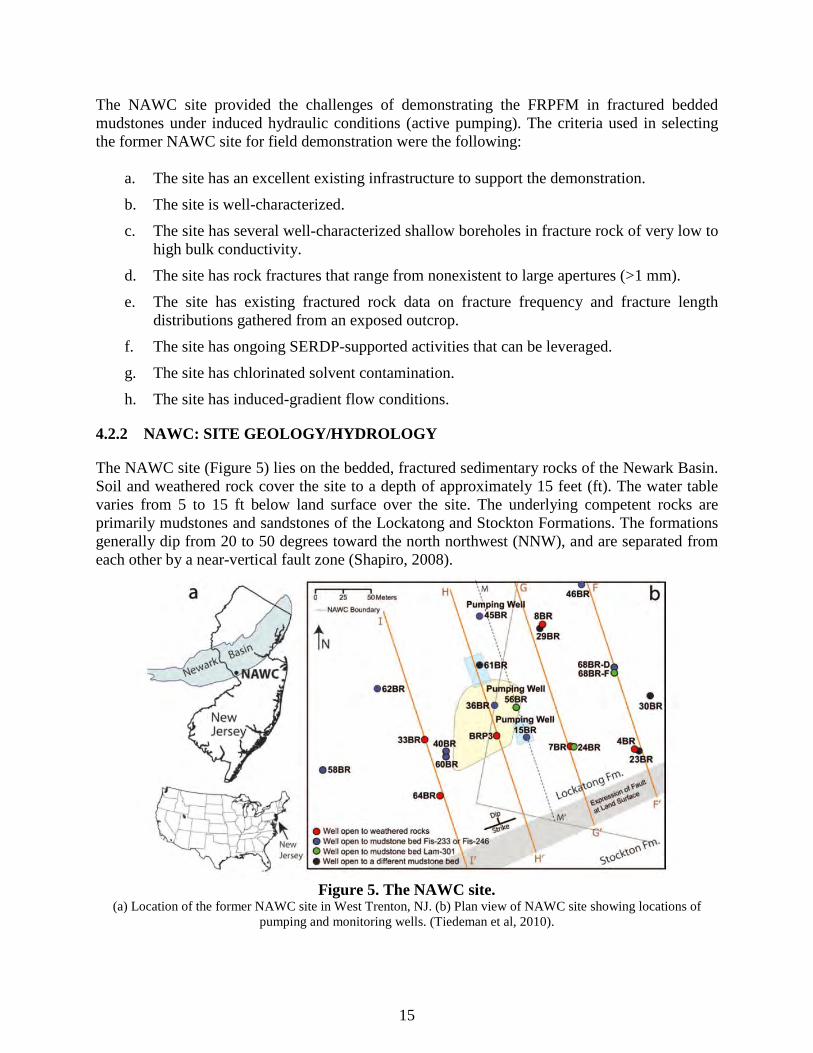
The NAWC site (Figure 5) is a 60 acre facility located in West Trenton, New Jersey. The NAWC served as a Naval testing facility for aircraft jet engines from the 1950s to 1994. During its operation, TCE was used for its properties of heat exchange in testing aircraft engines under various conditions of temperature and pressure. The handling and disposal of TCE at the site resulted in two source areas of TCE contamination; identified as Site 1 and Site 3 (Figure 5). Site 1 was the area where TCE was stored and handled, and where TCE was spilled or leaked onto the ground. Site 3 consists of a former wastewater lagoon, which was a sludge disposal area and received waste water containing dissolved TCE (Strategic Environmental Research and Development Program [SERDP] project ER-1555; Shapiro, 2008).
15
The NAWC site provided the challenges of demonstrating the FRPFM in fractured bedded mudstones under induced hydraulic conditions (active pumping). The criteria used in selecting the former NAWC site for field demonstration were the following:
a. The site has an excellent existing infrastructure to support the demonstration.
b. The site is well-characterized.
c. The site has several well-characterized shallow boreholes in fracture rock of very low to high bulk conductivity.
d. The site has rock fractures that range from nonexistent to large apertures (>1 mm).
e. The site has existing fractured rock data on fracture frequency and fracture length distributions gathered from an exposed outcrop.
f. The site has ongoing SERDP-supported activities that can be leveraged.
g. The site has chlorinated solvent contamination.
h. The site has induced-gradient flow conditions.
4.2.2 NAWC: SITE GEOLOGY/HYDROLOGY
The NAWC site (Figure 5) lies on the bedded, fractured sedimentary rocks of the Newark Basin. Soil and weathered rock cover the site to a depth of approximately 15 feet (ft). The water table varies from 5 to 15 ft below land surface over the site. The underlying competent rocks are primarily mudstones and sandstones of the Lockatong and Stockton Formations. The formations generally dip from 20 to 50 degrees toward the north northwest (NNW), and are separated from each other by a near-vertical fault zone (Shapiro, 2008).
Figure 5. The NAWC site.
(a) Location of the former NAWC site in West Trenton, NJ. (b) Plan view of NAWC site showing locations of pumping and monitoring wells. (Tiedeman et al, 2010).
16
4.2.3 NAWC: CONTAMINANT DISTRIBUTION
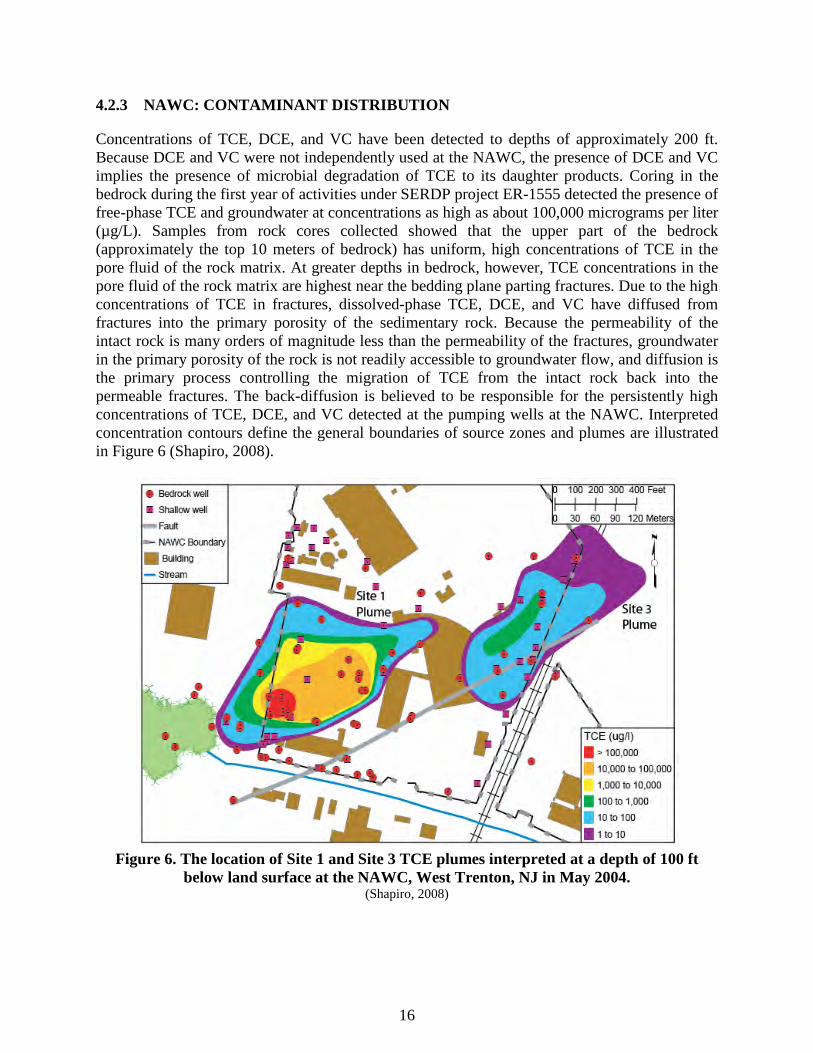
Concentrations of TCE, DCE, and VC have been detected to depths of approximately 200 ft. Because DCE and VC were not independently used at the NAWC, the presence of DCE and VC implies the presence of microbial degradation of TCE to its daughter products. Coring in the bedrock during the first year of activities under SERDP project ER-1555 detected the presence of free-phase TCE and groundwater at concentrations as high as about 100,000 micrograms per liter (µg/L). Samples from rock cores collected showed that the upper part of the bedrock (approximately the top 10 meters of bedrock) has uniform, high concentrations of TCE in the pore fluid of the rock matrix. At greater depths in bedrock, however, TCE concentrations in the pore fluid of the rock matrix are highest near the bedding plane parting fractures. Due to the high concentrations of TCE in fractures, dissolved-phase TCE, DCE, and VC have diffused from fractures into the primary porosity of the sedimentary rock. Because the permeability of the intact rock is many orders of magnitude less than the permeability of the fractures, groundwater in the primary porosity of the rock is not readily accessible to groundwater flow, and diffusion is the primary process controlling the migration of TCE from the intact rock back into the permeable fractures. The back-diffusion is believed to be responsible for the persistently high concentrations of TCE, DCE, and VC detected at the pumping wells at the NAWC. Interpreted concentration contours define the general boundaries of source zones and plumes are illustrated in Figure 6 (Shapiro, 2008).
Figure 6. The location of Site 1 and Site 3 TCE plumes interpreted at a depth of 100 ft
below land surface at the NAWC, West Trenton, NJ in May 2004. (Shapiro, 2008)
17
5.0 TEST DESIGN
5.1 CONCEPTUAL EXPERIMENTAL DESIGN
In this demonstration the FRPFM was tested under ambient and induced flow conditions in well-characterized boreholes in both fractured mudstone and dolostone. Repeated flux measurements were taken over regular depth intervals for comparison to competing technologies. Borehole dilution (BHD) tests were conducted over the same depth intervals for validation of flux measurements. To know in advance at what depth intervals to conduct FRPFM testing, selected boreholes were characterized based upon the extent to which data existed on:
1) Location and orientation of visible fractures; 2) Location of flowing fractures under ambient conditions; and, 3) Fractured rock transmissivity at a regular 0.3 to 1.5 meter depth interval.
Thus, the experimental design involved testing the FRPFM performance over multiple 1.0 meter intervals using existing characterization data to guide testing and in addition generate new data from the use of competitive technologies. Given the estimated locations of flowing fractures from high resolution temperature profiling (HRTP), it was feasible to directly assess FRPFM performance under ambient conditions with respect to:
1) Detecting the location of flowing fractures using visible tracers (compared to detection by HRTP);
2) Measuring active fracture orientation using visible tracers (compared to optical detection methods);
3) Measuring water flux at discrete intervals (compared to BHD tests);
4) Measuring TCE and DCE fluxes at discrete intervals (compared to calculated fluxes from TCE and DCE concentrations and measured water flux by BHD tests); and,
5) Measuring active fracture flow direction as indicated by the elution of a visible tracer at locations of active fractures (compared to HRTP measurements).
The fundamental virtue of this basic field demonstration design was the repetitive testing of the FRPFM against competing technologies in one or more well-characterized boreholes in a fractured mudstone and dolostone, thus producing data that can be subjected to rigorous statistical analysis.
5.2 BASELINE CHARACTERIZATION
It is prudent to anticipate that the FRPFM will typically be deployed in deep fractured rock wells or in deep wells screened in fractured rock or unconsolidated materials. To achieve cost-efficiencies in characterizing rock wells, FRPFM deployments will likely follow after other characterization tools (e.g., high resolution temperature logging [Pehme et al., 2007]; contaminant profiling [Sterling et al., 2005]; hydrophysical logging [Wilson et al., 2001]; K-profiling or hydraulic conductivity profiling using a FLUTe™ [Keller et al., 2007], etc.) have been used to locate contaminated fractures and/or fractures believed to conduct flows under
18
closed-hole conditions. Thus, if the FRPFM demonstration were being conducted on a new borehole, baseline characterization would include the following:
1) Measuring groundwater levels;
2) Measuring contaminant concentrations;
3) Conducting high resolution temperature logging in a FLUTe™ (closed hole conditions) to detect locations of flow fractures;
4) Conducting a down hole optical survey of visible fractures;
5) Analyzing rock cores for fractures or zones of contamination; and possibly,
6) Conducting targeted straddle packer tests Fracture hydraulic conductivity or hydraulic conductivity profiling using a FLUTe™ (Keller et al., 2007).
Because baseline characterization activities 3-6 were previously completed at both GTS and NAWC in multiple wells, measurement of water levels and contaminant concentrations were the two characterizations that were necessary prior to and during FRPFM field testing.
5.2.1 LABORATORY STUDY RESULTS
The intent of this phase of work was to select: 1) resident tracers and sorbent appropriate for the target contaminants and fracture flow conditions; 2) an appropriate visual tracer (dye) and fabric for visual indication of flowing fractures; and 3) to perform initial prototype design and deployment testing to prepare for field-scale testing. Each stage of lab work had multiple tasks, and portions of each stage were performed in parallel to determine the best individual device components for specific purposes (i.e., the best combination of dyes and fabric to provide visual indication of flowing fracture, and the best combination of sorbents and resident tracers for measuring water flow/flux within fractures). Once tested, the individual components were assembled for prototype testing using two different physical flow simulators (fracture flow simulator and large three-dimensional aquifer box). The flow tests were used to evaluate FRPFM performance under controlled flow conditions, and to compare results from competing open- and closed-hole technologies. A third and final stage of lab testing was performed in a full-scale mock borehole (4-inch diameter polyvinyl chloride [PVC] casing 36 ft deep) to simulate field deployment conditions in order to assess field-scale installation issues and develop optimal installation procedures in preparation for field tests. Between each stage of testing the FRPFM prototype was modified and scaled-up to prepare for field testing. More detailed discussion of lab procedures and results is provided in section 5.3 of the project Final Report.
5.3 FIELD TESTING
Over the duration of the project, 22 FRPFM deployments and 35 modified BHD tests were performed at two sites: GTS in Ontario, Canada, and the former NAWC in West Trenton, New Jersey, both of which had previously existing networks of well characterized fractured frock wells. The field demonstration tests were performed in a sequential fashion, progressively testing individual components of the FRPFM technology while incrementally incorporating newer
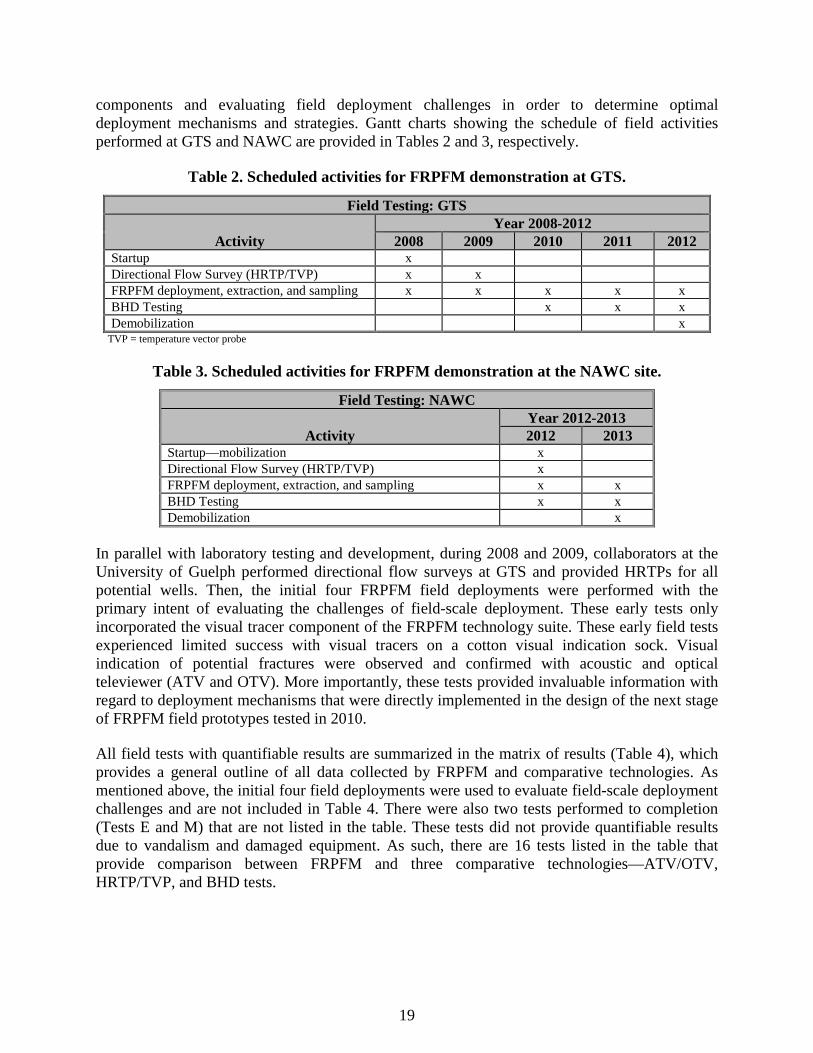
19
components and evaluating field deployment challenges in order to determine optimal deployment mechanisms and strategies. Gantt charts showing the schedule of field activities performed at GTS and NAWC are provided in Tables 2 and 3, respectively.
Table 2. Scheduled activities for FRPFM demonstration at GTS.
Field Testing: GTS
Activity Year 2008-2012
2008 2009 2010 2011 2012 Startup x Directional Flow Survey (HRTP/TVP) x x FRPFM deployment, extraction, and sampling x x x x x BHD Testing x x x Demobilization x
TVP = temperature vector probe
Table 3. Scheduled activities for FRPFM demonstration at the NAWC site.
Field Testing: NAWC
Activity Year 2012-2013 2012 2013
Startup—mobilization x Directional Flow Survey (HRTP/TVP) x FRPFM deployment, extraction, and sampling x x BHD Testing x x Demobilization x
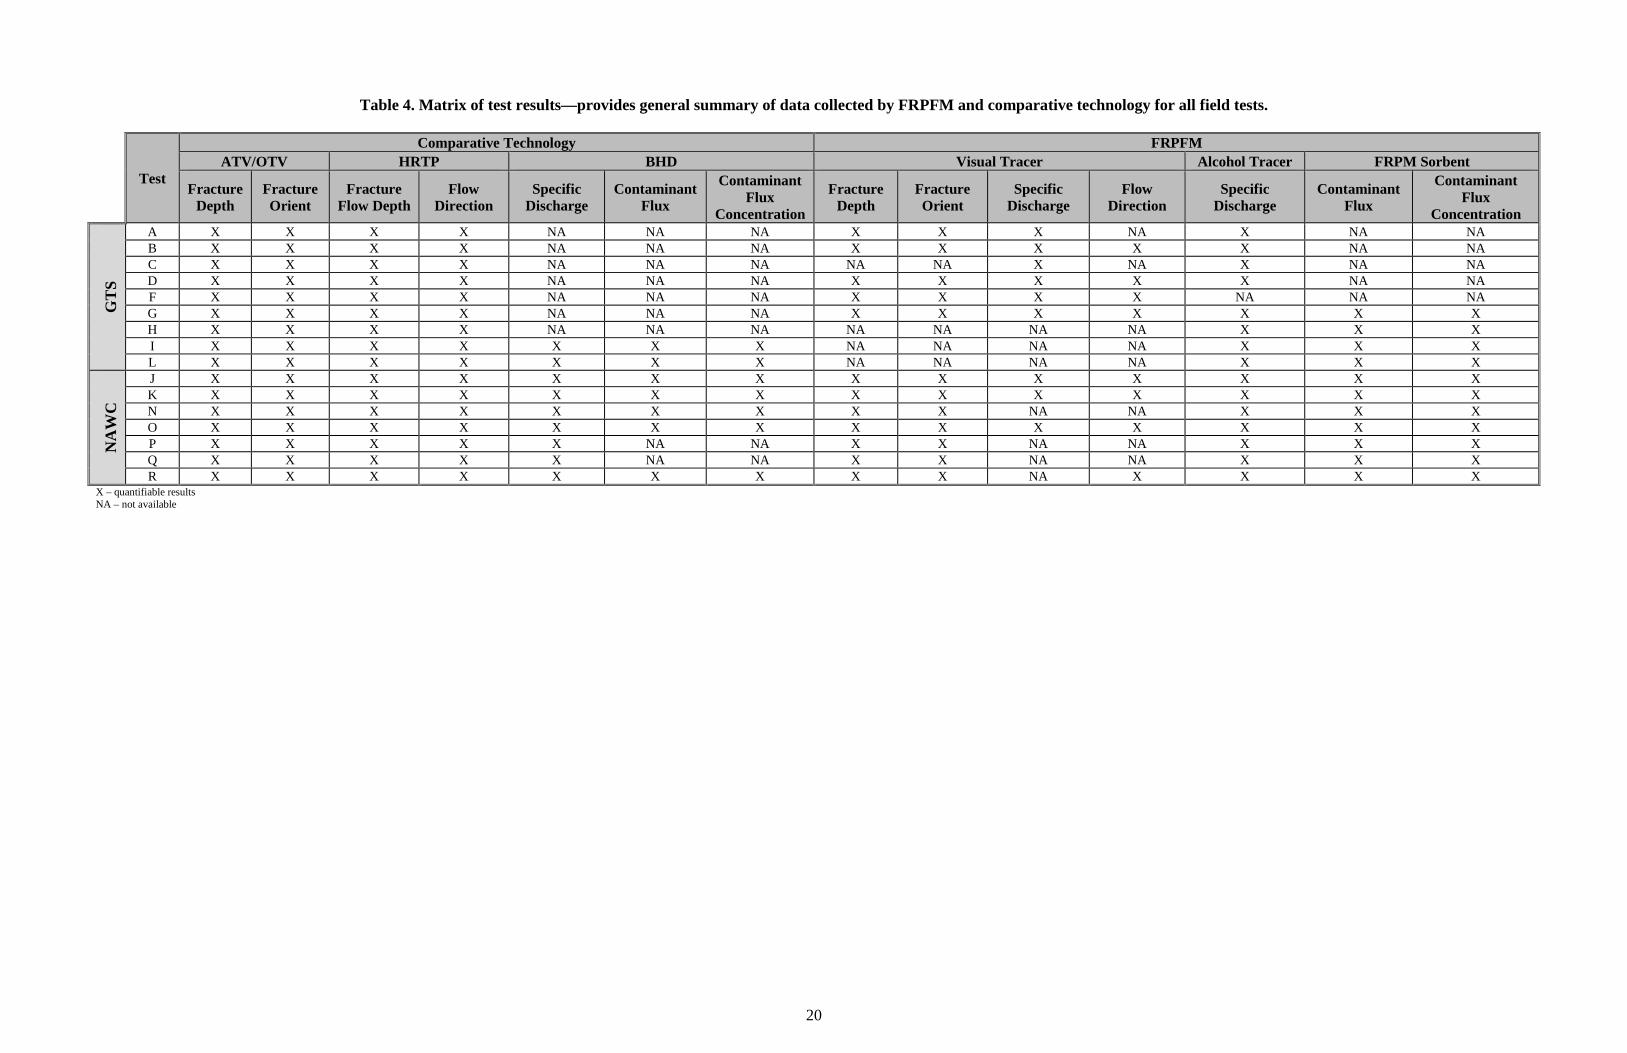
In parallel with laboratory testing and development, during 2008 and 2009, collaborators at the University of Guelph performed directional flow surveys at GTS and provided HRTPs for all potential wells. Then, the initial four FRPFM field deployments were performed with the primary intent of evaluating the challenges of field-scale deployment. These early tests only incorporated the visual tracer component of the FRPFM technology suite. These early field tests experienced limited success with visual tracers on a cotton visual indication sock. Visual indication of potential fractures were observed and confirmed with acoustic and optical televiewer (ATV and OTV). More importantly, these tests provided invaluable information with regard to deployment mechanisms that were directly implemented in the design of the next stage of FRPFM field prototypes tested in 2010. All field tests with quantifiable results are summarized in the matrix of results (Table 4), which provides a general outline of all data collected by FRPFM and comparative technologies. As mentioned above, the initial four field deployments were used to evaluate field-scale deployment challenges and are not included in Table 4. There were also two tests performed to completion (Tests E and M) that are not listed in the table. These tests did not provide quantifiable results due to vandalism and damaged equipment. As such, there are 16 tests listed in the table that provide comparison between FRPFM and three comparative technologies—ATV/OTV, HRTP/TVP, and BHD tests.
20
Table 4. Matrix of test results—provides general summary of data collected by FRPFM and comparative technology for all field tests.
Test
Comparative Technology FRPFM ATV/OTV HRTP BHD Visual Tracer Alcohol Tracer FRPM Sorbent
Fracture Depth
Fracture Orient
Fracture Flow Depth
Flow Direction
Specific Discharge
Contaminant Flux
Contaminant Flux
Concentration
Fracture Depth
Fracture Orient
Specific Discharge
Flow Direction
Specific Discharge
Contaminant Flux
Contaminant Flux
Concentration
GT
S
A X X X X NA NA NA X X X NA X NA NA B X X X X NA NA NA X X X X X NA NA C X X X X NA NA NA NA NA X NA X NA NA D X X X X NA NA NA X X X X X NA NA F X X X X NA NA NA X X X X NA NA NA G X X X X NA NA NA X X X X X X X H X X X X NA NA NA NA NA NA NA X X X I X X X X X X X NA NA NA NA X X X L X X X X X X X NA NA NA NA X X X
NA
WC
J X X X X X X X X X X X X X X K X X X X X X X X X X X X X X N X X X X X X X X X NA NA X X X O X X X X X X X X X X X X X X P X X X X X NA NA X X NA NA X X X Q X X X X X NA NA X X NA NA X X X R X X X X X X X X X NA X X X X
X – quantifiable results NA – not available
21
During 2010, five FRPFM field deployments were performed at the Guelph Tool site. The target zones for FRPFM interrogation were determined based upon pre-existing geophysics data (ATV/OTV) and closed-hole HRTP/TVP profiles used to indicate the presence of flow within the borehole. The first FRPFM test of 2010 incorporated two components of the FRPFM technology suite: 1) internal alcohol tracers on a new sorbent media (activated carbon felt) that was selected specifically for fracture rock applications based upon extensive laboratory testing; and 2) improved visual tracer sock now composed of a nylon-spandex blend (again, specifically selected for fracture rock applications based upon extensive laboratory testing). The internal tracers provide a direct measure of volumetric water flux (specific discharge) through the FRPFM, while the visual tracer provides indication of the presence, spatial distribution, and orientation of flowing fractures along with the direction of groundwater flow and an independent measure of water flux. Subsequent field tests during 2010 incrementally added new components to each subsequent FRPFM field prototype. Tests were performed incorporating a stainless steel shield used to encapsulate the FRPFM during downward deployment and upward retrieval within the borehole. The shield serves two purposes: 1) it physically protects the integrity of the visual tracer sock and underlying activated carbon felt by preventing contact with fracture rock face of borehole; and 2) it precludes internal tracer loss due to vertical flow of water through the device during deployment and retrieval. The final phase of testing during 2010 incorporated an accelerometer on the base of the FRPFM assembly in order to record the orientation of the device with regard to magnetic north during deployment. This allows for evaluation of the direction of flow within the FRPFM interrogation zone. With the inclusion of the accelerometer, the complete suite of FRPFM technologies had been assembled and tested at the field scale. During 2011, three FRPFM field deployments were performed along with three modified BHD tests at GTS. The intent for this phase of testing was to evaluate the FRPFM capabilities for quantifying contaminant flux, and to validate the FRPFM values for water flux and contaminant flux with independent measures obtained using modified BHD tests. During 2012, field demonstration efforts were expanded to include tests running in parallel at both GTS and NAWC in New Jersey. A total of five FRPFM deployments were performed, along with one FRPFM push-pull test and 16 BHD tests. The final phase of field testing was performed in 2013 at the NAWC site. A total of five FRPFM deployments were performed along with 16 modified BHD tests. The outcome of the combined results from all of the field tests is to demonstrate that the FRPFM provides direct, high-resolution, simultaneous measure of six data types with regard to actively flowing fractures. The data types correspond to the quantitative performance objectives outlined in Table 1: 1) detection of flowing fractures, 2) fracture location (depth), 3) fracture orientation, 4) fracture flow direction, 5) groundwater flux (specific discharge), and 6) contaminant mass flux.
5.4 SAMPLING METHODS
The objective of the sampling plan for this study was to acquire sufficient data to validate FRPFM technology performance in the field and allow regulatory agencies and managers to evaluate the innovative nature of the technology. Because the FRPFM provides time integrated
22
measures of both water and contaminant fluxes, temporal variations in flux are not a concern. However, spatial variations in flux can be significant. The visible tracers used on the FRPFM provide an indication of where sorbent sampling is needed to quantify water and contaminant fluxes in active fractures. Using visual tracer results to inform sorbent sampling allows for proper evaluation of spatial variations in both water and contaminant fluxes. Sample Collection. Two types of samples were collected during this study: ground water samples, and sorbent samples from FRPFM. Sampling methods and sample handling procedures are discussed in detail in Section 5.6 of the project Final Report.
5.5 SAMPLING RESULTS
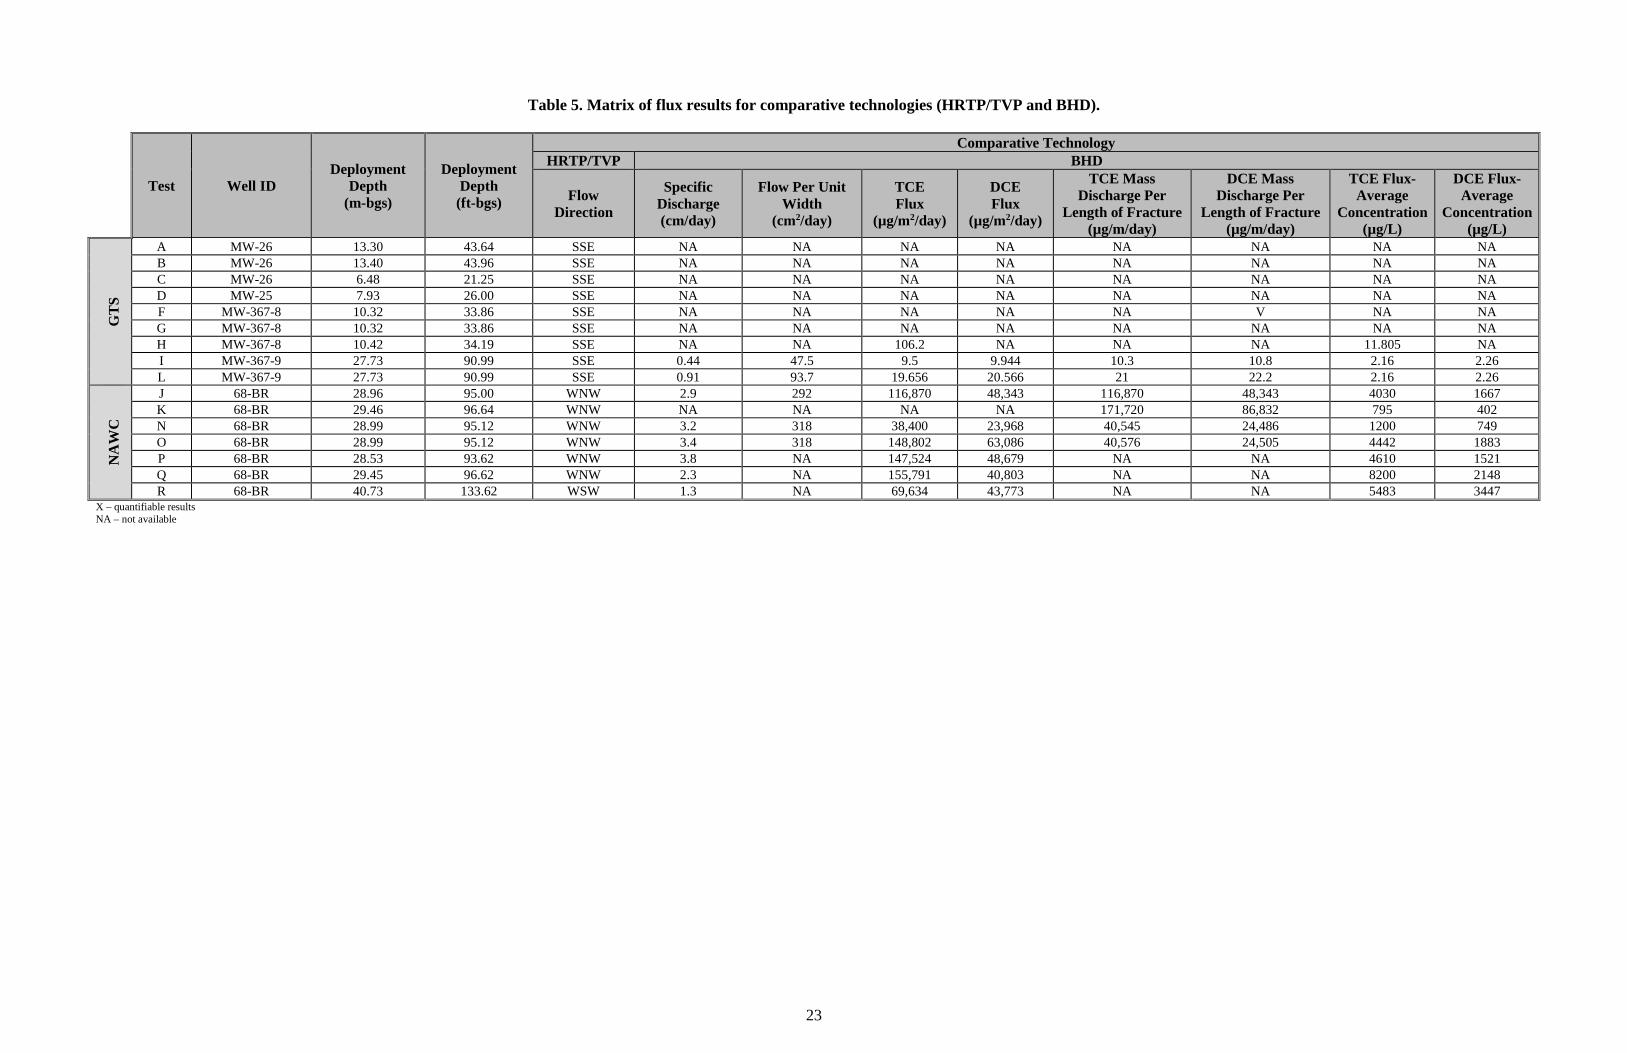
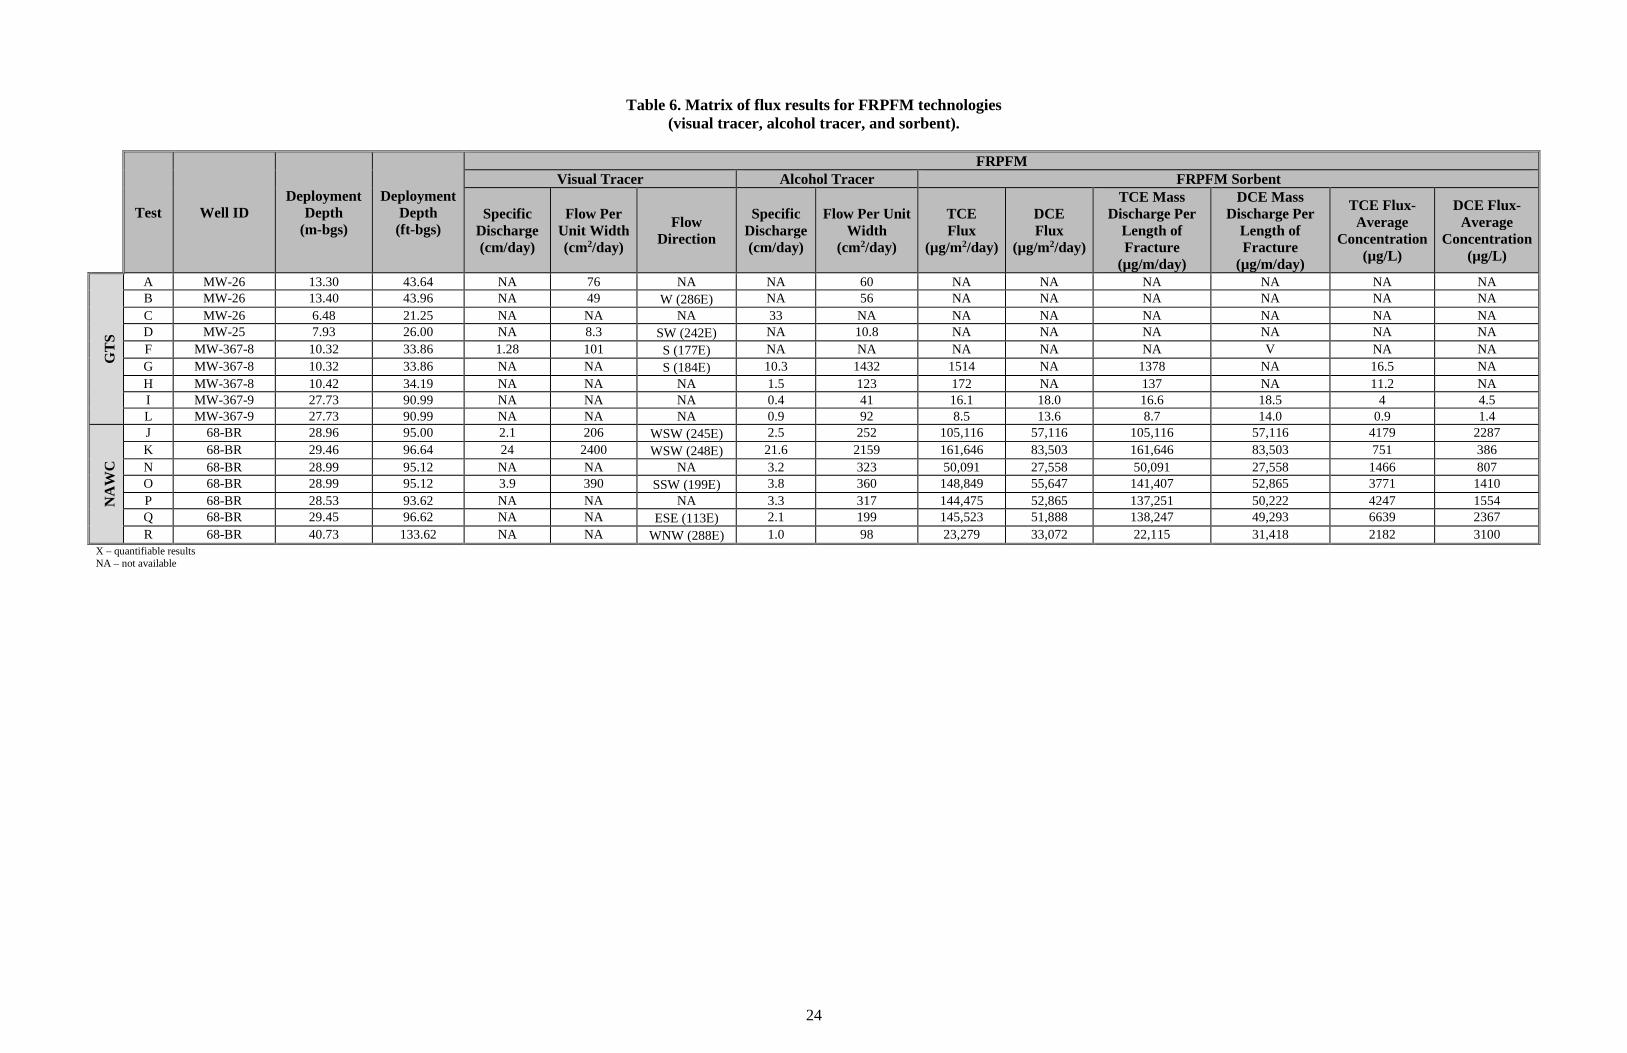
During 2010, five FRPFM field deployments were performed at GTS (Tests A, B, C, D, and E). The target zones for FRPFM interrogation were determined based upon pre-existing geophysics data and closed-hole high resolution temperature profiles used to indicate the presence of flow within the borehole. The objectives of these early tests were to: 1) test the capability of the FRPFM to identify flowing features within fractured rock systems; and 2) provide estimates for flow direction. It should be noted that the deployment depth for all tests is referenced to the center of the 1-meter FRPFM interrogation zone. As such, there is 0.5 meter (1.64 ft) of interrogation above and below the listed deployment depth. The first FRPFM test (Test A) was performed in well MW-26 with deployment duration of 4 days at a depth of 13.30 meters below ground surface (bgs) (43.64 ft-bgs). This phase of field tests incorporated two components of the FRPFM technology suite: 1) internal alcohol tracers on a new sorbent media (activated carbon felt) that was selected specifically for fractured rock applications based upon extensive laboratory testing; and 2) improved visual tracer sock now composed of a nylon-spandex blend (again, specifically selected for fracture rock applications based upon extensive laboratory testing). The elution of internal tracers provide a direct measure of volumetric water flux (specific discharge) through the FRPFM, while the visual tracer provides indication of the presence, spatial distribution, and orientation of flowing fractures along with the direction of groundwater flow and an independent measure of water flux. When the initial FRPFM prototype was retrieved, imaged, and sampled there were faint visual indications of a three potential flowing vertical and diagonal fractures with centroids at 13.29, 13.35, and 13.41 meters bgs. ATV-OTV logs indicated horizontal features at 13.43 and 13.72 meters bgs, and HRTP had indicated flow at 13.3 meters bgs. Analysis of the FRPFM internal alcohol tracers indicated a flow per unit width of 60 square centimeters per day (cm2/day), while evaluation of the apparent aperture and length of the individual visual dye features indicated a flow per unit width of 76 cm2/day. There was no quantifiable contaminant flux at this depth. Flux data for all tests are summarized in Tables 5 and 6. Table 5 summarizes results for comparative technologies (HRTP/TVP and BHD) while Table 6 summarizes results for FRPFM technologies (visual tracers, alcohol tracers and sorbent).
23
Table 5. Matrix of flux results for comparative technologies (HRTP/TVP and BHD).
Test Well ID Deployment
Depth (m-bgs)
Deployment Depth
(ft-bgs)
Comparative Technology HRTP/TVP BHD
Flow Direction
Specific Discharge (cm/day)
Flow Per Unit Width
(cm2/day)
TCE Flux
(µg/m2/day)
DCE Flux
(µg/m2/day)
TCE Mass Discharge Per
Length of Fracture (µg/m/day)
DCE Mass Discharge Per
Length of Fracture (µg/m/day)
TCE Flux-Average
Concentration (µg/L)
DCE Flux-Average
Concentration (µg/L)
GT
S
A MW-26 13.30 43.64 SSE NA NA NA NA NA NA NA NA B MW-26 13.40 43.96 SSE NA NA NA NA NA NA NA NA C MW-26 6.48 21.25 SSE NA NA NA NA NA NA NA NA D MW-25 7.93 26.00 SSE NA NA NA NA NA NA NA NA F MW-367-8 10.32 33.86 SSE NA NA NA NA NA V NA NA G MW-367-8 10.32 33.86 SSE NA NA NA NA NA NA NA NA H MW-367-8 10.42 34.19 SSE NA NA 106.2 NA NA NA 11.805 NA I MW-367-9 27.73 90.99 SSE 0.44 47.5 9.5 9.944 10.3 10.8 2.16 2.26 L MW-367-9 27.73 90.99 SSE 0.91 93.7 19.656 20.566 21 22.2 2.16 2.26
NA
WC
J 68-BR 28.96 95.00 WNW 2.9 292 116,870 48,343 116,870 48,343 4030 1667 K 68-BR 29.46 96.64 WNW NA NA NA NA 171,720 86,832 795 402 N 68-BR 28.99 95.12 WNW 3.2 318 38,400 23,968 40,545 24,486 1200 749 O 68-BR 28.99 95.12 WNW 3.4 318 148,802 63,086 40,576 24,505 4442 1883 P 68-BR 28.53 93.62 WNW 3.8 NA 147,524 48,679 NA NA 4610 1521 Q 68-BR 29.45 96.62 WNW 2.3 NA 155,791 40,803 NA NA 8200 2148 R 68-BR 40.73 133.62 WSW 1.3 NA 69,634 43,773 NA NA 5483 3447
X – quantifiable results NA – not available
24
Table 6. Matrix of flux results for FRPFM technologies (visual tracer, alcohol tracer, and sorbent).
Test Well ID Deployment
Depth (m-bgs)
Deployment Depth
(ft-bgs)
FRPFM Visual Tracer Alcohol Tracer FRPFM Sorbent
Specific Discharge (cm/day)
Flow Per Unit Width (cm2/day)
Flow Direction
Specific Discharge (cm/day)
Flow Per Unit Width
(cm2/day)
TCE Flux
(µg/m2/day)
DCE Flux
(µg/m2/day)
TCE Mass Discharge Per
Length of Fracture
(µg/m/day)
DCE Mass Discharge Per
Length of Fracture
(µg/m/day)
TCE Flux-Average
Concentration (µg/L)
DCE Flux-Average
Concentration (µg/L)
GT
S
A MW-26 13.30 43.64 NA 76 NA NA 60 NA NA NA NA NA NA B MW-26 13.40 43.96 NA 49 W (286Ε) NA 56 NA NA NA NA NA NA C MW-26 6.48 21.25 NA NA NA 33 NA NA NA NA NA NA NA D MW-25 7.93 26.00 NA 8.3 SW (242Ε) NA 10.8 NA NA NA NA NA NA F MW-367-8 10.32 33.86 1.28 101 S (177Ε) NA NA NA NA NA V NA NA G MW-367-8 10.32 33.86 NA NA S (184Ε) 10.3 1432 1514 NA 1378 NA 16.5 NA H MW-367-8 10.42 34.19 NA NA NA 1.5 123 172 NA 137 NA 11.2 NA I MW-367-9 27.73 90.99 NA NA NA 0.4 41 16.1 18.0 16.6 18.5 4 4.5 L MW-367-9 27.73 90.99 NA NA NA 0.9 92 8.5 13.6 8.7 14.0 0.9 1.4
NA
WC
J 68-BR 28.96 95.00 2.1 206 WSW (245Ε) 2.5 252 105,116 57,116 105,116 57,116 4179 2287 K 68-BR 29.46 96.64 24 2400 WSW (248Ε) 21.6 2159 161,646 83,503 161,646 83,503 751 386 N 68-BR 28.99 95.12 NA NA NA 3.2 323 50,091 27,558 50,091 27,558 1466 807 O 68-BR 28.99 95.12 3.9 390 SSW (199Ε) 3.8 360 148,849 55,647 141,407 52,865 3771 1410 P 68-BR 28.53 93.62 NA NA NA 3.3 317 144,475 52,865 137,251 50,222 4247 1554 Q 68-BR 29.45 96.62 NA NA ESE (113Ε) 2.1 199 145,523 51,888 138,247 49,293 6639 2367 R 68-BR 40.73 133.62 NA NA WNW (288Ε) 1.0 98 23,279 33,072 22,115 31,418 2182 3100
X – quantifiable results NA – not available
25
Subsequent field tests in 2010 incrementally added new components to each FRPFM field prototype that was deployed. The next component that was incorporated was an accelerometer on the base of the FRPFM assembly in order to record the orientation of the device with regard to magnetic north during deployment. This allows for evaluation of the direction of flow within the FRPFM interrogation zone. Test B was the first phase of testing that incorporated the accelerometer and was performed in well MW-26 with deployment duration of 4 days at a depth of 13.40 m-bgs (43.96 ft-bgs). When the FRPFM was retrieved, imaged, and sampled there were visual indications of two vertical flowing features. The upper feature was 21 cm long with a centroid at 13.23 m-bgs (43.41 ft-bgs) and an apparent aperture of 0.33 cm, while the lower feature was 10 cm long with a centroid at 13.92 m-bgs (45.67 ft-bgs) and an apparent aperture of 0.93 cm. The location of the upper feature corresponded with a potential vertical fracture noted in the acoustic televiewer data log possibly connecting two apparent horizontal fractures. FRPFM alcohol tracers indicated an average flow per unit width of 56 cm2/day while evaluation of visual dye features indicated an average flow per unit width of 49 cm2/day (Table 6). There was no quantifiable contaminant flux at this depth. Both of the visual features were on the same face of the FRPFM and were essentially collinear at approximately 106Ε from north (with a reported accuracy of 0.5 to 2.0 degrees root mean squared error for the accelerometer). As discussed in section 5.3.4, the visual features on the FRPFM sock indicate where flow has entered the device. As such, the inferred flow direction is offset by 180Ε, and the estimated groundwater flow direction within the FRPFM interrogation zone during Test B was 286Ε (west). Test C was the first test performed that incorporated a stainless steel shield that was designed to encapsulate the FRPFM during deployment and retrieval within the borehole. The shield serves two purposes: 1) it physically protects the integrity of the visual tracer sock and underlying activated carbon felt by preventing contact with the fracture rock face of the borehole; and 2) it precludes internal tracer loss due to vertical flow of water through the device during deployment and retrieval. Test C was performed in the highly weathered upper portion of MW26 with deployment duration of 5 days at a depth of 6.48 m-bgs (21.25 ft-bgs). The rock in this zone is unconsolidated with large voids and sharp edges. During 2009, preliminary FRPFM tests in this zone experienced both packer and visual sock failure due to contact with the sharp rock face. Once the shield was incorporated for Test C, FRPFM deployment, retrieval, and sampling all went well with no complications. Imagery of the visual indication sock showed significant washout on one face of the FRPFM with little to no dye remaining in the active flow zone. But, above and below the flow zone there was still tracer visible on the sock and more importantly, on the back (down gradient) side of the FRPFM there was still visual tracer present on the sock. All of these conditions correspond with expected results previously validated using the large scale aquifer box with high contrast flow zones at the University of Florida Coastal Laboratory (as discussed in section 5.3.4). Based upon analysis of internal alcohol tracers, the specific discharge within the washout zone was 33 cm/day (Table 6). There was no quantifiable contaminant flux at this depth. Test B and C were performed in parallel with two separate FRPFM prototypes. The prototype used for test C did not incorporate an accelerometer and as such the flow direction was not estimated. Test D was performed in well MW25 with a deployment duration of 5 days at a depth of 7.93 m-bgs (26 ft-bgs). When retrieved there were visual indications of three vertical flowing features
26
with centroids located at 7.63 m-bgs (25.05 ft-bgs), 7.88 m-bgs (25.85 ft-bgs), and 8.04 m-bgs (22.39 ft-bgs). The upper feature was 20 cm long with an apparent aperture of 0.17 cm, the middle feature was 4.5 cm long with an apparent aperture of 0.05 cm, and the bottom feature was 10 cm long with an apparent aperture of 0.35 cm. FRPFM alcohol tracers indicated an average flow per unit width of 10.8 cm2/day while evaluation of visual dye features indicated an average flow per unit width of 8.3 cm2/day (Table 6). There was no quantifiable contaminant flux at this depth. The three centroids of the visual features were located at 35.6Ε, 66.3Ε and 84.4Ε from north with inferred flow directions of 215.6°, 246.3°, and 264.4°, respectively. As such, the estimated general direction of groundwater flow within the FRPFM interrogation zone during Test D was 242° (southwest). Test E was run to completion, and the FRPFM was successfully retrieved. However, it was determined that the packer assembly had developed a leak during the deployment and the interrogation zone had not been vertically sealed for the duration of the test compromising the FRPFM results. As such, no data is reported but the test E designation is still recorded for continuity of discussion. During 2011, three FRPFM field deployments were completed. The intent for this phase of testing was to evaluate the FRPFM capabilities for quantifying contaminant flux. A new well was selected for this phase of testing (MW-367-8) as it was anticipated to be along the periphery of the longitudinal axis of the contaminant plume. Test F was performed in well MW-367-8 with a deployment duration of 10 days at a depth of 10.32 m-bgs (33.86 ft-bgs). When retrieved, there were visual indications of 56 discrete horizontal flowing features distributed along the device (Figure 7). Evaluation of the visual features indicated a flow per unit width of 101 cm2/day corresponding to a specific discharge of 1.28 cm/day over the interrogation zone (Table 6). Unfortunately, all samples of the FRPFM sorbent were destroyed during shipping from Canada to the United States and no analytical analysis of flux was possible. Evaluation of the location of centroids for each of the discrete horizontal features was used to estimate an average groundwater flow direction of 177Ε (south) (Table 6). Test G was performed in well MW-367-8 at the same depth as test F (10.32 m-bgs) with a deployment duration of 7 days. When retrieved, imagery indicated significant vertical washout of visual tracers at both the top and bottom of the interrogation zone. It was confirmed that the packers had maintained pressured for the duration of the test and the interrogation zone had been sealed. However, there was significant rainfall prior to and during the test. The visual dye washout zones were all predominantly on the same face of the FRPFM corresponding to an inferred groundwater flow direction of 184Ε (south). FRPFM alcohol tracers indicated a flow per unit width of 834 cm2/day with a specific discharge of 10.3 cm/day over the interrogation zone (Table 6 and Figure 7). Analysis of the FRPFM sorbent indicated a TCE mass flux of 1,514 µg/m2/day with flux averaged TCE concentration of 16.5 µg/L (Table 6 and Figure 7).
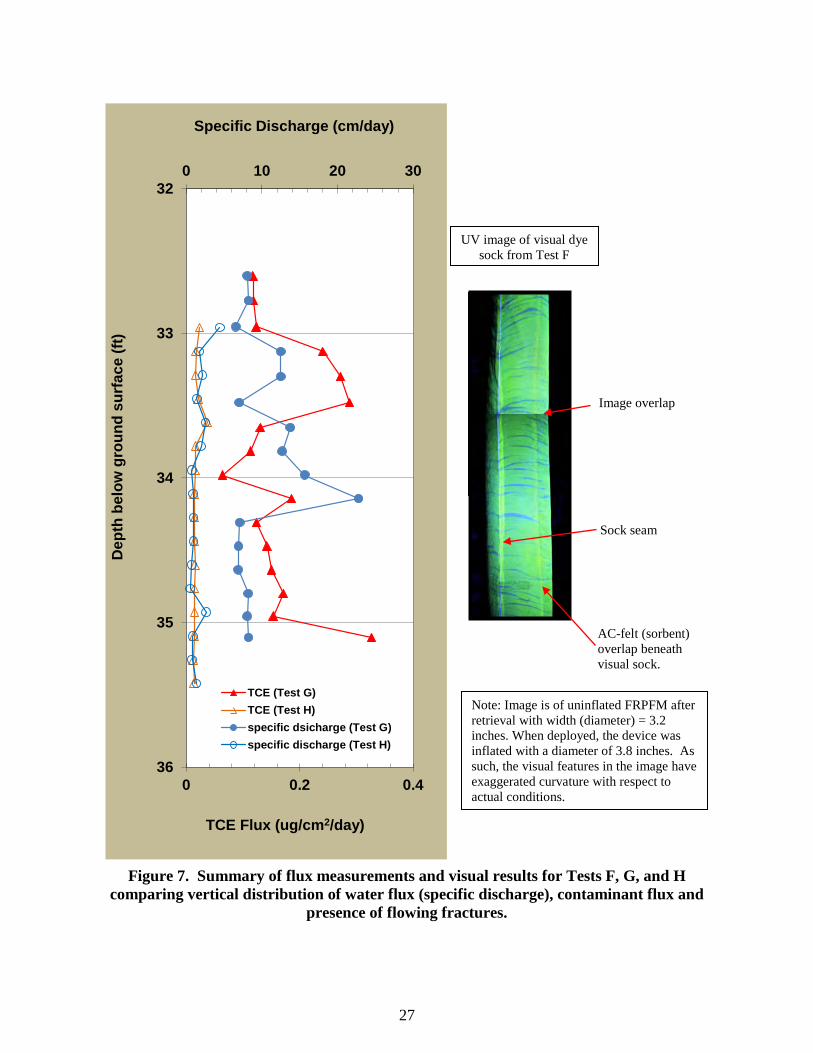
27
Figure 7. Summary of flux measurements and visual results for Tests F, G, and H comparing vertical distribution of water flux (specific discharge), contaminant flux and
presence of flowing fractures.
0 10 20 3032
33
34
35
360 0.2 0.4
Specific Discharge (cm/day)D
epth
bel
ow g
roun
d su
rfac
e (ft
)
TCE Flux (ug/cm2/day)
TCE (Test G)TCE (Test H)specific dsicharge (Test G)specific discharge (Test H)
UV image of visual dye sock from Test F
Sock seam
AC-felt (sorbent) overlap beneath visual sock.
Image overlap
Note: Image is of uninflated FRPFM after retrieval with width (diameter) = 3.2 inches. When deployed, the device was inflated with a diameter of 3.8 inches. As such, the visual features in the image have exaggerated curvature with respect to actual conditions.
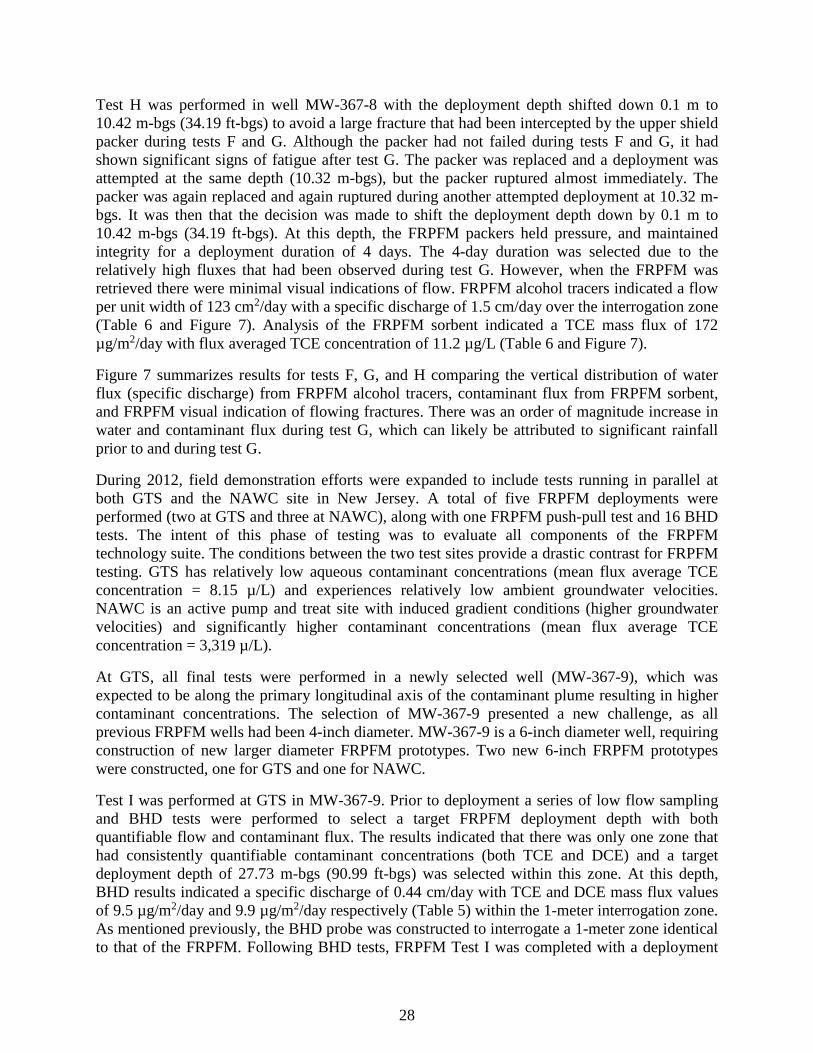
28
Test H was performed in well MW-367-8 with the deployment depth shifted down 0.1 m to 10.42 m-bgs (34.19 ft-bgs) to avoid a large fracture that had been intercepted by the upper shield packer during tests F and G. Although the packer had not failed during tests F and G, it had shown significant signs of fatigue after test G. The packer was replaced and a deployment was attempted at the same depth (10.32 m-bgs), but the packer ruptured almost immediately. The packer was again replaced and again ruptured during another attempted deployment at 10.32 m-bgs. It was then that the decision was made to shift the deployment depth down by 0.1 m to 10.42 m-bgs (34.19 ft-bgs). At this depth, the FRPFM packers held pressure, and maintained integrity for a deployment duration of 4 days. The 4-day duration was selected due to the relatively high fluxes that had been observed during test G. However, when the FRPFM was retrieved there were minimal visual indications of flow. FRPFM alcohol tracers indicated a flow per unit width of 123 cm2/day with a specific discharge of 1.5 cm/day over the interrogation zone (Table 6 and Figure 7). Analysis of the FRPFM sorbent indicated a TCE mass flux of 172 µg/m2/day with flux averaged TCE concentration of 11.2 µg/L (Table 6 and Figure 7).
Figure 7 summarizes results for tests F, G, and H comparing the vertical distribution of water flux (specific discharge) from FRPFM alcohol tracers, contaminant flux from FRPFM sorbent, and FRPFM visual indication of flowing fractures. There was an order of magnitude increase in water and contaminant flux during test G, which can likely be attributed to significant rainfall prior to and during test G.
During 2012, field demonstration efforts were expanded to include tests running in parallel at both GTS and the NAWC site in New Jersey. A total of five FRPFM deployments were performed (two at GTS and three at NAWC), along with one FRPFM push-pull test and 16 BHD tests. The intent of this phase of testing was to evaluate all components of the FRPFM technology suite. The conditions between the two test sites provide a drastic contrast for FRPFM testing. GTS has relatively low aqueous contaminant concentrations (mean flux average TCE concentration = 8.15 µ/L) and experiences relatively low ambient groundwater velocities. NAWC is an active pump and treat site with induced gradient conditions (higher groundwater velocities) and significantly higher contaminant concentrations (mean flux average TCE concentration = 3,319 µ/L).
At GTS, all final tests were performed in a newly selected well (MW-367-9), which was expected to be along the primary longitudinal axis of the contaminant plume resulting in higher contaminant concentrations. The selection of MW-367-9 presented a new challenge, as all previous FRPFM wells had been 4-inch diameter. MW-367-9 is a 6-inch diameter well, requiring construction of new larger diameter FRPFM prototypes. Two new 6-inch FRPFM prototypes were constructed, one for GTS and one for NAWC.
Test I was performed at GTS in MW-367-9. Prior to deployment a series of low flow sampling and BHD tests were performed to select a target FRPFM deployment depth with both quantifiable flow and contaminant flux. The results indicated that there was only one zone that had consistently quantifiable contaminant concentrations (both TCE and DCE) and a target deployment depth of 27.73 m-bgs (90.99 ft-bgs) was selected within this zone. At this depth, BHD results indicated a specific discharge of 0.44 cm/day with TCE and DCE mass flux values of 9.5 µg/m2/day and 9.9 µg/m2/day respectively (Table 5) within the 1-meter interrogation zone. As mentioned previously, the BHD probe was constructed to interrogate a 1-meter zone identical to that of the FRPFM. Following BHD tests, FRPFM Test I was completed with a deployment
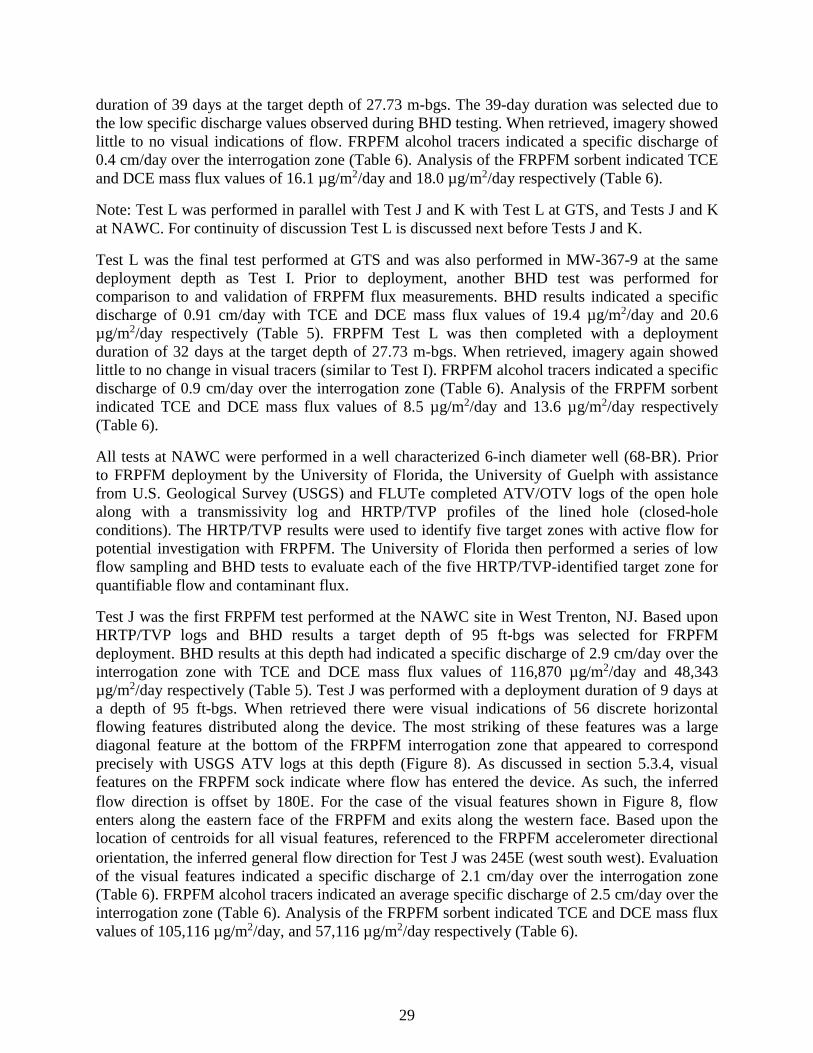
29
duration of 39 days at the target depth of 27.73 m-bgs. The 39-day duration was selected due to the low specific discharge values observed during BHD testing. When retrieved, imagery showed little to no visual indications of flow. FRPFM alcohol tracers indicated a specific discharge of 0.4 cm/day over the interrogation zone (Table 6). Analysis of the FRPFM sorbent indicated TCE and DCE mass flux values of 16.1 µg/m2/day and 18.0 µg/m2/day respectively (Table 6).
Note: Test L was performed in parallel with Test J and K with Test L at GTS, and Tests J and K at NAWC. For continuity of discussion Test L is discussed next before Tests J and K.
Test L was the final test performed at GTS and was also performed in MW-367-9 at the same deployment depth as Test I. Prior to deployment, another BHD test was performed for comparison to and validation of FRPFM flux measurements. BHD results indicated a specific discharge of 0.91 cm/day with TCE and DCE mass flux values of 19.4 µg/m2/day and 20.6 µg/m2/day respectively (Table 5). FRPFM Test L was then completed with a deployment duration of 32 days at the target depth of 27.73 m-bgs. When retrieved, imagery again showed little to no change in visual tracers (similar to Test I). FRPFM alcohol tracers indicated a specific discharge of 0.9 cm/day over the interrogation zone (Table 6). Analysis of the FRPFM sorbent indicated TCE and DCE mass flux values of 8.5 µg/m2/day and 13.6 µg/m2/day respectively (Table 6).
All tests at NAWC were performed in a well characterized 6-inch diameter well (68-BR). Prior to FRPFM deployment by the University of Florida, the University of Guelph with assistance from U.S. Geological Survey (USGS) and FLUTe completed ATV/OTV logs of the open hole along with a transmissivity log and HRTP/TVP profiles of the lined hole (closed-hole conditions). The HRTP/TVP results were used to identify five target zones with active flow for potential investigation with FRPFM. The University of Florida then performed a series of low flow sampling and BHD tests to evaluate each of the five HRTP/TVP-identified target zone for quantifiable flow and contaminant flux.
Test J was the first FRPFM test performed at the NAWC site in West Trenton, NJ. Based upon HRTP/TVP logs and BHD results a target depth of 95 ft-bgs was selected for FRPFM deployment. BHD results at this depth had indicated a specific discharge of 2.9 cm/day over the interrogation zone with TCE and DCE mass flux values of 116,870 µg/m2/day and 48,343 µg/m2/day respectively (Table 5). Test J was performed with a deployment duration of 9 days at a depth of 95 ft-bgs. When retrieved there were visual indications of 56 discrete horizontal flowing features distributed along the device. The most striking of these features was a large diagonal feature at the bottom of the FRPFM interrogation zone that appeared to correspond precisely with USGS ATV logs at this depth (Figure 8). As discussed in section 5.3.4, visual features on the FRPFM sock indicate where flow has entered the device. As such, the inferred flow direction is offset by 180Ε. For the case of the visual features shown in Figure 8, flow enters along the eastern face of the FRPFM and exits along the western face. Based upon the location of centroids for all visual features, referenced to the FRPFM accelerometer directional orientation, the inferred general flow direction for Test J was 245Ε (west south west). Evaluation of the visual features indicated a specific discharge of 2.1 cm/day over the interrogation zone (Table 6). FRPFM alcohol tracers indicated an average specific discharge of 2.5 cm/day over the interrogation zone (Table 6). Analysis of the FRPFM sorbent indicated TCE and DCE mass flux values of 105,116 µg/m2/day, and 57,116 µg/m2/day respectively (Table 6).
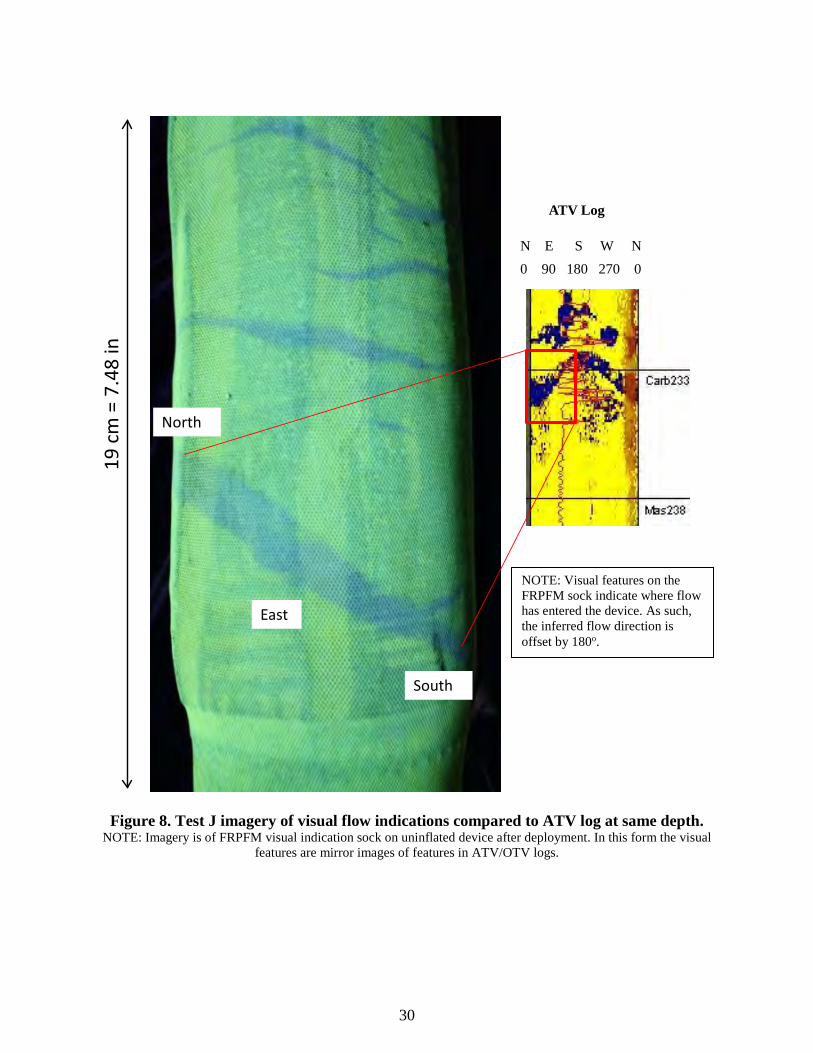
30
Figure 8. Test J imagery of visual flow indications compared to ATV log at same depth. NOTE: Imagery is of FRPFM visual indication sock on uninflated device after deployment. In this form the visual
features are mirror images of features in ATV/OTV logs.
19 c
m =
7.4
8 in
0 90 180 270 0
South
North
East
N E S W N
ATV Log
NOTE: Visual features on the FRPFM sock indicate where flow has entered the device. As such, the inferred flow direction is offset by 180o.
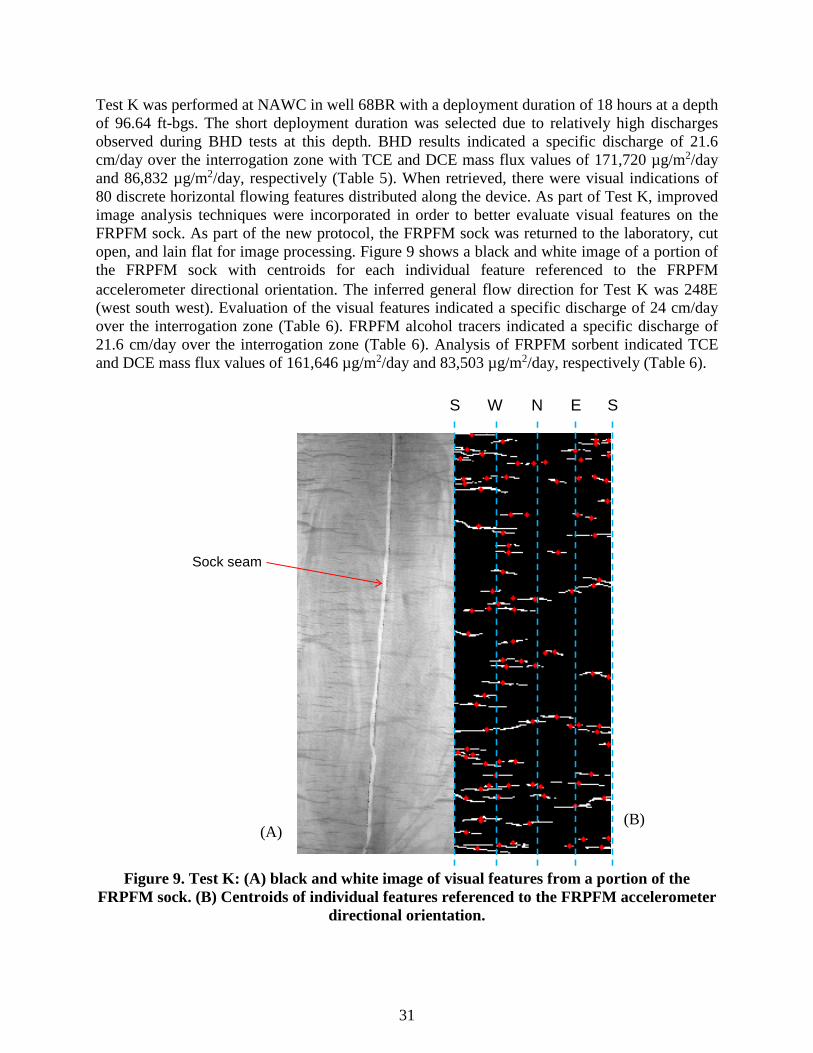
31
Test K was performed at NAWC in well 68BR with a deployment duration of 18 hours at a depth of 96.64 ft-bgs. The short deployment duration was selected due to relatively high discharges observed during BHD tests at this depth. BHD results indicated a specific discharge of 21.6 cm/day over the interrogation zone with TCE and DCE mass flux values of 171,720 µg/m2/day and 86,832 µg/m2/day, respectively (Table 5). When retrieved, there were visual indications of 80 discrete horizontal flowing features distributed along the device. As part of Test K, improved image analysis techniques were incorporated in order to better evaluate visual features on the FRPFM sock. As part of the new protocol, the FRPFM sock was returned to the laboratory, cut open, and lain flat for image processing. Figure 9 shows a black and white image of a portion of the FRPFM sock with centroids for each individual feature referenced to the FRPFM accelerometer directional orientation. The inferred general flow direction for Test K was 248Ε (west south west). Evaluation of the visual features indicated a specific discharge of 24 cm/day over the interrogation zone (Table 6). FRPFM alcohol tracers indicated a specific discharge of 21.6 cm/day over the interrogation zone (Table 6). Analysis of FRPFM sorbent indicated TCE and DCE mass flux values of 161,646 µg/m2/day and 83,503 µg/m2/day, respectively (Table 6).
Figure 9. Test K: (A) black and white image of visual features from a portion of the
FRPFM sock. (B) Centroids of individual features referenced to the FRPFM accelerometer directional orientation.
NW E SS
Sock seam
(A) (B)
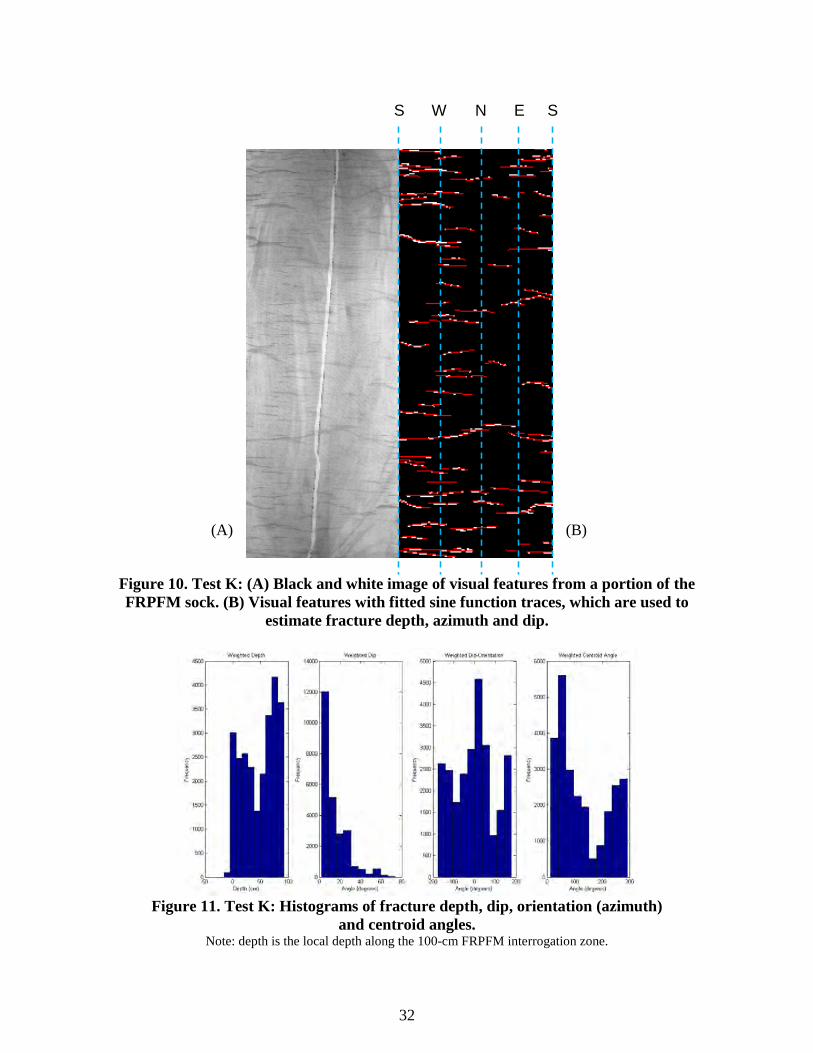
32
Figure 10. Test K: (A) Black and white image of visual features from a portion of the FRPFM sock. (B) Visual features with fitted sine function traces, which are used to
estimate fracture depth, azimuth and dip.
Figure 11. Test K: Histograms of fracture depth, dip, orientation (azimuth)
and centroid angles. Note: depth is the local depth along the 100-cm FRPFM interrogation zone.
NW E SS
(A) (B)
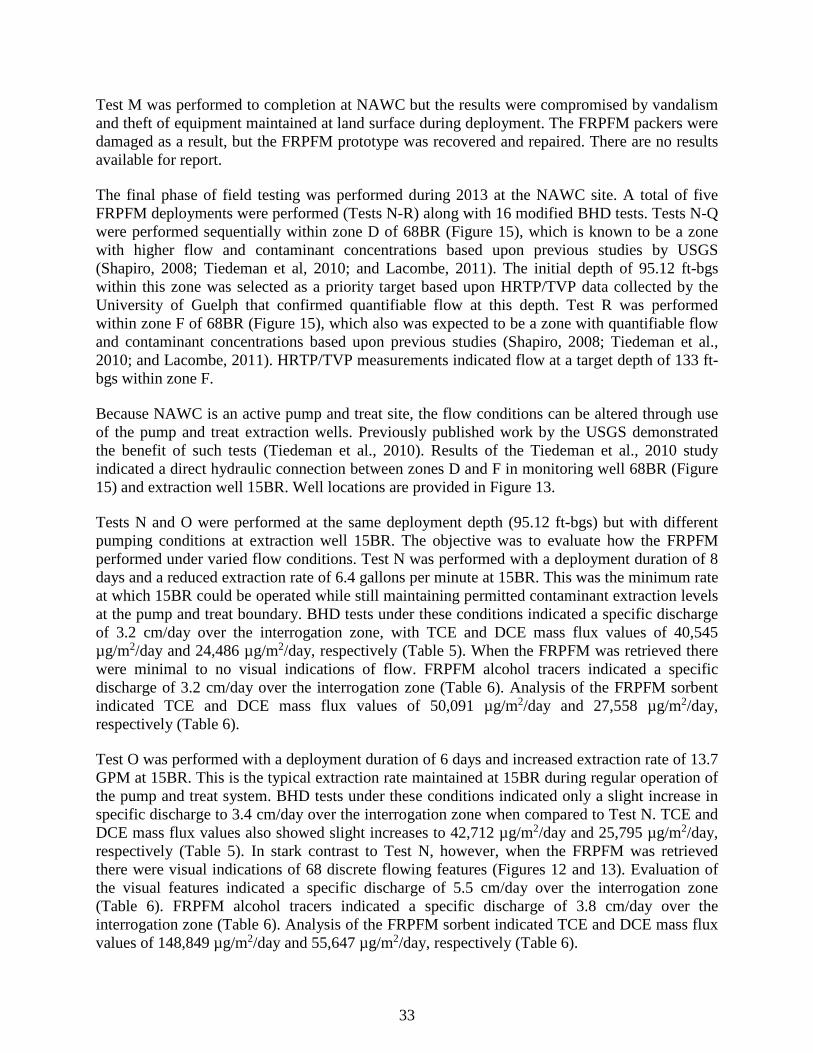
33
Test M was performed to completion at NAWC but the results were compromised by vandalism and theft of equipment maintained at land surface during deployment. The FRPFM packers were damaged as a result, but the FRPFM prototype was recovered and repaired. There are no results available for report. The final phase of field testing was performed during 2013 at the NAWC site. A total of five FRPFM deployments were performed (Tests N-R) along with 16 modified BHD tests. Tests N-Q were performed sequentially within zone D of 68BR (Figure 15), which is known to be a zone with higher flow and contaminant concentrations based upon previous studies by USGS (Shapiro, 2008; Tiedeman et al, 2010; and Lacombe, 2011). The initial depth of 95.12 ft-bgs within this zone was selected as a priority target based upon HRTP/TVP data collected by the University of Guelph that confirmed quantifiable flow at this depth. Test R was performed within zone F of 68BR (Figure 15), which also was expected to be a zone with quantifiable flow and contaminant concentrations based upon previous studies (Shapiro, 2008; Tiedeman et al., 2010; and Lacombe, 2011). HRTP/TVP measurements indicated flow at a target depth of 133 ft-bgs within zone F. Because NAWC is an active pump and treat site, the flow conditions can be altered through use of the pump and treat extraction wells. Previously published work by the USGS demonstrated the benefit of such tests (Tiedeman et al., 2010). Results of the Tiedeman et al., 2010 study indicated a direct hydraulic connection between zones D and F in monitoring well 68BR (Figure 15) and extraction well 15BR. Well locations are provided in Figure 13. Tests N and O were performed at the same deployment depth (95.12 ft-bgs) but with different pumping conditions at extraction well 15BR. The objective was to evaluate how the FRPFM performed under varied flow conditions. Test N was performed with a deployment duration of 8 days and a reduced extraction rate of 6.4 gallons per minute at 15BR. This was the minimum rate at which 15BR could be operated while still maintaining permitted contaminant extraction levels at the pump and treat boundary. BHD tests under these conditions indicated a specific discharge of 3.2 cm/day over the interrogation zone, with TCE and DCE mass flux values of 40,545 µg/m2/day and 24,486 µg/m2/day, respectively (Table 5). When the FRPFM was retrieved there were minimal to no visual indications of flow. FRPFM alcohol tracers indicated a specific discharge of 3.2 cm/day over the interrogation zone (Table 6). Analysis of the FRPFM sorbent indicated TCE and DCE mass flux values of 50,091 µg/m2/day and 27,558 µg/m2/day, respectively (Table 6). Test O was performed with a deployment duration of 6 days and increased extraction rate of 13.7 GPM at 15BR. This is the typical extraction rate maintained at 15BR during regular operation of the pump and treat system. BHD tests under these conditions indicated only a slight increase in specific discharge to 3.4 cm/day over the interrogation zone when compared to Test N. TCE and DCE mass flux values also showed slight increases to 42,712 µg/m2/day and 25,795 µg/m2/day, respectively (Table 5). In stark contrast to Test N, however, when the FRPFM was retrieved there were visual indications of 68 discrete flowing features (Figures 12 and 13). Evaluation of the visual features indicated a specific discharge of 5.5 cm/day over the interrogation zone (Table 6). FRPFM alcohol tracers indicated a specific discharge of 3.8 cm/day over the interrogation zone (Table 6). Analysis of the FRPFM sorbent indicated TCE and DCE mass flux values of 148,849 µg/m2/day and 55,647 µg/m2/day, respectively (Table 6).
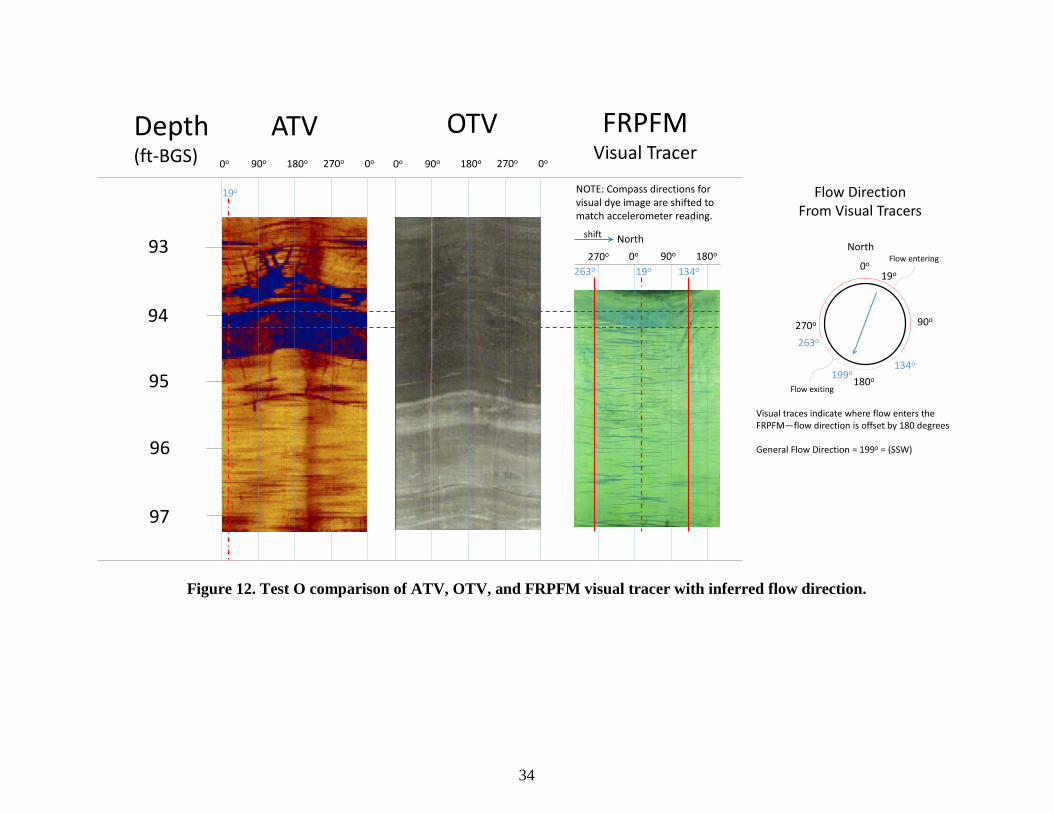
34
Figure 12. Test O comparison of ATV, OTV, and FRPFM visual tracer with inferred flow direction.
ATV OTV
95
0o 90o 180o 270o 0o 0o 90o 180o 270o 0o
96
97
93
94
Depth(ft-BGS)
North0o 90o 180o270o
134o19o 0o
180o
270o 90o
19o
263o
134o
Visual traces indicate where flow enters the FRPFM—flow direction is offset by 180 degrees
General Flow Direction = 199o = (SSW)
199o
Flow exiting
Flow enteringNorth
Flow DirectionFrom Visual Tracers
263o
19o NOTE: Compass directions for visual dye image are shifted to match accelerometer reading.
shift
FRPFMVisual Tracer
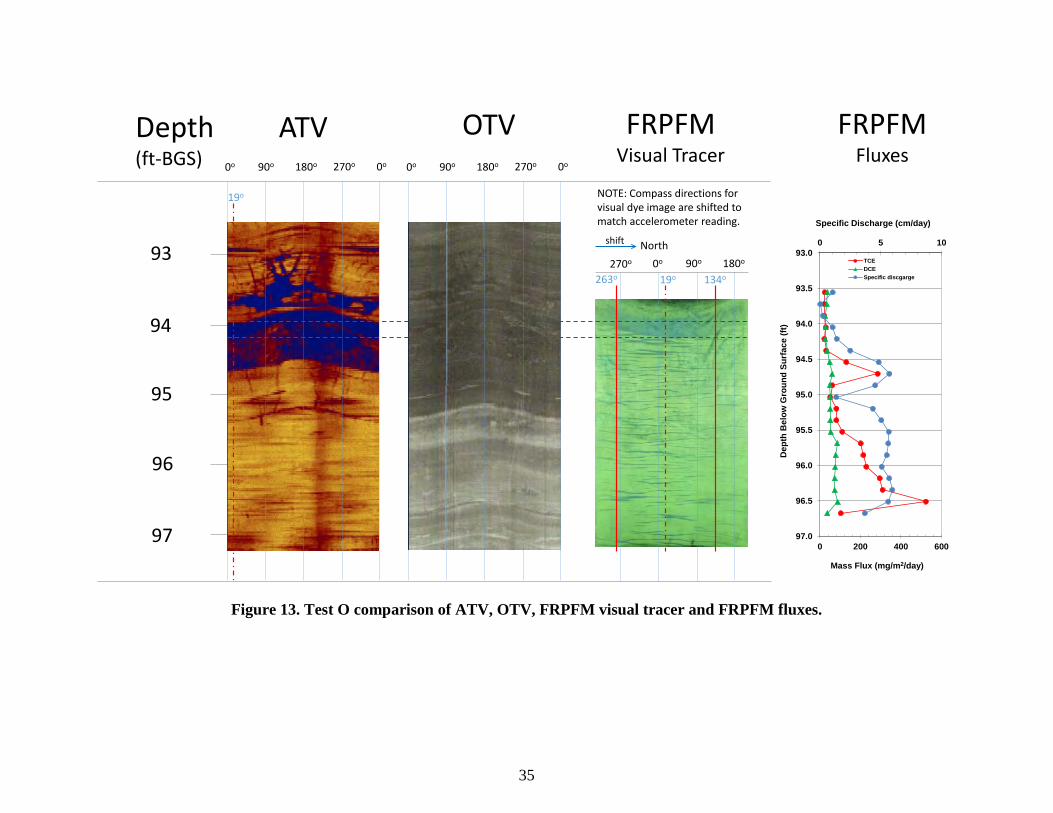
35
Figure 13. Test O comparison of ATV, OTV, FRPFM visual tracer and FRPFM fluxes.
ATV OTV
95
0o 90o 180o 270o 0o 0o 90o 180o 270o 0o
96
97
93
94
Depth(ft-BGS)
North0o 90o 180o270o
134o19o
FRPFMVisual Tracer
263o
19o NOTE: Compass directions for visual dye image are shifted to match accelerometer reading.
shift 0 5 1093.0
93.5
94.0
94.5
95.0
95.5
96.0
96.5
97.00 200 400 600
Specific Discharge (cm/day)
Dep
th B
elow
Gro
und
Surf
ace
(ft)
Mass Flux (mg/m2/day)
TCEDCESpecific discgarge
FRPFMFluxes
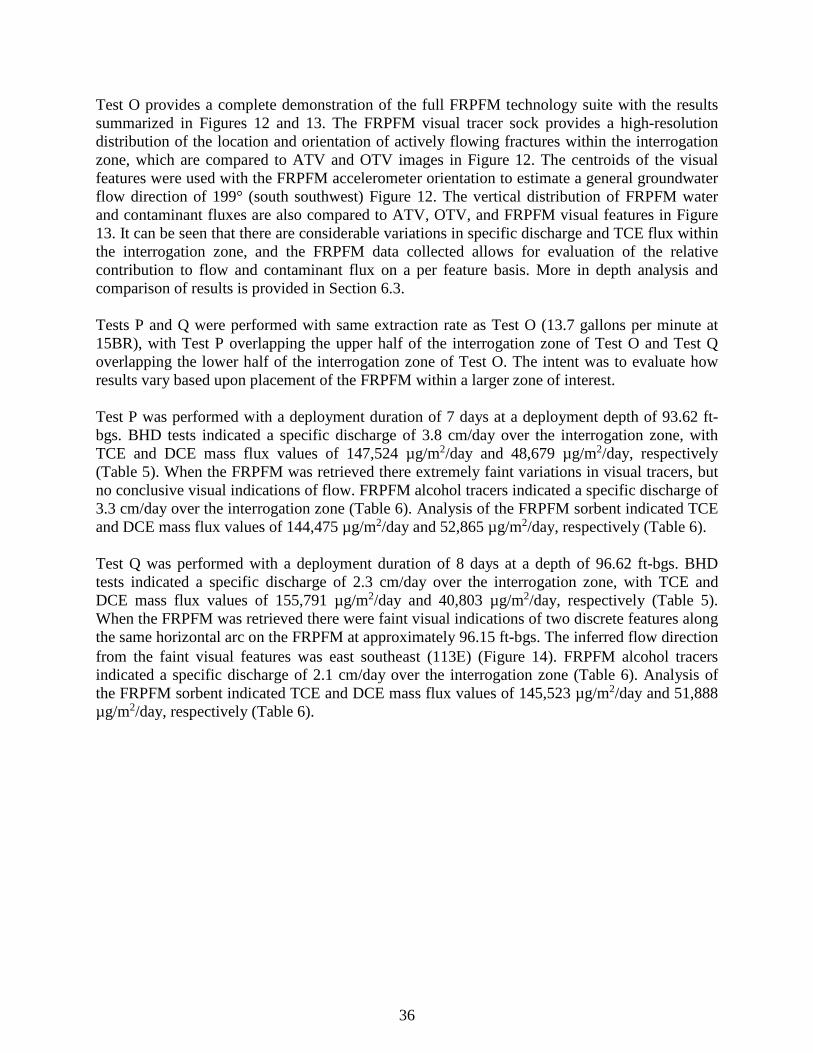
36
Test O provides a complete demonstration of the full FRPFM technology suite with the results summarized in Figures 12 and 13. The FRPFM visual tracer sock provides a high-resolution distribution of the location and orientation of actively flowing fractures within the interrogation zone, which are compared to ATV and OTV images in Figure 12. The centroids of the visual features were used with the FRPFM accelerometer orientation to estimate a general groundwater flow direction of 199° (south southwest) Figure 12. The vertical distribution of FRPFM water and contaminant fluxes are also compared to ATV, OTV, and FRPFM visual features in Figure 13. It can be seen that there are considerable variations in specific discharge and TCE flux within the interrogation zone, and the FRPFM data collected allows for evaluation of the relative contribution to flow and contaminant flux on a per feature basis. More in depth analysis and comparison of results is provided in Section 6.3. Tests P and Q were performed with same extraction rate as Test O (13.7 gallons per minute at 15BR), with Test P overlapping the upper half of the interrogation zone of Test O and Test Q overlapping the lower half of the interrogation zone of Test O. The intent was to evaluate how results vary based upon placement of the FRPFM within a larger zone of interest. Test P was performed with a deployment duration of 7 days at a deployment depth of 93.62 ft-bgs. BHD tests indicated a specific discharge of 3.8 cm/day over the interrogation zone, with TCE and DCE mass flux values of 147,524 µg/m2/day and 48,679 µg/m2/day, respectively (Table 5). When the FRPFM was retrieved there extremely faint variations in visual tracers, but no conclusive visual indications of flow. FRPFM alcohol tracers indicated a specific discharge of 3.3 cm/day over the interrogation zone (Table 6). Analysis of the FRPFM sorbent indicated TCE and DCE mass flux values of 144,475 µg/m2/day and 52,865 µg/m2/day, respectively (Table 6). Test Q was performed with a deployment duration of 8 days at a depth of 96.62 ft-bgs. BHD tests indicated a specific discharge of 2.3 cm/day over the interrogation zone, with TCE and DCE mass flux values of 155,791 µg/m2/day and 40,803 µg/m2/day, respectively (Table 5). When the FRPFM was retrieved there were faint visual indications of two discrete features along the same horizontal arc on the FRPFM at approximately 96.15 ft-bgs. The inferred flow direction from the faint visual features was east southeast (113Ε) (Figure 14). FRPFM alcohol tracers indicated a specific discharge of 2.1 cm/day over the interrogation zone (Table 6). Analysis of the FRPFM sorbent indicated TCE and DCE mass flux values of 145,523 µg/m2/day and 51,888 µg/m2/day, respectively (Table 6).
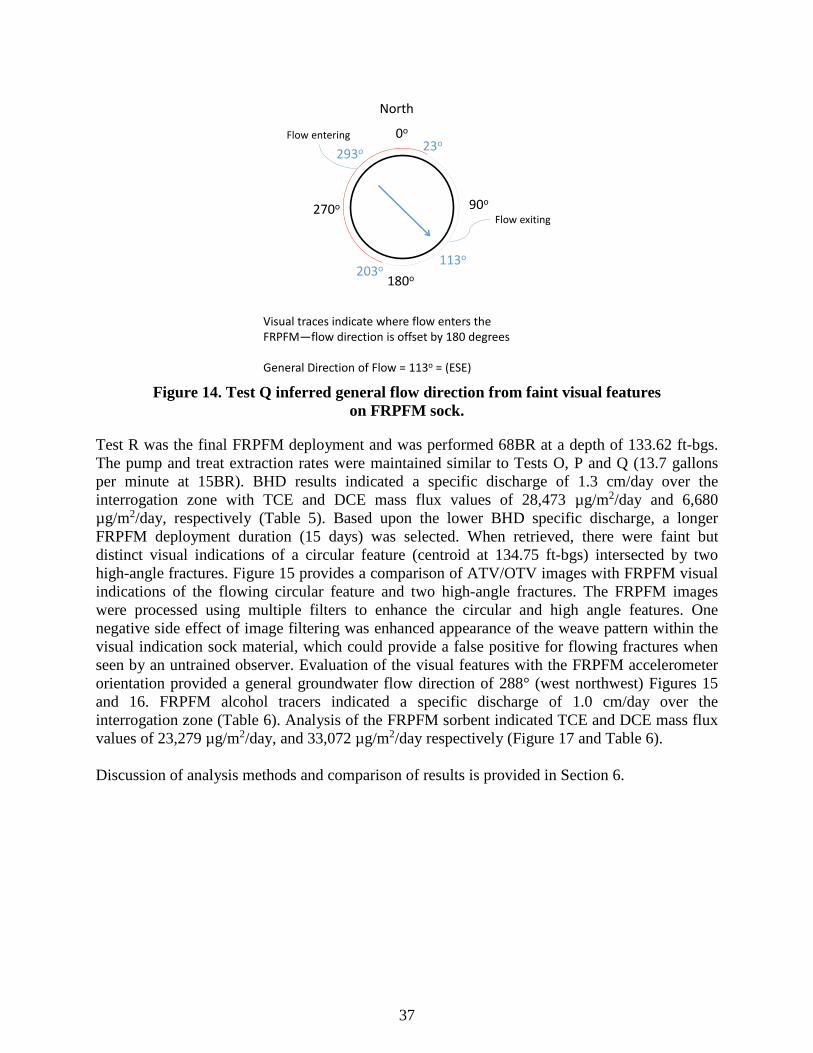
37
Figure 14. Test Q inferred general flow direction from faint visual features
on FRPFM sock.
Test R was the final FRPFM deployment and was performed 68BR at a depth of 133.62 ft-bgs. The pump and treat extraction rates were maintained similar to Tests O, P and Q (13.7 gallons per minute at 15BR). BHD results indicated a specific discharge of 1.3 cm/day over the interrogation zone with TCE and DCE mass flux values of 28,473 µg/m2/day and 6,680 µg/m2/day, respectively (Table 5). Based upon the lower BHD specific discharge, a longer FRPFM deployment duration (15 days) was selected. When retrieved, there were faint but distinct visual indications of a circular feature (centroid at 134.75 ft-bgs) intersected by two high-angle fractures. Figure 15 provides a comparison of ATV/OTV images with FRPFM visual indications of the flowing circular feature and two high-angle fractures. The FRPFM images were processed using multiple filters to enhance the circular and high angle features. One negative side effect of image filtering was enhanced appearance of the weave pattern within the visual indication sock material, which could provide a false positive for flowing fractures when seen by an untrained observer. Evaluation of the visual features with the FRPFM accelerometer orientation provided a general groundwater flow direction of 288° (west northwest) Figures 15 and 16. FRPFM alcohol tracers indicated a specific discharge of 1.0 cm/day over the interrogation zone (Table 6). Analysis of the FRPFM sorbent indicated TCE and DCE mass flux values of 23,279 µg/m2/day, and 33,072 µg/m2/day respectively (Figure 17 and Table 6). Discussion of analysis methods and comparison of results is provided in Section 6.
0o
180o
270o 90o
23o
203o113o
Visual traces indicate where flow enters the FRPFM—flow direction is offset by 180 degrees
General Direction of Flow = 113o = (ESE)
293o
Flow exiting
Flow entering
North
38
Figure 15. Test R Comparison of ATV/OTV with FRPFM visual indications of flowing circular feature intersecting two high-angle fractures.
The FRPFM images were processed using multiple filters to enhance the circular feature and high angle fractures. Note: one side effect of image filtering was the enhanced appearance of weave pattern within the visual indication sock material.
ATV OTV0o 90o 180o 270o 0o 0o 90o 180o 270o 0o
133
134
135
Depth(ft-BGS) 0o 90o 180o 270o
40o 256o
FRPFMVisual Tracer
Original Image
FRPFMVisual Tracer
First Image Filter
FRPFMVisual TracerColor Filter
0o 90o 180o 270o
40o 256oCircular feature
Weave pattern within visual indication sock—not actual fractures.
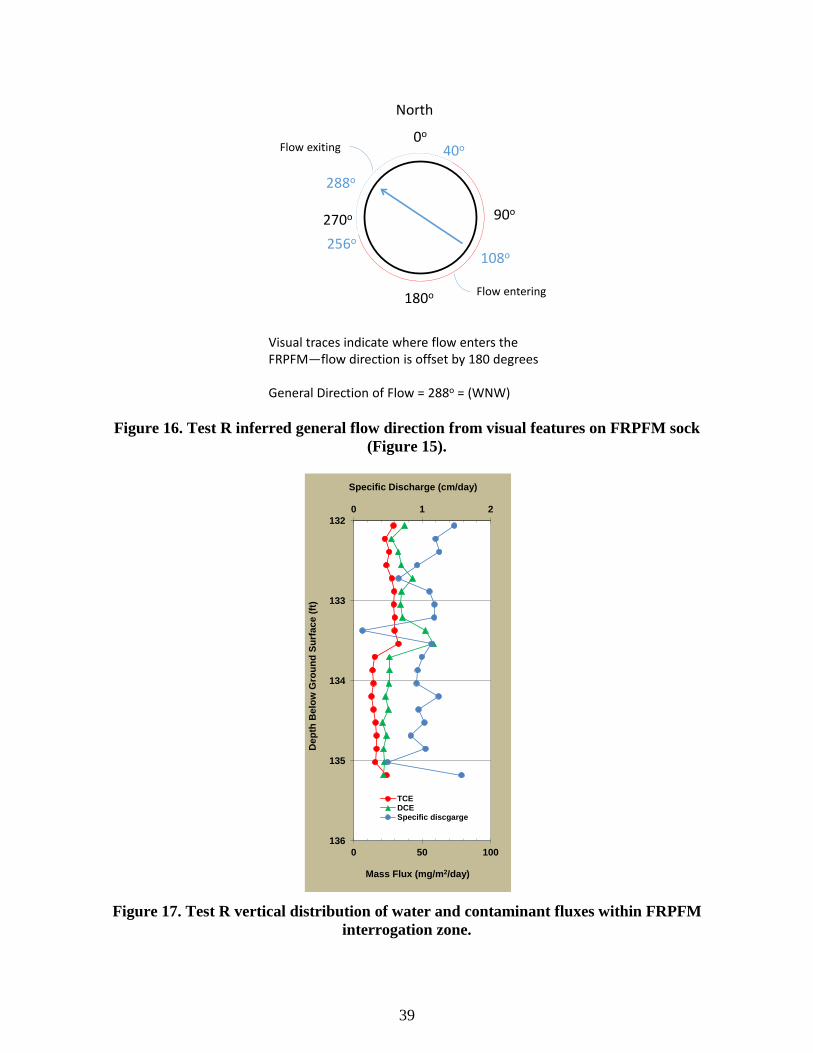
39
Figure 16. Test R inferred general flow direction from visual features on FRPFM sock (Figure 15).
Figure 17. Test R vertical distribution of water and contaminant fluxes within FRPFM interrogation zone.
0o
180o
270o 90o
40o
256o
108o
Visual traces indicate where flow enters the FRPFM—flow direction is offset by 180 degrees
General Direction of Flow = 288o = (WNW)
288o
Flow exiting
Flow entering
North
0 1 2132
133
134
135
1360 50 100
Specific Discharge (cm/day)
Dep
th B
elow
Gro
und
Surf
ace
(ft)
Mass Flux (mg/m2/day)
TCEDCESpecific discgarge

This page left blank intentionally.
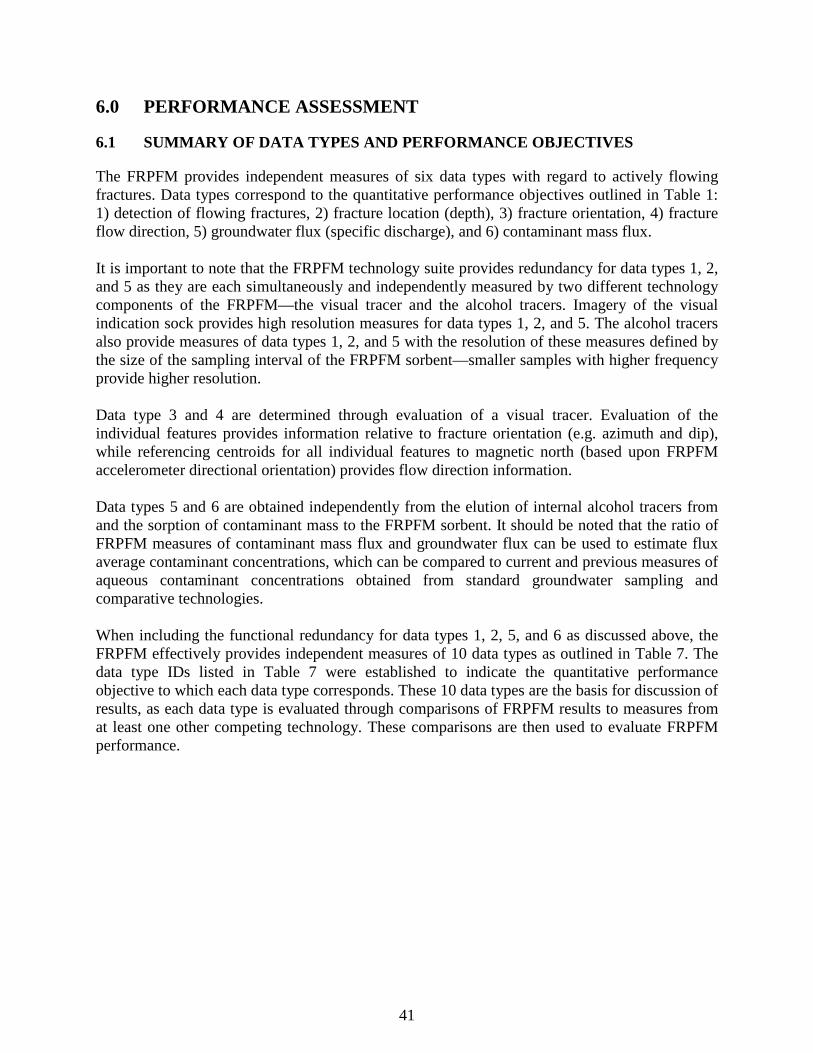
41
6.0 PERFORMANCE ASSESSMENT
6.1 SUMMARY OF DATA TYPES AND PERFORMANCE OBJECTIVES
The FRPFM provides independent measures of six data types with regard to actively flowing fractures. Data types correspond to the quantitative performance objectives outlined in Table 1: 1) detection of flowing fractures, 2) fracture location (depth), 3) fracture orientation, 4) fracture flow direction, 5) groundwater flux (specific discharge), and 6) contaminant mass flux. It is important to note that the FRPFM technology suite provides redundancy for data types 1, 2, and 5 as they are each simultaneously and independently measured by two different technology components of the FRPFM—the visual tracer and the alcohol tracers. Imagery of the visual indication sock provides high resolution measures for data types 1, 2, and 5. The alcohol tracers also provide measures of data types 1, 2, and 5 with the resolution of these measures defined by the size of the sampling interval of the FRPFM sorbent—smaller samples with higher frequency provide higher resolution. Data type 3 and 4 are determined through evaluation of a visual tracer. Evaluation of the individual features provides information relative to fracture orientation (e.g. azimuth and dip), while referencing centroids for all individual features to magnetic north (based upon FRPFM accelerometer directional orientation) provides flow direction information. Data types 5 and 6 are obtained independently from the elution of internal alcohol tracers from and the sorption of contaminant mass to the FRPFM sorbent. It should be noted that the ratio of FRPFM measures of contaminant mass flux and groundwater flux can be used to estimate flux average contaminant concentrations, which can be compared to current and previous measures of aqueous contaminant concentrations obtained from standard groundwater sampling and comparative technologies. When including the functional redundancy for data types 1, 2, 5, and 6 as discussed above, the FRPFM effectively provides independent measures of 10 data types as outlined in Table 7. The data type IDs listed in Table 7 were established to indicate the quantitative performance objective to which each data type corresponds. These 10 data types are the basis for discussion of results, as each data type is evaluated through comparisons of FRPFM results to measures from at least one other competing technology. These comparisons are then used to evaluate FRPFM performance.
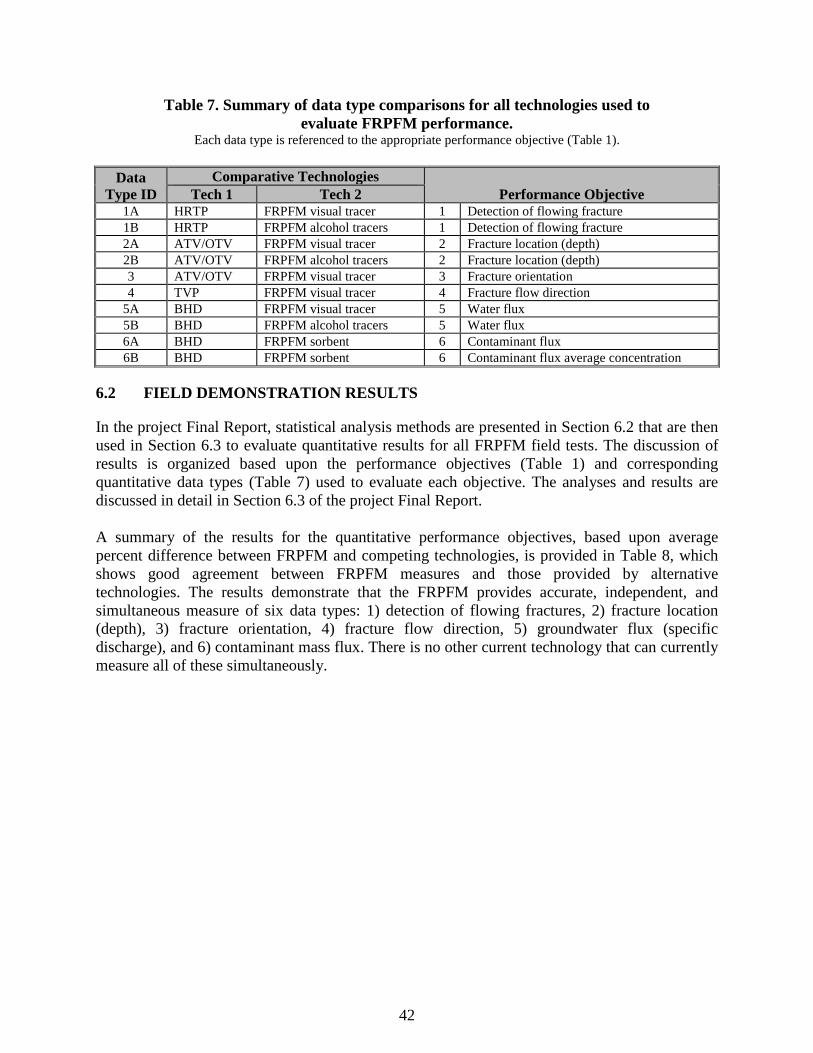
42
Table 7. Summary of data type comparisons for all technologies used to evaluate FRPFM performance.
Each data type is referenced to the appropriate performance objective (Table 1).
Data Type ID
Comparative Technologies Performance Objective Tech 1 Tech 2
1A HRTP FRPFM visual tracer 1 Detection of flowing fracture 1B HRTP FRPFM alcohol tracers 1 Detection of flowing fracture 2A ATV/OTV FRPFM visual tracer 2 Fracture location (depth) 2B ATV/OTV FRPFM alcohol tracers 2 Fracture location (depth) 3 ATV/OTV FRPFM visual tracer 3 Fracture orientation 4 TVP FRPFM visual tracer 4 Fracture flow direction
5A BHD FRPFM visual tracer 5 Water flux 5B BHD FRPFM alcohol tracers 5 Water flux 6A BHD FRPFM sorbent 6 Contaminant flux 6B BHD FRPFM sorbent 6 Contaminant flux average concentration
6.2 FIELD DEMONSTRATION RESULTS
In the project Final Report, statistical analysis methods are presented in Section 6.2 that are then used in Section 6.3 to evaluate quantitative results for all FRPFM field tests. The discussion of results is organized based upon the performance objectives (Table 1) and corresponding quantitative data types (Table 7) used to evaluate each objective. The analyses and results are discussed in detail in Section 6.3 of the project Final Report. A summary of the results for the quantitative performance objectives, based upon average percent difference between FRPFM and competing technologies, is provided in Table 8, which shows good agreement between FRPFM measures and those provided by alternative technologies. The results demonstrate that the FRPFM provides accurate, independent, and simultaneous measure of six data types: 1) detection of flowing fractures, 2) fracture location (depth), 3) fracture orientation, 4) fracture flow direction, 5) groundwater flux (specific discharge), and 6) contaminant mass flux. There is no other current technology that can currently measure all of these simultaneously.
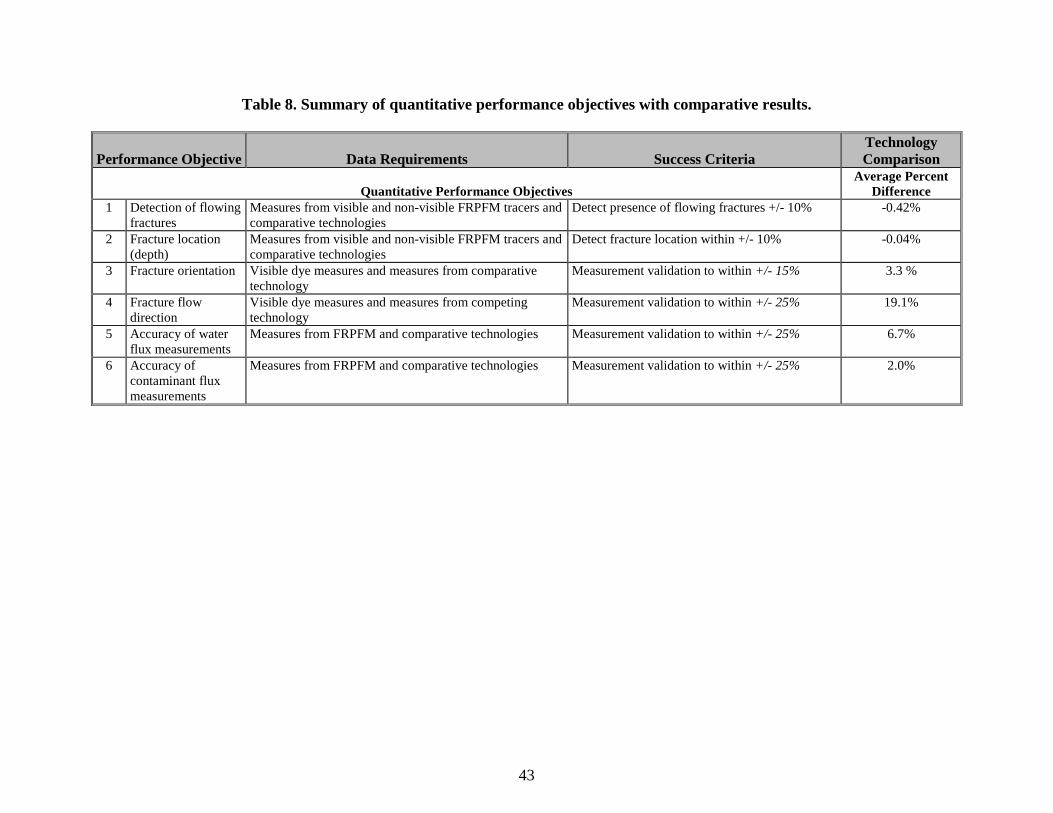
43
Table 8. Summary of quantitative performance objectives with comparative results.
Performance Objective Data Requirements Success Criteria Technology Comparison
Quantitative Performance Objectives Average Percent
Difference 1 Detection of flowing
fractures Measures from visible and non-visible FRPFM tracers and comparative technologies
Detect presence of flowing fractures +/- 10% -0.42%
2 Fracture location (depth)
Measures from visible and non-visible FRPFM tracers and comparative technologies
Detect fracture location within +/- 10% -0.04%
3 Fracture orientation Visible dye measures and measures from comparative technology
Measurement validation to within +/- 15% 3.3 %
4 Fracture flow direction
Visible dye measures and measures from competing technology
Measurement validation to within +/- 25% 19.1%
5 Accuracy of water flux measurements
Measures from FRPFM and comparative technologies Measurement validation to within +/- 25% 6.7%
6 Accuracy of contaminant flux measurements
Measures from FRPFM and comparative technologies Measurement validation to within +/- 25% 2.0%

This page left blank intentionally.
45
7.0 COST ASSESSMENT
7.1 COST MODEL
The FRPFM is the only technology that provides simultaneous measurement of six data types (Table 8) within fractured rock wells: 1) detection of flowing fractures, 2) fracture location (depth), 3) fracture orientation, 4) fracture flow direction, 5) groundwater flux (specific discharge), and 6) contaminant mass flux. The FRPFM provides high resolution measurements over a specific interrogation zone (currently 1 meter). Due to the high resolution nature of the technology, FRPFM application is meant to be focused on high priority target zones and not intended as tool for screening flow conditions across an entire borehole. In order to select the priority target zones, baseline characterization should include at a minimum standard ATV and OTV logs, and aqueous contaminant concentrations from zones of interest. Ideally, it is beneficial to have preliminary indications of potential flow zones based upon comparative and complementary technologies, such as BHD and HRTP/TVP to help identify the priority zones for high resolution FRPM measurements. The FRPFM technology currently functions through deployment of custom-built prototypes designed with a specified interrogation zone (typically 1 meter). Currently, prototypes exist for application in 4-inch and 6-inch fractured rock wells. Determining the price for application is based upon the number of wells to be evaluated, the number of target deployment zones within each well, and the resolution of FRPFM sorbent analysis for water and contaminant flux distributions. The cost of mobilization and demobilization are dependent upon site location. In order to estimate the cost of FRPFM deployment it is assumed that the technology will be used to investigate one well with one (1-meter) interrogation interval and a sampling resolution of 20 samples (5 cm depth resolution) for flux estimates.
7.2 COST DRIVERS
7.2.1 Cost Element: Mobilization
Mobilization encompasses required personnel and associated labor, planning, contracting, transportation/shipping requirements, permitting to secure regulatory approval for alcohol tracer use, and site preparation. The scale of mobilization will depend on the number of wells to be characterized.
7.2.2 Cost Element: Baseline Characterization
Baseline characterization encompasses required personnel and associated labor, investigation into available site-specific literature, a preliminary site visit, water level measurements, contaminant sampling and analysis, sample shipping, analytical laboratory costs, and residual waste handling. The scale of baseline characterization will depend on the number of wells to be characterized.
46
7.2.3 Cost Element: FRPFM
Deploying, extracting, and sampling the FRPFM will encompass required personnel and associated labor, capital equipment purchases, operator labor, operator training, raw materials, consumables, supplies, sampling, sample shipping, sample analysis, analytical laboratory costs, and residual waste handling. The scale of the FRPFM cost component will depend on the number interrogation zones to be investigated and the resolution of FRPFM sorbent analysis for water and contaminant flux distributions.
7.2.4 Cost Element: Alternative Technologies
The alternative technologies element encompasses costs of using alternative technologies including: BHD and HRTP/TVP in a FLUTe liner. With the exception of BHD, there are existing commercial entities that provide characterization services using the above technologies. For estimating costs of conducing borehole dilution, the following cost parameters will be tracked: transportation of personnel; materials and labor to construct a borehole dilution setup; shipping of equipment; water sampling; water sample analysis; analytical laboratory costs; and residual waste handling and all related labor related costs. The scale of the alternative technologies component will depend on the number of wells to be characterized.
7.2.5 Cost Element: Demobilization
Demobilization encompasses required personnel and associated labor, planning, contracting, transportation/shipping requirements. The scale of demobilization will depend on the number of wells to be characterized.
7.3 COST ANALYSIS
Because the FRPFM is the only device capable of providing high resolution simultaneous measurement of the six data types outlined in Table 8, there are no alternative methods available for direct comparison of cost. BHD provides an alternative method for measuring two of the six data types: water and contaminant flux. However, for low flow conditions (<10 cm/day), BHD test durations can approach 1 week requiring continuous staffing and maintenance (Test R at NAWC required a BHD test of 7 days to obtain stable contaminant flux estimate). HRTP and TVP provides an alternative method for measuring three of the six data types: presence of flowing fractures, fracture location, and flow direction. These methods have the added benefit that they provide characterization of these three measures over the entire depth of lined borehole. The TVP analysis used as basis of comparison in section 6 (Pehme et al., 2014) was performed in a lined borehole, which requires purchase of a FLUTe liner, if one is not already in use. As many sites actively use liners, the purchase of a FLUTe liner is considered an optional cost. In order to provide an accurate estimate for FRPFM cost, the following conditions are assumed: all wells for testing are pre-existing (no drilling costs); minimal baseline characterization includes ATV/OTV; and aqueous contaminant concentrations obtained within target zones. Table 9 outlines the total cost for FRPFM deployment assuming the technology will be used to investigate one well with one (1-meter) interrogation interval and a sampling resolution of 20 samples (5 cm depth resolution) for flux estimates. For most FRPFM operations, mobilization
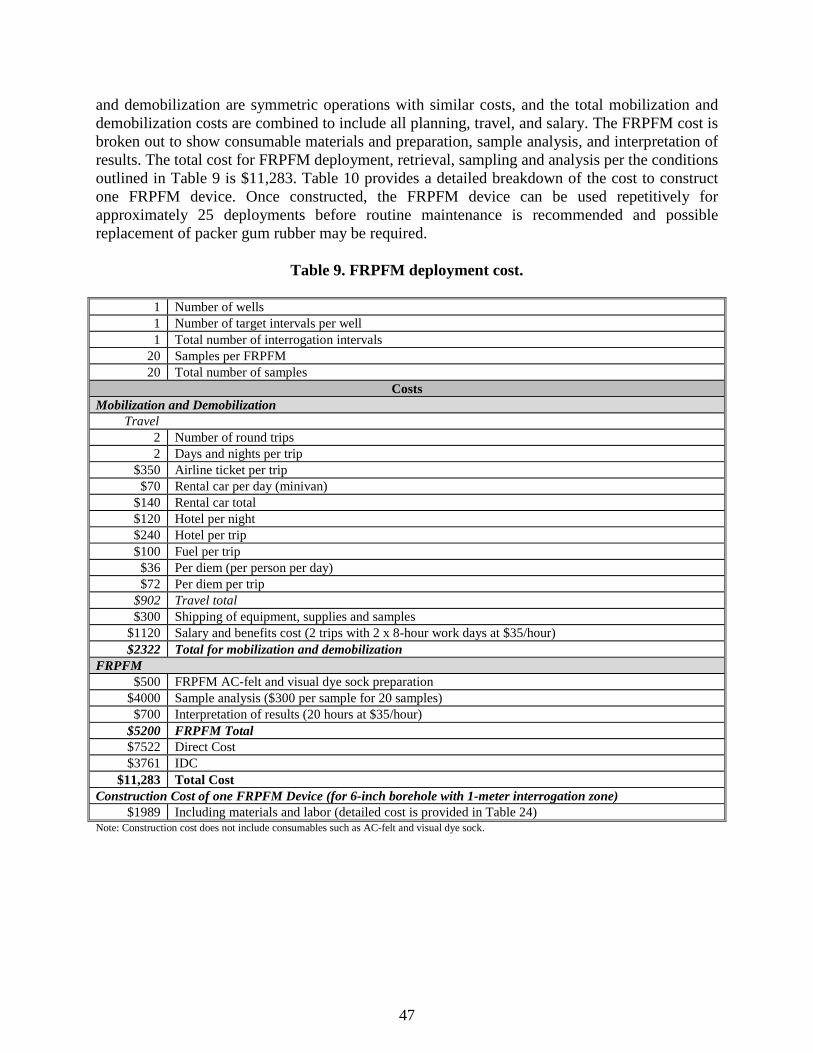
47
and demobilization are symmetric operations with similar costs, and the total mobilization and demobilization costs are combined to include all planning, travel, and salary. The FRPFM cost is broken out to show consumable materials and preparation, sample analysis, and interpretation of results. The total cost for FRPFM deployment, retrieval, sampling and analysis per the conditions outlined in Table 9 is $11,283. Table 10 provides a detailed breakdown of the cost to construct one FRPFM device. Once constructed, the FRPFM device can be used repetitively for approximately 25 deployments before routine maintenance is recommended and possible replacement of packer gum rubber may be required.
Table 9. FRPFM deployment cost.
1 Number of wells 1 Number of target intervals per well 1 Total number of interrogation intervals
20 Samples per FRPFM 20 Total number of samples
Costs Mobilization and Demobilization Travel
2 Number of round trips 2 Days and nights per trip
$350 Airline ticket per trip $70 Rental car per day (minivan)
$140 Rental car total $120 Hotel per night $240 Hotel per trip $100 Fuel per trip
$36 Per diem (per person per day) $72 Per diem per trip
$902 Travel total $300 Shipping of equipment, supplies and samples
$1120 Salary and benefits cost (2 trips with 2 x 8-hour work days at $35/hour) $2322 Total for mobilization and demobilization
FRPFM $500 FRPFM AC-felt and visual dye sock preparation
$4000 Sample analysis ($300 per sample for 20 samples) $700 Interpretation of results (20 hours at $35/hour)
$5200 FRPFM Total $7522 Direct Cost $3761 IDC
$11,283 Total Cost Construction Cost of one FRPFM Device (for 6-inch borehole with 1-meter interrogation zone)
$1989 Including materials and labor (detailed cost is provided in Table 24) Note: Construction cost does not include consumables such as AC-felt and visual dye sock.
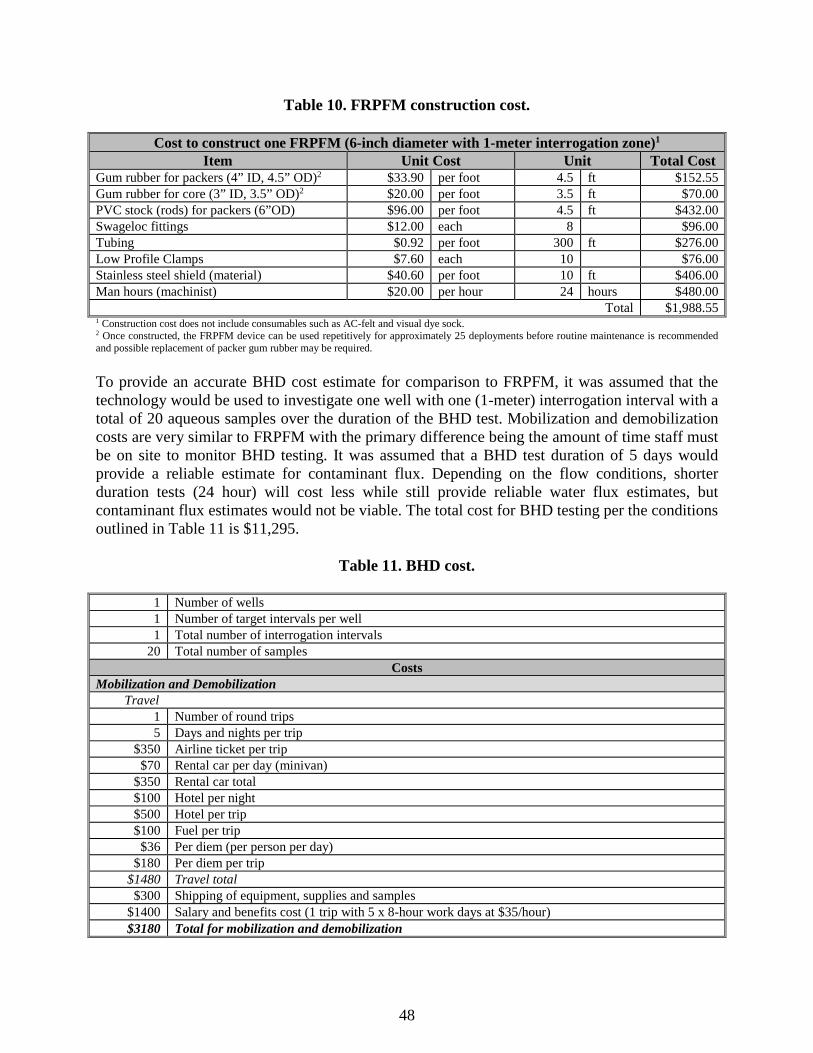
48
Table 10. FRPFM construction cost.
Cost to construct one FRPFM (6-inch diameter with 1-meter interrogation zone)1 Item Unit Cost Unit Total Cost
Gum rubber for packers (4” ID, 4.5” OD)2 $33.90 per foot 4.5 ft $152.55 Gum rubber for core (3” ID, 3.5” OD)2 $20.00 per foot 3.5 ft $70.00 PVC stock (rods) for packers (6”OD) $96.00 per foot 4.5 ft $432.00 Swageloc fittings $12.00 each 8 $96.00 Tubing $0.92 per foot 300 ft $276.00 Low Profile Clamps $7.60 each 10 $76.00 Stainless steel shield (material) $40.60 per foot 10 ft $406.00 Man hours (machinist) $20.00 per hour 24 hours $480.00
Total $1,988.55 1 Construction cost does not include consumables such as AC-felt and visual dye sock. 2 Once constructed, the FRPFM device can be used repetitively for approximately 25 deployments before routine maintenance is recommended and possible replacement of packer gum rubber may be required. To provide an accurate BHD cost estimate for comparison to FRPFM, it was assumed that the technology would be used to investigate one well with one (1-meter) interrogation interval with a total of 20 aqueous samples over the duration of the BHD test. Mobilization and demobilization costs are very similar to FRPFM with the primary difference being the amount of time staff must be on site to monitor BHD testing. It was assumed that a BHD test duration of 5 days would provide a reliable estimate for contaminant flux. Depending on the flow conditions, shorter duration tests (24 hour) will cost less while still provide reliable water flux estimates, but contaminant flux estimates would not be viable. The total cost for BHD testing per the conditions outlined in Table 11 is $11,295.
Table 11. BHD cost.
1 Number of wells 1 Number of target intervals per well 1 Total number of interrogation intervals
20 Total number of samples Costs
Mobilization and Demobilization Travel
1 Number of round trips 5 Days and nights per trip
$350 Airline ticket per trip $70 Rental car per day (minivan)
$350 Rental car total $100 Hotel per night $500 Hotel per trip $100 Fuel per trip
$36 Per diem (per person per day) $180 Per diem per trip
$1480 Travel total $300 Shipping of equipment, supplies and samples
$1400 Salary and benefits cost (1 trip with 5 x 8-hour work days at $35/hour) $3180 Total for mobilization and demobilization
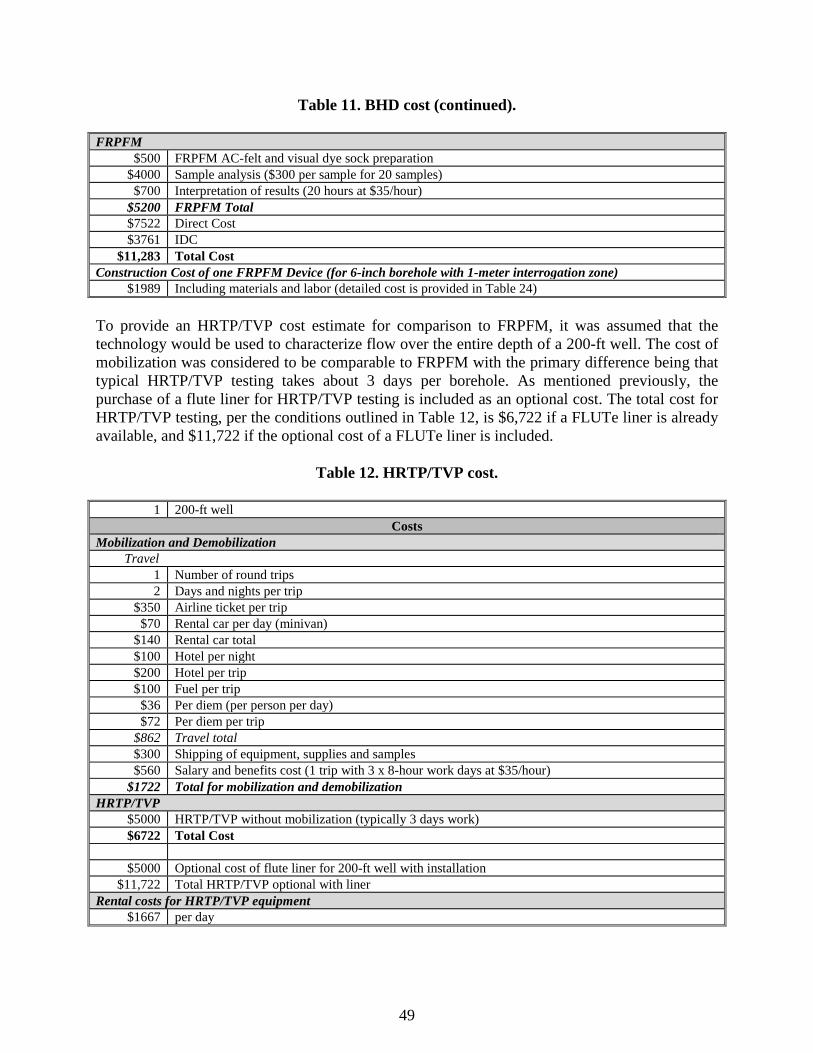
49
Table 11. BHD cost (continued). FRPFM
$500 FRPFM AC-felt and visual dye sock preparation $4000 Sample analysis ($300 per sample for 20 samples) $700 Interpretation of results (20 hours at $35/hour)
$5200 FRPFM Total $7522 Direct Cost $3761 IDC
$11,283 Total Cost Construction Cost of one FRPFM Device (for 6-inch borehole with 1-meter interrogation zone)
$1989 Including materials and labor (detailed cost is provided in Table 24) To provide an HRTP/TVP cost estimate for comparison to FRPFM, it was assumed that the technology would be used to characterize flow over the entire depth of a 200-ft well. The cost of mobilization was considered to be comparable to FRPFM with the primary difference being that typical HRTP/TVP testing takes about 3 days per borehole. As mentioned previously, the purchase of a flute liner for HRTP/TVP testing is included as an optional cost. The total cost for HRTP/TVP testing, per the conditions outlined in Table 12, is $6,722 if a FLUTe liner is already available, and $11,722 if the optional cost of a FLUTe liner is included.
Table 12. HRTP/TVP cost.
1 200-ft well Costs
Mobilization and Demobilization Travel
1 Number of round trips 2 Days and nights per trip
$350 Airline ticket per trip $70 Rental car per day (minivan)
$140 Rental car total $100 Hotel per night $200 Hotel per trip $100 Fuel per trip
$36 Per diem (per person per day) $72 Per diem per trip
$862 Travel total $300 Shipping of equipment, supplies and samples $560 Salary and benefits cost (1 trip with 3 x 8-hour work days at $35/hour)
$1722 Total for mobilization and demobilization HRTP/TVP
$5000 HRTP/TVP without mobilization (typically 3 days work) $6722 Total Cost
$5000 Optional cost of flute liner for 200-ft well with installation
$11,722 Total HRTP/TVP optional with liner Rental costs for HRTP/TVP equipment
$1667 per day

This page was intentionally left blank.
51
8.0 IMPLEMENTATION ISSUES
8.1 ENVIRONMENTAL CHECKLIST
Depending on site conditions, permits may be required for permission to release small quantities of food-grade tracers into the aquifer. A standard list of tracers is available, and no issues have been experienced with previous permit requests.
8.2 OTHER REGULATORY ISSUES
Continuous contact with appropriate site managers is strongly recommended through the duration of all testing to avoid issues with any site-specific regulations.
8.3 END-USER ISSUES
The FRPFM technology currently functions through deployment of custom-built prototypes designed with a specified interrogation zone (typically 1 meter). Currently, prototypes exist for application in 4-inch and 6-inch fractured rock wells. Deployment, retrieval, and sampling is straightforward and has been demonstrated to field technicians from the University of Guelph and USGS who experienced minimal issues with methodology transfer. As technology development continues, refinements will be made and applied to future prototypes (such as expanded interrogation zone). Site specific refinements can be made as needed.

This page was intentionally left blank.
53
9.0 REFERENCES
Acar, O., H. Klammler, K. Hatfield, M.A. Newman, M.D. Annable, J. Cho, B. Parker, J. Cherry, P. Pehme, P. Quinn, and R. Kroeker, 2013. A stochastic model for estimating groundwater and contaminant discharges from fractured rock passive flux meter measurements. Water Resources Research, 49. http://dx.doi.org/10.1002/wrcr.20109.
Annable, M.D., K. Hatfield, J. Cho, H. Klammler, B. Parker, J. Cherry, and P.S.C. Rao, 2005. Field-scale evaluation of the passive flux meter for simultaneous measurement of groundwater and contaminant fluxes. Environmental Science and Technology, 39 (18), 7194 -7201.
Cherry, J.A., B.L. Parker, and C. Keller, 2007. A new depth-discrete multilevel monitoring approach for fractured rock. Ground Water Monitoring & Remediation, 27(2): 57-70.
Guitierrez, G.M., J. Guimera, A. Yllera de Llano, A. Hernandez Benitez, J. Humm, and M. Saltink, 1977. Tracer test at El Berrocal site. J. Cont. Hydrol. 26 (1997), 179– 188.
Hatfield, K., M. Annable, J. Cho, P.S.C. Rao, and H. Klammler, 2004. A direct passive method for measuring water and contaminant fluxes in porous media. Journal of Contaminant Hydrology, 75 (3-4), 155-181.
Keller, C., J.A. Cherry, and B.L. Parker, 2007. A New Method for Fracture Identification and Continuous Hydraulic Conductivity Profiling in Fractured Rock Boreholes, for submittal to Ground Water Monitoring and Review.
Klammler, H., K. Hatfield, M. Annable, B. Parker, and J. Cherry, 2008. Device and method for measuring fluid fluxes, solute fluxes and fractured parameters in fractured flow systems, US Patent (SN 11/409,701).
Klammler, H., K. Hatfield, M. Annable, E. Agyei, B. Parker, J. Cherry, and P.S.C. Rao, 2007. “General analytical treatment of the flow field relevant to the interpretation of passive fluxmeter measurements.” Water Resources Research, 43(4), W04407.
Lacombe, P.J., 2011. Mass of chlorinated volatile organic compounds removed by Pump-and-Treat, Naval Air Warfare Center, West Trenton, New Jersey, 1996–2010: U.S. Geological Survey Scientific Investigations Report 2011–5003, 48 p.
Lisle, R.J., and P.R. Leyshon, 2004. “Stereographic Projection Techniques for Geologists and Civil Engineers,” 2nd edition. Cambridge University Press, UK.
Novakowski, K., G. Bickerton, P. Lapcevic, J. Voralek, and N. Ross, 2006. Measurements of groundwater velocity in discrete rock fractures. Journal of Contaminant Hydrology. 82(1-2), 44-60.
Pehme, P.E., B.L. Parker, J.A. Cherry, and J.P. Greenhouse, 2010. Improved resolution of ambient flow through fractured rock with temperature logs. Ground Water 28 (2), 191–211.
54
Pehme, P.E., B.L. Parker, J.A. Cherry, J. Molson, and J.P. Greenhouse, 2013. Enhanced detection of hydraulically active fractures by temperature profiling in lined heated bedrock boreholes. J. Hydrol. (484), 1–15. http://dx.doi.org/10.1016/j.jhydrol.2012.12.048.
Pehme, P.E., B.L. Parker, J.A. Cherry, and D. Blohm, 2014. Detailed measurement of the magnitude and orientation of thermal gradients in lined boreholes for characterizing groundwater flow in fractured rock. J. Hydrol. (484), 1–15. http://dx.doi.org/10.1016/j.jhydrol.2014.03.015.
Plett, J.H., 2006. Metolachlor and TCE plume characteristics in a dolomite aquifer using a transect. M.Sc. thesis, Dept. of Earth Sciences, University of Waterloo, Waterloo, Ontario.
Priest, S.D., 1985. “Hemispherical Projection Methods in Rock Mechanics.” George Allen & Unwin (Publishers) Ltd., UK.
SERDP/ESTCP, 2006. SERDP and ESTCP expert panel workshop on reducing uncertainty of DNAPL source zone remediation, http://docs.serdp-estcp.org/viewfile.cfm?Doc=DNAPLWorkshopReport.pdf.
Shapiro, A.M., F. Chapelle, M. DeFlaun, D. Goode, C. Tiedeman, and T. Imbiogiotta, 2008. A Comparison of Pump-and-Treat, Natural Attenuation, and Enhanced Biodegradation to Remediate Chlorinated Ethene Contaminated Fractured Rock Aquifers: SERDP Project ER-1555, USGS.
Sterling, S.N., B.L. Parker, J.A. Cherry, J.H. Williams, J.W. Lane Jr., and F.P. Haeni, 2005. Vertical cross contamination of trichloroethylene in a borehole in fractured sandstone. Ground Water, 43(4): 557-573.
Tiedeman, C.R., P.J. Laombe, and D.J. Goode, 2010. Multiple well-shutdown tests and site-scale flow simulation in fractured rocks. Ground Water, 48 (3): 401-415.
Wilson, J.T., W.A. Mandell, F.L. Pailet, E.R. Bayless, R.T. Hansen, P.M. Kearl, W.B. Kerfoot, M.W. Newhouse, and W.H. Pedler, 2001. An Evaluation of Borehole Flowmeters Used to Measure Horizontal Ground-Water Flow in Limestones of Indian, Kentucky, and Tennessee, 1999: USGS Water-Resources Investigations Report 01-4139, 129 p.
Xu, Y., G. van Tonder, B. van Wyk, E. van Wyk, and B. Aleobua, 1997. Borehole dilution experiment in a Karoo aquifer in Bloemfontein. Water SA 23 (2), 141–145.

This page was intentionally left blank.

A-1
APPENDIX A
POINTS OF CONTACT
Point of Contact Organization
Phone Fax
E-Mail Role In Project Kirk Hatfield University of Florida Phone: 352-392-9537
Fax: 352-392-3394 Email: [email protected]
Laboratory/field/modeling
Michael Annable University of Florida Phone: 352-392-3294 Fax: 352-392-3076 Email: [email protected]
Laboratory/field/analytical
Harald Klammler University of Florida Phone: 352-392-9537 Fax: 352-392-3394 Email: [email protected]
Modeling/statistical analysis
Mark Newman University of Florida Phone: 352-392-9537 Fax: 352-392-3394 Email: [email protected]
Laboratory/field/analytical
Beth Parker University of Guelph Phone: 519-824-4120 Fax: 519-836-0227 Email: [email protected]
Field/laboratory
John Cherry University of Guelph Phone: 519-888-4516 Fax: 519-883-0220 Email: [email protected]
Field/modeling
Andrea Leeson Environmental Security Technology Certification Program - Strategic Environmental Research and Development Program
Phone: 571-372-6398 Email: [email protected]
Program Manager – Environmental Restoration

ESTCP Office 4800 Mark Center Drive Suite 17008 Alexandria, VA 22350-3605
(571) 372-6565 (Phone)
E-mail: [email protected] www.serdp-estcp.org