Embed Size (px)
Citation preview

PRICES AND SUPPLY DISRUPTIONS DURING
NATURAL DISASTERS
by Alberto Cavallo*
MIT
Eduardo Cavallo
IDB
and
Roberto Rigobon
MIT and NBER
We study the daily behavior of supermarket prices and product availability following two recentnatural disasters: the 2010 earthquake in Chile and the 2011 earthquake in Japan. In both cases therewas an immediate and persistent effect on product availability. The number of goods available for salefell 32 percent in Chile and 17 percent in Japan from the day of the disaster to its lowest point, whichoccurred 61 and 18 days after the earthquakes, respectively. Product availability recovered slowly, anda significant share of goods remained out of stock after six months. By contrast, prices were relativelystable and did not increase for months after the earthquakes, even for goods that were experiencingsevere stockouts. These trends are present at all levels of aggregation, but appear strongly in non-perishable goods and emergency products. Our findings shed light into the determinants of sticky pricesin conditions where traditional adjustment costs are less important. In particular, we look at thefrequency and magnitudes of price changes in both countries and find that the results in Chile areconsistent with pricing models where retailers have fear of “customer anger”. In Japan, by contrast, theevidence suggests a bigger role for supply disruptions that restricted the ability of retailers to re-stockgoods after the earthquake.
Keywords: consumer anger, natural disasters, online data, scraped data, sticky prices, supply shocks
1. Introduction
The economic consequences of natural disasters are always measured withsignificant delays. The data that are immediately available, such as the strength ofthe seismic waves or the number of deaths, are not really useful to determine theeconomic impact of the disaster. Aggregate statistics such as industrial productionand GDP take months to be compiled and published, forcing governments (andCentral Banks in particular) to make decisions without really knowing the mag-nitude of any shortages and price increases that may be affecting the economy.Furthermore, even when the data becomes available, its low frequency tends tohide the short-run effects taking place in the days immediately after the disaster.
Note: We thank Marshall Reinsdorf and seminar participants at MIT for helpful comments andsuggestions. Diego Aparicio and Mathieu Pedemonte provided outstanding research assistance.
*Correspondence to: Alberto Cavallo, MIT, 77 Mass Ave E62-512, Cambridge, MA 02139, USA([email protected]).
Review of Income and Wealth 2014DOI: 10.1111/roiw.12141
bs_bs_banner
© 2014 International Association for Research in Income and Wealth
1

This has limited the literature’s understanding of how prices and quantities react tothis type of exogenous, unanticipated shock, which is a basic and fundamentalissue in economics.
In this paper we propose using online data to measure two key economicvariables in the aftermath of a natural disaster: supply disruptions and pricingbehaviors. We use data from the Billion Prices Project (BPP) at MIT, a large andcontinuing effort to collect online information from large retailers around the worldon a daily basis. We construct daily price indices across various goods and catego-ries and measure the degree of supply disruption with an index of product avail-ability, which tracks the number of goods that are available for purchase over time.
We focus on the earthquakes in Chile (2010) and Japan (2011), two majorcatastrophic natural disasters that occurred in countries where the BPP was col-lecting data before the events. We also limit our analysis to products sold insupermarkets, such as food, beverages, and other basic necessities which are morelikely to experience demand changes after a natural disaster and for which we havemore comprehensive data coverage.
We show that these natural disasters had an immediate impact on productavailability. A large share of goods went out of stock within days. The fall wasgradual but larger in Chile, where the number of products available fell by 32percent in the first two months after the earthquake, recovering slowly after that.In Japan, the fall was faster but smaller, with product availability dropping by 17percent within 18 days after the earthquake, and recovering gradually after that.
Prices, by contrast, remained surprisingly stable for several months after theearthquakes. The inflation rate started to rise only after 4 months in Japan, and 6months in Chile.
Nearly all categories of goods experienced a drop in product availability inboth countries during the first months. The recovery and price-change behaviorsdiffered significantly across categories. Many goods that could be consideredindispensable after an earthquake, such as powdered milk, diapers, and baby food,disappeared quickly from the stores and maintained stable prices for a long time.Others, such as batteries, had drops in availability but recovered quicker withrising prices.
Natural disasters, with their unanticipated and exogenous nature, can be usedto test some of the predictions of the large New Keynesian literature on pricestickiness. We therefore focus on variables such as the frequency of price changes,their average size, and the shape of the hazard functions for both stockout eventsand price adjustments.
In Chile, the data is consistent with the predictions of a growing strand of theliterature that has emphasized how fear of “consumer anger” may affect firms’pricing decisions.1 In particular, the frequency of price changes falls dramaticallyfor several months after the earthquake, suggesting that firms were delaying theirprice adjustments.
By contrast, in Japan the evidence is more consistent with a supply shock thataffected the retailer’s ability to re-stock. Product availability also fell dramatically,but the number of price changes remained stable over time. In addition, the
1See, for example, Blinder et al. (1998), Fabiani et al. (2006), and Rotemberg (2005).
Review of Income and Wealth 2014
© 2014 International Association for Research in Income and Wealth
2
product availability index in Japan has a surprisingly close co-movement with theofficial estimates of industrial production, providing more evidence of the impor-tance of the supply disruption in this case.
This paper is part of a large empirical literature on price stickiness, withpapers such as Bils and Klenow (2004), Nakamura and Steinsson (2008), Lach andTsiddon (1996), Kashyap (1995), Levy et al. (1997), and Blinder et al. (1998). Ourdistinctive contribution is to analyze how prices and product availability behave atthe time of natural disasters, which are unambiguous examples of exogenous andunanticipated aggregate shocks. Most of our findings are consistent with theoriesthat emphasize the effects of fairness concerns on pricing decisions, such as in thework of Kahneman et al. (1986) and Rotemberg (2005, 2011). Our results in Japanare complementary to the analysis in Weinstein and Schell (2012), who argue thatthe supply disruption from the 2011 earthquake caused a much larger and persis-tent contraction on industrial production than previous earthquakes. Finally, in arecent paper, Gagnon and Lopez-Salido (2014) study the pricing response of U.S.supermarkets to large demand shocks such as hurricane Katrina, and consistentwith our results, find almost no evidence that retailers responded to these shocksby raising prices.
2. The Earthquakes in Chile and Japan
On February 27, 2010, a strong earthquake (8.8 on the moment magnitudescale) struck off the coast of central Chile. The earthquake was felt strongly in sixChilean regions (from Valparaiso in the north to Araucania in the south) thatinclude approximately 80 percent of the country’s population. The earthquakealso triggered a tsunami which caused widespread destruction in coastal towns ofsouth-central Chile, prompting President Michelle Bachelet to immediately declarea “state of catastrophe” and to deploy emergency workers to the affected areas.
Chile’s earthquake ranks as one of the most destructive in recent years interms of economic damage, as Table 1 shows. The total economic damage causedby the earthquake was estimated at $30 billion, or 19 percent of GDP, accordingto the CRED International Disaster Database (EM-DAT).
On March 11, 2011, an even stronger earthquake (9.0 on the moment mag-nitude scale) struck off the Pacific coast of Japan, triggering a powerful tsunamiwith severe human and economic consequences. Initial disruptions in Japan werelarger than in Chile, particularly because the tsunami caused a nuclear accident in
TABLE 1
Top Natural Disasters by Total Damages (2008–12)
Country Date Type KilledDamages
(US$ million)Damages
(% of GDP)
Japan 11 Mar 2011 Earthquake (9.0 Mw) 19,846 210,000.00 3.85China 12 May 2008 Earthquake (8.0 Mw) 87,476 91,285.30 2.43Thailand 5 Aug 2011 Flood 813 40,000.00 12.56United States 12 Sep 2008 Storm 82 32,218.34 0.21Chile 27 Feb 2010 Earthquake (8.8 Mw) 562 30,900.90 18.65
Source: Authors’ calculation based on EM-DAT and WDI databases.
Review of Income and Wealth 2014
© 2014 International Association for Research in Income and Wealth
3

a power-generating plant (the Fukushima Daiichi Nuclear Power Plant complex),forcing the evacuation of thousands of residents in the vicinity of the plant.According to press reports, approximately 4.4 million households in northeasternJapan were left without electricity and 1.5 million without water for days. Nearly20,000 people were killed as a result of the disaster.
Japan’s total economic costs were estimated to be US$210 billion, making thisevent the costliest natural disaster in recent years in nominal terms. However, thisrepresented only 4 percent of GDP, about 20 percent of the estimated cost in Chile.2
In both countries, concerns about possible food scarcity and price increaseseven in areas that were not directly impacted by the earthquakes quickly surfacedon the news. In Chile, the national Baker’s Association complained about unjus-tified increases to the price of flour.3 On February 28, President Bacheletannounced that the government had reached an agreement with the major super-markets which would require them to give away basic foodstuffs to people affectedby the earthquake.4 In newspaper interviews, government officials also threatenedto enforce a law enacted in the 1970s to penalize anyone who in the aftermath ofa natural disaster sells basic staples at excessive prices.5 Similarly, in Japan, withindays after the earthquake the press reported shortages of food and gasoline aspeople hoarded basic items out of fear that supplies would soon dry up.6 Accord-ing to some reports, shoppers in the Tokyo metro area (150 miles from mostaffected areas) had cleaned supermarket shelves of items such as rice, bread, andyogurt. Moreover, many retailers claimed to have run out of emergency items suchas blankets, sanitary pads, diapers, toilet paper, instant noodles, and flashlights.7
Although reports and rumors in the media were widespread, there was noreliable information on the magnitudes of the shortages and price increases in theaftermath of these events. Even though shortages and out-of-stock items canimpose a significant welfare cost to consumers, they are not traditionally measuredby any official statistics. Official price indices are available, but only with a sig-nificant delay, and their monthly frequency can obscure high frequency patternsthat could alter expectations and economic behavior in the days after a naturaldisaster. In the next section, we discuss how online data can be used to constructstatistics that provide information on shortages and prices in real-time.
3. Data: The Billion Prices Project
Our data were collected as part of the Billion Prices Project (BPP), an aca-demic initiative at MIT that has been “scraping” daily prices from the largest
2The significant differences in terms of estimated economic costs and mortality, despite the similarphysical intensity of the two events, warrants further discussion. As discussed in Cavallo et al. (2010),there are various determinants of the economic costs of natural disasters in addition to the physicalintensity of the events. One of those determinants is the amount of capital exposed. Earthquakes are bytheir nature unpredictable and the exact location where they may strike is usually unknowable.Therefore, while it is possible to implement building codes and standards that better prepare infra-structure to resist possible earthquakes, it is not easy to locate wealth and populations in “safer” areas.The damages and mortality associated to earthquakes vary significantly, even for similar events.
3See http://bit.ly/12zcQDg4See http://bit.ly/18dqv8L5See http://bit.ly/17bXVTPI6See http://bit.ly/14Qatjw7See http://bit.ly/1bascHs
Review of Income and Wealth 2014
© 2014 International Association for Research in Income and Wealth
4

online retailers around the world since 2008. In this paper we use prices from thelargest supermarket in Chile and one of the leading supermarkets in Japan. Data-base details are shown in Table 2. We focus on a 9-month window around the dayof the natural disaster: 3 months before and 6 months after the event.
The data collection method is based on the use of software that monitors thepublic web pages where retailers list product and price information, scans theunderlying code to identify the relevant information (such as prices and availabil-ity), then stores everything in a structured database.8
An example of a good in our data is “Whole Milk, Brand Name, 1 liter.” Thescraping software automatically collects data on every single product on displayon the retailer’s website each day. Goods are listed on the website only if they arein stock and available for sale. Out of stock items therefore immediately disappearfrom our database, and only reappear on the day that they are offered for saleagain (if ever). We can therefore build statistics to study how the set of goodsavailable for purchase changes over time after a natural disaster.9
In terms of data treatment, our prices include taxes and sale discounts, toaccount for the final amount paid by the consumer. We do not include shippingcosts, which vary according to the location of the purchaser and are an exclusivefeature of the online purchasing experience. In addition, missing prices in the datawere often caused by scraping errors on days when the software fails to automati-cally start. For those dates, no data was collected. The number of days withfailures is reported in Table 2. These gaps in the data tend to last just one or twodays, until the scrape job is corrected. Finally, missing prices also occur when agood goes temporarily out of stock. For the price index calculations, if a gooddisappears and later reappears in our sample, we fill missing prices with thepreviously available values until a new price is observed.
Although online transactions are still a small share of retail sales in mostcountries, we are confident that the data collected online also provides informationabout offline prices and product availability. In the case of Chile, Cavallo (2012)presents the results of an online–offline validation with a randomly chosen sampleof 100 goods. Prices were sampled at an offline store in 15-day intervals between
8See Cavallo (2012) for more technical details on the scraping methodology.9Our results on product availability are only an upper bound on the degree of supply-chain
disruptions because we only know if a good is completely out of stock, but not how many units areavailable over time if it is still offered for sale. Supply disruptions affecting the normal level ofinventories are not captured in our metrics.
TABLE 2
Data Description
Chile Japan
Initial date December 2009 December 2010End date August 2010 September 2011Products 17,141 3,982Categories 265 26Days with no data* 42 6
Note: *These are days where the scraping software failed.
Review of Income and Wealth 2014
© 2014 International Association for Research in Income and Wealth
5
December 2008 and January 2009, then compared to the online prices for the samegoods on the same day. Only one retailer was involved in this validation exercise,but it is the same Chilean retailer whose data are included in this paper. Over 90percent of goods in the offline store were also available online on the same date.Furthermore, for those available in both locations, prices were identical in 89percent of the cases.10 Unfortunately we do not have direct evidence of the differ-ence between online and offline prices in the case of Japan, but we note thatCavallo (2012) found that online retailers tend to have stable markups in percent-age terms in many countries, implying similar online and offline inflation rates. Wecan test this prediction in the case of Japan, by comparing a supermarket priceindex with the official data price trends, as we do in Section 4.
4. The Aggregate Impact: Prices and Product Availability
Natural disasters can create both supply and demand shocks that affect pricesand product availability. Supply shocks originate in the destruction of productioncapacity and the disruption of supply chains. Demand shocks are linked to thepanic that consumers may experience after natural disasters, with people rushingto the stores to purchase basic necessities and hoard goods that they fear couldbecome unavailable in the days to come.
In this section, we look at aggregate prices and product availability in bothChile and Japan, and compare them to the predictions of recent pricing models.
4.1. Prices
Figure 1 shows a price index constructed with the online data. The index isnormalized to a value of 100 on the day of the natural disaster in order to moreeasily track changes after the event, as well as better compare across countries. Thevertical line marks the day of the natural disaster. The index is a simple Jevonsgeometric-average price index that uses all the products sold by these supermarketsand implicitly assigns equal importance to all goods. Details of the methodologyand motivation for this index formula are provided in the Appendix.
In both cases prices did not increase significantly during the first few monthsafter the events. In Chile, the trend of the index remained remarkably stable afterthe earthquake. Prices only rose in mid-July 2010, almost 6 months after theearthquake.11 In Japan, a similar pattern emerges. Before the earthquake, priceshad a negative trend, which did not change during the first 4 months after the
10Only 11 goods had different prices. They were all raw-food items that were sold online inpackages with pre-defined sizes, yet sold by weight in the offline stores, creating unit-price differencesacross the samples.
11Note that there is a relatively big spike in the Chilean index in late July. The scraping softwarefailed for 10 days before this date, so this spike reflects accumulated price changes during this period.A similar thing happened at the end of August, with a large drop in the index.
Review of Income and Wealth 2014
© 2014 International Association for Research in Income and Wealth
6
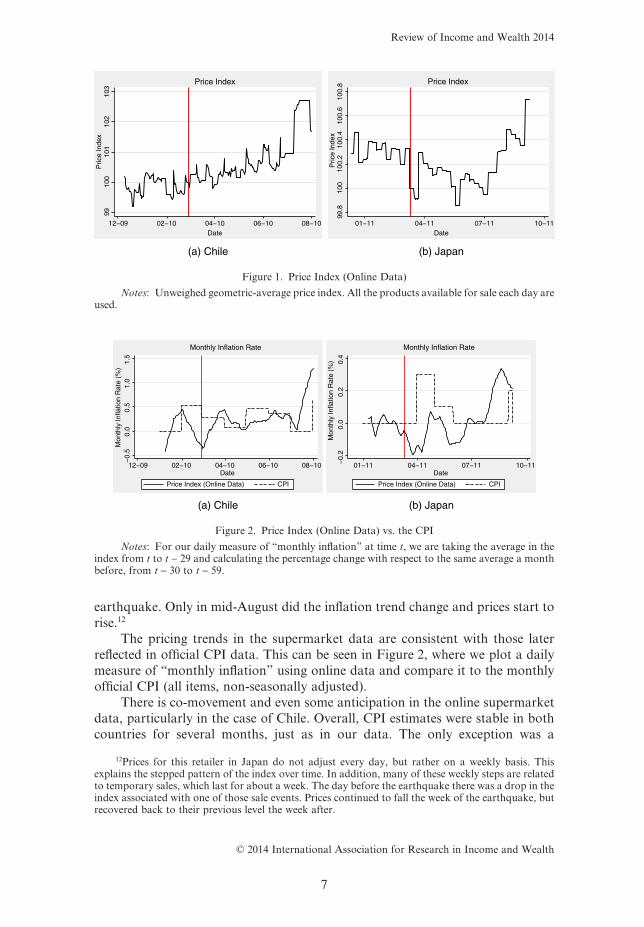
earthquake. Only in mid-August did the inflation trend change and prices start torise.12
The pricing trends in the supermarket data are consistent with those laterreflected in official CPI data. This can be seen in Figure 2, where we plot a dailymeasure of “monthly inflation” using online data and compare it to the monthlyofficial CPI (all items, non-seasonally adjusted).
There is co-movement and even some anticipation in the online supermarketdata, particularly in the case of Chile. Overall, CPI estimates were stable in bothcountries for several months, just as in our data. The only exception was a
12Prices for this retailer in Japan do not adjust every day, but rather on a weekly basis. Thisexplains the stepped pattern of the index over time. In addition, many of these weekly steps are relatedto temporary sales, which last for about a week. The day before the earthquake there was a drop in theindex associated with one of those sale events. Prices continued to fall the week of the earthquake, butrecovered back to their previous level the week after.
9910
010
110
210
3P
rice
Inde
x
12−09 02−10 04−10 06−10 08−10Date
(a) Chile (b) Japan
Price Index
99.8
100
100.
210
0.4
100.
610
0.8
Pric
e In
dex
01−11 04−11 07−11 10−11Date
Price Index
Figure 1. Price Index (Online Data)
Notes: Unweighed geometric-average price index. All the products available for sale each day areused.
−0.
50.
00.
51.
01.
5M
onth
ly In
flatio
n R
ate
(%)
12−09 02−10 04−10 06−10 08−10Date
(a) Chile (b) Japan
Price Index (Online Data) CPI
Monthly Inflation Rate−
0.2
0.0
0.2
0.4
Mon
thly
Infla
tion
Rat
e (%
)
01−11 04−11 07−11 10−11Date
Monthly Inflation Rate
Price Index (Online Data) CPI
Figure 2. Price Index (Online Data) vs. the CPI
Notes: For our daily measure of “monthly inflation” at time t, we are taking the average in theindex from t to t − 29 and calculating the percentage change with respect to the same average a monthbefore, from t − 30 to t − 59.
Review of Income and Wealth 2014
© 2014 International Association for Research in Income and Wealth
7

temporary spike in Japan’s CPI in April 2011 which was driven by a 0.2 percentincrease in fuel and transportation, categories of goods not covered in oursample.13
4.2. Product Availability
The rigidity of prices contrasts sharply with the behavior of goods availabilityin the aftermath of the earthquakes. Figure 3 shows indices of product availabilityfor both countries.
We measure product availability with a simple index that captures how manyitems are for sale in the supermarket on a given day. We normalize the index to avalue of 100 on the day of the natural disaster in order to be able to easily computethe change in product availability over time, as well as to facilitate comparisonsacross categories and countries. All goods sold by these retailers are included ineach case, with every good having equal weight in the index. As such, these metricsare meant to show retailer-level effects. In the next section we compare resultsacross categories.14
In the case of Chile, overall product availability fell by almost 8 percent theday after the earthquake and decreased an additional 25 percent to its lowest level,which occurred 61 days after the earthquake. Product availability did not fully
13Note that the monthly online inflation rate is calculated on a daily basis using the average of theindex in the previous 30 days compared to the same average a month before. A monthly rate calculatedthis way (instead of using a simple 30-day difference) has the advantage of being less sensitive to thedaily volatility in the index. This method, however, introduces some smoothing into the results. Inaddition, Figure 2 does not reflect the effects of the last days of the online price index movements(shown in Figure 1) because we limited the sample to exactly 180 days after the earthquakes. Since theCPI is updated at the end of the month, and we are plotting the graphs only for the days with data inboth the CPI and the online index, Figure 2 does not show the information for the partial results on thelast month of the sample.
14We do not have product expenditure weights and are therefore not able to construct weightedindices. The potential impact of weights is not obvious for the case of product availability. For example,it is possible that the goods that disappear from the stores are those that are sold the most, making theproduct availability concerns even stronger than what our results imply. But it is also possible that,given the emergency, retailers shift their focus to the most widely sold products, making an effort tokeep them in stock. In that case, a drop in product availability would be less worrisome (people haveless variety, but the goods they buy the most are still available).
7080
9010
011
0P
rodu
ct A
vaila
bilit
y
12−09 02−10 04−10 06−10 08−10Date
Product Availability Index
(a) Chile
7080
9010
011
0P
rodu
ct A
vaila
bilit
y
01−11 04−11 07−11 10−11Date
Product Availability Index
(b) Japan
Figure 3. Product Availability
Review of Income and Wealth 2014
© 2014 International Association for Research in Income and Wealth
8
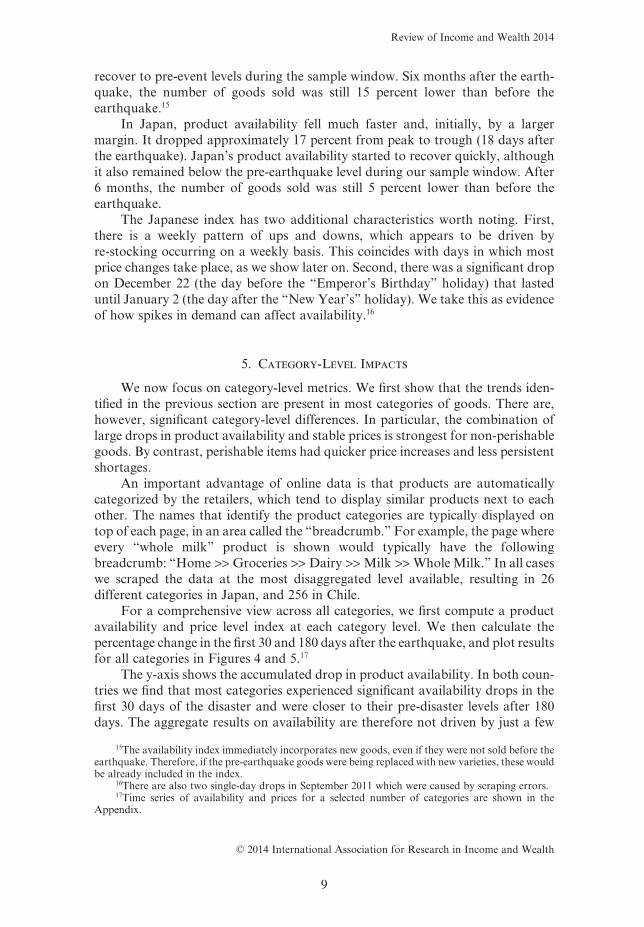
recover to pre-event levels during the sample window. Six months after the earth-quake, the number of goods sold was still 15 percent lower than before theearthquake.15
In Japan, product availability fell much faster and, initially, by a largermargin. It dropped approximately 17 percent from peak to trough (18 days afterthe earthquake). Japan’s product availability started to recover quickly, althoughit also remained below the pre-earthquake level during our sample window. After6 months, the number of goods sold was still 5 percent lower than before theearthquake.
The Japanese index has two additional characteristics worth noting. First,there is a weekly pattern of ups and downs, which appears to be driven byre-stocking occurring on a weekly basis. This coincides with days in which mostprice changes take place, as we show later on. Second, there was a significant dropon December 22 (the day before the “Emperor’s Birthday” holiday) that lasteduntil January 2 (the day after the “New Year’s” holiday). We take this as evidenceof how spikes in demand can affect availability.16
5. Category-Level Impacts
We now focus on category-level metrics. We first show that the trends iden-tified in the previous section are present in most categories of goods. There are,however, significant category-level differences. In particular, the combination oflarge drops in product availability and stable prices is strongest for non-perishablegoods. By contrast, perishable items had quicker price increases and less persistentshortages.
An important advantage of online data is that products are automaticallycategorized by the retailers, which tend to display similar products next to eachother. The names that identify the product categories are typically displayed ontop of each page, in an area called the “breadcrumb.” For example, the page whereevery “whole milk” product is shown would typically have the followingbreadcrumb: “Home >> Groceries >> Dairy >> Milk >> Whole Milk.” In all caseswe scraped the data at the most disaggregated level available, resulting in 26different categories in Japan, and 256 in Chile.
For a comprehensive view across all categories, we first compute a productavailability and price level index at each category level. We then calculate thepercentage change in the first 30 and 180 days after the earthquake, and plot resultsfor all categories in Figures 4 and 5.17
The y-axis shows the accumulated drop in product availability. In both coun-tries we find that most categories experienced significant availability drops in thefirst 30 days of the disaster and were closer to their pre-disaster levels after 180days. The aggregate results on availability are therefore not driven by just a few
15The availability index immediately incorporates new goods, even if they were not sold before theearthquake. Therefore, if the pre-earthquake goods were being replaced with new varieties, these wouldbe already included in the index.
16There are also two single-day drops in September 2011 which were caused by scraping errors.17Time series of availability and prices for a selected number of categories are shown in the
Appendix.
Review of Income and Wealth 2014
© 2014 International Association for Research in Income and Wealth
9

categories. Instead, both of these earthquakes had an impact on the availability ofnearly all categories of goods sold at the stores.
The x-axis, where the accumulated price changes in each category are plotted,shows a different pattern. There are roughly the same number of categories withprice increases and decreases, both at the 30- and 180-day horizons. While theaggregate price index is stable, there is clearly significant dispersion in pricingbehaviors across categories.
We can shed some light on the differences in price and availability responsesby looking at individual categories over time. In Figures 6 to 9 we plot daily indicesfor distinct groups of goods that show different behaviors along these two dimen-sions. We start with Chile, where the category information is available at a moredisaggregated level.
First, there is a distinct set of goods whose product availability decreased bymore than 20 percent. In some cases product availability fell within days of theearthquake. Examples include: pasta (Figure 6(a)), powdered milk (6(b)), andbasic staples like baby diapers (6(c)). In other cases, the drop was more gradual, as
−70
−50
−30
−10
1030
5070
90%
Cha
nge
in P
rodu
ct A
vaila
bilit
y
−20 −10 0 10 20% Change in Price Index
Mean Availability : −16.22 % , Mean Price : 0.07 %
Category Effects
(a) 30-days
−70
−50
−30
−10
1030
5070
90%
Cha
nge
in P
rodu
ct A
vaila
bilit
y
−20 −10 0 10 20% Change in Price Index
Mean Availability : −7.87 % , Mean Price : 1.45 %
Category Effects
(b) 180-days
Figure 4. Chile: Changes in Availability and Prices
−70
−50
−30
−10
1030
5070
90%
Cha
nge
in P
rodu
ct A
vaila
bilit
y
−20 −10 0 10 20% Change in Price Index
Mean Availability : −15.51 % , Mean Price : 0.34 %
Category Effects
(a) 30-days
−70
−50
−30
−10
1030
5070
90%
Cha
nge
in P
rodu
ct A
vaila
bilit
y
−20 −10 0 10 20% Change in Price Index
Mean Availability : −5.54 % , Mean Price : 0.75 %
Category Effects
(b) 180-days
Figure 5. Japan: Changes in Availability and Prices
Review of Income and Wealth 2014
© 2014 International Association for Research in Income and Wealth
10

with baby foods (6(d)), soups (6(e)), and unflavored cookies (6(f)). Note that theseare all non-perishable goods that people are likely to stock up on if they are fearfulof future scarcity, which can explain why they disappeared from the stores. Inter-estingly, in all these cases prices remained stable for several months.
A second group of goods, as shown in Figure 7, had significant drops inproduct availability but started having price increases soon after the earthquake.These included perishable goods like eggs (7(a)), fresh vegetables (7(b)), and meat(7(c)).
A third set of goods had no fall in product availability coupled with higherprices. These include fish (Figure 8(a)) and batteries (8(b)), which may be surpris-ing given that coastal towns were affected by the tsunami following the earthquakeand also that demand for batteries likely increased in the aftermath of the event forfear of blackouts. It is possible, however, that the large price increases helpedreduce demand and prevent stockout. Finally, the case of milk (8(c)) is interestingbecause the Chilean government explicitly announced policies intended to secure
7580
8590
9510
0A
vaila
bilit
y
12−09 02−10 04−10 06−10Date
Product Availability
9810
010
210
410
6In
dex
Price Index
(a) Pasta
7080
9010
0A
vaila
bilit
y
Product Availability
9798
9910
010
110
2In
dex
Price Index
(b) Powdered Milk
7080
9010
011
0A
vaila
bilit
y
9798
9910
010
1In
dex
(c) Baby Diapers20
4060
8010
0A
vaila
bilit
y
9698
100
102
104
Inde
x
(d) Baby Food
4060
8010
012
0A
vaila
bilit
y
9810
010
210
410
6In
dex
(e) Soup
4060
8010
012
0A
vaila
bilit
y
9496
9810
010
2In
dex
(f) Unflavored Cookies
08−10 12−09 02−10 04−10 06−10Date
08−10 12−09 02−10 04−10 06−10Date
08−10 12−09 02−10 04−10 06−10Date
08−10
12−09 02−10 04−10 06−10Date
08−10
12−09 02−10 04−10 06−10Date
08−1012−09 02−10 04−10 06−10Date
08−1012−09 02−10 04−10 06−10Date
08−1012−09 02−10 04−10 06−10Date
08−10
12−09 02−10 04−10 06−10Date
08−1012−09 02−10 04−10 06−10Date
08−1012−09 02−10 04−10 06−10Date
08−10
Product Availability Price Index Product Availability Price Index
Product Availability Price Index Product Availability Price Index
Figure 6. Chile; Drops in Product Availability and Stable Prices
Note: In all cases the graph on the left is Availability, and the graph on the right is Price Index.
Review of Income and Wealth 2014
© 2014 International Association for Research in Income and Wealth
11

6070
8090
100
Ava
ilabi
lity
12−09 02−10 04−10 06−10Date
Product Availability
100
105
110
115
Inde
x
Price Index
(a) Eggs
8090
100
110
Ava
ilabi
lity
Product Availability
9510
010
511
011
5In
dex
Price Index
(b) Vegetables60
7080
9010
0A
vaila
bilit
y
8090
100
110
120
Inde
x
(c) Meat
08−10 12−09 02−10 04−10 06−10Date
08−10 12−09 02−10 04−10 06−10Date
08−10 12−09 02−10 04−10 06−10Date
08−10
12−09 02−10 04−10 06−10Date
08−10 12−09 02−10 04−10 06−10Date
08−10
Product Availability Price Index
Figure 7. Chile; Drops in Product Availability and Higher Prices
Note: In all cases the graph on the left is Product Availability, and the graph on the right is PriceIndex.
5010
015
020
0A
vaila
bilit
y
Product Availability
9698
100
102
104
106
Inde
x
Price Index
(a) Fish
100
120
140
160
180
200
Ava
ilabi
lity
Product Availability99
100
101
102
103
104
Inde
xPrice Index
(b) Batteries
8590
9510
0A
vaila
bilit
y
Product Availability
8590
9510
010
511
0In
dex
01dec2009 01feb2010 01apr2010 01jun2010 01aug2010Date
Price Index
(c) Milk
12−09 02−10 04−10 06−10Date
08−10 12−09 02−10 04−10 06−10Date
08−10 12−09 02−10 04−10 06−10Date
08−10 12−09 02−10 04−10 06−10Date
08−10
12−09 02−10 04−10 06−10Date
08−10
Figure 8. Chile; Stable Product Availability
Note: In all cases the graph on the left is Product Availability, and the graph on the right is PriceIndex.
Review of Income and Wealth 2014
© 2014 International Association for Research in Income and Wealth
12

its availability at stable prices to victims of the earthquake.18 These policiesappear to have worked successfully, at least during the first four months after theearthquake.
In Japan the product categories are much more broadly defined, due to theway the retailer chooses to group products on its website. Still, some interestingpatterns emerge as shown in Figure 9. First, we find fresh fish (9(a)) among thecategories where stocks fell sharply after the earthquake. This is not surprisingbecause many fishing ports in Japan were washed out by the tsunami, and healthconcerns arose due to the nuclear accident in Fukushima. Similarly, the stock ofmeat (9(b)) fell after the earthquake. Notwithstanding the fall in product avail-ability, in both cases prices did not change much after the earthquake. Anothercategory where product availability fell was baby food (9(c)). However, in thiscase, the price increased sharply (for Japanese standards) about a month after theearthquake, as product availability began to recover. Other categories, such as tea(9(d)), suffered only mild decreases in availability, while prices increased steadilyafter the shock.
Understanding the specific trends in each category of goods is beyond thescope of this paper, as many of the trends observed in these graphs may not berelated at all to the earthquake but rather to individual shocks and seasonalpatterns in each group. There are, however, two main trends that stand out fromthe previous analysis. First, the fall in product availability observed in the aggre-gate data affected the vast majority of categories, while prices remained stable onaverage. Second, there is significant heterogeneity across categories, particularly in
18See http://bit.ly/13HyNY4
6080
100
120
Ava
ilabi
lity
01−11 04−11 07−11 10−11Date
Product Availability
100
100.
510
110
1.5
102
Inde
x
Price Index
(a) Fresh Fish
8090
100
110
120
130
Ava
ilabi
lity
Product Availability
99.6
99.8
100
100.
210
0.4
100.
6In
dex
Price Index
(b) Meat
7080
9010
0A
vaila
bilit
y
100
100.
510
110
1.5
102
Inde
x
(c) Baby Food
8090
100
110
120
Ava
ilabi
lity
100
100.
510
110
1.5
102
102.
5In
dex
(d) Tea
01−11 04−11 07−11 10−11Date
01−11 04−11 07−11 10−11Date
01−11 04−11 07−11 10−11Date
01−11 04−11 07−11 10−11Date
01−11 04−11 07−11 10−11Date
01−11 04−11 07−11 10−11Date
01−11 04−11 07−11 10−11Date
Product Availability Price Index Product Availability Price Index
Figure 9. Japan: Categories
Note: In all cases the graph on the left is Availability, and the graph on the right is Price Index.
Review of Income and Wealth 2014
© 2014 International Association for Research in Income and Wealth
13

terms of pricing behaviors and their interaction with product availability afterthe earthquake. In the next section, we explore potential explanations for thesetrends.
6. Supply Shocks and Consumer Anger
It is not surprising to see items that go out of stock in the days after anearthquake: people get scared, demand for some basic goods rises suddenly, andretailers have no time to react either with prices or stocks. What is harder tounderstand is how the combination of large stockout and stable prices can persistfor many months.
One possibility is that retailers are unable to re-stock (and re-price) due to apersistent supply disruption. In particular, suppose that a retailer sets a simplemarkup over marginal cost, and that this marginal cost becomes known only at thetime when goods are purchased from the wholesaler. If the supply chain is brokenbecause of the earthquake, either because goods are not being produced or theycannot be transported, then the retailer will simply not be updating those prices atall. That is, this would be a setup where prices only change when new inventory isadded. The combination of a cost-based pricing strategy and a persistent supplyshock could therefore explain why so many goods remain out of stock and pricesdo not change for so long.19
Another possibility is that retailers are able to re-stock at a higher cost, butthey are unable to increase their own price due to fear of “customer anger.” If theycan not charge higher prices, they have less incentive to replace goods that havedisappeared from the stores.20
In macroeconomics, the importance of customer relationships and the effecton price changes goes back to the work of Okun (1981). Okun emphasized howfirms with repeated customer interactions may refrain from raising prices whenfacing increases in demand. The fear of antagonizing customers is also frequentlymentioned by retailers in surveys as a reason for not changing prices often (Blinderet al., 1998; Fabiani et al., 2006). More recent papers such as Renner and Tyran(2004) and Nakamura and Steinsson (2011) have focused on the existence of“customer markets” and their implications for price-setting decisions.
In the context of an earthquake, perhaps the most relevant theoretical litera-ture is the one that touches on aspects of “fairness” in pricing. The seminal paperby Kahneman et al. (1986) spurred a large literature that explores how consider-ations of fairness can affect perceptions of price changes. More recent theoreticalpapers such as Rotemberg (2005, 2011) provide models where consumers experi-ence disappointment with price changes that they consider “unfair,” ultimatelyaffecting the price-setting decisions of firms. In Rotemberg (2005) fairness consid-erations enter directly into the utility function. Consumers expect producers to
19A necessary condition is also that the prices of available goods should not be significantlyaffected by the lack of availability of related goods that disappear.
20It is possible, however, that there are indirect incentives to re-stock even when price changes arenot possible. For example, retailers may derive reputational advantages to being seen as a reliablesupplier. This would be consistent with “sensitive” good categories that experienced both stableavailability and prices after the earthquake, such as milk in Chile.
Review of Income and Wealth 2014
© 2014 International Association for Research in Income and Wealth
14
have a certain degree of altruism and form expectations about the size of pricechange that is acceptable. The level of altruism can change exogenously. Forexample, during a natural disaster consumers could simply expect retailers toreduce their margins and be more altruistic. This threshold of fairness can alsochange with the amount and quality of information available to consumers. Forexample, if consumers think that the retailer’s costs have increased, then they maytolerate higher price changes. This could, for example, explain why the prices ofperishable goods increased in Chile. After all, consumers can easily understandthat an earthquake will affect the supply of goods such as eggs and meat, but theymay not understand why the cost of easy-to-stock items such as pasta, powderedmilk, or baby food may be affected. In Rotemberg (2011), fairness is linked toregrets that customers have from not buying the good before a price increase. Inthe context of an earthquake, for example, consumers may regret not havingbought the products needed for an emergency kit. Similarly, perishable goodswould be less affected by regret considerations.21
Regardless of the specific mechanism taking place, natural disasters willtend to both cause significant supply disruptions and increase concerns aboutfairness. So the two explanations for the aggregate results described above areplausible and not mutually exclusive.22 However, we can learn more about theirrelative importance in each country by looking closely at some price-stickinessstatistics.
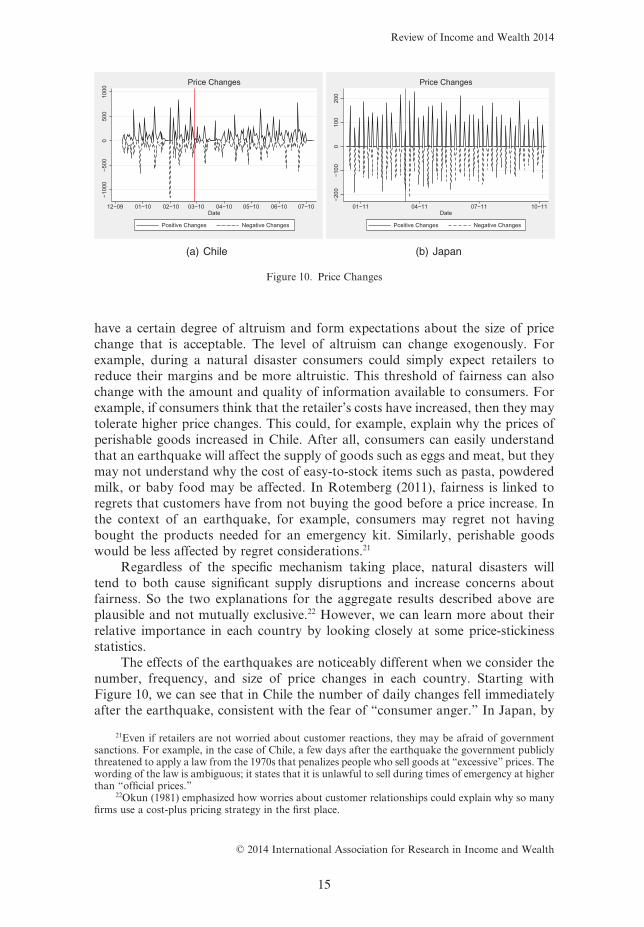
The effects of the earthquakes are noticeably different when we consider thenumber, frequency, and size of price changes in each country. Starting withFigure 10, we can see that in Chile the number of daily changes fell immediatelyafter the earthquake, consistent with the fear of “consumer anger.” In Japan, by
21Even if retailers are not worried about customer reactions, they may be afraid of governmentsanctions. For example, in the case of Chile, a few days after the earthquake the government publiclythreatened to apply a law from the 1970s that penalizes people who sell goods at “excessive” prices. Thewording of the law is ambiguous; it states that it is unlawful to sell during times of emergency at higherthan “official prices.”
22Okun (1981) emphasized how worries about customer relationships could explain why so manyfirms use a cost-plus pricing strategy in the first place.
−100
0−5
000
500
1000
12−09 01−10 02−10 03−10 04−10 05−10 06−10 07−10Date
Positive Changes Negative Changes
Price Changes
(a) Chile
−200
−100
010
020
0
01−11 04−11 07−11 10−11Date
Positive Changes Negative Changes
Price Changes
(b) Japan
Figure 10. Price Changes
Review of Income and Wealth 2014
© 2014 International Association for Research in Income and Wealth
15
contrast, there is little change in the number of price changes over time. About 100prices changed each week, both before and after the earthquake. The earthquakedid not change the number of prices that changed per week, even though it had alarge impact on the number of products available for sale.
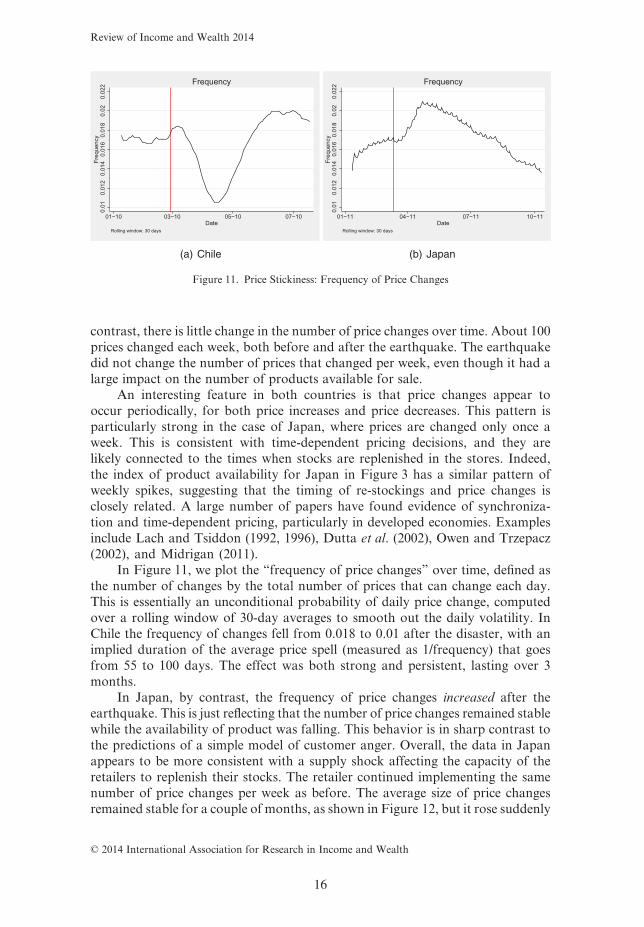
An interesting feature in both countries is that price changes appear tooccur periodically, for both price increases and price decreases. This pattern isparticularly strong in the case of Japan, where prices are changed only once aweek. This is consistent with time-dependent pricing decisions, and they arelikely connected to the times when stocks are replenished in the stores. Indeed,the index of product availability for Japan in Figure 3 has a similar pattern ofweekly spikes, suggesting that the timing of re-stockings and price changes isclosely related. A large number of papers have found evidence of synchroniza-tion and time-dependent pricing, particularly in developed economies. Examplesinclude Lach and Tsiddon (1992, 1996), Dutta et al. (2002), Owen and Trzepacz(2002), and Midrigan (2011).
In Figure 11, we plot the “frequency of price changes” over time, defined asthe number of changes by the total number of prices that can change each day.This is essentially an unconditional probability of daily price change, computedover a rolling window of 30-day averages to smooth out the daily volatility. InChile the frequency of changes fell from 0.018 to 0.01 after the disaster, with animplied duration of the average price spell (measured as 1/frequency) that goesfrom 55 to 100 days. The effect was both strong and persistent, lasting over 3months.
In Japan, by contrast, the frequency of price changes increased after theearthquake. This is just reflecting that the number of price changes remained stablewhile the availability of product was falling. This behavior is in sharp contrast tothe predictions of a simple model of customer anger. Overall, the data in Japanappears to be more consistent with a supply shock affecting the capacity of theretailers to replenish their stocks. The retailer continued implementing the samenumber of price changes per week as before. The average size of price changesremained stable for a couple of months, as shown in Figure 12, but it rose suddenly
0.01
0.01
20.
014
0.01
60.
018
0.02
0.02
2Fr
eque
ncy
01−10 03−10 05−10 07−10Date
Rolling window: 30 days
Frequency
(a) Chile
0.01
0.01
20.
014
0.01
60.
018
0.02
0.02
2Fr
eque
ncy
01−11 04−11 07−11 10−11Date
Rolling window: 30 days
Frequency
(b) Japan
Figure 11. Price Stickiness: Frequency of Price Changes
Review of Income and Wealth 2014
© 2014 International Association for Research in Income and Wealth
16

in June 2011, probably reflecting increases in wholesale prices that were beingpassed-on to consumers after months of delays.23
The idea that Japan suffered a persistent supply shock is intuitive given theFukushima nuclear disaster that followed the earthquake. Indeed, in a recentpaper Weinstein and Schell (2012) argue that the 2011 earthquake in Japan causeda much larger and persistent contraction of industrial production than previousearthquakes, and show that this was directly linked to the reduction in energyproduction. Could this have affected product availability? The evidence inFigure 13, where we plot our index of product availability and the official index ofindustrial production in both countries, suggests it did. In Japan, there is a sur-prising co-movement between both indices. Industrial production fell by 15percent in the month after the earthquake, and recovered at a very similar rate asour product availability index over time. By contrast, industrial production in
23This is consistent with standard menu cost models, such as Mankiw (1985), where small pricechanges are not optimal. In the presence of an adjustment cost, prices remain fixed until the accumu-lated difference with the optimal price becomes large enough to cover it.
1416
1820
Siz
e (%
)
01−10 03−10 05−10 07−10Date
Rolling window: 30 days
Size of Changes
(a) Chile
46
810
12S
ize
(%)
01−11 04−11 07−11 10−11Date
Rolling window: 30 days
Size of Changes
(b) Japan
Figure 12. Mean Size of Price Changes
7080
9010
011
0
12−09 02−10 04−10 06−10 08−10Date
Product Availability Industrial Production (sa)
Product Availability and Industrial Production
(a) Chile
7080
9010
011
0
01−11 04−11 07−11 10−11Date
Product Availability Industrial Production (sa)
Product Availability and Industrial Production
(b) Japan
Figure 13. Availability and Industrial Production
Review of Income and Wealth 2014
© 2014 International Association for Research in Income and Wealth
17

Chile, although negatively affected by the earthquake, recovered quickly to itsprevious level within a couple of months.
7. Survival Analysis
In Section 4 we showed that the immediate effects of the natural disaster weremostly in product availability, not in prices. Section 5 shows that this applies tomost categories of goods. We now extend the analysis to study good-level effectsof price changes and stockout. Our objective is to estimate the “Hazard Rate” ofprice changes (or stockout). This is the probability of a price change (or stockout)conditional on the number of days since the natural disaster. We want to under-stand if, at the good level, there is evidence that the hazard rate of stockoutdecreases with time after the disaster, while the hazard rate of price changesincreases. We also want to see if goods that are considered necessities after anearthquake (e.g., those in a typical emergency kit) tend to behave differently interms of their good-level hazards.
To measure hazard rates, we use standard methods in Survival Analysis, atechnique that focuses on the time elapsed from the “onset of risk” until theoccurrence of a “failure” event. In our context, the “risk” starts on the day of thenatural disaster, and the “failure” is a stockout (or a price change). Formally, if T isa random variable measuring the duration of the price spell, with density functionf(t) and cumulative density F(t), the hazard h(t) is the limiting probability that afailure occurs at time t, conditional on the days passed since the natural disaster:
(1) h tt T t t t T
tt( ) lim
Pr( | ).= < < + <
→Δ
ΔΔ0
The hazard measures the instantaneous risk of a stockout over time, condi-tional on survival until that day. To estimate it, we use a non-parametric approachfrom Nelson (1972) and Aalen (1978), which does not require any distributionalassumptions.24 It starts with a simple estimate of the cumulative hazard functionH(t), given by:
(2) ˆ ( )|
H tc
nj
jj t tj
= ∑�
where cj is the number of failures at time tj and nj is the number of goods that canstill fail at time tj. The incremental steps cj/nj are an estimate for the probability offailure at tj, taking into account only those goods that have survived until thatpoint in time. Unlike the product availability index in previous sections, the hazardrate for stockout will therefore not consider goods that are new after theearthquake (goods that were not available for sale before the earthquake, but thatappear some time later). This allows us to isolate the effects of the earthquake ongoods that existed at the time of the disaster.
24Results are robust to the use of a semi-parametric Cox model that can incorporate covariates andaccount for unobserved heterogeneity at the category level.
Review of Income and Wealth 2014
© 2014 International Association for Research in Income and Wealth
18

To obtain the smoothed hazard function ˆ( )h t , we take the discrete changes inˆ ( )H t and weight them using a kernel function:
(3) ˆ( ) ˆ ( )h tb
Kt t
bH tj
jj D
=−⎛
⎝⎜⎞⎠⎟∈
∑1 Δ
where K is a symmetric kernel density, b is the smoothing bandwidth, and D is theset of times with failures.
We conduct the analysis separately for price changes and stockout. Only thefirst occurrence of each of the failure events is considered for each good. That is,a good that disappears from the store at time t will not be used to compute thestockout hazard rate from then on, even if it reappears later. This is a fairassumption because any subsequent stockout will not likely be linked to thenatural disaster itself. Similarly, if a good has a price change after the naturaldisaster at time t, it will drop from our price-change hazard estimates from thenon. We are implicitly assuming that the retailers fully adjust to the earthquake atthe time when the first price change is implemented. An alternative assumptionwould be that retailers adjust gradually, implementing a series of small pricechanges over time. We do not, however, find any evidence of this behavior inthis data.
Figures 14 and 15 plot the estimated hazard functions with 95 percent confi-dence intervals for both countries. In all cases, we include a horizontal line at theunconditional probability over the sample period.
These hazards show that the daily probability of going out of stock immedi-ately after the earthquake was close to 0.8 percent in both countries (approxi-mately 20 percent in a month). This is significantly higher than the unconditionaldaily probability 0.3 percent per day in Chile (9 percent per month) and 0.4 percentin Japan (12 percent per month). This initial similarity between countries disap-pears after the first week. In Chile the stockout hazard falls gradually. The longerthe amount of time since the disaster, the lower the probability a good has ofdisappearing from the store. The effect is persistent, with the stockout hazardremaining above the unconditional probability until around 90 days.
00.
002
0.00
40.
006
0.00
8
0 50 100 150Days since Natural Disaster
Smoothed Hazard FunctionProbability of Stockout − Chile
(a) Stockout Hazard
00.
020.
040.
060.
08
0 50 100 150Days since Natural Disaster
Smoothed Hazard FunctionProbability of Price Change − Chile
(b) Price-Change Hazard
Figure 14. Hazards in Chile
Review of Income and Wealth 2014
© 2014 International Association for Research in Income and Wealth
19

In Japan the stockout hazard falls much quicker and starts to increase again50 days after the disaster, as seen in Figure 15. Most of the stockout risk happenswithin a narrow window of time. If a good does not disappear quickly from thestore, then it is not very likely to disappear at all. Once again, this result isconsistent with disruptions in the supply chain. Those goods that managed toremain in stock are likely the goods that did not have any supply-chain problemsto begin with, and therefore the retailer can keep them in stock over time.
The price change hazards in both countries start at similarly low levels imme-diately after the earthquake, around 0.01 percent (an implied duration of 100days). This level represents a significant drop in Chile compared to the uncondi-tional daily probability of 0.018 percent (an implied duration of 55 days), but onlya small drop for Japan, where prices are usually stickier and the unconditionalprobability is 0.014 percent (an implied duration of 75 days). From then on, thesehazard rates remain low for several months in both countries, reflecting the reluc-tance of these retailers to make any price changes at all.
We can also compute hazards for different types of goods and see if there areany differences for “Emergency” products and “Perishable” goods, as suggestedby the results in Section 5. We do this only for Chile, were we have more detailedcategory information to classify goods into these two groups. Emergency productsare those listed by the Chilean government as part of a suggested emergency kit incase of natural disasters.25
Customer anger theories tend to have different predictions about the post-earthquake behavior of these two types of goods. The probability of a price changeshould be lower for emergency goods immediately after an earthquake (becausepeople consider increases to be unfair), while the probability of a stockout shouldbe higher (they are in high demand and their prices are not rising). Perishableitems, by contrast, are the type of goods that are not likely to experience such a bigdemand shock and consumers would be more likely to consider price increases asfair (either because it is easier to understand that the cost to supply things like freshvegetables goes up after an earthquake, or because people may actually experience
25See http://www.onemi.cl/kit-de-emergencia.html
0.00
20.
004
0.00
60.
008
0 50 100 150 200Days since Natural Disaster
Smoothed Hazard FunctionProbability of Stockout − Japan
(a) Stockout Hazard
0.01
0.02
0.03
0.04
0 50 100 150 200Days since Natural Disaster
Smoothed Hazard FunctionProbability of Price Change − Japan
(b) Price-Change Hazard
Figure 15. Hazards in Japan
Review of Income and Wealth 2014
© 2014 International Association for Research in Income and Wealth
20

less regret for not buying them before the earthquake). This is exactly what we findin Figure 16 for the earthquake in Chile.
Finally, while these hazard rates provide evidence on the likelihood of bothstockout and price changes ocurring as time from the earthquake increases, theydo not directly link goods that had stockout with those that had price changes.26
To examine this, we compute (on a monthly basis) the share of price increases,price decreases, or identical prices on the day of reintroduction. Results are shownin Figure 17.27
In both countries the vast majority of goods that went out stock after theearthquake, and later reappeared, did so at exactly the same price they had before
26For example, the price change hazards in Figures 14(b) and 15(b) include observations fromgoods that had stockouts and those that did not. An interesting question is what happens to prices ofgoods that go out of stock once they are reintroduced at the stores.
27We use only goods that were available on the day of the earthquake, go out of stock later on, andreappear at some point during our sample period. To avoid the effects of potential scraping errors, werequired goods to disappear from the database for at least 3 days before we consider them as having astockout.
00.
002
0.00
40.
006
0.00
80.
01
0 50 100 150Days since Natural Disaster
All Emergency Perishable
Smoothed Hazard FunctionProbability of Stockout − Chile
(a) Stockout Hazards
00.
020.
040.
06
0 50 100 150Days since Natural Disaster
All Emergency Perishable
Smoothed Hazard FunctionProbability of Price Change − Chile
(b) Price-Change Hazard
Figure 16. Perishable and Emergency Goods in Chile
00.
20.
40.
60.
8P
rob
12−09 02−10 04−10 06−10 08−10Date
Increase Decrease SameProb. Increase: 0.19 − Prob. Decrease: 0.13 − Prob. Same: 0.682137 Introductions of 5479 Discontinuities after the Earthquake.
Probability of Price Change at Re−Stocking (30−Day Window)Conditional to Post−Earthquake Stockout
Chile
(a) Chile
00.
20.
40.
60.
81
Pro
b
01−11 04−11 07−11 10−11Date
Increase Decrease SameProb. Increase: 0.09 − Prob. Decrease: 0.03 − Prob. Same: 0.88693 Introductions of 1103 Discontinuities after the Earthquake.
Probability of Price Change at Re−Stocking (30−Day Window)Conditional to Post−Earthquake Stockout
Japan
(b) Japan
Figure 17. Prices at time of Re-Stocking
Review of Income and Wealth 2014
© 2014 International Association for Research in Income and Wealth
21

(collapsing the time series, we find that 67 percent of reintroductions had identicalprices in Chile and 87 percent in Japan). This suggests that either wholesale pricesdid not increase, or the retailers were not able or willing to pass-through any highercosts to consumers immediately upon re-stocking.28
8. Conclusions
We study the aggregate behavior of prices and product availability in theaftermath of two recent catastrophic natural disasters: the 2010 earthquake inChile and the 2011 earthquake in Japan. We show, that in both cases, the marginof adjustment during the disaster was in product availability, not prices. We findthat this is consistent with the expected response in the context of “customeranger” models, such as Rotemberg (2005), particularly in Chile, where the fre-quency of price changes fell significantly after the earthquake. In Japan, we findevidence more closely linked to supply disruption and the retailer’s inability tore-stock items than pricing behavior linked to consumer anger.
Our metrics capture the effects of both demand and supply conditions. Thedemand shock is associated with the needs and fears that people experience in theimmediate aftermath of the disaster. Goods that disappear quickly from the storesare mostly non-perishable items that people are likely to hoard in fear of futuresupply disruptions. The supply shock affects the ability of retailers to replenishtheir stocks over time, even after the initial spike in demand dissipates. In somecases, as we showed for Japan, product availability disruptions could serve as earlyindicators of the magnitude of industrial production changes.
Online data have many advantages in the context of natural disasters. Datacan be collected remotely, in real time, and without requiring any resources fromthe retailers involved. But there are also important limitations. Relatively fewretailers and categories of goods are currently available online, particularly in poorcountries. Even when retailers are online, their servers could stop operating duringnatural disasters, so there is no way to scrape data. In other cases, retailers maysimply stop updating prices and stock information online, voluntarily suspendingtheir online service during the time of the disaster. The reliability of online datasources under extreme circumstances needs to be determined, and will likelydepend on the country and context under which the natural disaster occurs.
References
Aalen, O., “Nonparametric Inference for a Family of Counting Processes,” Annals of Statistics, 6,701–26, 1978.
Bils, M. and P. J. Klenow, “Some Evidence on the Importance of Sticky Prices,” Journal of PoliticalEconomy, 112, 947–85, 2004.
Blinder, A., E. Canetti, D. Lebow, and J. Rudd, “Asking about Prices: A New Approach to Under-standing Price Stickiness,” Russell Sage Foundation, New York, 1998.
Cavallo, A., “Scraped Data and Sticky Prices,” MIT Sloan Working Paper, 2012.Cavallo, E., A. Powell, and O. Becerra, “Estimating the Direct Economic Damages of the Earthquake
in Haiti,” Economic Journal, 120, F298–312, 2010.
28The size of price changes in Japan did increase considerably in June 2011, as shown in Figure 12.However, these were price changes from goods that were already in stock at the time.
Review of Income and Wealth 2014
© 2014 International Association for Research in Income and Wealth
22
Dutta, S., M. Bergen, and D. Levy, “Price Flexibility in Channels of Distribution: Evidence fromScanner Data,” Journal of Economic Dynamics and Control, 26, 1845–900, 2002.
Fabiani, S., M. Durant, I. Hernando, C. Kwapil, and B. Landau, “What Firms’ Surveys Tell us aboutPrice-Setting Behaviour in the Euro Area,” International Journal of Central Banking, 2, 3–47, 2006.
Gagnon, E. and J. D. Lopez-Salido, “Small Price Responses to Large Demand Shocks,” Finance andEconomics Discussion Series 2014–18, Board of Governors of the Federal Reserve System (U.S.),2014.
Kahneman, D., J. L. Knetsch, and R. Thaler, “Fairness as a Constraint on Profit Seeking: Entitlementsin the Market,” American Economic Review, 76, 728–41, 1986.
Kashyap, A. K., “Sticky Prices: New Evidence from Retail Catalogues,” Quarterly Journal of Econom-ics, 110, 245–74, 1995.
Lach, S. and D. Tsiddon, “The Behavior of Prices and Inflation: An Empirical Analysis of Disaggre-gated Price Data,” Journal of Political Economy, 100, 349–89, 1992.
———, “Staggering and Synchronization in Price-Setting: Evidence from Multiproduct Firms,”American Economic Review, 86, 1175–96, 1996.
Levy, D., M. Bergen, S. Dutta, and R. Venable, “The Magnitude of Menu Costs: Direct Evidence fromLarge U.S. Supermarket Chains,” Quarterly Journal of Economics, 112, 791–825, 1997.
Mankiw, N. G., “Small Menu Costs and Large Business Cycles: A Macroeconomic Model,” QuarterlyJournal of Economics, 100, 529–38, 1985.
Midrigan, V., “Menu Costs, Multiproduct Firms, and Aggregate Fluctuations,” Econometrica, 79,1139–80, 2011.
Nakamura, E. and J. Steinsson, “Five Facts about Prices: A Reevaluation of Menu Cost Models,”Quarterly Journal of Economics, 123, 1415–64, 2008.
———, “Price Setting in Forward-Looking Customer Markets,” Journal of Monetary Economics, 58,220–33, 2011.
Nelson, W., “Theory and Applications of Hazard Plotting for Censored Failure Data,” Technometrics,14, 945–66, 1972.
Okun, A. M., Prices and Quantity: A Macroeconomic Analysis, Brookings Institution Press, Washing-ton DC, 1981.
Owen, A. and D. Trzepacz, “Menu Costs, Firm Strategy, and Price Rigidity,” Economics Letters, 76,345–49, 2002.
Renner, E. and J-R. Tyran, “Price Rigidity in Customer Markets,” Journal of Economic Behavior &Organization, 55, 575–93, 2004.
Rotemberg, J., “Customer Anger at Price Increases, Changes in the Frequency of Price Adjustment andMonetary Policy,” Journal of Monetary Economics, 52, 829–52, 2005.
Rotemberg, J. J., “Fair Pricing,” Journal of the European Economic Association, 9, 952–81, 2011.Weinstein, D. E. and M. K. Schell, “Evaluating the Economic Response to Japan’s Earthquake,”
RIETI Policy Discussion Paper Series 12-P-003, 2012.
Supporting Information
Additional Supporting Information may be found in the online version of this article at thepublisher’s web-site:
A: Appendix
Review of Income and Wealth 2014
© 2014 International Association for Research in Income and Wealth
23


![340]) - Cavallo](https://img.pdfslide.net/doc/110x75/61a18cb563d60e08cd7db997/340-cavallo.jpg)