Embed Size (px)
Citation preview
NTPC, Simhadri, 4X500MW, Visakhapatnam, Andhra Pradesh
Unit Capacity Year of Comml
Power Share
AP TN Kar Ker Pud
Unit-1 500 MW Sep 2002 100% X X X X
Unit-2 500 MW Mar 2003 100% X X X X
Unit-3 500 MW Sep 2011 45.8% 22.8% 20.4% 9.2% 1.8%
Unit-4 500 MW Sep 2012 45.8% 22.8% 20.4% 9.2% 1.8%

This region is suffering from power starvation...
“Customer demanded, we want power and we want it now.”
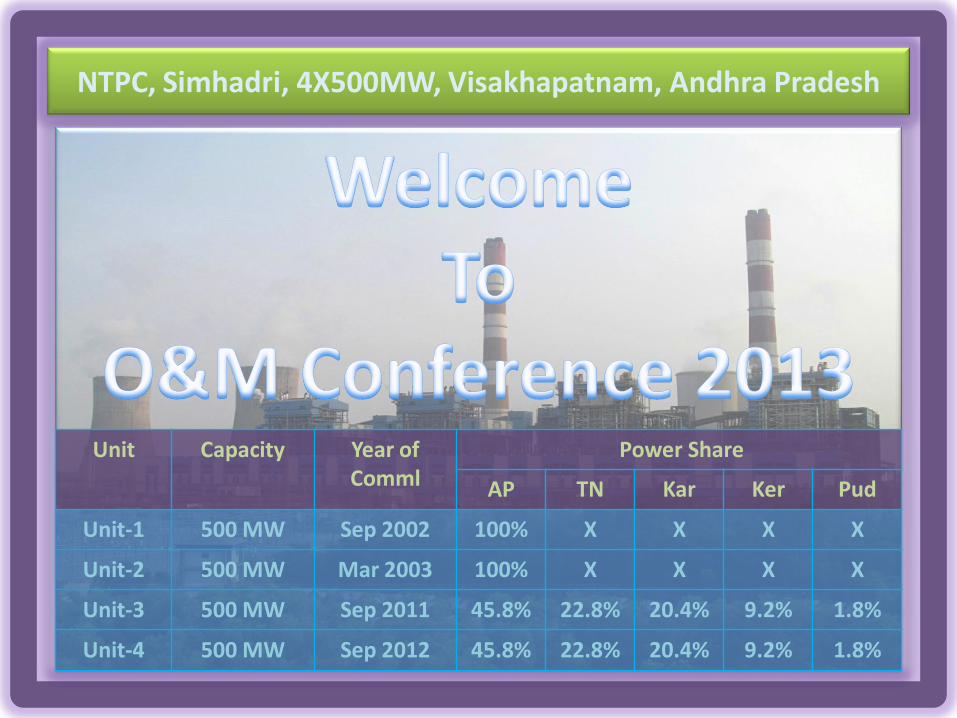
Generation Loss due to Coal Shortage
498.55
47.86
3.43
87.85
0
67.43
97.49 116.35
53.45 51.03 62.41
51.166
638.47
0.00
100.00
200.00
300.00
400.00
500.00
600.00
700.00
Gen Loss due to Coal Shortage (MU)
Station
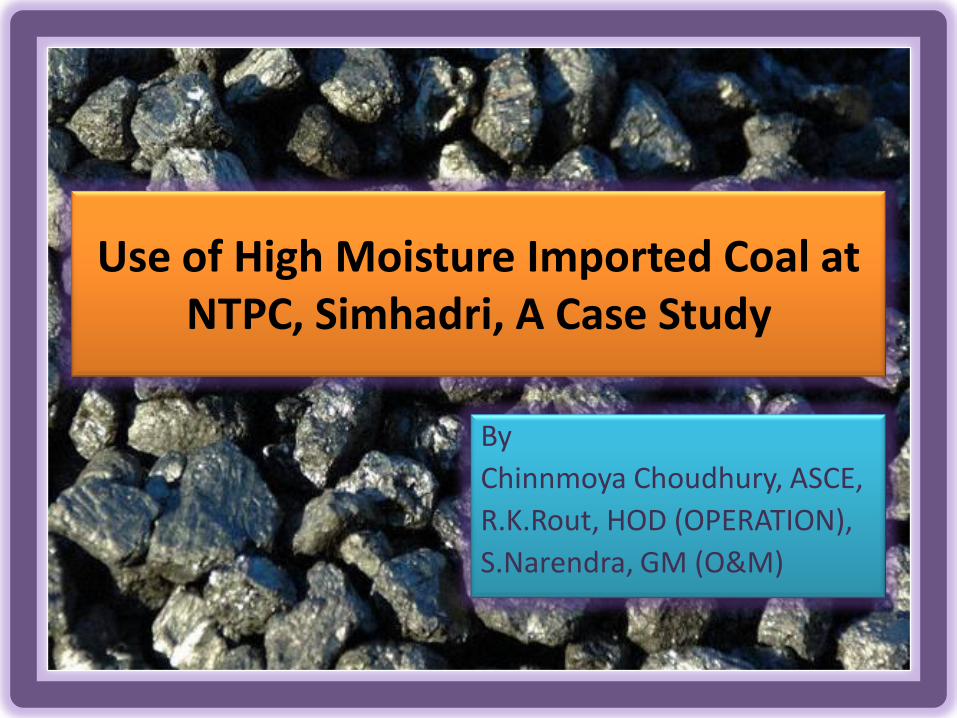
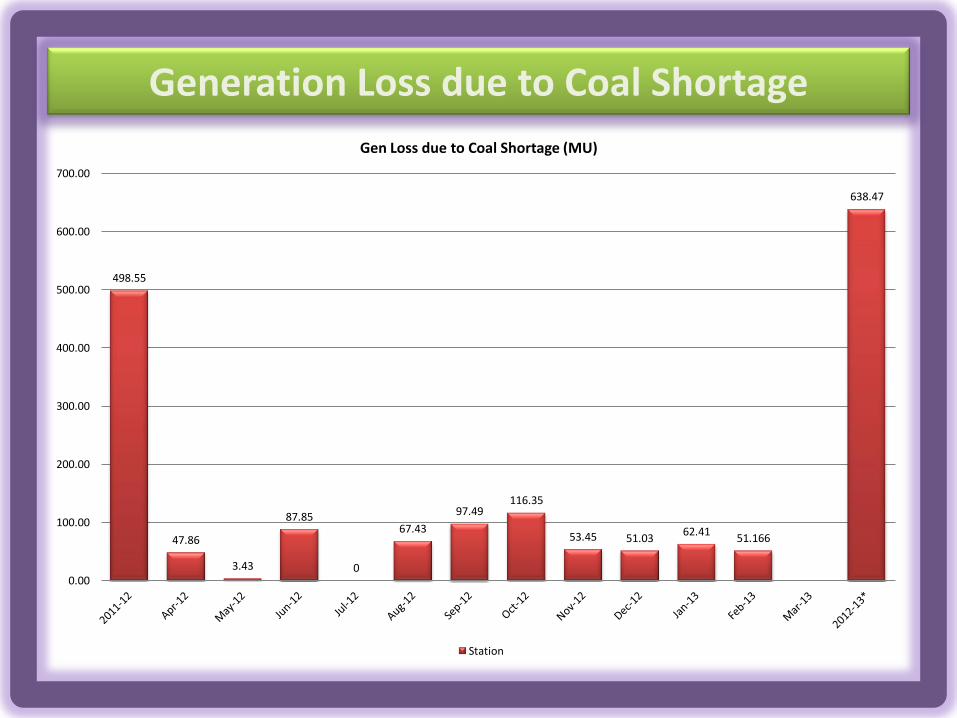
Use of High Moisture Imported Coal at NTPC, Simhadri, A Case Study
By
Chinnmoya Choudhury, ASCE,
R.K.Rout, HOD (OPERATION),
S.Narendra, GM (O&M)
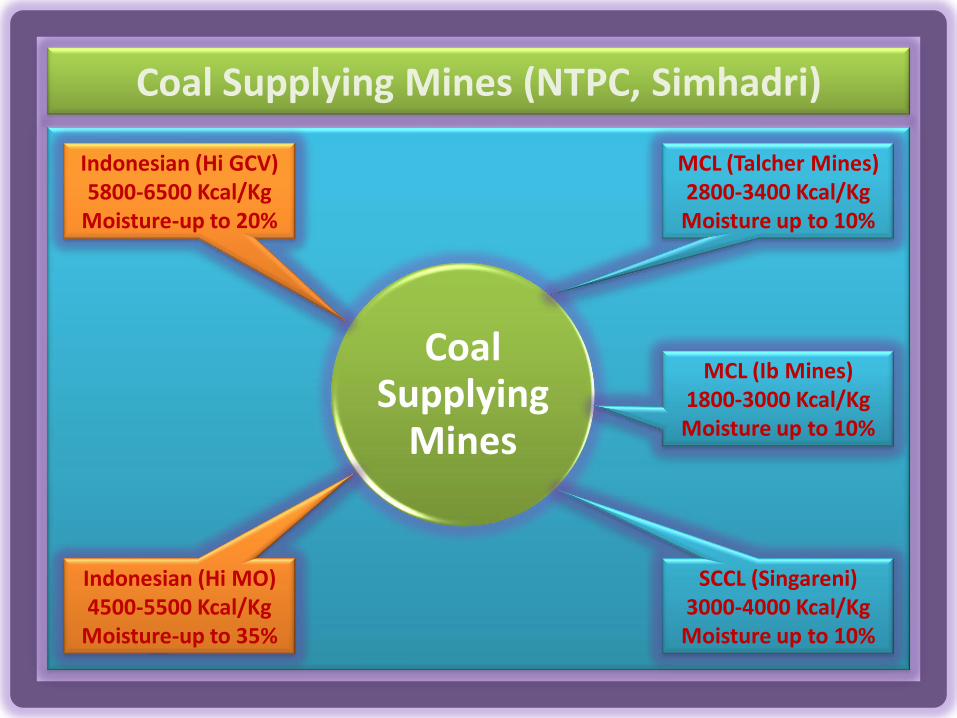
Coal Supplying Mines (NTPC, Simhadri)
Coal Supplying
Mines
MCL (Talcher Mines) 2800-3400 Kcal/Kg Moisture up to 10%
MCL (Ib Mines) 1800-3000 Kcal/Kg Moisture up to 10%
SCCL (Singareni) 3000-4000 Kcal/Kg Moisture up to 10%
Indonesian (Hi GCV) 5800-6500 Kcal/Kg
Moisture-up to 20%
Indonesian (Hi MO) 4500-5500 Kcal/Kg
Moisture-up to 35%
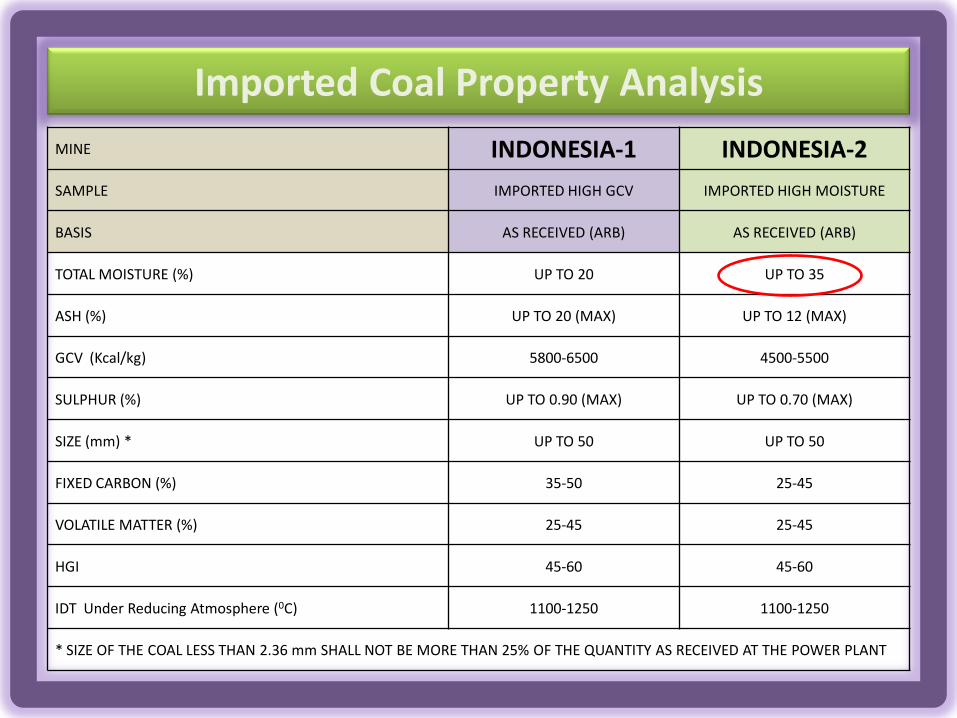
Imported Coal Property Analysis
MINE INDONESIA-1 INDONESIA-2
SAMPLE IMPORTED HIGH GCV IMPORTED HIGH MOISTURE
BASIS AS RECEIVED (ARB) AS RECEIVED (ARB)
TOTAL MOISTURE (%) UP TO 20 UP TO 35
ASH (%) UP TO 20 (MAX) UP TO 12 (MAX)
GCV (Kcal/kg) 5800-6500 4500-5500
SULPHUR (%) UP TO 0.90 (MAX) UP TO 0.70 (MAX)
SIZE (mm) * UP TO 50 UP TO 50
FIXED CARBON (%) 35-50 25-45
VOLATILE MATTER (%) 25-45 25-45
HGI 45-60 45-60
IDT Under Reducing Atmosphere (0C) 1100-1250 1100-1250
* SIZE OF THE COAL LESS THAN 2.36 mm SHALL NOT BE MORE THAN 25% OF THE QUANTITY AS RECEIVED AT THE POWER PLANT
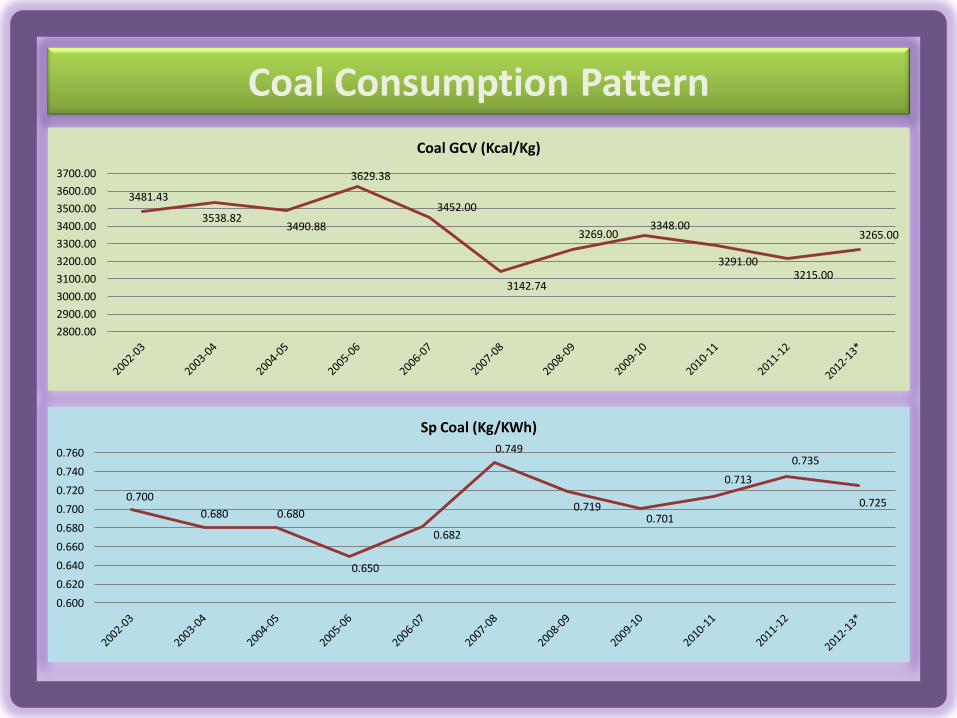
Coal Consumption Pattern
3481.43
3538.82 3490.88
3629.38
3452.00
3142.74
3269.00 3348.00
3291.00 3215.00
3265.00
2800.00
2900.00
3000.00
3100.00
3200.00
3300.00
3400.00
3500.00
3600.00
3700.00
Coal GCV (Kcal/Kg)
0.700
0.680 0.680
0.650
0.682
0.749
0.719 0.701
0.713
0.735
0.725
0.600
0.620
0.640
0.660
0.680
0.700
0.720
0.740
0.760
Sp Coal (Kg/KWh)

Coal Pricing...
₹ 2
,718
.00
₹ 1
,880
.00
₹ 1
,810
.00
₹ 3
,506
.00
₹ 5,000.00
₹ 3
,600
.00
₹ 3
,283
.00
₹ 0.00
₹ 1,000.00
₹ 2,000.00
₹ 3,000.00
₹ 4,000.00
₹ 5,000.00
₹ 6,000.00
2012-13
Coal Cost As Fired
Landed Coal Cost (Talcher)
Landed Coal Cost (Ib)
Landed Coal Cost (SCCL)
Landed Coal Cost (Hi GCV Imported)
Landed Coal Cost (Hi MO Imported)
E Procured Coal Cost (Talcher)
₹ 2,093.00 ₹ 1,917.00
₹ 2,043.00
₹ 2,718.00
₹ 1,500.00
₹ 1,700.00
₹ 1,900.00
₹ 2,100.00
₹ 2,300.00
₹ 2,500.00
₹ 2,700.00
₹ 2,900.00
2009-10 2010-11 2011-12 2012-13
Cost of Coal as Fired
Landed Coal Cost (CAF)

Precautions Taken...
Imported Coal mix to a Max of 10% and Bunkering in Mills A to F
Mill O/L temp at 70 0C
Mill I/L temp at 300 0C
Excess Air to maintain Eco O/L Oxygen at 3.0-3.5%
Close Observation of 10.5 Mtr. Peep Holes
Timely Bottom Deashing
Blending of Imported Coal only with MCL Coal (no SCCL Coal)
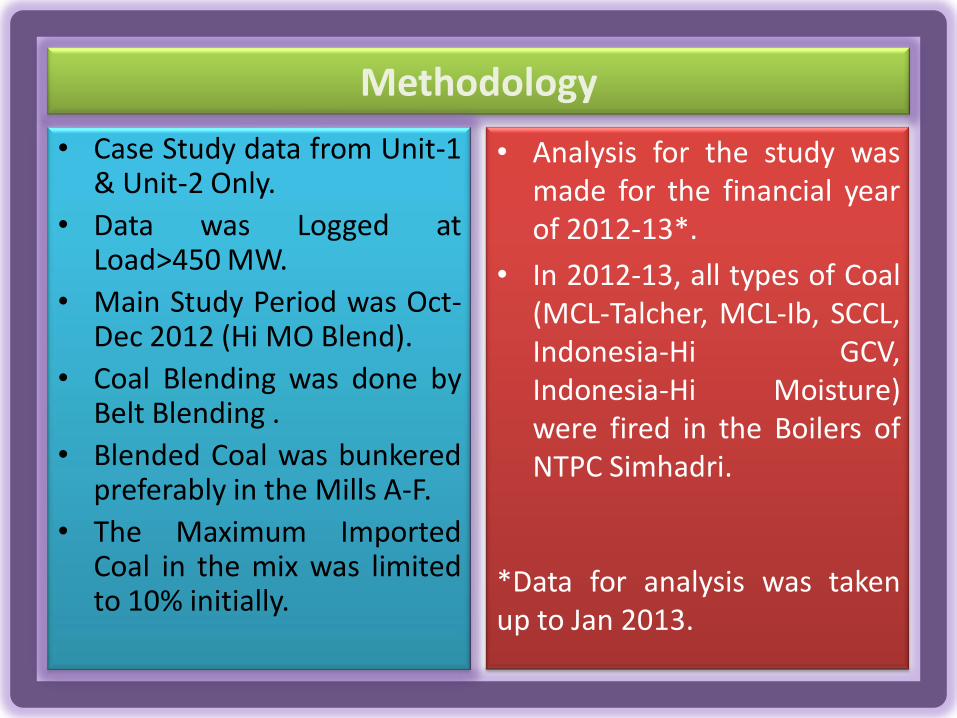
Methodology
• Case Study data from Unit-1 & Unit-2 Only.
• Data was Logged at Load>450 MW.
• Main Study Period was Oct-Dec 2012 (Hi MO Blend).
• Coal Blending was done by Belt Blending .
• Blended Coal was bunkered preferably in the Mills A-F.
• The Maximum Imported Coal in the mix was limited to 10% initially.
• Analysis for the study was made for the financial year of 2012-13*.
• In 2012-13, all types of Coal (MCL-Talcher, MCL-Ib, SCCL, Indonesia-Hi GCV, Indonesia-Hi Moisture) were fired in the Boilers of NTPC Simhadri.
*Data for analysis was taken up to Jan 2013.
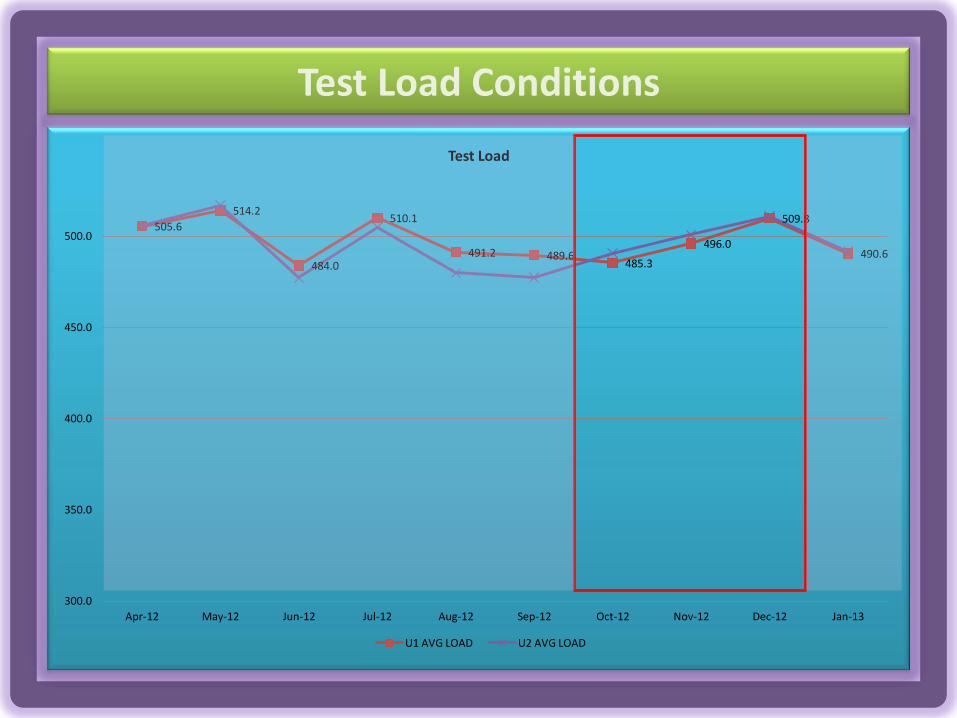
Test Load Conditions
505.6
514.2
484.0
510.1
491.2 489.6 485.3
496.0
509.8
490.6
300.0
350.0
400.0
450.0
500.0
Apr-12 May-12 Jun-12 Jul-12 Aug-12 Sep-12 Oct-12 Nov-12 Dec-12 Jan-13
Test Load
U1 AVG LOAD U2 AVG LOAD
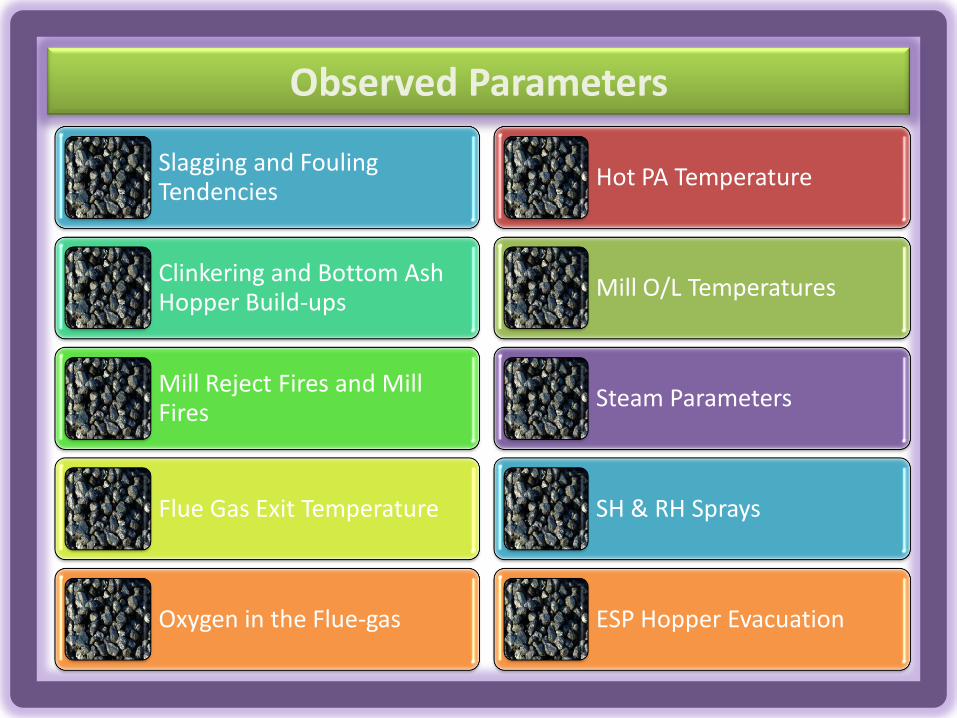
Observed Parameters
Slagging and Fouling Tendencies
Clinkering and Bottom Ash Hopper Build-ups
Mill Reject Fires and Mill Fires
Flue Gas Exit Temperature
Oxygen in the Flue-gas
Hot PA Temperature
Mill O/L Temperatures
Steam Parameters
SH & RH Sprays
ESP Hopper Evacuation
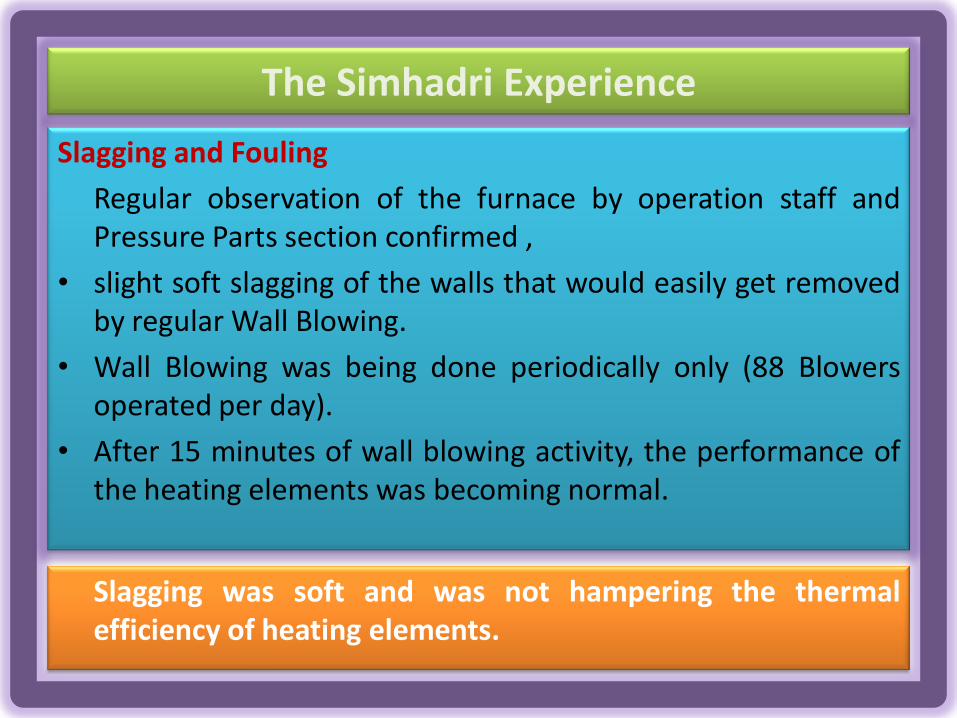
The Simhadri Experience
Slagging and Fouling
Regular observation of the furnace by operation staff and Pressure Parts section confirmed ,
• slight soft slagging of the walls that would easily get removed by regular Wall Blowing.
• Wall Blowing was being done periodically only (88 Blowers operated per day).
• After 15 minutes of wall blowing activity, the performance of the heating elements was becoming normal.
Slagging was soft and was not hampering the thermal efficiency of heating elements.
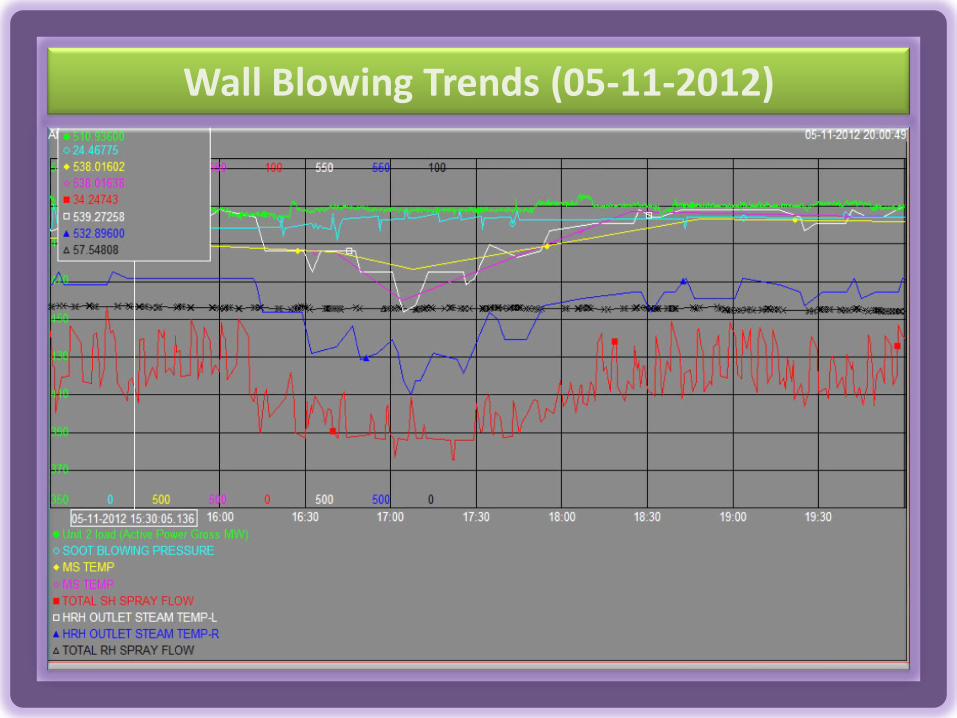
Wall Blowing Trends (05-11-2012)
The Simhadri Experience
Clinkering
• In the months of Oct to Dec 2012, there was not even a single reported case of Bottom Ash Hopper Build-up and Clinker Grinder over-load i.e. clinkering, in all the running Units, at NTPC, Simhadri.
Clinkering was not Observed while firing Indonesian Imported Coal even at blending ratios of 30%.
The Simhadri Experience
Mill Reject Problems
• The average Mill Reject Problems encountered while using Hi GCV Indonesian Coal with MCL Coal was 0.6 per day per unit.
• The average Mill Reject Problems for the period of Oct to Dec 2012 came down to as low as 0.2 per day per unit when Hi Moisture Imported Coal was blended with Indian MCL Coal.
Mill Reject Problems were less and Boiler ‘0”mtr area housekeeping was quite Improved.
The Simhadri Experience
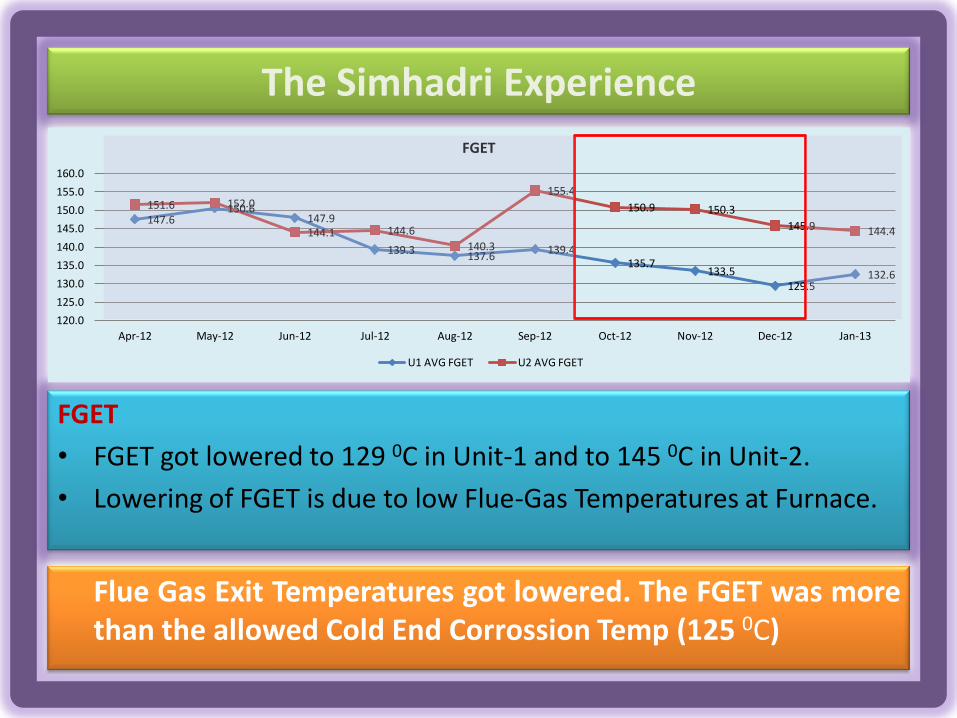
FGET
• FGET got lowered to 129 0C in Unit-1 and to 145 0C in Unit-2.
• Lowering of FGET is due to low Flue-Gas Temperatures at Furnace.
147.6 150.6
147.9
139.3 137.6
139.4 135.7
133.5 129.5
132.6
151.6 152.0
144.1 144.6
140.3
155.4
150.9 150.3
145.9 144.4
120.0
125.0
130.0
135.0
140.0
145.0
150.0
155.0
160.0
Apr-12 May-12 Jun-12 Jul-12 Aug-12 Sep-12 Oct-12 Nov-12 Dec-12 Jan-13
FGET
U1 AVG FGET U2 AVG FGET
Flue Gas Exit Temperatures got lowered. The FGET was more than the allowed Cold End Corrossion Temp (125 0C)
The Simhadri Experience
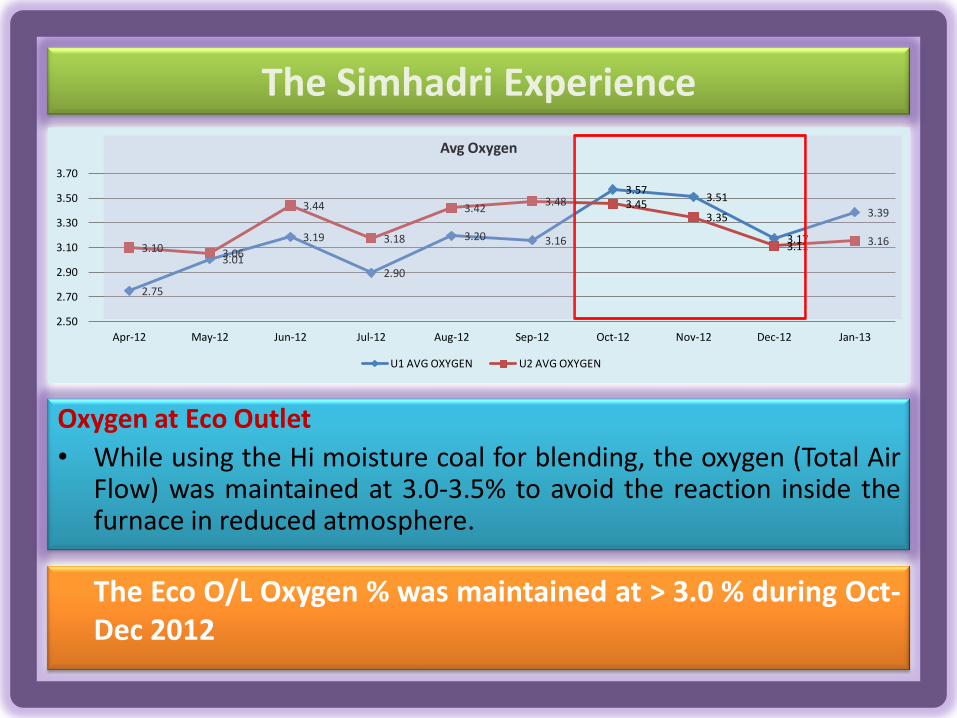
Oxygen at Eco Outlet
• While using the Hi moisture coal for blending, the oxygen (Total Air Flow) was maintained at 3.0-3.5% to avoid the reaction inside the furnace in reduced atmosphere.
2.75
3.01
3.19
2.90
3.20 3.16
3.57 3.51
3.17
3.39
3.10 3.06
3.44
3.18
3.42 3.48 3.45
3.35
3.11 3.16
2.50
2.70
2.90
3.10
3.30
3.50
3.70
Apr-12 May-12 Jun-12 Jul-12 Aug-12 Sep-12 Oct-12 Nov-12 Dec-12 Jan-13
Avg Oxygen
U1 AVG OXYGEN U2 AVG OXYGEN
The Eco O/L Oxygen % was maintained at > 3.0 % during Oct-Dec 2012

The Simhadri Experience
Hot PA Temp • The Hot PA temperature in both Unit-1 and Unit-2 was more or less
stable. • The marginal increasing in Unit-2 may be due to certain degree of
fouling caused due to prolonged operation and nearing O/H.
321.2
325.8
319.8
313.2
307.7 310.0
304.9 306.3 306.6 307.1
313.9
319.1
304.8 303.5
292.5
307.8 308.5
313.7 314.2 310.4
290.0
295.0
300.0
305.0
310.0
315.0
320.0
325.0
330.0
Apr-12 May-12 Jun-12 Jul-12 Aug-12 Sep-12 Oct-12 Nov-12 Dec-12 Jan-13
Hot PA Temp
U1 AVG HOT PA TEMP U2 AVG HOT PA TEMP
The Hi Moisture Coal has made PA Header Temperatures Stable.
The Simhadri Experience
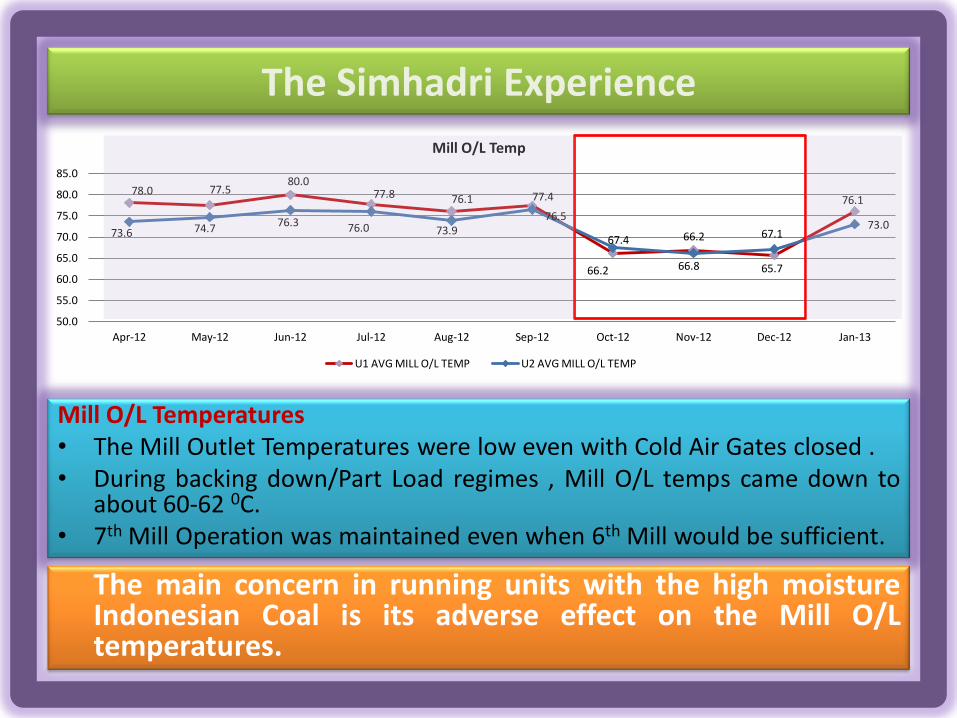
Mill O/L Temperatures • The Mill Outlet Temperatures were low even with Cold Air Gates closed . • During backing down/Part Load regimes , Mill O/L temps came down to
about 60-62 0C. • 7th Mill Operation was maintained even when 6th Mill would be sufficient.
The main concern in running units with the high moisture Indonesian Coal is its adverse effect on the Mill O/L temperatures.
78.0 77.5 80.0
77.8 76.1 77.4
66.2 66.8 65.7
76.1
73.6 74.7 76.3 76.0 73.9 76.5
67.4 66.2 67.1 73.0
50.0
55.0
60.0
65.0
70.0
75.0
80.0
85.0
Apr-12 May-12 Jun-12 Jul-12 Aug-12 Sep-12 Oct-12 Nov-12 Dec-12 Jan-13
Mill O/L Temp
U1 AVG MILL O/L TEMP U2 AVG MILL O/L TEMP
The Simhadri Experience
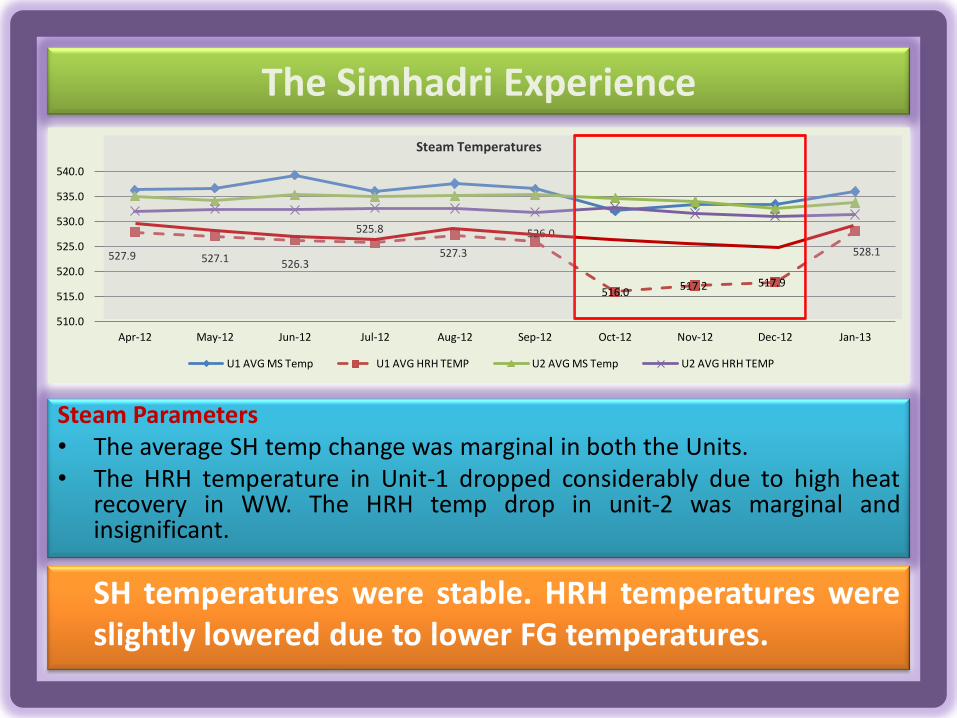
Steam Parameters • The average SH temp change was marginal in both the Units. • The HRH temperature in Unit-1 dropped considerably due to high heat
recovery in WW. The HRH temp drop in unit-2 was marginal and insignificant.
SH temperatures were stable. HRH temperatures were slightly lowered due to lower FG temperatures.
527.9 527.1 526.3
525.8
527.3
526.0
516.0 517.2 517.9
528.1
510.0
515.0
520.0
525.0
530.0
535.0
540.0
Apr-12 May-12 Jun-12 Jul-12 Aug-12 Sep-12 Oct-12 Nov-12 Dec-12 Jan-13
Steam Temperatures
U1 AVG MS Temp U1 AVG HRH TEMP U2 AVG MS Temp U2 AVG HRH TEMP
The Simhadri Experience
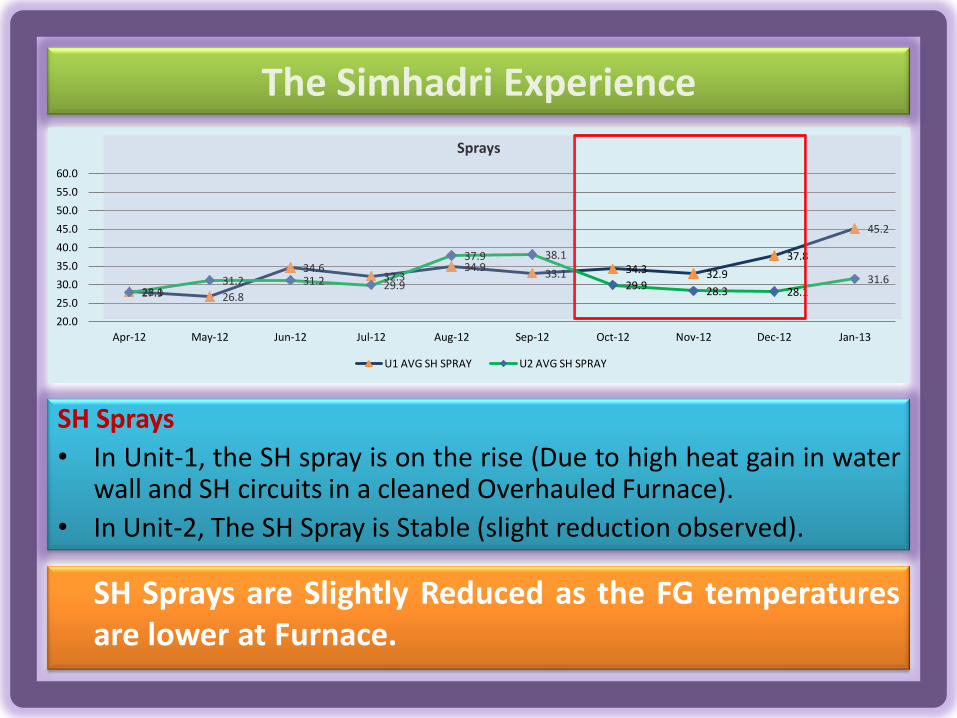
SH Sprays
• In Unit-1, the SH spray is on the rise (Due to high heat gain in water wall and SH circuits in a cleaned Overhauled Furnace).
• In Unit-2, The SH Spray is Stable (slight reduction observed).
28.1 26.8
34.6 32.3
34.9 33.1 34.3 32.9
37.8
45.2
27.9 31.2 31.2 29.9
37.9 38.1
29.9 28.3 28.1 31.6
20.0
25.0
30.0
35.0
40.0
45.0
50.0
55.0
60.0
Apr-12 May-12 Jun-12 Jul-12 Aug-12 Sep-12 Oct-12 Nov-12 Dec-12 Jan-13
Sprays
U1 AVG SH SPRAY U2 AVG SH SPRAY
SH Sprays are Slightly Reduced as the FG temperatures are lower at Furnace.

The Simhadri Experience
RH Sprays
• The RH Spray in Unit-1 was inconsistent and was dependant on the RH Acromat and Metal Temperatures.
• In Unit-2, the RH Spray was steadily increasing.
51.9
56.8
44.6
55.7
39.2
45.4
38.3 39.5
55.9
44.5 42.4
57.6
25.3
40.5
32.0
40.4 40.9
46.7
56.2 55.5
20.0
25.0
30.0
35.0
40.0
45.0
50.0
55.0
60.0
Apr-12 May-12 Jun-12 Jul-12 Aug-12 Sep-12 Oct-12 Nov-12 Dec-12 Jan-13
Sprays
U1 AVG RH SPRAY U2 AVG RH SPRAY
RH Sprays are on the rising trend which may be due to certain degree of Secondary Combustion.
The Simhadri Experience
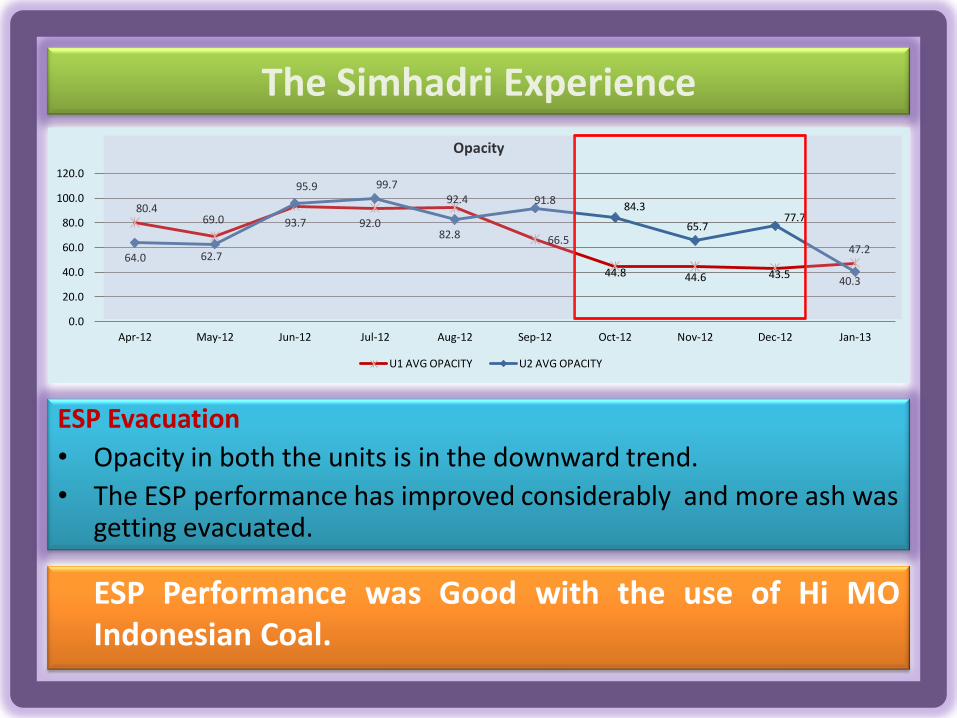
ESP Evacuation
• Opacity in both the units is in the downward trend.
• The ESP performance has improved considerably and more ash was getting evacuated.
80.4 69.0 93.7 92.0
92.4
66.5
44.8 44.6 43.5
47.2 64.0 62.7
95.9 99.7
82.8
91.8 84.3
65.7 77.7
40.3
0.0
20.0
40.0
60.0
80.0
100.0
120.0
Apr-12 May-12 Jun-12 Jul-12 Aug-12 Sep-12 Oct-12 Nov-12 Dec-12 Jan-13
Opacity
U1 AVG OPACITY U2 AVG OPACITY
ESP Performance was Good with the use of Hi MO Indonesian Coal.
The Simhadri Experience
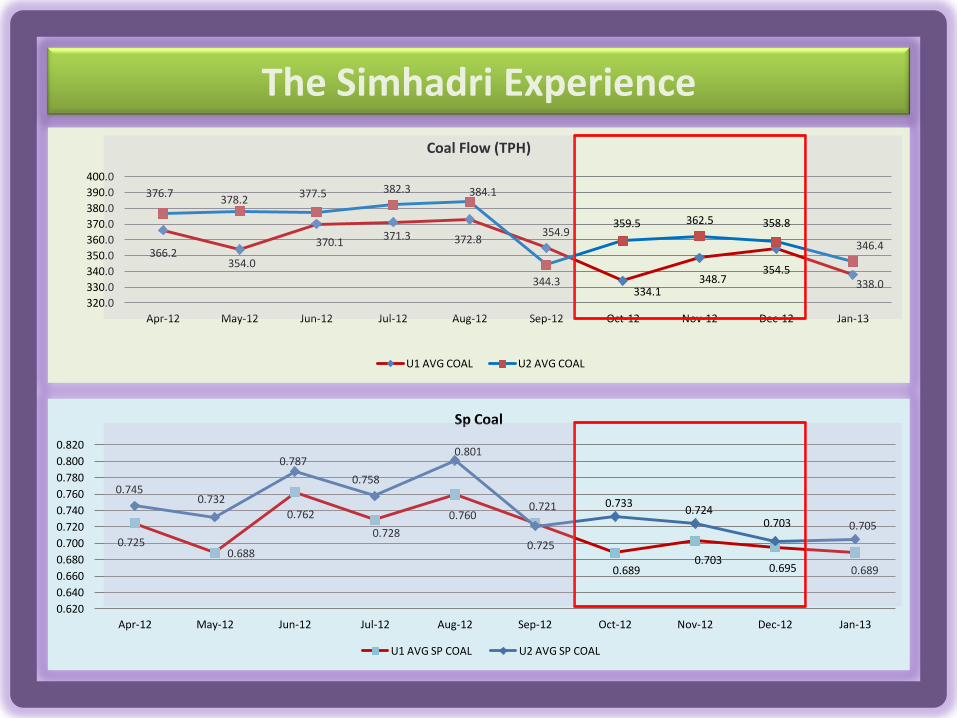
366.2 354.0
370.1 371.3 372.8
354.9
334.1 348.7
354.5 338.0
376.7 378.2
377.5 382.3 384.1
344.3
359.5 362.5 358.8
346.4
320.0
330.0
340.0
350.0
360.0
370.0
380.0
390.0
400.0
Apr-12 May-12 Jun-12 Jul-12 Aug-12 Sep-12 Oct-12 Nov-12 Dec-12 Jan-13
Coal Flow (TPH)
U1 AVG COAL U2 AVG COAL
0.725 0.688
0.762
0.728
0.760
0.725
0.689 0.703
0.695 0.689
0.745 0.732
0.787
0.758
0.801
0.721 0.733 0.724
0.703 0.705
0.620
0.640
0.660
0.680
0.700
0.720
0.740
0.760
0.780
0.800
0.820
Apr-12 May-12 Jun-12 Jul-12 Aug-12 Sep-12 Oct-12 Nov-12 Dec-12 Jan-13
Sp Coal
U1 AVG SP COAL U2 AVG SP COAL
The Simhadri Experience
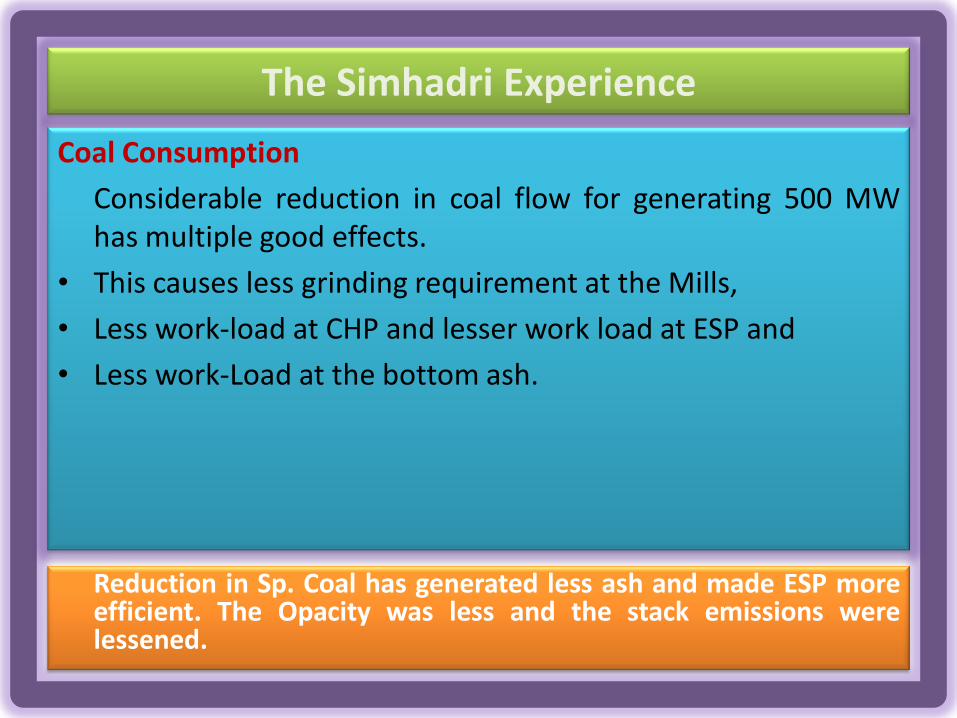
Coal Consumption
Considerable reduction in coal flow for generating 500 MW has multiple good effects.
• This causes less grinding requirement at the Mills,
• Less work-load at CHP and lesser work load at ESP and
• Less work-Load at the bottom ash.
Reduction in Sp. Coal has generated less ash and made ESP more efficient. The Opacity was less and the stack emissions were lessened.
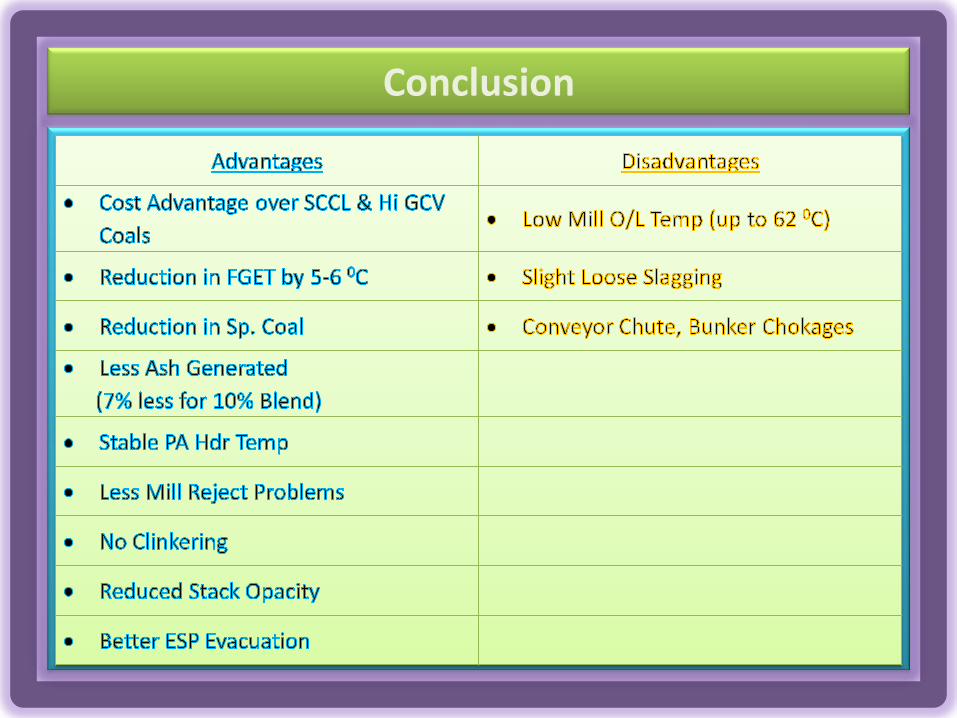
Conclusion
Conclusion
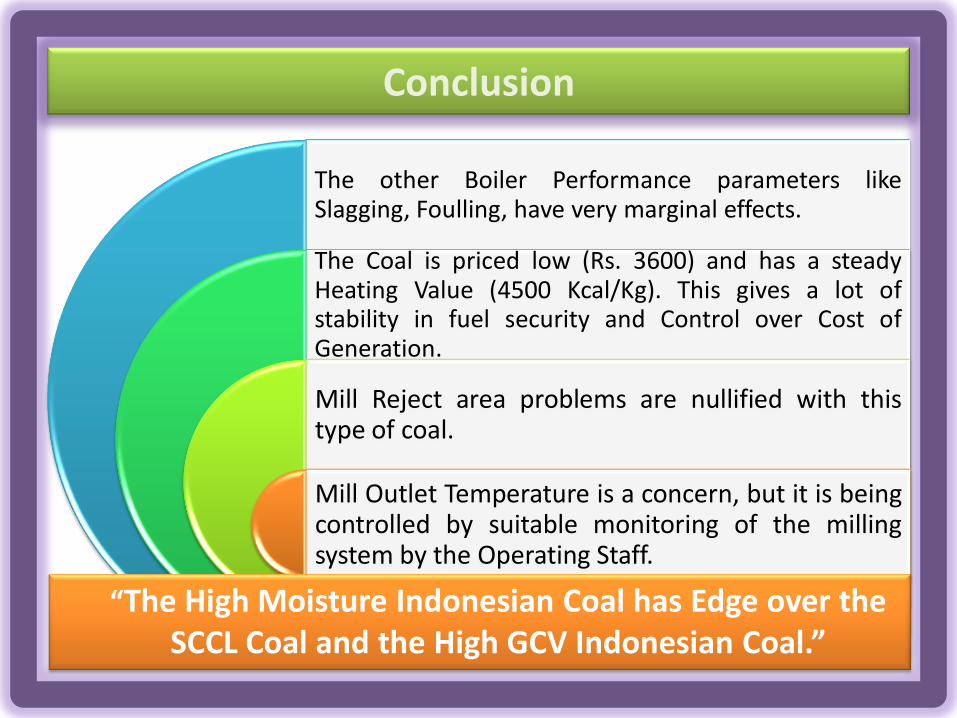
The other Boiler Performance parameters like Slagging, Foulling, have very marginal effects.
The Coal is priced low (Rs. 3600) and has a steady Heating Value (4500 Kcal/Kg). This gives a lot of stability in fuel security and Control over Cost of Generation.
Mill Reject area problems are nullified with this type of coal.
Mill Outlet Temperature is a concern, but it is being controlled by suitable monitoring of the milling system by the Operating Staff.
“The High Moisture Indonesian Coal has Edge over the SCCL Coal and the High GCV Indonesian Coal.”
The Combustion Characteristics of this Grade of Coal may be studied in detail for any long term effects on the Boiler Performance and Life.
The High Moisture Indonesian Coal is found to be suitable for use in BHEL make 500 MW CE design Corner Fired boilers, while mixed with the available Indian Sub-Bituminous Low Grade Coal, up to 30% ratio. This meticulous study has given a lot of confidence to the entire thermal power producers in the country to use the High Grade High Moisture Imported Coal in the existing Boilers.