Embed Size (px)
Citation preview
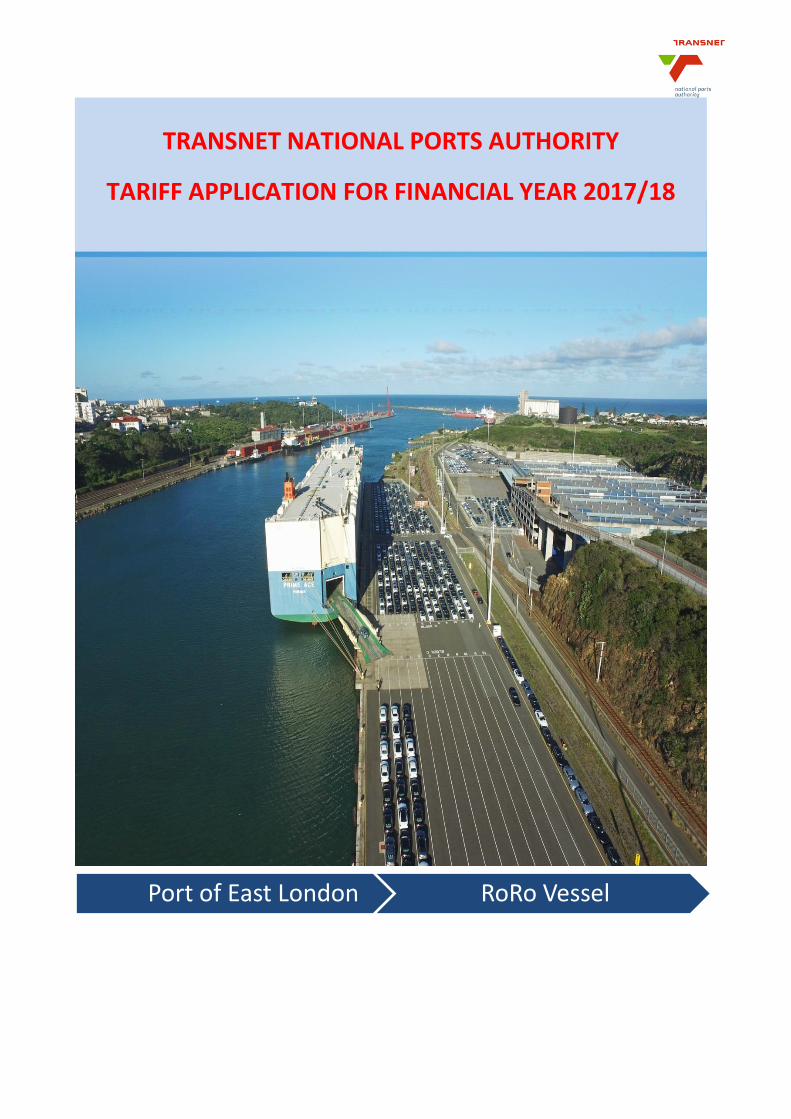
Port of East London RoRo Vessel
TRANSNET NATIONAL PORTS AUTHORITY
TARIFF APPLICATION FOR FINANCIAL YEAR 2017/18
Transnet National Ports Authority Tariff Application for Financial Year 2017/18 __________________
Page 1 of 78
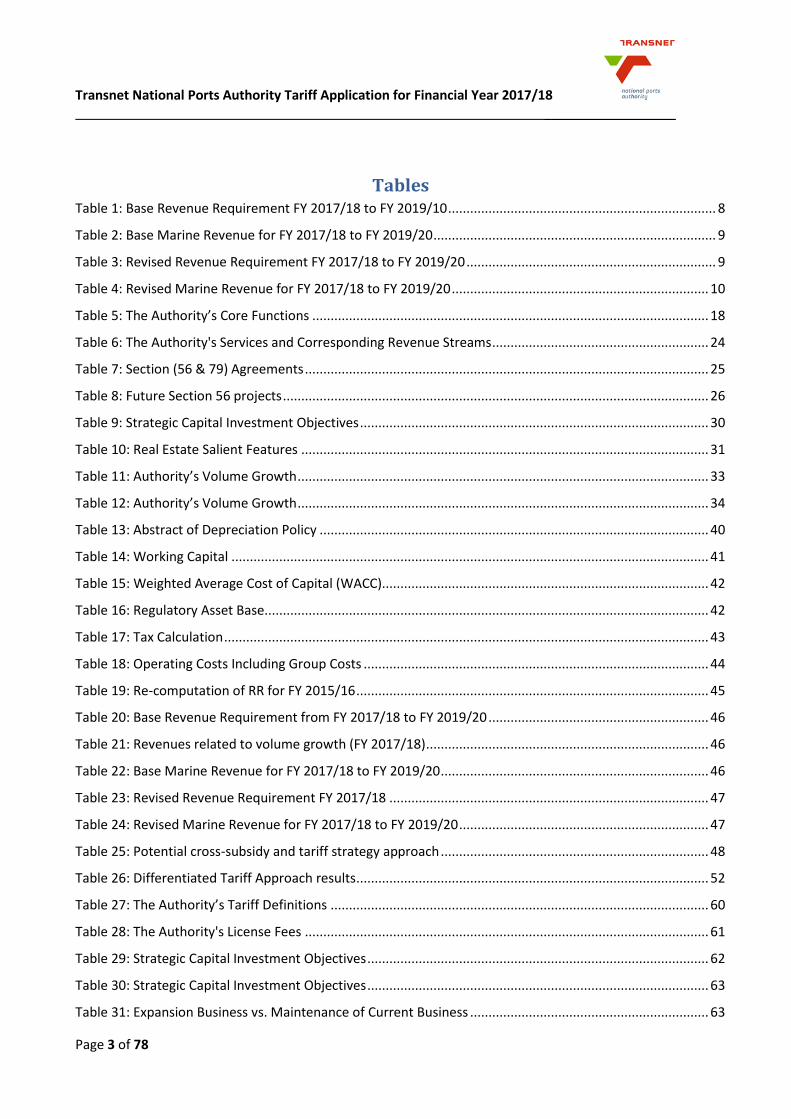
Table of Contents 1.Executive
Summary…………………………………………………………………………………………………………………………………... 7
2.Introduction……………………………………………………………………………………………………………………………………….. 10
3.Legal Basis and Regulatory
Requirements………………………………………………………………………………………………………………………………..………... 11
3.1 Section 72 of the Act sets out the Authority’s obligations in relation to “Authority’s tariff book” ........ 11
3.2 The Ports Directives .................................................................................................................................. 11
3.3 Regulatory Manual / Tariff Methodology ................................................................................................. 12
4.The Business of the Authority…………………………………………………………………………………………………………….. 17
4.1 Introduction .............................................................................................................................................. 17
4.2 Functions of the Authority........................................................................................................................ 17
4.3 Transnet Market Demand Strategy .......................................................................................................... 18
4.4 Operation Phakisa .................................................................................................................................... 19
4.5 Tariffs in Perspective ................................................................................................................................ 22
5. Port Infrastructure Development Plan and Capital Expenditure………………………………………………………….. 26
5.1 Port Investment planning ......................................................................................................................... 26
5.2 The Authority’s Capital Investment Programme ...................................................................................... 27
5.3 Progress on Capital Investment Program ................................................................................................. 28
5.4 Supplier Development .............................................................................................................................. 28
5.5 Key Focus Areas of Capital Investment Program in FY 2017/18 to FY 2019/20 ....................................... 29
6. The Authority’s Total
Revenue……………………………………………………………………………………………………………….. 30
6.1 Real Estate Revenue ................................................................................................................................. 30
6.2 Marine Business Revenue......................................................................................................................... 32
6.2.1 The Authority’s Volumes ....................................................................................................................... 32
6.3 Cargo ......................................................................................................................................................... 33
6.3.1 Containers.............................................................................................................................................. 34
6.3.2 Automotives .......................................................................................................................................... 36
6.3.3 Coal ........................................................................................................................................................ 37
6.3.4 Iron Ore.................................................................................................................................................. 37
6.3.5 Manganese Ore ..................................................................................................................................... 37
Transnet National Ports Authority Tariff Application for Financial Year 2017/18 __________________
Page 2 of 78
6.3.6 Liquid Bulk ............................................................................................................................................. 38
6.3.7 Marine Services ..................................................................................................................................... 38
7. Tariff Application
Approach……………………………………………………………………………………………………………………. 39
7.1 Revenue Requirement Formula................................................................................................................ 39
7.1.1 Regulatory Asset Base ........................................................................................................................... 39
7.1.2 Weighted Average Cost of Capital ......................................................................................................... 42
7.1.3 Valuation of the RAB ............................................................................................................................. 42
7.1.4 Taxation ................................................................................................................................................. 43
7.1.5 Operating Costs ..................................................................................................................................... 43
7.1.6 Revenue Claw-back ............................................................................................................................... 44
7.2 Revenue Requirement .............................................................................................................................. 45
7.3Tariff Application ....................................................................................................................................... 46
7.4 The Authority’s Pricing Strategy ............................................................................................................... 47
7.5 Asset Cost Allocations ............................................................................................................................... 49
7.6 Tariff Book Proposal for FY 2017/18......................................................................................................... 51
8. Port
Efficiency………………………………………………………………………………………………………………………………………… 53
8.1 Terminal Operations Licencing Oversight ................................................................................................ 56
9. Marine Operations
Management…………………………………………………………………………………………………………… 57
9.1.1 Pilotage .................................................................................................................................................. 57
9.1.2 Towage .................................................................................................................................................. 57
9.1.3 Berthing Services ................................................................................................................................... 58
10.
Conclusion…………………………………………………………………………………………………………………………………………… 58
ANNEXURE A: The Authority’s Tariff
Book………………………………………………………………………………………………….. 60
ANNEXURE B: Capital
Expenditure…………………………………………………………………………………………………………….. 62
ANNEXURE C:
Volumes………………………………………………………………………………………………………………………………. 70
ANNEXURE D: Operating
Expenditure………………………………………………………………………………………………………… 71
Transnet National Ports Authority Tariff Application for Financial Year 2017/18 __________________
Page 3 of 78
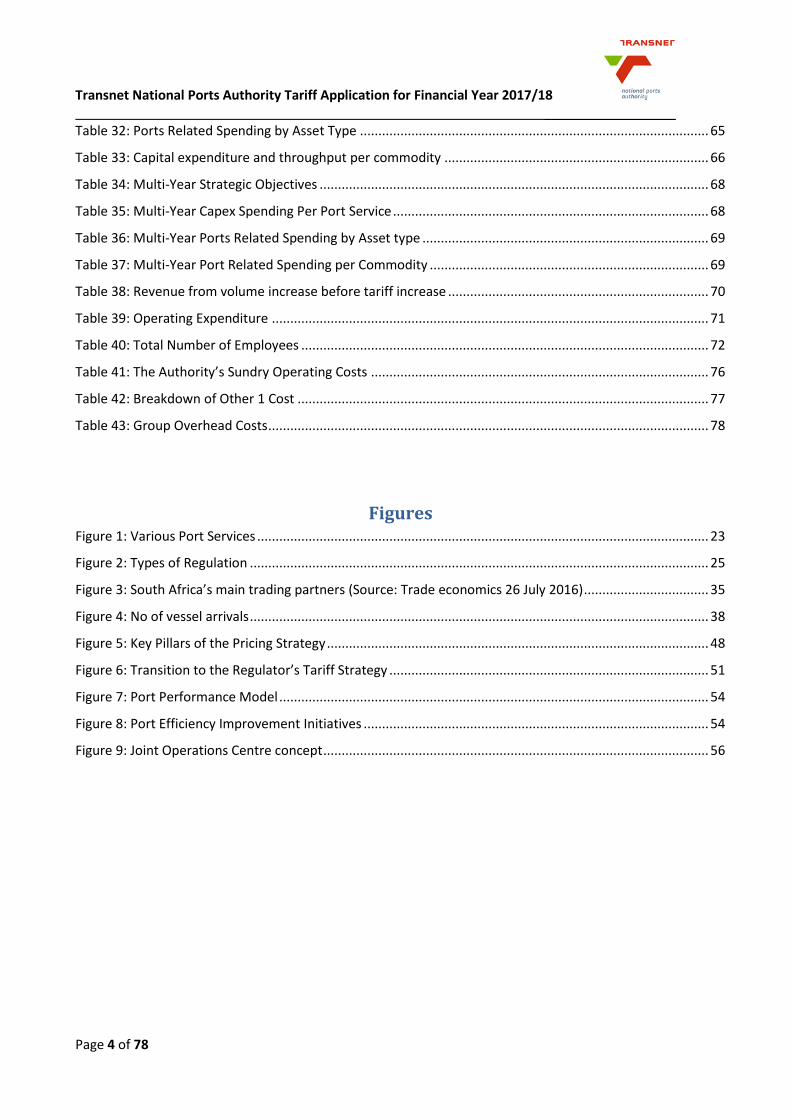
Tables Table 1: Base Revenue Requirement FY 2017/18 to FY 2019/10 ......................................................................... 8
Table 2: Base Marine Revenue for FY 2017/18 to FY 2019/20 ............................................................................. 9
Table 3: Revised Revenue Requirement FY 2017/18 to FY 2019/20 .................................................................... 9
Table 4: Revised Marine Revenue for FY 2017/18 to FY 2019/20 ...................................................................... 10
Table 5: The Authority’s Core Functions ............................................................................................................ 18
Table 6: The Authority's Services and Corresponding Revenue Streams ........................................................... 24
Table 7: Section (56 & 79) Agreements .............................................................................................................. 25
Table 8: Future Section 56 projects .................................................................................................................... 26
Table 9: Strategic Capital Investment Objectives ............................................................................................... 30
Table 10: Real Estate Salient Features ............................................................................................................... 31
Table 11: Authority’s Volume Growth ................................................................................................................ 33
Table 12: Authority’s Volume Growth ................................................................................................................ 34
Table 13: Abstract of Depreciation Policy .......................................................................................................... 40
Table 14: Working Capital .................................................................................................................................. 41
Table 15: Weighted Average Cost of Capital (WACC)......................................................................................... 42
Table 16: Regulatory Asset Base......................................................................................................................... 42
Table 17: Tax Calculation .................................................................................................................................... 43
Table 18: Operating Costs Including Group Costs .............................................................................................. 44
Table 19: Re-computation of RR for FY 2015/16 ................................................................................................ 45
Table 20: Base Revenue Requirement from FY 2017/18 to FY 2019/20 ............................................................ 46
Table 21: Revenues related to volume growth (FY 2017/18) ............................................................................. 46
Table 22: Base Marine Revenue for FY 2017/18 to FY 2019/20 ......................................................................... 46
Table 23: Revised Revenue Requirement FY 2017/18 ....................................................................................... 47
Table 24: Revised Marine Revenue for FY 2017/18 to FY 2019/20 .................................................................... 47
Table 25: Potential cross-subsidy and tariff strategy approach ......................................................................... 48
Table 26: Differentiated Tariff Approach results ................................................................................................ 52
Table 27: The Authority’s Tariff Definitions ....................................................................................................... 60
Table 28: The Authority's License Fees .............................................................................................................. 61
Table 29: Strategic Capital Investment Objectives ............................................................................................. 62
Table 30: Strategic Capital Investment Objectives ............................................................................................. 63
Table 31: Expansion Business vs. Maintenance of Current Business ................................................................. 63
Transnet National Ports Authority Tariff Application for Financial Year 2017/18 __________________
Page 4 of 78
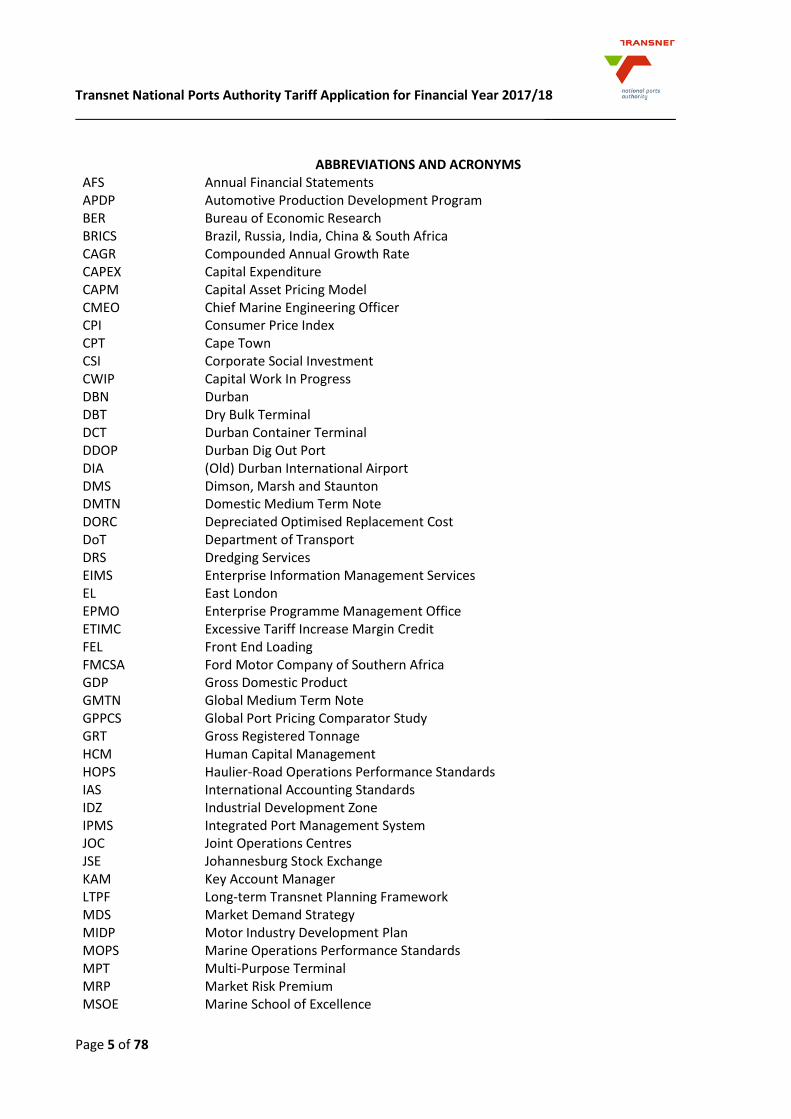
Table 32: Ports Related Spending by Asset Type ............................................................................................... 65
Table 33: Capital expenditure and throughput per commodity ........................................................................ 66
Table 34: Multi-Year Strategic Objectives .......................................................................................................... 68
Table 35: Multi-Year Capex Spending Per Port Service ...................................................................................... 68
Table 36: Multi-Year Ports Related Spending by Asset type .............................................................................. 69
Table 37: Multi-Year Port Related Spending per Commodity ............................................................................ 69
Table 38: Revenue from volume increase before tariff increase ....................................................................... 70
Table 39: Operating Expenditure ....................................................................................................................... 71
Table 40: Total Number of Employees ............................................................................................................... 72
Table 41: The Authority’s Sundry Operating Costs ............................................................................................ 76
Table 42: Breakdown of Other 1 Cost ................................................................................................................ 77
Table 43: Group Overhead Costs ........................................................................................................................ 78
Figures Figure 1: Various Port Services ........................................................................................................................... 23
Figure 2: Types of Regulation ............................................................................................................................. 25
Figure 3: South Africa’s main trading partners (Source: Trade economics 26 July 2016) .................................. 35
Figure 4: No of vessel arrivals ............................................................................................................................. 38
Figure 5: Key Pillars of the Pricing Strategy ........................................................................................................ 48
Figure 6: Transition to the Regulator’s Tariff Strategy ....................................................................................... 51
Figure 7: Port Performance Model ..................................................................................................................... 54
Figure 8: Port Efficiency Improvement Initiatives .............................................................................................. 54
Figure 9: Joint Operations Centre concept ......................................................................................................... 56
Transnet National Ports Authority Tariff Application for Financial Year 2017/18 __________________
Page 5 of 78
ABBREVIATIONS AND ACRONYMS AFS Annual Financial Statements APDP Automotive Production Development Program BER Bureau of Economic Research BRICS Brazil, Russia, India, China & South Africa CAGR Compounded Annual Growth Rate CAPEX Capital Expenditure CAPM Capital Asset Pricing Model CMEO Chief Marine Engineering Officer CPI Consumer Price Index CPT Cape Town CSI Corporate Social Investment CWIP Capital Work In Progress DBN Durban DBT Dry Bulk Terminal DCT Durban Container Terminal DDOP Durban Dig Out Port DIA (Old) Durban International Airport DMS Dimson, Marsh and Staunton DMTN Domestic Medium Term Note DORC Depreciated Optimised Replacement Cost DoT Department of Transport DRS Dredging Services EIMS Enterprise Information Management Services EL East London EPMO Enterprise Programme Management Office ETIMC Excessive Tariff Increase Margin Credit FEL Front End Loading FMCSA Ford Motor Company of Southern Africa GDP Gross Domestic Product GMTN Global Medium Term Note GPPCS Global Port Pricing Comparator Study GRT Gross Registered Tonnage HCM Human Capital Management HOPS Haulier-Road Operations Performance Standards IAS International Accounting Standards IDZ Industrial Development Zone IPMS Integrated Port Management System JOC Joint Operations Centres JSE Johannesburg Stock Exchange KAM Key Account Manager LTPF Long-term Transnet Planning Framework MDS Market Demand Strategy MIDP Motor Industry Development Plan MOPS Marine Operations Performance Standards MPT Multi-Purpose Terminal MRP Market Risk Premium MSOE Marine School of Excellence
Transnet National Ports Authority Tariff Application for Financial Year 2017/18 __________________
Page 6 of 78
MTBSA Man Truck and Bus South Africa Mtpa Millions tonnes per annum NAAMSA National Association of Automobile Manufacturers of South Africa NBV Net Book Value NERSA National Energy Regulator of South Africa NGQ Ngqura NIMS National Infrastructure Maintenance Strategy NPA National Ports Authority NPCC National Port Consultative Committee NPP National Ports Plan OD Operating Divisions OEMs Original Equipment Manufacturers OPEC Organisation of Petroleum Exporting Countries Opex Operating Costs PCC Port Consultative Committee PE Port Elizabeth PLP Project Life Cycle Process RAB RR
Regulatory Asset Base Revenue Requirement
RfR Risk Free Rate
RBCT Richards Bay Coal Terminal RCB Richards Bay ROD Record of Decision ROPS Rail Operations Performance Standards SA South Africa SAMSA South African Maritime Safety Association SARB South African Reserve Bank SARS South African Revenue Services SBIDZ Saldanha Bay Industrial Development Zone SLD SOC
Saldanha Bay State Owned Company
SOE State Owned Enterprise SRAB Starting Regulatory Asset Base TCC Transnet Corporate Centre TEU Twenty-foot Equivalent Unit TOC Trended Original Cost TONS Tonnages TOPS Terminal Operator Performance Standards TP Transnet Properties TPT Transnet Port Terminals TSHD Trailing Suction Hopper Dredger UK United Kingdom USA United States of America VWSA Volkswagen South Africa WACC Weighted Average Cost of Capital WACD Weighted Average Cost of Debt
Transnet National Ports Authority Tariff Application for Financial Year 2017/18 __________________
Page 7 of 78
1. Executive Summary
In terms of Section 72 (1) (a) of the National Ports Act, 2005 (Act No. 12 of 2005) (”the Act”), Transnet
National Ports Authority, a division of Transnet SOC Limited (“the Authority”) is required, with the approval
of the Ports Regulator (“the Regulator”), to determine tariffs for services and facilities offered by the
Authority and to annually publish a tariff book containing those tariffs. The Port Directives were approved
on 13 July 2009 (gazetted on 06 August 2009) and amended on 29 January 2010. In terms of these
Directives, when considering the proposed tariffs for the Authority, the Regulator must ensure that such
tariffs allow the Authority to:
a) recover its investment in owning, managing, controlling and administering ports and its investment in
port services and facilities;
b) recover its costs in maintaining, operating, managing, controlling and administering ports and its costs
in providing port services and facilities; and
c) earn a return commensurate with the risk of owning, managing, controlling and administering ports
and of providing port services and facilities.
The Authority shall on an annual basis, on or before 1 August, submit its application setting out its
proposed tariff for all services and facilities offered by the Authority for the following financial year for the
approval by the Regulator. Also the Directives allow the Authority to submit to the Regulator a proposal
for the amendment of any tariff for services and facilities offered by the Authority at any port from time
to time. The Directives prescribe a period of 4 months upon which the Regulator shall make a decision.
In determining the tariffs, the Authority applies the prescribed Tariff Methodology issued by the Regulator
on 31 July 2014. The approved Tariff Methodology allows the Regulator to govern the Authority’s tariff
setting process and considers a multi-year approach, applicable to the 2015/16 to 2017/18 tariff years. It
further allows for an annual review and an annual adjustment of tariffs within the three year period as
opposed to fixing the tariffs for the full period.
The approach applicable to the tariff period FY2017/18, per the Tariff Methodology, is based on the
Revenue Requirement (RR) formula as follows:
Revenue Requirement
= Regulatory Asset Base (RAB) x Weighted Average Cost of Capital (WACC)
+ Operating Costs + Depreciation + Taxation Expense ±Claw-back
± Excessive Tariff Increase Margin Credit (ETIMC)
The components of the RR formula have been summarised in the Tariff Methodology as follows:
a) Regulatory Asset Base (RAB): The RAB represents the value of assets that the NPA is allowed to earn
a return on. The value of the assets in the RAB is indexed by inflation each year based on the Trended
Original Cost (‘TOC’) approach.
b) Vanilla Weighted Average Cost of Capital (WACC): The WACC represents the risk adjusted
opportunity costs of capital and is the minimum return for an investment in order to continue to
attract capital, given the risks. A real WACC is applied, given that the RAB is indexed by inflation.

Transnet National Ports Authority Tariff Application for Financial Year 2017/18 __________________
Page 8 of 78
c) Operating Costs: The Regulator will analyse the operating cost estimates for the period on a detailed
line by line basis. The NPA is required to provide detailed and complete motivation for each of the
expenses applied for.
d) Depreciation: The depreciation of the assets in the RAB will be calculated as a straight line 40 year
on the opening balance of the RAB.
e) Taxation Expense: The Regulator will use the pass-through tax approach where the vanilla WACC will
be applied to the average RAB for the period under consideration, less the interest cost of debt and
the corporate tax rate to determine the tax liability to be treated as an expense in the RR calculation.
f) Claw-Back: The key purpose of applying the claw-back is to ensure that the NPA or any port user is
fairly treated and is not subjected to unfair gains and losses. The Regulator will spread the total
impact of over/under recovery of revenue over a period of two tariff determinations.
g) Excessive Tariff Increase Margin Credit (ETIMC): The Regulator considers it prudent to avoid future
tariff spikes by retaining and increasing the NPA’s ETIMC.
This Tariff Application is prepared in accordance with the Tariff Methodology together with the
consideration of the latest economic indicators. The Tariff Application for FY 2017/18 is presented as
follows:
Table 1: Base Revenue Requirement FY 2017/18 to FY 2019/20
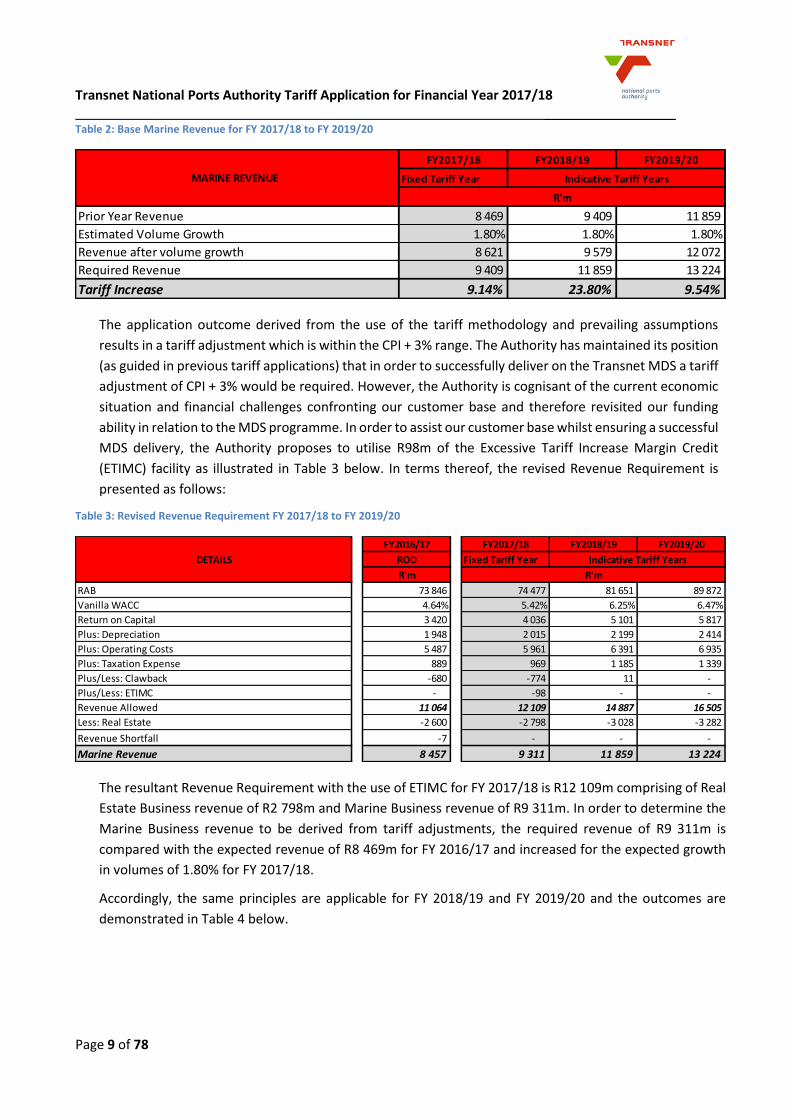
This resultant Revenue Requirement for FY 2017/18 is R12 207m comprising of Real Estate Business
revenue of R2 798m and Marine Business revenue of R9 409m. In order to determine the Marine Business
revenue to be derived from tariff adjustments, the required revenue of R9 409m is compared with the
expected revenue of R8 469m for FY 2016/17 and increased for the expected growth in volumes of 1.80%
to realise a tariff increase of 9.14% for FY 2017/18, as presented in Table 2 below.
FY2016/17 FY2017/18 FY2018/19 FY2019/20
ROD Fixed Tariff Year
R'm
RAB 73 846 74 477 81 651 89 872
Vanilla WACC 4.64% 5.42% 6.25% 6.47%
Return on Capital 3 420 4 036 5 101 5 817
Plus: Depreciation 1 948 2 015 2 199 2 414
Plus: Operating Costs 5 487 5 961 6 391 6 935
Plus: Taxation Expense 889 969 1 185 1 339
Plus/Less: Clawback -680 -774 11 -
Plus/Less: ETIMC - - - -
Revenue Allowed 11 064 12 207 14 887 16 505
Less: Real Estate -2 600 -2 798 -3 028 -3 282
Revenue Shortfall -7 - - -
Marine Revenue 8 457 9 409 11 859 13 224
Indicative Tariff Years
R'm
DETAILS
Transnet National Ports Authority Tariff Application for Financial Year 2017/18 __________________
Page 9 of 78
Table 2: Base Marine Revenue for FY 2017/18 to FY 2019/20
The application outcome derived from the use of the tariff methodology and prevailing assumptions
results in a tariff adjustment which is within the CPI + 3% range. The Authority has maintained its position
(as guided in previous tariff applications) that in order to successfully deliver on the Transnet MDS a tariff
adjustment of CPI + 3% would be required. However, the Authority is cognisant of the current economic
situation and financial challenges confronting our customer base and therefore revisited our funding
ability in relation to the MDS programme. In order to assist our customer base whilst ensuring a successful
MDS delivery, the Authority proposes to utilise R98m of the Excessive Tariff Increase Margin Credit
(ETIMC) facility as illustrated in Table 3 below. In terms thereof, the revised Revenue Requirement is
presented as follows:
Table 3: Revised Revenue Requirement FY 2017/18 to FY 2019/20
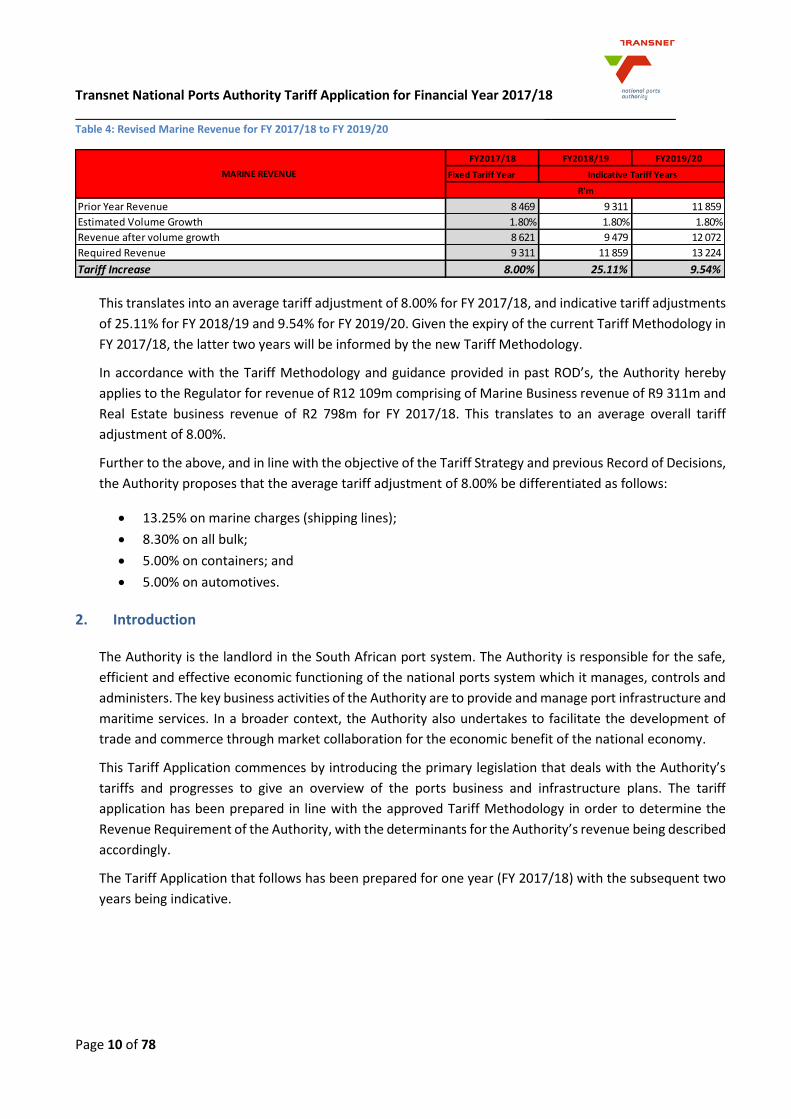
The resultant Revenue Requirement with the use of ETIMC for FY 2017/18 is R12 109m comprising of Real
Estate Business revenue of R2 798m and Marine Business revenue of R9 311m. In order to determine the
Marine Business revenue to be derived from tariff adjustments, the required revenue of R9 311m is
compared with the expected revenue of R8 469m for FY 2016/17 and increased for the expected growth
in volumes of 1.80% for FY 2017/18.
Accordingly, the same principles are applicable for FY 2018/19 and FY 2019/20 and the outcomes are
demonstrated in Table 4 below.
FY2017/18 FY2018/19 FY2019/20
Fixed Tariff Year
8 469 9 409 11 859
1.80% 1.80% 1.80%
8 621 9 579 12 072
9 409 11 859 13 224
9.14% 23.80% 9.54%
MARINE REVENUE Indicative Tariff Years
R'm
Prior Year Revenue
Estimated Volume Growth
Revenue after volume growth
Required Revenue
Tariff Increase
FY2016/17 FY2017/18 FY2018/19 FY2019/20
ROD Fixed Tariff Year
R'm
RAB 73 846 74 477 81 651 89 872
Vanilla WACC 4.64% 5.42% 6.25% 6.47%
Return on Capital 3 420 4 036 5 101 5 817
Plus: Depreciation 1 948 2 015 2 199 2 414
Plus: Operating Costs 5 487 5 961 6 391 6 935
Plus: Taxation Expense 889 969 1 185 1 339
Plus/Less: Clawback -680 -774 11 -
Plus/Less: ETIMC - -98 - -
Revenue Allowed 11 064 12 109 14 887 16 505
Less: Real Estate -2 600 -2 798 -3 028 -3 282
Revenue Shortfall -7 - - -
Marine Revenue 8 457 9 311 11 859 13 224
Indicative Tariff Years
R'm
DETAILS
Transnet National Ports Authority Tariff Application for Financial Year 2017/18 __________________
Page 10 of 78
Table 4: Revised Marine Revenue for FY 2017/18 to FY 2019/20
This translates into an average tariff adjustment of 8.00% for FY 2017/18, and indicative tariff adjustments
of 25.11% for FY 2018/19 and 9.54% for FY 2019/20. Given the expiry of the current Tariff Methodology in
FY 2017/18, the latter two years will be informed by the new Tariff Methodology.
In accordance with the Tariff Methodology and guidance provided in past ROD’s, the Authority hereby
applies to the Regulator for revenue of R12 109m comprising of Marine Business revenue of R9 311m and
Real Estate business revenue of R2 798m for FY 2017/18. This translates to an average overall tariff
adjustment of 8.00%.
Further to the above, and in line with the objective of the Tariff Strategy and previous Record of Decisions,
the Authority proposes that the average tariff adjustment of 8.00% be differentiated as follows:
13.25% on marine charges (shipping lines);
8.30% on all bulk;
5.00% on containers; and
5.00% on automotives.
2. Introduction
The Authority is the landlord in the South African port system. The Authority is responsible for the safe,
efficient and effective economic functioning of the national ports system which it manages, controls and
administers. The key business activities of the Authority are to provide and manage port infrastructure and
maritime services. In a broader context, the Authority also undertakes to facilitate the development of
trade and commerce through market collaboration for the economic benefit of the national economy.
This Tariff Application commences by introducing the primary legislation that deals with the Authority’s
tariffs and progresses to give an overview of the ports business and infrastructure plans. The tariff
application has been prepared in line with the approved Tariff Methodology in order to determine the
Revenue Requirement of the Authority, with the determinants for the Authority’s revenue being described
accordingly.
The Tariff Application that follows has been prepared for one year (FY 2017/18) with the subsequent two
years being indicative.
FY2017/18 FY2018/19 FY2019/20
Fixed Tariff Year
8 469 9 311 11 859
1.80% 1.80% 1.80%
8 621 9 479 12 072
9 311 11 859 13 224
8.00% 25.11% 9.54%
MARINE REVENUE
Prior Year Revenue
Estimated Volume Growth
Revenue after volume growth
Required Revenue
Tariff Increase
Indicative Tariff Years
R'm
Transnet National Ports Authority Tariff Application for Financial Year 2017/18 __________________
Page 11 of 78
3. Legal Basis and Regulatory Requirements
The regulatory framework for the Authority’s tariffs is informed by the Act, and the Directives promulgated
by the Regulator. In terms of the regulatory framework the Authority is required, with the approval of the
Regulator, to determine tariffs for services and facilities offered by the Authority and to annually publish
a tariff book containing those tariffs.
3.1 Section 72 of the Act sets out the Authority’s obligations in relation to “Authority’s tariff book”
72. (1) (a) The Authority must, with the approval of the Ports Regulator, determine tariffs for services
and facilities offered by the Authority and annually publish a tariff book containing those
tariffs;
(b) The Authority may, with the approval of the Ports Regulator, amend the tariff book
whenever it is necessary to do so.
(2) The Authority must, prior to any substantial alteration of a tariff, consult with the National Port
Consultative Committee.
(3) Subject to section 9 of the Competition Act, 1998 (Act No. 89 of 1998), the tariffs contemplated in
subsection (1) may vary between ports.
(4) Notwithstanding the provisions of this section, the Authority may enter into an agreement with a
licensed operator or a party to an agreement or a port user for the variation of any tariff
contemplated in subsection (1).
3.2 The Ports Directives
3.2.1 The Regulator developed the Directives, which were gazetted on 6 August 2009 and amended
on 29 January 2010. Of these, the most pertinent to the setting and approval of tariffs are
Directive 22 (which deals with the Approval and amendment of tariffs) and Directive 23 (which
deals with Tariff requirements).
3.2.2 Directive 23 (1) requires the Regulator to consider whether the tariffs proposed by the Authority
reflect and balance:
a) A systematic tariff that is applicable on a comparable basis;
b) Fairness;
c) The avoidance of discrimination save where discrimination is in the public interest;
d) Simplicity and transparency;
e) Predictability and stability;
f) The avoidance of cross subsidisations save where cross subsidisation is in the public interest;
and
g) The promotion of access to ports and efficient and effective management and operation in
ports.
3.2.3 The opening statement of sub-directive 23(2), reads as follows: In considering the Authority's
proposed tariffs, and any subsequent proposed significant variations, the Regulator must enable
the Authority to:
Transnet National Ports Authority Tariff Application for Financial Year 2017/18 __________________
Page 12 of 78
(a) Recover its investment in owning, managing, controlling and administering ports and its
investment in port services and facilities;
(b) Recover its costs in maintaining, operating, managing, controlling and administering ports
and its costs in providing port services and facilities; and
(c) Make a profit commensurate with the risk of owning, managing, controlling and
administering ports and of providing port services and facilities.
This sub-directive prescribes that the Regulator must enable the Authority to recover its
investment, costs and to earn a profit commensurate with the risk it bears.
3.2.4 Per the Directives, the Authority shall on an annual basis, on or before 1 August, submit its
application setting out its proposed tariff for all services and facilities offered by the Authority
for the following financial year for approval by the Regulator. Also the Directives allow the
Authority to submit to the Regulator a proposal for the amendment of any tariff for services and
facilities offered by the Authority at any port from time to time. The Directives prescribe a period
of 4 months upon which the Regulator shall make a decision.
Any deviation from the set timelines per the Directives could result in a significant misalignment
between the application submitted by the Authority and the Regulator’s ROD.
3.3 Regulatory Manual / Tariff Methodology
3.3.1 On 31 July 2014, the Regulator issued a Regulatory Manual (“Tariff Methodology”) applicable
for the tariff years 2015/16 to 2017/18. The Tariff Methodology will be multi-year in its
approach, with the aim of continued improvement in the level of transparency and consistency
in the tariff setting process.
3.3.2 The Tariff Methodology allows for an annual review and an annual adjustment of tariffs within
the three year period as opposed to fixing the prices for the full period.
3.3.3 Furthermore, the Regulator is of the view that guidelines contained in the Tariff Methodology
will assist in narrowing the gap between what is requested by the Authority and subsequently
granted by the Regulator.
3.3.4 The approach decided upon is based on the Revenue Requirement methodology with the
building blocks (as described in the Tariff Methodology) is set out below:
3.3.4.1 Regulatory Asset Base (RAB): The value of total assets in the RAB is indexed by inflation
each year - the Trended Original Cost (“TOC”) approach. Each year, estimated Capex and
depreciation is added to the closing balance for the previous year to arrive at an updated
closing balance for the current year. The expected working capital balance is added to
arrive at a total RAB estimate, which is averaged over the year to account for the
progressive spending of Capital Works In Progress (CWIP) over the period. The RAB
formula applicable to the FY 2015/16 to FY 2017/18 tariff years is as follows:
Transnet National Ports Authority Tariff Application for Financial Year 2017/18 __________________
Page 13 of 78
3.3.4.2 Depreciation: The following formula, which takes into consideration the principle of
financial capital maintenance to fully account for capital expenditure and inflation, is used
in the calculation of depreciation:
Depreciation = (RAB(o,y) + (RAB (o,y).CPI(y))+(Capex(y)/2.CPI(y)))/40
3.3.4.3 Inflation trending: The inflation rate for calculating the trend in the value of assets will
be the Consumer Price Index (CPI) forecast for each financial year during the tariff period
as at the latest forecast published by the National Treasury, which if unavailable by the
time of calculation, will be substituted with the latest reputable forecast from leading
independent institutions such as the Bureau of Economic Research (BER). The same
inflation rate will be used in the calculation of the weighted average cost of capital.
3.3.4.4 Capital Works In Progress (CWIP): Detailed projections for the tariff period, including
tariff year 2014/15, per asset class, service and project, as well as monthly planned
expenditure schedules, must be provided to motivate the CWIP to be included in the RAB.
3.3.4.5 Working Capital: The estimate of working capital, equates to the actual net working
capital as per the latest available NPA annual financial statements, consisting of accounts
receivables plus inventory less accounts payables (i.e. operating cash is excluded),
adjusted by forecast volume growth and CPI inflation for the following year. In addition,
CWIP payables, which are estimated at 1/12th of the capital expenditure projected for
that year, is included.
3.3.4.6 Weighted Average Cost of Capital (WACC) – Vanilla WACC: In general, the WACC
represents the risk adjusted opportunity cost of capital and is the minimum return for
investment in order to continue to attract capital, given risks.
A real WACC (cost of equity and cost of debt) will be applied and expressed in Vanilla
terms (i.e. post-tax cost of equity and pre-tax cost of debt) and accordingly, a separate
allowance for tax expense in the revenue requirement formula is required.
RABy=𝟏
𝟐 𝑹𝑨𝑩𝒄, 𝒚 + 𝑹𝑨𝑩𝒐, 𝒚 +𝒘y
RABc,y=RABo,y 𝟏 + 𝑪𝑷𝑰𝒚 𝟏 + 𝑪𝑾𝑰𝑷𝒚 − 𝑫𝒚
Where:
RABy = value of the RAB used to determine the returns for period y
RABo,y = opening value of RAB for the period y
RABc,y = closing value of RAB for the period y
Wy = forecast average net working capital over period y
CWIPy = value of expected capital investment over the period y
Dy = depreciation allowance for assets over the review period y
CPIy = annual rate of general inflation expected over period y
Transnet National Ports Authority Tariff Application for Financial Year 2017/18 __________________
Page 14 of 78
The components of the WACC are as follows:
Cost of Equity: The post-tax cost of equity is calculated with reference to the Capital
Asset Pricing Model (CAPM), which is expressed as:
Risk Free rate (RFR): The twenty year government bond is an appropriate measure
of the Risk Free Rate (RFR), and, in particular, the R186 bond instrument (yield) as
it adequately reflects the market’s perception of sovereign risk and inflation going
forward. The average RFR is calculated over a five year period (from August 2009
to July 2014) for the first tariff year, August 2010 to July 2015 for the second and
from August 2011 to July 2016 for the final tariff year in the period.
The Real RFR is deduced by using the Fisher Equation.
Market Risk Premium (MRP): The MRP is in essence forward-looking and, as such, it
cannot be observed but must be forecasted. For the tariff period, the Regulator will use
the Dimson, Marsh and Staunton (DMS) estimate of the geometric mean MRP as
measured against bonds for South Africa to determine a MRP for the Authority’s cost of
WACCvanilla = kd.g +ke (1-g)
Where:
kd = pre-tax cost of debt
ke = post tax cost of equity
g = gearing which is debt over total capital
ke = 𝒓f + 𝜷 x MRP
Where:
𝒓f = real risk free rate
𝜷 = Measure of NPA’s exposure to market (non-diversifiable) risk
MRP = The market risk premium measuring the premium over and
above the risk free rate that investors might expect in return
1+ 𝒊 = (1+ 𝒓)(1+ 𝑬(𝑰))
Where:
𝑖 = nominal rate
𝑟 = real rate
E(I) = Expected inflation
Transnet National Ports Authority Tariff Application for Financial Year 2017/18 __________________
Page 15 of 78
equity calculation. The use of the DMS dataset over its full period of existence requires
the use of geometric mean to better address concerns related to the correlation in
excess returns and mean reversion.
Beta (𝜷 : Due to the Authority not being a traded company, there is no beta (𝛽)
published reflecting its risk relative to firms listed on the Johannesburg Stock Exchange
(JSE). A beta has to be set to reflect the risks faced by NPA under the RR methodology.
This must ensure an appropriate return for the risk faced.
The inclusion of a claw-back mechanism reduces exposure to systematic risk and the
existence of an interventionist regulatory regime requires the Regulator to use a beta
substantially lower than large firms listed on the JSE, such as the JSE Top 40.
For the tariff period covered, the Regulator will use the 0.50 asset beta decided upon
and motivated in the previous Records of Decision (ROD).
The Hamada equation is used to re-lever the asset beta resulting in an equity beta of
0.86.
Gearing (g): The appropriate gearing for the entity for period is 50%.
Cost of Debt: NPA’s actual, embedded debt costs should be used to determine the cost
of debt applied within the WACC. The average embedded Transnet Group cost of debt
(pre-tax nominal) of Transnet SOC Ltd should be used for the 2015/16 tariff year, as no
current alternative exists.
3.3.4.7 Taxation Expense (t): A corporate tax rate of 28% will be used for the period. The pass-
through tax approach, where the vanilla WACC will be applied to the average RAB for the
period under consideration, less the interest cost of debt and wear and tear, and other
tax allowances. The corporate tax rate will be used to determine the tax liability which
shall be treated as an expense in the RR calculation.
Tax allowance = (Net revenue before tax allowance)/ (1-t)*t
The calculation of tax allowance must also reflect the flow of funds related to any claw-
back calculated as well as ETIMC allowances to ensure adequate tax cover for the NPA.
3.3.4.8 Operating Costs: The NPA is required to provide detailed and complete motivation for
the applied expenses, especially on large items like labour and energy costs.
Transnet Group costs will be included in the total allowed expenses subject to the
requirement that the NPA submits a detailed explanation and motivation for the amount
to be transferred to Transnet Group.
In addition, the NPA shall provide externally audited financial reports with all supporting
documentation and detailed explanations including basis of allocation and policy
documents that support such allocations.
3.3.4.9 Claw-back: The key purpose of applying claw-back is to ensure that the NPA or any port
user is fairly treated and is not subjected to any unfair gains or losses that are a result of
incorrect forecasting, inaccurate information and system shocks. Its main application is
to reduce the impact of differences between the allowed revenue (based on a number of
Transnet National Ports Authority Tariff Application for Financial Year 2017/18 __________________
Page 16 of 78
forecasts and assumptions) calculated at the time of the tariff application and actual
audited figures.
The variables to be estimated in line with the Tariff Methodology, annually, prior to the
start of the following tariff year for claw-back purposes are the:
RAB (including capex)
Depreciation
Operating Expenditure
Tax allowance
Volumes
Inflation (CPI)
The total impact of over/under recovery of revenue will be spread over a period of two
tariff determinations.
3.3.4.10 Excessive Tariff Increase Margin Credit (ETIMC): The Regulator regulates in the long term
interest of the port industry. This requires that the Regulator not only confine itself to the
immediate tariff decision, but also consider ways to ease any future shocks to the system.
It is generally accepted that capital expenditure will spike at some point in the foreseeable
future, but that these projects have not as yet been specified to a level of detail that
allows for accurate prediction. As such, the Regulator considers it prudent to avoid future
tariff spikes by retaining and increasing the Authority’s ETIMC.
The Regulator may authorise the release of part or the whole of the value of the ETIMC
facility to influence tariff levels whenever it deems necessary including, but not limited
to, spikes in tariffs (defined as an average tariff increase in excess of the inflation forecast)
due to sharp increase in capital expenditure, volume volatility, or and market related
factors. The Regulator may also consider national objectives in any decision to add to, or
to utilise the ETIMC facility to adjust tariffs.
3.3.4.11 Volume Forecast: The Authority is required to submit detailed volume forecasts with
reasons, as well as revenue calculations based on the forecast volumes and current tariff
levels together with proposed tariffs for the period.
3.3.4.12 Introduction of efficiency incentive: The Regulator will continue to monitor progress of
the results of the Terminal Operator Performance Standards (TOPS) as well as Marine
Operators Performance Standards (MOPS) and will introduce an efficiency component to
the tariff determination when the Regulator is satisfied that a credible efficiency
monitoring system has been established.

Transnet National Ports Authority Tariff Application for Financial Year 2017/18 __________________
Page 17 of 78
4. The Business of the Authority
4.1 Introduction
The Authority operates within the port industry, providing services to its target market comprising of port
users, which include terminal operators, shipping lines, ship agents, cargo owners and the clearing and
forwarding industry. The Authority owns and manages nine ports within South Africa, namely: Port Nolloth,
Saldanha Bay, Cape Town, Mossel Bay, Port Elizabeth, Ngqura, East London, Durban and Richards Bay.
Port Nolloth falls under the jurisdiction of the Authority, however it is currently not a commercial port and
renders maritime services of a basic nature supporting fishing and supply vessels.
Port infrastructure and maritime services are provided in five market segments, namely: containers, dry
bulk, liquid bulk, break-bulk and automotive. The major commodities handled at the ports are coal, iron
ore, manganese, containers, automotive, steel, fruit, ferrochrome and petroleum products. Growth of
these commodities is a function of global demand, logistics infrastructure capacity and supply chain
efficiencies which include port efficiencies.
Port users fall into three main categories, namely: terminal operators, shipping lines and cargo owners.
While numerous other parties utilise the port, they do so to a lesser extent than these principal port users.
4.2 Functions of the Authority
The National Commercial Ports Policy requires that the Authority be responsible for the management of
the national commercial port system as a landlord port authority. Being a landlord port authority means
that the Authority:
owns, develops and maintains port infrastructure;
does not engage in port operations (except as operator of last resort);
does not employ cargo handling labour;
fulfils a port regulatory function including oversight and port landowner function; and
owns all port land.
Transnet National Ports Authority Tariff Application for Financial Year 2017/18 __________________
Page 18 of 78
The Authority’s core functions (as set out in Section 11 of the Act) can be summarised in the following
Table:
Table 5: The Authority’s Core Functions
Function Detail
Landlord Promote the use, improvement and development of ports, and control land use within the ports, having the power to lease port land under conditions it determines.
Master planner Plan, improve, develop and maintain port infrastructure.
Controller of ports navigation Make and apply rules to control navigation within port limits and approaches, ensure protection of the environment and ensure safety and security within port limits.
Controller of ports services and facilities
Ensure that port services and facilities are provided, and may enter into agreements or license other parties to provide these.
Marketer and administrator Ensure that adequate, affordable, equitable and efficient port services and facilities are provided for port users.
Change agent Ensure non-discriminatory, fair, transparent access to port services and facilities; advancement of previously disadvantaged people; promotion of representation and participation in terminal operations; enhanced transparency in port management.
Coordinator with other State Agencies
Advise on all matters relating to the port sector, and liaise with all stakeholders.
4.3 Transnet Market Demand Strategy
Transnet’s mandate is to assist in lowering the cost of doing business in South Africa, enabling economic
growth and ensuring security of supply through providing appropriate port, rail and pipeline infrastructure
in a cost-effective and efficient manner, within acceptable benchmarks. This mandate and its strategic
objectives are aligned with National Plans and the Statement of Strategic Intent issued by the Minister of
Public Enterprises.
The Authority operates on a landlord port model where it serves as a landlord to terminal operators. It
also has an oversight role in ensuring seamless import-export transactions to the port users and other
stakeholders. Furthermore, the Authority provides for port infrastructure as well as other services in the
ports, such as pilotage, vessel traffic services to vessel agents, shipping lines, small crafts and the global
shipping community.
Transnet National Ports Authority Tariff Application for Financial Year 2017/18 __________________
Page 19 of 78
Some of the MDS driven milestones reached are as follows:
Capital investments focus on sustaining and expanding capacity and the oceans economy as driver for
economic growth and job creation;
Launch of SMART People’s ports aimed at efficient and technologically advanced ports with visibility
of cargo across the value chain;
Information Performance Management System (IPMS) and Joint Operation Centres (JOCs) to provide
a basis for value chain visibility and logistics collaboration;
Performance targets with TOPS, MOPS, HOPS, ROPS to create an efficient port system and to exercise
performance oversight;
Upgraded security with state of the art surveillance equipment (CCTV) to ensure a safe and secure Port
System;
Renewal of Dredging and tug fleet;
Success in executing Section 56 projects (Refer to Table 7);
Agreements containing a criteria to promote localisation, supplier development and transformation of
the port system; and
Green port focus - Compliance, Oversight.
4.4 Operation Phakisa
The launch of Operation Phakisa by the State President (July 2014) marked the commencement of focused
initiatives by Government for the Private Sector to exploit the economic potential of South Africa’s oceans
in the Marine Transport and Manufacturing, Offshore Oil and Gas Exploration, Aquaculture, Marine
Protection Services and Oceans Governance sectors. The main objective of Operation Phakisa is to create
capacity that will contribute to increased GDP growth and increased employment aligned to the priorities
of the National Development Plan. The Authority is the implementing agency for the port infrastructure
initiatives (ship repair, rig repair and boat building capacity) under the Marine Transport and
Manufacturing Lab.
Operation Phakisa initiatives by the Authority highlight the fact that South Africa can achieve GDP growth
and job creation by pursuing the development of new ship and rig repair facilities, and by ensuring that
existing ship repair facilities are maintained to promote further growth in the ship repair market. Operation
Phakisa strongly underlined and supported the role of the Authority as set out in Section 11 of the Act,
which states that the Authority must plan, provide, maintain and improve port infrastructure.
Operation Phakisa also demonstrates that growth within the oceans economy cannot be realised unless
the proposed new port facilities are delivered as integrated industry solutions, with strong partnerships
between the ports, IDZ’s and the ship repair/offshore oil and gas industry. Operation Phakisa will create
opportunities for industry to invest and operate port facilities that will create capacity and unlock
opportunities within these sectors of marine manufacturing. One of the primary initiatives will be to
establish a dedicated oil and gas support hub at the port of Saldanha Bay to attract supply chain players
within the oil and gas sector.
Transnet National Ports Authority Tariff Application for Financial Year 2017/18 __________________
Page 20 of 78
As part of the initiatives shown in the 3-feet Plan for the Marine Transport and Manufacturing Lab, the
Authority committed to the delivery of new ship/rig repair facilities at the Port of Saldanha Bay (i.e.
Initiative 2) and Richards Bay (i.e. Initiative 7) as well as a new boat building facility at the Port of East
London. In addition, the Authority has prioritised the maintenance and refurbishment of existing ship
repair facilities at the ports of Durban, East London, Port Elizabeth, Mossel Bay and Cape Town (Initiative
5). The Authority will invest a portion of the funds in the refurbishment of existing facilities within the
ports, with the remainder being outsourced.
The Authority has made significant progress in the initiatives towards the establishment of the new
Operation Phakisa facilities mentioned above. A thorough international and local market engagement
process was undertaken with the assistance of a Transaction Advisor to develop the business case and
Private-Sector-Participation Funding Model for the new builds. Operation Phakisa will thereby create
opportunities for the private sector to invest in new port facilities in order to support both the offshore
and onshore Industrial Development Zone. This supports the oil and gas industry and also expands marine
manufacturing within ports. The Saldanha Bay Industrial Development Zone will likely attract companies
that will provide land-based facilities to support offshore operations in terms of logistics, equipment
servicing, rig repair and fabrication, as well as companies interested in dedicated infrastructure and
quayside access for vessel fabrication, logistics and repairs. The identification of suitable operators to fund-
build and operate these new facilities has commenced through and open market process (Section 56
process) with issuing of an international Request for Proposal (RFP) for the Offshore Supply Base (OSSB) in
Saldanha, as well as an Expression of Interest (EOI) for the remaining new facilities at the Ports of Saldanha,
Richards Bay and East London. The procurement process will unfold with the operational date for the
OSSB as January, 2017 and the remaining facilities by December, 2019.
The Authority has committed funding to the maintenance and refurbishment of existing ship repair
facilities (Initiative 5) as contained in this Tariff submission. This comprehensive 5-year programme
extending to 2019 includes the refurbishment and upgrade works at the Durban Dry Dock and Workshop
24, the East London Dry Dock and Workshop, Port of Port Elizabeth Boat Repair facility, Lead-in Jetties and
Slipway, the Mossel Bay Slipway, the Cape Town Sturrock and Robinson Dry Docks, Synchrolift, the
extension of the Saldanha Bay OSSB berth and the replacement of the Ports Authority’s Floating Dock.
Significant achievements to date include the following:
Refurbishment of the Durban Dry Dock Outer Caisson;
The delivery of Workshop 24 equipment;
Completion of the Port Elizabeth Boat Repair Facility;
Commissioning of the 90 ton Boat Hoist; and
Other projects comprising the above scope are at various stages of project maturity.
The Authority looked at the commercial possibilities of the ship repair as well as oil and gas facilities. The
Authority however is going beyond this mandate to ensure upskilling of its human resources in order to
take advantage of what the Operation Phakisa program has to offer. In doing so, the Authority has
established training centres in the port of Cape Town, port of Richards Bay, port of Durban, port of
Saldanha Bay, port of East London and Nelson Mandela Bay ports (Refer to Annexure D – Operation
Expenditure, on training). These projects will provide training opportunities for learners in the field of
millwright, spray painting, plumbing, electricians, as well as other maritime and technical training.
Transnet National Ports Authority Tariff Application for Financial Year 2017/18 __________________
Page 21 of 78
Launch of SMART People’s ports
The Authority has embarked on a project of SMART People’s ports concept. This project, amongst other
initiatives, is based on the JOCs concept that is being rolled out across all ports to attain port value chain
visibility at any given time. This ensures that the Authority can track port performance and ease up
bottlenecks where necessary. Like all progressive ports in the world, the Authority will track and measure
port performance 24/7.
The JOCs project is premised on the notion that what is not managed cannot be measured. JOCs aim to
improve port efficiencies through collaborative effort with the port community, to create integrated port
operational plans, and to monitor execution of the plans in real time.
Progress to date:
Physical Joint Operations Centre facilities have been established at the Head Quarters and in the following ports:
Richards Bay;
Durban;
East London;
Nelson Mandela ports (currently sharing one facility in Port Elizabeth and Ngqura will be establishing
theirs shortly);
Cape Town;
Saldanha Bay; and
Mossel Bay – under construction.
JOCs processes have been signed off and all JOC staff have been trained on these processes. On-boarding
of Transnet Port Terminals (TPT), private terminal operators and Transnet Freight Rail (TFR) is ongoing to
enable Joint Operation Centres to have a holistic view of the port total logistics chain. JOCs currently have
a view of rail planning and execution of plans for all the trains entering and exiting the ports. In
strengthening the role of JOCs, a team in each port will be established comprising of the following
stakeholders:
The Authority’s Joint Operations Centre staff;
Private Terminal Representative;
Transnet Operations Centre staff (comprising of Transnet Freight Rail and Transnet Port Operations);
and
Full utilisation of the CCTV Cameras for monitoring purposes focusing on quayside operations and
road congestion.
A fully operational JOC will eradicate issues such as:
Challenges of port congestion;
Silo operation;
Underutilisation of port capacity;
Costly business practices; and
Unavailability of a single data point.
Transnet National Ports Authority Tariff Application for Financial Year 2017/18 __________________
Page 22 of 78
JOCs will provide an integrated port value chain and performance visibility and thus reduce anchorage
waiting time, improve vessel planning and ship turnaround time. To date some of the current JOC’s
achievements are as follows:
Port of Durban JOC operating 24/7;
Access to TFR IATS system installed in JOCs and utilised daily;
Ongoing engagements between port JOCs and TFR;
IPMS marine system launched and in roll out stage in all JOCs;
JOC processes designed, validated and signed off by all ports;
Job creation of approximately thirty (30) new full time jobs in all JOCs nationwide;
Soft and hard skills training of all JOC employees, including on-the-job training; and
Continuous engagements with various stakeholder associations and forums, e.g. SASSOA.
4.5 Tariffs in Perspective
The Authority, like any other port authority, needs to generate revenue by charging tariffs for the services
that it renders, and to achieve the aforementioned MDS targets. The Authority may charge fees, in
accordance with tariffs approved by the Regulator, in order to fulfil the functions it must perform in terms
of the Act.
As a landlord port authority, the Authority’s core services, as specified in the Act, result in a number of
revenue streams, which are utilised by the Authority to fulfil its responsibility for the safe, efficient and
effective economic functioning of the national ports system.
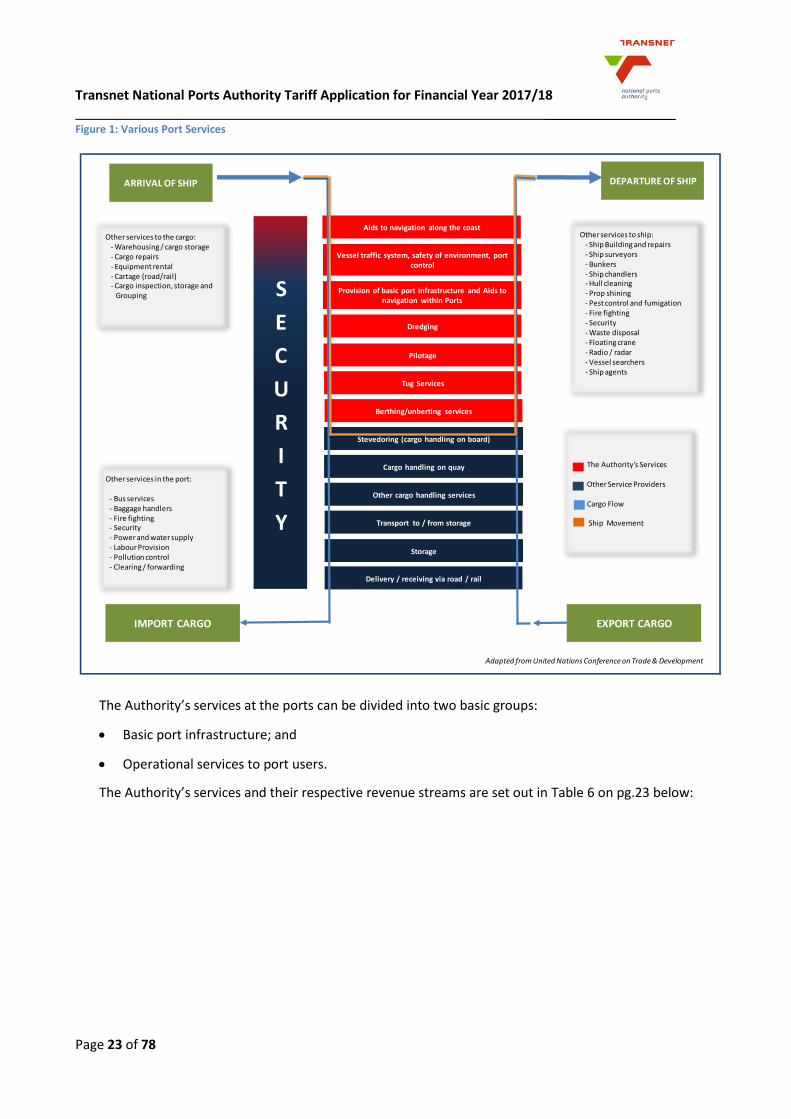
There are various services provided within a port - Figure 1 on pg. 23 below: Various Port Services
(adapted from the United Nations Conference on Trade and Development) illustrates the flow of cargo
and ships through the port system:
Transnet National Ports Authority Tariff Application for Financial Year 2017/18 __________________
Page 23 of 78
Figure 1: Various Port Services
The Authority’s services at the ports can be divided into two basic groups:
Basic port infrastructure; and
Operational services to port users.
The Authority’s services and their respective revenue streams are set out in Table 6 on pg.23 below:
Other services to the cargo:- Warehousing / cargo storage- Cargo repairs- Equipment rental- Cartage (road/rail)- Cargo inspection, storage and
Grouping
Other services in the port:
- Bus services - Baggage handlers- Fire fighting- Security- Power and water supply- Labour Provision- Pollution control- Clearing / forwarding
Aids to navigation along the coast
Vessel traffic system, safety of environment, port control
Provision of basic port infrastructure and Aids to navigation within Ports
Dredging
Pilotage
Tug Services
Berthing/unberting services
Stevedoring (cargo handling on board)
Cargo handling on quay
Other cargo handling services
Transport to / from storage
Storage
Delivery / receiving via road / rail
IMPORT CARGO EXPORT CARGO
Other services to ship:- Ship Building and repairs- Ship surveyors- Bunkers- Ship chandlers- Hull cleaning- Prop shining- Pest control and fumigation- Fire fighting- Security- Waste disposal- Floating crane- Radio / radar- Vessel searchers- Ship agents
S
E
C
U
R
I
T
Y
Adapted from United Nations Conference on Trade & Development
The Authority's Services
Other Service Providers
Cargo Flow
Ship Movement
DEPARTURE OF SHIPARRIVAL OF SHIP

Transnet National Ports Authority Tariff Application for Financial Year 2017/18 __________________
Page 24 of 78
Table 6: The Authority's Services and Corresponding Revenue Streams
In the context of the South African ports system and the Act, the revenue generated from the Authority’s
services is utilised inter alia to:
Maintain basic port infrastructure;
Provide future port infrastructure;
Maintain and provide the current and future marine fleet; and
Maintain and provide current and future ship repair facilities.
This makes the South African port system distinct from most ports internationally, where typically, some
port capital costs are funded through State or Municipal budgets. The Authority’s Tariff Book sets out the
various tariffs that are charged by the Authority to maintain and develop the South African port system
(Refer to Annexure A).
Apart from the services that the Authority itself renders, the Authority is also the controller of port services
and facilities that are provided by others in the ports. The Authority exercises such control in accordance
with the provisions of the Act, by means of agreements, licences and permits. The Act and Port Rules issued
by the Authority in terms of section 80(2) of the Act, and the Authority’s Guidelines of Agreements,
Licences and Permits (25 April 2008), specify the degree of regulation that is being exercised in this regard.
Port Infrastructure Revenue Stream
Port land and
terminals
Lease port land to terminal operators and other port
service and port facility providers in the port(s).
Lease income (rentals)
Wet
infrastructure
Lighthouse services infrastructure (lighthouses, buoys,
beacons and electronic / radio navigation equipment) ,
port control and safety, entrance channels, breakwaters,
turning basins, aids to navigation within port limits, vessel
traffic services, maintenance dredging within ports.
Light dues, port dues, vessel traffic
services fees
Dry
infrastructure
Quay walls, roads, rail lines, buildings, fencing, port
security, lighting (outside terminals), bulk services and in
certain cases terminal infrastructure,
Cargo dues, berth dues
Ship repair
services
Provide and maintain ship repair facilities Preparation fee, docking and
undocking fees (vessels at repair
facilities), berth dues (vessels at
repair quays)
Marine services Pilotage, tug assistance, berthing, running of lines,
floating cranes
Pilotage dues, tug assistance fees,
berthing fees, running of line fees,
floating crane hire fees
Transnet National Ports Authority Tariff Application for Financial Year 2017/18 __________________
Page 25 of 78
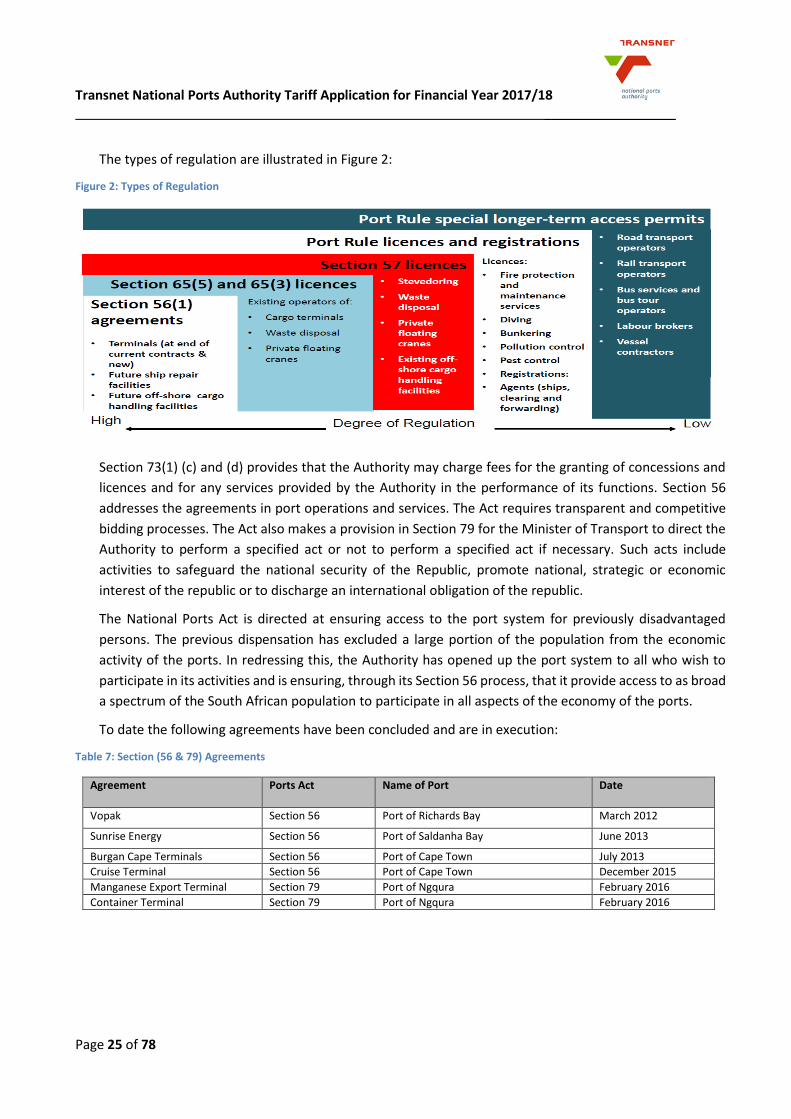
The types of regulation are illustrated in Figure 2:
Figure 2: Types of Regulation
Section 73(1) (c) and (d) provides that the Authority may charge fees for the granting of concessions and
licences and for any services provided by the Authority in the performance of its functions. Section 56
addresses the agreements in port operations and services. The Act requires transparent and competitive
bidding processes. The Act also makes a provision in Section 79 for the Minister of Transport to direct the
Authority to perform a specified act or not to perform a specified act if necessary. Such acts include
activities to safeguard the national security of the Republic, promote national, strategic or economic
interest of the republic or to discharge an international obligation of the republic.
The National Ports Act is directed at ensuring access to the port system for previously disadvantaged
persons. The previous dispensation has excluded a large portion of the population from the economic
activity of the ports. In redressing this, the Authority has opened up the port system to all who wish to
participate in its activities and is ensuring, through its Section 56 process, that it provide access to as broad
a spectrum of the South African population to participate in all aspects of the economy of the ports.
To date the following agreements have been concluded and are in execution:
Table 7: Section (56 & 79) Agreements
Agreement Ports Act Name of Port Date
Vopak Section 56 Port of Richards Bay March 2012
Sunrise Energy Section 56 Port of Saldanha Bay June 2013
Burgan Cape Terminals Section 56 Port of Cape Town July 2013
Cruise Terminal Section 56 Port of Cape Town December 2015
Manganese Export Terminal Section 79 Port of Ngqura February 2016
Container Terminal Section 79 Port of Ngqura February 2016

Transnet National Ports Authority Tariff Application for Financial Year 2017/18 __________________
Page 26 of 78
An indication of future Section 56 projects is listed below: Table 8: Future Section 56 projects
Region S56 Project Sector Status
KwaZulu-Natal Cruise Terminal Passenger Cruise-Line Terminal
Request for Proposal In the Market Place
Lot 100 Liquid Bulk Request For Proposal In the Market
Floating Dock Ship Repair EOI in the market and then proceeding to RFP
Eastern Region Heavy Fuel (HFO) Liquid Bulk Preparing to issue Request For Proposal
Shed 10 & 11 Break-Bulk Preparing to issue Request For Proposal.
East London Dry Dock Ship repair Preparing to issue Request For Proposal
General Cargo Terminal (Ngqura)
General Cargo Terminal
Finalising Internal processes before going to market.
Storage tanks Liquid Bulk Finalising the agreement
Tag Yacht Yacht Building Finalising the agreement
Western Cape Off Shore Supply Base- Saldanha
Liquid Bulk RFP is in the market
Rig Repair Facility - Saldanha
Rig repair Finalising Project with the Transaction advisors
Bunkering Storage Facility- Cape Town
Liquid Bulk Initial Stages
5. Port Infrastructure Development Plan and Capital Expenditure
Section 11(1) of the National Ports Act lists the main functions of the Authority, amongst others, the
responsibilities with respect to the provision of port infrastructure.
5.1 Port Investment planning
“Functions of the Authority”
11. (1) the main function of the Authority is to own, manage, control and administer ports to ensure their
efficient and economic functioning, and in doing so the Authority must:
(a) plan, provide, maintain and improve port infrastructure;
(b) prepare and periodically update a port development framework plan for each port, which
must reflect the Authority’s policy for port development and land use within such port;
(c) control land use within ports, and has the power to lease land under such conditions as the
Authority may determine;
(d) provide or arrange for road and rail access within ports;
(e) arrange for such services such as water, light, power and sewerage and telecommunications
within ports; and
(f) Maintain the sustainability of the ports and their surroundings;
Transnet National Ports Authority Tariff Application for Financial Year 2017/18 __________________
Page 27 of 78
5.2 The Authority’s Capital Investment Programme
The Authority’s investment spending is primarily influenced by its detailed strategic initiatives which aim
at providing adequate port infrastructure ahead of demand, improving vessel and cargo turnaround; and
improving the productive use of assets.
In developing the capex plans, the following activities are considered by the Authority:
Long-term Framework Plans: The Authority prepares a National Ports Plan on an annual basis which
includes the individual Port Development Framework Plans. These Plans outline the proposed
investments across the ports to create capacity to meet anticipated demand. The latest version
available is the National Ports Plan (NPP) 2015. The NPP 2015 informs the ports Chapter of Transnet’s
Long Term Planning Framework (LTPF). These 2015 plans are currently available on the Authority’s
website for stakeholders review and comment to input into NPP 2016.
Capacity studies: The Authority uses a robust simulation tool to assess the capacity of current
infrastructure and to simulate future infrastructure capacity. The capacity studies are updated
annually.
Volume Studies: The forecasted volumes used in the Authority’s development plans are based on the
Transnet Corporate Plan for the short-term investment guidelines. The long-term investment
guidelines use the forecasted volumes from Transnet’s Freight Demand Model, which provides the
volume studies for all Transnet Operating Divisions. The Transnet Freight Demand Model is a demand
forecasting tool developed and utilised in association with the University of Stellenbosch.
Prioritization: Projects are prioritised by safety; and secondly to meet demand forecasted.
Interaction with Transnet: The Authority maintains close interaction with Transnet Planning, Transnet
Commercial and Transnet Capital Integration during the planning cycle and the development research
process. The plan developed by the Authority is incorporated into the Transnet Plans.
Port Consultative Committees (PCC’s) & National Port Consultative Committees (NPCC’s): The
Authority adopts a consultative approach to the drafting of the Port Development Framework Plans
and the execution of the resultant Capital Investment Plan. Port Development Framework Plans
projected for the short, medium and long term as well as 5 year Capital Investment Plans have been
consulted with port users. This consultation was conducted on a port-by-port basis during a process
facilitated by the Department of Transport (DoT) in May and June 2015 with the South African
Maritime Safety Association (SAMSA) as secretariat. These plans are informed by the aforementioned
Transnet Freight Demand Model (developed by the University of Stellenbosch). The model was
presented to the NPCC at a workshop held in June 2015 to ensure that these plans are understood by
port users.
The following initiatives of the Authority are aimed at supporting the MDS and volume growth:
Improve management and delivery of capital projects;
Ensure compliance to Project Lifecycle Process (PLP) model;
Tracking of capital projects delivery by the Enterprise Programme Management Office (EPMO);
Improve capital planning and budgeting processes;
Transnet National Ports Authority Tariff Application for Financial Year 2017/18 __________________
Page 28 of 78
Improve procurement process to reduce turnaround time;
Ensure disciplined execution of the capital and maintenance programmes;
Implement integrated commercial management and integrated capacity planning processes with a
total supply chain focus to improve customer service and achieve wider integration of the port system;
Increase focus on business development; and
Improve land and other asset utilisation.
5.3 Progress on Capital Investment Program
The MDS is aimed at expanding the port infrastructure for the purpose of pursuing opportunities for
volume growth; enhancing service levels, productivity and efficiency gains. These are projects that allowed
the Authority and Transnet to pursue some strategic objectives, such as creation of direct and indirect jobs,
skills development, youth employment and efficiency targets. MDS is not only about Transnet, but key to
South Africa's growth objectives. It encompasses a strategy to deliver a lasting economic, social and
environmental value to the society.
The major projects include:
Acquisition of 9 Tugs for the Authority’s ports, including Richards Bay, Durban, Port Elizabeth and
Saldanha Bay, of which 2 have been delivered;
Reconstruction of sheet-pile Quay Walls at Maydon wharf (i.e. 3 berths completed, 4 in progress);
Completion of feasibility studies for the Durban berth deepening 203 to 205 with execution phase
having commenced;
Operationalise the port for containers in the Port of Ngqura with 90% completion;
Firefighting equipment at tanker basin in the Port of Cape Town with 76% completion to date;
Acquisition of second new Dredger (TSHD) in the Authority Dredging services;
CCTV for the safety and security of the ports; and
Operation Phakisa projects in the Authority’s ports, including Durban, East London, Port Elizabeth,
Mossel Bay, Cape Town and Saldanha Bay.
The MDS is also based on a combination of partnerships with its stakeholders, hence Transnet came up
with the development program aimed at enabling economic participation by a wider part of the
economically active South Africans.
5.4 Supplier Development
In addition to the capital investment program, Transnet embraces the national imperatives driven by
Government which aims to address investment in infrastructure, especially when partnered with skills and
capacity development. This allows the country to gain the ability to tackle historic inequalities through
enabling economic participation by people with historically disadvantaged backgrounds in the mainstream
of the economy. Transnet fully endorses and supports Government’s economic policies through its
facilitation of the Supplier Development (SD) program with initiatives implemented through procurement.
As part of Transnet’s procurement policy, the Authority facilitates SD through procurement of supplies
from firms and entrepreneurs with previously disadvantaged backgrounds. The SD initiatives are
Transnet National Ports Authority Tariff Application for Financial Year 2017/18 __________________
Page 29 of 78
determined on a contract by contract basis. The SD is a broader program which focuses on a number of
categories including:
Skills Development;
Job creation/preservation;
Small Business Promotion;
Capacity and Capability Building;
Rural Development and Regional Integration; and
Technology and sustainability.
Since its formation, the SD has already made progress in delivering on the mission it was meant to
accomplish. These accomplishments include the following:
The Authority has procured supplies to the value of R 2.9bn through competitive bidding processes;
Of these supplies, procurement to the value R 1.3bn has been allocated to small suppliers who are
targeted in accordance with the objectives of the SD program where goods and services would only be
procured from these suppliers;
Of the R 1.3bn procurement dedicated in the SD program, invoices to the value of approximately
R600m have been paid out to these suppliers who participated in the supply chain through the SD
program.
5.5 Key Focus Areas of Capital Investment Program in FY 2017/18 to FY 2019/20
The areas of Capital Investment Program for FY 2017/18 to FY 2019/20 amounts to R 4 050bn, R 5 401bn
and R 6 358m respectively. These amounts are included in the Authority’s Regulatory Asset Base as capital
expenditure in the years in which they are incurred. These projects are not new as they are MDS projects
which were started since its inceptions. This section gives progress on the projects that are continuing from
FY 2017/18 to FY 2019/20:
Port of Durban execution of DCT berth deepening 203 and 205;
Port of Durban Berth IV upgrade;
Port of Durban Island view berth 9;
Port of Durban Tug jetty;
Port of Richards Bay purchase of additional helicopter;
Port of Richards Bay additional rail facility for Duine Area;
Port of Richards Bay upgrade breakwater;
Port of Ngqura Berth 100A roads, port entrance and services;
Port of Ngqura Berth Manganese export facility;
Port of Ngqura operationalise container terminal;
Port of East London rehabilitation of Latimers Landing wooden jetty;
Port of Saldanha Bay bulk electrical power supply related to third Tipler; and
Operation Phakisa projects in the Authority’s ports, including Durban, East London, Port Elizabeth,
Mossel Bay, Cape Town and Saldanha Bay

Transnet National Ports Authority Tariff Application for Financial Year 2017/18 __________________
Page 30 of 78
These reflect the continuing programme which is organised in productivity and efficiency, together with safety
and risk as well as human capital objectives, as demonstrated in Table 9 below.
Table 9: Strategic Capital Investment Objectives
The detailed capital expenditure schedule is highlighted in Annexure B.
6. The Authority’s Total Revenue
6.1 Real Estate Revenue
The Authority has positioned itself as a landlord port authority, managing all fixed assets under its control
in a responsible and productive manner.
Real Estate Management is driven by key principles that seek to support the vision of creating a world-
class port system in South Africa, that supports the development goals of our country and the region as a
conduit for import and export trade between South Africa and the world. The Authority leases out land to
achieve optimum productivity within the ports.
Third party tenants enter into short/long term leases to enable them to invest and develop facilities for
their operations. Rentals are negotiated on a case by case basis and are therefore not reflected in the
Authority’s Tariff Book.
The salient details of the Authority’s Real Estate portfolio are summarised in Table 10 on pg.31 below to
give a consolidated overview of the portfolio.
LE
2016/17 2017/18 2018/19 2019/20
Rm Rm Rm Rm
To maximise return on investments by
obtaining additional volumes 608 1 675 2 364 3 552
To maximise return on investments by
improving operating efficiencies 832 397 241 151
To preserve current revenue streams without
obtaining additional volumes (ie. revenue
protection) 784 1 420 2 071 1 797
Ensure Safety Optimisation 327 386 420 360
Optimise Business Enterprise Offerings 123 32 167 253
Optimally Satisfy Social Investments (non
economic value creating projects) 12 19 35 81
Environmental 43 48 43 82
Human Capital
Optimise Human Resources 71 73 60 82
Total (excl. borrowing cost) 2 801 4 050 5 401 6 358
Strategic objective Details
Projections
Safety, Risk and Effective
Governance
Re-engineering, Integration,
Productivity and Efficiency

Transnet National Ports Authority Tariff Application for Financial Year 2017/18 __________________
Page 31 of 78
Table 10: Real Estate Salient Features
By nature of leases being contract driven, the Authority’s Real Estate business is not subject to a tariff
increase by the Ports Regulator but is taken into consideration in the determination of the allowable
revenue. This business is driven by a set of functions which are set out in the Act. In line with the Act, the
Authority must:
Control land use within ports and has the power to lease land under such condition as it may
determine;
Ensure that adequate, affordable and efficient port service and facilities are provided;
Exercise licencing and controlling functions in respect of port services and port facilities to be able to
perform efficiently;
Ensure that any person required to render any port services and port facilities is able to perform
efficiently; and
Promote the achievement of equality by measures designed to advance persons or categories of
persons historically disadvantaged by unfair discrimination in the operation of facilities in the ports
environment.
Further to the above, in terms of Section 11 (1) (r) of the Act, the Authority must promote greater
representation, in particular to increase participation in terminal operations of historically disadvantaged
persons. In order to achieve compliance with the Act, the Authority has considered measures to achieve
75% of Level 4 B-BBEE status in lease contracts and strives to attain a complete occupation of its properties.
In setting the regime, the Authority considers its financial objectives as well as the tenants’ financial
rewards and incentives. The tenants (i.e. Terminal Operators) derive income from terminal handling
charges. This enables lessee’s ability to meet rental payments to the Authority. Should the sub-optimal
usage of the leased facilities continue to exist across the port system, this could be equated to hardships
which cause contractual disequilibrium (i.e. the inability to afford rent). The Authority has in the last
couple of months observed its tenants struggling to meet rental obligations. In fact tenants are beginning
to engage the Authority and have indicated that should the sluggish economic trade conditions (i.e. lower
volumes handled at the terminals) continue to persist this will necessitate re-negotiation of leases with
possible handover of some leased facilities.
FY2016/17 FY2017/18 FY2018/19 FY2019/20
Current Tariff Year Fixed Tariff Year
8 8 8 8
Approx 22 million sqmApprox 22 million sqm Approx 22 million sqm Approx 22 million sqm
728 740 747 755
90 90 90 90
20% 20% 20% 20%
5.00% 6.00% 5.00% 5.00%
5 - 25 Years 5 - 25 Years 5 - 25 Years 5 - 25 Years
R2 570 m R2 798 m R3 028 m R3 282 m
R2 798 m R3 028 m R3 282 m R3 541 m
Forecast Revenue Growth R228 m R230 m R254 m R260 m
Estimated Revenue (Current Financial Year)
Estimated Revenue (Subsequent Financia l Year)
Number of Tenants
Total No. of Terminal Operators
Vacancy factor including Unserviced/Unused land
Vacancy factor excluding Unserviced/Unused land
Average term of Leases
SALIENT FEATURES OF REAL ESTATE BUSINESSIndicative Tariff Years
Number of Ports
Gross Lettable Area
Transnet National Ports Authority Tariff Application for Financial Year 2017/18 __________________
Page 32 of 78
6.2 Marine Business Revenue
The Authority generates revenue by providing services to port users, which include terminal operators,
shipping lines, ship agents, cargo owners and the clearing and forwarding industry. Port Infrastructure and
maritime services are provided by the Authority for the five commodity categories, namely: containers,
dry bulk, liquid bulk, break-bulk and automotives. The main source of revenue is the tariffs which are
charged by the Authority for providing the aforementioned services with approval by the Regulator. In
determining the tariffs of the Authority, consideration is given to the forecasted volume growth which is
influenced by the economic outlook.
6.2.1 The Authority’s Volumes
The volumes of the Authority are mainly driven by commodity cargo movements through the ports and
marine vessel traffic entering the ports.
The yearly projections for the Authority’s volume budget process usually commence in October and spans
until the Transnet Board approves the budgets in February of the following year. These are forecasts which
refer to the probable demand for commodities which are moved through the Authority’s port
infrastructure.
The budget process generally gives an indication of the current year’s performance (Latest Estimates); the
following year’s volumes (budget period); and the forecast for the next six years. This in essence allows
Transnet to plan its goals for the short to medium term and determine its projected profitability over the
period.
The volumes budget compilation follows a bottom-up approach, commencing with the Authority’s Key
Account Managers (KAM’s) at port level communicating and liaising with customers concerning their
operational and strategic plans and how this translates into volume forecasts for the six year period. The
KAM’s also liaise with all Port Terminals operating within their ports for alignment purposes and will then
consolidate at Port Level for all different cargo categories and forward to Head Office for consolidation.
During the budget evaluation process that follows, various key factors such as historic, prevailing and
anticipated market conditions, operational efficiencies, and infrastructure capacity levels and anticipated
improvements throughout the value chain, are considered in order to validate the reasonableness of
commodity volume projections over the period.
Further, Transnet has implemented periodic volume validation exercises which entail a formal interaction
platform with key customers to validate customer volume forecasts. All divisions of Transnet participate
in these volume validation exercises, with the objective of integrated and synchronised volume planning
through the entire commodity value chain. These exercises have assisted the Authority in ensuring
forecasts that are credibly closer to actuals post events.
Historically, volumes forecasted at the time of the tariff application and compared to the actuals (i.e. 18
months later) have had a marginal deviation, which adds credibility to the Authority’s processes as per
Table 11 on pg.33 below.

Transnet National Ports Authority Tariff Application for Financial Year 2017/18 __________________
Page 33 of 78
Table 11: Authority’s Volume Growth
6.3 Cargo
Having faced strong headwinds throughout the last financial year, the world economy again failed to attain
a higher growth momentum in FY 2016/17. Amongst adverse factors there were lower commodity prices,
highly volatile equity and currency markets which impacts South Africa more severely since it is dependent
on foreign capital inflows to finance deficits and shortfalls in the current account. Other factors include
deflationary risks in some parts of the globe particularly developed economies, the United States
consideration of normalising the monetary policy, as well as the slowing Chinese economy due to its
structural adjustments and weaker global demand. These factors impact the South African economy
directly. These factors drive activity in the South African ports as they are global demand and supply
dynamics which influences the movement of cargo across the globe.
The Authority has various categories of cargo that traverse port infrastructure. Through the movement of
cargo the Authority generates revenue in its ports in the form of cargo dues. Cargo is segregated in
accordance with how it is handled in the port. These categories include cargo that comes in the form of
containers, automotives and bulk. The bulk cargo is further separated into dry, break and liquid (which
includes petroleum and chemicals).
Further classification splits cargo into imports, exports, coastwise and transhipments.
Imports emanates from international destinations into South African ports.
Export cargo is shipped from South African ports for international destinations.
Coastwise cargo is shipped within South African ports.
Transhipment is cargo emanating from foreign and international ports for international destinations
other than South African ports. However, it is handled as cargo in transit within the South African ports.
Tariff Application Actuals Tariff Application Actuals Tariff Application Budget
Deepsea Full: Imports 1 469 318 1 434 668 -2.36% 1 462 031 1 438 931 -1.58% 1 484 081 1 485 279 0.08%
Deepsea Full: Exports 1 068 067 1 083 534 1.45% 1 221 667 1 067 037 -12.66% 1 234 759 1 176 692 -4.70%
Transhipments 1 131 724 1 102 705 -2.56% 1 111 657 971 637 -12.60% 1 241 142 1 126 514 -9.24%
Other 1 110 046 1 078 258 -2.86% 1 039 133 961 567 -7.46% 1 149 836 1 163 841 1.22%
Total 4 779 155 4 699 165 -1.67% 4 834 488 4 439 172 -8.18% 5 109 818 4 952 326 -3.08%
Vehicles: Imports 387 857 359 948 -7.20% 334 739 362 571 8.31% 409 250 380 809 -6.95%
Vehicles: Exports 216 925 265 989 22.62% 277 311 297 879 7.42% 263 832 314 734 19.29%
Other 12 730 42 384 232.95% 85 659 36 599 -57.27% 7 091 40 751 474.69%
Total 617 512 668 321 8.23% 697 709 697 049 -0.09% 680 173 736 294 8.25%
Break Bulk: Imports 1 703 019 3 212 736 88.65% 2 490 659 2 343 785 -5.90% 2 452 233 2 018 759 -17.68%
Break Bulk: Exports 8 889 842 5 967 281 -32.88% 5 888 748 5 031 883 -14.55% 6 509 241 5 208 158 -19.99%
Other 104 934 281 312 168.08% 291 736 192 507 -34.01% 33 781 75 566 123.69%
Total 10 697 795 9 461 329 -11.56% 8 671 143 7 568 175 -12.72% 8 995 255 7 302 483 -18.82%
Coal Exports 87 930 000 78 188 933 -11.08% 79 252 931 76 677 750 -3.25% 80 998 000 80 430 000 -0.70%
Iron Ore Exports 60 400 000 57 200 167 -5.30% 58 105 245 58 671 830 0.98% 60 500 000 60 000 000 -0.83%
Manganese Ore Exports 7 800 000 10 677 828 36.90% 7 927 532 9 674 685 22.04% 10 300 000 11 425 000 10.92%
Other Dry Bulk 26 041 882 25 540 921 -1.92% 26 934 444 25 761 651 -4.35% 28 255 002 28 294 774 0.14%
Total 182 171 882 171 607 849 -5.80% 172 220 152 170 785 916 -0.83% 180 053 002 180 149 774 0.05%
Petroleum 32 619 504 34 175 968 4.77% 34 062 173 32 894 389 -3.43% 34 540 414 32 397 371 -6.20%
Chemicals 1 984 753 2 179 697 9.82% 1 923 002 2 213 120 15.09% 2 256 856 1 865 878 -17.32%
Other Liquid bulk 8 272 953 6 429 283 -22.29% 1 332 224 6 597 376 395.22% 1 187 381 6 595 372 455.46%
Total 42 877 210 42 784 948 -0.22% 37 317 399 41 704 885 11.76% 37 984 651 40 858 621 7.57%
Break Bulk (Metric Tons)
Dry Bulk (Metric Tons)
Liquid Bulk (kl)
Deviations
TA vs BudgetDetails
Deviations
TA vs Actuals
Deviations
TA vs Actuals
FY2014/15 FY2015/16 FY2016/17
Containers (TEUs)
Vehicles (Units)
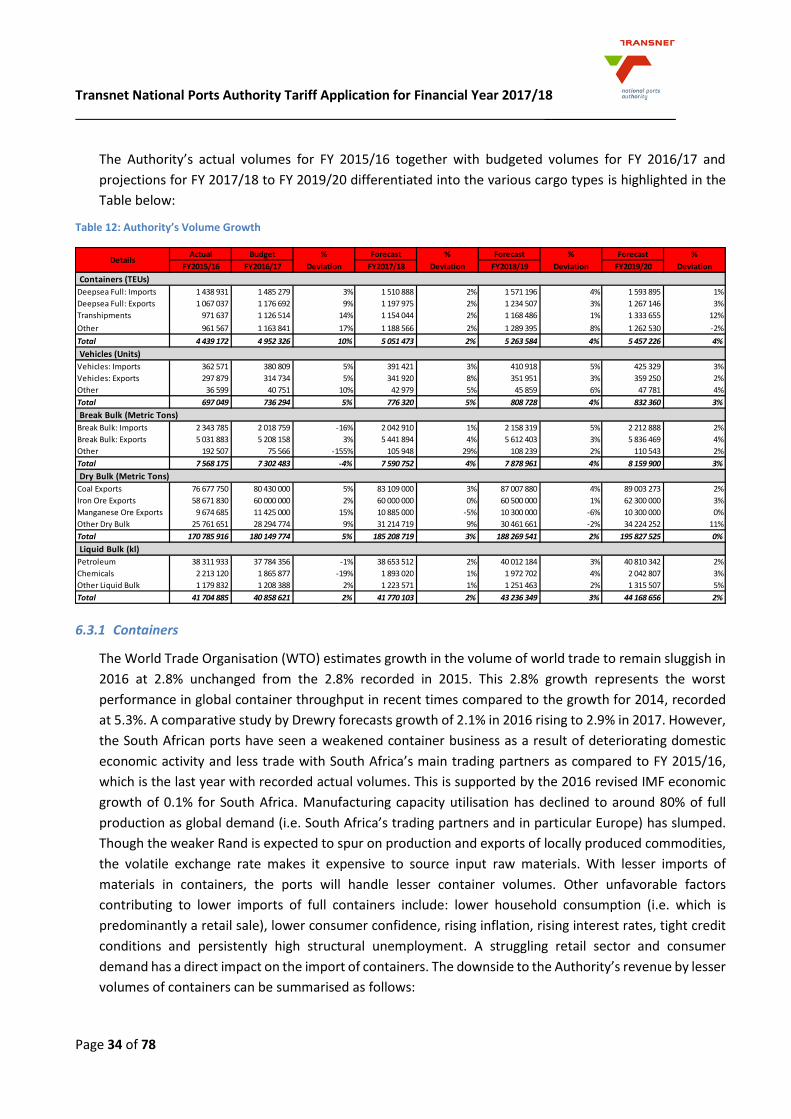
Transnet National Ports Authority Tariff Application for Financial Year 2017/18 __________________
Page 34 of 78
The Authority’s actual volumes for FY 2015/16 together with budgeted volumes for FY 2016/17 and
projections for FY 2017/18 to FY 2019/20 differentiated into the various cargo types is highlighted in the
Table below:
Table 12: Authority’s Volume Growth
6.3.1 Containers
The World Trade Organisation (WTO) estimates growth in the volume of world trade to remain sluggish in
2016 at 2.8% unchanged from the 2.8% recorded in 2015. This 2.8% growth represents the worst
performance in global container throughput in recent times compared to the growth for 2014, recorded
at 5.3%. A comparative study by Drewry forecasts growth of 2.1% in 2016 rising to 2.9% in 2017. However,
the South African ports have seen a weakened container business as a result of deteriorating domestic
economic activity and less trade with South Africa’s main trading partners as compared to FY 2015/16,
which is the last year with recorded actual volumes. This is supported by the 2016 revised IMF economic
growth of 0.1% for South Africa. Manufacturing capacity utilisation has declined to around 80% of full
production as global demand (i.e. South Africa’s trading partners and in particular Europe) has slumped.
Though the weaker Rand is expected to spur on production and exports of locally produced commodities,
the volatile exchange rate makes it expensive to source input raw materials. With lesser imports of
materials in containers, the ports will handle lesser container volumes. Other unfavorable factors
contributing to lower imports of full containers include: lower household consumption (i.e. which is
predominantly a retail sale), lower consumer confidence, rising inflation, rising interest rates, tight credit
conditions and persistently high structural unemployment. A struggling retail sector and consumer
demand has a direct impact on the import of containers. The downside to the Authority’s revenue by lesser
volumes of containers can be summarised as follows:
Actual Budget % Forecast % Forecast % Forecast %
FY2015/16 FY2016/17 Deviation FY2017/18 Deviation FY2018/19 Deviation FY2019/20 Deviation
Deepsea Full: Imports 1 438 931 1 485 279 3% 1 510 888 2% 1 571 196 4% 1 593 895 1%
Deepsea Full: Exports 1 067 037 1 176 692 9% 1 197 975 2% 1 234 507 3% 1 267 146 3%
Transhipments 971 637 1 126 514 14% 1 154 044 2% 1 168 486 1% 1 333 655 12%
Other 961 567 1 163 841 17% 1 188 566 2% 1 289 395 8% 1 262 530 -2%
Total 4 439 172 4 952 326 10% 5 051 473 2% 5 263 584 4% 5 457 226 4%
Vehicles: Imports 362 571 380 809 5% 391 421 3% 410 918 5% 425 329 3%
Vehicles: Exports 297 879 314 734 5% 341 920 8% 351 951 3% 359 250 2%
Other 36 599 40 751 10% 42 979 5% 45 859 6% 47 781 4%
Total 697 049 736 294 5% 776 320 5% 808 728 4% 832 360 3%
Break Bulk: Imports 2 343 785 2 018 759 -16% 2 042 910 1% 2 158 319 5% 2 212 888 2%
Break Bulk: Exports 5 031 883 5 208 158 3% 5 441 894 4% 5 612 403 3% 5 836 469 4%
Other 192 507 75 566 -155% 105 948 29% 108 239 2% 110 543 2%
Total 7 568 175 7 302 483 -4% 7 590 752 4% 7 878 961 4% 8 159 900 3%
Coal Exports 76 677 750 80 430 000 5% 83 109 000 3% 87 007 880 4% 89 003 273 2%
Iron Ore Exports 58 671 830 60 000 000 2% 60 000 000 0% 60 500 000 1% 62 300 000 3%
Manganese Ore Exports 9 674 685 11 425 000 15% 10 885 000 -5% 10 300 000 -6% 10 300 000 0%
Other Dry Bulk 25 761 651 28 294 774 9% 31 214 719 9% 30 461 661 -2% 34 224 252 11%
Total 170 785 916 180 149 774 5% 185 208 719 3% 188 269 541 2% 195 827 525 0%
Petroleum 38 311 933 37 784 356 -1% 38 653 512 2% 40 012 184 3% 40 810 342 2%
Chemicals 2 213 120 1 865 877 -19% 1 893 020 1% 1 972 702 4% 2 042 807 3%
Other Liquid Bulk 1 179 832 1 208 388 2% 1 223 571 1% 1 251 463 2% 1 315 507 5%
Total 41 704 885 40 858 621 2% 41 770 103 2% 43 236 349 3% 44 168 656 2%
Details
Liquid Bulk (kl)
Containers (TEUs)
Vehicles (Units)
Break Bulk (Metric Tons)
Dry Bulk (Metric Tons)
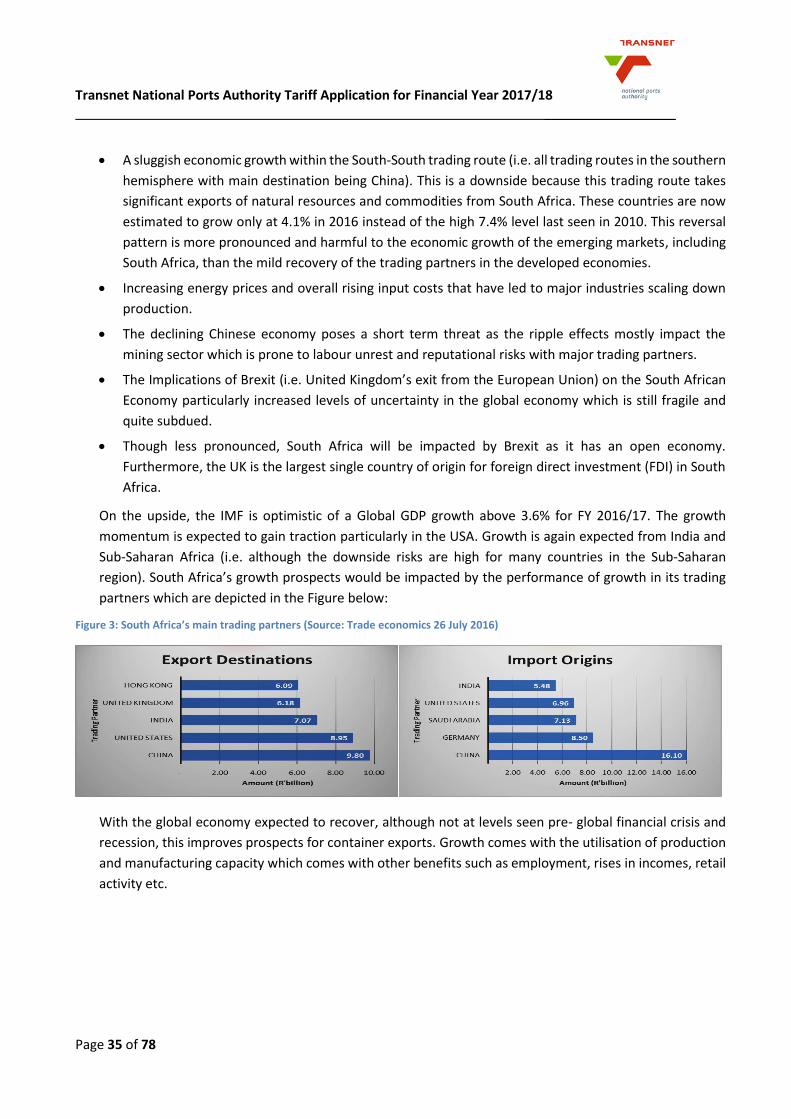
Transnet National Ports Authority Tariff Application for Financial Year 2017/18 __________________
Page 35 of 78
A sluggish economic growth within the South-South trading route (i.e. all trading routes in the southern
hemisphere with main destination being China). This is a downside because this trading route takes
significant exports of natural resources and commodities from South Africa. These countries are now
estimated to grow only at 4.1% in 2016 instead of the high 7.4% level last seen in 2010. This reversal
pattern is more pronounced and harmful to the economic growth of the emerging markets, including
South Africa, than the mild recovery of the trading partners in the developed economies.
Increasing energy prices and overall rising input costs that have led to major industries scaling down
production.
The declining Chinese economy poses a short term threat as the ripple effects mostly impact the
mining sector which is prone to labour unrest and reputational risks with major trading partners.
The Implications of Brexit (i.e. United Kingdom’s exit from the European Union) on the South African
Economy particularly increased levels of uncertainty in the global economy which is still fragile and
quite subdued.
Though less pronounced, South Africa will be impacted by Brexit as it has an open economy.
Furthermore, the UK is the largest single country of origin for foreign direct investment (FDI) in South
Africa.
On the upside, the IMF is optimistic of a Global GDP growth above 3.6% for FY 2016/17. The growth
momentum is expected to gain traction particularly in the USA. Growth is again expected from India and
Sub-Saharan Africa (i.e. although the downside risks are high for many countries in the Sub-Saharan
region). South Africa’s growth prospects would be impacted by the performance of growth in its trading
partners which are depicted in the Figure below:
Figure 3: South Africa’s main trading partners (Source: Trade economics 26 July 2016)
With the global economy expected to recover, although not at levels seen pre- global financial crisis and
recession, this improves prospects for container exports. Growth comes with the utilisation of production
and manufacturing capacity which comes with other benefits such as employment, rises in incomes, retail
activity etc.
Transnet National Ports Authority Tariff Application for Financial Year 2017/18 __________________
Page 36 of 78
6.3.2 Automotives
South Africa has heavily invested (i.e. estimated in the region of more than R25 billion) since the inception
of Industrial Policy Action Plan (IPAP). As part of IPAP’s 2016/17-2018/19 review, the Department of Trade
and Industry (the Dti) highlighted the 2015 financial year successes as new investments in the automotive
industry summarised as follows:
A Chinese company, Beijing Automobile International Corporation (BAIC), co-funded by the Industrial
Development Corporation (IDC) is to build a new motor manufacturing plant in Port Elizabeth;
Ford will invest R2,5bn to build the Everest sports utility vehicle and expand the production of the Ford
Ranger pickup at its Silverton assembly plant in Pretoria, on the back of a R699 million incentive
provided by the Automotive Policy Development Programme (APDP). This should create about 1,200
jobs;
Volkswagen Group will invest more than R4,5bn for new models and infrastructure at its factory in
Port Elizabeth;
BMW will invest R6bn into its Rosslyn plant for the production of the next generation BMW X3 destined
for both local market and exports;
An Iveco-Larimar joint venture has begun the production of trucks and buses on its production plant
in Rosslyn. This plant should employ about 1,000 workers;
Toyota started the completely knocked down (CKD) production of the Quantum minibus at its Durban
facility. The project created 270 direct jobs and introduced 50 new components to be sourced locally;
Nissan announced that it would manufacture its new Datsun Go to be assembled at its Rosslyn plant
and turn the plant into its African manufacturing base;
Volvo has invested R60 million in a regional parts and distribution centre in Benoni, thus consolidating
all logistical operations in Sub-Saharan Africa;
Goodyear SA will invest R670m to increase production of high value-added consumer tyres at its
Uitenhage plant, relocating the plant’s production of medium radial truck tyres to other plants across
the company’s facilities in Europe, the Middle East and Africa;
A Japanese-listed company, Sumitomo Rubber Industries is on phase two of its R2bn investment
focused on manufacturing truck and bus tyres. The company received R300m from the Automotive
Investment Scheme (AIS). This investment should create approximately 1,200 jobs in total in
Ladysmith;
Daimler, a German motor company announced that it intends to make SA the service base for its new
global truck and bus strategy. This move should benefit Mercedes Benz and increase investment in its
East London plant.
These initiatives should propel the export market going forward. However, the disruption in the local
automotive manufacturing may come in the form of wage negotiations and strikes which come with
uncertain risk in production of vehicles. The bulk of South African automotive exports are destined for
Australia, Europe, Africa, Asia and North America. Persistent economic challenges in these regions might
constrain exports volumes.
Transnet National Ports Authority Tariff Application for Financial Year 2017/18 __________________
Page 37 of 78
6.3.3 Coal
Although the coal market remains vulnerable to global economic recovery and performance especially
from China, India and Japan continue to maintain their increased reliance on coal imports which should
support the global coal seaborne market, hence coal is expected to grow between 2%-3% in FY 2017/18 in
the Authority’s volume forecasts. This is a lower growth rate as compared to the recent past. This lower
growth rate is mainly driven by the following:
Excess supply of coal in the markets creates lower than anticipated volume throughput shipped
through Richards Bay Coal Terminal (RBCT) as compared to the past years;
Higher stock piles with shippers waiting for the recovery and hopefully a higher price of coal;
Competition for export volumes still emanates from South Africa’s own domestic consumption; and
Most importantly, response to climate change in efforts to reduce carbon emissions mean alternative
fuel sources are likely to be promoted at the expense of coal.
6.3.4 Iron Ore
The downward trend in commodity prices which started in the last couple of years is still continuing. A
weaker demand, particularly from China and excess supply internationally, has underpinned the adverse
price trends (i.e. to US53 dollars per ton from US197 per ton in 2008) in the Iron Ore market. The prices of
certain commodities recovered somewhat, but this could be transitory as the underlying fundamentals
have generally not changed. Iron Ore is still expected to be subdued in FY 2017/18.
The Port of Saldanha Bay is the dedicated port for iron ore exports with a capacity of 58.5 million tons per
annum (Mtpa). The Multipurpose Terminal at the port will handle Iron Ore volumes in addition to the Bulk
Terminal which has been serving that purpose in Saldanha Bay. Iron Ore (together with Manganese Ore)
are directly influenced by growth in the steel industry and with the rapid drop in demand for steel in China,
Iron Ore is not expected to rise as demand is low for the commodity.
6.3.5 Manganese Ore
Manganese Ore volumes are flat and anticipated to decrease 5% in FY 2017/18. Like Iron Ore and
steelmaking metal, Manganese Ore has had a challenging year, largely due to the downturn in China. Low
manganese prices are impacting market participants in various ways. Some exporters feel that short-term
prices are not as doom and gloom. In the long term, some exporters are feeling bullish as South Africa
exports only 42% to China and 58% to other countries.
The port of Port Elizabeth is the primary exporter of manganese with a capacity of 4.9 Mtpa. Additional
capacity is available in the port of Durban at an estimated capacity of 2 Mtpa, as well as the port of
Saldanha Bay (MPT) with a throughput capacity of 4 Mtpa. This is ample and adequate capacity to handle
the export volumes raised in Table 12 above. South Africa produces the highest quality ore grade in the
world (i.e. 3 times better than the quality produced in China), and will always supply at a constant average
level of approximately 10 million tonnages. As a result, the downturn currently experienced is only
situational and is expected to pick up post FY 2019/20.
Transnet National Ports Authority Tariff Application for Financial Year 2017/18 __________________
Page 38 of 78
6.3.6 Liquid Bulk
The international crude oil prices fell sharply during the course of FY 2015/16, with the supply side factors
dominating the price developments. OPEC, which controls 40% of the global supply, continued with their
operations in the face of falling oil prices and produced even more oil, exacerbating negative market
developments and triggering further price collapses throughout the year. Prices might remain low as non-
OPEC countries compete for their market share.
For the Authority’s ports, liquid bulk volumes increased substantially during the FY 2015/16 as refineries
and speculators exploited the price advantage. However, the buoyant crude oil import was limited by the
country’s storage capacity. In addition, with no recovery in prices, the crude imported remains in storage
instead of being shipped in and out of the country creating activity in the ports.
The other commodities in the liquid bulk category are export of chemicals which is an activity largely
affected by global market conditions, in particular European economies. Although forecasted to be
positive, it is still subdued in FY 2016/17 and FY 2017/18.
6.3.7 Marine Services
Marine volumes comprise of the number of vessels arriving at South African ports and their associated
Gross Registered Tonnage (GRT). The size of the vessel and the number of days spent in the port dictates
the amount that shipping lines will pay for utilising basic port infrastructure and marine services
operational charges, i.e. tugs, berthing and pilot assistance.
The vessel traffic is demand driven as it depends on growth in volumes per cargo commodity. Based on
the current economic outlook, the Authority projects a lesser traffic of vessels at the ports as shipping lines
continue to consolidate cargo volumes to reduce costs (See Figure 4 below).
Figure 4: No. of vessel arrivals
A closer look at the vessel movements indicates the following:
Lesser arrivals in Containers and Bulk vessels - with larger container vessels arriving in the Authority’s
ports. The bulk commodity is a falling category as a result vessel movements are expected to remain
flat;
Vessels carrying all other commodities are expected to remain flat in FY 2017/18.
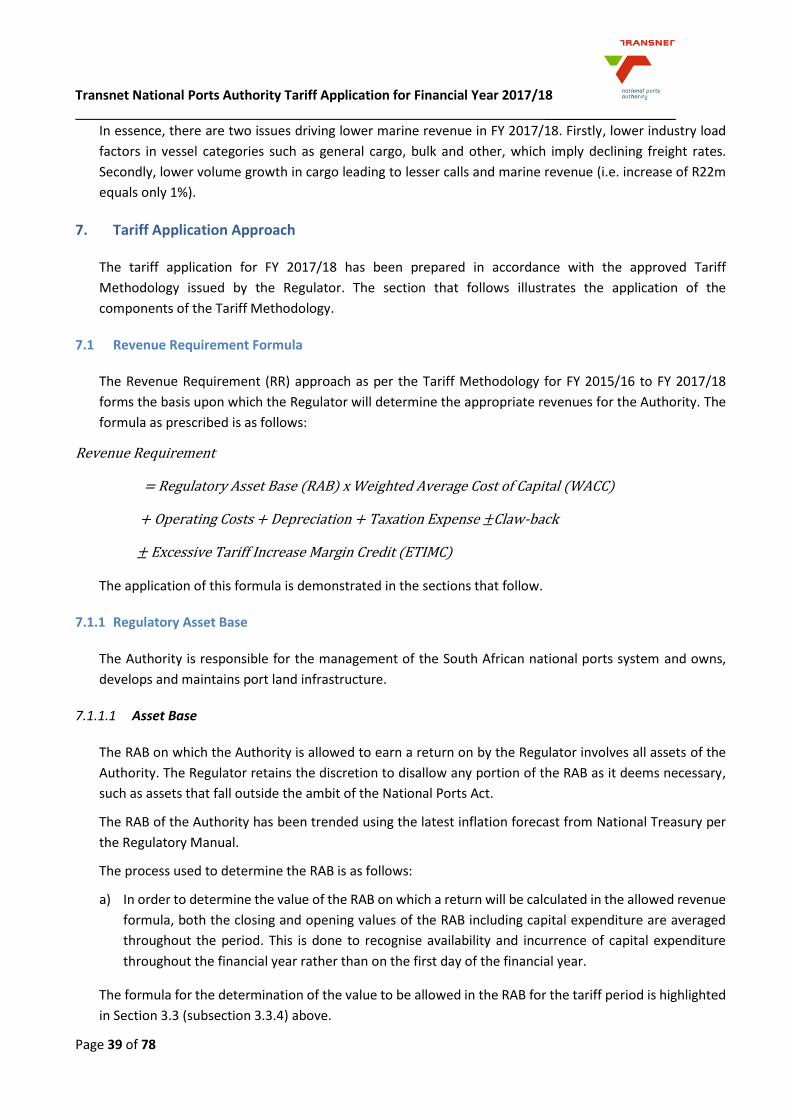
Transnet National Ports Authority Tariff Application for Financial Year 2017/18 __________________
Page 39 of 78
In essence, there are two issues driving lower marine revenue in FY 2017/18. Firstly, lower industry load
factors in vessel categories such as general cargo, bulk and other, which imply declining freight rates.
Secondly, lower volume growth in cargo leading to lesser calls and marine revenue (i.e. increase of R22m
equals only 1%).
7. Tariff Application Approach
The tariff application for FY 2017/18 has been prepared in accordance with the approved Tariff
Methodology issued by the Regulator. The section that follows illustrates the application of the
components of the Tariff Methodology.
7.1 Revenue Requirement Formula
The Revenue Requirement (RR) approach as per the Tariff Methodology for FY 2015/16 to FY 2017/18
forms the basis upon which the Regulator will determine the appropriate revenues for the Authority. The
formula as prescribed is as follows:
Revenue Requirement
= Regulatory Asset Base (RAB) x Weighted Average Cost of Capital (WACC)
+ Operating Costs + Depreciation + Taxation Expense ±Claw-back
± Excessive Tariff Increase Margin Credit (ETIMC)
The application of this formula is demonstrated in the sections that follow.
7.1.1 Regulatory Asset Base
The Authority is responsible for the management of the South African national ports system and owns,
develops and maintains port land infrastructure.
7.1.1.1 Asset Base
The RAB on which the Authority is allowed to earn a return on by the Regulator involves all assets of the
Authority. The Regulator retains the discretion to disallow any portion of the RAB as it deems necessary,
such as assets that fall outside the ambit of the National Ports Act.
The RAB of the Authority has been trended using the latest inflation forecast from National Treasury per
the Regulatory Manual.
The process used to determine the RAB is as follows:
a) In order to determine the value of the RAB on which a return will be calculated in the allowed revenue
formula, both the closing and opening values of the RAB including capital expenditure are averaged
throughout the period. This is done to recognise availability and incurrence of capital expenditure
throughout the financial year rather than on the first day of the financial year.
The formula for the determination of the value to be allowed in the RAB for the tariff period is highlighted
in Section 3.3 (subsection 3.3.4) above.
Transnet National Ports Authority Tariff Application for Financial Year 2017/18 __________________
Page 40 of 78
7.1.1.2 Depreciation
Financial Reporting
In terms on financial reporting, the Authority’s depreciation is recognised on a straight-line basis over the
estimated useful lives of each component of an item of property, plant and equipment. Land and assets in
the course of construction are not depreciated. All other property, plant and equipment, including
capitalised leased assets, are depreciated on a straight-line basis over their estimated useful lives or the
term of the lease, if shorter. Major repairs and overhauls are depreciated over the remaining useful life of
the related asset or to the date of the next major repair or overhaul, whichever is shorter. Depreciation
commences when the asset is available for use. Assets are depreciated over the following periods:
Table 13: Abstract of Depreciation Policy
Tariff Application
In accordance with the Tariff Methodology, the RAB will be depreciated on a straight line, 40 year basis on
the trended/inflated asset base. Furthermore, 50% of the capex that is included in the RAB is inflated in
determining depreciation. The resultant depreciation is R2 015m for FY 2017/18, R2 199m for FY 2018/19
and R2 421m for FY 2019/20.
7.1.1.3 Inflation Trending
The Tariff Methodology prescribes the use of the Consumer Price Index (CPI) for the tariff period based on
the latest forecast published by the National Treasury or alternatively the BER inflation forecast, for the
purposes of trending the RAB. The Authority has utilised the latest forecasts published annually by National
Treasury (Source: Budget Review released on 24 February 2016 (Economic Outlook: Chapter 2)).
Asset class Years
Buildings and structures 10 – 50
Buildings and structures components 10 – 25
Permanent way and works 3 – 95
Aircraft including components 5 – 8
Port infrastructure 12 – 100
Floating craft including components 5 – 40
Containers 10 – 20
Vehicles 3 – 15
Machinery, equipment and furniture 3 – 30
SIGNIFICANT ACCOUNTING POLICIES
PROPERTY, PLANT AND EQUIPMENT
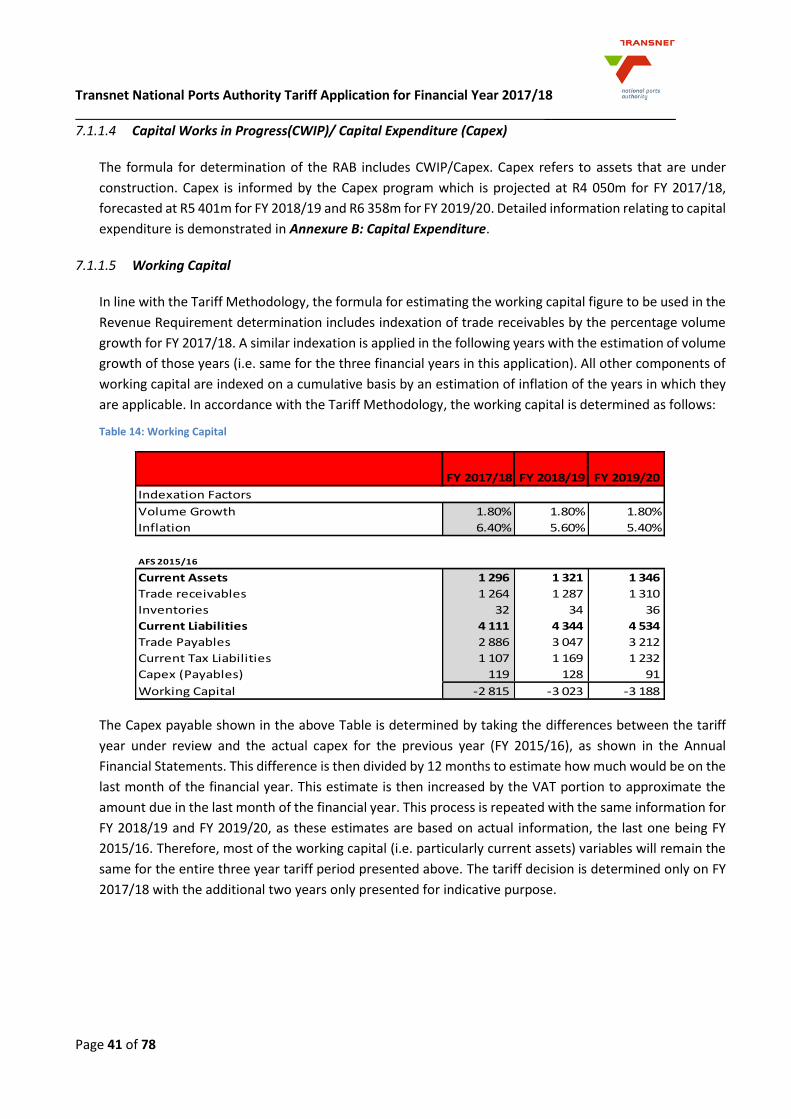
Transnet National Ports Authority Tariff Application for Financial Year 2017/18 __________________
Page 41 of 78
7.1.1.4 Capital Works in Progress(CWIP)/ Capital Expenditure (Capex)
The formula for determination of the RAB includes CWIP/Capex. Capex refers to assets that are under
construction. Capex is informed by the Capex program which is projected at R4 050m for FY 2017/18,
forecasted at R5 401m for FY 2018/19 and R6 358m for FY 2019/20. Detailed information relating to capital
expenditure is demonstrated in Annexure B: Capital Expenditure.
7.1.1.5 Working Capital
In line with the Tariff Methodology, the formula for estimating the working capital figure to be used in the
Revenue Requirement determination includes indexation of trade receivables by the percentage volume
growth for FY 2017/18. A similar indexation is applied in the following years with the estimation of volume
growth of those years (i.e. same for the three financial years in this application). All other components of
working capital are indexed on a cumulative basis by an estimation of inflation of the years in which they
are applicable. In accordance with the Tariff Methodology, the working capital is determined as follows:
Table 14: Working Capital
The Capex payable shown in the above Table is determined by taking the differences between the tariff
year under review and the actual capex for the previous year (FY 2015/16), as shown in the Annual
Financial Statements. This difference is then divided by 12 months to estimate how much would be on the
last month of the financial year. This estimate is then increased by the VAT portion to approximate the
amount due in the last month of the financial year. This process is repeated with the same information for
FY 2018/19 and FY 2019/20, as these estimates are based on actual information, the last one being FY
2015/16. Therefore, most of the working capital (i.e. particularly current assets) variables will remain the
same for the entire three year tariff period presented above. The tariff decision is determined only on FY
2017/18 with the additional two years only presented for indicative purpose.
FY 2017/18 FY 2018/19 FY 2019/20
Indexation Factors
Volume Growth 1.80% 1.80% 1.80%
Inflation 6.40% 5.60% 5.40%
AFS 2015/16
Current Assets 1 296 1 321 1 346
Trade receivables 1 264 1 287 1 310
Inventories 32 34 36
Current Liabilities 4 111 4 344 4 534
Trade Payables 2 886 3 047 3 212
Current Tax Liabilities 1 107 1 169 1 232
Capex (Payables) 119 128 91
Working Capital -2 815 -3 023 -3 188
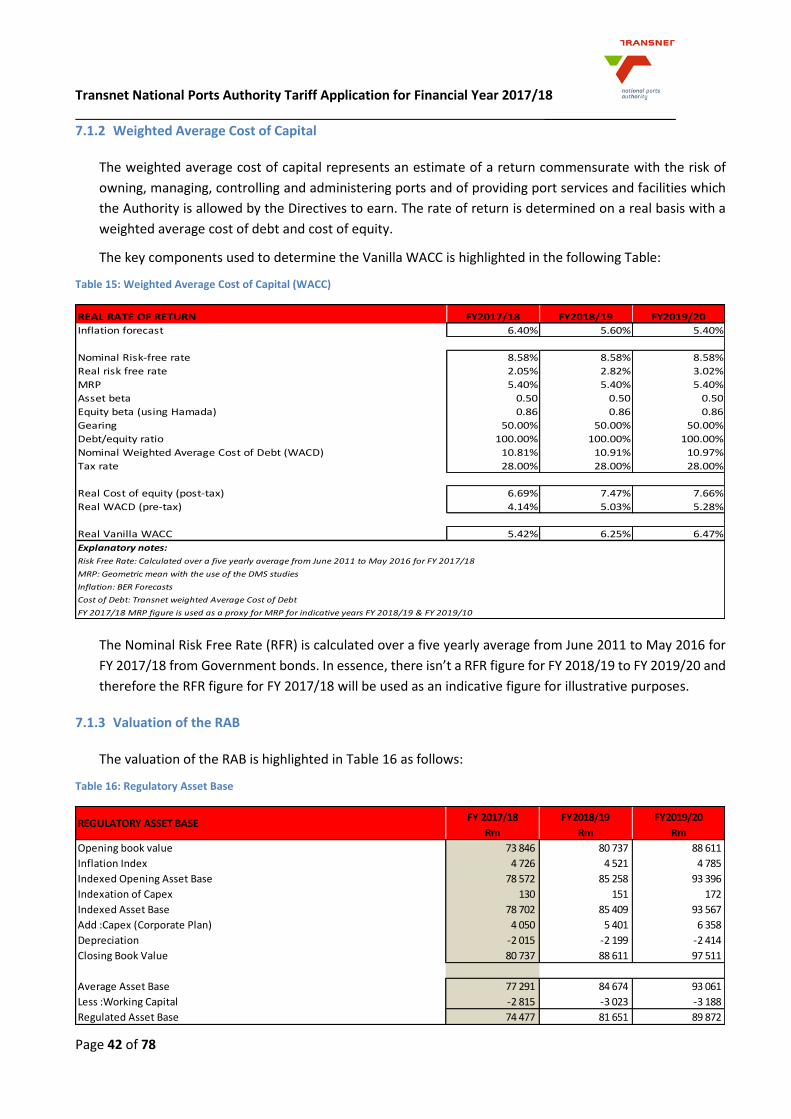
Transnet National Ports Authority Tariff Application for Financial Year 2017/18 __________________
Page 42 of 78
7.1.2 Weighted Average Cost of Capital
The weighted average cost of capital represents an estimate of a return commensurate with the risk of
owning, managing, controlling and administering ports and of providing port services and facilities which
the Authority is allowed by the Directives to earn. The rate of return is determined on a real basis with a
weighted average cost of debt and cost of equity.
The key components used to determine the Vanilla WACC is highlighted in the following Table:
Table 15: Weighted Average Cost of Capital (WACC)
The Nominal Risk Free Rate (RFR) is calculated over a five yearly average from June 2011 to May 2016 for
FY 2017/18 from Government bonds. In essence, there isn’t a RFR figure for FY 2018/19 to FY 2019/20 and
therefore the RFR figure for FY 2017/18 will be used as an indicative figure for illustrative purposes.
7.1.3 Valuation of the RAB
The valuation of the RAB is highlighted in Table 16 as follows:
Table 16: Regulatory Asset Base
REAL RATE OF RETURN FY2017/18 FY2018/19 FY2019/20
Inflation forecast 6.40% 5.60% 5.40%
Nominal Risk-free rate 8.58% 8.58% 8.58%
Real risk free rate 2.05% 2.82% 3.02%
MRP 5.40% 5.40% 5.40%
Asset beta 0.50 0.50 0.50
Equity beta (using Hamada) 0.86 0.86 0.86
Gearing 50.00% 50.00% 50.00%
Debt/equity ratio 100.00% 100.00% 100.00%
Nominal Weighted Average Cost of Debt (WACD) 10.81% 10.91% 10.97%
Tax rate 28.00% 28.00% 28.00%
Real Cost of equity (post-tax) 6.69% 7.47% 7.66%
Real WACD (pre-tax) 4.14% 5.03% 5.28%
Real Vanilla WACC 5.42% 6.25% 6.47%
Explanatory notes:
Risk Free Rate: Calculated over a five yearly average from June 2011 to May 2016 for FY 2017/18
MRP: Geometric mean with the use of the DMS studies
Inflation: BER Forecasts
Cost of Debt: Transnet weighted Average Cost of Debt
FY 2017/18 MRP figure is used as a proxy for MRP for indicative years FY 2018/19 & FY 2019/10
REGULATORY ASSET BASEFY 2017/18
Rm
FY2018/19
Rm
FY2019/20
Rm
Opening book value 73 846 80 737 88 611
Inflation Index 4 726 4 521 4 785
Indexed Opening Asset Base 78 572 85 258 93 396
Indexation of Capex 130 151 172
Indexed Asset Base 78 702 85 409 93 567
Add :Capex (Corporate Plan) 4 050 5 401 6 358
Depreciation -2 015 -2 199 -2 414
Closing Book Value 80 737 88 611 97 511
Average Asset Base 77 291 84 674 93 061
Less :Working Capital -2 815 -3 023 -3 188
Regulated Asset Base 74 477 81 651 89 872
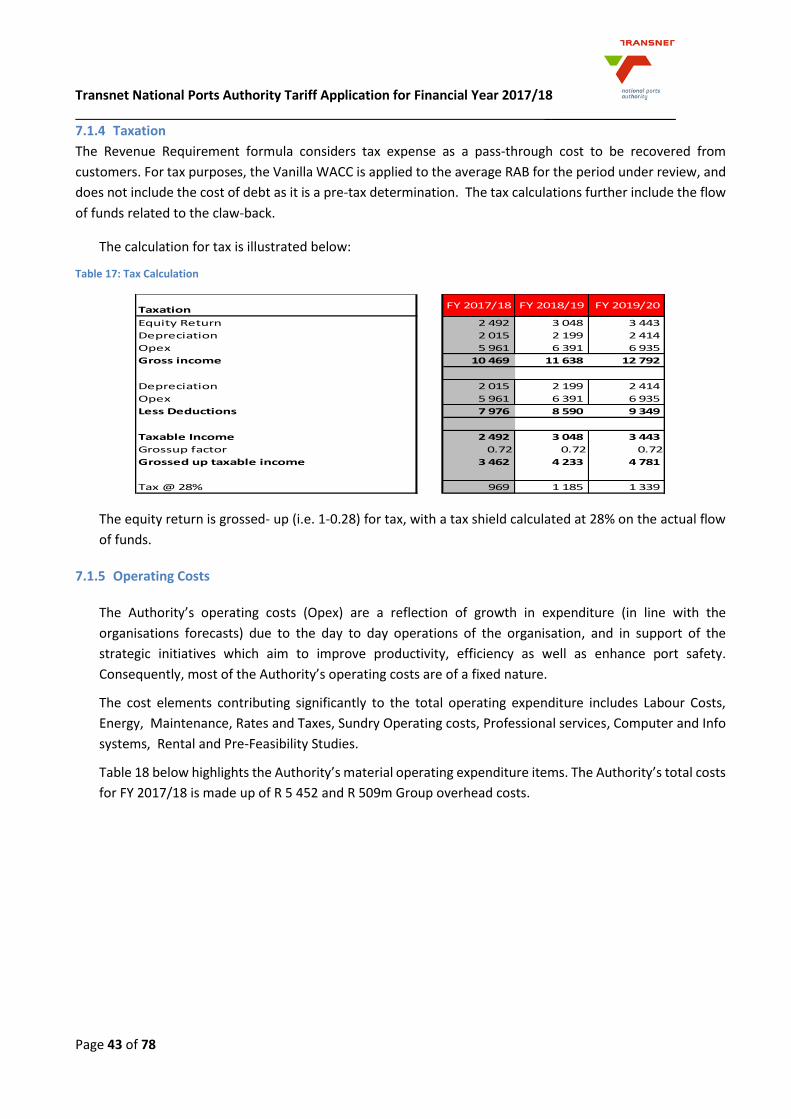
Transnet National Ports Authority Tariff Application for Financial Year 2017/18 __________________
Page 43 of 78
7.1.4 Taxation
The Revenue Requirement formula considers tax expense as a pass-through cost to be recovered from
customers. For tax purposes, the Vanilla WACC is applied to the average RAB for the period under review, and
does not include the cost of debt as it is a pre-tax determination. The tax calculations further include the flow
of funds related to the claw-back.
The calculation for tax is illustrated below:
Table 17: Tax Calculation
The equity return is grossed- up (i.e. 1-0.28) for tax, with a tax shield calculated at 28% on the actual flow
of funds.
7.1.5 Operating Costs
The Authority’s operating costs (Opex) are a reflection of growth in expenditure (in line with the
organisations forecasts) due to the day to day operations of the organisation, and in support of the
strategic initiatives which aim to improve productivity, efficiency as well as enhance port safety.
Consequently, most of the Authority’s operating costs are of a fixed nature.
The cost elements contributing significantly to the total operating expenditure includes Labour Costs,
Energy, Maintenance, Rates and Taxes, Sundry Operating costs, Professional services, Computer and Info
systems, Rental and Pre-Feasibility Studies.
Table 18 below highlights the Authority’s material operating expenditure items. The Authority’s total costs
for FY 2017/18 is made up of R 5 452 and R 509m Group overhead costs.
Taxation FY 2017/18 FY 2018/19 FY 2019/20
Equity Return 2 492 3 048 3 443
Depreciation 2 015 2 199 2 414
Opex 5 961 6 391 6 935
Gross income 10 469 11 638 12 792
Depreciation 2 015 2 199 2 414
Opex 5 961 6 391 6 935
Less Deductions 7 976 8 590 9 349
Taxable Income 2 492 3 048 3 443
Grossup factor 0.72 0.72 0.72
Grossed up taxable income 3 462 4 233 4 781
Tax @ 28% 969 1 185 1 339
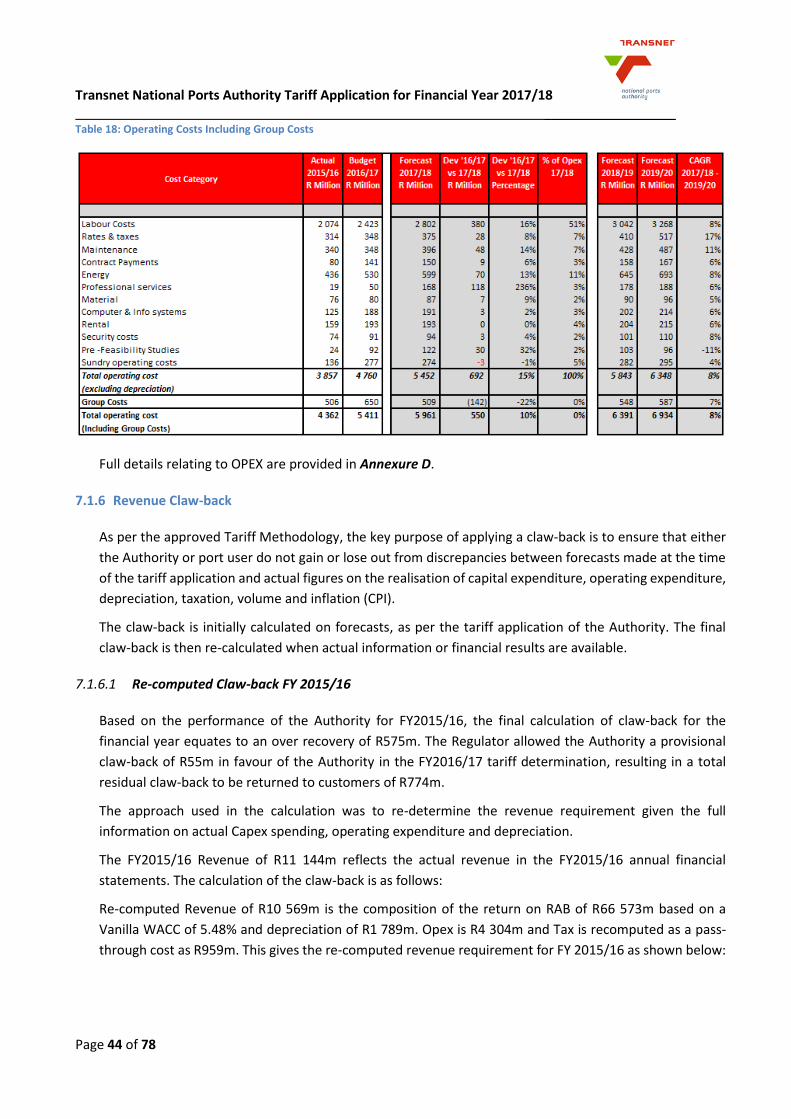
Transnet National Ports Authority Tariff Application for Financial Year 2017/18 __________________
Page 44 of 78
Table 18: Operating Costs Including Group Costs
Full details relating to OPEX are provided in Annexure D.
7.1.6 Revenue Claw-back
As per the approved Tariff Methodology, the key purpose of applying a claw-back is to ensure that either
the Authority or port user do not gain or lose out from discrepancies between forecasts made at the time
of the tariff application and actual figures on the realisation of capital expenditure, operating expenditure,
depreciation, taxation, volume and inflation (CPI).
The claw-back is initially calculated on forecasts, as per the tariff application of the Authority. The final
claw-back is then re-calculated when actual information or financial results are available.
7.1.6.1 Re-computed Claw-back FY 2015/16
Based on the performance of the Authority for FY2015/16, the final calculation of claw-back for the
financial year equates to an over recovery of R575m. The Regulator allowed the Authority a provisional
claw-back of R55m in favour of the Authority in the FY2016/17 tariff determination, resulting in a total
residual claw-back to be returned to customers of R774m.
The approach used in the calculation was to re-determine the revenue requirement given the full
information on actual Capex spending, operating expenditure and depreciation.
The FY2015/16 Revenue of R11 144m reflects the actual revenue in the FY2015/16 annual financial
statements. The calculation of the claw-back is as follows:
Re-computed Revenue of R10 569m is the composition of the return on RAB of R66 573m based on a
Vanilla WACC of 5.48% and depreciation of R1 789m. Opex is R4 304m and Tax is recomputed as a pass-
through cost as R959m. This gives the re-computed revenue requirement for FY 2015/16 as shown below:
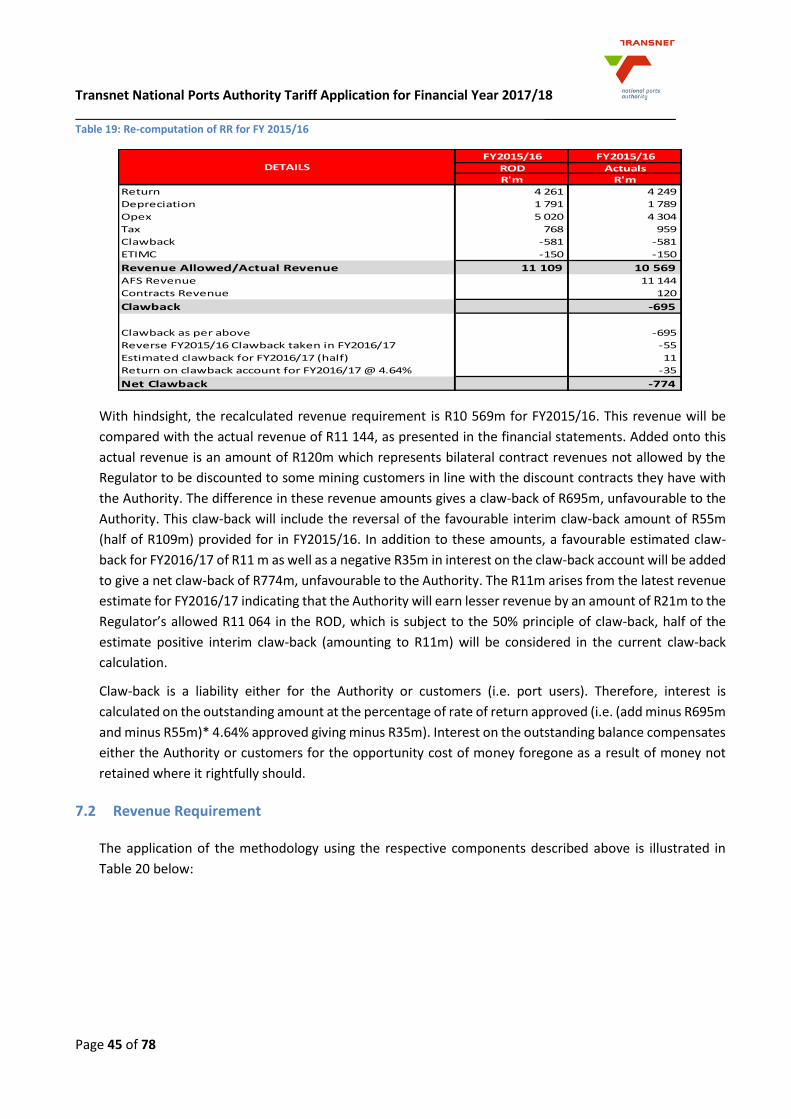
Transnet National Ports Authority Tariff Application for Financial Year 2017/18 __________________
Page 45 of 78
Table 19: Re-computation of RR for FY 2015/16
With hindsight, the recalculated revenue requirement is R10 569m for FY2015/16. This revenue will be
compared with the actual revenue of R11 144, as presented in the financial statements. Added onto this
actual revenue is an amount of R120m which represents bilateral contract revenues not allowed by the
Regulator to be discounted to some mining customers in line with the discount contracts they have with
the Authority. The difference in these revenue amounts gives a claw-back of R695m, unfavourable to the
Authority. This claw-back will include the reversal of the favourable interim claw-back amount of R55m
(half of R109m) provided for in FY2015/16. In addition to these amounts, a favourable estimated claw-
back for FY2016/17 of R11 m as well as a negative R35m in interest on the claw-back account will be added
to give a net claw-back of R774m, unfavourable to the Authority. The R11m arises from the latest revenue
estimate for FY2016/17 indicating that the Authority will earn lesser revenue by an amount of R21m to the
Regulator’s allowed R11 064 in the ROD, which is subject to the 50% principle of claw-back, half of the
estimate positive interim claw-back (amounting to R11m) will be considered in the current claw-back
calculation.
Claw-back is a liability either for the Authority or customers (i.e. port users). Therefore, interest is
calculated on the outstanding amount at the percentage of rate of return approved (i.e. (add minus R695m
and minus R55m)* 4.64% approved giving minus R35m). Interest on the outstanding balance compensates
either the Authority or customers for the opportunity cost of money foregone as a result of money not
retained where it rightfully should.
7.2 Revenue Requirement
The application of the methodology using the respective components described above is illustrated in
Table 20 below:
FY2015/16 FY2015/16
ROD ActualsR'm R'm
4 261 4 249
1 791 1 789
5 020 4 304
768 959
-581 -581
-150 -150
11 109 10 569
11 144
Contracts Revenue 120
-695
-695
-55
11
-35
-774
DETAILS
Return
Depreciation
Opex
Tax
Clawback
ETIMC
Revenue Allowed/Actual Revenue
AFS Revenue
Clawback
Clawback as per above
Reverse FY2015/16 Clawback taken in FY2016/17
Estimated clawback for FY2016/17 (half)
Return on clawback account for FY2016/17 @ 4.64%
Net Clawback
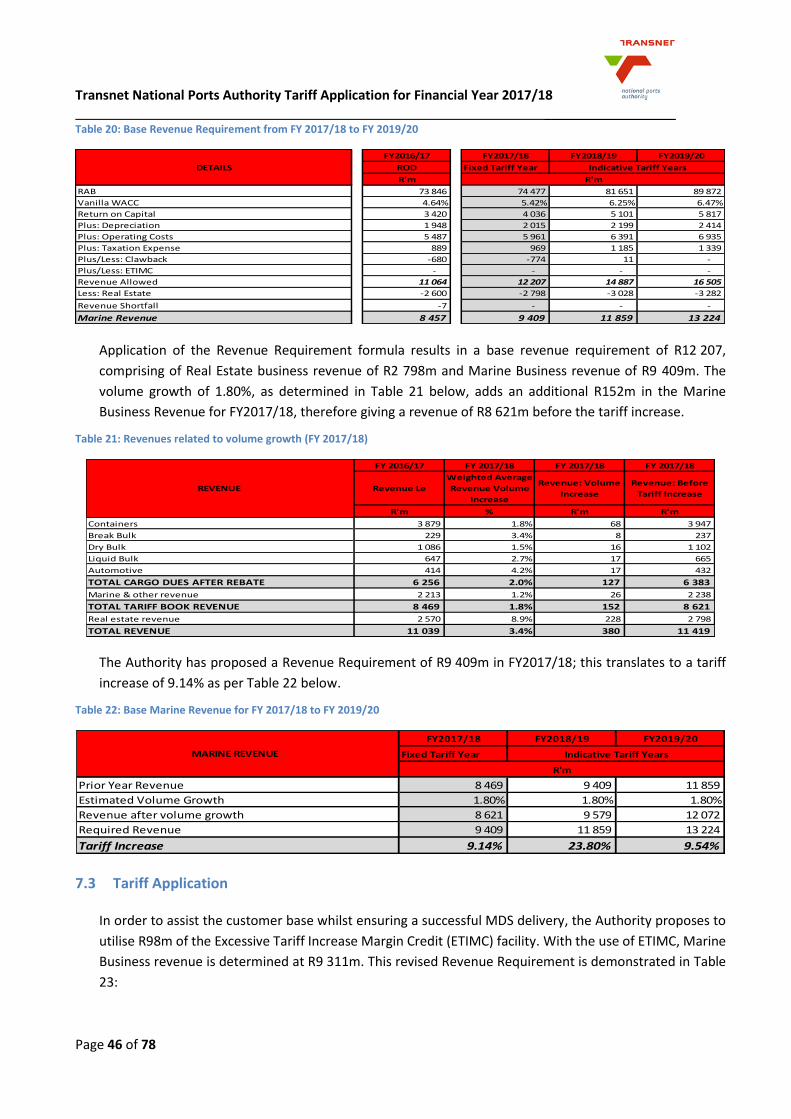
Transnet National Ports Authority Tariff Application for Financial Year 2017/18 __________________
Page 46 of 78
Table 20: Base Revenue Requirement from FY 2017/18 to FY 2019/20
Application of the Revenue Requirement formula results in a base revenue requirement of R12 207,
comprising of Real Estate business revenue of R2 798m and Marine Business revenue of R9 409m. The
volume growth of 1.80%, as determined in Table 21 below, adds an additional R152m in the Marine
Business Revenue for FY2017/18, therefore giving a revenue of R8 621m before the tariff increase.
Table 21: Revenues related to volume growth (FY 2017/18)
The Authority has proposed a Revenue Requirement of R9 409m in FY2017/18; this translates to a tariff
increase of 9.14% as per Table 22 below.
Table 22: Base Marine Revenue for FY 2017/18 to FY 2019/20
7.3 Tariff Application
In order to assist the customer base whilst ensuring a successful MDS delivery, the Authority proposes to
utilise R98m of the Excessive Tariff Increase Margin Credit (ETIMC) facility. With the use of ETIMC, Marine
Business revenue is determined at R9 311m. This revised Revenue Requirement is demonstrated in Table
23:
FY2016/17 FY2017/18 FY2018/19 FY2019/20
ROD Fixed Tariff Year
R'm
RAB 73 846 74 477 81 651 89 872
Vanilla WACC 4.64% 5.42% 6.25% 6.47%
Return on Capital 3 420 4 036 5 101 5 817
Plus: Depreciation 1 948 2 015 2 199 2 414
Plus: Operating Costs 5 487 5 961 6 391 6 935
Plus: Taxation Expense 889 969 1 185 1 339
Plus/Less: Clawback -680 -774 11 -
Plus/Less: ETIMC - - - -
Revenue Allowed 11 064 12 207 14 887 16 505
Less: Real Estate -2 600 -2 798 -3 028 -3 282
Revenue Shortfall -7 - - -
Marine Revenue 8 457 9 409 11 859 13 224
Indicative Tariff Years
R'm
DETAILS
FY 2016/17 FY 2017/18 FY 2017/18 FY 2017/18
Revenue Le
Weighted Average
Revenue Volume
Increase
Revenue: Volume
Increase
Revenue: Before
Tariff Increase
R'm % R'm R'm
Containers 3 879 1.8% 68 3 947
Break Bulk 229 3.4% 8 237
Dry Bulk 1 086 1.5% 16 1 102
Liquid Bulk 647 2.7% 17 665
Automotive 414 4.2% 17 432
TOTAL CARGO DUES AFTER REBATE 6 256 2.0% 127 6 383
Marine & other revenue 2 213 1.2% 26 2 238
TOTAL TARIFF BOOK REVENUE 8 469 1.8% 152 8 621
Real estate revenue 2 570 8.9% 228 2 798
TOTAL REVENUE 11 039 3.4% 380 11 419
REVENUE
FY2017/18 FY2018/19 FY2019/20
Fixed Tariff Year
8 469 9 409 11 859
1.80% 1.80% 1.80%
8 621 9 579 12 072
9 409 11 859 13 224
9.14% 23.80% 9.54%
MARINE REVENUE Indicative Tariff Years
R'm
Prior Year Revenue
Estimated Volume Growth
Revenue after volume growth
Required Revenue
Tariff Increase
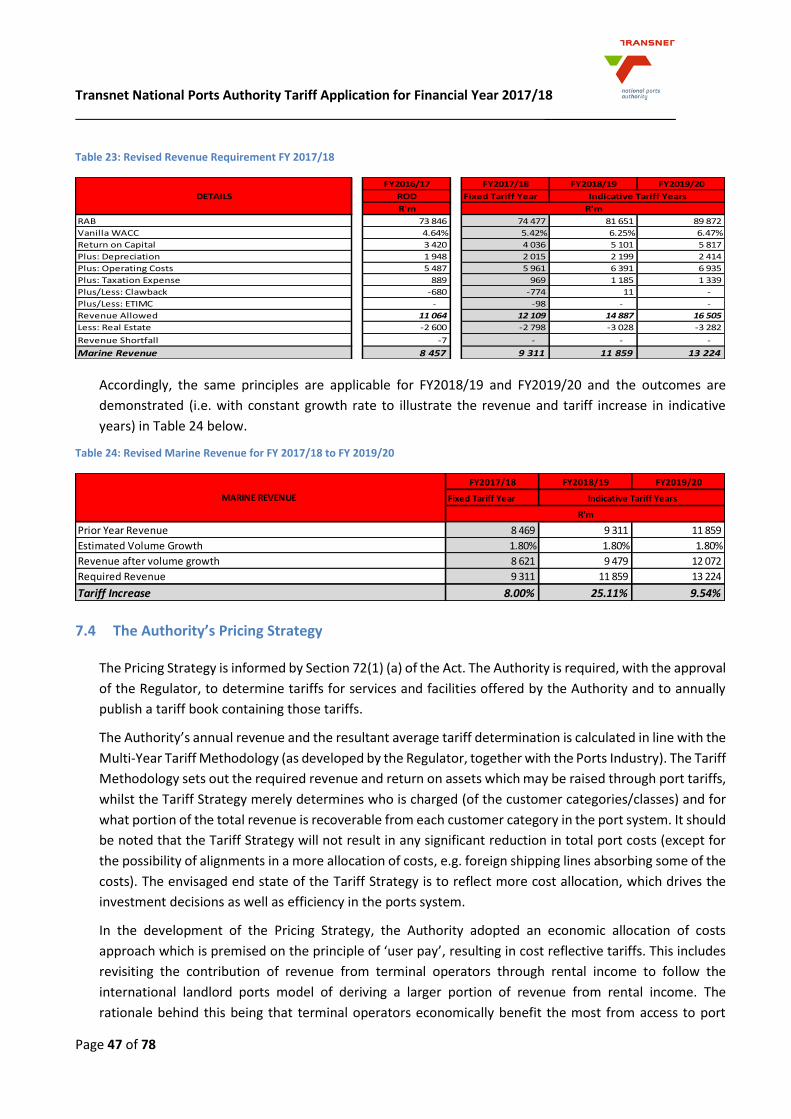
Transnet National Ports Authority Tariff Application for Financial Year 2017/18 __________________
Page 47 of 78
Table 23: Revised Revenue Requirement FY 2017/18
Accordingly, the same principles are applicable for FY2018/19 and FY2019/20 and the outcomes are
demonstrated (i.e. with constant growth rate to illustrate the revenue and tariff increase in indicative
years) in Table 24 below.
Table 24: Revised Marine Revenue for FY 2017/18 to FY 2019/20
7.4 The Authority’s Pricing Strategy
The Pricing Strategy is informed by Section 72(1) (a) of the Act. The Authority is required, with the approval
of the Regulator, to determine tariffs for services and facilities offered by the Authority and to annually
publish a tariff book containing those tariffs.
The Authority’s annual revenue and the resultant average tariff determination is calculated in line with the
Multi-Year Tariff Methodology (as developed by the Regulator, together with the Ports Industry). The Tariff
Methodology sets out the required revenue and return on assets which may be raised through port tariffs,
whilst the Tariff Strategy merely determines who is charged (of the customer categories/classes) and for
what portion of the total revenue is recoverable from each customer category in the port system. It should
be noted that the Tariff Strategy will not result in any significant reduction in total port costs (except for
the possibility of alignments in a more allocation of costs, e.g. foreign shipping lines absorbing some of the
costs). The envisaged end state of the Tariff Strategy is to reflect more cost allocation, which drives the
investment decisions as well as efficiency in the ports system.
In the development of the Pricing Strategy, the Authority adopted an economic allocation of costs
approach which is premised on the principle of ‘user pay’, resulting in cost reflective tariffs. This includes
revisiting the contribution of revenue from terminal operators through rental income to follow the
international landlord ports model of deriving a larger portion of revenue from rental income. The
rationale behind this being that terminal operators economically benefit the most from access to port
FY2016/17 FY2017/18 FY2018/19 FY2019/20
ROD Fixed Tariff Year
R'm
RAB 73 846 74 477 81 651 89 872
Vanilla WACC 4.64% 5.42% 6.25% 6.47%
Return on Capital 3 420 4 036 5 101 5 817
Plus: Depreciation 1 948 2 015 2 199 2 414
Plus: Operating Costs 5 487 5 961 6 391 6 935
Plus: Taxation Expense 889 969 1 185 1 339
Plus/Less: Clawback -680 -774 11 -
Plus/Less: ETIMC - -98 - -
Revenue Allowed 11 064 12 109 14 887 16 505
Less: Real Estate -2 600 -2 798 -3 028 -3 282
Revenue Shortfall -7 - - -
Marine Revenue 8 457 9 311 11 859 13 224
Indicative Tariff Years
R'm
DETAILS
FY2017/18 FY2018/19 FY2019/20
Fixed Tariff Year
8 469 9 311 11 859
1.80% 1.80% 1.80%
8 621 9 479 12 072
9 311 11 859 13 224
8.00% 25.11% 9.54%
MARINE REVENUE
Prior Year Revenue
Estimated Volume Growth
Revenue after volume growth
Required Revenue
Tariff Increase
Indicative Tariff Years
R'm
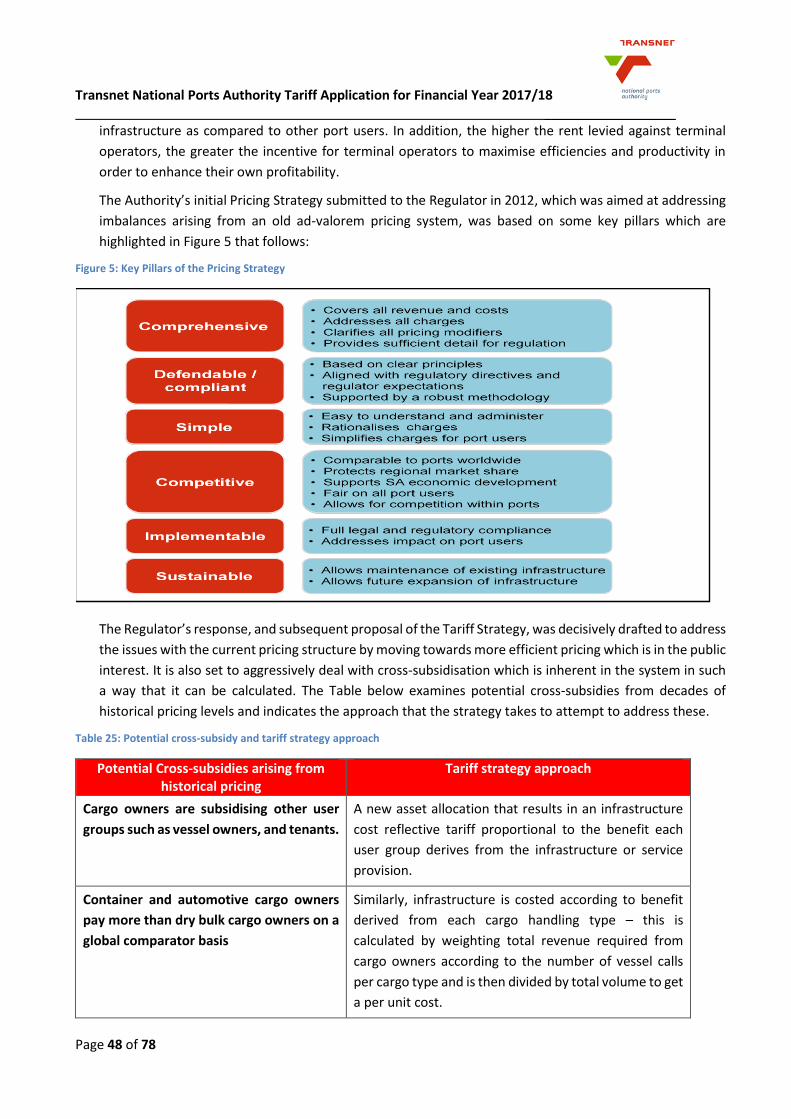
Transnet National Ports Authority Tariff Application for Financial Year 2017/18 __________________
Page 48 of 78
infrastructure as compared to other port users. In addition, the higher the rent levied against terminal
operators, the greater the incentive for terminal operators to maximise efficiencies and productivity in
order to enhance their own profitability.
The Authority’s initial Pricing Strategy submitted to the Regulator in 2012, which was aimed at addressing
imbalances arising from an old ad-valorem pricing system, was based on some key pillars which are
highlighted in Figure 5 that follows:
Figure 5: Key Pillars of the Pricing Strategy
The Regulator’s response, and subsequent proposal of the Tariff Strategy, was decisively drafted to address
the issues with the current pricing structure by moving towards more efficient pricing which is in the public
interest. It is also set to aggressively deal with cross-subsidisation which is inherent in the system in such
a way that it can be calculated. The Table below examines potential cross-subsidies from decades of
historical pricing levels and indicates the approach that the strategy takes to attempt to address these.
Table 25: Potential cross-subsidy and tariff strategy approach
Potential Cross-subsidies arising from historical pricing
Tariff strategy approach
Cargo owners are subsidising other user
groups such as vessel owners, and tenants.
A new asset allocation that results in an infrastructure
cost reflective tariff proportional to the benefit each
user group derives from the infrastructure or service
provision.
Container and automotive cargo owners
pay more than dry bulk cargo owners on a
global comparator basis
Similarly, infrastructure is costed according to benefit
derived from each cargo handling type – this is
calculated by weighting total revenue required from
cargo owners according to the number of vessel calls
per cargo type and is then divided by total volume to get
a per unit cost.
Transnet National Ports Authority Tariff Application for Financial Year 2017/18 __________________
Page 49 of 78
Potential Cross-subsidies arising from historical pricing
Tariff strategy approach
It is still to be determined whether lessees
are being subsidised (i.e. paying less than
market value for their land) and whether
some lessees are subsidising others (i.e.
paying unequal or unfair tariffs).
The Regulator will start to actively monitor rental prices
to ensure that two pieces of land with similar
characteristics are not being charged radically different
rentals. Furthermore, the Regulator will endeavor to
determine the market value of port land as part of its
asset valuation exercise.
Port users of a particular port subsidising
users in other ports, through a system
wide tariff book approach.
System-wide pricing will remain in order to reduce the
risk placed on any single port user; however, the tariff
book is to be rebalanced and direct user charges in
certain instances may be introduced.
Port users subsidise fledgling port-related
industries and other national policy
initiatives/government objectives.
Discounting certain infrastructure for identified port
users in order to achieve national objectives of
economic growth and inclusion will remain.
Use of port revenue/profits for non-port
purposes.
This is outside the scope of the tariff strategy.
Port users of the same category or user
group paying lower tariffs than similar
users through differentiated tariffs or
discount structures.
All discount structures are to be removed from the tariff
book. Tariff rationalisation will result in a gradual move
towards consolidated tariffs that will include the
removal of any discount structure currently in place.
Certain built-in incentives and discounts will remain,
mainly related to coastwise shipping and transhipment
etc.
The above statements are seen as generalised statements and exceptions may persist. The Regulator is
committed to understanding and unravelling any other cross-subsidies which prevent efficient pricing in
the port system and welcomes the views of port stakeholders in this regard. The real transition in terms of
which tariffs will be set to converge on a base rate, as determined in accordance with these principles
established in the Tariff Strategy, will be discussed in 7.6 below.
7.5 Asset Cost Allocations
In the Tariff Strategy, the Regulator follows a coherent costed infrastructure according to an asset
allocation in the similar manner prescribed by the Authority. The Regulator’s Tariff Strategy for the South
African ports is premised on the following principles:
Cost causation: To provide port users with the correct pricing signals when utilising port facilities;
Cost minimisation: An approach seen to minimise costs;
Distribution of benefits: To achieve equity and reasonability between causers and beneficiaries of
costs; and
Practicality: For practicality and ease of implementation of Tariff Strategy.

Transnet National Ports Authority Tariff Application for Financial Year 2017/18 __________________
Page 50 of 78
Furthermore, in the allocation or attribution of the cost of port assets, the Regulator takes into
consideration which user classes depend more on a particular asset type and the extent to which they
would be affected if the infrastructure did not exist. Therefore, in considering where the burden of this
asset class allocation should be, the Regulator also looked at the activities of the different users and the
benefit they derive therefrom. The Regulator has categorised port users as follows:
Shipping Lines;
Cargo Owners;
Terminal operators (and all cargo working lessees); and
All other lessees in the port system.
The general underlying logic is that the seaward side benefits mostly shipping lines and cargo owners,
while the interface benefits mostly shipping lines and tenants, and the landward side benefits mostly
tenants.
Figure 6 below identifies the key port assets and allocates these assets to user groups in order to determine
a more equitable share of infrastructure and cost sharing between the broad groups.
Figure 6: Ports Regulator’s Asset Allocations
This pricing structure, which is cost reflective, is envisaged to be phased-in over a period of at least 10
years and the Regulator has highlighted the following factors for a prolonged implementation period to be
accommodated:
contractual agreements and binding leases prevents the Regulator from changing tariffs too quickly;
large shifts in tariffs may lead to unintended consequences and as such, a more gradual approach is
favoured; and
the cost structure of the port system by its very nature changes and evolves over time.
The phased approach as envisaged by the Regulator will lead to the following tariff increase over the
envisaged 10 year period:
Cargo Owners: - 5.2% real price decrease on an annual basis;
Shipping Lines: 7.2% real price increase on an annual basis; and
Tenants: 2.8% real increase on lease revenue on an annual basis.
Port User Asset Class Lessees
Terminal
Operator Cargo Owners Shipping Lines
Breakwaters 33% shared on a NBV basis 33% 33%
Channels, Fairways, basins 50% 50%
Quay walls, berths and jetties 50% 50%
All ship working vessels and aids to
navigation 100%
Vessel repair infrastructure 40% 15% 15% 30%
All movable NPA assets, buildings and
structures (not part of lease
agreements) and unused land 50% shared on a NBV basis 25% 25%
Terminal land and staging areas 100%
Non-Terminal Land including
recreational and yachting 100%
All common access infrastructure 66% Shared on a NBV basis 33%
Overheads 50% shared on a NBV basis 25% 25%
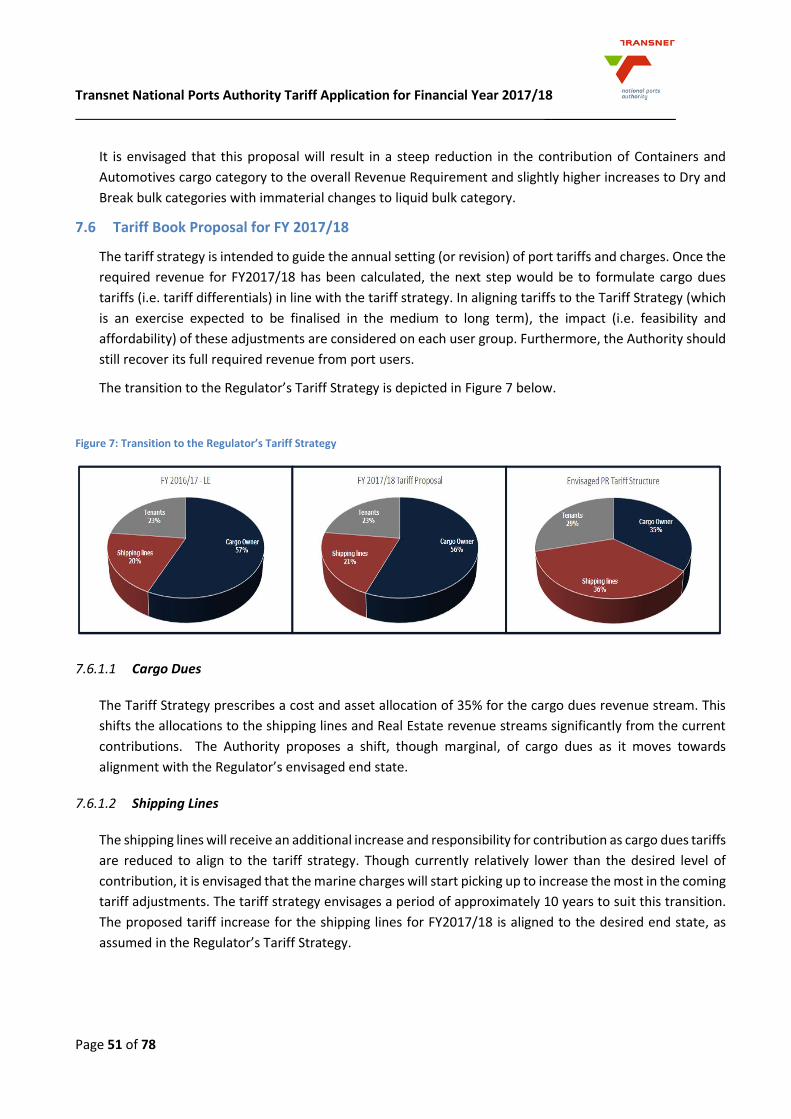
Transnet National Ports Authority Tariff Application for Financial Year 2017/18 __________________
Page 51 of 78
It is envisaged that this proposal will result in a steep reduction in the contribution of Containers and
Automotives cargo category to the overall Revenue Requirement and slightly higher increases to Dry and
Break bulk categories with immaterial changes to liquid bulk category.
7.6 Tariff Book Proposal for FY 2017/18
The tariff strategy is intended to guide the annual setting (or revision) of port tariffs and charges. Once the
required revenue for FY2017/18 has been calculated, the next step would be to formulate cargo dues
tariffs (i.e. tariff differentials) in line with the tariff strategy. In aligning tariffs to the Tariff Strategy (which
is an exercise expected to be finalised in the medium to long term), the impact (i.e. feasibility and
affordability) of these adjustments are considered on each user group. Furthermore, the Authority should
still recover its full required revenue from port users.
The transition to the Regulator’s Tariff Strategy is depicted in Figure 7 below.
Figure 7: Transition to the Regulator’s Tariff Strategy
7.6.1.1 Cargo Dues
The Tariff Strategy prescribes a cost and asset allocation of 35% for the cargo dues revenue stream. This
shifts the allocations to the shipping lines and Real Estate revenue streams significantly from the current
contributions. The Authority proposes a shift, though marginal, of cargo dues as it moves towards
alignment with the Regulator’s envisaged end state.
7.6.1.2 Shipping Lines
The shipping lines will receive an additional increase and responsibility for contribution as cargo dues tariffs
are reduced to align to the tariff strategy. Though currently relatively lower than the desired level of
contribution, it is envisaged that the marine charges will start picking up to increase the most in the coming
tariff adjustments. The tariff strategy envisages a period of approximately 10 years to suit this transition.
The proposed tariff increase for the shipping lines for FY2017/18 is aligned to the desired end state, as
assumed in the Regulator’s Tariff Strategy.
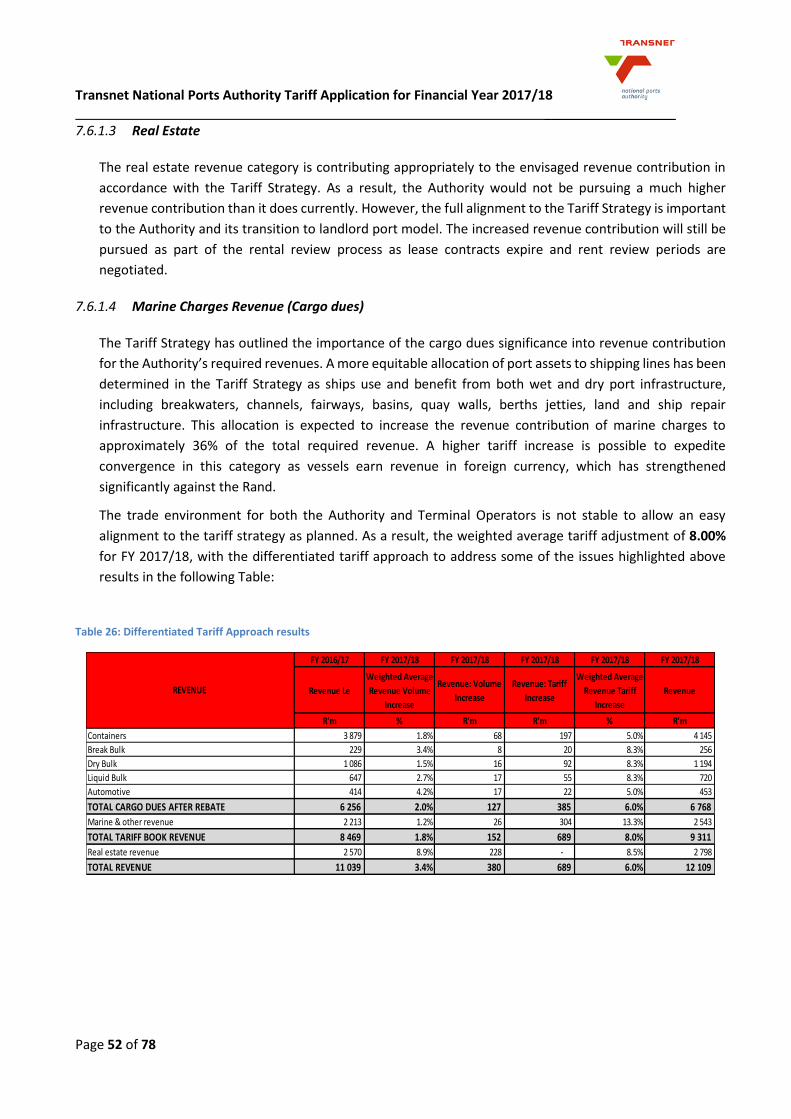
Transnet National Ports Authority Tariff Application for Financial Year 2017/18 __________________
Page 52 of 78
7.6.1.3 Real Estate
The real estate revenue category is contributing appropriately to the envisaged revenue contribution in
accordance with the Tariff Strategy. As a result, the Authority would not be pursuing a much higher
revenue contribution than it does currently. However, the full alignment to the Tariff Strategy is important
to the Authority and its transition to landlord port model. The increased revenue contribution will still be
pursued as part of the rental review process as lease contracts expire and rent review periods are
negotiated.
7.6.1.4 Marine Charges Revenue (Cargo dues)
The Tariff Strategy has outlined the importance of the cargo dues significance into revenue contribution
for the Authority’s required revenues. A more equitable allocation of port assets to shipping lines has been
determined in the Tariff Strategy as ships use and benefit from both wet and dry port infrastructure,
including breakwaters, channels, fairways, basins, quay walls, berths jetties, land and ship repair
infrastructure. This allocation is expected to increase the revenue contribution of marine charges to
approximately 36% of the total required revenue. A higher tariff increase is possible to expedite
convergence in this category as vessels earn revenue in foreign currency, which has strengthened
significantly against the Rand.
The trade environment for both the Authority and Terminal Operators is not stable to allow an easy
alignment to the tariff strategy as planned. As a result, the weighted average tariff adjustment of 8.00%
for FY 2017/18, with the differentiated tariff approach to address some of the issues highlighted above
results in the following Table:
Table 26: Differentiated Tariff Approach results
FY 2016/17 FY 2017/18 FY 2017/18 FY 2017/18 FY 2017/18 FY 2017/18
Revenue Le
Weighted Average
Revenue Volume
Increase
Revenue: Volume
Increase
Revenue: Tariff
Increase
Weighted Average
Revenue Tariff
Increase
Revenue
R'm % R'm R'm % R'm
Containers 3 879 1.8% 68 197 5.0% 4 145
Break Bulk 229 3.4% 8 20 8.3% 256
Dry Bulk 1 086 1.5% 16 92 8.3% 1 194
Liquid Bulk 647 2.7% 17 55 8.3% 720
Automotive 414 4.2% 17 22 5.0% 453
TOTAL CARGO DUES AFTER REBATE 6 256 2.0% 127 385 6.0% 6 768
Marine & other revenue 2 213 1.2% 26 304 13.3% 2 543
TOTAL TARIFF BOOK REVENUE 8 469 1.8% 152 689 8.0% 9 311
Real estate revenue 2 570 8.9% 228 - 8.5% 2 798
TOTAL REVENUE 11 039 3.4% 380 689 6.0% 12 109
REVENUE
Transnet National Ports Authority Tariff Application for Financial Year 2017/18 __________________
Page 53 of 78
7.6.1.5 New Tariff Proposals
Bunker levy tariff in the Port of Durban
The Authority has decided to request for approval to introduce a bunker levy tariff in the Tariff Book for
the port of Durban at the rate of R 10.55/ton. This follows the Authority’s investment of R57.5 m used in
the extension of the bunker berth facility at the Island View Berth 10 recently. The project is already
completed and as a result the port is currently realising the following amongst other benefits:
Improved operational efficiencies by increasing turnaround times of vessels;
Reduction of risks in refuelling by pipelines;
Sufficient provision for fuelling ships at the port;
This avails the full range of bunker grade previously not available in the port; and
Most importantly it gives a dedicated berth in the port of Durban.
The Authority has consulted extensively with the customers and affected stakeholders about the bunker
levy and a decision has now been taken to include this tariff in the Tariff Book FY2017/18 submitted to the
Regulator.
8. Port Efficiency
The ports system is central to South Africa’s ability to engage in international trade and promote economic
growth. Ports exist at the coastal end of supply chains and play a critical role in the effectiveness of
respective hinterlands served by these supply chains. The overall performance of ports is therefore a
matter of strategic importance.
The primary role of the Authority is to provide port capacity and further to ensure that the full set of
productive services exists at a port in order to serve demand. The provision of capacity is necessary but in
itself not sufficient to ensure that the objectives of the Authority are achieved. The levels of efficiency
realized in the operation of such capacity have shown to be a key determinant of the success, service levels
and attractiveness of a port.
The drive for efficiency at South African ports is an important pillar in the Market Demand Strategy of the
Authority, where specific focus is on improvement of the operational effectiveness and productivity of the
ports system. The Authority has invested in a journey commencing in the 2012/13 financial year to
establish and implement an operations model, institutional processes and to reorganize itself in order to
address the systematic improvement of port efficiency. The Authority has made significant progress in the
implementation of the operations model (shown in Figure 8 below). This model is based upon the ports
supply chain with specific emphasis on the optimisation of ship turnaround time and port cargo dwell times
focusing on the role of main port players delivering a port service. The model is expressed by determining
efficiency standards for terminal operators, marine services, shipping lines, the rail operator and road
haulers and by exercising oversight to ensure that these port players work to meet these standards. The
main initiatives in this regard are shown (in Figure 9) below.

Transnet National Ports Authority Tariff Application for Financial Year 2017/18 __________________
Page 54 of 78
Figure 8: Port Performance Model
Figure 9: Port Efficiency Improvement Initiatives
Anchorage Apron TerminalBerth
Inte
rmo
da
l
CARGO FLOWS
Transnet National Ports Authority Tariff Application for Financial Year 2017/18 __________________
Page 55 of 78
Terminal Operator Performance Standards (TOPS), first implemented in 2013, has been iteratively
improved with each annual issue thereby ensuring that TOPS Year 4, issued in July 2016, is more reflective
of efficiencies expected from the South African ports system. The Authority will further refine the setting
of standards through investment in port benchmarking tools and techniques. Further, the concepts for a
penalty/incentive system linked to TOPS will be consulted and developed with stakeholders in FY2016/17.
The Authority revised Marine Operator Performance Standards (MOPS) in 2016 to include requested vessel
service time. The use of a compulsory slot booking system for all ports, and its visibility to Shipping Lines
on the Authority’s newly developed Integrated Port Management Systems (IPMS) enables effective marine
service planning and provides a basis to monitor the achievement of MOPS.
The Authority is set to issue Rail Operator Performance Standards (ROPS) in FY2016/17 to Transnet Freight
Rail as the rail operator and to firm up rail related standards for terminals contained in TOPS for all rail
operations within port boundaries. ROPS measures are being incorporated into the Transnet Value Chain
Coordination (TVCC) initiative for integration and effective monitoring.
The Authority has successfully commissioned a Truck Staging Area at the port of Richards Bay to ensure a
more efficient flow of trucks at the port, thereby avoiding congestion. The effectiveness of traffic flows is
being monitored. The conditions for the implementation of Haulier Operator Performance Standards
(HOPS) to address the flow of trucks and ease congestion at the port of Durban are being assessed and a
feasibility study is underway during this financial year.
The Authority continues to improve its capability to exercise operations oversight in order to set port
operating targets, monitor performance and to intervene to effect corrective actions by the respective
port player. The Authority has organised to track and monitor port operational performance across the
ports system on a daily, weekly, monthly, quarterly and annual basis, reliant on information technology.
The JOC is currently in the pilot phase at the port of Durban and will be transitioning to its next stage of
development (i.e. see Figure 10 below) which will incorporate the participation of Rail Operators and the
phased on boarding of main terminal operators. This exciting development will improve port efficiency
through collaborative planning, monitoring and re-planning of port operations where necessary. The
development of JOC’s at remaining ports and head office will proceed in FY2016/17.

Transnet National Ports Authority Tariff Application for Financial Year 2017/18 __________________
Page 56 of 78
Figure 10: Joint Operations Centre concept
The Authority engages with port users through Port Consultative Committees and other engagement
platforms on efficiency improvement at ports. These engagements have a positive effect in ensuring that
a culture of performance is being embedded at South African ports.
8.1 Terminal Operations Licencing Oversight
The Port Rule licenses, permitting and registration and Terminal Operator management (through
conversion process or section 56/79) creates a platform to oversee the compliance of the port users to the
regulatory framework.
Some of the key components of the Oversight Programme include the Safety, Health, Process Safety and
Environmental Management compliance, Security, Property, Financial, Maintenance regime for its assets,
as well as the operational performance requirements for terminal operators and marine.
The Authority is in its fourth year of oversight management and it is continuously improving the
programme in conjunction with port users.
Transnet National Ports Authority Tariff Application for Financial Year 2017/18 __________________
Page 57 of 78
9. Marine Operations Management
The Authority is committed to ensuring a seamless marine service is provided to vessels arriving, departing
and shifting within South African ports.
This will include a process of stringent monitoring and measurement of the causative factors, which could
result in ships being delayed due to Pilotage, Tugs or Berthing Services (which are under the direct control
of the Authority). Approved targets have been set for each of the aforementioned categories and are
monitored at various managerial platforms.
9.1.1 Pilotage
Pilotage delays are caused due to pilot license restrictions or the pilot being occupied with other shipping
at the required service time. The overbooking of service also results in delays; however, the slot system in
the IPMS (web based online booking system) will provide guidance in terms of slot allocations and prevent
the overbooking of slots.
Helicopter downtime depends on the severity of specific technical problems encountered during
operations, but on average, each helicopter can be down for at least seven days each month for
maintenance purposes. The Authority has three helicopters. The Authority has an Air Operator’s Certificate
issue by the CAA which has strict planned maintenance schedules that need to be adhered to, to ensure
the safety of marine pilots and helicopter crew. The planned maintenance is based on the hours of
operation – once the hours are achieved the relevant components are required to be serviced as required
by the Owner Equipment Manufacturers specifications manual. These planned maintenance at times
impacts on operational availability; however, the ports have pilot boats as a backup service to ensure
seamless services.
9.1.2 Towage
Tug delays are caused by tugs not being available at the required service time due to mechanical
breakdowns, the tugs being busy with other shipping, or due to a shortage of tug capacity (which includes
manning levels).
In order to reduce the abovementioned types of delays, the following initiatives are currently being
implemented:
The on-going upgrade of the existing marine fleet which includes the delivery of new tugs in the various
ports; 9 tugs in total will be built locally in South Africa by SA Shipyards by July 2018 – 2 of the 9 tugs
have been completed and are operational in the port of Port Elizabeth;
On-going focus on the Tug Maintenance regime to ensure maximum availability - internal and external
audits are conducted to ensure the safe operations of the tugs;
Implementation of the Marine Operational Performance Standards [MOPS] to manage performance;
and
Initiatives to ramp up services in Durban, Richards Bay and Cape Town to ensure sufficient tug capacity.
This means increasing the number of personnel to man the additional craft to be deployed, e.g. the
increase in use of tugs from 5 to 6 tugs for the Port of Durban resulted in the additional staff to man
the craft – 4 x Tugs Masters, 4 x Chief Marine Engineers, 4 x Marine Engineer officers, 12x General
Purpose Ratings.

Transnet National Ports Authority Tariff Application for Financial Year 2017/18 __________________
Page 58 of 78
The changes in the regulations, namely the Merchant Shipping Act, 1951 (Act No. 57 of 1951) – the
Merchant Shipping (Safe Manning, Training and Certification) Regulations, 2013 come into effect on 01
January 2017. This means that the qualifications and certificates of competence required by the Authority
to man the tugs, must comply with the new regulations. Hence, there is a significant effort by the Authority
to ensure that all the necessary training and development is in place to ensure compliance with these new
standards.
9.1.3 Berthing Services
Berthing delays are generally caused due to larger vessel sizes that require additional berthing teams that
are not available at the required service time due to servicing of other vessels. Vessels below 200m usually
use 1 berthing gang to safely berth the vessel; vessels over 200m will require 2 gangs which negatively
impacts on the service to other vessels. In order to reduce the abovementioned types of delays, a quad
shift system at the ports of Cape Town, Durban, Saldanha Bay and Richards Bay, as well as additional
number of personnel per team, have been implemented which will ensure that the berthing services shift
patterns are aligned with the pilotage and tug operations. The system also ensures better leave planning
which enables scheduling of training and annual leave rotation amongst the personnel teams.
Marine Operations will review all marine operational processes, and this includes marine operational
planning, resourcing and fleet replacement strategy. The functional structures are continuously being
monitored to improve efficiency levels. It is expected that this will further ensure that the current number
of shipping delays are reduced, thereby enhancing the overall efficiency of the ports system. Efficiencies
will be measured in accordance with the Marine Operations Performance Standards and will be monitored
and recorded by the Operations Centres. The implementation of new technology will also enhance the
services provided to the clients and provide them with transparency when it comes to planning of their
vessels. The web based online booking system IPMS has been implemented in all 8 ports - currently
improving on user adoption of the system to obtain the full benefits of the system.
10. Conclusion
The principal objective of the MDS is to close the gap between the market demand for cargo transport and
handling services and the capacity to satisfy this demand. The need to achieve this objective is the key
driver behind the large capital investment programme underpinning the MDS. However, weak demand
combined with a rapid expansion in global supply, has had a particularly adverse impact on international
commodity markets, with steep price declines witnessed across most commodities. The economic
downturn has severely impacted South Africa’s largest trading partners and BRICS nations, with slowing
growth and subdued recoveries expected to continue for at least the short term.
High-income countries are expected to continue yielding slight economic gains amid a gradual tightening
of financing conditions, as well as a stabilisation of commodity prices, and a gradual economic rebalancing
of China, accompanied by slowing growth. Substantial supply-side risks prevail, including an unsystematic
slowdown in emerging market economies, as well as financial market turmoil arising from sudden shifts in
borrowing costs amid deteriorating fundamentals, lingering vulnerabilities in some countries, and
heightened geopolitical tensions.
To remain agile and resilient in the face of projected declining demand and lower volumes performance,
the Authority continuously modulates its spend to ensure that it drives efficiency in our ports and ensures
capacity is created ahead of validated demand.
Transnet National Ports Authority Tariff Application for Financial Year 2017/18 __________________
Page 59 of 78
The Authority’s operating context is infrastructure-driven with operations in water-stressed catchments.
This necessitates occupational training, as well as comprehensive policies and procedures to safe-guard
our employees and the public within and around our operations. Additionally, we recognise the need to
foster safety vigilance among our employees through a safety-oriented operational culture. A commitment
to personal health and safety, and the health and safety of colleagues and the communities where we
operate, is a commitment to excellence in our operations.
The key pillars of the Authority’s core strategy, which is aligned to the MDS and aimed at reducing the cost
of doing business and contributing to higher economic growth, are as follows:
Create and maintain adequate port infrastructure ahead of demand to enable volume growth;
Improve port efficiency;
Assume a collaborative role to enhance port integration, logistics performance and market growth;
and
Creation of SMART Peoples Ports.
The Authority’s financial strategy, aligned to that of Transnet, is designed to achieve the core strategy by:
Proactively enabling capacity creation over the long term;
Maintaining financial stability as guided by gearing and cash interest cover; and
Retaining an investment-grade credit rating, at least on a stand-alone basis, to enable cost-effective
funding.
This financial strategy is supported by the Port Directives which guides that when considering the proposed
tariffs for the Authority, the Regulator must ensure that such tariffs allow the Authority to:
a) Recover its investment in owning, managing, controlling and administering Ports and its investment in
port services and facilities;
b) Recover its costs in maintaining, operating, managing, controlling and administering Ports and its costs
in providing port services and facilities; and
c) Earn a return commensurate with the risk of owning, managing, controlling and administering ports
and of providing port services and facilities.
The tariff application for FY2017/18 has been prepared in accordance with the approved Tariff
Methodology issued by the Regulator and based on the Revenue Requirement formula.
Based on the application of the approved Tariff Methodology and the Revenue Requirement Formula, the
Authority hereby applies to the Regulator for revenue of R12 109m, comprising Marine Business revenue
of R9 311m and Real Estate business revenue of R2 798m. This translates to an average overall tariff
adjustment of 8.00%.
In alignment with the principles of the Regulator’s approved Tariff Strategy of 2015, the Authority further
proposes that the average 8.00% tariff adjustment be differentiated as follows:
13.25% on marine charges (shipping lines);
8.30% on all bulk;
5.00% on containers; and
5.00% on automotives.
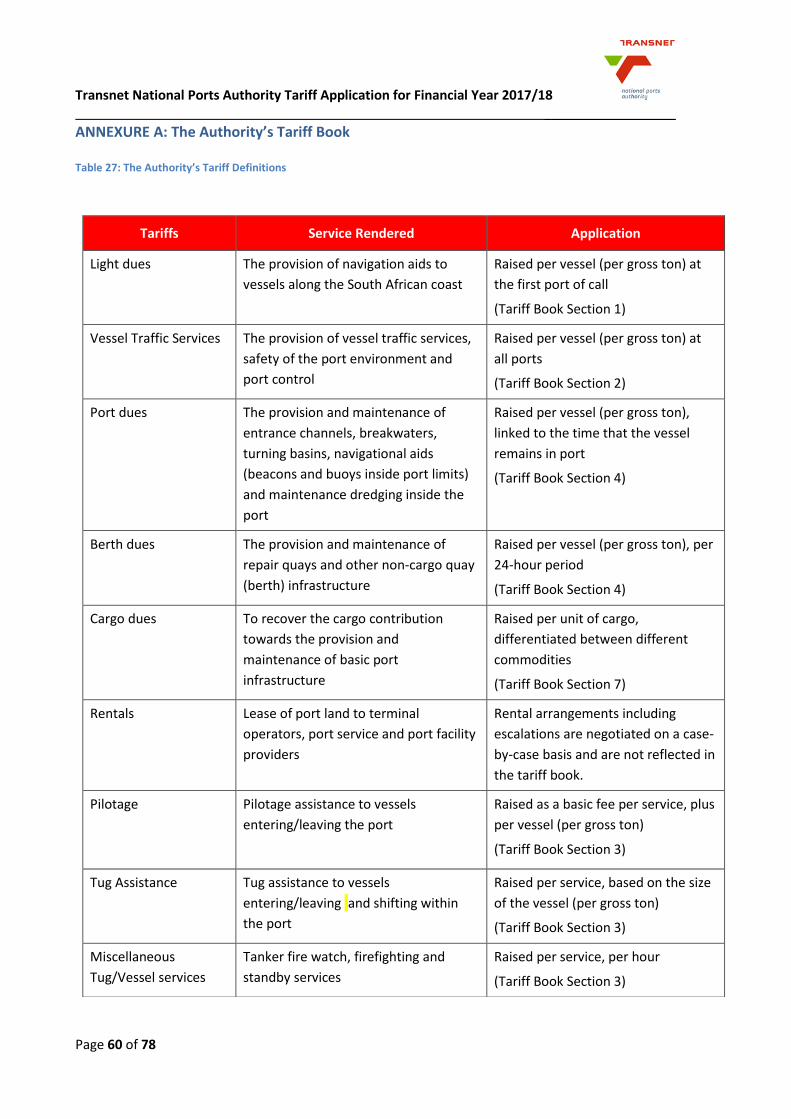
Transnet National Ports Authority Tariff Application for Financial Year 2017/18 __________________
Page 60 of 78
ANNEXURE A: The Authority’s Tariff Book
Table 27: The Authority’s Tariff Definitions
Tariffs Service Rendered Application
Light dues The provision of navigation aids to
vessels along the South African coast
Raised per vessel (per gross ton) at
the first port of call
(Tariff Book Section 1)
Vessel Traffic Services The provision of vessel traffic services,
safety of the port environment and
port control
Raised per vessel (per gross ton) at
all ports
(Tariff Book Section 2)
Port dues The provision and maintenance of
entrance channels, breakwaters,
turning basins, navigational aids
(beacons and buoys inside port limits)
and maintenance dredging inside the
port
Raised per vessel (per gross ton),
linked to the time that the vessel
remains in port
(Tariff Book Section 4)
Berth dues The provision and maintenance of
repair quays and other non-cargo quay
(berth) infrastructure
Raised per vessel (per gross ton), per
24-hour period
(Tariff Book Section 4)
Cargo dues To recover the cargo contribution
towards the provision and
maintenance of basic port
infrastructure
Raised per unit of cargo,
differentiated between different
commodities
(Tariff Book Section 7)
Rentals Lease of port land to terminal
operators, port service and port facility
providers
Rental arrangements including
escalations are negotiated on a case-
by-case basis and are not reflected in
the tariff book.
Pilotage Pilotage assistance to vessels
entering/leaving the port
Raised as a basic fee per service, plus
per vessel (per gross ton)
(Tariff Book Section 3)
Tug Assistance Tug assistance to vessels
entering/leaving and shifting within
the port
Raised per service, based on the size
of the vessel (per gross ton)
(Tariff Book Section 3)
Miscellaneous
Tug/Vessel services
Tanker fire watch, firefighting and
standby services
Raised per service, per hour
(Tariff Book Section 3)
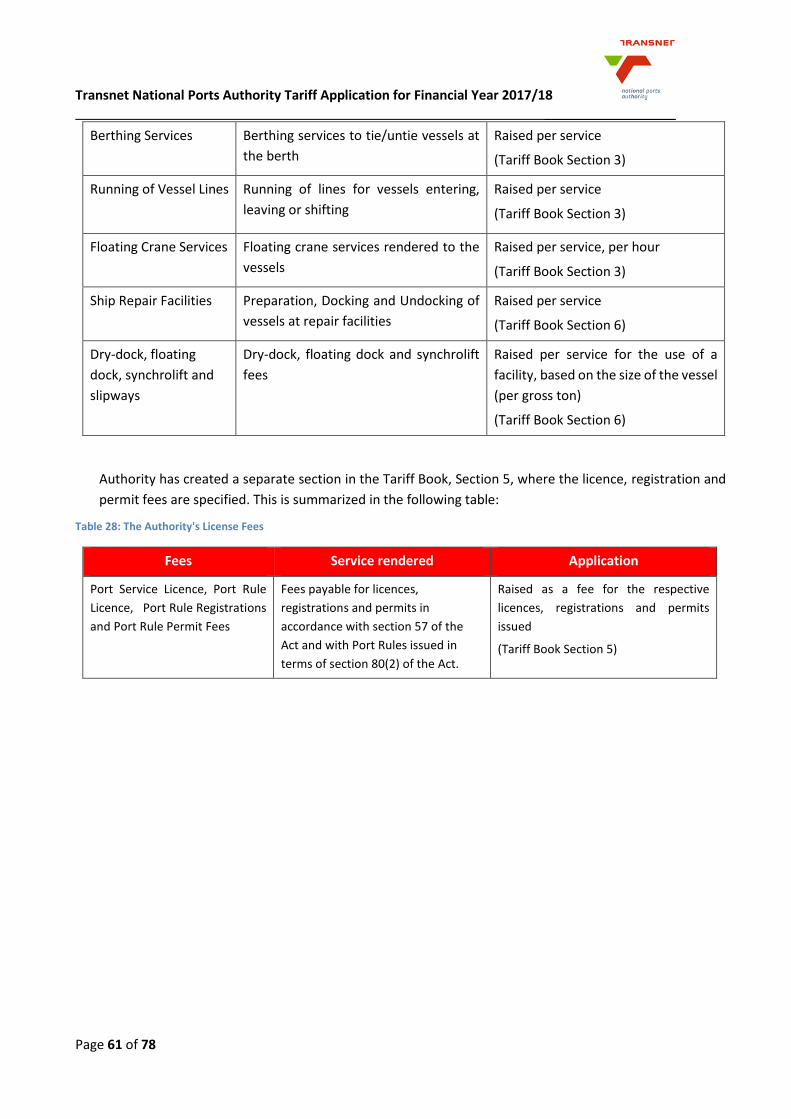
Transnet National Ports Authority Tariff Application for Financial Year 2017/18 __________________
Page 61 of 78
Authority has created a separate section in the Tariff Book, Section 5, where the licence, registration and
permit fees are specified. This is summarized in the following table:
Table 28: The Authority's License Fees
Fees Service rendered Application
Port Service Licence, Port Rule
Licence, Port Rule Registrations
and Port Rule Permit Fees
Fees payable for licences,
registrations and permits in
accordance with section 57 of the
Act and with Port Rules issued in
terms of section 80(2) of the Act.
Raised as a fee for the respective
licences, registrations and permits
issued
(Tariff Book Section 5)
Berthing Services Berthing services to tie/untie vessels at
the berth
Raised per service
(Tariff Book Section 3)
Running of Vessel Lines Running of lines for vessels entering,
leaving or shifting
Raised per service
(Tariff Book Section 3)
Floating Crane Services Floating crane services rendered to the
vessels
Raised per service, per hour
(Tariff Book Section 3)
Ship Repair Facilities Preparation, Docking and Undocking of
vessels at repair facilities
Raised per service
(Tariff Book Section 6)
Dry-dock, floating
dock, synchrolift and
slipways
Dry-dock, floating dock and synchrolift
fees
Raised per service for the use of a
facility, based on the size of the vessel
(per gross ton)
(Tariff Book Section 6)

Transnet National Ports Authority Tariff Application for Financial Year 2017/18 __________________
Page 62 of 78
ANNEXURE B: Capital Expenditure
The Authority’s investment spending is primarily influenced by the strategic initiatives which are aimed at
providing adequate port infrastructure ahead of demand.
The capital expenditure for FY 2015/16 to FY 2019/20 is segregated into various categories in order to
demonstrate the strategic objectives, major projects considered and the impact of such capital
expenditure. In order to provide a view on future capex, information for a 7 year period has also been
included. The tables that follow illustrate the capital expenditure:
Table 29: Strategic Capital Investment Objectives
Actual LE
2015/16 2016/17 2017/18 2018/19 2019/20
Rm Rm
545 608 1 675 2 364 3 552
603 832 397 241 151
941 784 1 420 2 071 1 797
764 327 386 420 360
60 123 32 167 253
- 12 19 35 81
31 43 48 43 82
Human Capital
14 71 73 60 82
Total (excl. borrowing cost) 2 959 2 801 4 050 5 401 6 358
Safety, Risk and Effective Governance
Re-engineering, Integration, Productivity and Efficiency
Projections
Rm
Strategic objective
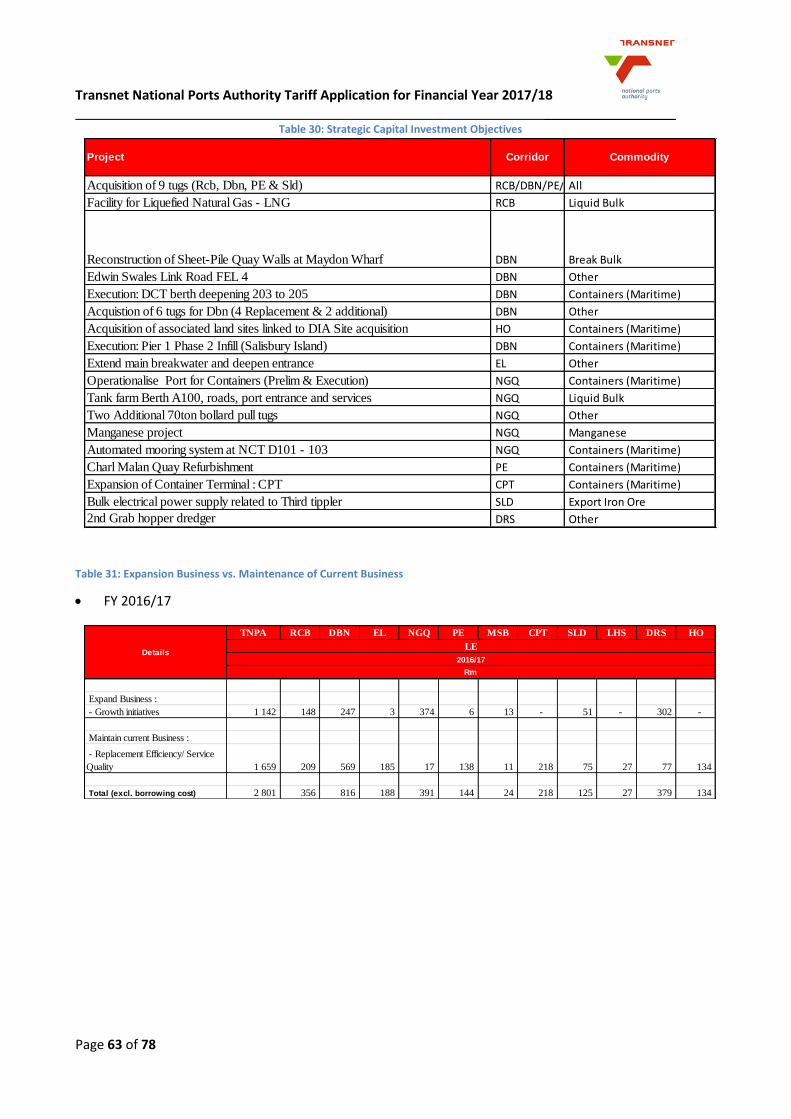
Transnet National Ports Authority Tariff Application for Financial Year 2017/18 __________________
Page 63 of 78
Table 30: Strategic Capital Investment Objectives
Table 31: Expansion Business vs. Maintenance of Current Business
FY 2016/17
Acquisition of 9 tugs (Rcb, Dbn, PE & Sld) RCB/DBN/PE/SLDAll
Facility for Liquefied Natural Gas - LNG RCB Liquid Bulk
Reconstruction of Sheet-Pile Quay Walls at Maydon Wharf DBN Break Bulk
Edwin Swales Link Road FEL 4 DBN Other
Execution: DCT berth deepening 203 to 205 DBN Containers (Maritime)
Acquistion of 6 tugs for Dbn (4 Replacement & 2 additional) DBN Other
Acquisition of associated land sites linked to DIA Site acquisition HO Containers (Maritime)
Execution: Pier 1 Phase 2 Infill (Salisbury Island) DBN Containers (Maritime)
Extend main breakwater and deepen entrance EL Other
Operationalise Port for Containers (Prelim & Execution) NGQ Containers (Maritime)
Tank farm Berth A100, roads, port entrance and services NGQ Liquid Bulk
Two Additional 70ton bollard pull tugs NGQ Other
Manganese project NGQ Manganese
Automated mooring system at NCT D101 - 103 NGQ Containers (Maritime)
Charl Malan Quay Refurbishment PE Containers (Maritime)
Expansion of Container Terminal : CPT CPT Containers (Maritime)
Bulk electrical power supply related to Third tippler SLD Export Iron Ore
2nd Grab hopper dredger DRS Other
Corridor CommodityProject
TNPA RCB DBN EL NGQ PE MSB CPT SLD LHS DRS HO
Expand Business :
- Growth initiatives 1 142 148 247 3 374 6 13 - 51 - 302 -
Maintain current Business :
- Replacement Efficiency/ Service
Quality 1 659 209 569 185 17 138 11 218 75 27 77 134
Total (excl. borrowing cost) 2 801 356 816 188 391 144 24 218 125 27 379 134
LE
2016/17
Rm
Details
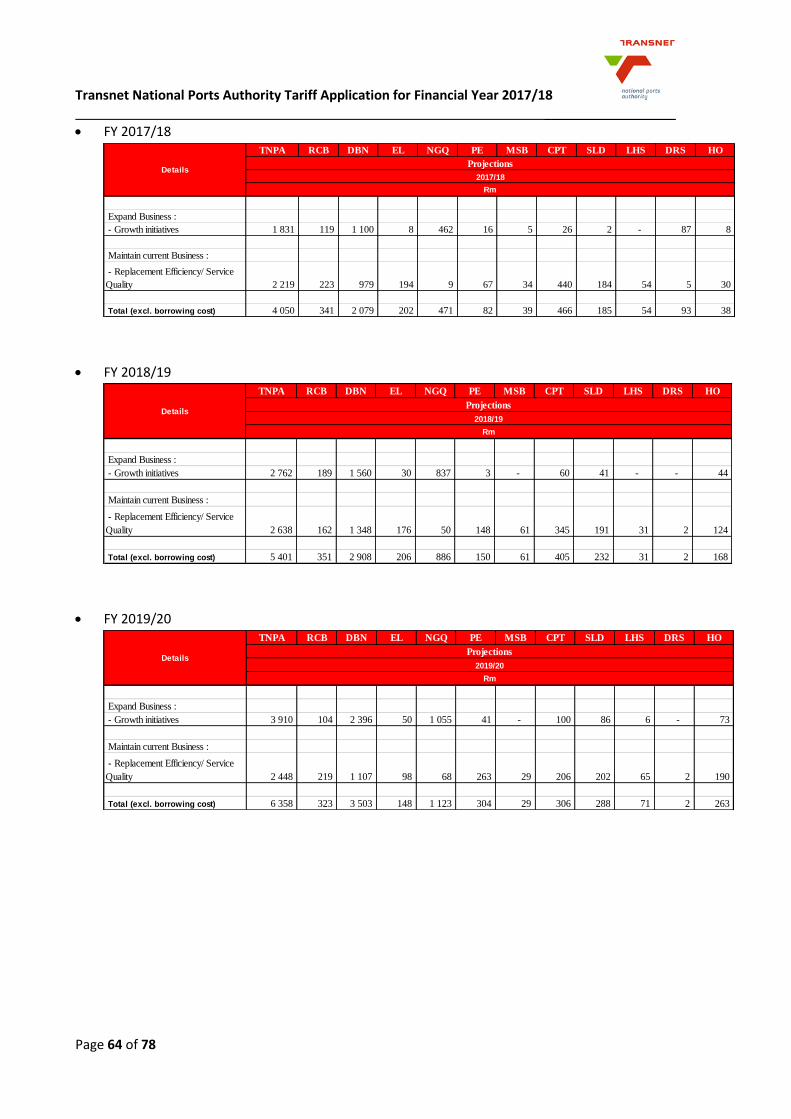
Transnet National Ports Authority Tariff Application for Financial Year 2017/18 __________________
Page 64 of 78
FY 2017/18
FY 2018/19
FY 2019/20
TNPA RCB DBN EL NGQ PE MSB CPT SLD LHS DRS HO
Expand Business :
- Growth initiatives 1 831 119 1 100 8 462 16 5 26 2 - 87 8
Maintain current Business :
- Replacement Efficiency/ Service
Quality 2 219 223 979 194 9 67 34 440 184 54 5 30
Total (excl. borrowing cost) 4 050 341 2 079 202 471 82 39 466 185 54 93 38
DetailsProjections
2017/18
Rm
TNPA RCB DBN EL NGQ PE MSB CPT SLD LHS DRS HO
Expand Business :
- Growth initiatives 2 762 189 1 560 30 837 3 - 60 41 - - 44
Maintain current Business :
- Replacement Efficiency/ Service
Quality 2 638 162 1 348 176 50 148 61 345 191 31 2 124
Total (excl. borrowing cost) 5 401 351 2 908 206 886 150 61 405 232 31 2 168
DetailsProjections
2018/19
Rm
TNPA RCB DBN EL NGQ PE MSB CPT SLD LHS DRS HO
Expand Business :
- Growth initiatives 3 910 104 2 396 50 1 055 41 - 100 86 6 - 73
Maintain current Business :
- Replacement Efficiency/ Service
Quality 2 448 219 1 107 98 68 263 29 206 202 65 2 190
Total (excl. borrowing cost) 6 358 323 3 503 148 1 123 304 29 306 288 71 2 263
Projections
2019/20
Rm
Details
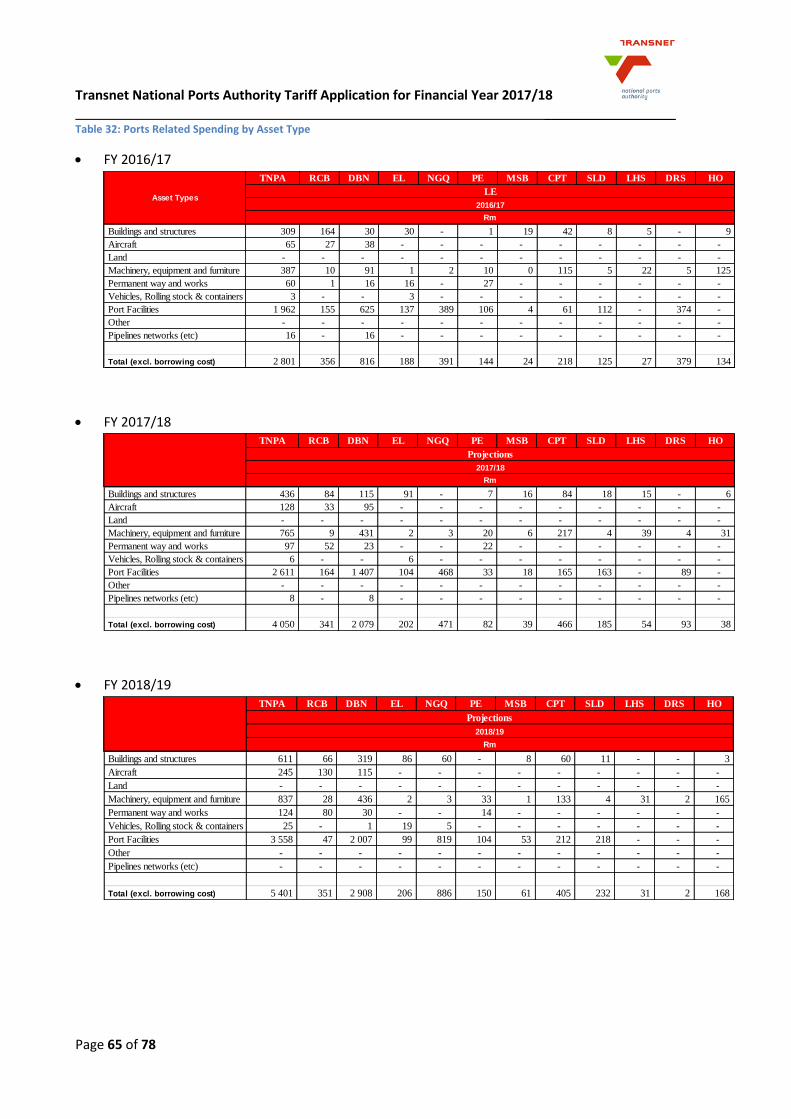
Transnet National Ports Authority Tariff Application for Financial Year 2017/18 __________________
Page 65 of 78
Table 32: Ports Related Spending by Asset Type
FY 2016/17
FY 2017/18
FY 2018/19
TNPA RCB DBN EL NGQ PE MSB CPT SLD LHS DRS HO
Buildings and structures 309 164 30 30 - 1 19 42 8 5 - 9
Aircraft 65 27 38 - - - - - - - - -
Land - - - - - - - - - - - -
Machinery, equipment and furniture 387 10 91 1 2 10 0 115 5 22 5 125
Permanent way and works 60 1 16 16 - 27 - - - - - -
Vehicles, Rolling stock & containers 3 - - 3 - - - - - - - -
Port Facilities 1 962 155 625 137 389 106 4 61 112 - 374 -
Other - - - - - - - - - - - -
Pipelines networks (etc) 16 - 16 - - - - - - - - -
Total (excl. borrowing cost) 2 801 356 816 188 391 144 24 218 125 27 379 134
LE
2016/17
Rm
Asset Types
TNPA RCB DBN EL NGQ PE MSB CPT SLD LHS DRS HO
Buildings and structures 436 84 115 91 - 7 16 84 18 15 - 6
Aircraft 128 33 95 - - - - - - - - -
Land - - - - - - - - - - - -
Machinery, equipment and furniture 765 9 431 2 3 20 6 217 4 39 4 31
Permanent way and works 97 52 23 - - 22 - - - - - -
Vehicles, Rolling stock & containers 6 - - 6 - - - - - - - -
Port Facilities 2 611 164 1 407 104 468 33 18 165 163 - 89 -
Other - - - - - - - - - - - -
Pipelines networks (etc) 8 - 8 - - - - - - - - -
Total (excl. borrowing cost) 4 050 341 2 079 202 471 82 39 466 185 54 93 38
Projections
2017/18
Rm
TNPA RCB DBN EL NGQ PE MSB CPT SLD LHS DRS HO
Buildings and structures 611 66 319 86 60 - 8 60 11 - - 3
Aircraft 245 130 115 - - - - - - - - -
Land - - - - - - - - - - - -
Machinery, equipment and furniture 837 28 436 2 3 33 1 133 4 31 2 165
Permanent way and works 124 80 30 - - 14 - - - - - -
Vehicles, Rolling stock & containers 25 - 1 19 5 - - - - - - -
Port Facilities 3 558 47 2 007 99 819 104 53 212 218 - - -
Other - - - - - - - - - - - -
Pipelines networks (etc) - - - - - - - - - - - -
Total (excl. borrowing cost) 5 401 351 2 908 206 886 150 61 405 232 31 2 168
Projections
2018/19
Rm

Transnet National Ports Authority Tariff Application for Financial Year 2017/18 __________________
Page 66 of 78
FY 2019/20
Table 33: Capital expenditure and throughput per commodity
Containers
Liquid Bulk
Iron Ore
TNPA RCB DBN EL NGQ PE MSB CPT SLD LHS DRS HO
Buildings and structures 740 71 411 45 75 - 7 47 82 - - 2
Aircraft 115 100 15 - - - - - - - - -
Land 14 - 14 - - - - - - - - -
Machinery, equipment and furniture 688 10 267 5 5 29 1 34 4 71 2 260
Permanent way and works 123 63 50 - - 10 - - - - - -
Vehicles, Rolling stock & containers 36 - 3 18 15 - - - - - - -
Port Facilities 4 642 79 2 742 80 1 028 265 21 226 202 - - -
Other - - - - - - - - - - - -
Pipelines networks (etc) - - - - - - - - - - - -
Total (excl. borrowing cost) 6 358 323 3 503 148 1 123 304 29 306 288 71 2 263
Projections
2019/20
Rm
FY2016/17 FY2017/18 FY2018/19 FY2019/20 FY2020/21 FY2021/22 FY2022/23
Containers 299 1 151 1 559 2 626 4 042 4 359 3 080 - Dbn: DCT berth deepening berth 203 to 205
- Expand 299 1 146 1 469 2 391 3 842 4 089 2 980 - Dbn: Pier 1 phase 2 Infill (Salisbury Island)
- Maintain - 5 90 235 200 270 100 - NGQ: Automated mooring system D101 -103
Volumes ('000 TEUs)
- Budget and Projections 4 952 5 051 5 264 5 458 5 697 5 953 6 273
- Capacity 8 043 7 643 7 643 7 643 7 643 7 643 9 443
Total Capex spend to this year 14 036
Indicative return on capital 762
Depreciation 125
Additional Revenue Required 887
Containers
DETAILSR'm
Major Capital Projects
FY2016/17 FY2017/18 FY2018/19 FY2019/20 FY2020/21 FY2021/22 FY2022/23
Liquid Bulk 230 376 934 1 217 828 1 296 823 - NGQ: tank farm berth A100, roads, port
- Expand 57 180 575 910 567 1 285 768 entrance and services
- Maintain 173 197 359 307 261 11 55 - RCB: Facility for LNG
Volumes (mKI)
- Budget and Projections 41 42 43 44 44 46 48
- Capacity 92 92 92 92 92 92 96
Total Capex spend to this year 4 882
Indicative return on capital 265
Depreciation 44
Additional Revenue Required 309
Liquid Bulk
DETAILS Major Capital ProjectsR'm
FY2016/17 FY2017/18 FY2018/19 FY2019/20 FY2020/21 FY2021/22 FY2022/23
Iron Ore 752 217 31 72 896 1 650 690 - SLD: Ore Expansion Phase 2 berth
- Expand 403 139 31 72 775 1 330 540 Construction (to 82.5mtpa)
- Maintain 349 78 - - 121 320 150
Volumes (mt)
- Budget and Projections 60 60 60 62 62 62 62
- Capacity 60 60 60 60 60 60 60
Total Capex spend to this year 3 618
Indicative return on capital 196
Depreciation 32
Additional Revenue Required 229
Iron Ore
DETAILS Major Capital ProjectsR'm
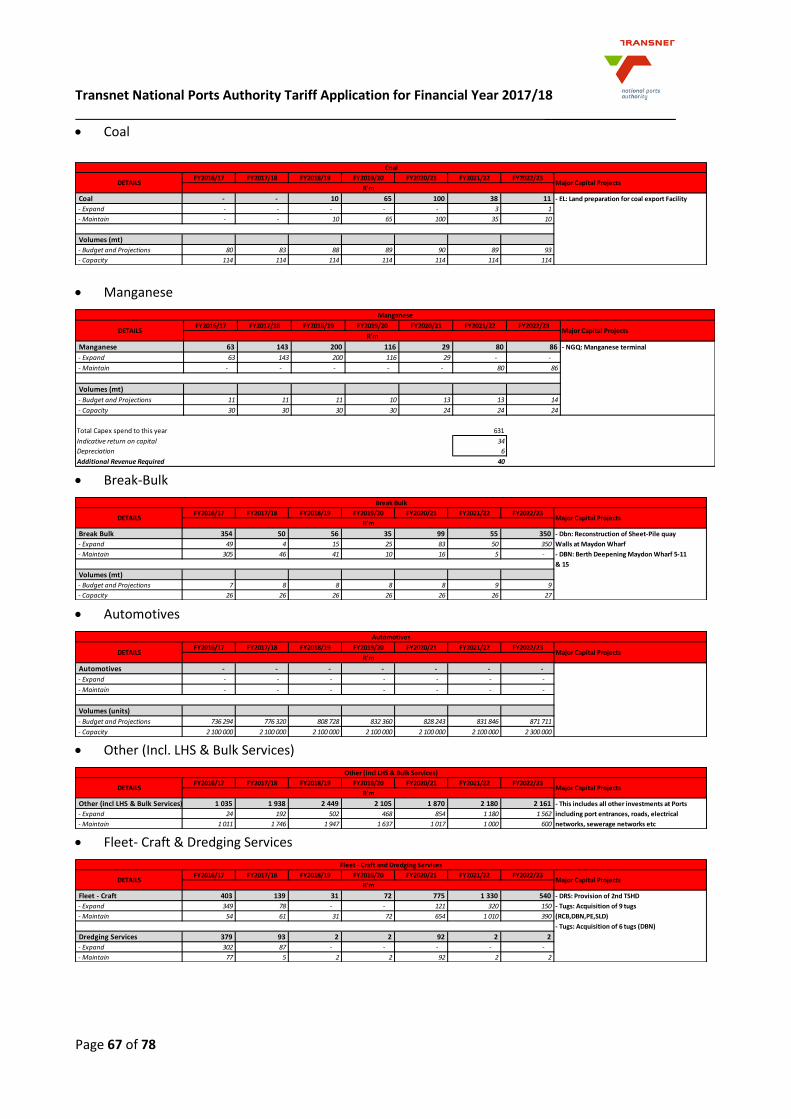
Transnet National Ports Authority Tariff Application for Financial Year 2017/18 __________________
Page 67 of 78
Coal
Manganese
Break-Bulk
Automotives
Other (Incl. LHS & Bulk Services)
Fleet- Craft & Dredging Services
FY2016/17 FY2017/18 FY2018/19 FY2019/20 FY2020/21 FY2021/22 FY2022/23
Coal - - 10 65 100 38 11 - EL: Land preparation for coal export Facility
- Expand - - - - - 3 1
- Maintain - - 10 65 100 35 10
Volumes (mt)
- Budget and Projections 80 83 88 89 90 89 93
- Capacity 114 114 114 114 114 114 114
Coal
DETAILS Major Capital ProjectsR'm
FY2016/17 FY2017/18 FY2018/19 FY2019/20 FY2020/21 FY2021/22 FY2022/23
Manganese 63 143 200 116 29 80 86 - NGQ: Manganese terminal
- Expand 63 143 200 116 29 - -
- Maintain - - - - - 80 86
Volumes (mt)
- Budget and Projections 11 11 11 10 13 13 14
- Capacity 30 30 30 30 24 24 24
Total Capex spend to this year 631
Indicative return on capital 34
Depreciation 6
Additional Revenue Required 40
DETAILS Major Capital ProjectsR'm
Manganese
FY2016/17 FY2017/18 FY2018/19 FY2019/20 FY2020/21 FY2021/22 FY2022/23
Break Bulk 354 50 56 35 99 55 350 - Dbn: Reconstruction of Sheet-Pile quay
- Expand 49 4 15 25 83 50 350 Walls at Maydon Wharf
- Maintain 305 46 41 10 16 5 - - DBN: Berth Deepening Maydon Wharf 5-11
& 15
Volumes (mt)
- Budget and Projections 7 8 8 8 8 9 9
- Capacity 26 26 26 26 26 26 27
Break Bulk
DETAILS Major Capital ProjectsR'm
FY2016/17 FY2017/18 FY2018/19 FY2019/20 FY2020/21 FY2021/22 FY2022/23
Automotives - - - - - - -
- Expand - - - - - - -
- Maintain - - - - - - -
Volumes (units)
- Budget and Projections 736 294 776 320 808 728 832 360 828 243 831 846 871 711
- Capacity 2 100 000 2 100 000 2 100 000 2 100 000 2 100 000 2 100 000 2 300 000
Automotives
DETAILS Major Capital ProjectsR'm
FY2016/17 FY2017/18 FY2018/19 FY2019/20 FY2020/21 FY2021/22 FY2022/23
Other (incl LHS & Bulk Services) 1 035 1 938 2 449 2 105 1 870 2 180 2 161 - This includes all other investments at Ports
- Expand 24 192 502 468 854 1 180 1 562 including port entrances, roads, electrical
- Maintain 1 011 1 746 1 947 1 637 1 017 1 000 600 networks, sewerage networks etc
DETAILS Major Capital ProjectsR'm
Other (incl LHS & Bulk Services)
FY2016/17 FY2017/18 FY2018/19 FY2019/20 FY2020/21 FY2021/22 FY2022/23
Fleet - Craft 403 139 31 72 775 1 330 540 - DRS: Provision of 2nd TSHD
- Expand 349 78 - - 121 320 150 - Tugs: Acquisition of 9 tugs
- Maintain 54 61 31 72 654 1 010 390 (RCB,DBN,PE,SLD)
- Tugs: Acquisition of 6 tugs (DBN)
Dredging Services 379 93 2 2 92 2 2
- Expand 302 87 - - - - -
- Maintain 77 5 2 2 92 2 2
Fleet - Craft and Dredging Services
DETAILS Major Capital ProjectsR'm
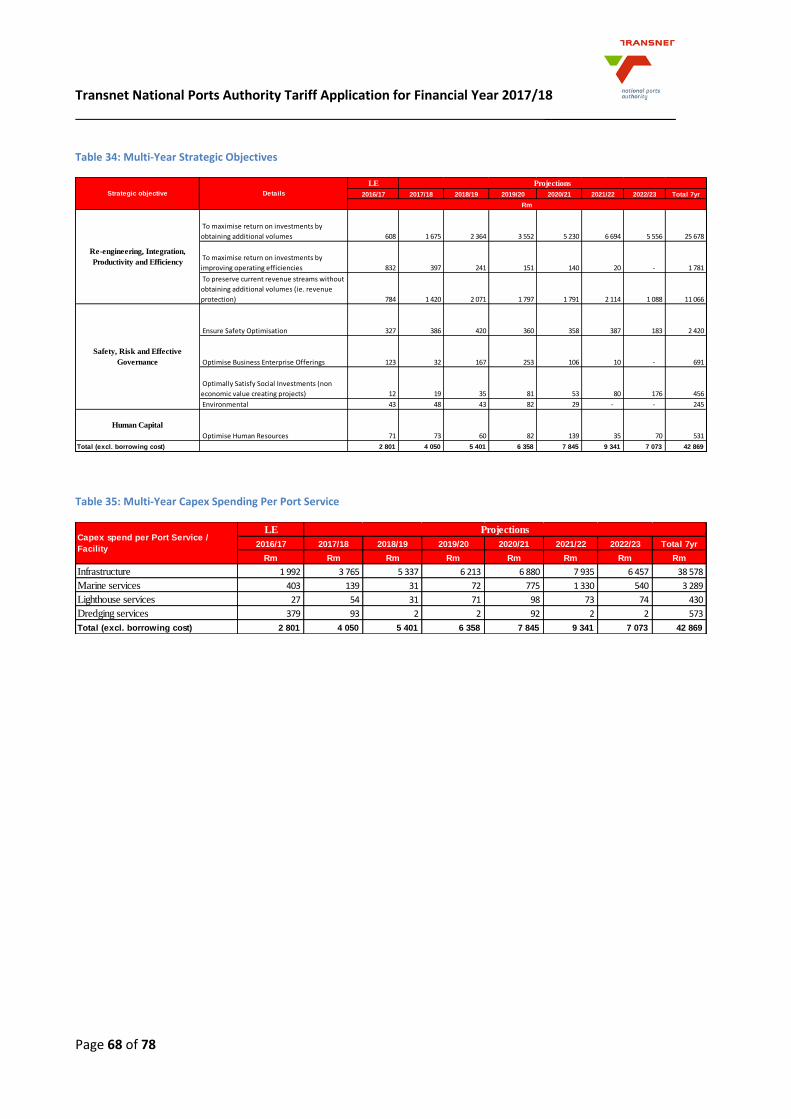
Transnet National Ports Authority Tariff Application for Financial Year 2017/18 __________________
Page 68 of 78
Table 34: Multi-Year Strategic Objectives
Table 35: Multi-Year Capex Spending Per Port Service
LE
2016/17 2017/18 2018/19 2019/20 2020/21 2021/22 2022/23 Total 7yr
To maximise return on investments by
obtaining additional volumes 608 1 675 2 364 3 552 5 230 6 694 5 556 25 678
To maximise return on investments by
improving operating efficiencies 832 397 241 151 140 20 - 1 781
To preserve current revenue streams without
obtaining additional volumes (ie. revenue
protection) 784 1 420 2 071 1 797 1 791 2 114 1 088 11 066
Ensure Safety Optimisation 327 386 420 360 358 387 183 2 420
Optimise Business Enterprise Offerings 123 32 167 253 106 10 - 691
Optimally Satisfy Social Investments (non
economic value creating projects) 12 19 35 81 53 80 176 456
Environmental 43 48 43 82 29 - - 245
Human Capital
Optimise Human Resources 71 73 60 82 139 35 70 531
Total (excl. borrowing cost) 2 801 4 050 5 401 6 358 7 845 9 341 7 073 42 869
Rm
Projections
Strategic objective Details
Safety, Risk and Effective
Governance
Re-engineering, Integration,
Productivity and Efficiency
LE
2016/17 2017/18 2018/19 2019/20 2020/21 2021/22 2022/23 Total 7yr
Rm Rm Rm Rm Rm Rm Rm Rm
Infrastructure 1 992 3 765 5 337 6 213 6 880 7 935 6 457 38 578
Marine services 403 139 31 72 775 1 330 540 3 289
Lighthouse services 27 54 31 71 98 73 74 430
Dredging services 379 93 2 2 92 2 2 573
Total (excl. borrowing cost) 2 801 4 050 5 401 6 358 7 845 9 341 7 073 42 869
Capex spend per Port Service /
Facility
Projections
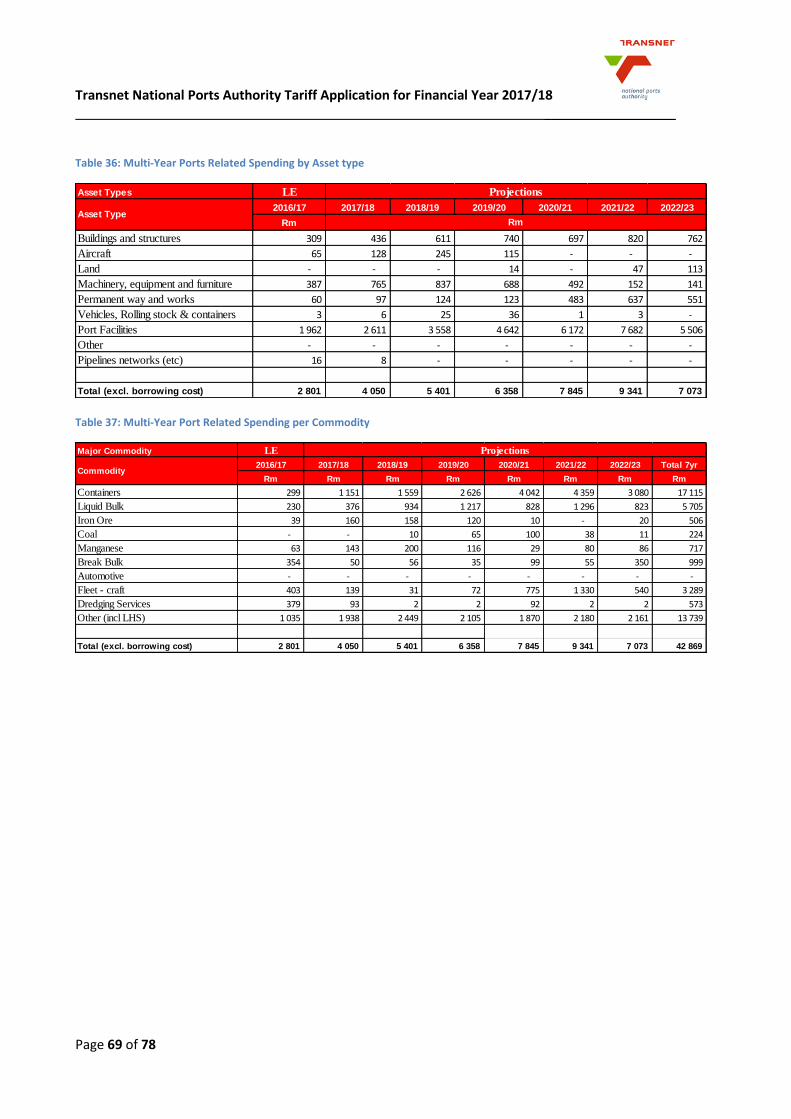
Transnet National Ports Authority Tariff Application for Financial Year 2017/18 __________________
Page 69 of 78
Table 36: Multi-Year Ports Related Spending by Asset type
Table 37: Multi-Year Port Related Spending per Commodity
Asset Types LE
2016/17 2017/18 2018/19 2019/20 2020/21 2021/22 2022/23
Rm
Buildings and structures 309 436 611 740 697 820 762
Aircraft 65 128 245 115 - - -
Land - - - 14 - 47 113
Machinery, equipment and furniture 387 765 837 688 492 152 141
Permanent way and works 60 97 124 123 483 637 551
Vehicles, Rolling stock & containers 3 6 25 36 1 3 -
Port Facilities 1 962 2 611 3 558 4 642 6 172 7 682 5 506
Other - - - - - - -
Pipelines networks (etc) 16 8 - - - - -
Total (excl. borrowing cost) 2 801 4 050 5 401 6 358 7 845 9 341 7 073
Projections
RmAsset Type
Major Commodity LE
2016/17 2017/18 2018/19 2019/20 2020/21 2021/22 2022/23 Total 7yr
Rm Rm Rm Rm Rm Rm Rm Rm
Containers 299 1 151 1 559 2 626 4 042 4 359 3 080 17 115
Liquid Bulk 230 376 934 1 217 828 1 296 823 5 705
Iron Ore 39 160 158 120 10 - 20 506
Coal - - 10 65 100 38 11 224
Manganese 63 143 200 116 29 80 86 717
Break Bulk 354 50 56 35 99 55 350 999
Automotive - - - - - - - -
Fleet - craft 403 139 31 72 775 1 330 540 3 289
Dredging Services 379 93 2 2 92 2 2 573
Other (incl LHS) 1 035 1 938 2 449 2 105 1 870 2 180 2 161 13 739
Total (excl. borrowing cost) 2 801 4 050 5 401 6 358 7 845 9 341 7 073 42 869
Projections
Commodity
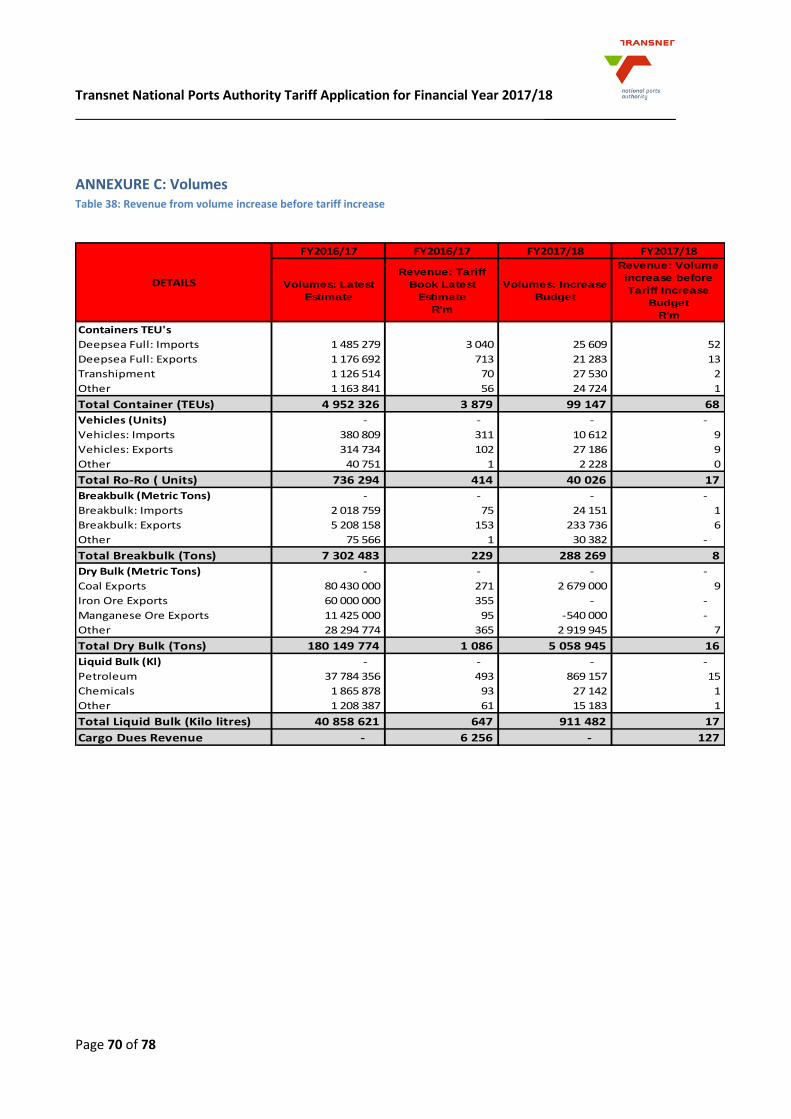
Transnet National Ports Authority Tariff Application for Financial Year 2017/18 __________________
Page 70 of 78
ANNEXURE C: Volumes Table 38: Revenue from volume increase before tariff increase
FY2016/17 FY2016/17 FY2017/18 FY2017/18
Volumes: Latest
Estimate
Revenue: Tariff
Book Latest
Estimate
R'm
Volumes: Increase
Budget
Revenue: Volume
increase before
Tariff Increase
Budget
R'm
Containers TEU's
Deepsea Full: Imports 1 485 279 3 040 25 609 52
Deepsea Full: Exports 1 176 692 713 21 283 13
Transhipment 1 126 514 70 27 530 2
Other 1 163 841 56 24 724 1
Total Container (TEUs) 4 952 326 3 879 99 147 68
Vehicles (Units) - - - -
Vehicles: Imports 380 809 311 10 612 9
Vehicles: Exports 314 734 102 27 186 9
Other 40 751 1 2 228 0
Total Ro-Ro ( Units) 736 294 414 40 026 17
Breakbulk (Metric Tons) - - - -
Breakbulk: Imports 2 018 759 75 24 151 1
Breakbulk: Exports 5 208 158 153 233 736 6
Other 75 566 1 30 382 -
Total Breakbulk (Tons) 7 302 483 229 288 269 8
Dry Bulk (Metric Tons) - - - -
Coal Exports 80 430 000 271 2 679 000 9
Iron Ore Exports 60 000 000 355 - -
Manganese Ore Exports 11 425 000 95 -540 000 -
Other 28 294 774 365 2 919 945 7
Total Dry Bulk (Tons) 180 149 774 1 086 5 058 945 16
Liquid Bulk (Kl) - - - -
Petroleum 37 784 356 493 869 157 15
Chemicals 1 865 878 93 27 142 1
Other 1 208 387 61 15 183 1
Total Liquid Bulk (Kilo litres) 40 858 621 647 911 482 17
Cargo Dues Revenue - 6 256 - 127
DETAILS
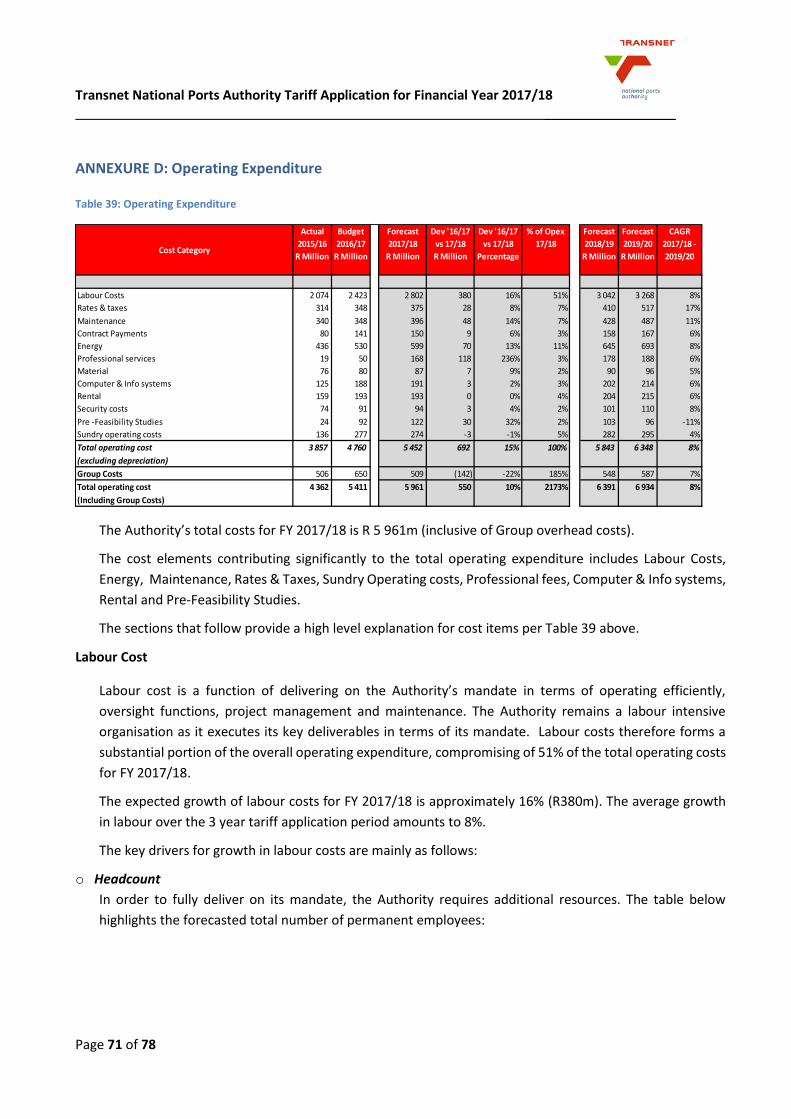
Transnet National Ports Authority Tariff Application for Financial Year 2017/18 __________________
Page 71 of 78
ANNEXURE D: Operating Expenditure
Table 39: Operating Expenditure
The Authority’s total costs for FY 2017/18 is R 5 961m (inclusive of Group overhead costs).
The cost elements contributing significantly to the total operating expenditure includes Labour Costs,
Energy, Maintenance, Rates & Taxes, Sundry Operating costs, Professional fees, Computer & Info systems,
Rental and Pre-Feasibility Studies.
The sections that follow provide a high level explanation for cost items per Table 39 above.
Labour Cost
Labour cost is a function of delivering on the Authority’s mandate in terms of operating efficiently,
oversight functions, project management and maintenance. The Authority remains a labour intensive
organisation as it executes its key deliverables in terms of its mandate. Labour costs therefore forms a
substantial portion of the overall operating expenditure, compromising of 51% of the total operating costs
for FY 2017/18.
The expected growth of labour costs for FY 2017/18 is approximately 16% (R380m). The average growth
in labour over the 3 year tariff application period amounts to 8%.
The key drivers for growth in labour costs are mainly as follows:
o Headcount
In order to fully deliver on its mandate, the Authority requires additional resources. The table below
highlights the forecasted total number of permanent employees:
Actual Budget Forecast Dev '16/17 Dev '16/17 % of Opex Forecast Forecast CAGR
2015/16 2016/17 2017/18 vs 17/18 vs 17/18 17/18 2018/19 2019/20 2017/18 -
R Million R Million R Million R Million Percentage R Million R Million 2019/20
2
Labour Costs 2 074 2 423 2 802 380 16% 51% 3 042 3 268 8%
Rates & taxes 314 348 375 28 8% 7% 410 517 17%
Maintenance 340 348 396 48 14% 7% 428 487 11%
Contract Payments 80 141 150 9 6% 3% 158 167 6%
Energy 436 530 599 70 13% 11% 645 693 8%
Professional services 19 50 168 118 236% 3% 178 188 6%
Material 76 80 87 7 9% 2% 90 96 5%
Computer & Info systems 125 188 191 3 2% 3% 202 214 6%
Rental 159 193 193 0 0% 4% 204 215 6%
Security costs 74 91 94 3 4% 2% 101 110 8%
Pre -Feasibility Studies 24 92 122 30 32% 2% 103 96 -11%
Sundry operating costs 136 277 274 -3 -1% 5% 282 295 4%
Total operating cost 3 857 4 760 5 452 692 15% 100% 5 843 6 348 8%
(excluding depreciation)
Group Costs 506 650 509 (142) -22% 185% 548 587 7%
Total operating cost 4 362 5 411 5 961 550 10% 2173% 6 391 6 934 8%
(Including Group Costs)
Cost Category
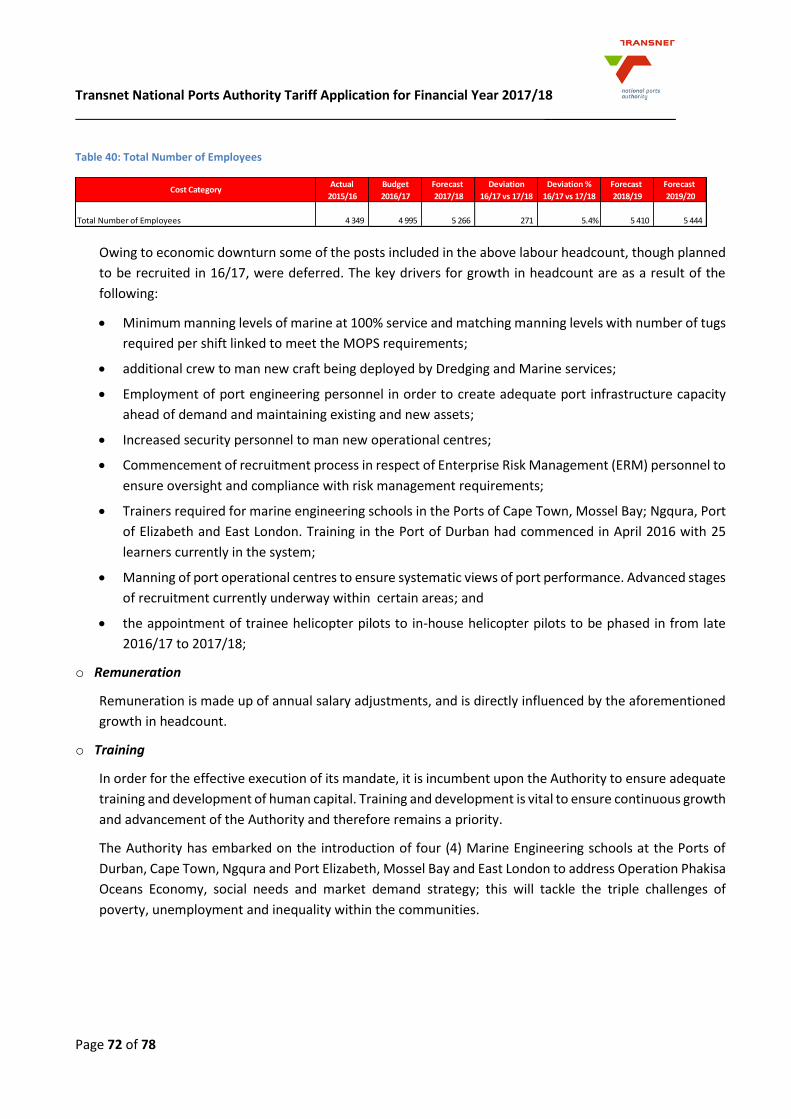
Transnet National Ports Authority Tariff Application for Financial Year 2017/18 __________________
Page 72 of 78
Table 40: Total Number of Employees
Owing to economic downturn some of the posts included in the above labour headcount, though planned
to be recruited in 16/17, were deferred. The key drivers for growth in headcount are as a result of the
following:
Minimum manning levels of marine at 100% service and matching manning levels with number of tugs
required per shift linked to meet the MOPS requirements;
additional crew to man new craft being deployed by Dredging and Marine services;
Employment of port engineering personnel in order to create adequate port infrastructure capacity
ahead of demand and maintaining existing and new assets;
Increased security personnel to man new operational centres;
Commencement of recruitment process in respect of Enterprise Risk Management (ERM) personnel to
ensure oversight and compliance with risk management requirements;
Trainers required for marine engineering schools in the Ports of Cape Town, Mossel Bay; Ngqura, Port
of Elizabeth and East London. Training in the Port of Durban had commenced in April 2016 with 25
learners currently in the system;
Manning of port operational centres to ensure systematic views of port performance. Advanced stages
of recruitment currently underway within certain areas; and
the appointment of trainee helicopter pilots to in-house helicopter pilots to be phased in from late
2016/17 to 2017/18;
o Remuneration
Remuneration is made up of annual salary adjustments, and is directly influenced by the aforementioned
growth in headcount.
o Training
In order for the effective execution of its mandate, it is incumbent upon the Authority to ensure adequate
training and development of human capital. Training and development is vital to ensure continuous growth
and advancement of the Authority and therefore remains a priority.
The Authority has embarked on the introduction of four (4) Marine Engineering schools at the Ports of
Durban, Cape Town, Ngqura and Port Elizabeth, Mossel Bay and East London to address Operation Phakisa
Oceans Economy, social needs and market demand strategy; this will tackle the triple challenges of
poverty, unemployment and inequality within the communities.
Actual Budget Forecast Deviation Deviation % Forecast Forecast
2015/16 2016/17 2017/18 16/17 vs 17/18 16/17 vs 17/18 2018/19 2019/20
Total Number of Employees 4 349 4 995 5 266 271 5.4% 5 410 5 444
Cost Category
Transnet National Ports Authority Tariff Application for Financial Year 2017/18 __________________
Page 73 of 78
The progress status on each of these training schools is as follows:
Port of Durban: Training commenced in April 2016. (SLA between the Authority and Transnet
Engineering - 25 trainees)
Port of East London: training will commence in FY 2017/18.
Port of Mossel Bay: training will commence in October 2017. SLA between the Authority and PETROSA
Port of Cape Town: training will commence in 2017. Refurbishing the facility has commenced
The Authority continues with various training initiatives relating to cadet training; helicopter pilot training,
aircraft maintenance and aircraft avionics training. These are budgeted at R103 m including compensation
for the cadets.
Rates and Taxes
Rates and taxes relate to municipal rates and are based on the methodology employed by the
municipalities in accordance with the Municipal Rates and Taxes Act. The increase in this cost category is
above inflation rate.
Maintenance
It is necessary for the Authority to ensure that port infrastructure and other assets are maintained in
accordance with required engineering standards. Maintenance is essential in order to ensure continuity
in operations and offer customers service certainty.
Maintenance is driven by planned maintenance, aged infrastructure, new infrastructure assets, new
marine craft (routine maintenance) and increased maintenance focused on the ship repair business.
Increase in maintenance for FY 2017/18 is approximately 14% - R48m (with an average growth in
maintenance over the three year period of approximately 11%) and is mainly attributed to the following:
Refurbishment of ageing infrastructure;
The National Infrastructure Maintenance Strategy (NIMS) provides maintenance benchmarks for State
Owned Enterprises (SOE’s) which is set at 5% of the book value of port infrastructure. The Authority
currently spends approximately 1% of book value on port infrastructure with the aim to gradually align to
a benchmark level of 5%. This is an accelerated spending on maintenance over the next few years as the
Authority intends on reaching an initial target of 2.5%;
Changes to business operations have a direct result on the levels of maintenance required. As the port
system continues to handle larger container vessels than it is designed to accommodate; frequent dredging
of berths is required resulting in increased and additional maintenance of dredgers. Ports are handling
bigger, deeper ships with a very small under keel clearance. This has led to scouring of the seabed which
then requires additional dredging. An external Grab Dredger has been hired in Durban to attend to this
operational challenge as an interim measure whilst the Berth Deepening project is being executed;
Ship repairs maintenance and refurbishment which involves the upgrading of existing facilities to ensure
its sustained and efficient use. The refurbishment continues to include mainly:
o Civil: Concrete repairs, crane rail upgrade, water reticulation, enclosure;
o Electrical: Optimisation of electrical network, components replacements; and
o Mechanical: Crane refurbishment/replacement, pump and valve upgrades.
Transnet National Ports Authority Tariff Application for Financial Year 2017/18 __________________
Page 74 of 78
Contract Payments
The increase on contract payment for FY 2017/18 is approximately 6% with the average increase over the
three year tariff application period is approximately 6%. This is attributed to the costs relating to Operation
Phakisa in FEL1& FEL2 stages. The Authority, together with Transnet and the Department of Energy are
exploring various options for alternate energy sources, to assist the country’s power supply. The Authority
is now completing a pre-feasibility for the development of the LNG Import Facilities at the Port of Richards
Bay; Port of Ngqura and Port of Saldanha Bay. The research and design work must be completed in FY
2017/18.
Energy
Energy costs are mainly attributable to the fuel and electricity consumption of the Authority. The increase
in costs for FY 2017/18 is approximately 13% (R70m) and mainly due to the following:
Average electricity tariff increases approved by the National Energy Regulator of South Africa (NERSA)
for Eskom (9.40%) and municipal distributors (7.64%) for FY 2016/17 used as an indicative basis for FY
2017/18; and
Additional fuel costs relating to the new marine craft including the new dredgers with capacities higher
than the older craft. To date 2 tugs have been commissioned and it is expected that a further 6 tugs
will be commissioned by the year ended 2017/18.
Given the larger bollard pull capacity of the craft for improved efficiencies, this result in higher fuel
consumption.
The average increase over the three year period is approximately 8% and is mainly due to the anticipated
higher electricity tariffs.
Professional Services
Professional fees relate to internal and external audit fees (financial and operational/ environmental)
whilst the remainder relates to other professional services.
Other professional fees relate to Operational Audits & Transnet Certification, and Real Estate projects
relating to Land use audit projects, Anticipated Section 56 consultants and Investment Property Valuation
Fees. These include the pre-feasibility study for the development of LNG Import Facilities at the ports of
Richards Bay; Ngqura and Saldanha. The research and design work must be completed over the 2017/18
year.
Material
Material costs relate to material used in the maintenance of marine fleet and civil maintenance and are
therefore directly influenced by maintenance activity. The material costs increase in FY 2017/18 is 9%
(R7m) with the average growth in material costs over the 3 year tariff application period amounting to 5%.
The explanations provided above under Maintenance have a direct bearing on material as well.
Computer and Information Systems
Computer and information systems include network costs, software licences, information system support,
development cost, computer consumables and on-going maintenance thereof.
Transnet National Ports Authority Tariff Application for Financial Year 2017/18 __________________
Page 75 of 78
Rental
Rental costs relates to the hiring of internal and external land and buildings, leasing of vehicles, equipment,
computers and furniture.
Security
Security costs relate to the use of private security firms at the ports and are expected to increase by 4%
(R3m) for FY 2017/18.
Pre-Feasibility Studies
Pre-feasibility studies are undertaken to determine future capital investments in a pre-feasibility phase to
determine the best alternative for construction, preliminary design work and costing to assess overall
viability of the project.
The increase in pre-feasibility costs for FY 2017/18 is 32% (R30m).
Pre-feasibility study costs for FY 2017/18 includes studies relating to ship repair facilities for the port
system in terms of the Operation Phakisa initiative at the ports of East London; Saldanha; Durban and Cape
Town. The Authority will also be embarking on research on other development projects including the
Richards Bay expansion; increased power supply in the Port of Durban; roads study interlinked with metro;
the Cape Town container terminal expansion. It will also be necessary for the Authority to complete the
revised National Ports Plan and Port Development Framework Plans, as well as land use and port zoning
plans for development.
Sundry Operating Costs
The detailed costs relating to sundry expenses are highlighted in Table 41 below. Sundry Costs include
expenses relating to insurance, stationery and printing, transport, promotions and advertising, and other
miscellaneous operating expenditure.
The main cost drivers relating to sundry expenses are as follows:
Legal Costs:
Health and Sanitation
Insurance
Other (i.e. mainly consulting)
Further to the above, the request for proposals for the Section 56 projects and public hearings thereof
will lead to increased environmental management, legal fees, printing/stationary, promotions and
advertising and feasibility studies.
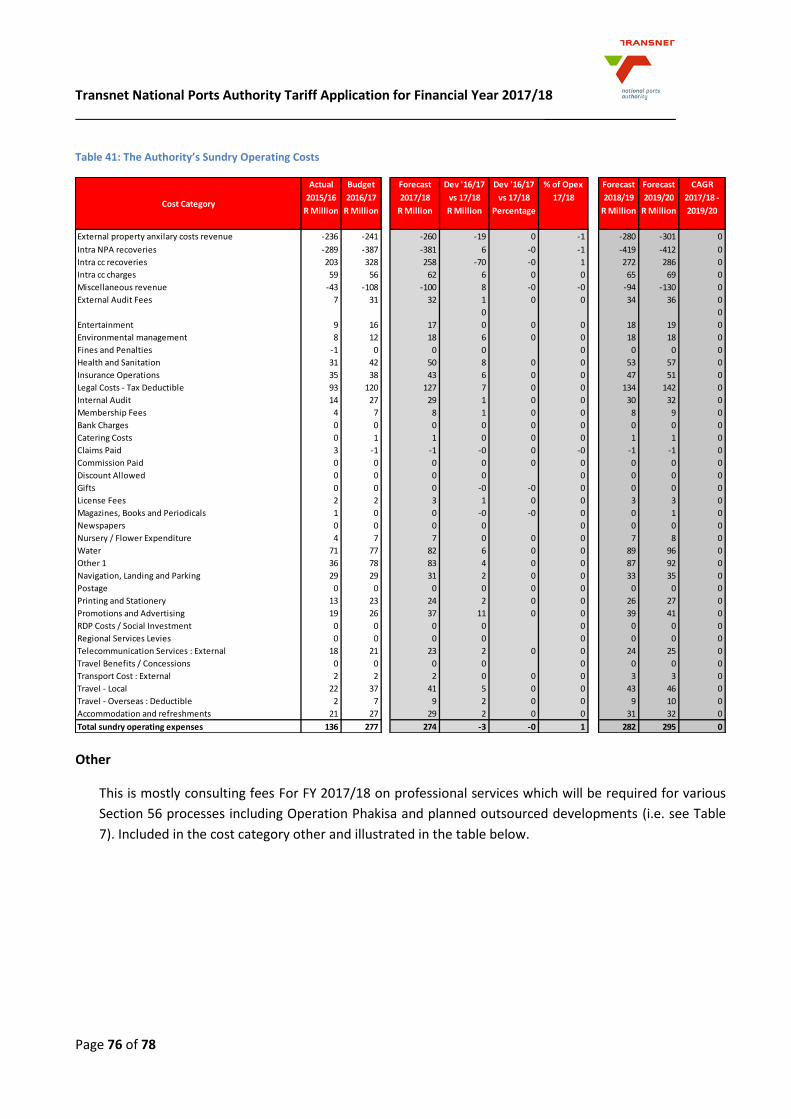
Transnet National Ports Authority Tariff Application for Financial Year 2017/18 __________________
Page 76 of 78
Table 41: The Authority’s Sundry Operating Costs
Other
This is mostly consulting fees For FY 2017/18 on professional services which will be required for various
Section 56 processes including Operation Phakisa and planned outsourced developments (i.e. see Table
7). Included in the cost category other and illustrated in the table below.
Actual Budget Forecast Dev '16/17 Dev '16/17 % of Opex Forecast Forecast CAGR
2015/16 2016/17 2017/18 vs 17/18 vs 17/18 17/18 2018/19 2019/20 2017/18 -
R Million R Million R Million R Million Percentage R Million R Million 2019/20
External property anxilary costs revenue -236 -241 -260 -19 0 -1 -280 -301 0
Intra NPA recoveries -289 -387 -381 6 -0 -1 -419 -412 0
Intra cc recoveries 203 328 258 -70 -0 1 272 286 0
Intra cc charges 59 56 62 6 0 0 65 69 0
Miscellaneous revenue -43 -108 -100 8 -0 -0 -94 -130 0
External Audit Fees 7 31 32 1 0 0 34 36 0
0 0
Entertainment 9 16 17 0 0 0 18 19 0
Environmental management 8 12 18 6 0 0 18 18 0
Fines and Penalties -1 0 0 0 0 0 0 0
Health and Sanitation 31 42 50 8 0 0 53 57 0
Insurance Operations 35 38 43 6 0 0 47 51 0
Legal Costs - Tax Deductible 93 120 127 7 0 0 134 142 0
Internal Audit 14 27 29 1 0 0 30 32 0
Membership Fees 4 7 8 1 0 0 8 9 0
Bank Charges 0 0 0 0 0 0 0 0 0
Catering Costs 0 1 1 0 0 0 1 1 0
Claims Paid 3 -1 -1 -0 0 -0 -1 -1 0
Commission Paid 0 0 0 0 0 0 0 0 0
Discount Allowed 0 0 0 0 0 0 0 0
Gifts 0 0 0 -0 -0 0 0 0 0
License Fees 2 2 3 1 0 0 3 3 0
Magazines, Books and Periodicals 1 0 0 -0 -0 0 0 1 0
Newspapers 0 0 0 0 0 0 0 0
Nursery / Flower Expenditure 4 7 7 0 0 0 7 8 0
Water 71 77 82 6 0 0 89 96 0
Other 1 36 78 83 4 0 0 87 92 0
Navigation, Landing and Parking 29 29 31 2 0 0 33 35 0
Postage 0 0 0 0 0 0 0 0 0
Printing and Stationery 13 23 24 2 0 0 26 27 0
Promotions and Advertising 19 26 37 11 0 0 39 41 0
RDP Costs / Social Investment 0 0 0 0 0 0 0 0
Regional Services Levies 0 0 0 0 0 0 0 0
Telecommunication Services : External 18 21 23 2 0 0 24 25 0
Travel Benefits / Concessions 0 0 0 0 0 0 0 0
Transport Cost : External 2 2 2 0 0 0 3 3 0
Travel - Local 22 37 41 5 0 0 43 46 0
Travel - Overseas : Deductible 2 7 9 2 0 0 9 10 0
Accommodation and refreshments 21 27 29 2 0 0 31 32 0
Total sundry operating expenses 136 277 274 -3 -0 1 282 295 0
Cost Category
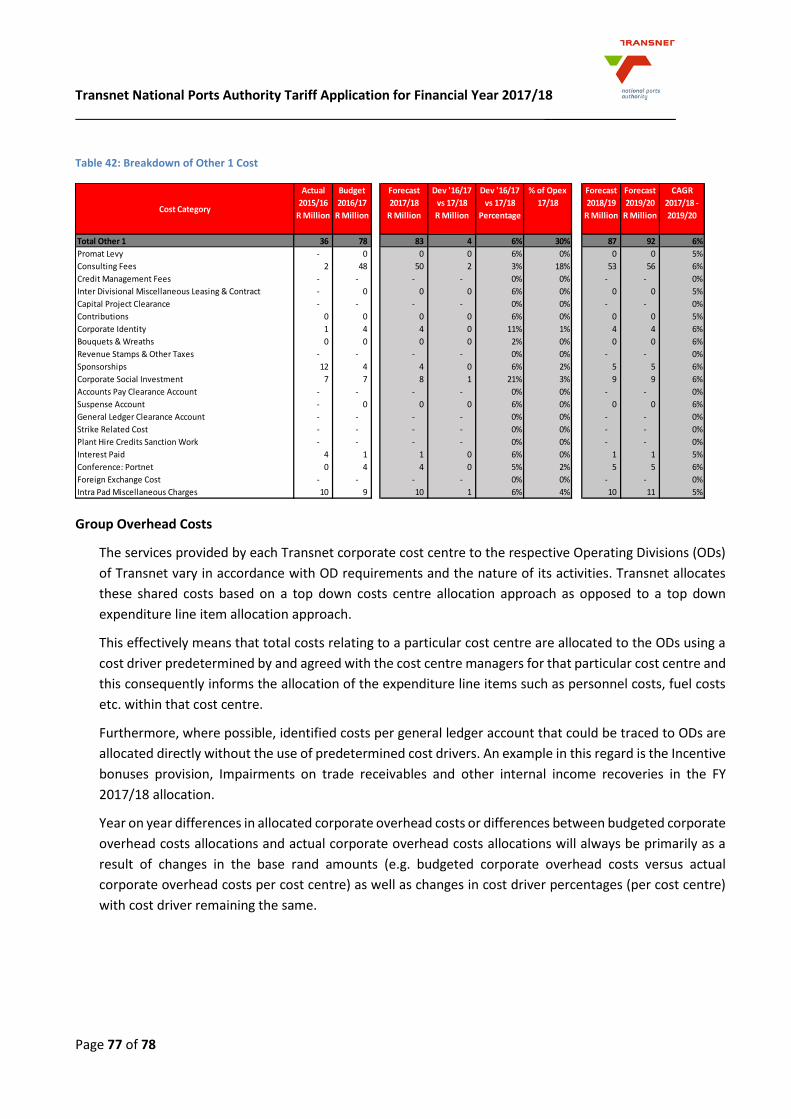
Transnet National Ports Authority Tariff Application for Financial Year 2017/18 __________________
Page 77 of 78
Table 42: Breakdown of Other 1 Cost
Group Overhead Costs
The services provided by each Transnet corporate cost centre to the respective Operating Divisions (ODs)
of Transnet vary in accordance with OD requirements and the nature of its activities. Transnet allocates
these shared costs based on a top down costs centre allocation approach as opposed to a top down
expenditure line item allocation approach.
This effectively means that total costs relating to a particular cost centre are allocated to the ODs using a
cost driver predetermined by and agreed with the cost centre managers for that particular cost centre and
this consequently informs the allocation of the expenditure line items such as personnel costs, fuel costs
etc. within that cost centre.
Furthermore, where possible, identified costs per general ledger account that could be traced to ODs are
allocated directly without the use of predetermined cost drivers. An example in this regard is the Incentive
bonuses provision, Impairments on trade receivables and other internal income recoveries in the FY
2017/18 allocation.
Year on year differences in allocated corporate overhead costs or differences between budgeted corporate
overhead costs allocations and actual corporate overhead costs allocations will always be primarily as a
result of changes in the base rand amounts (e.g. budgeted corporate overhead costs versus actual
corporate overhead costs per cost centre) as well as changes in cost driver percentages (per cost centre)
with cost driver remaining the same.
Actual Budget Forecast Dev '16/17 Dev '16/17 % of Opex Forecast Forecast CAGR
2015/16 2016/17 2017/18 vs 17/18 vs 17/18 17/18 2018/19 2019/20 2017/18 -
R Million R Million R Million R Million Percentage R Million R Million 2019/20
Total Other 1 36 78 83 4 6% 30% 87 92 6%
Promat Levy - 0 0 0 6% 0% 0 0 5%
Consulting Fees 2 48 50 2 3% 18% 53 56 6%
Credit Management Fees - - - - 0% 0% - - 0%
Inter Divisional Miscellaneous Leasing & Contract - 0 0 0 6% 0% 0 0 5%
Capital Project Clearance - - - - 0% 0% - - 0%
Contributions 0 0 0 0 6% 0% 0 0 5%
Corporate Identity 1 4 4 0 11% 1% 4 4 6%
Bouquets & Wreaths 0 0 0 0 2% 0% 0 0 6%
Revenue Stamps & Other Taxes - - - - 0% 0% - - 0%
Sponsorships 12 4 4 0 6% 2% 5 5 6%
Corporate Social Investment 7 7 8 1 21% 3% 9 9 6%
Accounts Pay Clearance Account - - - - 0% 0% - - 0%
Suspense Account - 0 0 0 6% 0% 0 0 6%
General Ledger Clearance Account - - - - 0% 0% - - 0%
Strike Related Cost - - - - 0% 0% - - 0%
Plant Hire Credits Sanction Work - - - - 0% 0% - - 0%
Interest Paid 4 1 1 0 6% 0% 1 1 5%
Conference: Portnet 0 4 4 0 5% 2% 5 5 6%
Foreign Exchange Cost - - - - 0% 0% - - 0%
Intra Pad Miscellaneous Charges 10 9 10 1 6% 4% 10 11 5%
Cost Category

Transnet National Ports Authority Tariff Application for Financial Year 2017/18 __________________
Page 78 of 78
Table 43: Group Overhead Costs
In order to achieve some of the key milestones of the MDS, Transnet has been and continues to implement
cost containment initiatives across all of its operating divisions and specialist units which include the
Transnet corporate office. Transnet corporate overhead costs allocated to the Authority have thus been
decreasing given the strict measures that have been taken to reduce operating costs.
Of importance to note is that the above allocation of corporate overhead costs to the Authority excludes
any share of the corporate costs provision for incentive bonuses.
FY 2015/16 FY 2016/17 FY 2017/18 FY 2018/19 FY 2019/20
Actuals Budget Projections Projections Projections
Revenue External -0.62 - - - 0% - -
Revenue Internal - - - - 0% - -
Internal Recoveries -8.50 - - - 0% - -
Total Revenue -9.13 - - - 0% - -
Net Operating Expenses 443.81 572.61 440.07 -132.54 -23% 477.74 514.48
Personnel Costs 148.08 255.61 139.34 -116.27 -45% 151.74 163.26
Fuel Costs 0.09 0.18 0.24 0.06 32% 0.27 0.28
Electricity Costs 5.45 1.38 1.93 0.55 40% 2.12 2.27
Material Costs 0.13 0.36 0.51 0.15 43% 0.56 0.60
Other Operating Costs 290.06 315.09 298.04 -17.04 -5% 323.06 348.06
Accommodation and Refreshments 6.09 3.94 1.85 -2.09 -53% 2.02 2.17
Professional Fees 69.21 81.87 95.54 13.68 17% 103.53 111.50
Electronic Data Costs 78.02 23.81 58.43 34.62 145% 24.98 68.25
Internal Audit 22.55 26.47 23.13 -3.34 -13% 63.31 26.98
Social Investment 35.26 37.86 36.06 -1.80 -5% 39.19 42.17
Miscellaneous Costs 78.93 141.14 83.03 -58.11 -41% 90.03 96.99 Profit from Operations before Depreciation,
Amortisation and Items listed below 434.68 572.61 440.07 -132.54 -23% 477.74 514.48
Depreciation and Amortisation 32.88 47.35 40.75 -6.60 -14% 38.56 37.05
Profit from Operations before Items listed below 467.57 619.96 480.82 -139.15 -22% 516.30 551.53
Profit on Sale of Interest in Business - - - - 0% - -
Impairment of Assets 1.14 - -0.84 -0.84 0% -0.84 -0.84
Dividends Received - - - - 0% - -
Post-Retirement Benefits Obligation Costs 23.85 26.94 27.49 0.55 2% 29.88 32.15
Fair Value Adjustments 0.17 0.09 0.13 0.04 40% 0.14 0.15
Income from Associstes - - - - 0% - -
Profit from Operations before Net Finance Costs 492.73 646.99 507.60 -139.39 -22% 545.48 583.00
Transnet Capital Projects 13.29 3.39 0.87 -2.52 -74% 2.58 3.46
Transnet Foundation -0.23 -0.27 0.11 0.38 -138% 0.08 0.04
Transnet Corporate Overhead Costs: NPA 505.79 650.11 508.58 -141.53 -22% 548.14 586.50
YOY % Increase
Details
Transnet Group Costs
Dev FY 16/17
vs FY 17/18
Dev FY 16/17
vs FY 17/18 (%)