Embed Size (px)
Citation preview
CDP CDP 2016 Climate Change 2016 Information Request Nampak Ltd
Module: Introduction
Page: Introduction
CC0.1
Introduction Please give a general description and introduction to your organization. Nampak is Africa’s largest diversified packaging manufacturer and has manufacturing operations in South Africa, 11 African countries as well as in the United Kingdom and Isle of Man. Nampak manufactures packaging products from metal, glass, plastics and paper, which are supplied to a wide range of customers. Nampak is the major supplier of plastic bottles to the dairy industry in the United Kingdom. In the rest of Africa there are manufacturing operations in Angola, Botswana, Ethiopia, Kenya, Malawi, Mozambique, Nigeria, Swaziland, Tanzania, Zambia and Zimbabwe. These operations service international beverage (alcoholic and non-alcoholic) and food markets (dairy, food services, fruit and vegetable, meat and poultry, snack food), as well as chemicals, tobacco, toiletries, household, industrial, healthcare and retail markets. During FY2015, Nampak underwent significant restructuring and disposed of the Corrugated, Flexibles, Sacks and Tissues business units, hence the 2014 Scope 1 & 2 emissions data was restated to reflect the divestment. The group participates in post-consumer recycling through industry bodies. Nampak group services control head office, procurement, treasury and property rental activities and are based in Bryanston, Johannesburg.
CC0.2
Reporting Year Please state the start and end date of the year for which you are reporting data. The current reporting year is the latest/most recent 12-month period for which data is reported. Enter the dates of this year first.
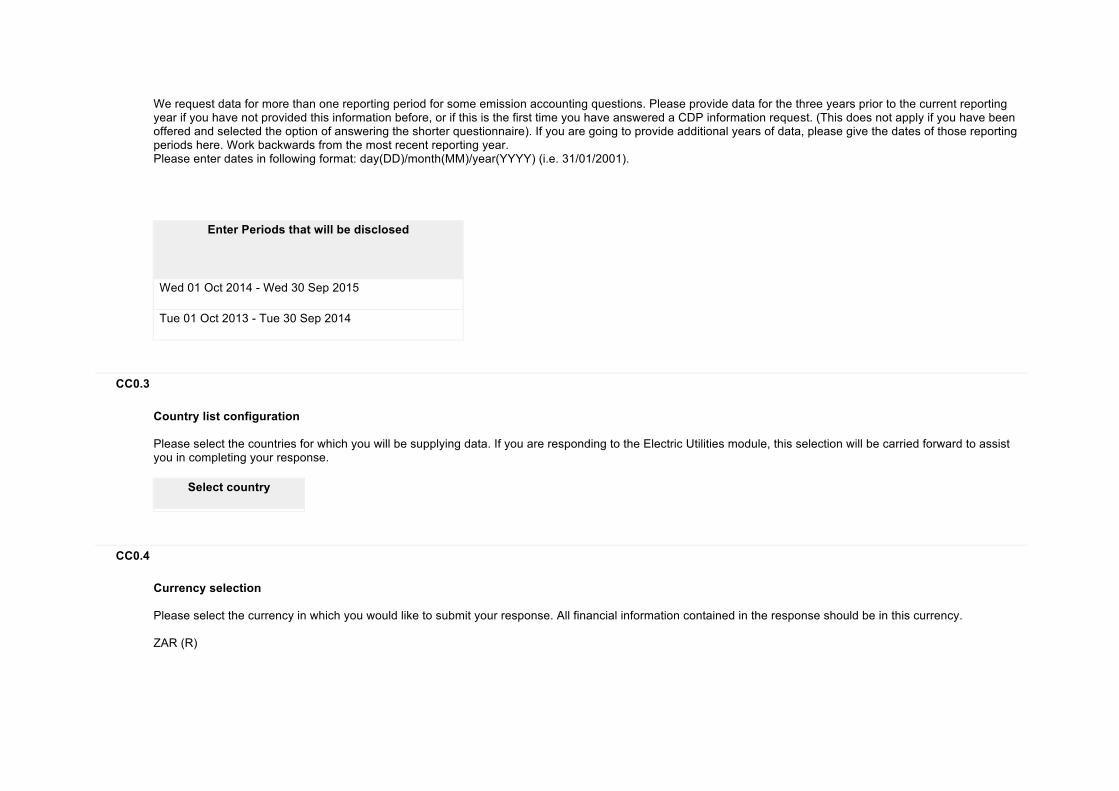
We request data for more than one reporting period for some emission accounting questions. Please provide data for the three years prior to the current reporting year if you have not provided this information before, or if this is the first time you have answered a CDP information request. (This does not apply if you have been offered and selected the option of answering the shorter questionnaire). If you are going to provide additional years of data, please give the dates of those reporting periods here. Work backwards from the most recent reporting year. Please enter dates in following format: day(DD)/month(MM)/year(YYYY) (i.e. 31/01/2001).
Enter Periods that will be disclosed
Wed 01 Oct 2014 - Wed 30 Sep 2015 Tue 01 Oct 2013 - Tue 30 Sep 2014
CC0.3
Country list configuration Please select the countries for which you will be supplying data. If you are responding to the Electric Utilities module, this selection will be carried forward to assist you in completing your response.
Select country
CC0.4
Currency selection Please select the currency in which you would like to submit your response. All financial information contained in the response should be in this currency. ZAR (R)
CC0.6
Modules As part of the request for information on behalf of investors, electric utilities, companies with electric utility activities or assets, companies in the automobile or auto component manufacture sub-industries, companies in the oil and gas sub-industries, companies in the information technology and telecommunications sectors and companies in the food, beverage and tobacco industry group should complete supplementary questions in addition to the main questionnaire. If you are in these sector groupings (according to the Global Industry Classification Standard (GICS)), the corresponding sector modules will not appear below but will automatically appear in the navigation bar when you save this page. If you want to query your classification, please email [email protected]. If you have not been presented with a sector module that you consider would be appropriate for your company to answer, please select the module below. If you wish to view the questions first, please see https://www.cdp.net/en-US/Programmes/Pages/More-questionnaires.aspx.
Further Information
Module: Management
Page: CC1. Governance
CC1.1
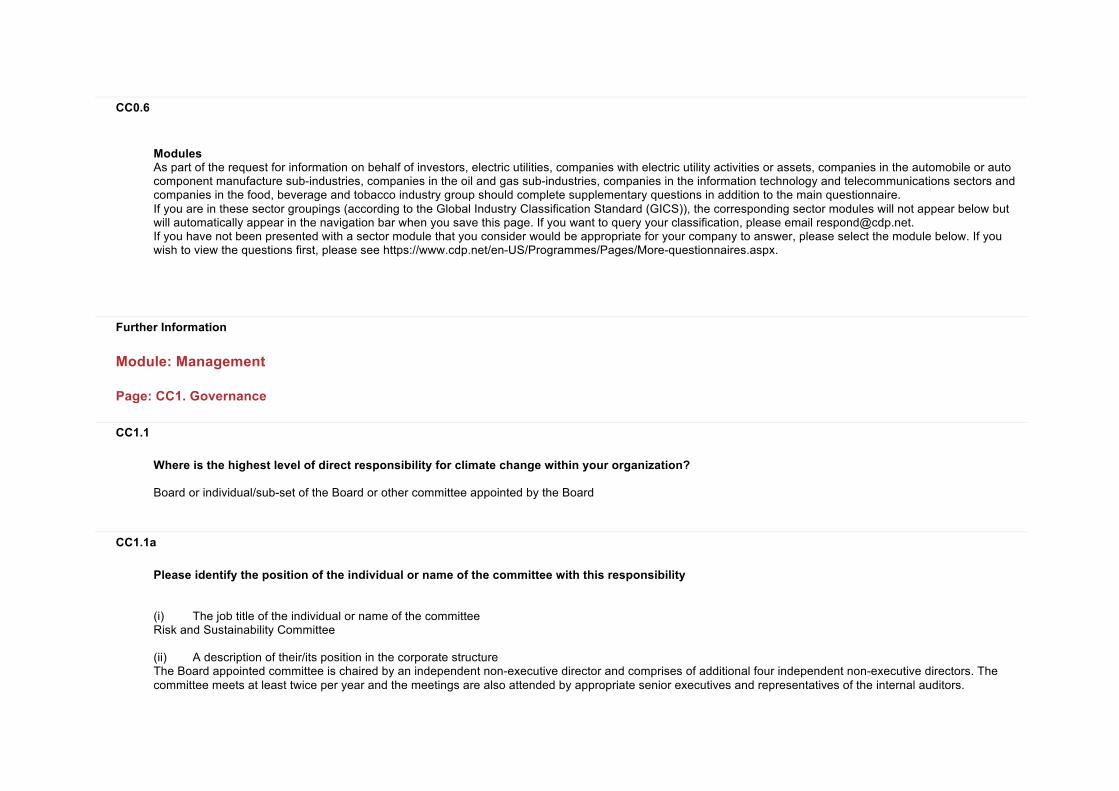
Where is the highest level of direct responsibility for climate change within your organization? Board or individual/sub-set of the Board or other committee appointed by the Board
CC1.1a
Please identify the position of the individual or name of the committee with this responsibility (i) The job title of the individual or name of the committee Risk and Sustainability Committee (ii) A description of their/its position in the corporate structure The Board appointed committee is chaired by an independent non-executive director and comprises of additional four independent non-executive directors. The committee meets at least twice per year and the meetings are also attended by appropriate senior executives and representatives of the internal auditors.
The Risk and Sustainability committee provides guidance on the overall sustainability processes for the group. This includes inter alia reviewing trends in sustainability practices that include climate change, defining the group’s sustainability commitments, providing guidance on policy frameworks as well as monitoring and reporting to the Board on the group’s progress against its sustainability commitments that include climate change and environmental issues.
CC1.2
Do you provide incentives for the management of climate change issues, including the attainment of targets? Yes
CC1.2a
Please provide further details on the incentives provided for the management of climate change issues
Who is entitled to benefit from these
incentives?
The type of incentives
Incentivized performance
indicator
Comment
Management group Monetary reward
Energy reduction target
Performance against energy usage targets forms part of the individual performance measures that determine annual salary increases and the annual incentive bonus payments for senior management.
Further Information
Page: CC2. Strategy
CC2.1
Please select the option that best describes your risk management procedures with regard to climate change risks and opportunities Integrated into multi-disciplinary company wide risk management processes
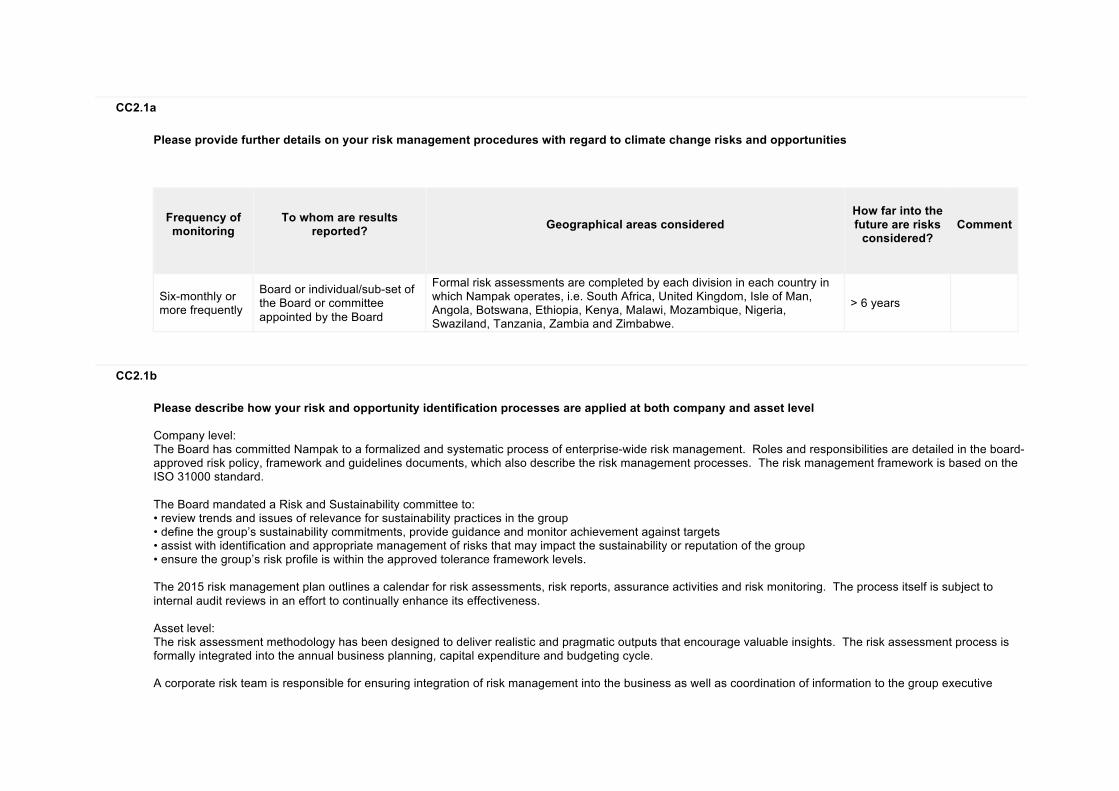
CC2.1a
Please provide further details on your risk management procedures with regard to climate change risks and opportunities
Frequency of monitoring
To whom are results
reported?
Geographical areas considered
How far into the future are risks
considered?
Comment
Six-monthly or more frequently
Board or individual/sub-set of the Board or committee appointed by the Board
Formal risk assessments are completed by each division in each country in which Nampak operates, i.e. South Africa, United Kingdom, Isle of Man, Angola, Botswana, Ethiopia, Kenya, Malawi, Mozambique, Nigeria, Swaziland, Tanzania, Zambia and Zimbabwe.
> 6 years
CC2.1b
Please describe how your risk and opportunity identification processes are applied at both company and asset level Company level: The Board has committed Nampak to a formalized and systematic process of enterprise-wide risk management. Roles and responsibilities are detailed in the board-approved risk policy, framework and guidelines documents, which also describe the risk management processes. The risk management framework is based on the ISO 31000 standard. The Board mandated a Risk and Sustainability committee to: • review trends and issues of relevance for sustainability practices in the group • define the group’s sustainability commitments, provide guidance and monitor achievement against targets • assist with identification and appropriate management of risks that may impact the sustainability or reputation of the group • ensure the group’s risk profile is within the approved tolerance framework levels. The 2015 risk management plan outlines a calendar for risk assessments, risk reports, assurance activities and risk monitoring. The process itself is subject to internal audit reviews in an effort to continually enhance its effectiveness. Asset level: The risk assessment methodology has been designed to deliver realistic and pragmatic outputs that encourage valuable insights. The risk assessment process is formally integrated into the annual business planning, capital expenditure and budgeting cycle. A corporate risk team is responsible for ensuring integration of risk management into the business as well as coordination of information to the group executive
committee for review, before presenting it to the Risk and Sustainability committee. Risk trends are monitored using performance data and key risk indicators aligned to the current business plan. Identified risks are monitored at divisional and group meetings, which are attended by the CEO and/or CFO. Internal risk reporting is regimented and interaction on various risk issues occurs throughout the year. Historic risk data is retained to track risk mitigation performance and establish trend-lines.
CC2.1c
How do you prioritize the risks and opportunities identified? Management established a number of functions and processes to address and prioritize operational risks and opportunities. Formal risk assessments are completed annually at each division and group support function using proprietary enterprise risk management software. This structured methodology includes: • identification and assessment of inherent risks with quantification, where appropriate • a review of the mitigating opportunities or initiatives to reduce the impact of a particular risk • assessing whether the risk has a likelihood of declining, increasing or remaining stable over the next three to five years • the provision of a residual risk position. Predetermined risk categories have been established to guide the operations in their risk assessments. Operational risk registers are updated quarterly while at group level the identified risks are reviewed through a consolidated risk register. The residual risk scores guide the level of attention required from the group executive and the Risk and Sustainability committee. The group has established a risk appetite and risk tolerance framework. Measurement parameters used to determine the risk appetite is the group’s EBITDA, and the risk tolerance is set against key financial ratios. Risk appetite statements in respect of social, economic and environmental, including climate change aspects, have also been agreed. The risk management framework provides an outline of the potential financial impact on all risk categories, thereby ensuring that the level of financial risk exposure is taken into account when determining the residual risk outcome. Nampak’s most material risks are assessed in terms of each risk’s potential impact on the achievement of the group’s strategy, as well as the probability of each arising. As the intensity of risks can change periodically, the risks are not ranked in order of their magnitude. The probability of each occurring influences the position of the risks on the heat map.
CC2.1d
Please explain why you do not have a process in place for assessing and managing risks and opportunities from climate change, and whether you plan to introduce such a process in future
Main reason for not having a process
Do you plan to introduce a process?
Comment
CC2.2
Is climate change integrated into your business strategy? Yes
CC2.2a
Please describe the process of how climate change is integrated into your business strategy and any outcomes of this process i) Nampak is considered to be a company with medium impact on the environment. Its major impacts come in the form of the use of raw material it purchases (such as tinplate, aluminium and various forms of plastics, silica sand, soda ash, limestone and dolomite), the non-renewable source of electricity and water that is consumes and the management of post-consumer waste, reuse and recycling. Nampak’s environmental policy states its commitment to operating as an environmentally responsible company, and its belief that the integrated actions of its operations to conserve natural resources and protect the environment make business sense. As a packaging supplier, Nampak is indirectly exposed to the same risks and opportunities as its customers. These are assessed and deliberated with customers at divisional level as the risks and opportunities could be different across the packaging material types. Information gathered through various forms of engagement with stakeholders also informs the risk assessments undertaken by the divisions. Nampak strives to create packaging that is balanced in terms of providing product protection and preservation, is cost-effective, creates maximum consumer appeal and at the same time takes into account environmental responsibility. Nampak therefore considers the environment in all business decisions and actions and promotes environmental awareness, both internally and externally, through proactive communications with stakeholders. Environmental aspects as well as the resultant effect on Nampak’s operations are considered in all procurement decisions. ii) Climate change presents both risks and opportunities for Nampak, a holding company with diverse interests in metals, glass, plastics and paper, and with 53 manufacturing sites. Climate change aspects, which influenced Nampak’s business strategy include shortages or the availability of resources and severe weather events that could lead
to logistics interruptions. The threat of energy shortages and outages coupled with possible taxes and increased costs influenced various energy efficiency initiatives. Changes in consumer behaviour and attitude towards more sustainable, less energy-intensive products have influenced Nampak’s research and development of more sustainable packaging products. iii) Nampak has adopted a dual approach to short term strategy changes. The first approach is to establish a Nampak-specific carbon footprint using the Greenhouse Gas Protocol. The second approach is a lifecycle assessment process, which establishes the carbon emissions of packaging products from resource usage (cradle) to the customers’ premises (gate) and can be further extended in conjunction with customers to include the filled product to the end of its lifecycle. Water usage at Nampak is measured and targets are set with action plans to sustainably reduce water usage relative to the volume of product produced. About 69% of Nampak’s greenhouse gas emissions come from power consumption. The South African divisions had an overall target (in line with Eskom’s target) to reduce Nampak’s energy consumption by 10% between 2008 and 2013 in its continuous operations, which was achieved. In 2014 a new five-year target was set that requires a 10% reduction in energy intensity efficiency ratios by 2019 from a 2014 baseline across all operations. iv) Long term strategy changes influenced by climate change relate to the development of sustainable packaging through continued group participation in extensive recycling initiatives and investment of significant time and resources into the development of innovative packaging that is lighter and has a higher proportion of recyclable content. Nampak’s significant research and development capability enables the company to respond to a changing consumer attitude and regulatory environment, as it allows Nampak to capitalise on movements in consumption patterns driven by environmental awareness. v) Strategic competitive advantage can be obtained by balancing the generation of packaging waste, depletion of natural resources, the efficient use of energy and recycling which all has a positive effect on costs. Shifts in consumer attitude towards more sustainable, less energy-intensive products present a business opportunity as Nampak manufactures several products that help businesses and consumers export to the European Union (EU). vi) Nampak invested nearly R933 million in a third furnace at the Roodekop glass factory, which was commissioned in July 2014. The furnace consumes natural gas during operations, which has the added benefit of diversifying the energy supply from electricity to natural gas resulting in reduced GHG emissions. The bulk of Nampak’s water usage takes place in the production of beverage cans and for the cooling system in the manufacture of glass bottles. To reduce Nampak’s reliance on municipal water, a water harvesting system was installed during the construction of the third glass furnace in 2014. The closed-loop system has a 1 176kl water harvest tank, which filters out particles and other waste to a skip and circulates the water through the system for reuse. This eliminates the need for Nampak to continuously draw water from municipal sources. The new furnace is targeted to save 15% on energy consumption, meet all the country’s new air quality emission standards and reduce water consumption by up to 90% with a new closed loop water system. During FY2015 Nampak invested R25 million on the installation of a water treatment plant in Angola while commissioning the second aluminium beverage can line in that country. The plant recovers and recycles between 95% and 98% of the 192 000 litres of used water per day that is generated from production. It is one of only
two such systems in the world. Besides conserving a valuable natural resource, this recycling capacity will reduce reliance on municipal water and will improve operating efficiencies in future years.
CC2.2b
Please explain why climate change is not integrated into your business strategy
CC2.2c
Does your company use an internal price of carbon? No, and we currently don't anticipate doing so in the next 2 years
CC2.2d
Please provide details and examples of how your company uses an internal price of carbon
CC2.3
Do you engage in activities that could either directly or indirectly influence public policy on climate change through any of the following? (tick all that apply) Direct engagement with policy makers Trade associations
CC2.3a
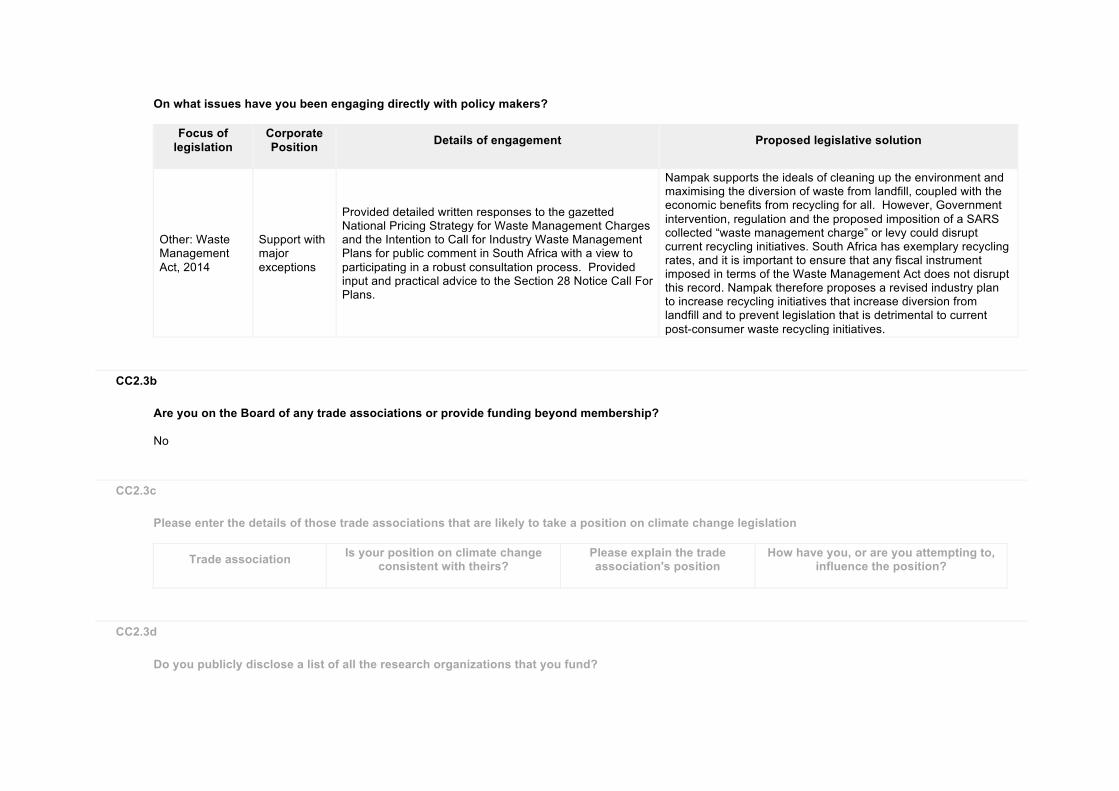
On what issues have you been engaging directly with policy makers?
Focus of legislation
Corporate Position
Details of engagement
Proposed legislative solution
Other: Waste Management Act, 2014
Support with major exceptions
Provided detailed written responses to the gazetted National Pricing Strategy for Waste Management Charges and the Intention to Call for Industry Waste Management Plans for public comment in South Africa with a view to participating in a robust consultation process. Provided input and practical advice to the Section 28 Notice Call For Plans.
Nampak supports the ideals of cleaning up the environment and maximising the diversion of waste from landfill, coupled with the economic benefits from recycling for all. However, Government intervention, regulation and the proposed imposition of a SARS collected “waste management charge” or levy could disrupt current recycling initiatives. South Africa has exemplary recycling rates, and it is important to ensure that any fiscal instrument imposed in terms of the Waste Management Act does not disrupt this record. Nampak therefore proposes a revised industry plan to increase recycling initiatives that increase diversion from landfill and to prevent legislation that is detrimental to current post-consumer waste recycling initiatives.
CC2.3b
Are you on the Board of any trade associations or provide funding beyond membership? No
CC2.3c
Please enter the details of those trade associations that are likely to take a position on climate change legislation
Trade association
Is your position on climate change consistent with theirs?
Please explain the trade association's position
How have you, or are you attempting to, influence the position?
CC2.3d
Do you publicly disclose a list of all the research organizations that you fund?
CC2.3e
Please provide details of the other engagement activities that you undertake
CC2.3f
What processes do you have in place to ensure that all of your direct and indirect activities that influence policy are consistent with your overall climate change strategy? Nampak is acutely aware of the impact that packaging products can have on the environment. The various divisional representatives engage and meet on a regular basis with policy makers, trade associations and industry bodies to debate and give recommendations on various topics including regulation, climate change and competition to ensure sustainability in their business models. Feedback on issues is reported as per the in the Nampak risk management guidelines and framework.
CC2.3g
Please explain why you do not engage with policy makers
Further Information
Page: CC3. Targets and Initiatives
CC3.1
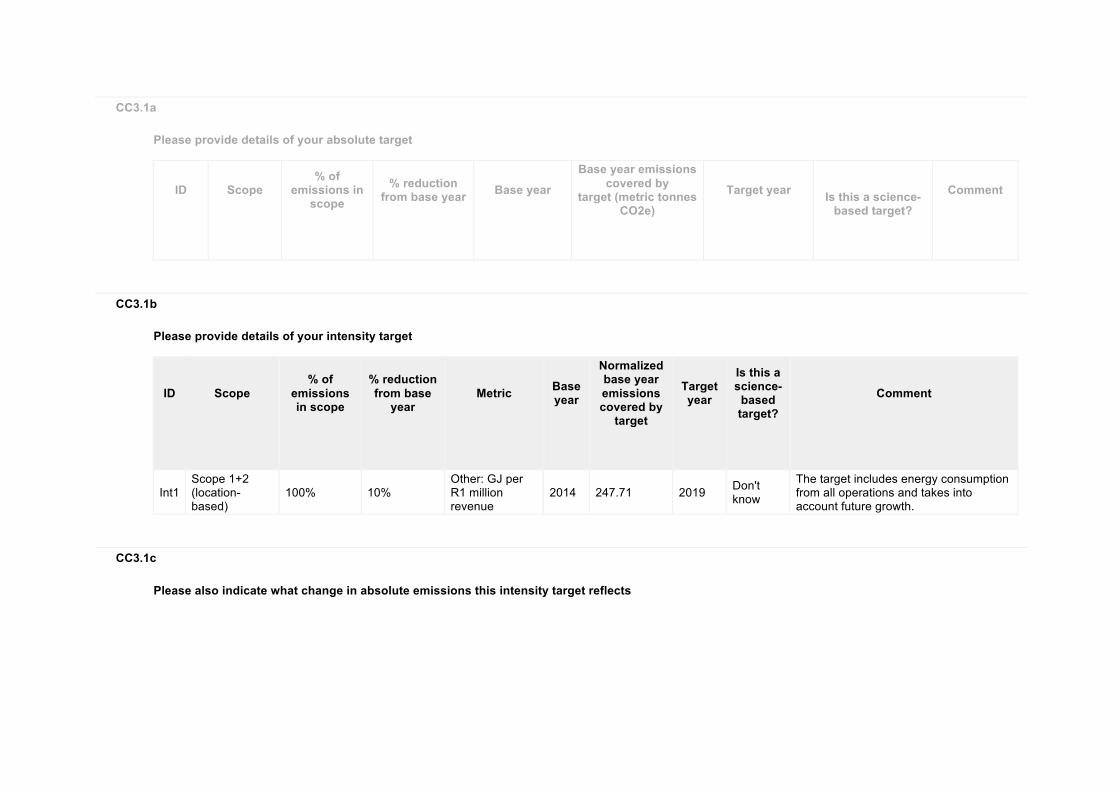
Did you have an emissions reduction or renewable energy consumption or production target that was active (ongoing or reached completion) in the reporting year? Intensity target
CC3.1a
Please provide details of your absolute target
ID
Scope
% of emissions in
scope
% reduction from base year
Base year
Base year emissions covered by
target (metric tonnes CO2e)
Target year
Is this a science-
based target?
Comment
CC3.1b
Please provide details of your intensity target
ID
Scope
% of emissions in scope
% reduction from base
year
Metric
Base year
Normalized base year emissions covered by
target
Target year
Is this a science-
based target?
Comment
Int1 Scope 1+2 (location-based)
100% 10% Other: GJ per R1 million revenue
2014 247.71 2019 Don't know
The target includes energy consumption from all operations and takes into account future growth.
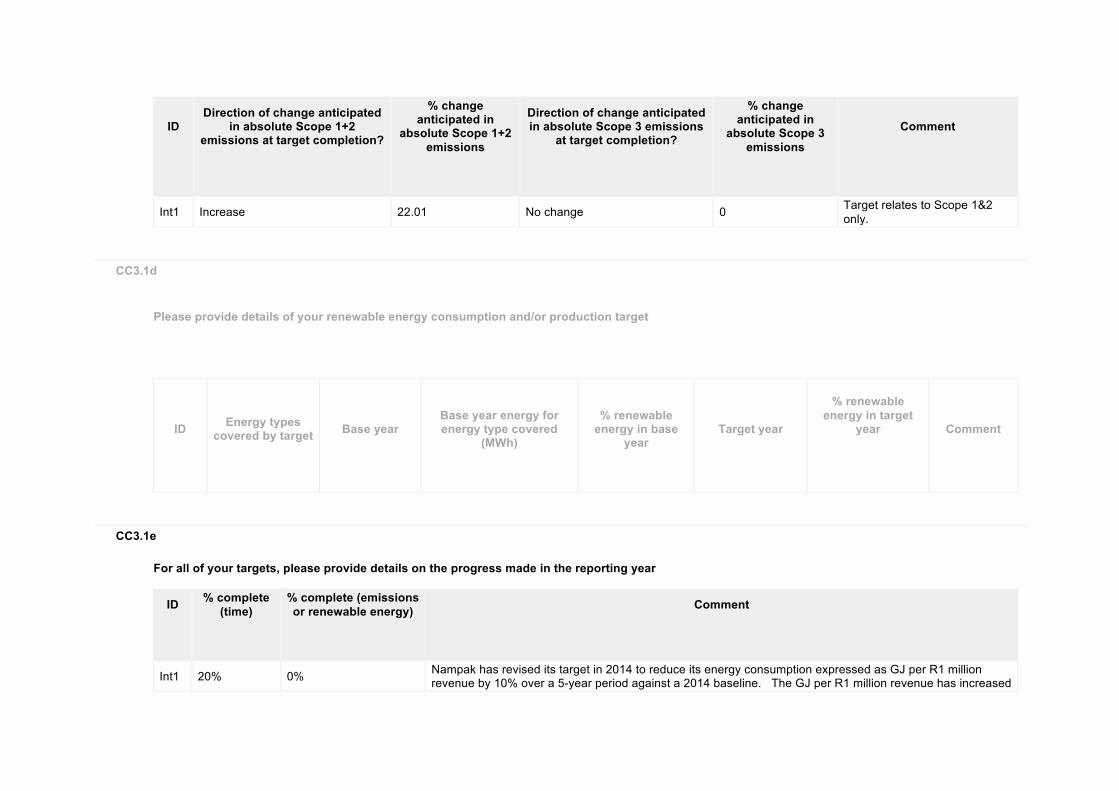
CC3.1c
Please also indicate what change in absolute emissions this intensity target reflects
ID
Direction of change anticipated in absolute Scope 1+2
emissions at target completion?
% change anticipated in
absolute Scope 1+2 emissions
Direction of change anticipated in absolute Scope 3 emissions
at target completion?
% change anticipated in
absolute Scope 3 emissions
Comment
Int1 Increase 22.01 No change 0 Target relates to Scope 1&2 only.
CC3.1d
Please provide details of your renewable energy consumption and/or production target
ID
Energy types
covered by target
Base year
Base year energy for energy type covered
(MWh)
% renewable
energy in base year
Target year
% renewable
energy in target year
Comment
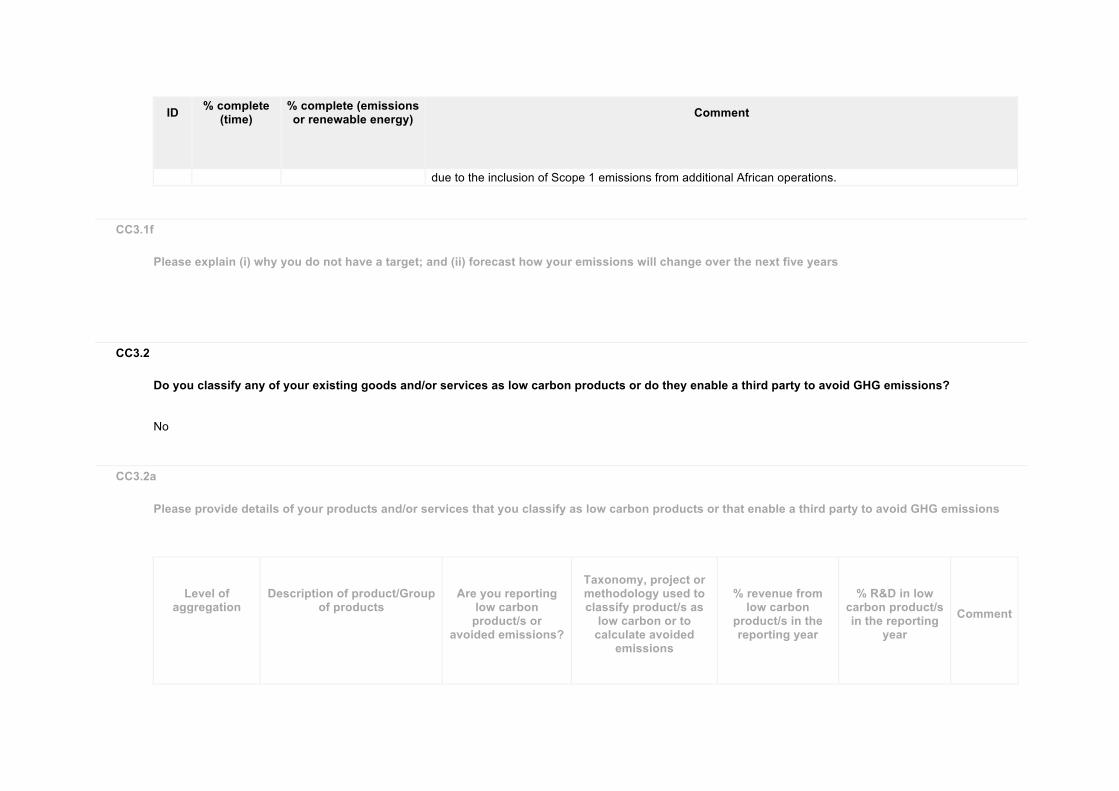
CC3.1e
For all of your targets, please provide details on the progress made in the reporting year
ID
% complete (time)
% complete (emissions or renewable energy)
Comment
Int1 20% 0% Nampak has revised its target in 2014 to reduce its energy consumption expressed as GJ per R1 million revenue by 10% over a 5-year period against a 2014 baseline. The GJ per R1 million revenue has increased
ID
% complete (time)
% complete (emissions or renewable energy)
Comment
due to the inclusion of Scope 1 emissions from additional African operations.
CC3.1f
Please explain (i) why you do not have a target; and (ii) forecast how your emissions will change over the next five years
CC3.2
Do you classify any of your existing goods and/or services as low carbon products or do they enable a third party to avoid GHG emissions? No
CC3.2a
Please provide details of your products and/or services that you classify as low carbon products or that enable a third party to avoid GHG emissions
Level of
aggregation
Description of product/Group
of products
Are you reporting
low carbon product/s or
avoided emissions?
Taxonomy, project or methodology used to classify product/s as
low carbon or to calculate avoided
emissions
% revenue from
low carbon product/s in the reporting year
% R&D in low
carbon product/s in the reporting
year
Comment
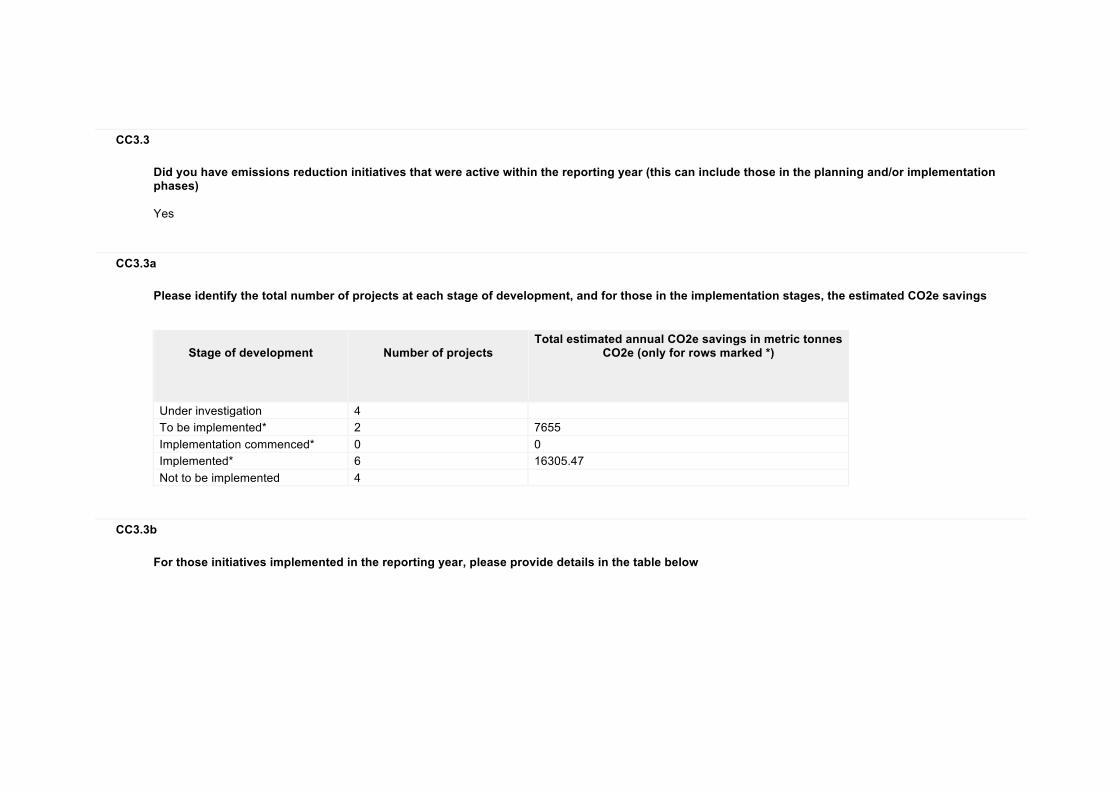
CC3.3
Did you have emissions reduction initiatives that were active within the reporting year (this can include those in the planning and/or implementation phases) Yes
CC3.3a
Please identify the total number of projects at each stage of development, and for those in the implementation stages, the estimated CO2e savings
Stage of development
Number of projects
Total estimated annual CO2e savings in metric tonnes CO2e (only for rows marked *)
Under investigation 4 To be implemented* 2 7655 Implementation commenced* 0 0 Implemented* 6 16305.47 Not to be implemented 4
CC3.3b
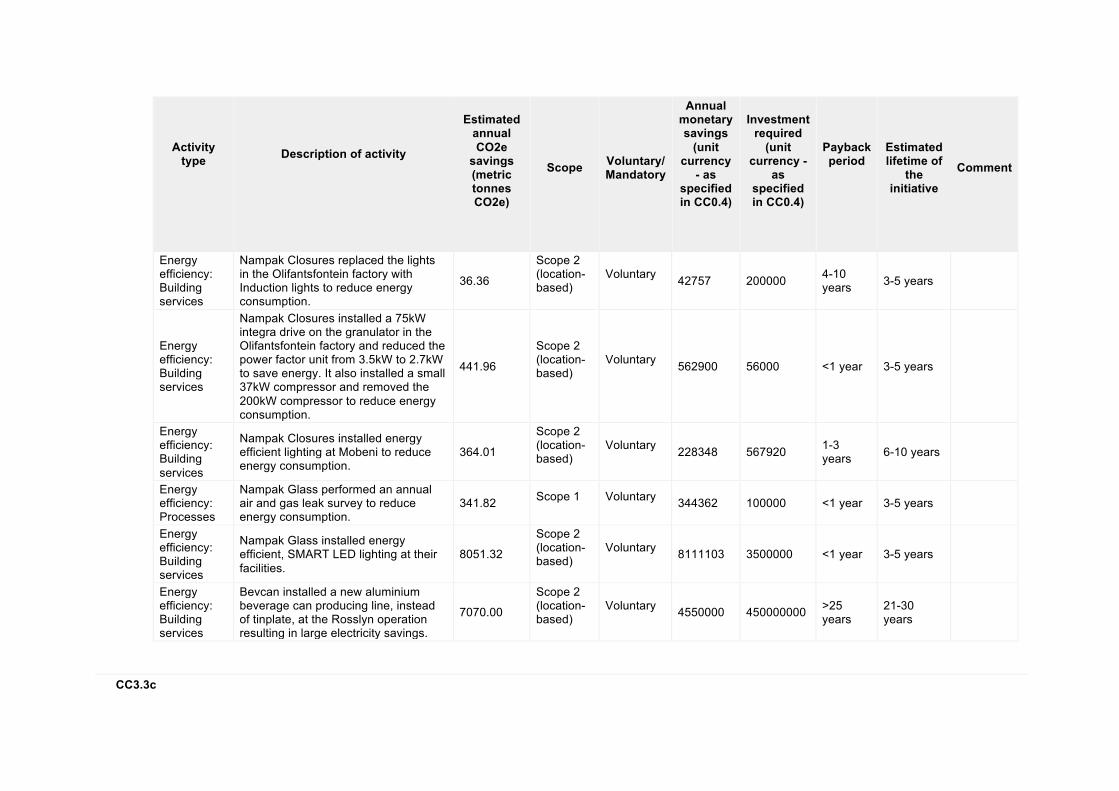
For those initiatives implemented in the reporting year, please provide details in the table below
Activity type
Description of activity
Estimated annual CO2e
savings (metric tonnes CO2e)
Scope
Voluntary/ Mandatory
Annual monetary savings
(unit currency
- as specified in CC0.4)
Investment required
(unit currency -
as specified in CC0.4)
Payback period
Estimated lifetime of
the initiative
Comment
Energy efficiency: Building services
Nampak Closures replaced the lights in the Olifantsfontein factory with Induction lights to reduce energy consumption.
36.36
Scope 2 (location-based)
Voluntary 42757 200000 4-10
years 3-5 years
Energy efficiency: Building services
Nampak Closures installed a 75kW integra drive on the granulator in the Olifantsfontein factory and reduced the power factor unit from 3.5kW to 2.7kW to save energy. It also installed a small 37kW compressor and removed the 200kW compressor to reduce energy consumption.
441.96
Scope 2 (location-based)
Voluntary 562900 56000 <1 year 3-5 years
Energy efficiency: Building services
Nampak Closures installed energy efficient lighting at Mobeni to reduce energy consumption.
364.01
Scope 2 (location-based)
Voluntary 228348 567920 1-3
years 6-10 years
Energy efficiency: Processes
Nampak Glass performed an annual air and gas leak survey to reduce energy consumption.
341.82 Scope 1
Voluntary 344362 100000 <1 year 3-5 years
Energy efficiency: Building services
Nampak Glass installed energy efficient, SMART LED lighting at their facilities.
8051.32
Scope 2 (location-based)
Voluntary 8111103 3500000 <1 year 3-5 years
Energy efficiency: Building services
Bevcan installed a new aluminium beverage can producing line, instead of tinplate, at the Rosslyn operation resulting in large electricity savings.
7070.00
Scope 2 (location-based)
Voluntary 4550000 450000000 >25
years 21-30 years
CC3.3c
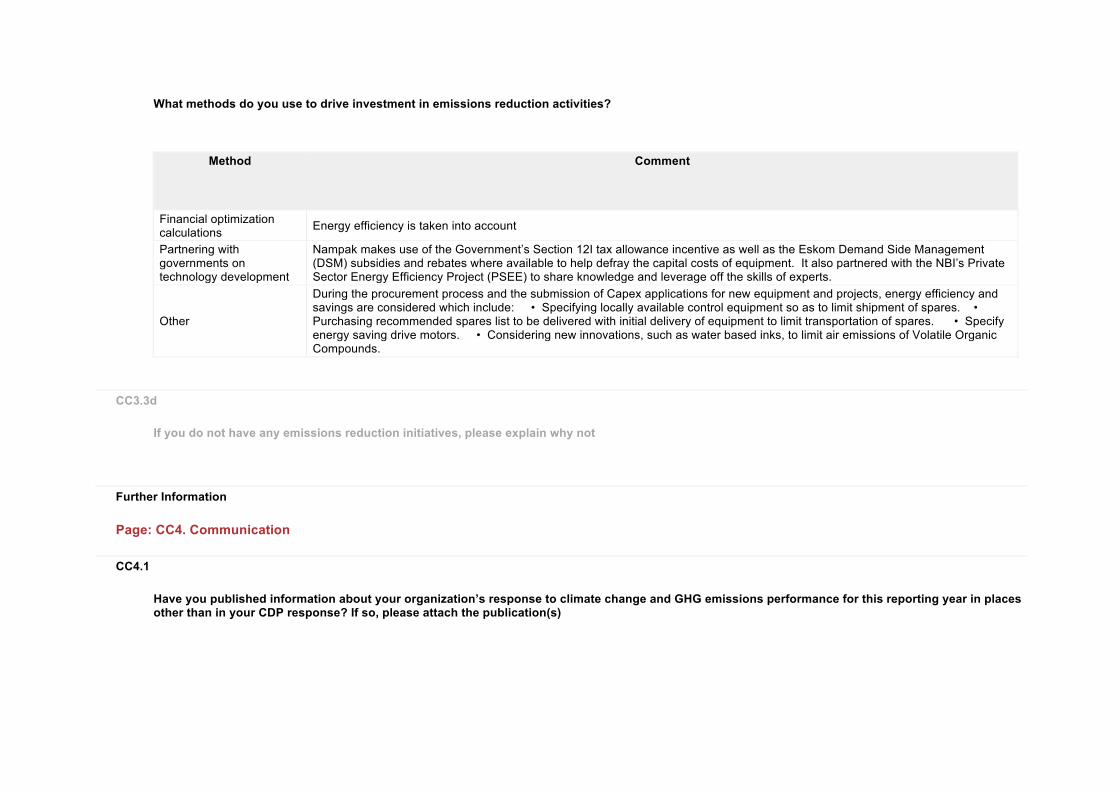
What methods do you use to drive investment in emissions reduction activities?
Method
Comment
Financial optimization calculations Energy efficiency is taken into account
Partnering with governments on technology development
Nampak makes use of the Government’s Section 12I tax allowance incentive as well as the Eskom Demand Side Management (DSM) subsidies and rebates where available to help defray the capital costs of equipment. It also partnered with the NBI’s Private Sector Energy Efficiency Project (PSEE) to share knowledge and leverage off the skills of experts.
Other
During the procurement process and the submission of Capex applications for new equipment and projects, energy efficiency and savings are considered which include: • Specifying locally available control equipment so as to limit shipment of spares. • Purchasing recommended spares list to be delivered with initial delivery of equipment to limit transportation of spares. • Specify energy saving drive motors. • Considering new innovations, such as water based inks, to limit air emissions of Volatile Organic Compounds.
CC3.3d
If you do not have any emissions reduction initiatives, please explain why not
Further Information
Page: CC4. Communication
CC4.1
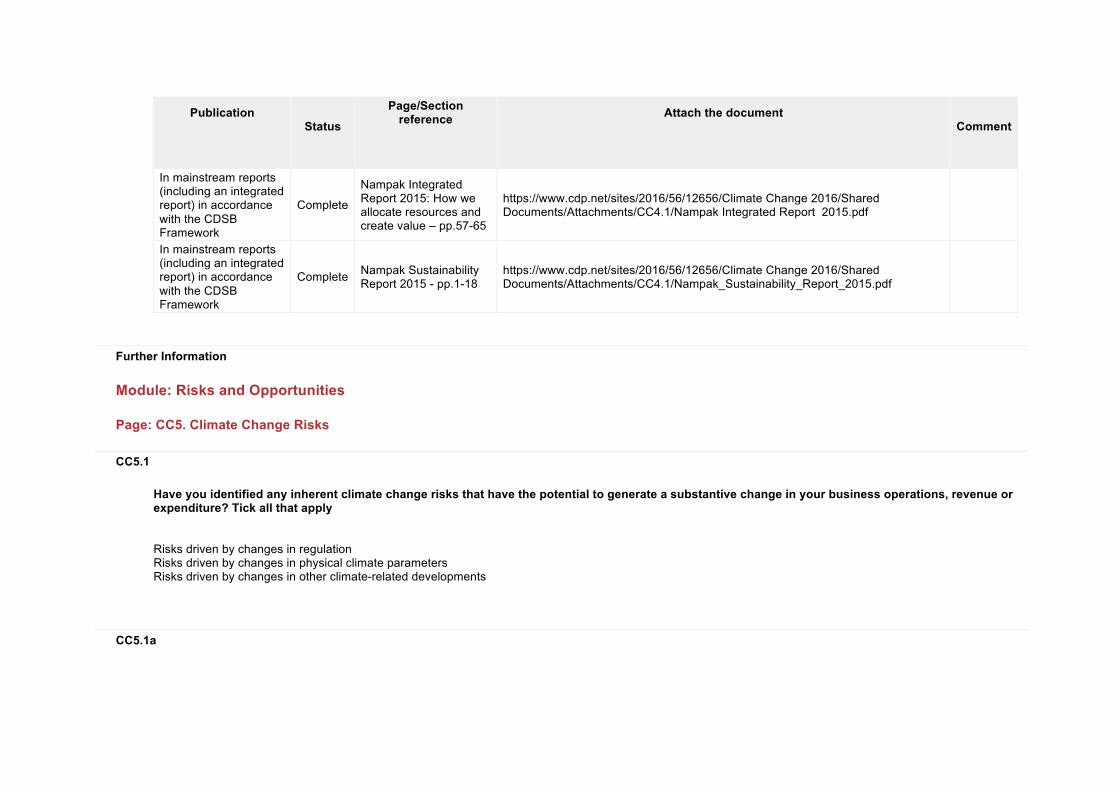
Have you published information about your organization’s response to climate change and GHG emissions performance for this reporting year in places other than in your CDP response? If so, please attach the publication(s)
Publication
Status
Page/Section reference
Attach the document
Comment
In mainstream reports (including an integrated report) in accordance with the CDSB Framework
Complete
Nampak Integrated Report 2015: How we allocate resources and create value – pp.57-65
https://www.cdp.net/sites/2016/56/12656/Climate Change 2016/Shared Documents/Attachments/CC4.1/Nampak Integrated Report 2015.pdf
In mainstream reports (including an integrated report) in accordance with the CDSB Framework
Complete Nampak Sustainability Report 2015 - pp.1-18
https://www.cdp.net/sites/2016/56/12656/Climate Change 2016/Shared Documents/Attachments/CC4.1/Nampak_Sustainability_Report_2015.pdf
Further Information
Module: Risks and Opportunities
Page: CC5. Climate Change Risks
CC5.1
Have you identified any inherent climate change risks that have the potential to generate a substantive change in your business operations, revenue or expenditure? Tick all that apply Risks driven by changes in regulation Risks driven by changes in physical climate parameters Risks driven by changes in other climate-related developments
CC5.1a
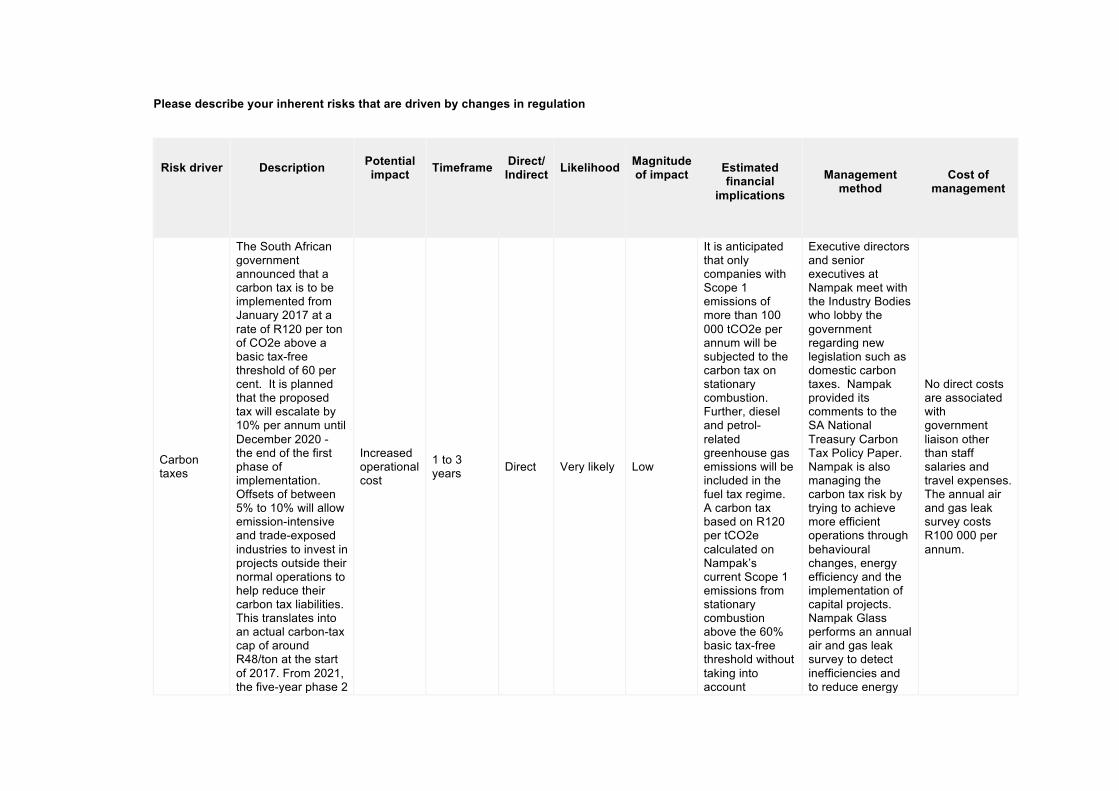
Please describe your inherent risks that are driven by changes in regulation
Risk driver
Description
Potential impact
Timeframe
Direct/ Indirect
Likelihood
Magnitude of impact
Estimated financial
implications
Management
method
Cost of
management
Carbon taxes
The South African government announced that a carbon tax is to be implemented from January 2017 at a rate of R120 per ton of CO2e above a basic tax-free threshold of 60 per cent. It is planned that the proposed tax will escalate by 10% per annum until December 2020 - the end of the first phase of implementation. Offsets of between 5% to 10% will allow emission-intensive and trade-exposed industries to invest in projects outside their normal operations to help reduce their carbon tax liabilities. This translates into an actual carbon-tax cap of around R48/ton at the start of 2017. From 2021, the five-year phase 2
Increased operational cost
1 to 3 years Direct Very likely Low
It is anticipated that only companies with Scope 1 emissions of more than 100 000 tCO2e per annum will be subjected to the carbon tax on stationary combustion. Further, diesel and petrol-related greenhouse gas emissions will be included in the fuel tax regime. A carbon tax based on R120 per tCO2e calculated on Nampak’s current Scope 1 emissions from stationary combustion above the 60% basic tax-free threshold without taking into account
Executive directors and senior executives at Nampak meet with the Industry Bodies who lobby the government regarding new legislation such as domestic carbon taxes. Nampak provided its comments to the SA National Treasury Carbon Tax Policy Paper. Nampak is also managing the carbon tax risk by trying to achieve more efficient operations through behavioural changes, energy efficiency and the implementation of capital projects. Nampak Glass performs an annual air and gas leak survey to detect inefficiencies and to reduce energy
No direct costs are associated with government liaison other than staff salaries and travel expenses. The annual air and gas leak survey costs R100 000 per annum.
Risk driver
Description
Potential impact
Timeframe
Direct/ Indirect
Likelihood
Magnitude of impact
Estimated financial
implications
Management
method
Cost of
management
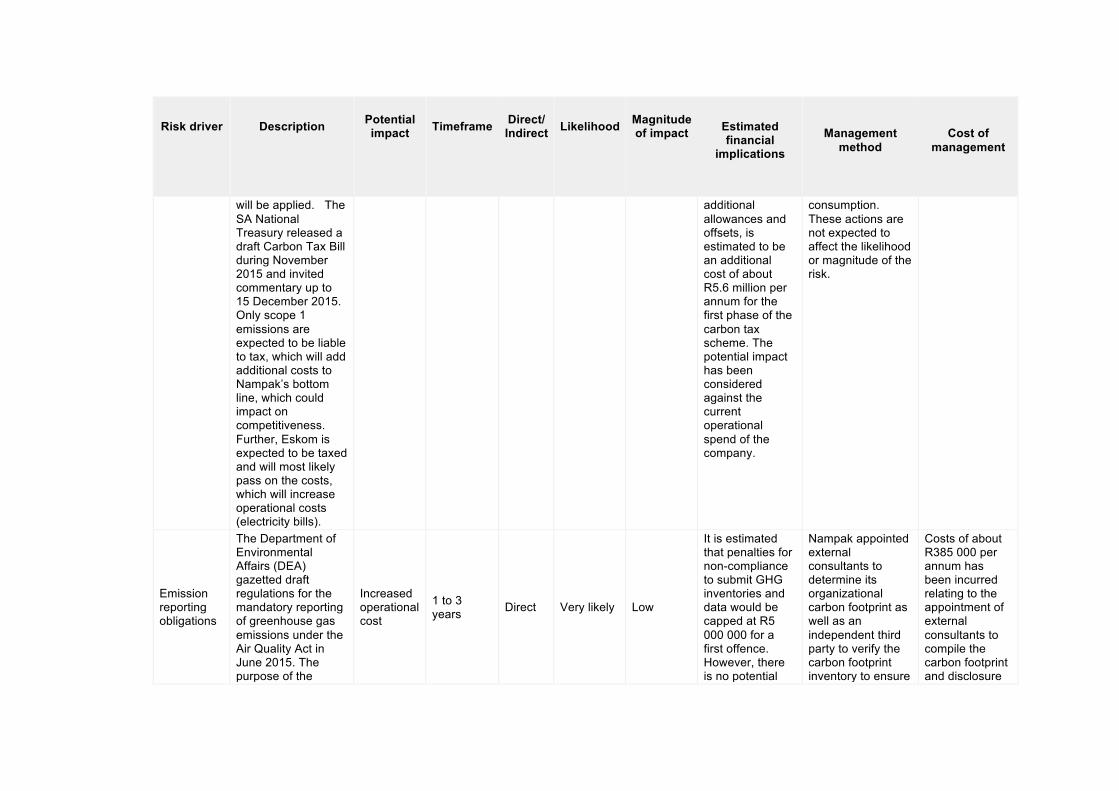
will be applied. The SA National Treasury released a draft Carbon Tax Bill during November 2015 and invited commentary up to 15 December 2015. Only scope 1 emissions are expected to be liable to tax, which will add additional costs to Nampak’s bottom line, which could impact on competitiveness. Further, Eskom is expected to be taxed and will most likely pass on the costs, which will increase operational costs (electricity bills).
additional allowances and offsets, is estimated to be an additional cost of about R5.6 million per annum for the first phase of the carbon tax scheme. The potential impact has been considered against the current operational spend of the company.
consumption. These actions are not expected to affect the likelihood or magnitude of the risk.
Emission reporting obligations
The Department of Environmental Affairs (DEA) gazetted draft regulations for the mandatory reporting of greenhouse gas emissions under the Air Quality Act in June 2015. The purpose of the
Increased operational cost
1 to 3 years Direct Very likely Low
It is estimated that penalties for non-compliance to submit GHG inventories and data would be capped at R5 000 000 for a first offence. However, there is no potential
Nampak appointed external consultants to determine its organizational carbon footprint as well as an independent third party to verify the carbon footprint inventory to ensure
Costs of about R385 000 per annum has been incurred relating to the appointment of external consultants to compile the carbon footprint and disclosure
Risk driver
Description
Potential impact
Timeframe
Direct/ Indirect
Likelihood
Magnitude of impact
Estimated financial
implications
Management
method
Cost of
management
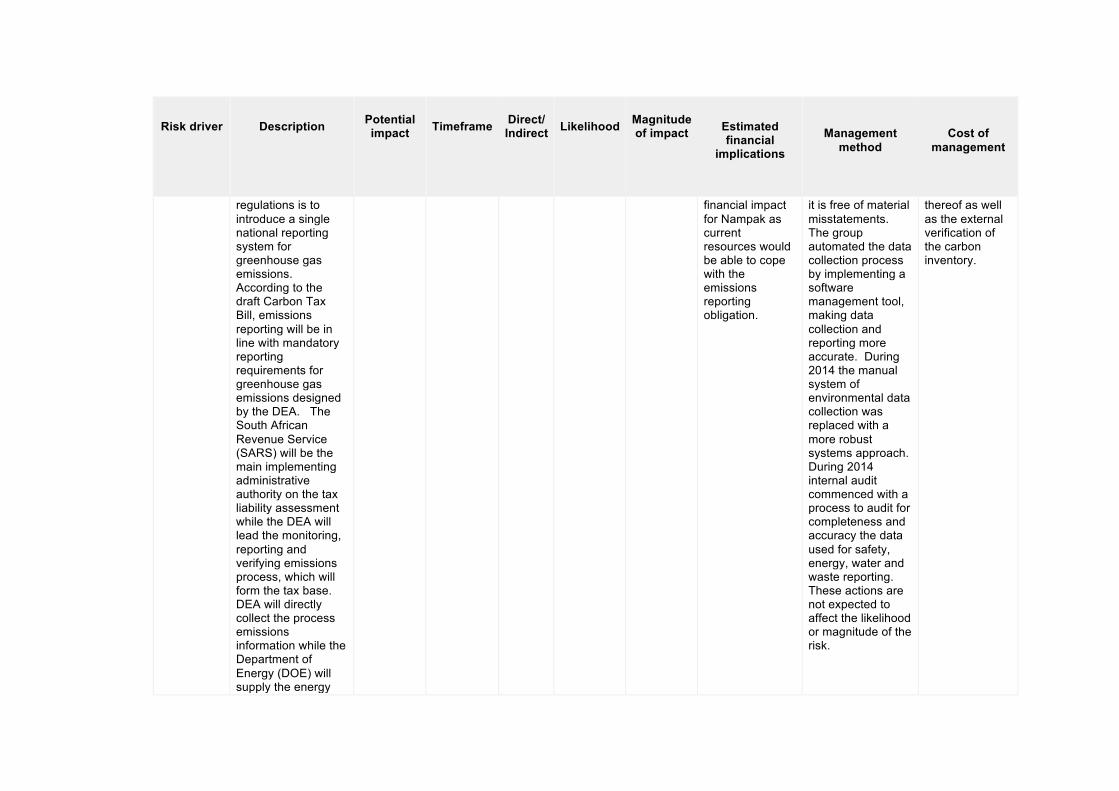
regulations is to introduce a single national reporting system for greenhouse gas emissions. According to the draft Carbon Tax Bill, emissions reporting will be in line with mandatory reporting requirements for greenhouse gas emissions designed by the DEA. The South African Revenue Service (SARS) will be the main implementing administrative authority on the tax liability assessment while the DEA will lead the monitoring, reporting and verifying emissions process, which will form the tax base. DEA will directly collect the process emissions information while the Department of Energy (DOE) will supply the energy
financial impact for Nampak as current resources would be able to cope with the emissions reporting obligation.
it is free of material misstatements. The group automated the data collection process by implementing a software management tool, making data collection and reporting more accurate. During 2014 the manual system of environmental data collection was replaced with a more robust systems approach. During 2014 internal audit commenced with a process to audit for completeness and accuracy the data used for safety, energy, water and waste reporting. These actions are not expected to affect the likelihood or magnitude of the risk.
thereof as well as the external verification of the carbon inventory.
Risk driver
Description
Potential impact
Timeframe
Direct/ Indirect
Likelihood
Magnitude of impact
Estimated financial
implications
Management
method
Cost of
management
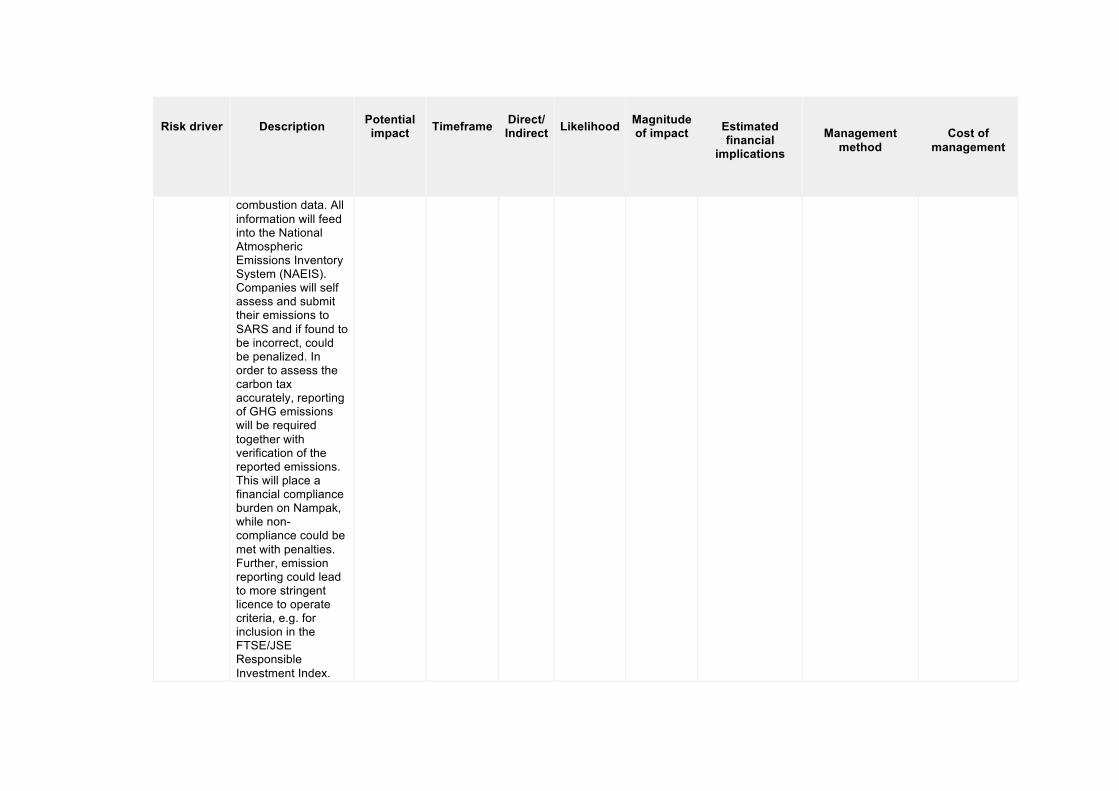
combustion data. All information will feed into the National Atmospheric Emissions Inventory System (NAEIS). Companies will self assess and submit their emissions to SARS and if found to be incorrect, could be penalized. In order to assess the carbon tax accurately, reporting of GHG emissions will be required together with verification of the reported emissions. This will place a financial compliance burden on Nampak, while non-compliance could be met with penalties. Further, emission reporting could lead to more stringent licence to operate criteria, e.g. for inclusion in the FTSE/JSE Responsible Investment Index.
Risk driver
Description
Potential impact
Timeframe
Direct/ Indirect
Likelihood
Magnitude of impact
Estimated financial
implications
Management
method
Cost of
management
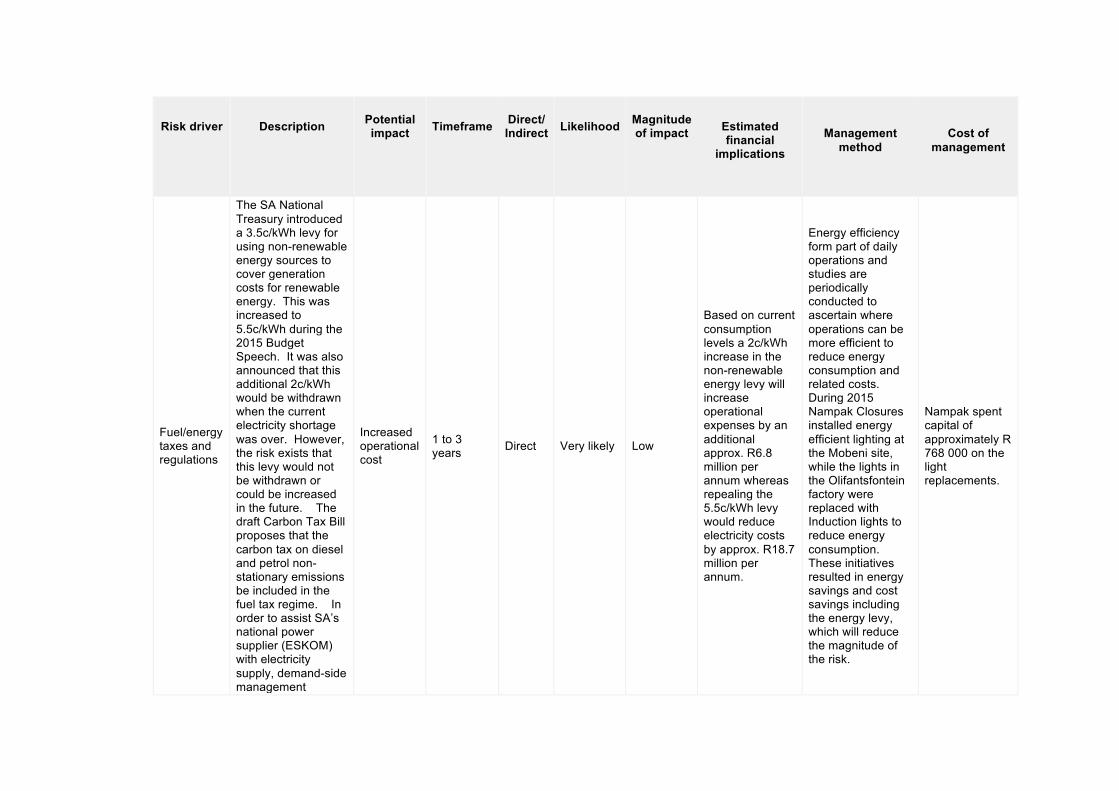
Fuel/energy taxes and regulations
The SA National Treasury introduced a 3.5c/kWh levy for using non-renewable energy sources to cover generation costs for renewable energy. This was increased to 5.5c/kWh during the 2015 Budget Speech. It was also announced that this additional 2c/kWh would be withdrawn when the current electricity shortage was over. However, the risk exists that this levy would not be withdrawn or could be increased in the future. The draft Carbon Tax Bill proposes that the carbon tax on diesel and petrol non-stationary emissions be included in the fuel tax regime. In order to assist SA’s national power supplier (ESKOM) with electricity supply, demand-side management
Increased operational cost
1 to 3 years Direct Very likely Low
Based on current consumption levels a 2c/kWh increase in the non-renewable energy levy will increase operational expenses by an additional approx. R6.8 million per annum whereas repealing the 5.5c/kWh levy would reduce electricity costs by approx. R18.7 million per annum.
Energy efficiency form part of daily operations and studies are periodically conducted to ascertain where operations can be more efficient to reduce energy consumption and related costs. During 2015 Nampak Closures installed energy efficient lighting at the Mobeni site, while the lights in the Olifantsfontein factory were replaced with Induction lights to reduce energy consumption. These initiatives resulted in energy savings and cost savings including the energy levy, which will reduce the magnitude of the risk.
Nampak spent capital of approximately R 768 000 on the light replacements.
Risk driver
Description
Potential impact
Timeframe
Direct/ Indirect
Likelihood
Magnitude of impact
Estimated financial
implications
Management
method
Cost of
management
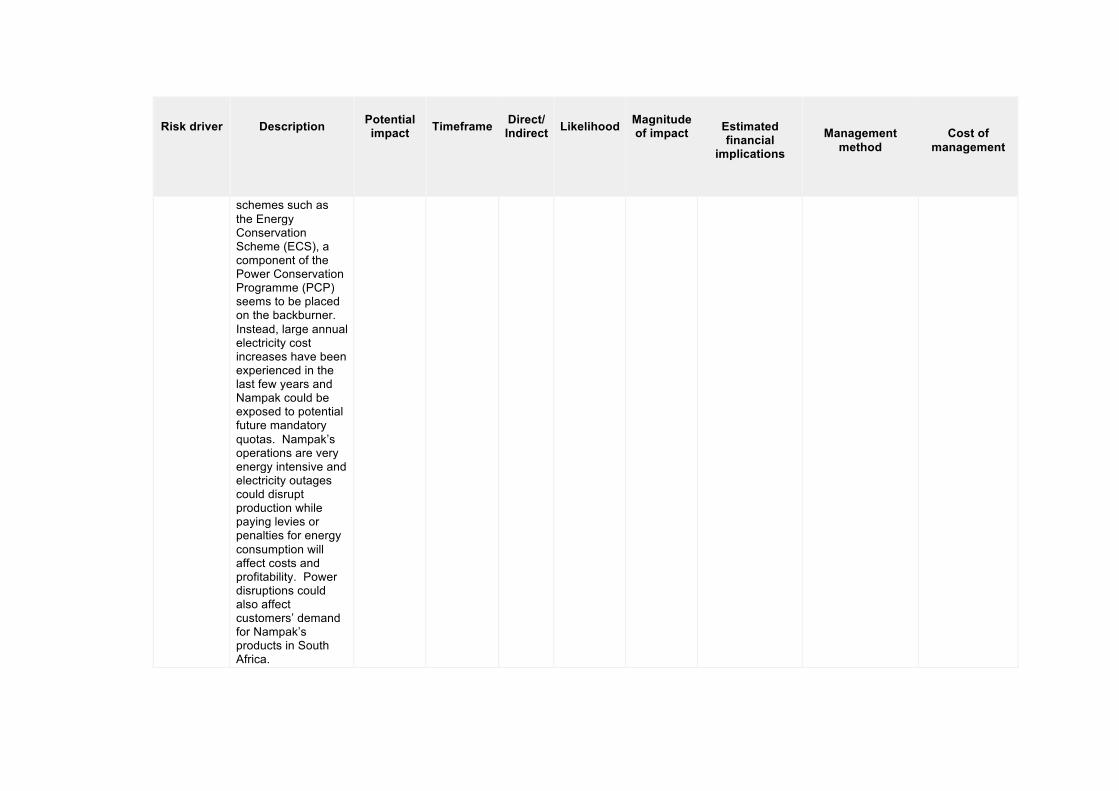
schemes such as the Energy Conservation Scheme (ECS), a component of the Power Conservation Programme (PCP) seems to be placed on the backburner. Instead, large annual electricity cost increases have been experienced in the last few years and Nampak could be exposed to potential future mandatory quotas. Nampak’s operations are very energy intensive and electricity outages could disrupt production while paying levies or penalties for energy consumption will affect costs and profitability. Power disruptions could also affect customers’ demand for Nampak’s products in South Africa.
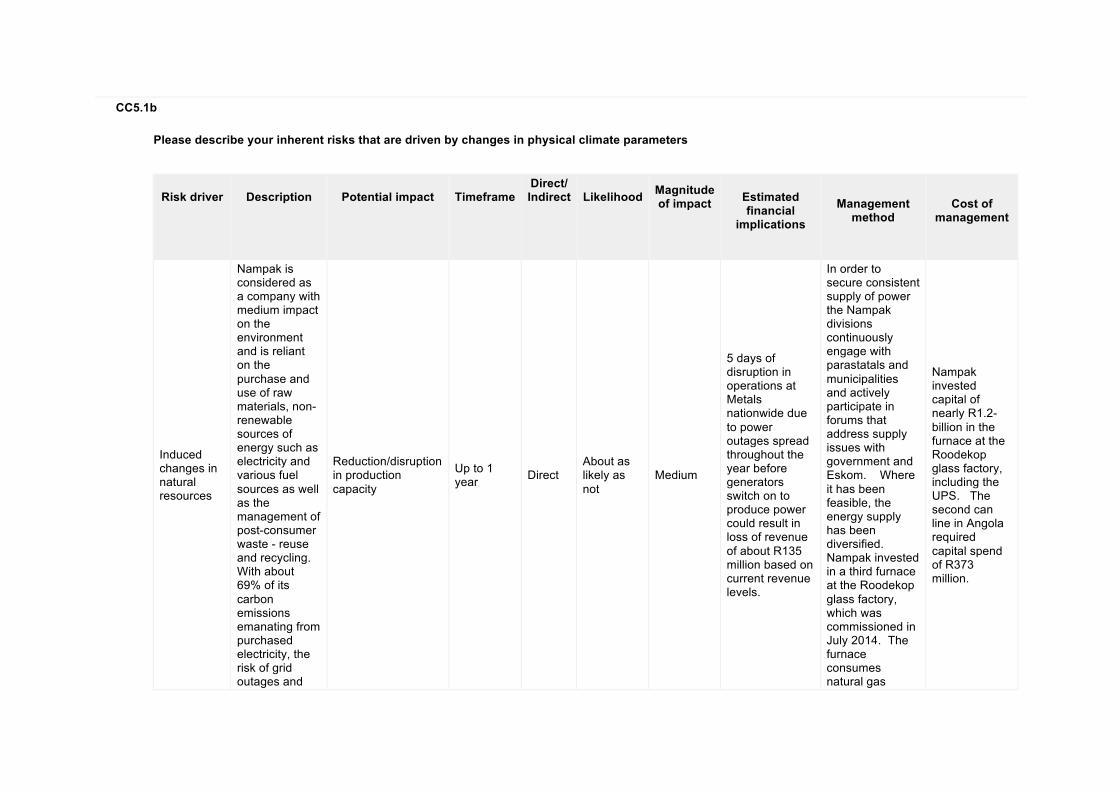
CC5.1b
Please describe your inherent risks that are driven by changes in physical climate parameters
Risk driver
Description
Potential impact
Timeframe
Direct/ Indirect
Likelihood
Magnitude of impact
Estimated financial
implications
Management
method
Cost of
management
Induced changes in natural resources
Nampak is considered as a company with medium impact on the environment and is reliant on the purchase and use of raw materials, non-renewable sources of energy such as electricity and various fuel sources as well as the management of post-consumer waste - reuse and recycling. With about 69% of its carbon emissions emanating from purchased electricity, the risk of grid outages and
Reduction/disruption in production capacity
Up to 1 year Direct
About as likely as not
Medium
5 days of disruption in operations at Metals nationwide due to power outages spread throughout the year before generators switch on to produce power could result in loss of revenue of about R135 million based on current revenue levels.
In order to secure consistent supply of power the Nampak divisions continuously engage with parastatals and municipalities and actively participate in forums that address supply issues with government and Eskom. Where it has been feasible, the energy supply has been diversified. Nampak invested in a third furnace at the Roodekop glass factory, which was commissioned in July 2014. The furnace consumes natural gas
Nampak invested capital of nearly R1.2-billion in the furnace at the Roodekop glass factory, including the UPS. The second can line in Angola required capital spend of R373 million.
Risk driver
Description
Potential impact
Timeframe
Direct/ Indirect
Likelihood
Magnitude of impact
Estimated financial
implications
Management
method
Cost of
management
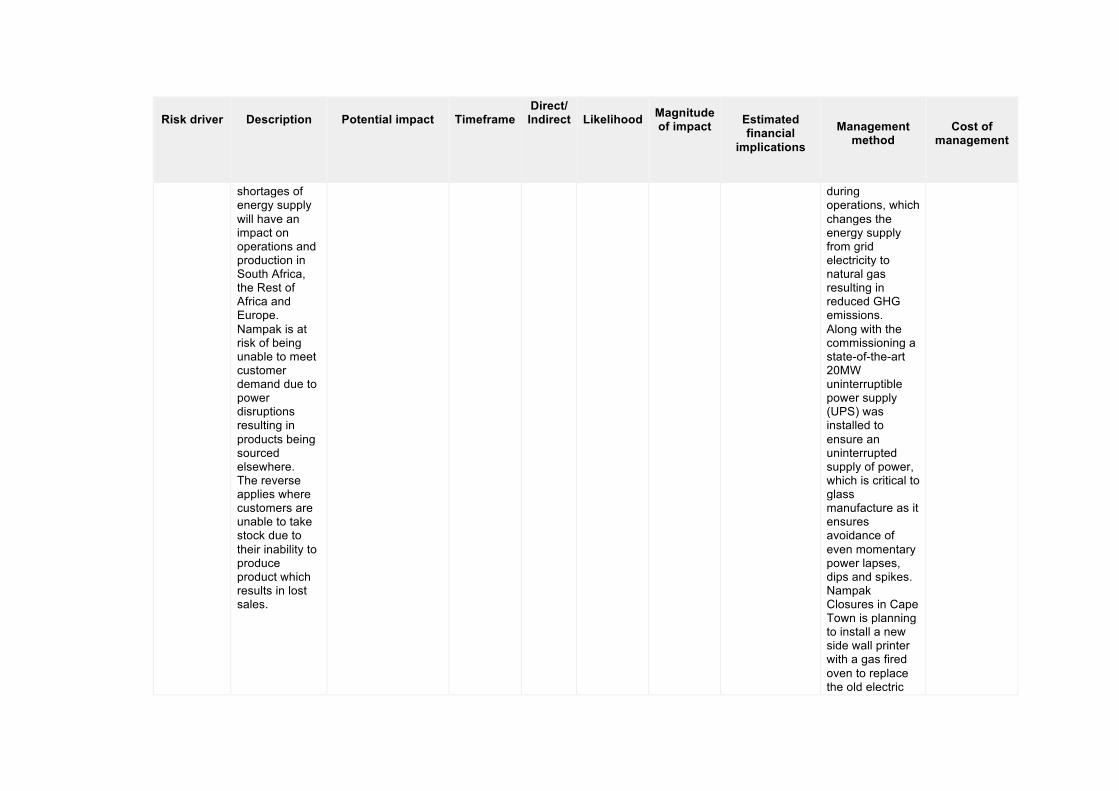
shortages of energy supply will have an impact on operations and production in South Africa, the Rest of Africa and Europe. Nampak is at risk of being unable to meet customer demand due to power disruptions resulting in products being sourced elsewhere. The reverse applies where customers are unable to take stock due to their inability to produce product which results in lost sales.
during operations, which changes the energy supply from grid electricity to natural gas resulting in reduced GHG emissions. Along with the commissioning a state-of-the-art 20MW uninterruptible power supply (UPS) was installed to ensure an uninterrupted supply of power, which is critical to glass manufacture as it ensures avoidance of even momentary power lapses, dips and spikes. Nampak Closures in Cape Town is planning to install a new side wall printer with a gas fired oven to replace the old electric
Risk driver
Description
Potential impact
Timeframe
Direct/ Indirect
Likelihood
Magnitude of impact
Estimated financial
implications
Management
method
Cost of
management
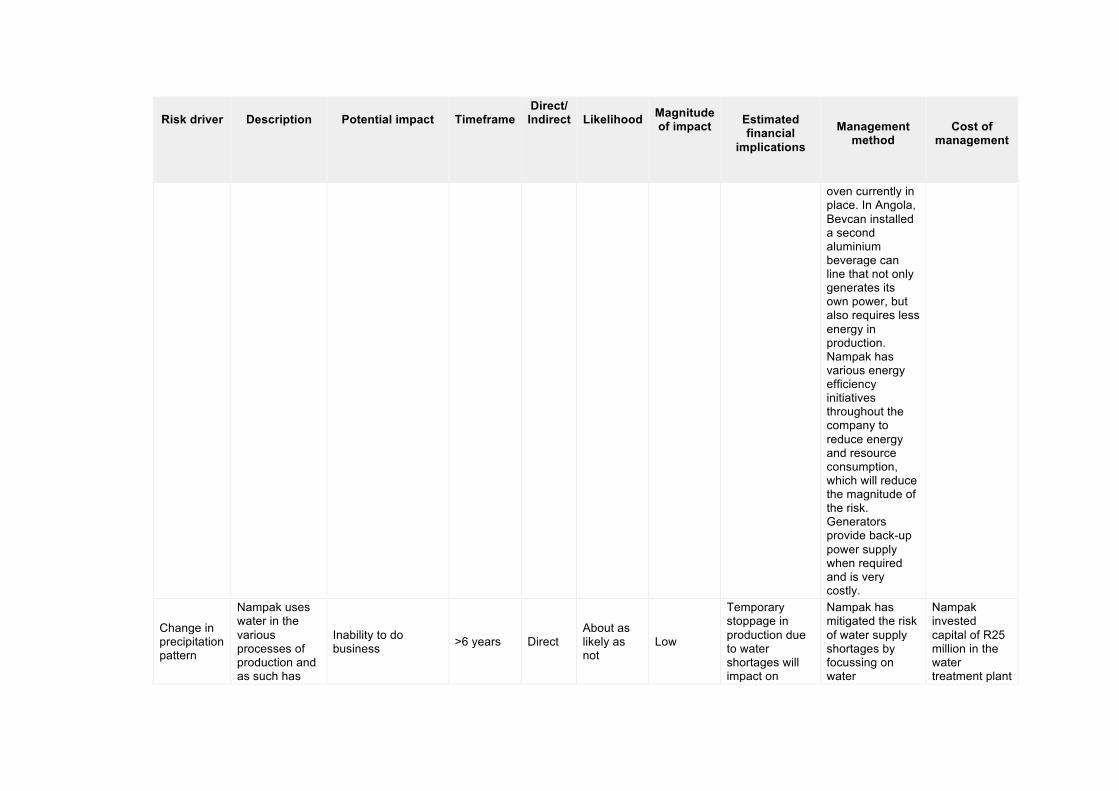
oven currently in place. In Angola, Bevcan installed a second aluminium beverage can line that not only generates its own power, but also requires less energy in production. Nampak has various energy efficiency initiatives throughout the company to reduce energy and resource consumption, which will reduce the magnitude of the risk. Generators provide back-up power supply when required and is very costly.
Change in precipitation pattern
Nampak uses water in the various processes of production and as such has
Inability to do business >6 years Direct
About as likely as not
Low
Temporary stoppage in production due to water shortages will impact on
Nampak has mitigated the risk of water supply shortages by focussing on water
Nampak invested capital of R25 million in the water treatment plant
Risk driver
Description
Potential impact
Timeframe
Direct/ Indirect
Likelihood
Magnitude of impact
Estimated financial
implications
Management
method
Cost of
management
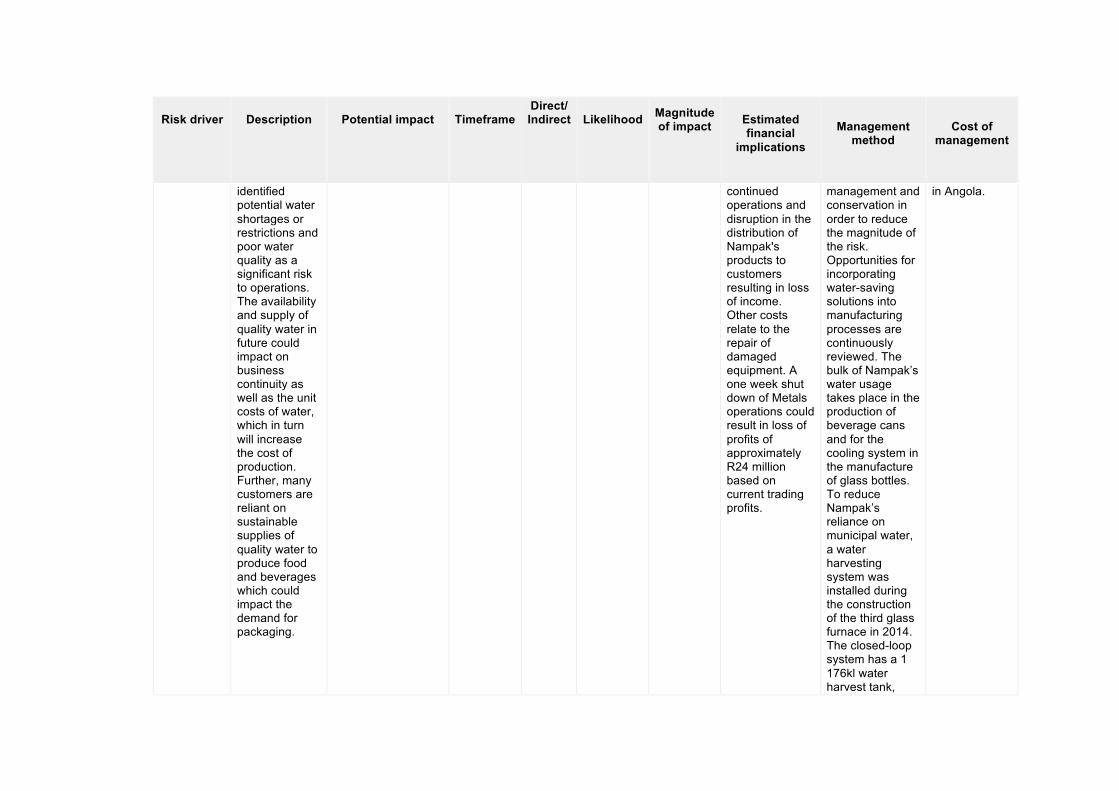
identified potential water shortages or restrictions and poor water quality as a significant risk to operations. The availability and supply of quality water in future could impact on business continuity as well as the unit costs of water, which in turn will increase the cost of production. Further, many customers are reliant on sustainable supplies of quality water to produce food and beverages which could impact the demand for packaging.
continued operations and disruption in the distribution of Nampak's products to customers resulting in loss of income. Other costs relate to the repair of damaged equipment. A one week shut down of Metals operations could result in loss of profits of approximately R24 million based on current trading profits.
management and conservation in order to reduce the magnitude of the risk. Opportunities for incorporating water-saving solutions into manufacturing processes are continuously reviewed. The bulk of Nampak’s water usage takes place in the production of beverage cans and for the cooling system in the manufacture of glass bottles. To reduce Nampak’s reliance on municipal water, a water harvesting system was installed during the construction of the third glass furnace in 2014. The closed-loop system has a 1 176kl water harvest tank,
in Angola.
Risk driver
Description
Potential impact
Timeframe
Direct/ Indirect
Likelihood
Magnitude of impact
Estimated financial
implications
Management
method
Cost of
management
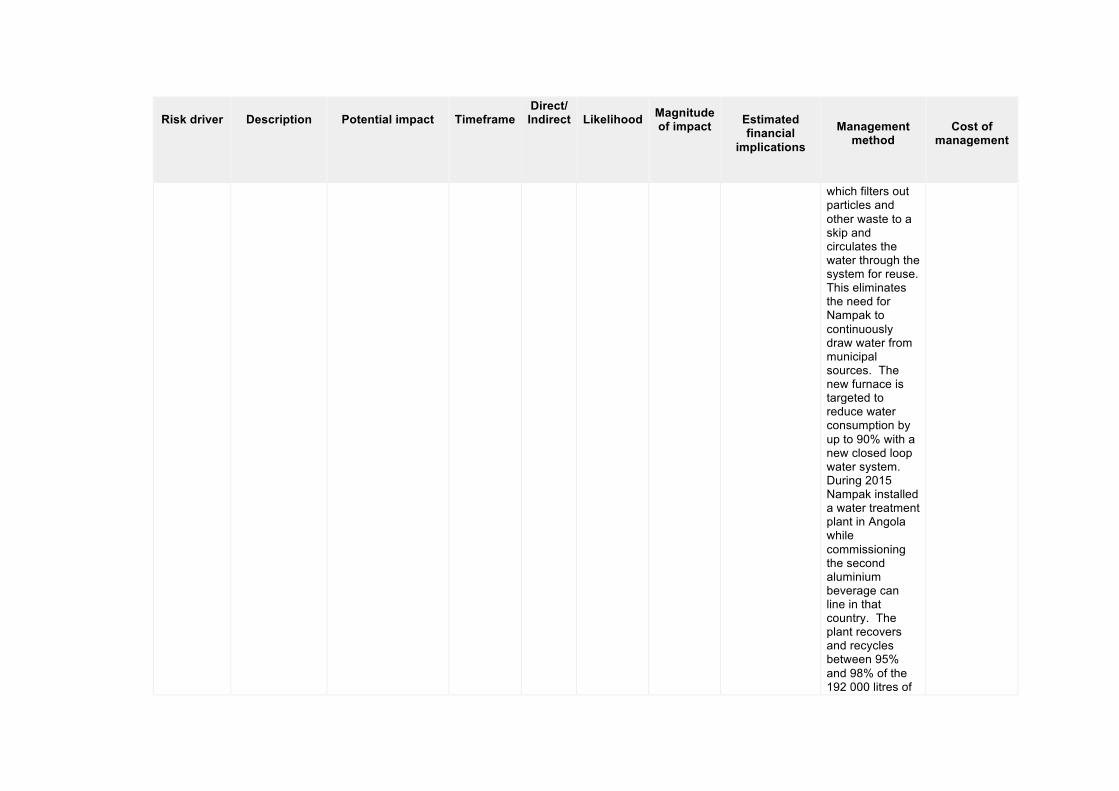
which filters out particles and other waste to a skip and circulates the water through the system for reuse. This eliminates the need for Nampak to continuously draw water from municipal sources. The new furnace is targeted to reduce water consumption by up to 90% with a new closed loop water system. During 2015 Nampak installed a water treatment plant in Angola while commissioning the second aluminium beverage can line in that country. The plant recovers and recycles between 95% and 98% of the 192 000 litres of
Risk driver
Description
Potential impact
Timeframe
Direct/ Indirect
Likelihood
Magnitude of impact
Estimated financial
implications
Management
method
Cost of
management
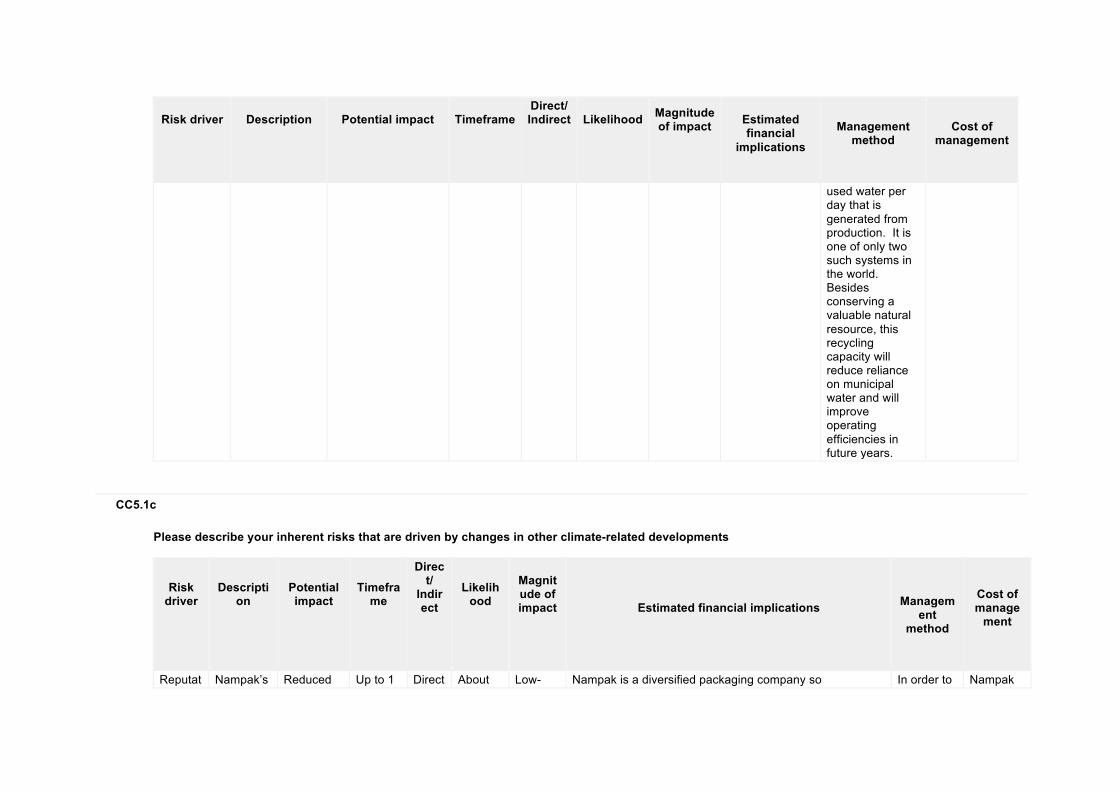
used water per day that is generated from production. It is one of only two such systems in the world. Besides conserving a valuable natural resource, this recycling capacity will reduce reliance on municipal water and will improve operating efficiencies in future years.
CC5.1c
Please describe your inherent risks that are driven by changes in other climate-related developments
Risk driver
Description
Potential impact
Timeframe
Direct/
Indirect
Likelihood
Magnitude of impact
Estimated financial implications
Management
method
Cost of manage
ment
Reputat Nampak’s Reduced Up to 1 Direct About Low- Nampak is a diversified packaging company so In order to Nampak
Risk driver
Description
Potential impact
Timeframe
Direct/
Indirect
Likelihood
Magnitude of impact
Estimated financial implications
Management
method
Cost of manage
ment
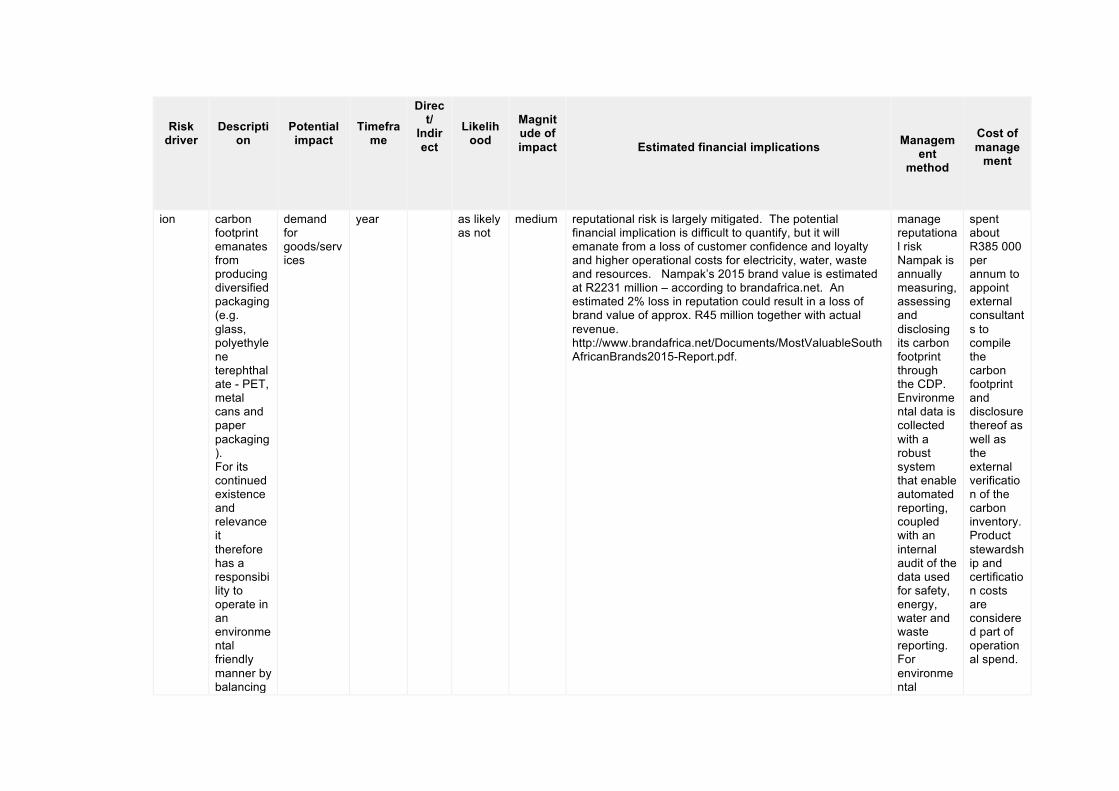
ion carbon footprint emanates from producing diversified packaging (e.g. glass, polyethylene terephthalate - PET, metal cans and paper packaging). For its continued existence and relevance it therefore has a responsibility to operate in an environmental friendly manner by balancing
demand for goods/services
year as likely as not
medium reputational risk is largely mitigated. The potential financial implication is difficult to quantify, but it will emanate from a loss of customer confidence and loyalty and higher operational costs for electricity, water, waste and resources. Nampak’s 2015 brand value is estimated at R2231 million – according to brandafrica.net. An estimated 2% loss in reputation could result in a loss of brand value of approx. R45 million together with actual revenue. http://www.brandafrica.net/Documents/MostValuableSouthAfricanBrands2015-Report.pdf.
manage reputational risk Nampak is annually measuring, assessing and disclosing its carbon footprint through the CDP. Environmental data is collected with a robust system that enable automated reporting, coupled with an internal audit of the data used for safety, energy, water and waste reporting. For environmental
spent about R385 000 per annum to appoint external consultants to compile the carbon footprint and disclosure thereof as well as the external verification of the carbon inventory. Product stewardship and certification costs are considered part of operational spend.
Risk driver
Description
Potential impact
Timeframe
Direct/
Indirect
Likelihood
Magnitude of impact
Estimated financial implications
Management
method
Cost of manage
ment
depleting natural resources, the efficient use of energy, packaging waste generation and recycling. In order to manufacture the sustainable packaging products quality controls will be required to provide assurance of environmental stewardship for Nampak’s customers as well as the end-users in
credibility in operations and products Nampak has obtained product stewardship such as Hazard Analysis Critical Control Point (HACCP), an internationally recognised and scientific approach to the identification and control of hazards in food preparation, processing, manufactur
Risk driver
Description
Potential impact
Timeframe
Direct/
Indirect
Likelihood
Magnitude of impact
Estimated financial implications
Management
method
Cost of manage
ment
South Africa, the rest of Africa and Europe.
ing and use to ensure that the food is safe to consume. The Plastics plants in the United Kingdom that produce packaging for foodstuffs conform to the British Retail Consortium Institute of Packaging standard, which is held and required by all the major retailers and brand owners. South African operations
Risk driver
Description
Potential impact
Timeframe
Direct/
Indirect
Likelihood
Magnitude of impact
Estimated financial implications
Management
method
Cost of manage
ment
are certified in terms of ISO 14001:2004 that measure, monitor and communicate environmental performance. Assurance about the quality, safety and reliability of Nampak’s products is provided through the ISO 9001:2008 Quality Management System certification as well as ISO 22000:2005 and PAS223.
Risk driver
Description
Potential impact
Timeframe
Direct/
Indirect
Likelihood
Magnitude of impact
Estimated financial implications
Management
method
Cost of manage
ment
Nampak Glass was awarded ISO 50001: 2011 certification - the energy management systems standard. These actions are expected to reduce the likelihood and magnitude of reputational risk.
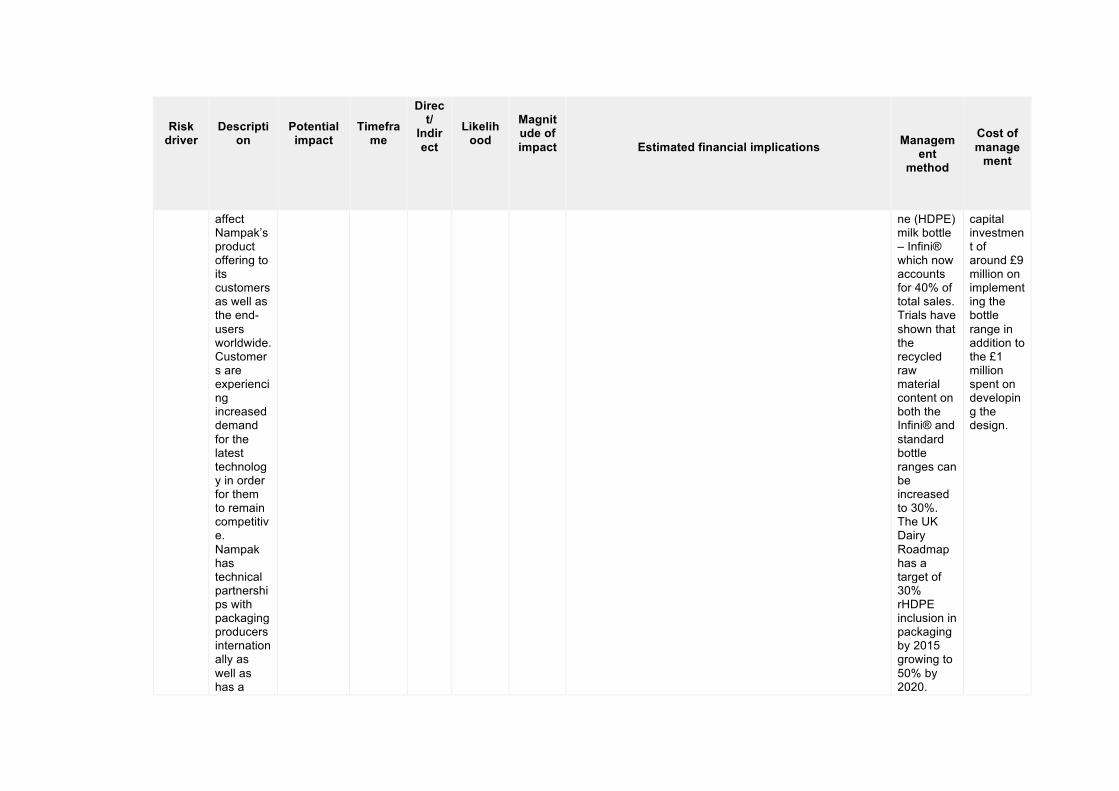
Changing consumer behaviour
Shifts in consumer attitude towards more sustainable, less energy-intensive products could
Reduced demand for goods/services
1 to 3 years Direct
About as likely as not
Low
The potential financial impact will be a decrease in sales of specific packaging types and reduced demand for Nampak’s products. An estimated 0.5% decrease in sales of Plastics UK could result in a decrease of revenue of approx. R10 million per annum based on current revenue levels.
Nampak Plastics UK manufactures its patented light-weighted high-density polyethyle
R&D had a budget of about R40 million to defray staff costs. The Infini project required a
Risk driver
Description
Potential impact
Timeframe
Direct/
Indirect
Likelihood
Magnitude of impact
Estimated financial implications
Management
method
Cost of manage
ment
affect Nampak’s product offering to its customers as well as the end-users worldwide. Customers are experiencing increased demand for the latest technology in order for them to remain competitive. Nampak has technical partnerships with packaging producers internationally as well as has a
ne (HDPE) milk bottle – Infini® which now accounts for 40% of total sales. Trials have shown that the recycled raw material content on both the Infini® and standard bottle ranges can be increased to 30%. The UK Dairy Roadmap has a target of 30% rHDPE inclusion in packaging by 2015 growing to 50% by 2020.
capital investment of around £9 million on implementing the bottle range in addition to the £1 million spent on developing the design.
Risk driver
Description
Potential impact
Timeframe
Direct/
Indirect
Likelihood
Magnitude of impact
Estimated financial implications
Management
method
Cost of manage
ment
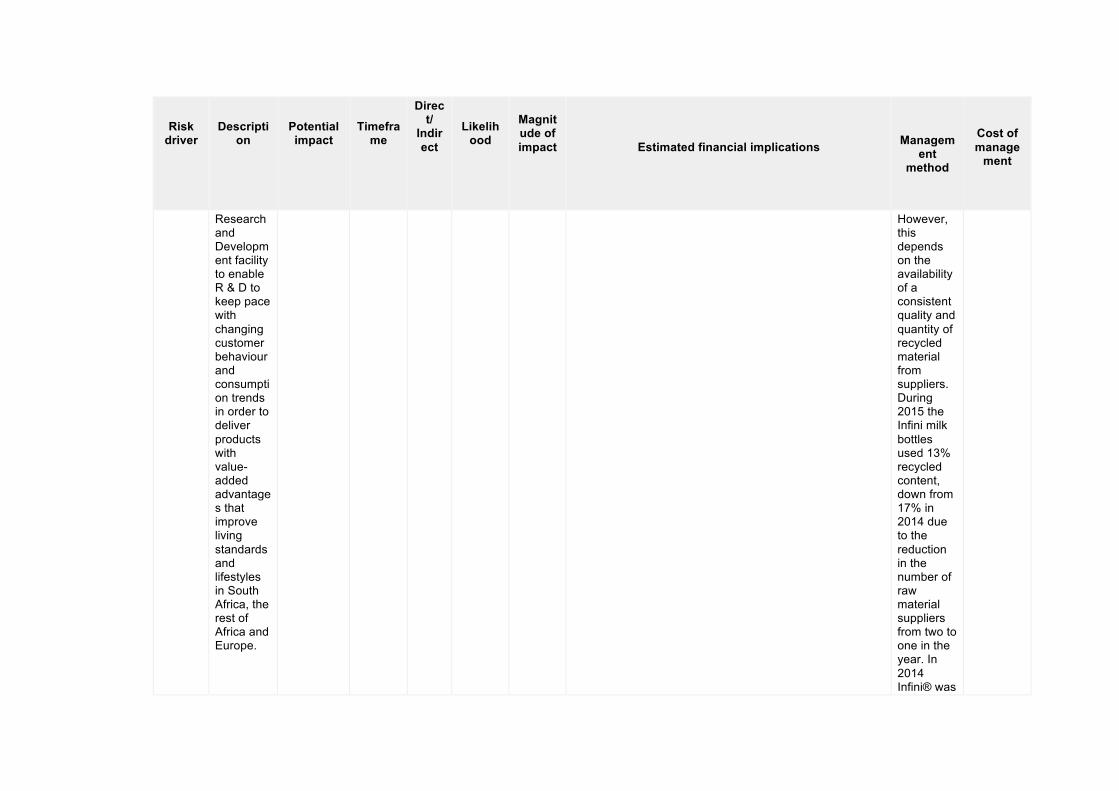
Research and Development facility to enable R & D to keep pace with changing customer behaviour and consumption trends in order to deliver products with value-added advantages that improve living standards and lifestyles in South Africa, the rest of Africa and Europe.
However, this depends on the availability of a consistent quality and quantity of recycled material from suppliers. During 2015 the Infini milk bottles used 13% recycled content, down from 17% in 2014 due to the reduction in the number of raw material suppliers from two to one in the year. In 2014 Infini® was

Risk driver
Description
Potential impact
Timeframe
Direct/
Indirect
Likelihood
Magnitude of impact
Estimated financial implications
Management
method
Cost of manage
ment
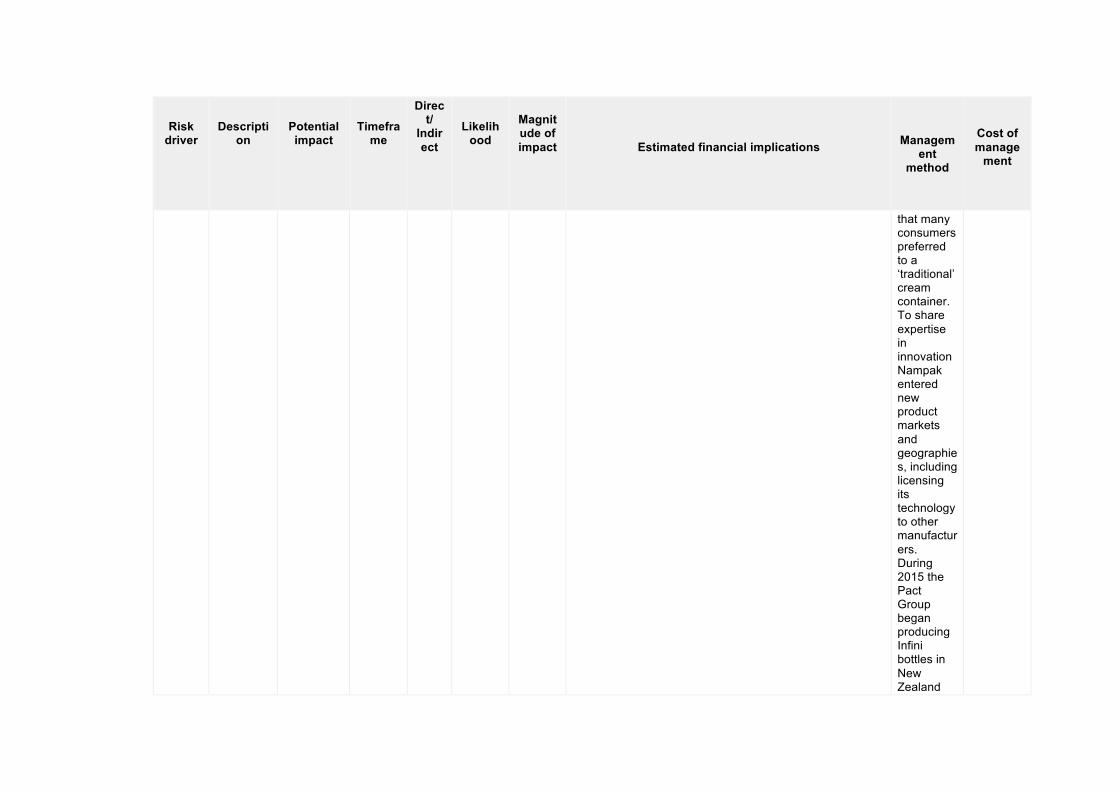
awarded the Farm Business Cream Award for Packaging that recognizes the Infini bottle as the world's lightest 4-pint (2.27 litre) 32g bottle with recycled HDPE of up to 30%. Other dairy packaging products include a Cream Bottle, a light, re-sealable, leak-proof and easy-to-pour rigid plastic bottle – which independent research showed
Risk driver
Description
Potential impact
Timeframe
Direct/
Indirect
Likelihood
Magnitude of impact
Estimated financial implications
Management
method
Cost of manage
ment
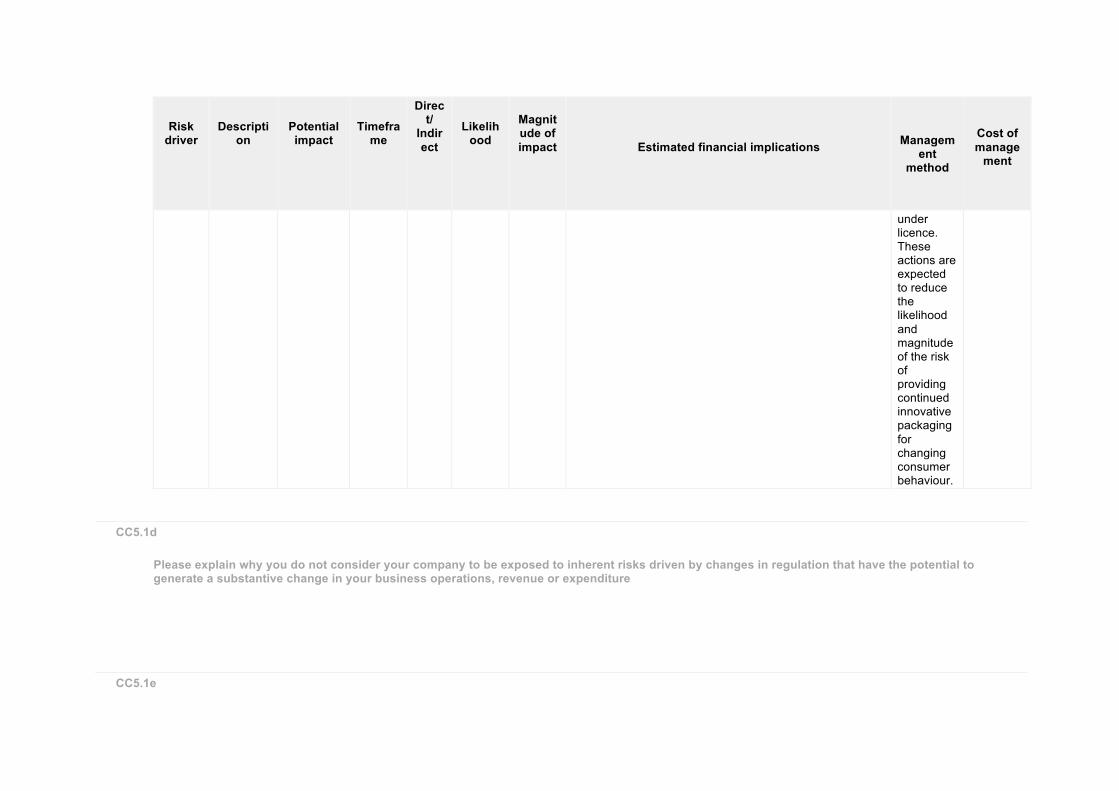
that many consumers preferred to a ‘traditional’ cream container. To share expertise in innovation Nampak entered new product markets and geographies, including licensing its technology to other manufacturers. During 2015 the Pact Group began producing Infini bottles in New Zealand
Risk driver
Description
Potential impact
Timeframe
Direct/
Indirect
Likelihood
Magnitude of impact
Estimated financial implications
Management
method
Cost of manage
ment
under licence. These actions are expected to reduce the likelihood and magnitude of the risk of providing continued innovative packaging for changing consumer behaviour.
CC5.1d
Please explain why you do not consider your company to be exposed to inherent risks driven by changes in regulation that have the potential to generate a substantive change in your business operations, revenue or expenditure
CC5.1e
Please explain why you do not consider your company to be exposed to inherent risks driven by physical climate parameters that have the potential to generate a substantive change in your business operations, revenue or expenditure
CC5.1f
Please explain why you do not consider your company to be exposed to inherent risks driven by changes in other climate-related developments that have the potential to generate a substantive change in your business operations, revenue or expenditure
Further Information
Page: CC6. Climate Change Opportunities
CC6.1
Have you identified any inherent climate change opportunities that have the potential to generate a substantive change in your business operations, revenue or expenditure? Tick all that apply Opportunities driven by changes in regulation Opportunities driven by changes in physical climate parameters Opportunities driven by changes in other climate-related developments
CC6.1a
Please describe your inherent opportunities that are driven by changes in regulation
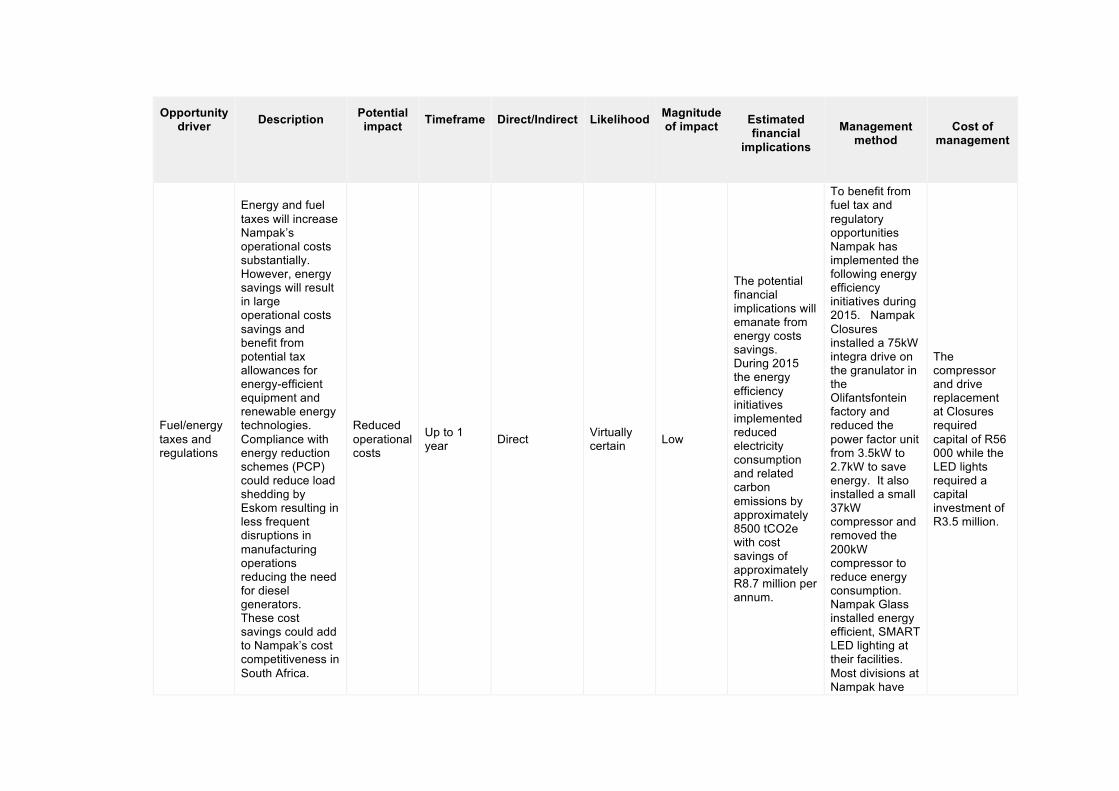
Opportunity driver
Description
Potential impact
Timeframe
Direct/Indirect
Likelihood
Magnitude of impact
Estimated financial
implications
Management
method
Cost of
management
Fuel/energy taxes and regulations
Energy and fuel taxes will increase Nampak’s operational costs substantially. However, energy savings will result in large operational costs savings and benefit from potential tax allowances for energy-efficient equipment and renewable energy technologies. Compliance with energy reduction schemes (PCP) could reduce load shedding by Eskom resulting in less frequent disruptions in manufacturing operations reducing the need for diesel generators. These cost savings could add to Nampak’s cost competitiveness in South Africa.
Reduced operational costs
Up to 1 year Direct Virtually
certain Low
The potential financial implications will emanate from energy costs savings. During 2015 the energy efficiency initiatives implemented reduced electricity consumption and related carbon emissions by approximately 8500 tCO2e with cost savings of approximately R8.7 million per annum.
To benefit from fuel tax and regulatory opportunities Nampak has implemented the following energy efficiency initiatives during 2015. Nampak Closures installed a 75kW integra drive on the granulator in the Olifantsfontein factory and reduced the power factor unit from 3.5kW to 2.7kW to save energy. It also installed a small 37kW compressor and removed the 200kW compressor to reduce energy consumption. Nampak Glass installed energy efficient, SMART LED lighting at their facilities. Most divisions at Nampak have
The compressor and drive replacement at Closures required capital of R56 000 while the LED lights required a capital investment of R3.5 million.
Opportunity driver
Description
Potential impact
Timeframe
Direct/Indirect
Likelihood
Magnitude of impact
Estimated financial
implications
Management
method
Cost of
management
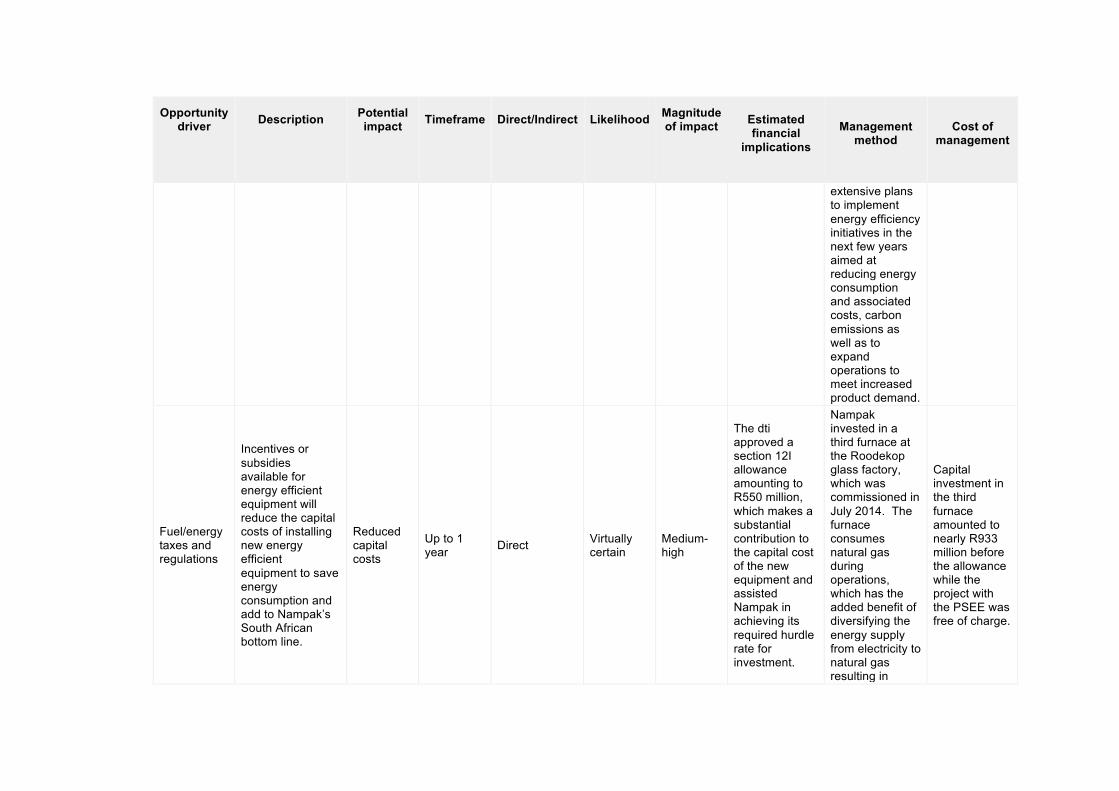
extensive plans to implement energy efficiency initiatives in the next few years aimed at reducing energy consumption and associated costs, carbon emissions as well as to expand operations to meet increased product demand.
Fuel/energy taxes and regulations
Incentives or subsidies available for energy efficient equipment will reduce the capital costs of installing new energy efficient equipment to save energy consumption and add to Nampak’s South African bottom line.
Reduced capital costs
Up to 1 year Direct Virtually
certain Medium-high
The dti approved a section 12I allowance amounting to R550 million, which makes a substantial contribution to the capital cost of the new equipment and assisted Nampak in achieving its required hurdle rate for investment.
Nampak invested in a third furnace at the Roodekop glass factory, which was commissioned in July 2014. The furnace consumes natural gas during operations, which has the added benefit of diversifying the energy supply from electricity to natural gas resulting in
Capital investment in the third furnace amounted to nearly R933 million before the allowance while the project with the PSEE was free of charge.
Opportunity driver
Description
Potential impact
Timeframe
Direct/Indirect
Likelihood
Magnitude of impact
Estimated financial
implications
Management
method
Cost of
management
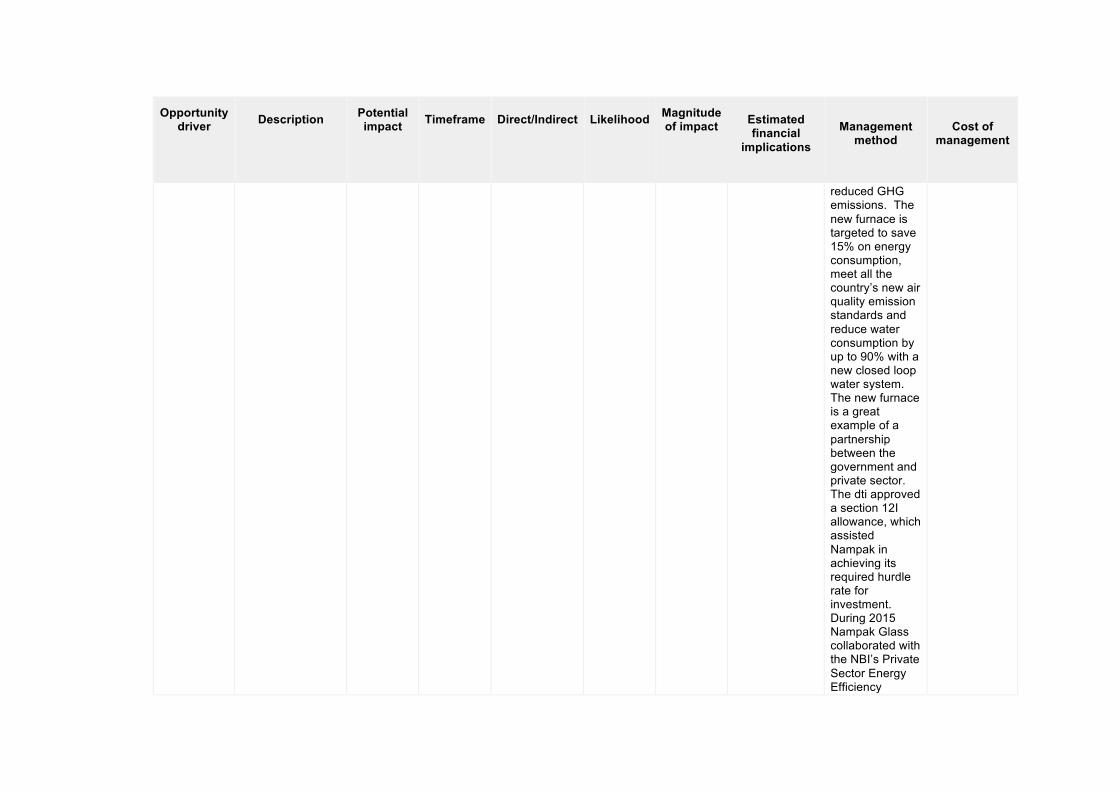
reduced GHG emissions. The new furnace is targeted to save 15% on energy consumption, meet all the country’s new air quality emission standards and reduce water consumption by up to 90% with a new closed loop water system. The new furnace is a great example of a partnership between the government and private sector. The dti approved a section 12I allowance, which assisted Nampak in achieving its required hurdle rate for investment. During 2015 Nampak Glass collaborated with the NBI’s Private Sector Energy Efficiency
Opportunity driver
Description
Potential impact
Timeframe
Direct/Indirect
Likelihood
Magnitude of impact
Estimated financial
implications
Management
method
Cost of
management
Project (PSEE) to identify energy waste. The project identified and devised a strategic energy management plan for the next 5 years.
CC6.1b
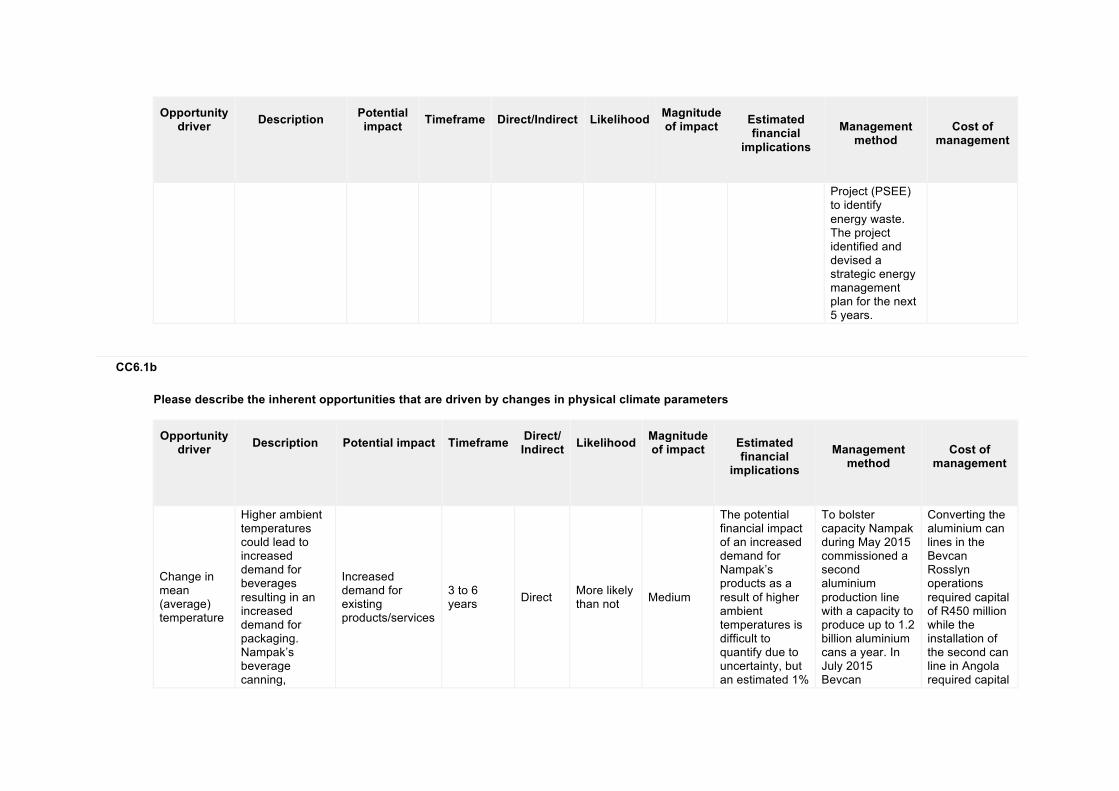
Please describe the inherent opportunities that are driven by changes in physical climate parameters
Opportunity driver
Description
Potential impact
Timeframe
Direct/ Indirect
Likelihood
Magnitude of impact
Estimated financial
implications
Management
method
Cost of
management
Change in mean (average) temperature
Higher ambient temperatures could lead to increased demand for beverages resulting in an increased demand for packaging. Nampak’s beverage canning,
Increased demand for existing products/services
3 to 6 years Direct More likely
than not Medium
The potential financial impact of an increased demand for Nampak’s products as a result of higher ambient temperatures is difficult to quantify due to uncertainty, but an estimated 1%
To bolster capacity Nampak during May 2015 commissioned a second aluminium production line with a capacity to produce up to 1.2 billion aluminium cans a year. In July 2015 Bevcan
Converting the aluminium can lines in the Bevcan Rosslyn operations required capital of R450 million while the installation of the second can line in Angola required capital
Opportunity driver
Description
Potential impact
Timeframe
Direct/ Indirect
Likelihood
Magnitude of impact
Estimated financial
implications
Management
method
Cost of
management
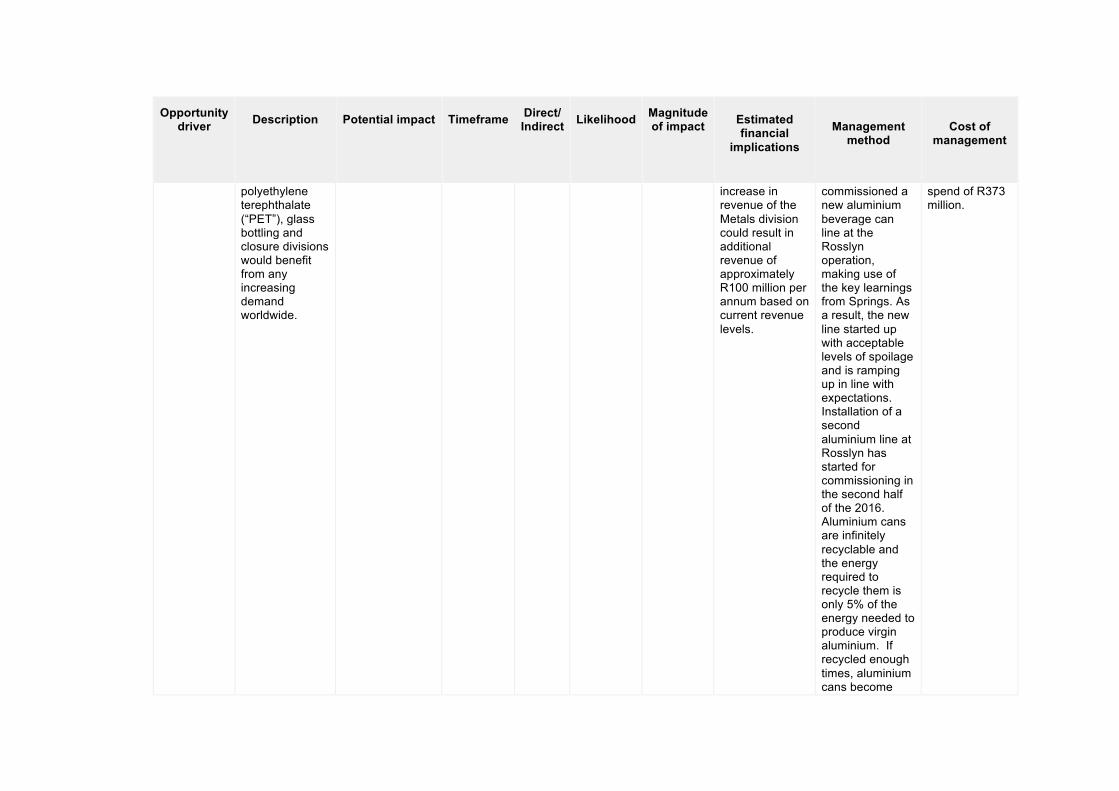
polyethylene terephthalate (“PET”), glass bottling and closure divisions would benefit from any increasing demand worldwide.
increase in revenue of the Metals division could result in additional revenue of approximately R100 million per annum based on current revenue levels.
commissioned a new aluminium beverage can line at the Rosslyn operation, making use of the key learnings from Springs. As a result, the new line started up with acceptable levels of spoilage and is ramping up in line with expectations. Installation of a second aluminium line at Rosslyn has started for commissioning in the second half of the 2016. Aluminium cans are infinitely recyclable and the energy required to recycle them is only 5% of the energy needed to produce virgin aluminium. If recycled enough times, aluminium cans become
spend of R373 million.
Opportunity driver
Description
Potential impact
Timeframe
Direct/ Indirect
Likelihood
Magnitude of impact
Estimated financial
implications
Management
method
Cost of
management
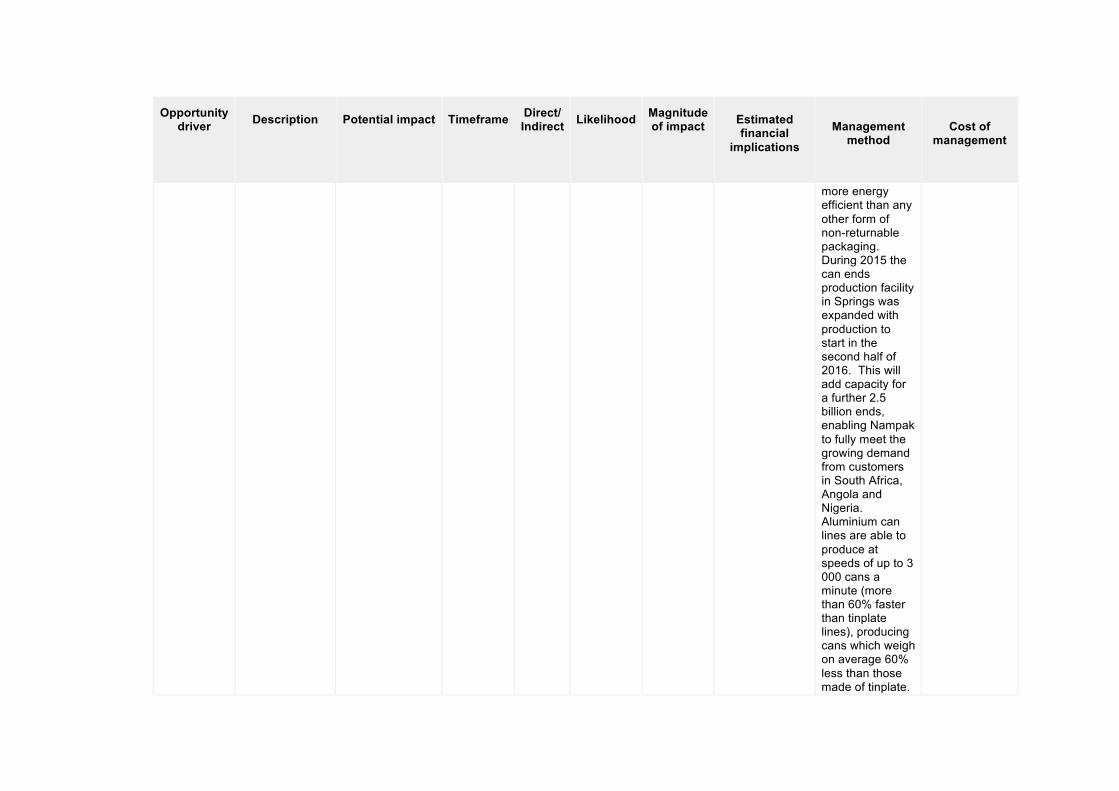
more energy efficient than any other form of non-returnable packaging. During 2015 the can ends production facility in Springs was expanded with production to start in the second half of 2016. This will add capacity for a further 2.5 billion ends, enabling Nampak to fully meet the growing demand from customers in South Africa, Angola and Nigeria. Aluminium can lines are able to produce at speeds of up to 3 000 cans a minute (more than 60% faster than tinplate lines), producing cans which weigh on average 60% less than those made of tinplate.
Opportunity driver
Description
Potential impact
Timeframe
Direct/ Indirect
Likelihood
Magnitude of impact
Estimated financial
implications
Management
method
Cost of
management
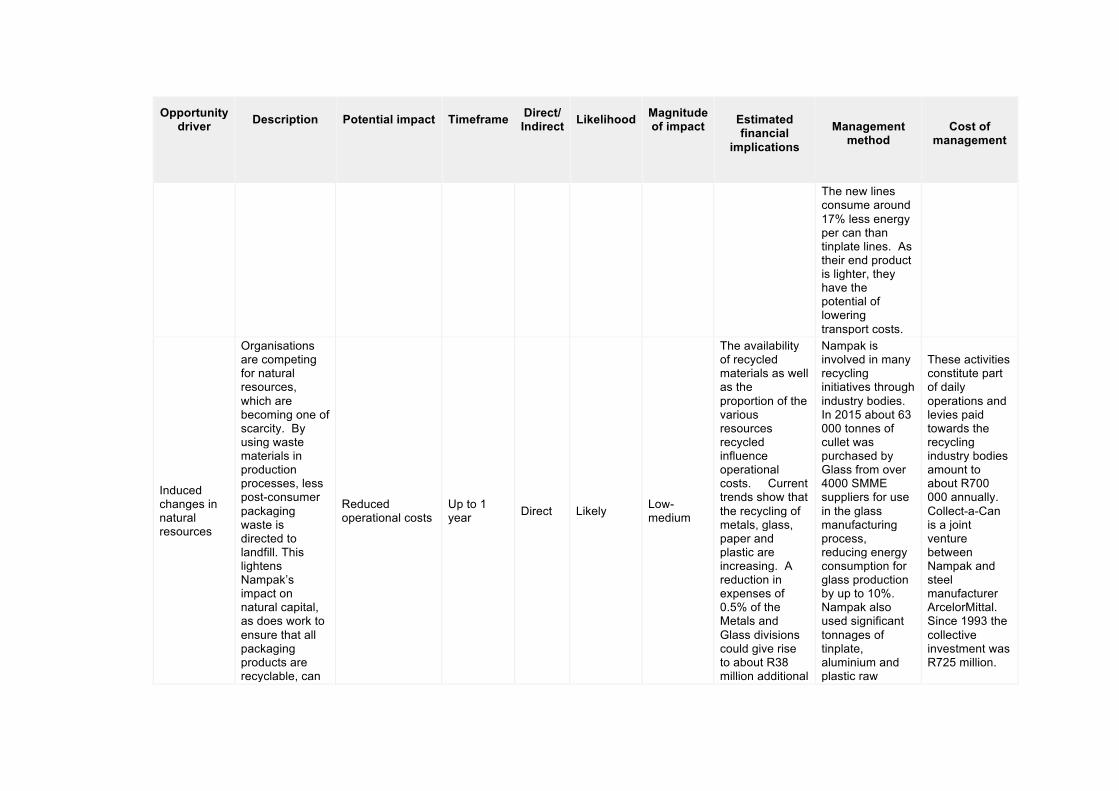
The new lines consume around 17% less energy per can than tinplate lines. As their end product is lighter, they have the potential of lowering transport costs.
Induced changes in natural resources
Organisations are competing for natural resources, which are becoming one of scarcity. By using waste materials in production processes, less post-consumer packaging waste is directed to landfill. This lightens Nampak’s impact on natural capital, as does work to ensure that all packaging products are recyclable, can
Reduced operational costs
Up to 1 year Direct Likely Low-
medium
The availability of recycled materials as well as the proportion of the various resources recycled influence operational costs. Current trends show that the recycling of metals, glass, paper and plastic are increasing. A reduction in expenses of 0.5% of the Metals and Glass divisions could give rise to about R38 million additional
Nampak is involved in many recycling initiatives through industry bodies. In 2015 about 63 000 tonnes of cullet was purchased by Glass from over 4000 SMME suppliers for use in the glass manufacturing process, reducing energy consumption for glass production by up to 10%. Nampak also used significant tonnages of tinplate, aluminium and plastic raw
These activities constitute part of daily operations and levies paid towards the recycling industry bodies amount to about R700 000 annually. Collect-a-Can is a joint venture between Nampak and steel manufacturer ArcelorMittal. Since 1993 the collective investment was R725 million.
Opportunity driver
Description
Potential impact
Timeframe
Direct/ Indirect
Likelihood
Magnitude of impact
Estimated financial
implications
Management
method
Cost of
management
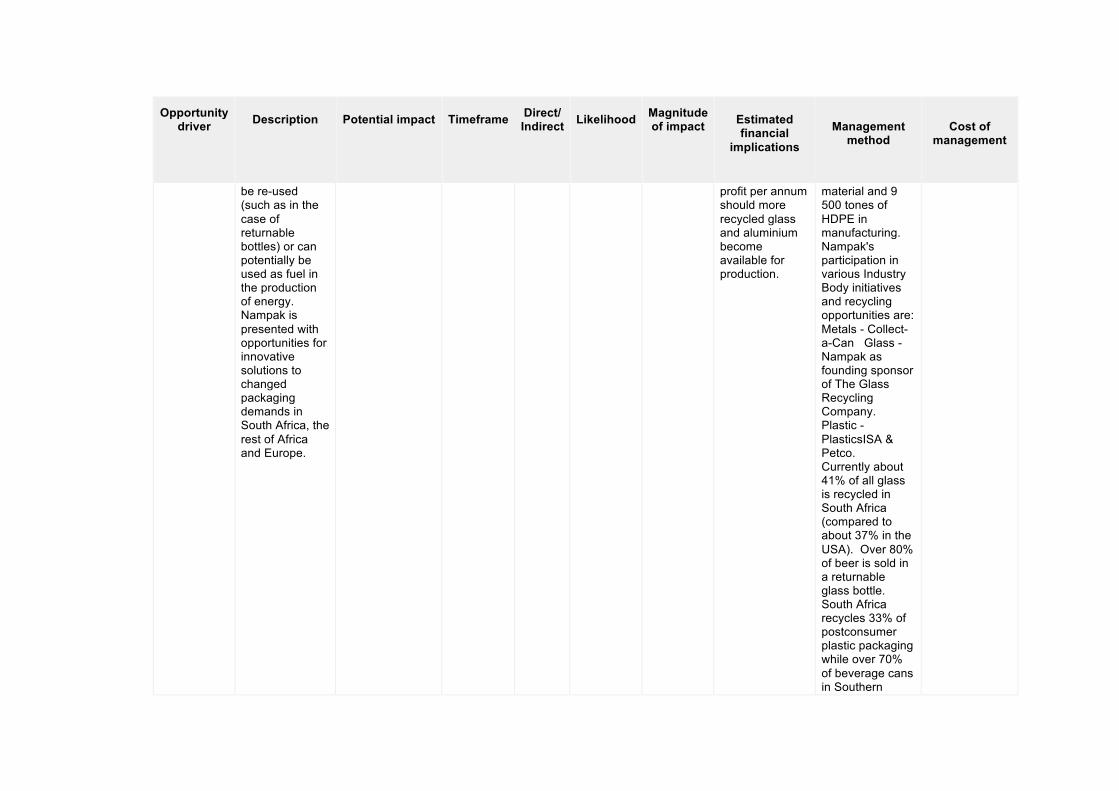
be re-used (such as in the case of returnable bottles) or can potentially be used as fuel in the production of energy. Nampak is presented with opportunities for innovative solutions to changed packaging demands in South Africa, the rest of Africa and Europe.
profit per annum should more recycled glass and aluminium become available for production.
material and 9 500 tones of HDPE in manufacturing. Nampak's participation in various Industry Body initiatives and recycling opportunities are: Metals - Collect-a-Can Glass - Nampak as founding sponsor of The Glass Recycling Company. Plastic - PlasticsISA & Petco. Currently about 41% of all glass is recycled in South Africa (compared to about 37% in the USA). Over 80% of beer is sold in a returnable glass bottle. South Africa recycles 33% of postconsumer plastic packaging while over 70% of beverage cans in Southern
Opportunity driver
Description
Potential impact
Timeframe
Direct/ Indirect
Likelihood
Magnitude of impact
Estimated financial
implications
Management
method
Cost of
management
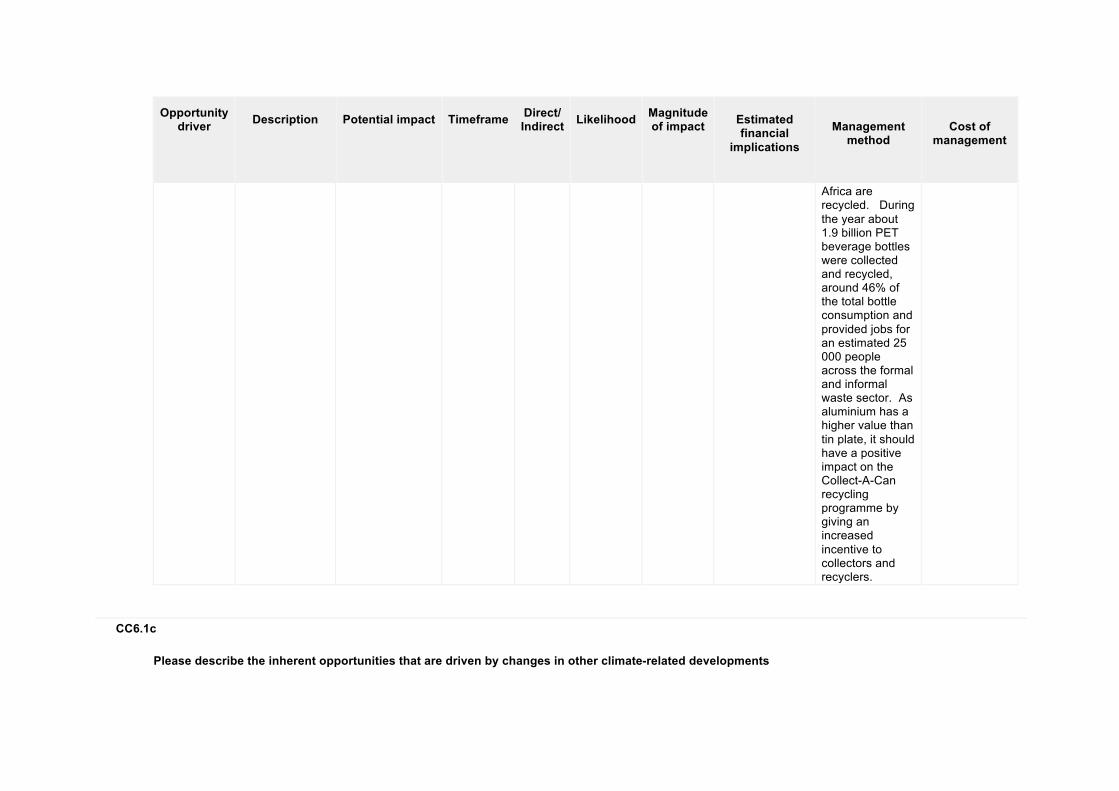
Africa are recycled. During the year about 1.9 billion PET beverage bottles were collected and recycled, around 46% of the total bottle consumption and provided jobs for an estimated 25 000 people across the formal and informal waste sector. As aluminium has a higher value than tin plate, it should have a positive impact on the Collect-A-Can recycling programme by giving an increased incentive to collectors and recyclers.
CC6.1c
Please describe the inherent opportunities that are driven by changes in other climate-related developments
Opportunity
driver
Description
Potential impact
Timeframe
Direct/
Indirect
Likelihood
Magnitude of impact
Estimated financial implications
Management
method
Cost of manage
ment
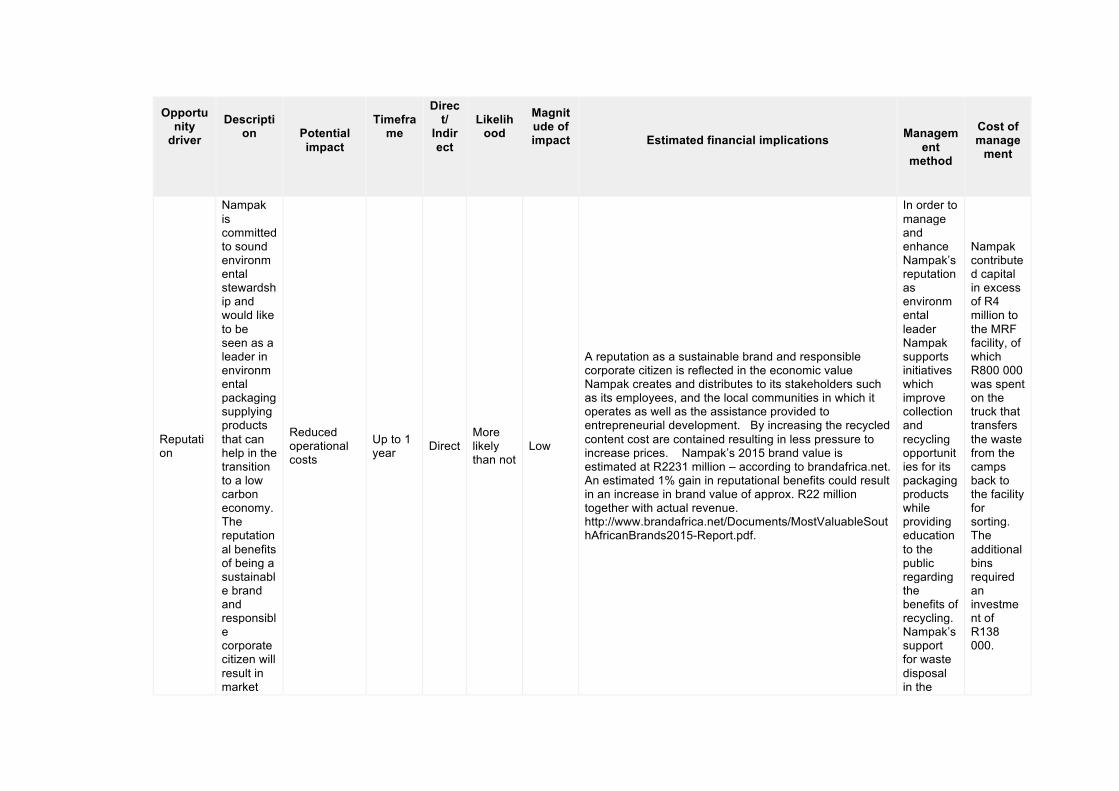
Reputation
Nampak is committed to sound environmental stewardship and would like to be seen as a leader in environmental packaging supplying products that can help in the transition to a low carbon economy. The reputational benefits of being a sustainable brand and responsible corporate citizen will result in market
Reduced operational costs
Up to 1 year Direct
More likely than not
Low
A reputation as a sustainable brand and responsible corporate citizen is reflected in the economic value Nampak creates and distributes to its stakeholders such as its employees, and the local communities in which it operates as well as the assistance provided to entrepreneurial development. By increasing the recycled content cost are contained resulting in less pressure to increase prices. Nampak’s 2015 brand value is estimated at R2231 million – according to brandafrica.net. An estimated 1% gain in reputational benefits could result in an increase in brand value of approx. R22 million together with actual revenue. http://www.brandafrica.net/Documents/MostValuableSouthAfricanBrands2015-Report.pdf.
In order to manage and enhance Nampak’s reputation as environmental leader Nampak supports initiatives which improve collection and recycling opportunities for its packaging products while providing education to the public regarding the benefits of recycling. Nampak’s support for waste disposal in the
Nampak contributed capital in excess of R4 million to the MRF facility, of which R800 000 was spent on the truck that transfers the waste from the camps back to the facility for sorting. The additional bins required an investment of R138 000.
Opportunity
driver
Description
Potential impact
Timeframe
Direct/
Indirect
Likelihood
Magnitude of impact
Estimated financial implications
Management
method
Cost of manage
ment
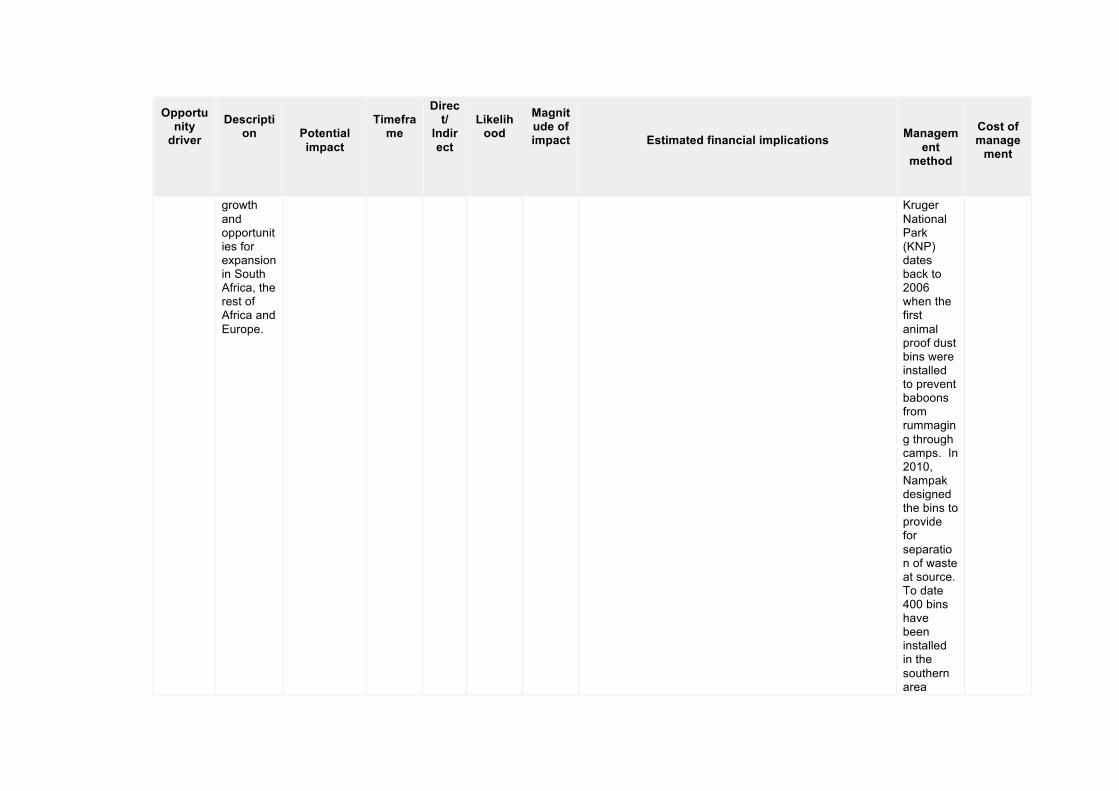
growth and opportunities for expansion in South Africa, the rest of Africa and Europe.
Kruger National Park (KNP) dates back to 2006 when the first animal proof dust bins were installed to prevent baboons from rummaging through camps. In 2010, Nampak designed the bins to provide for separation of waste at source. To date 400 bins have been installed in the southern area
Opportunity
driver
Description
Potential impact
Timeframe
Direct/
Indirect
Likelihood
Magnitude of impact
Estimated financial implications
Management
method
Cost of manage
ment
camps. A Waste Materials Recovery System Facility (known as the MRF) was installed at Skukuza Camp to allow post-consumer packaging waste that is collected from the camps to be sorted on-site, into various material types for recycling. The MRF is a closed loop system that allows
Opportunity
driver
Description
Potential impact
Timeframe
Direct/
Indirect
Likelihood
Magnitude of impact
Estimated financial implications
Management
method
Cost of manage
ment
processors to separate different waste materials on a conveyer belt. Baboon proof storage cages have been installed at the facility and a truck was provided to transfer the post-consumer packaging waste from the camps back to the facility for sorting. Nampak trained KNP staff on the
Opportunity
driver
Description
Potential impact
Timeframe
Direct/
Indirect
Likelihood
Magnitude of impact
Estimated financial implications
Management
method
Cost of manage
ment
operation of the system to ensure maximum beneficiation. The volume of recyclable materials from the MRF is increasing and in 2015 Nampak provided additional bins to assist park visitors with the separation of recyclable materials to be used downstream in the manufacturing process, reducing the
Opportunity
driver
Description
Potential impact
Timeframe
Direct/
Indirect
Likelihood
Magnitude of impact
Estimated financial implications
Management
method
Cost of manage
ment
amount of waste sent to landfills.
Changing consumer behaviour
Shifts in consumer attitude towards more sustainable, less energy-intensive products could affect Nampak’s product offering to its customers as well as the end-users. Dependable packaging products enable easier transportation and handling of products;
New products/business services
Up to 1 year Direct Very
likely Medium
The potential financial impact will be an increase in sales and demand for Nampak’s products. An estimated 0.5% increase in sales could result in an increase of revenue of approx. R86 million per annum based on current revenue levels.
Nampak continuously strive to introduce sustainable products with improved performance and recyclability to support customers’ sales while lighter packaging have the potential to lower transport costs and carbon emissions. Nampak has a Research and
R&D costs relate to staff costs and the department had a budget of about R40 million for the year.
Opportunity
driver
Description
Potential impact
Timeframe
Direct/
Indirect
Likelihood
Magnitude of impact
Estimated financial implications
Management
method
Cost of manage
ment
protect products and prevent deterioration; enhance shelf-life and reduce the amount of food spoilage. It also informs consumers of product ingredients, including health and safety information. Nampak understands that its packaging products have the potential to reduce carbon emissions
Development facility with relationships with international technical service providers to provide cutting-edge packaging, innovation and product testing as a support service. During 2015 it focused on reducing the use of raw materials by decreasing the weight of packaging products. The
Opportunity
driver
Description
Potential impact
Timeframe
Direct/
Indirect
Likelihood
Magnitude of impact
Estimated financial implications
Management
method
Cost of manage
ment
, providing a unique opportunity to support the transition to a low carbon economy. Nampak will therefore continue to explore innovative solutions to accommodate changed packaging demands in South Africa, the rest of Africa and Europe.
weight of a 1.5 litre PET water bottle and generic HDPE bottle were reduced by 8% and 10% respectively. The raw material used for a 250ml PET juice bottle was reduced by approximately 5%. R&D updated its finite element analysis (FEA) capabilities by investing in new integrated FEA/CAD
Opportunity
driver
Description
Potential impact
Timeframe
Direct/
Indirect
Likelihood
Magnitude of impact
Estimated financial implications
Management
method
Cost of manage
ment
software system used in lightweighting, down-gauging and modelling work. R&D changed certain metal closures to double-reduced (DR) tinplate from single-reduced tinplate, resulting in a reduction in weight. DivFood reduced the weight of some fish cans thanks to the adoption of DR
Opportunity
driver
Description
Potential impact
Timeframe
Direct/
Indirect
Likelihood
Magnitude of impact
Estimated financial implications
Management
method
Cost of manage
ment
tinplate as a raw material. With the changeover of Bevcan’s lines from tinplate to aluminium, R&D has been extensively involved in testing all the product formulations for compatibility with aluminium, as well as the shelf life of various products in aluminium packaging. Nampak Glass used the R&D facilities for the
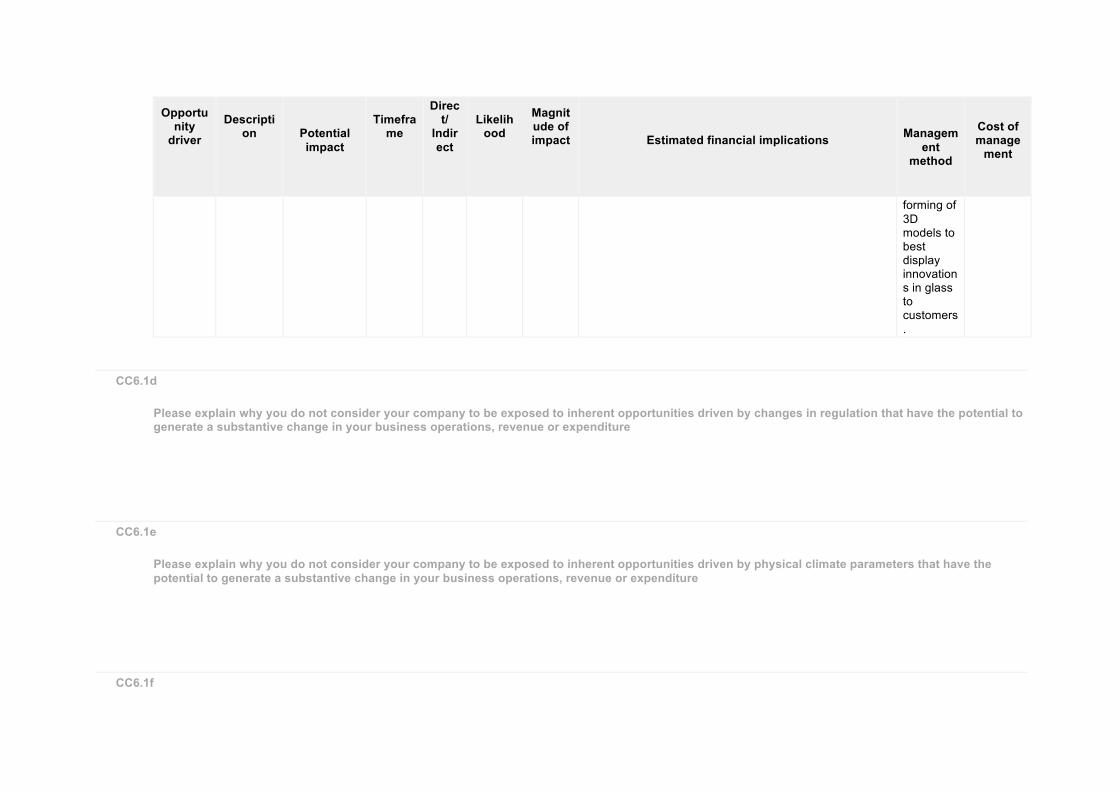
Opportunity
driver
Description
Potential impact
Timeframe
Direct/
Indirect
Likelihood
Magnitude of impact
Estimated financial implications
Management
method
Cost of manage
ment
forming of 3D models to best display innovations in glass to customers.
CC6.1d
Please explain why you do not consider your company to be exposed to inherent opportunities driven by changes in regulation that have the potential to generate a substantive change in your business operations, revenue or expenditure
CC6.1e
Please explain why you do not consider your company to be exposed to inherent opportunities driven by physical climate parameters that have the potential to generate a substantive change in your business operations, revenue or expenditure
CC6.1f
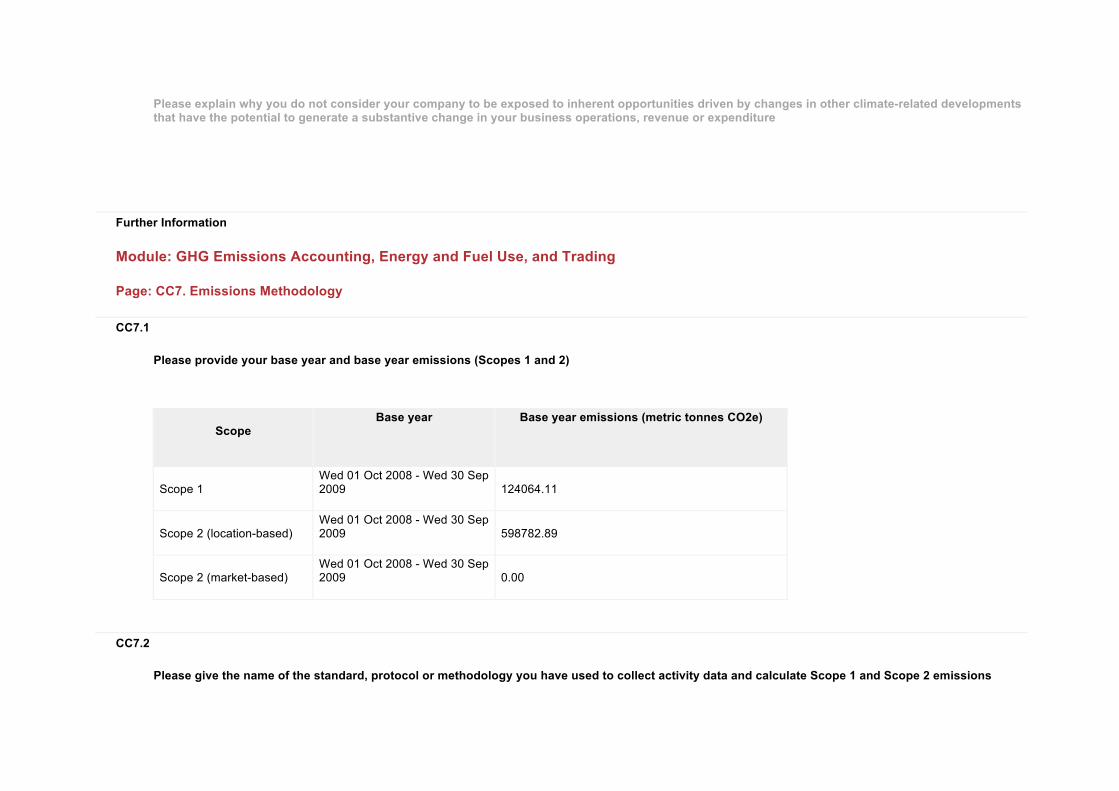
Please explain why you do not consider your company to be exposed to inherent opportunities driven by changes in other climate-related developments that have the potential to generate a substantive change in your business operations, revenue or expenditure
Further Information
Module: GHG Emissions Accounting, Energy and Fuel Use, and Trading
Page: CC7. Emissions Methodology
CC7.1
Please provide your base year and base year emissions (Scopes 1 and 2)
Scope
Base year
Base year emissions (metric tonnes CO2e)
Scope 1 Wed 01 Oct 2008 - Wed 30 Sep 2009
124064.11
Scope 2 (location-based) Wed 01 Oct 2008 - Wed 30 Sep 2009
598782.89
Scope 2 (market-based) Wed 01 Oct 2008 - Wed 30 Sep 2009
0.00
CC7.2
Please give the name of the standard, protocol or methodology you have used to collect activity data and calculate Scope 1 and Scope 2 emissions
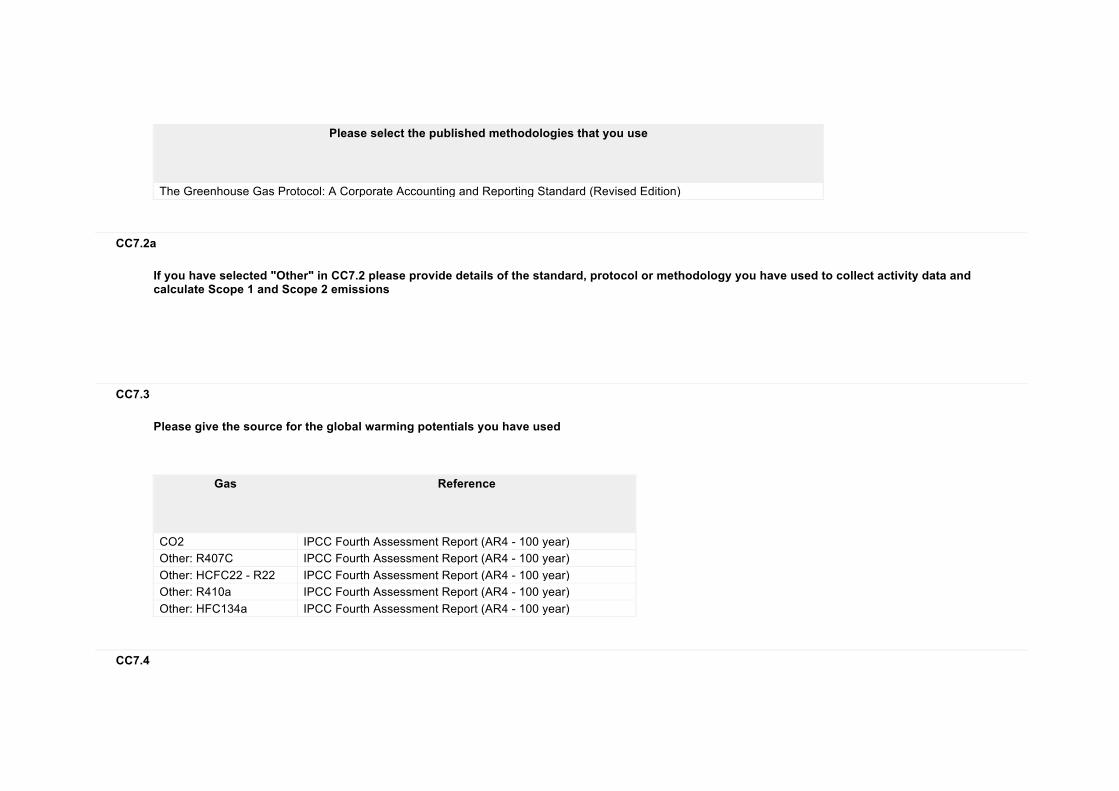
Please select the published methodologies that you use
The Greenhouse Gas Protocol: A Corporate Accounting and Reporting Standard (Revised Edition)
CC7.2a
If you have selected "Other" in CC7.2 please provide details of the standard, protocol or methodology you have used to collect activity data and calculate Scope 1 and Scope 2 emissions
CC7.3
Please give the source for the global warming potentials you have used
Gas
Reference
CO2 IPCC Fourth Assessment Report (AR4 - 100 year) Other: R407C IPCC Fourth Assessment Report (AR4 - 100 year) Other: HCFC22 - R22 IPCC Fourth Assessment Report (AR4 - 100 year) Other: R410a IPCC Fourth Assessment Report (AR4 - 100 year) Other: HFC134a IPCC Fourth Assessment Report (AR4 - 100 year)
CC7.4
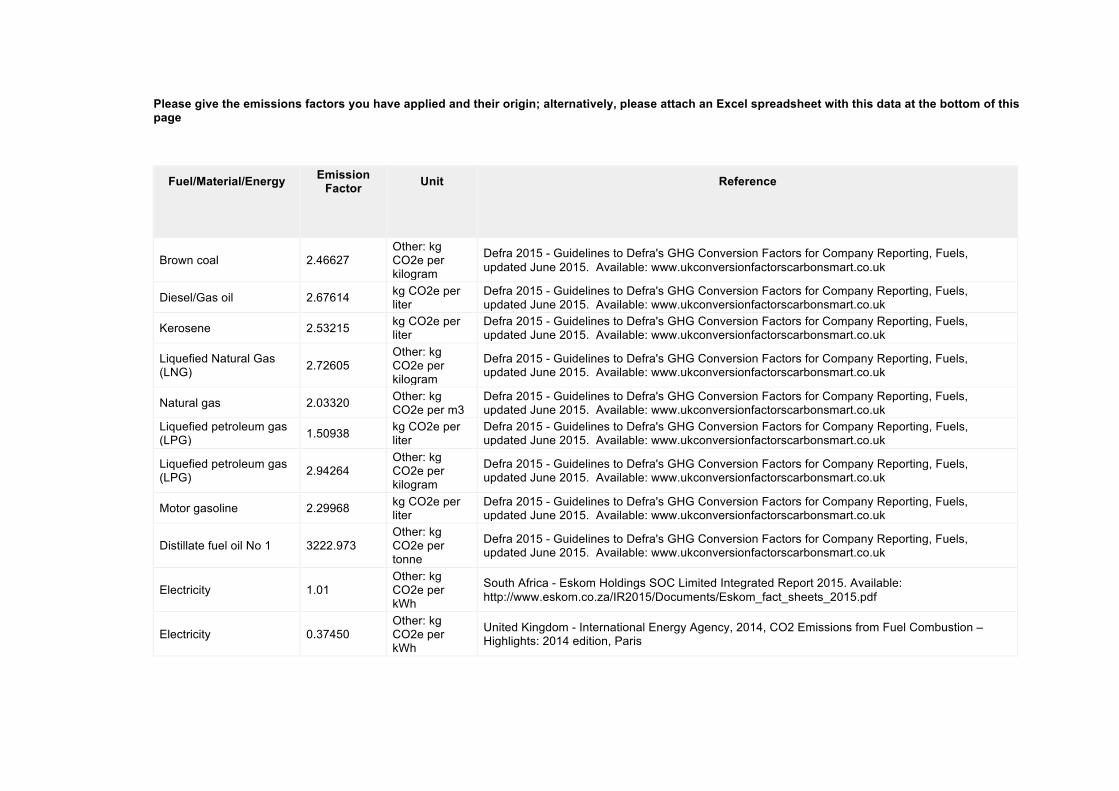
Please give the emissions factors you have applied and their origin; alternatively, please attach an Excel spreadsheet with this data at the bottom of this page
Fuel/Material/Energy
Emission Factor
Unit
Reference
Brown coal 2.46627 Other: kg CO2e per kilogram
Defra 2015 - Guidelines to Defra's GHG Conversion Factors for Company Reporting, Fuels, updated June 2015. Available: www.ukconversionfactorscarbonsmart.co.uk
Diesel/Gas oil 2.67614 kg CO2e per liter
Defra 2015 - Guidelines to Defra's GHG Conversion Factors for Company Reporting, Fuels, updated June 2015. Available: www.ukconversionfactorscarbonsmart.co.uk
Kerosene 2.53215 kg CO2e per liter
Defra 2015 - Guidelines to Defra's GHG Conversion Factors for Company Reporting, Fuels, updated June 2015. Available: www.ukconversionfactorscarbonsmart.co.uk
Liquefied Natural Gas (LNG) 2.72605
Other: kg CO2e per kilogram
Defra 2015 - Guidelines to Defra's GHG Conversion Factors for Company Reporting, Fuels, updated June 2015. Available: www.ukconversionfactorscarbonsmart.co.uk
Natural gas 2.03320 Other: kg CO2e per m3
Defra 2015 - Guidelines to Defra's GHG Conversion Factors for Company Reporting, Fuels, updated June 2015. Available: www.ukconversionfactorscarbonsmart.co.uk
Liquefied petroleum gas (LPG) 1.50938 kg CO2e per
liter Defra 2015 - Guidelines to Defra's GHG Conversion Factors for Company Reporting, Fuels, updated June 2015. Available: www.ukconversionfactorscarbonsmart.co.uk
Liquefied petroleum gas (LPG) 2.94264
Other: kg CO2e per kilogram
Defra 2015 - Guidelines to Defra's GHG Conversion Factors for Company Reporting, Fuels, updated June 2015. Available: www.ukconversionfactorscarbonsmart.co.uk
Motor gasoline 2.29968 kg CO2e per liter
Defra 2015 - Guidelines to Defra's GHG Conversion Factors for Company Reporting, Fuels, updated June 2015. Available: www.ukconversionfactorscarbonsmart.co.uk
Distillate fuel oil No 1 3222.973 Other: kg CO2e per tonne
Defra 2015 - Guidelines to Defra's GHG Conversion Factors for Company Reporting, Fuels, updated June 2015. Available: www.ukconversionfactorscarbonsmart.co.uk
Electricity 1.01 Other: kg CO2e per kWh
South Africa - Eskom Holdings SOC Limited Integrated Report 2015. Available: http://www.eskom.co.za/IR2015/Documents/Eskom_fact_sheets_2015.pdf
Electricity 0.37450 Other: kg CO2e per kWh
United Kingdom - International Energy Agency, 2014, CO2 Emissions from Fuel Combustion – Highlights: 2014 edition, Paris
Further Information
Page: CC8. Emissions Data - (1 Oct 2013 - 30 Sep 2014)
CC8.1
Please select the boundary you are using for your Scope 1 and 2 greenhouse gas inventory Equity share
CC8.2
Please provide your gross global Scope 1 emissions figures in metric tonnes CO2e 124174.74
CC8.3
Does your company have any operations in markets providing product or supplier specific data in the form of contractual instruments? No
CC8.3a
Please provide your gross global Scope 2 emissions figures in metric tonnes CO2e
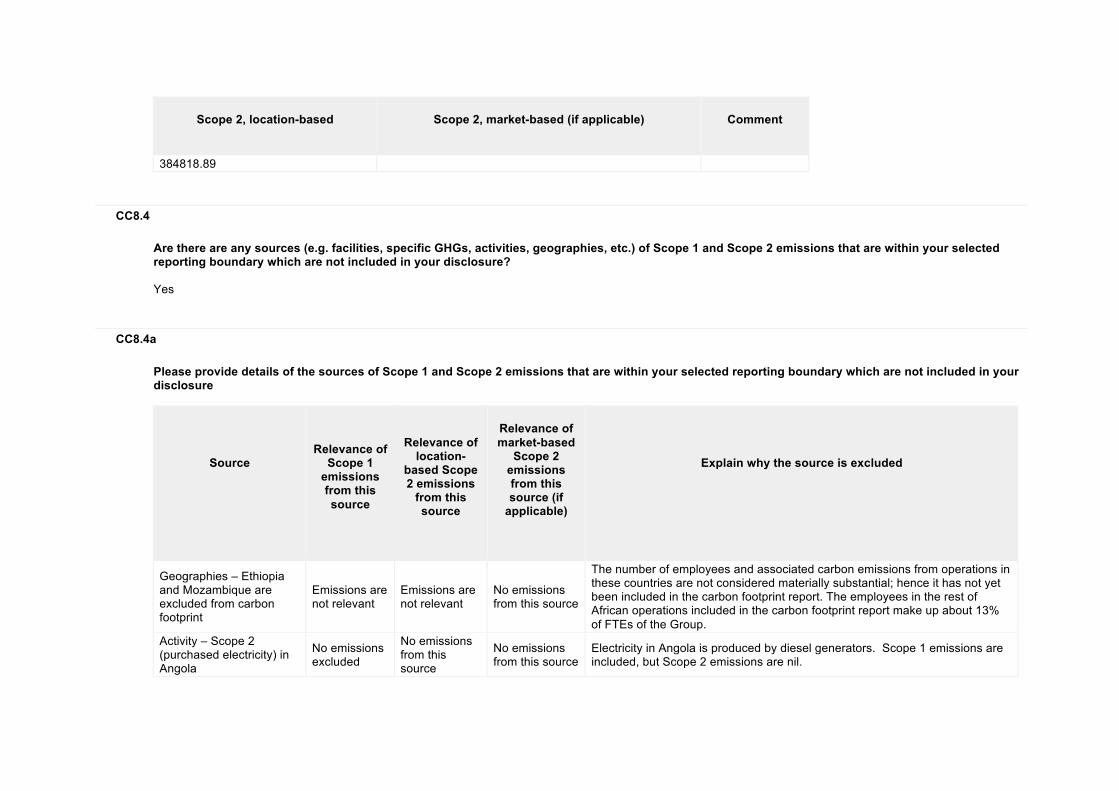
Scope 2, location-based
Scope 2, market-based (if applicable)
Comment
384818.89
CC8.4
Are there are any sources (e.g. facilities, specific GHGs, activities, geographies, etc.) of Scope 1 and Scope 2 emissions that are within your selected reporting boundary which are not included in your disclosure? Yes
CC8.4a
Please provide details of the sources of Scope 1 and Scope 2 emissions that are within your selected reporting boundary which are not included in your disclosure
Source
Relevance of
Scope 1 emissions from this source
Relevance of
location-based Scope 2 emissions
from this source
Relevance of market-based
Scope 2 emissions from this source (if
applicable)
Explain why the source is excluded
Geographies – Ethiopia and Mozambique are excluded from carbon footprint
Emissions are not relevant
Emissions are not relevant
No emissions from this source
The number of employees and associated carbon emissions from operations in these countries are not considered materially substantial; hence it has not yet been included in the carbon footprint report. The employees in the rest of African operations included in the carbon footprint report make up about 13% of FTEs of the Group.
Activity – Scope 2 (purchased electricity) in Angola
No emissions excluded
No emissions from this source
No emissions from this source
Electricity in Angola is produced by diesel generators. Scope 1 emissions are included, but Scope 2 emissions are nil.

CC8.5
Please estimate the level of uncertainty of the total gross global Scope 1 and 2 emissions figures that you have supplied and specify the sources of uncertainty in your data gathering, handling and calculations
Scope
Uncertainty range
Main sources of
uncertainty
Please expand on the uncertainty in your data
Scope 1 More than 2% but less than or equal to 5%
Data Gaps Assumptions Extrapolation Data Management
Although great effort was made to ensure completeness and accuracy by using internal spreadsheets with controls and responsible parties; due to the large scope of the organisation, it is expected that some discrepancies could have occurred in the data collection and supply from the various divisional facilities of the company. Fuel consumed in owned equipment was derived from purchase records and not metered consumption. Data used to calculate the emissions from the vehicle fleet and forklifts consisted of litres of petrol and diesel and kilograms of LPG purchased.
Scope 2 (location-based)
More than 2% but less than or equal to 5%
Data Gaps Extrapolation Metering/ Measurement Constraints
In South Africa electricity charges are based on meters owned and maintained (calibrated) by Eskom or the municipalities. Some countries and divisions have missing data and available data was extrapolated to reflect consumption for a full year.
Scope 2 (market-based)
Less than or equal to 2%
No Sources of Uncertainty
No emissions in this scope.
CC8.6
Please indicate the verification/assurance status that applies to your reported Scope 1 emissions No third party verification or assurance
CC8.6a
Please provide further details of the verification/assurance undertaken for your Scope 1 emissions, and attach the relevant statements
Verification or
assurance cycle in place
Status in the
current reporting year
Type of verification or
assurance
Attach the statement
Page/section reference
Relevant standard
Proportion of reported Scope 1 emissions
verified (%)
CC8.6b
Please provide further details of the regulatory regime to which you are complying that specifies the use of Continuous Emissions Monitoring Systems (CEMS)
Regulation
% of emissions covered by the system
Compliance period
Evidence of submission
CC8.7
Please indicate the verification/assurance status that applies to at least one of your reported Scope 2 emissions figures No third party verification or assurance
CC8.7a
Please provide further details of the verification/assurance undertaken for your location-based and/or market-based Scope 2 emissions, and attach the relevant statements
Location-based or
market-based figure?
Verification or
assurance cycle in place
Status in the
current reporting year
Type of verification
or assurance
Attach the statement
Page/Section reference
Relevant standard
Proportion of
reported Scope 2 emissions verified
(%)
CC8.8
Please identify if any data points have been verified as part of the third party verification work undertaken, other than the verification of emissions figures reported in CC8.6, CC8.7 and CC14.2
Additional data points verified
Comment
No additional data verified Nampak's carbon footprint was restated due to divestment of the Corrugated, Flexibles, Sacks and Tissues business units.
CC8.9
Are carbon dioxide emissions from biologically sequestered carbon relevant to your organization? No
CC8.9a
Please provide the emissions from biologically sequestered carbon relevant to your organization in metric tonnes CO2
Further Information
Page: CC8. Emissions Data - (1 Oct 2014 - 30 Sep 2015)
CC8.1
Please select the boundary you are using for your Scope 1 and 2 greenhouse gas inventory Equity share
CC8.2
Please provide your gross global Scope 1 emissions figures in metric tonnes CO2e 162422.89
CC8.3
Does your company have any operations in markets providing product or supplier specific data in the form of contractual instruments? No
CC8.3a
Please provide your gross global Scope 2 emissions figures in metric tonnes CO2e
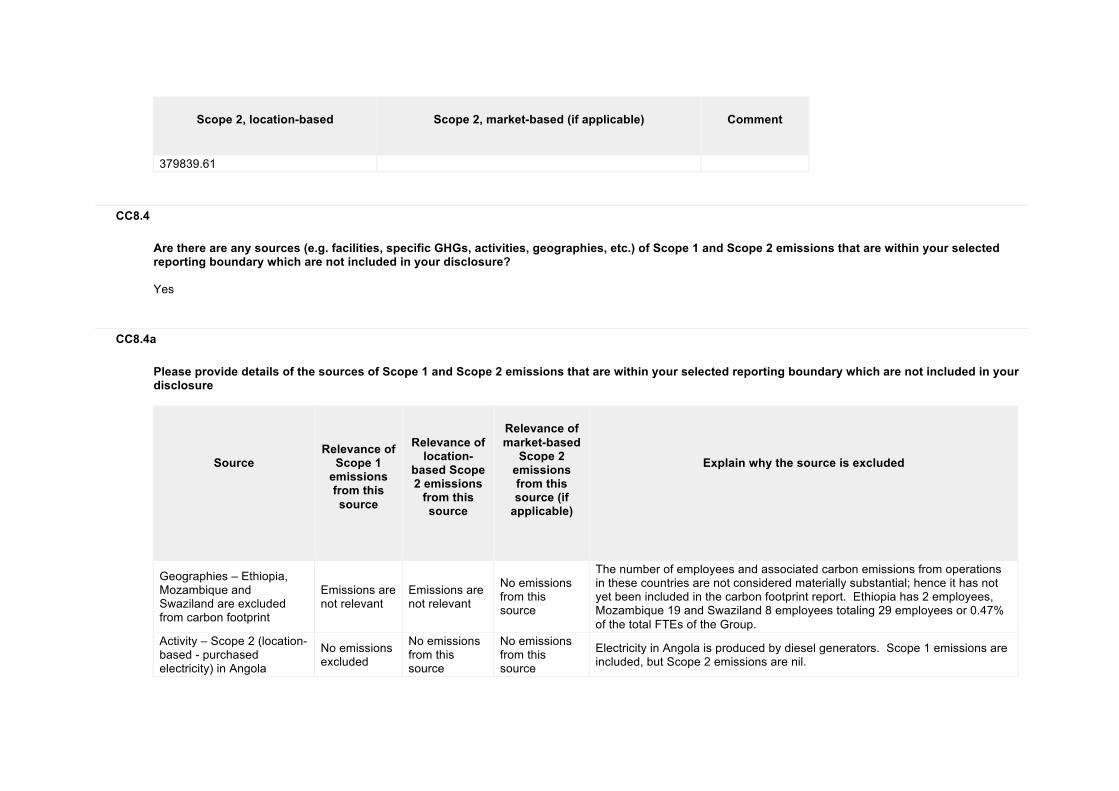
Scope 2, location-based
Scope 2, market-based (if applicable)
Comment
379839.61
CC8.4
Are there are any sources (e.g. facilities, specific GHGs, activities, geographies, etc.) of Scope 1 and Scope 2 emissions that are within your selected reporting boundary which are not included in your disclosure? Yes
CC8.4a
Please provide details of the sources of Scope 1 and Scope 2 emissions that are within your selected reporting boundary which are not included in your disclosure
Source
Relevance of
Scope 1 emissions from this source
Relevance of
location-based Scope 2 emissions
from this source
Relevance of market-based
Scope 2 emissions from this source (if
applicable)
Explain why the source is excluded
Geographies – Ethiopia, Mozambique and Swaziland are excluded from carbon footprint
Emissions are not relevant
Emissions are not relevant
No emissions from this source
The number of employees and associated carbon emissions from operations in these countries are not considered materially substantial; hence it has not yet been included in the carbon footprint report. Ethiopia has 2 employees, Mozambique 19 and Swaziland 8 employees totaling 29 employees or 0.47% of the total FTEs of the Group.
Activity – Scope 2 (location-based - purchased electricity) in Angola
No emissions excluded
No emissions from this source
No emissions from this source
Electricity in Angola is produced by diesel generators. Scope 1 emissions are included, but Scope 2 emissions are nil.
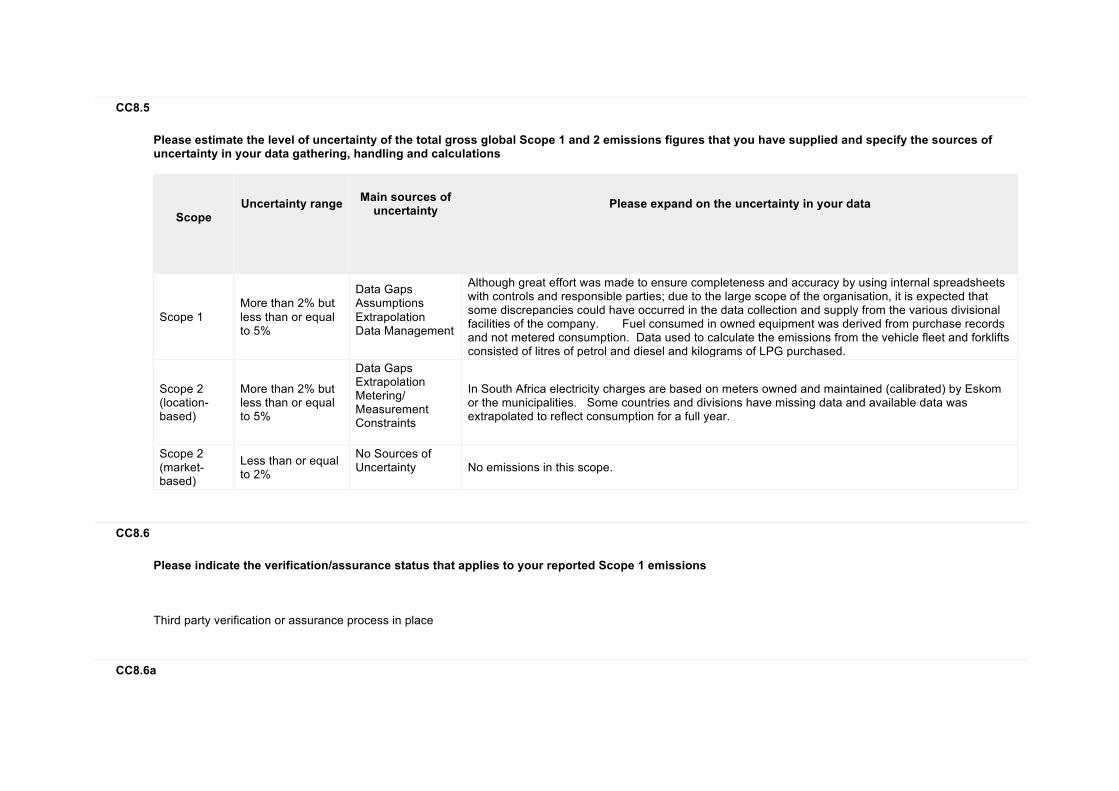
CC8.5
Please estimate the level of uncertainty of the total gross global Scope 1 and 2 emissions figures that you have supplied and specify the sources of uncertainty in your data gathering, handling and calculations
Scope
Uncertainty range
Main sources of
uncertainty
Please expand on the uncertainty in your data
Scope 1 More than 2% but less than or equal to 5%
Data Gaps Assumptions Extrapolation Data Management
Although great effort was made to ensure completeness and accuracy by using internal spreadsheets with controls and responsible parties; due to the large scope of the organisation, it is expected that some discrepancies could have occurred in the data collection and supply from the various divisional facilities of the company. Fuel consumed in owned equipment was derived from purchase records and not metered consumption. Data used to calculate the emissions from the vehicle fleet and forklifts consisted of litres of petrol and diesel and kilograms of LPG purchased.
Scope 2 (location-based)
More than 2% but less than or equal to 5%
Data Gaps Extrapolation Metering/ Measurement Constraints
In South Africa electricity charges are based on meters owned and maintained (calibrated) by Eskom or the municipalities. Some countries and divisions have missing data and available data was extrapolated to reflect consumption for a full year.
Scope 2 (market-based)
Less than or equal to 2%
No Sources of Uncertainty
No emissions in this scope.
CC8.6
Please indicate the verification/assurance status that applies to your reported Scope 1 emissions Third party verification or assurance process in place
CC8.6a
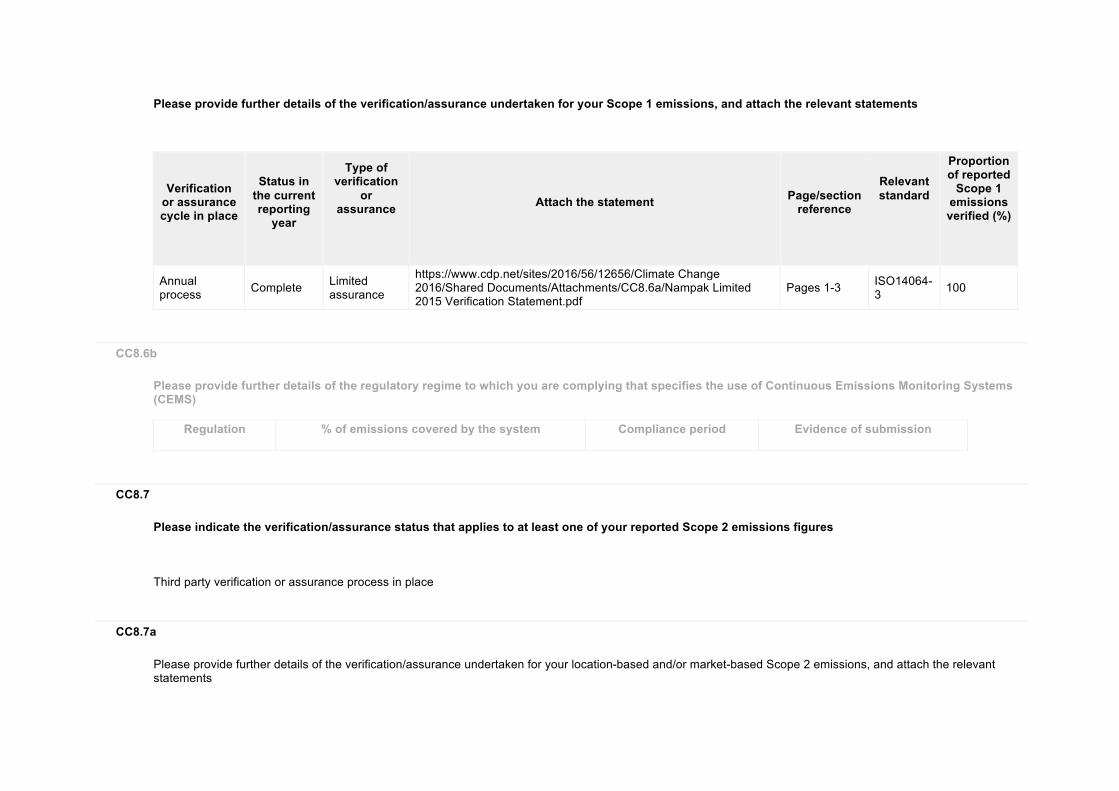
Please provide further details of the verification/assurance undertaken for your Scope 1 emissions, and attach the relevant statements
Verification
or assurance cycle in place
Status in
the current reporting
year
Type of verification
or assurance
Attach the statement
Page/section
reference
Relevant standard
Proportion of reported
Scope 1 emissions verified (%)
Annual process Complete Limited
assurance
https://www.cdp.net/sites/2016/56/12656/Climate Change 2016/Shared Documents/Attachments/CC8.6a/Nampak Limited 2015 Verification Statement.pdf
Pages 1-3 ISO14064-3 100
CC8.6b
Please provide further details of the regulatory regime to which you are complying that specifies the use of Continuous Emissions Monitoring Systems (CEMS)
Regulation
% of emissions covered by the system
Compliance period
Evidence of submission
CC8.7
Please indicate the verification/assurance status that applies to at least one of your reported Scope 2 emissions figures Third party verification or assurance process in place
CC8.7a
Please provide further details of the verification/assurance undertaken for your location-based and/or market-based Scope 2 emissions, and attach the relevant statements
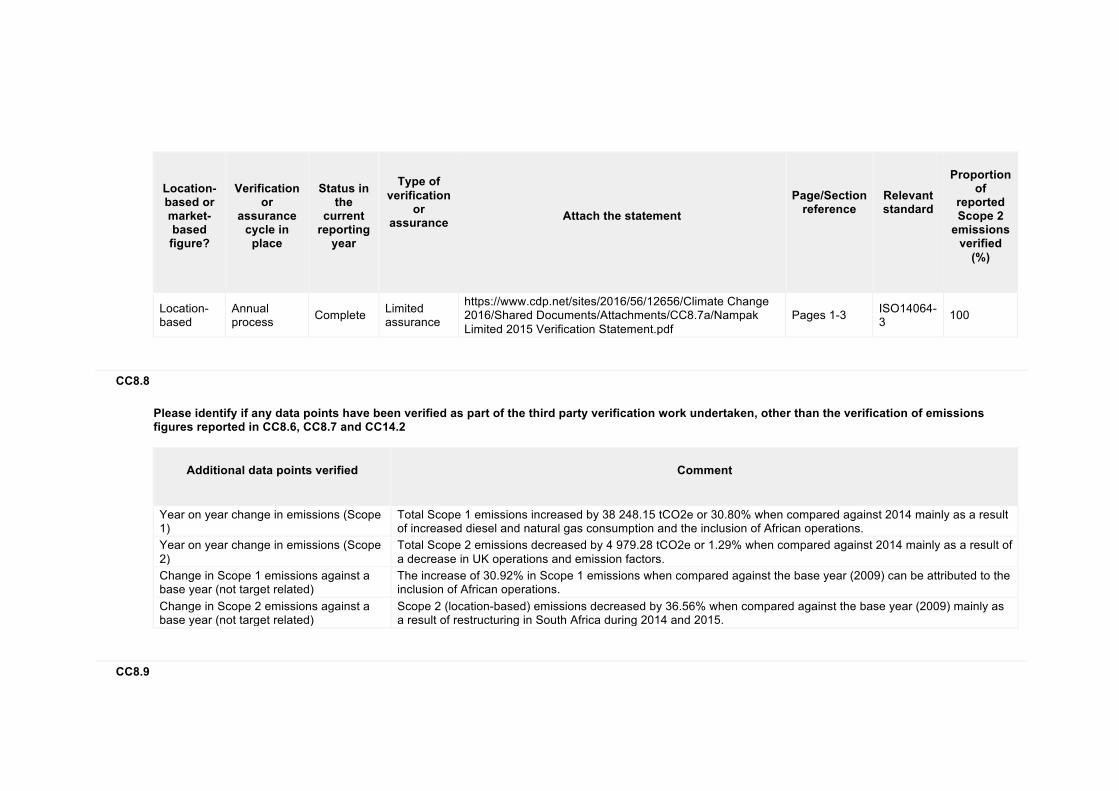
Location-based or market-based figure?
Verification
or assurance
cycle in place
Status in
the current
reporting year
Type of verification
or assurance
Attach the statement
Page/Section reference
Relevant standard
Proportion
of reported Scope 2
emissions verified
(%)
Location-based
Annual process Complete Limited
assurance
https://www.cdp.net/sites/2016/56/12656/Climate Change 2016/Shared Documents/Attachments/CC8.7a/Nampak Limited 2015 Verification Statement.pdf
Pages 1-3 ISO14064-3 100
CC8.8
Please identify if any data points have been verified as part of the third party verification work undertaken, other than the verification of emissions figures reported in CC8.6, CC8.7 and CC14.2
Additional data points verified
Comment
Year on year change in emissions (Scope 1)
Total Scope 1 emissions increased by 38 248.15 tCO2e or 30.80% when compared against 2014 mainly as a result of increased diesel and natural gas consumption and the inclusion of African operations.
Year on year change in emissions (Scope 2)
Total Scope 2 emissions decreased by 4 979.28 tCO2e or 1.29% when compared against 2014 mainly as a result of a decrease in UK operations and emission factors.
Change in Scope 1 emissions against a base year (not target related)
The increase of 30.92% in Scope 1 emissions when compared against the base year (2009) can be attributed to the inclusion of African operations.
Change in Scope 2 emissions against a base year (not target related)
Scope 2 (location-based) emissions decreased by 36.56% when compared against the base year (2009) mainly as a result of restructuring in South Africa during 2014 and 2015.
CC8.9
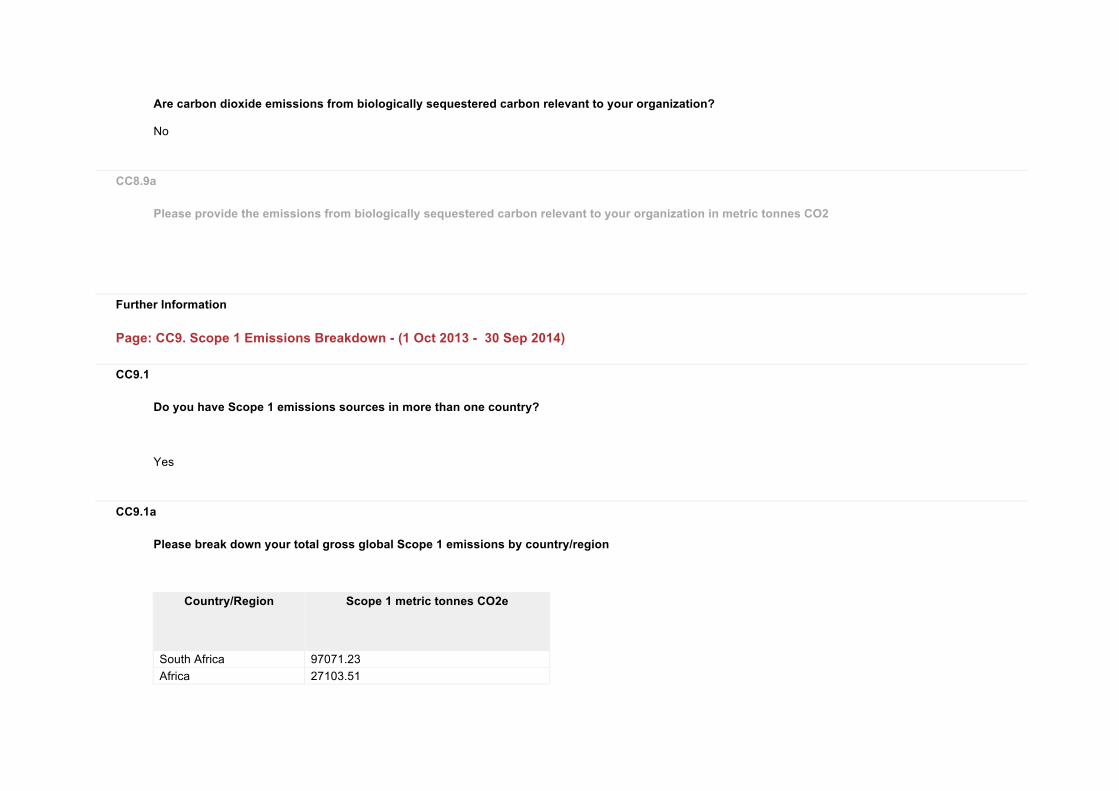
Are carbon dioxide emissions from biologically sequestered carbon relevant to your organization? No
CC8.9a
Please provide the emissions from biologically sequestered carbon relevant to your organization in metric tonnes CO2
Further Information
Page: CC9. Scope 1 Emissions Breakdown - (1 Oct 2013 - 30 Sep 2014)
CC9.1
Do you have Scope 1 emissions sources in more than one country? Yes
CC9.1a
Please break down your total gross global Scope 1 emissions by country/region
Country/Region
Scope 1 metric tonnes CO2e
South Africa 97071.23 Africa 27103.51
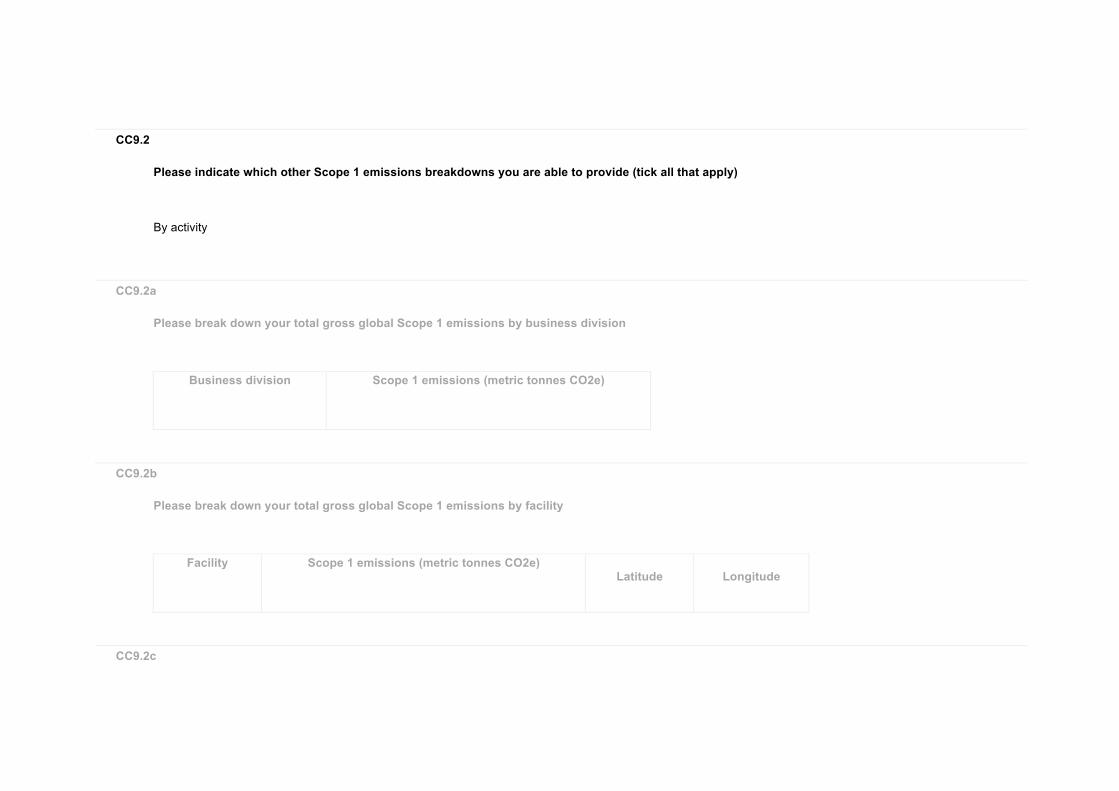
CC9.2
Please indicate which other Scope 1 emissions breakdowns you are able to provide (tick all that apply) By activity
CC9.2a
Please break down your total gross global Scope 1 emissions by business division
Business division
Scope 1 emissions (metric tonnes CO2e)
CC9.2b
Please break down your total gross global Scope 1 emissions by facility
Facility
Scope 1 emissions (metric tonnes CO2e)
Latitude
Longitude
CC9.2c
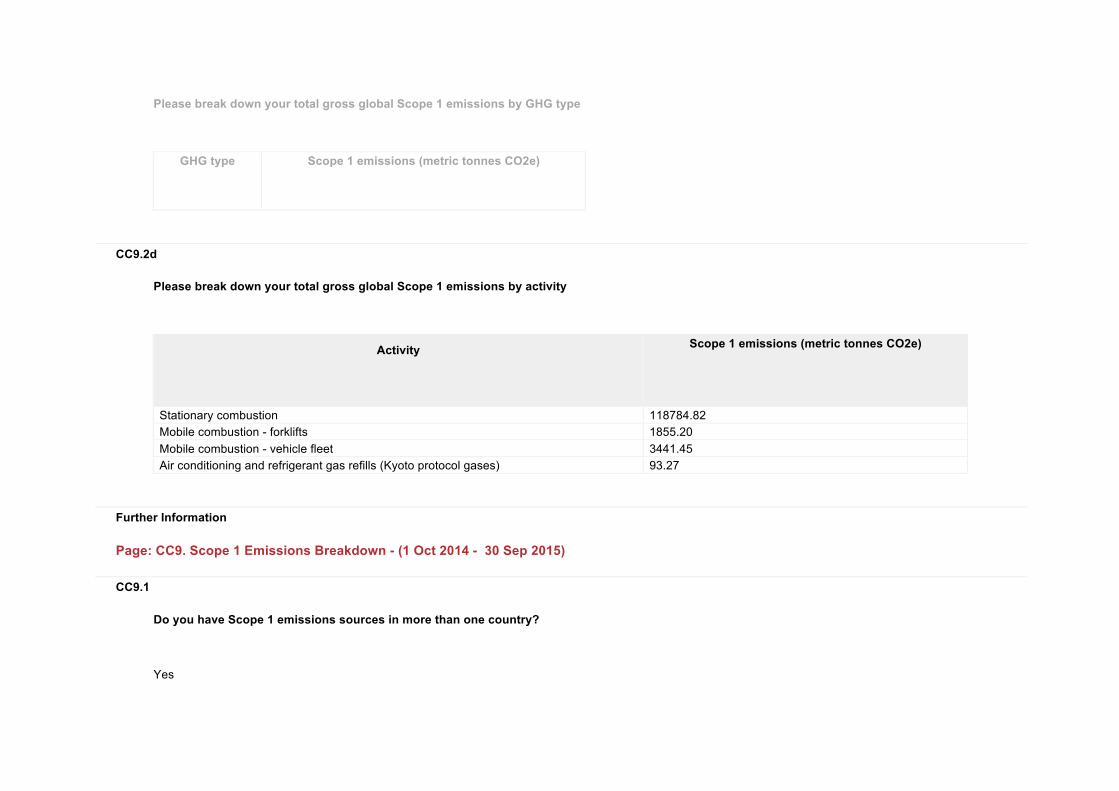
Please break down your total gross global Scope 1 emissions by GHG type
GHG type
Scope 1 emissions (metric tonnes CO2e)
CC9.2d
Please break down your total gross global Scope 1 emissions by activity
Activity
Scope 1 emissions (metric tonnes CO2e)
Stationary combustion 118784.82 Mobile combustion - forklifts 1855.20 Mobile combustion - vehicle fleet 3441.45 Air conditioning and refrigerant gas refills (Kyoto protocol gases) 93.27
Further Information
Page: CC9. Scope 1 Emissions Breakdown - (1 Oct 2014 - 30 Sep 2015)
CC9.1
Do you have Scope 1 emissions sources in more than one country? Yes
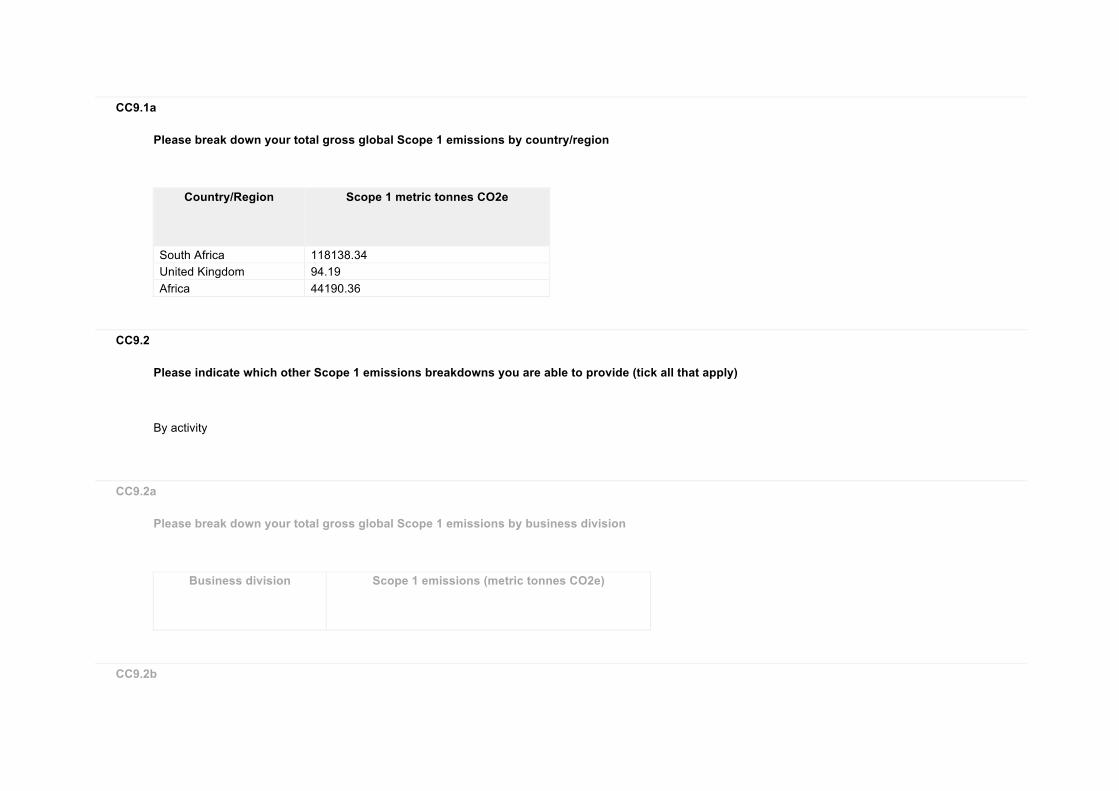
CC9.1a
Please break down your total gross global Scope 1 emissions by country/region
Country/Region
Scope 1 metric tonnes CO2e
South Africa 118138.34 United Kingdom 94.19 Africa 44190.36
CC9.2
Please indicate which other Scope 1 emissions breakdowns you are able to provide (tick all that apply) By activity
CC9.2a
Please break down your total gross global Scope 1 emissions by business division
Business division
Scope 1 emissions (metric tonnes CO2e)
CC9.2b
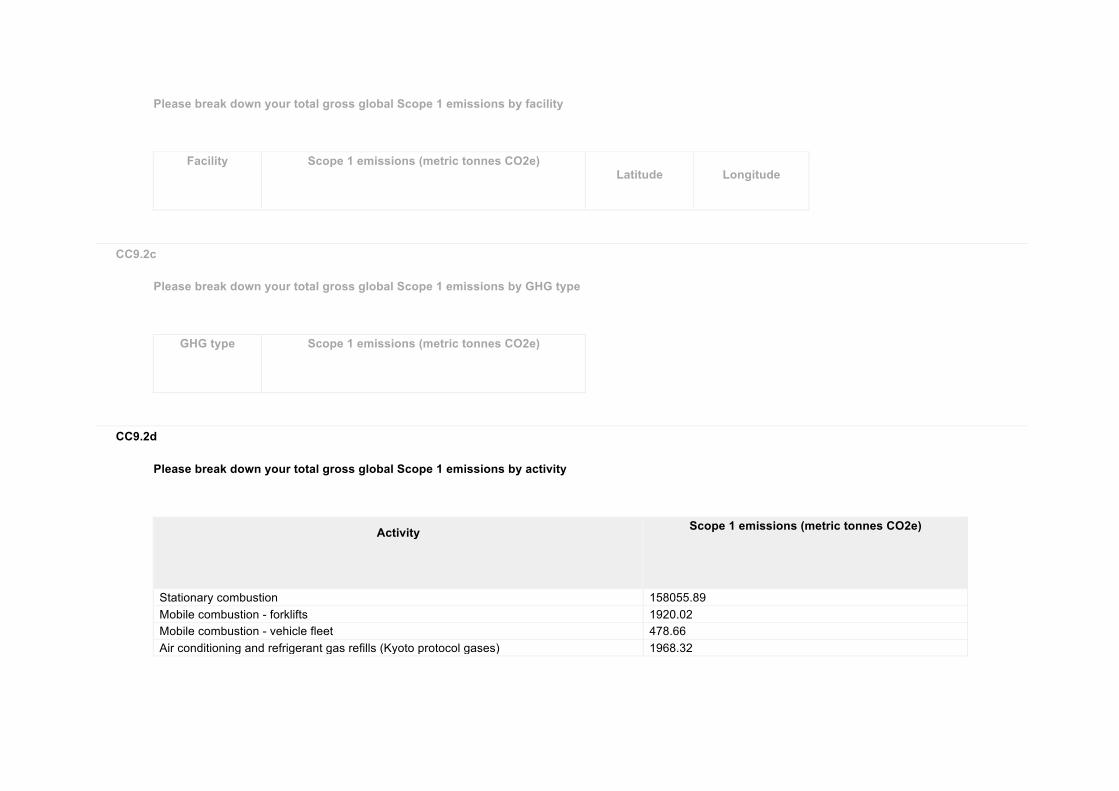
Please break down your total gross global Scope 1 emissions by facility
Facility
Scope 1 emissions (metric tonnes CO2e)
Latitude
Longitude
CC9.2c
Please break down your total gross global Scope 1 emissions by GHG type
GHG type
Scope 1 emissions (metric tonnes CO2e)
CC9.2d
Please break down your total gross global Scope 1 emissions by activity
Activity
Scope 1 emissions (metric tonnes CO2e)
Stationary combustion 158055.89 Mobile combustion - forklifts 1920.02 Mobile combustion - vehicle fleet 478.66 Air conditioning and refrigerant gas refills (Kyoto protocol gases) 1968.32
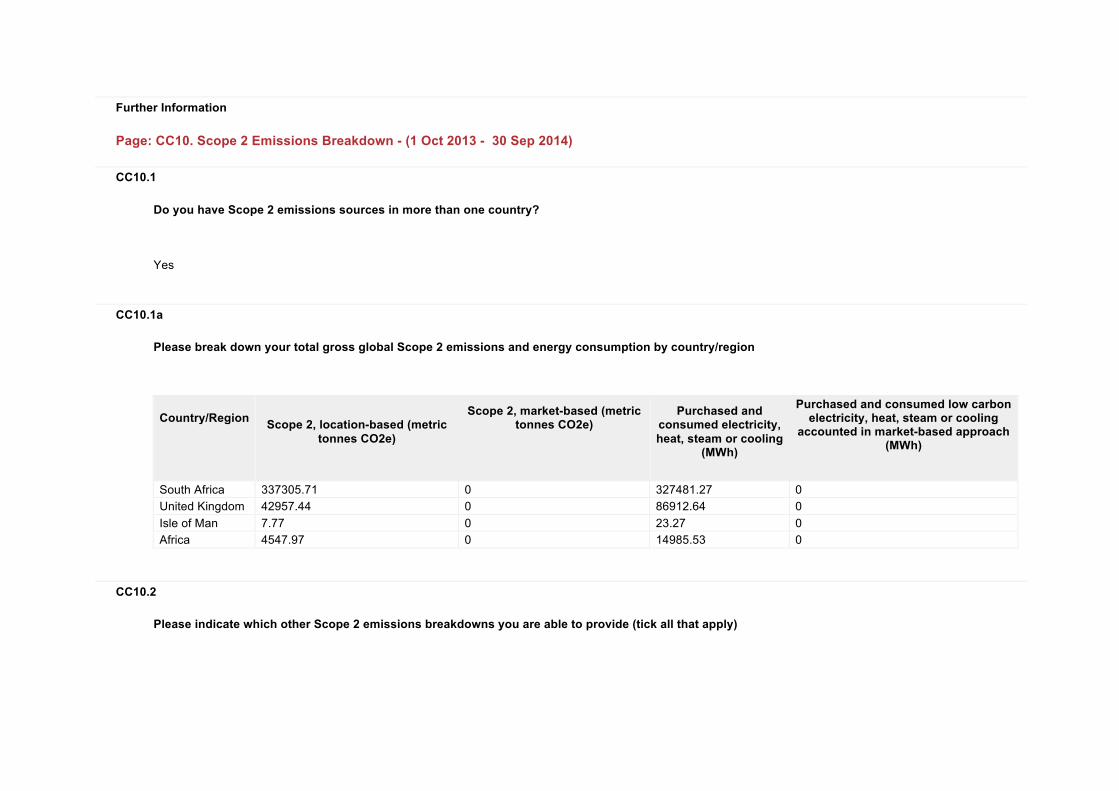
Further Information
Page: CC10. Scope 2 Emissions Breakdown - (1 Oct 2013 - 30 Sep 2014)
CC10.1
Do you have Scope 2 emissions sources in more than one country? Yes
CC10.1a
Please break down your total gross global Scope 2 emissions and energy consumption by country/region
Country/Region
Scope 2, location-based (metric
tonnes CO2e)
Scope 2, market-based (metric tonnes CO2e)
Purchased and consumed electricity, heat, steam or cooling
(MWh)
Purchased and consumed low carbon electricity, heat, steam or cooling
accounted in market-based approach (MWh)
South Africa 337305.71 0 327481.27 0 United Kingdom 42957.44 0 86912.64 0 Isle of Man 7.77 0 23.27 0 Africa 4547.97 0 14985.53 0
CC10.2
Please indicate which other Scope 2 emissions breakdowns you are able to provide (tick all that apply)

CC10.2a
Please break down your total gross global Scope 2 emissions by business division
Business division
Scope 2 emissions, location based (metric tonnes CO2e)
Scope 2 emissions, market-based
(metric tonnes CO2e)
CC10.2b
Please break down your total gross global Scope 2 emissions by facility
Facility
Scope 2 emissions, location based (metric tonnes CO2e)
Scope 2 emissions, market-based
(metric tonnes CO2e)
CC10.2c
Please break down your total gross global Scope 2 emissions by activity
Activity
Scope 2 emissions, location based (metric tonnes CO2e)
Scope 2 emissions, market-based
(metric tonnes CO2e)
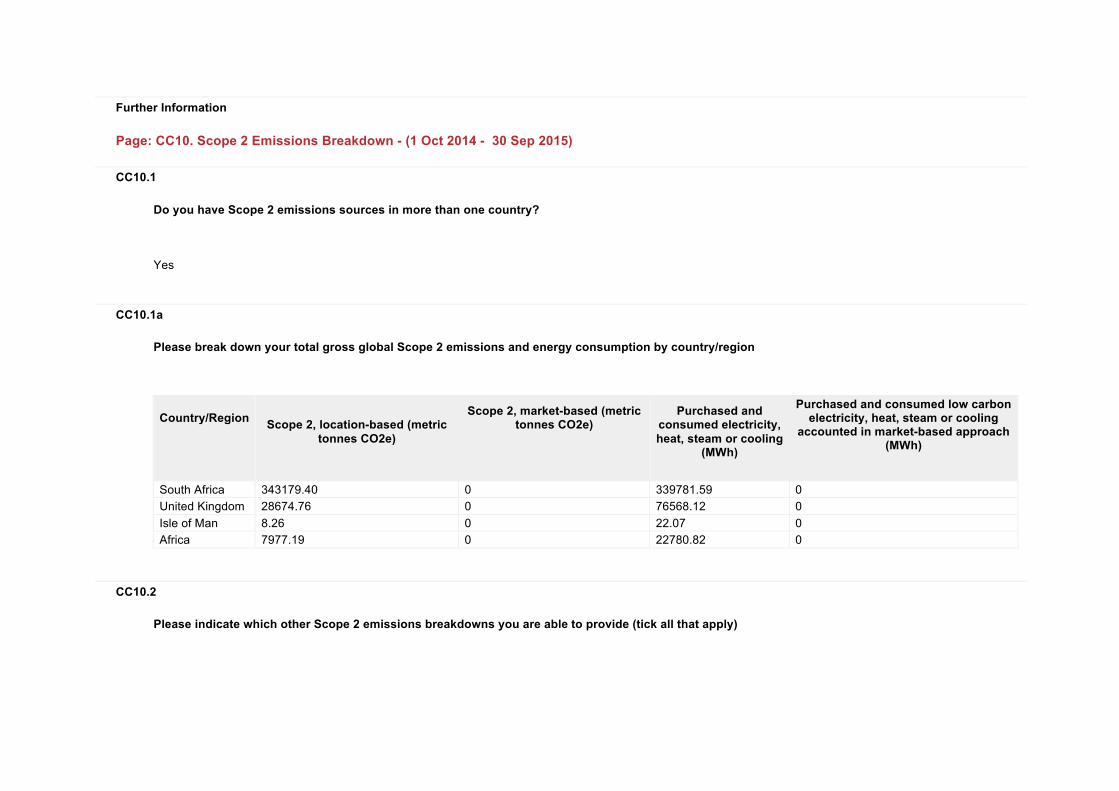
Further Information
Page: CC10. Scope 2 Emissions Breakdown - (1 Oct 2014 - 30 Sep 2015)
CC10.1
Do you have Scope 2 emissions sources in more than one country? Yes
CC10.1a
Please break down your total gross global Scope 2 emissions and energy consumption by country/region
Country/Region
Scope 2, location-based (metric
tonnes CO2e)
Scope 2, market-based (metric tonnes CO2e)
Purchased and consumed electricity, heat, steam or cooling
(MWh)
Purchased and consumed low carbon electricity, heat, steam or cooling
accounted in market-based approach (MWh)
South Africa 343179.40 0 339781.59 0 United Kingdom 28674.76 0 76568.12 0 Isle of Man 8.26 0 22.07 0 Africa 7977.19 0 22780.82 0
CC10.2
Please indicate which other Scope 2 emissions breakdowns you are able to provide (tick all that apply)
CC10.2a
Please break down your total gross global Scope 2 emissions by business division
Business division
Scope 2 emissions, location based (metric tonnes CO2e)
Scope 2 emissions, market-based
(metric tonnes CO2e)
CC10.2b
Please break down your total gross global Scope 2 emissions by facility
Facility
Scope 2 emissions, location based (metric tonnes CO2e)
Scope 2 emissions, market-based
(metric tonnes CO2e)
CC10.2c
Please break down your total gross global Scope 2 emissions by activity
Activity
Scope 2 emissions, location based (metric tonnes CO2e)
Scope 2 emissions, market-based
(metric tonnes CO2e)
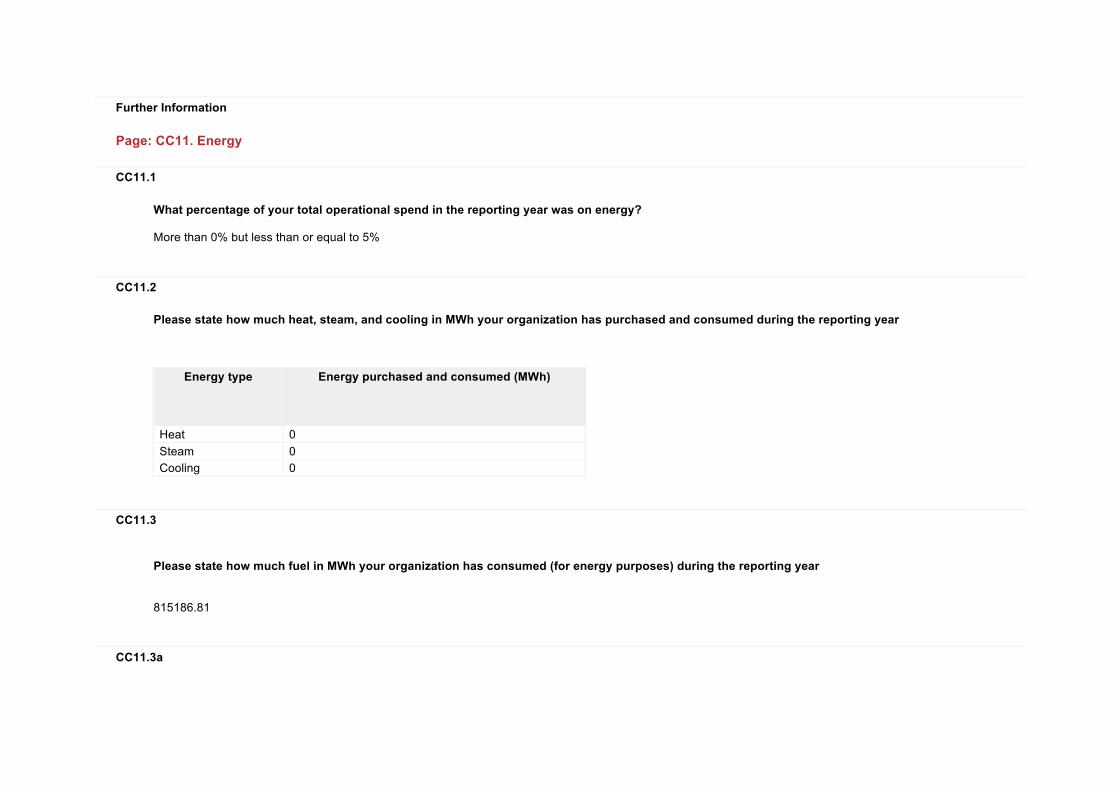
Further Information
Page: CC11. Energy
CC11.1
What percentage of your total operational spend in the reporting year was on energy? More than 0% but less than or equal to 5%
CC11.2
Please state how much heat, steam, and cooling in MWh your organization has purchased and consumed during the reporting year
Energy type
Energy purchased and consumed (MWh)
Heat 0 Steam 0 Cooling 0
CC11.3
Please state how much fuel in MWh your organization has consumed (for energy purposes) during the reporting year 815186.81
CC11.3a
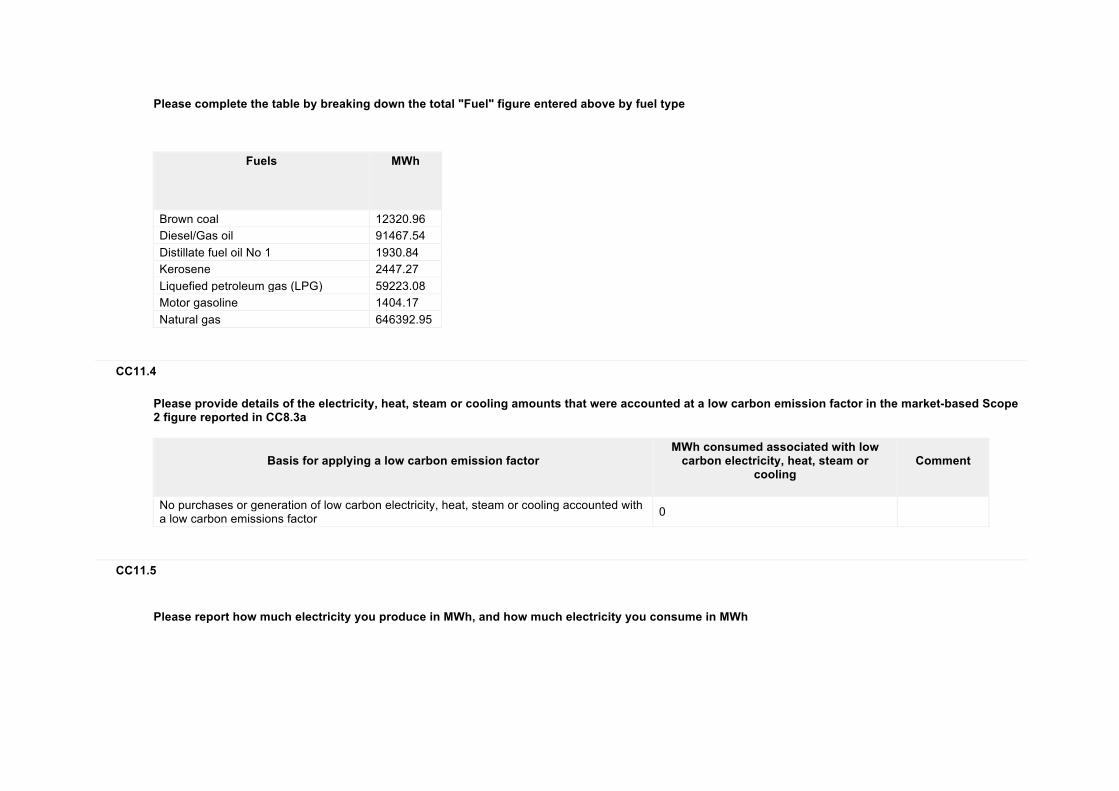
Please complete the table by breaking down the total "Fuel" figure entered above by fuel type
Fuels
MWh
Brown coal 12320.96 Diesel/Gas oil 91467.54 Distillate fuel oil No 1 1930.84 Kerosene 2447.27 Liquefied petroleum gas (LPG) 59223.08 Motor gasoline 1404.17 Natural gas 646392.95
CC11.4
Please provide details of the electricity, heat, steam or cooling amounts that were accounted at a low carbon emission factor in the market-based Scope 2 figure reported in CC8.3a
Basis for applying a low carbon emission factor
MWh consumed associated with low carbon electricity, heat, steam or
cooling
Comment
No purchases or generation of low carbon electricity, heat, steam or cooling accounted with a low carbon emissions factor 0
CC11.5
Please report how much electricity you produce in MWh, and how much electricity you consume in MWh
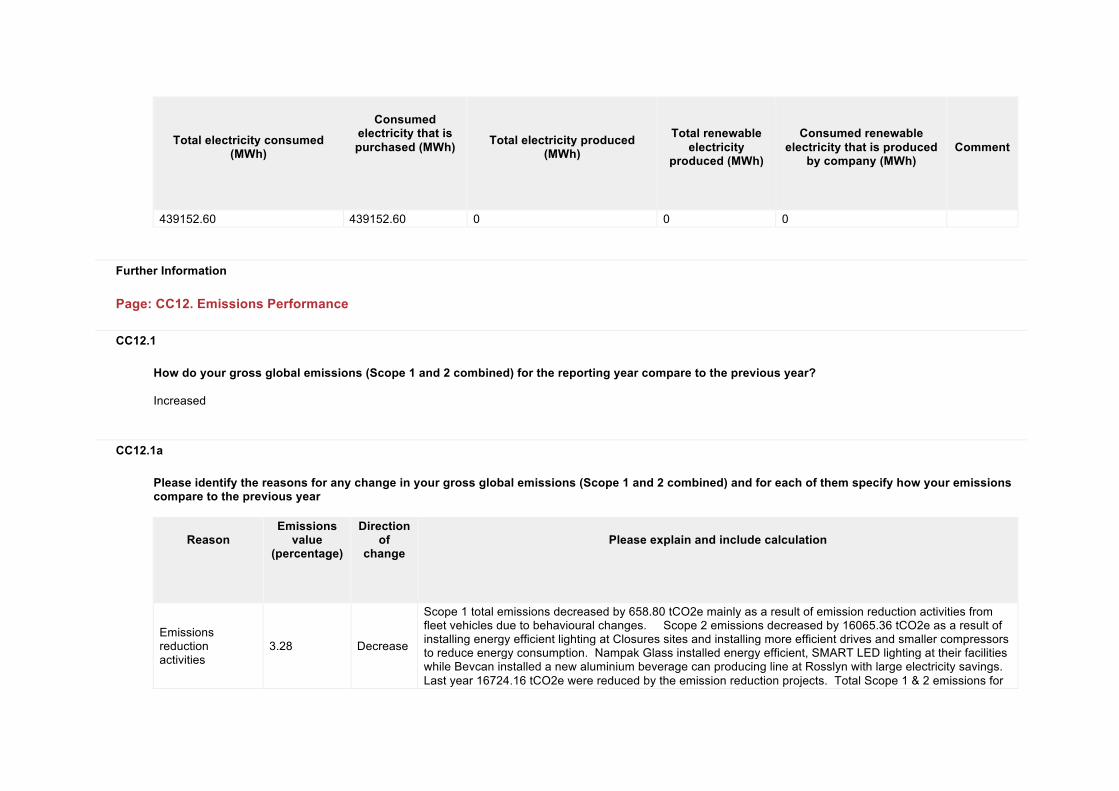
Total electricity consumed
(MWh)
Consumed
electricity that is purchased (MWh)
Total electricity produced
(MWh)
Total renewable
electricity produced (MWh)
Consumed renewable
electricity that is produced by company (MWh)
Comment
439152.60 439152.60 0 0 0
Further Information
Page: CC12. Emissions Performance
CC12.1
How do your gross global emissions (Scope 1 and 2 combined) for the reporting year compare to the previous year? Increased
CC12.1a
Please identify the reasons for any change in your gross global emissions (Scope 1 and 2 combined) and for each of them specify how your emissions compare to the previous year
Reason
Emissions value
(percentage)
Direction of
change
Please explain and include calculation
Emissions reduction activities
3.28 Decrease
Scope 1 total emissions decreased by 658.80 tCO2e mainly as a result of emission reduction activities from fleet vehicles due to behavioural changes. Scope 2 emissions decreased by 16065.36 tCO2e as a result of installing energy efficient lighting at Closures sites and installing more efficient drives and smaller compressors to reduce energy consumption. Nampak Glass installed energy efficient, SMART LED lighting at their facilities while Bevcan installed a new aluminium beverage can producing line at Rosslyn with large electricity savings. Last year 16724.16 tCO2e were reduced by the emission reduction projects. Total Scope 1 & 2 emissions for
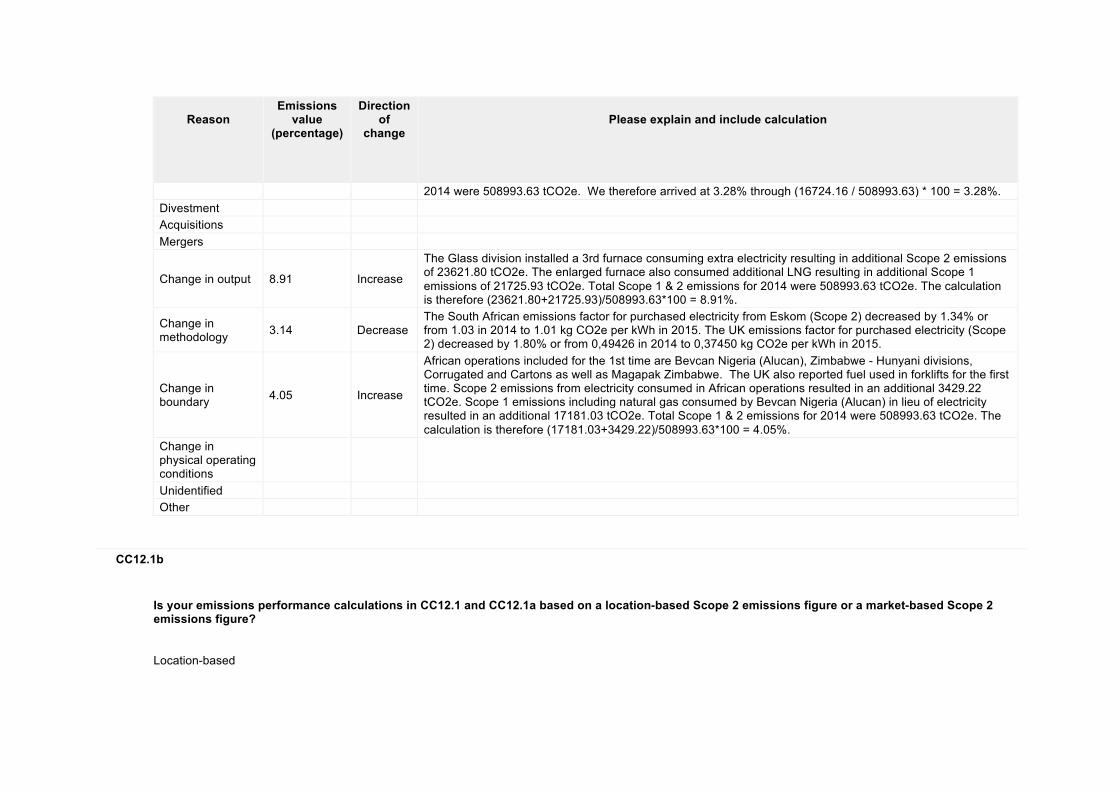
Reason
Emissions value
(percentage)
Direction of
change
Please explain and include calculation
2014 were 508993.63 tCO2e. We therefore arrived at 3.28% through (16724.16 / 508993.63) * 100 = 3.28%. Divestment Acquisitions Mergers
Change in output 8.91 Increase
The Glass division installed a 3rd furnace consuming extra electricity resulting in additional Scope 2 emissions of 23621.80 tCO2e. The enlarged furnace also consumed additional LNG resulting in additional Scope 1 emissions of 21725.93 tCO2e. Total Scope 1 & 2 emissions for 2014 were 508993.63 tCO2e. The calculation is therefore (23621.80+21725.93)/508993.63*100 = 8.91%.
Change in methodology 3.14 Decrease
The South African emissions factor for purchased electricity from Eskom (Scope 2) decreased by 1.34% or from 1.03 in 2014 to 1.01 kg CO2e per kWh in 2015. The UK emissions factor for purchased electricity (Scope 2) decreased by 1.80% or from 0,49426 in 2014 to 0,37450 kg CO2e per kWh in 2015.
Change in boundary 4.05 Increase
African operations included for the 1st time are Bevcan Nigeria (Alucan), Zimbabwe - Hunyani divisions, Corrugated and Cartons as well as Magapak Zimbabwe. The UK also reported fuel used in forklifts for the first time. Scope 2 emissions from electricity consumed in African operations resulted in an additional 3429.22 tCO2e. Scope 1 emissions including natural gas consumed by Bevcan Nigeria (Alucan) in lieu of electricity resulted in an additional 17181.03 tCO2e. Total Scope 1 & 2 emissions for 2014 were 508993.63 tCO2e. The calculation is therefore (17181.03+3429.22)/508993.63*100 = 4.05%.
Change in physical operating conditions
Unidentified Other
CC12.1b
Is your emissions performance calculations in CC12.1 and CC12.1a based on a location-based Scope 2 emissions figure or a market-based Scope 2 emissions figure? Location-based
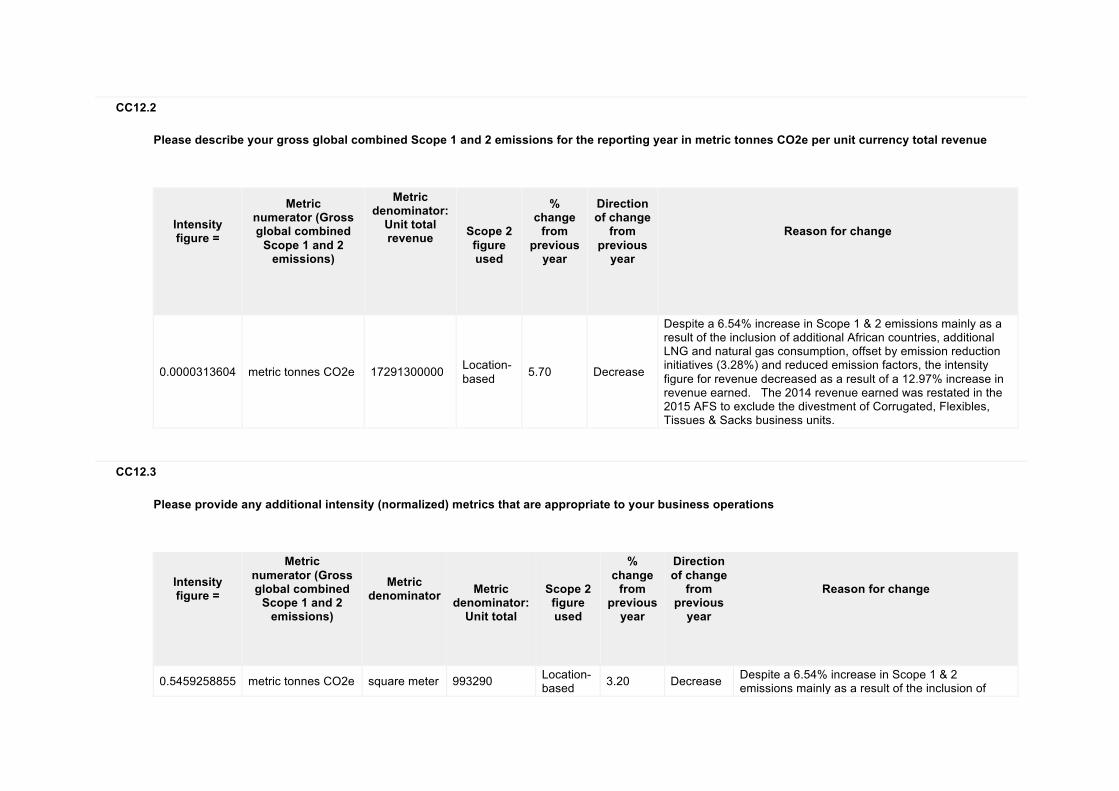
CC12.2
Please describe your gross global combined Scope 1 and 2 emissions for the reporting year in metric tonnes CO2e per unit currency total revenue
Intensity figure =
Metric numerator (Gross global combined
Scope 1 and 2 emissions)
Metric denominator:
Unit total revenue
Scope 2 figure used
% change
from previous
year
Direction of change
from previous
year
Reason for change
0.0000313604 metric tonnes CO2e 17291300000 Location-based 5.70 Decrease
Despite a 6.54% increase in Scope 1 & 2 emissions mainly as a result of the inclusion of additional African countries, additional LNG and natural gas consumption, offset by emission reduction initiatives (3.28%) and reduced emission factors, the intensity figure for revenue decreased as a result of a 12.97% increase in revenue earned. The 2014 revenue earned was restated in the 2015 AFS to exclude the divestment of Corrugated, Flexibles, Tissues & Sacks business units.
CC12.3
Please provide any additional intensity (normalized) metrics that are appropriate to your business operations
Intensity figure =
Metric numerator (Gross global combined
Scope 1 and 2 emissions)
Metric denominator
Metric
denominator: Unit total
Scope 2 figure used
% change
from previous
year
Direction of change
from previous
year
Reason for change
0.5459258855 metric tonnes CO2e square meter 993290 Location-based 3.20 Decrease Despite a 6.54% increase in Scope 1 & 2
emissions mainly as a result of the inclusion of
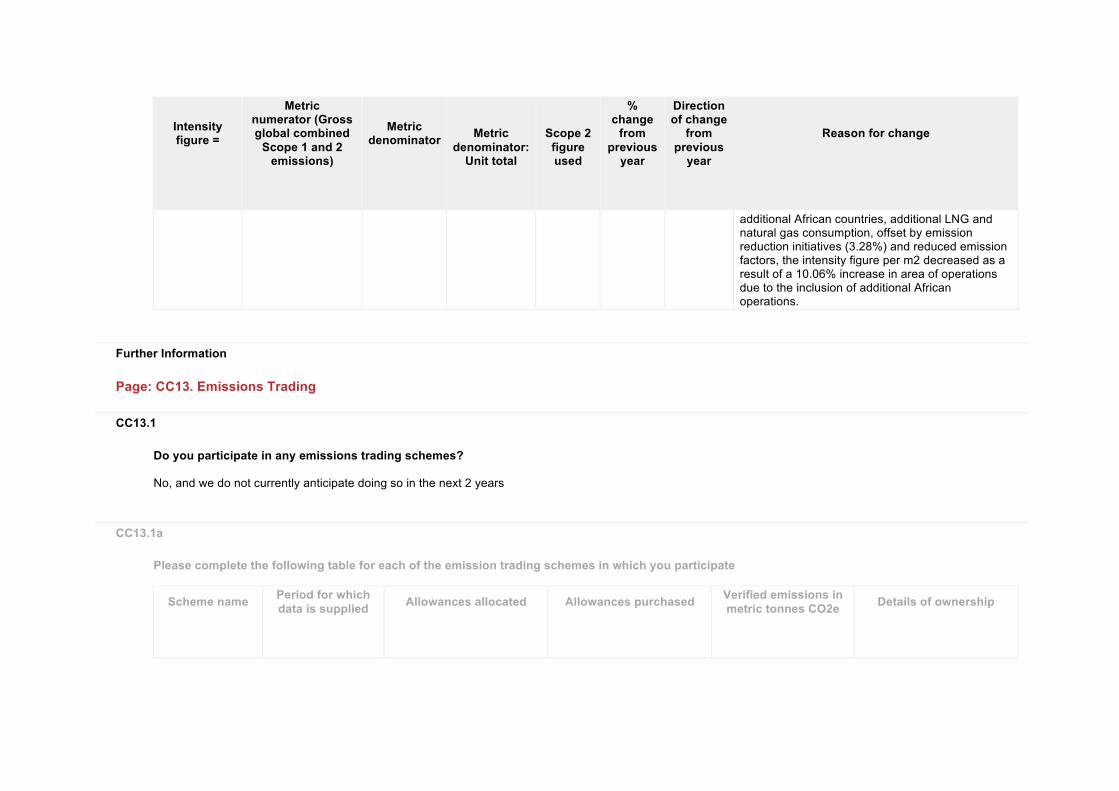
Intensity figure =
Metric numerator (Gross global combined
Scope 1 and 2 emissions)
Metric denominator
Metric
denominator: Unit total
Scope 2 figure used
% change
from previous
year
Direction of change
from previous
year
Reason for change
additional African countries, additional LNG and natural gas consumption, offset by emission reduction initiatives (3.28%) and reduced emission factors, the intensity figure per m2 decreased as a result of a 10.06% increase in area of operations due to the inclusion of additional African operations.
Further Information
Page: CC13. Emissions Trading
CC13.1
Do you participate in any emissions trading schemes? No, and we do not currently anticipate doing so in the next 2 years
CC13.1a
Please complete the following table for each of the emission trading schemes in which you participate
Scheme name
Period for which data is supplied
Allowances allocated
Allowances purchased
Verified emissions in metric tonnes CO2e
Details of ownership
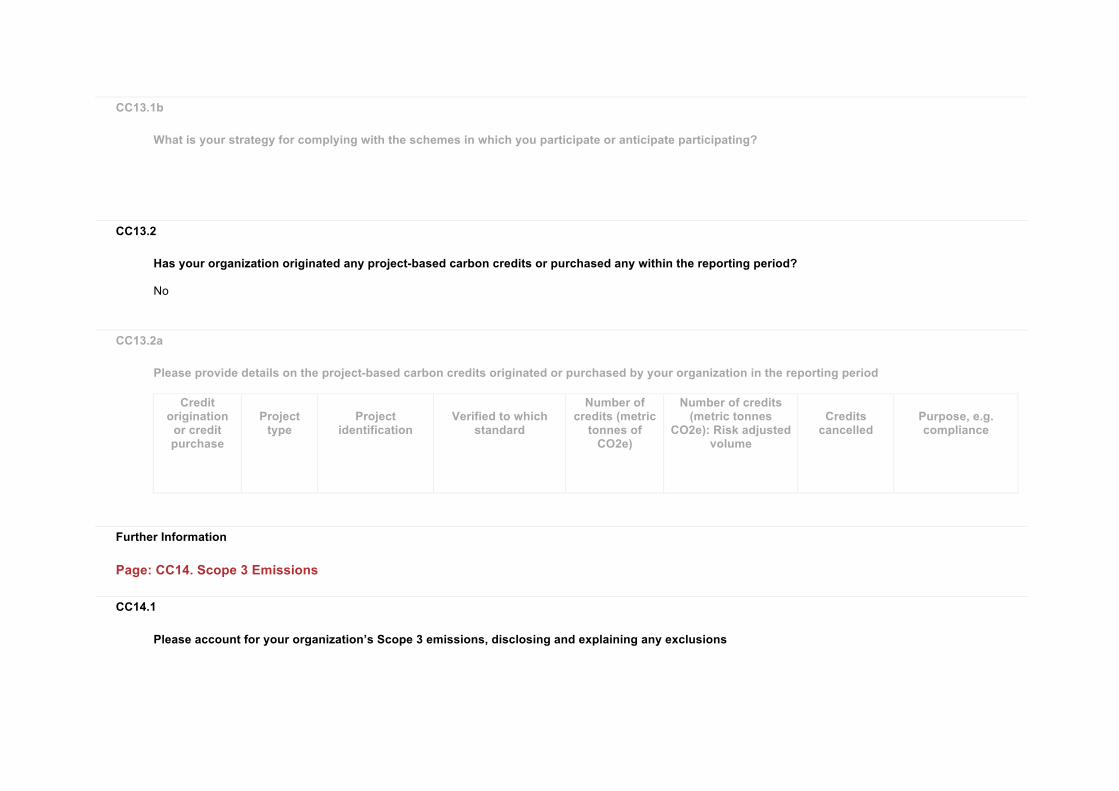
CC13.1b
What is your strategy for complying with the schemes in which you participate or anticipate participating?
CC13.2
Has your organization originated any project-based carbon credits or purchased any within the reporting period? No
CC13.2a
Please provide details on the project-based carbon credits originated or purchased by your organization in the reporting period
Credit origination
or credit purchase
Project type
Project identification
Verified to which standard
Number of credits (metric
tonnes of CO2e)
Number of credits (metric tonnes
CO2e): Risk adjusted volume
Credits cancelled
Purpose, e.g. compliance
Further Information
Page: CC14. Scope 3 Emissions
CC14.1
Please account for your organization’s Scope 3 emissions, disclosing and explaining any exclusions
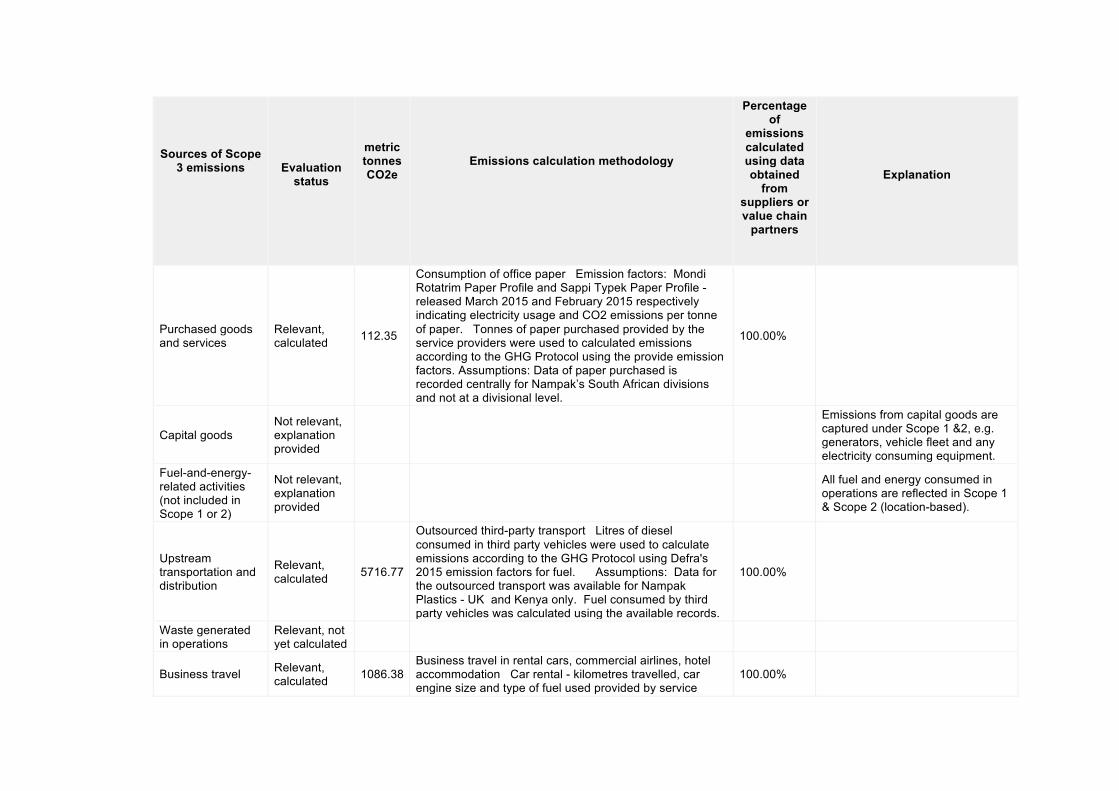
Sources of Scope 3 emissions
Evaluation status
metric tonnes CO2e
Emissions calculation methodology
Percentage of
emissions calculated using data obtained
from suppliers or value chain
partners
Explanation
Purchased goods and services
Relevant, calculated 112.35
Consumption of office paper Emission factors: Mondi Rotatrim Paper Profile and Sappi Typek Paper Profile - released March 2015 and February 2015 respectively indicating electricity usage and CO2 emissions per tonne of paper. Tonnes of paper purchased provided by the service providers were used to calculated emissions according to the GHG Protocol using the provide emission factors. Assumptions: Data of paper purchased is recorded centrally for Nampak’s South African divisions and not at a divisional level.
100.00%
Capital goods Not relevant, explanation provided
Emissions from capital goods are captured under Scope 1 &2, e.g. generators, vehicle fleet and any electricity consuming equipment.
Fuel-and-energy-related activities (not included in Scope 1 or 2)
Not relevant, explanation provided
All fuel and energy consumed in operations are reflected in Scope 1 & Scope 2 (location-based).
Upstream transportation and distribution
Relevant, calculated 5716.77
Outsourced third-party transport Litres of diesel consumed in third party vehicles were used to calculate emissions according to the GHG Protocol using Defra's 2015 emission factors for fuel. Assumptions: Data for the outsourced transport was available for Nampak Plastics - UK and Kenya only. Fuel consumed by third party vehicles was calculated using the available records.
100.00%
Waste generated in operations
Relevant, not yet calculated
Business travel Relevant, calculated 1086.38
Business travel in rental cars, commercial airlines, hotel accommodation Car rental - kilometres travelled, car engine size and type of fuel used provided by service
100.00%

Sources of Scope 3 emissions
Evaluation status
metric tonnes CO2e
Emissions calculation methodology
Percentage of
emissions calculated using data obtained
from suppliers or value chain
partners
Explanation
provider. Defra's 2015 emission factors for business travel - land used. Air travel - flight information provided by service provider, including class of travel, departure dates and destination of each leg. Carbon Calculated determined the distance travelled. Defra's 2015 emission factors for business travel - air used. Hotel accommodation - bednights provided by service provider. Emissions factor sourced from UNEP World Meteorological Organisation Climate Change And Tourism Report; A2.2.3 Accommodation. Emissions were calculated according to the GHG Protocol. Assumptions: All fights are booked through the company therefore there are no privately booked flights that are not accounted for. Hotel accommodation was based on estimated number of nights away on business travel and calculations were based on 1 person occupying a room per night. Data is reported centrally for Nampak’s South African divisions and not at a divisional level.
Employee commuting
Relevant, not yet calculated
Upstream leased assets
Not relevant, explanation provided
Many forklifts are leased although managed by Nampak including purchasing of fuel. It was not possible to establish which forklifts were owned and which were leased, thus all forklift fuel was recorded as Scope 1.
Downstream transportation and distribution
Not relevant, explanation provided
Nampak Plastics – UK and Kenya outsourced and paid for their third party transport, which is reflected in
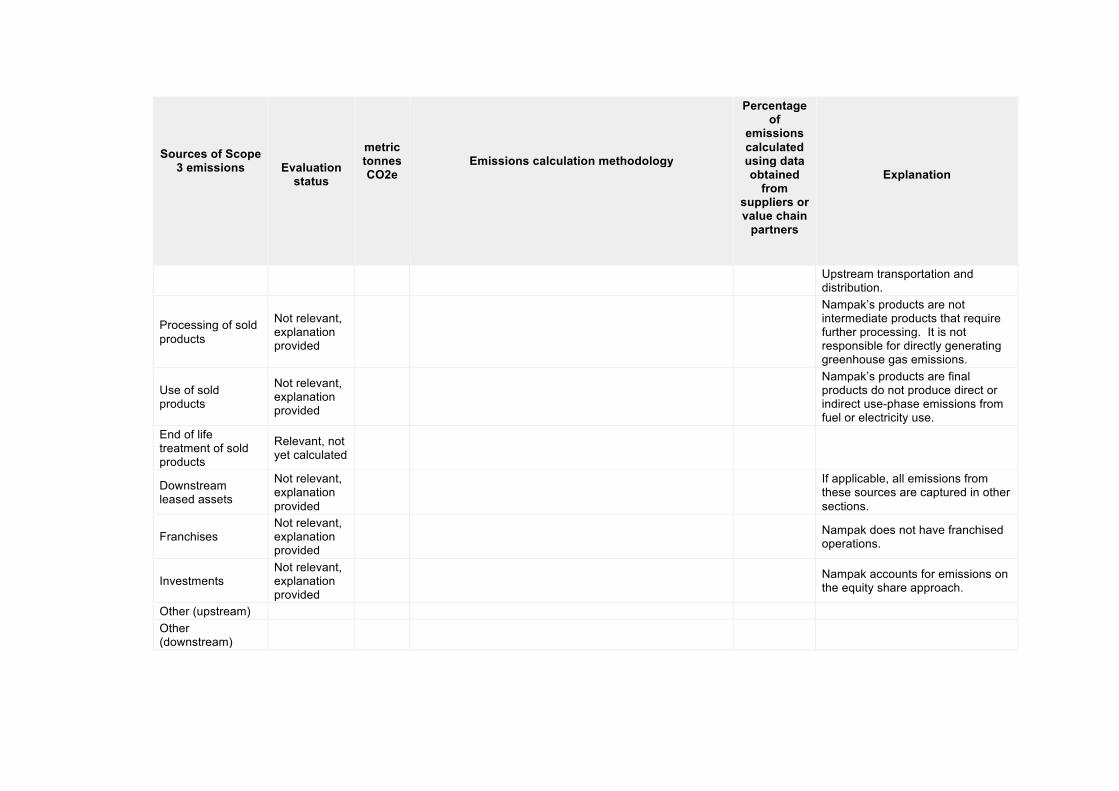
Sources of Scope 3 emissions
Evaluation status
metric tonnes CO2e
Emissions calculation methodology
Percentage of
emissions calculated using data obtained
from suppliers or value chain
partners
Explanation
Upstream transportation and distribution.
Processing of sold products
Not relevant, explanation provided
Nampak’s products are not intermediate products that require further processing. It is not responsible for directly generating greenhouse gas emissions.
Use of sold products
Not relevant, explanation provided
Nampak’s products are final products do not produce direct or indirect use-phase emissions from fuel or electricity use.
End of life treatment of sold products
Relevant, not yet calculated
Downstream leased assets
Not relevant, explanation provided
If applicable, all emissions from these sources are captured in other sections.
Franchises Not relevant, explanation provided
Nampak does not have franchised operations.
Investments Not relevant, explanation provided
Nampak accounts for emissions on the equity share approach.
Other (upstream) Other (downstream)
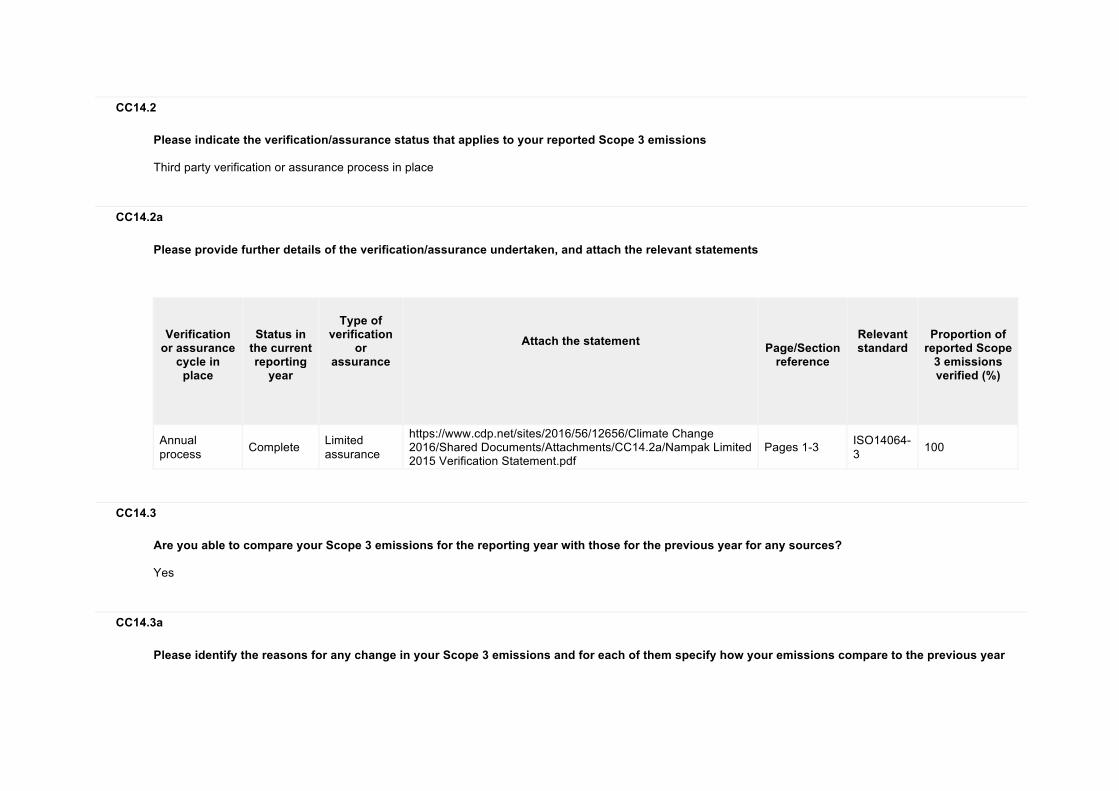
CC14.2
Please indicate the verification/assurance status that applies to your reported Scope 3 emissions Third party verification or assurance process in place
CC14.2a
Please provide further details of the verification/assurance undertaken, and attach the relevant statements
Verification
or assurance cycle in
place
Status in
the current reporting
year
Type of
verification or
assurance
Attach the statement
Page/Section
reference
Relevant standard
Proportion of
reported Scope 3 emissions verified (%)
Annual process Complete Limited
assurance
https://www.cdp.net/sites/2016/56/12656/Climate Change 2016/Shared Documents/Attachments/CC14.2a/Nampak Limited 2015 Verification Statement.pdf
Pages 1-3 ISO14064-3 100
CC14.3
Are you able to compare your Scope 3 emissions for the reporting year with those for the previous year for any sources? Yes
CC14.3a
Please identify the reasons for any change in your Scope 3 emissions and for each of them specify how your emissions compare to the previous year
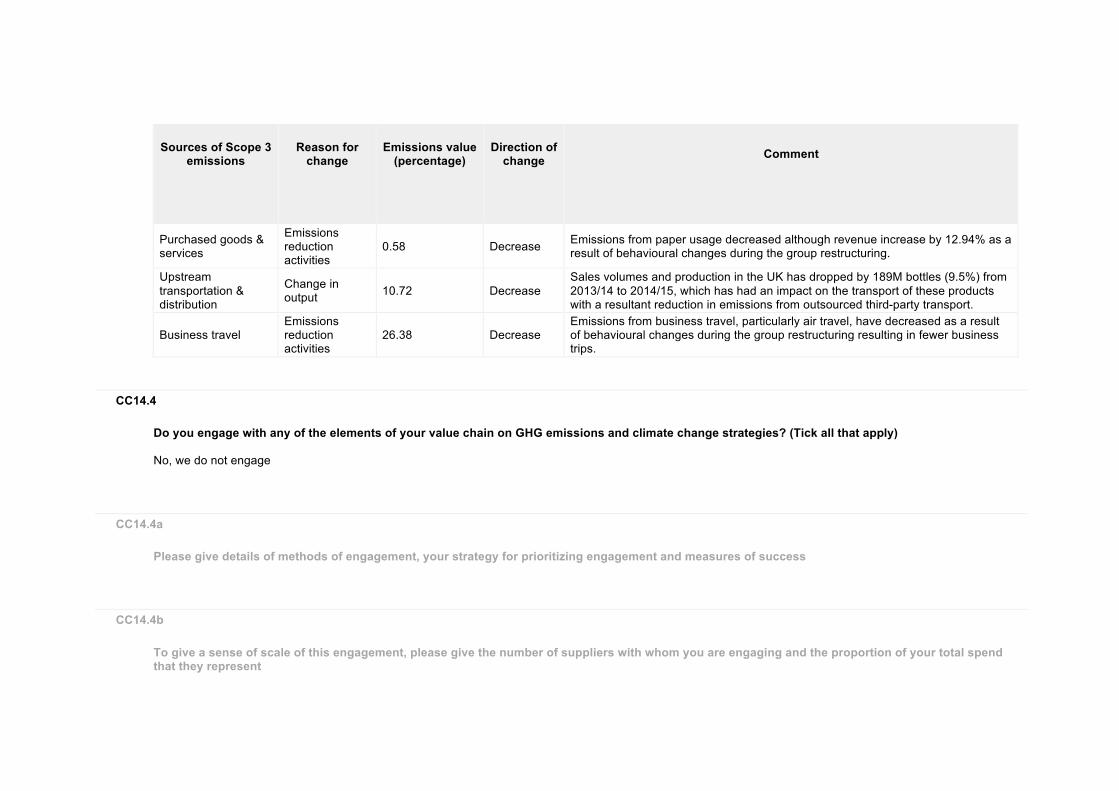
Sources of Scope 3
emissions
Reason for
change
Emissions value
(percentage)
Direction of
change
Comment
Purchased goods & services
Emissions reduction activities
0.58 Decrease Emissions from paper usage decreased although revenue increase by 12.94% as a result of behavioural changes during the group restructuring.
Upstream transportation & distribution
Change in output 10.72 Decrease
Sales volumes and production in the UK has dropped by 189M bottles (9.5%) from 2013/14 to 2014/15, which has had an impact on the transport of these products with a resultant reduction in emissions from outsourced third-party transport.
Business travel Emissions reduction activities
26.38 Decrease Emissions from business travel, particularly air travel, have decreased as a result of behavioural changes during the group restructuring resulting in fewer business trips.
CC14.4
Do you engage with any of the elements of your value chain on GHG emissions and climate change strategies? (Tick all that apply) No, we do not engage
CC14.4a
Please give details of methods of engagement, your strategy for prioritizing engagement and measures of success
CC14.4b
To give a sense of scale of this engagement, please give the number of suppliers with whom you are engaging and the proportion of your total spend that they represent
Number of suppliers
% of total spend (direct and indirect)
Comment
CC14.4c
If you have data on your suppliers’ GHG emissions and climate change strategies, please explain how you make use of that data
How you make use of the data
Please give details
CC14.4d
Please explain why you do not engage with any elements of your value chain on GHG emissions and climate change strategies, and any plans you have to develop an engagement strategy in the future No formalised methods of engagement exist, however environmental factors are taken into account with suppliers as far as possible (more related to services being supplied). In the UK the entire industry is involved in reducing the environmental impact to achieve the Dairy Roadmap’s target of 30% rHDPE inclusion in packaging by 2015 resulting in the launch of Nampak’s Infini® bottle in 2013. In future the possibility does exist for strategic discussions with service providers, and potential service providers. For instance, focus could be placed on the environmental awareness of the goods purchased – particularly in the instance of paper and travel.
Further Information
Module: Sign Off
Page: CC15. Sign Off
CC15.1
Please provide the following information for the person that has signed off (approved) your CDP climate change response
Name
Job title
Corresponding job category
Lynne Kidd Group Compensation, Benefits and Sustainability Manager Environment/Sustainability manager
Further Information
CDP 2016 Climate Change 2016 Information Request