Embed Size (px)
Citation preview

Annual
Results
2016
November 2016
Forward looking
statements
We may make statements that are not historical facts and relate to analyses and other information based on forecasts of future results and
estimates of amounts not yet determinable. These are forward-looking statements as defined in the U.S. Private Securities Litigation Reform
Act of 1995. Words such as “believe”, ”anticipate”, “expect”, intend”, “seek”, “will”, “plan”, “could”, “may”, ”endeavour” and “project” and
similar expressions are intended to identify such forward-looking statements, but are not the exclusive means of identifying such statements.
By their very nature, forward-looking statements involve inherent risks and uncertainties, both general and specific, and there are risks that
predictions, forecasts, projections and other forward-looking statements will not be achieved.
If one or more of these risks materialise, or should underlying assumptions prove incorrect, actual results may be very different from those
anticipated. The factors that could cause our actual results to differ materially from the plans, objectives, expectations, estimates and
intentions in such forward-looking statements are discussed in each year’s annual report. Forward-looking statements apply only as of the
date on which they are made, and we do not undertake other than in terms of the Listings Requirements of the JSE Limited, to update or
revise any statement, whether as a result of new information, future events or otherwise. All income forecasts published in this report are
unaudited. Investors are cautioned not to place undue reliance on any forward-looking statements contained herein.

2016
results overview
Group revenue
up 11%
Net gearing down
to 49% (2015: 72%)
R1.7 billion raised
through sale and
leaseback
HEPS down 48%:
abnormal forex losses,
higher interest costs and
higher effective tax rate
Group trading profit up
4%, Glass contributes
R105 million
R681 million abnormal
foreign exchange loss:
58% naira and 23%
kwanza devaluation
Rest of Africa
trading profit up 12%,
now 52% of group
trading profit
EPS up 11%
3
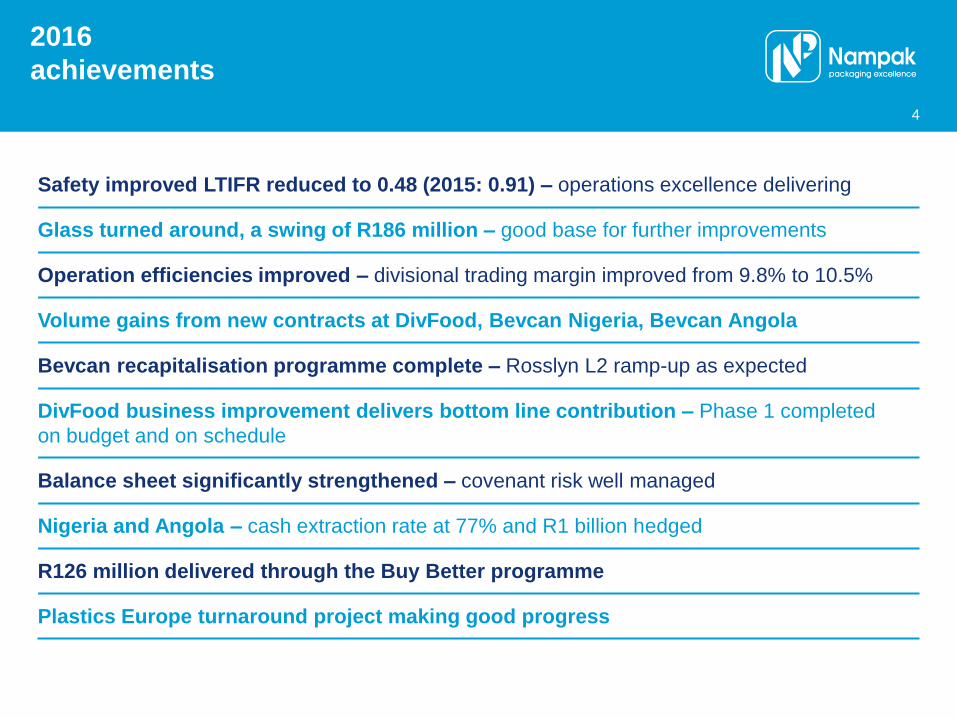
Safety improved LTIFR reduced to 0.48 (2015: 0.91) – operations excellence delivering
Glass turned around, a swing of R186 million – good base for further improvements
Operation efficiencies improved – divisional trading margin improved from 9.8% to 10.5%
Volume gains from new contracts at DivFood, Bevcan Nigeria, Bevcan Angola
Bevcan recapitalisation programme complete – Rosslyn L2 ramp-up as expected
DivFood business improvement delivers bottom line contribution – Phase 1 completed
on budget and on schedule
Balance sheet significantly strengthened – covenant risk well managed
Nigeria and Angola – cash extraction rate at 77% and R1 billion hedged
R126 million delivered through the Buy Better programme
Plastics Europe turnaround project making good progress
2016
achievements
4
0
20
40
60
80
100
120
140
160
180
200
Oc
t-1
5
No
v-1
5
Dec
-15
Jan
-16
Fe
b-1
6
Ma
r-16
Ap
r-16
Ma
y-1
6
Ju
n-1
6
Ju
l-1
6
Au
g-1
6
Se
p-1
6
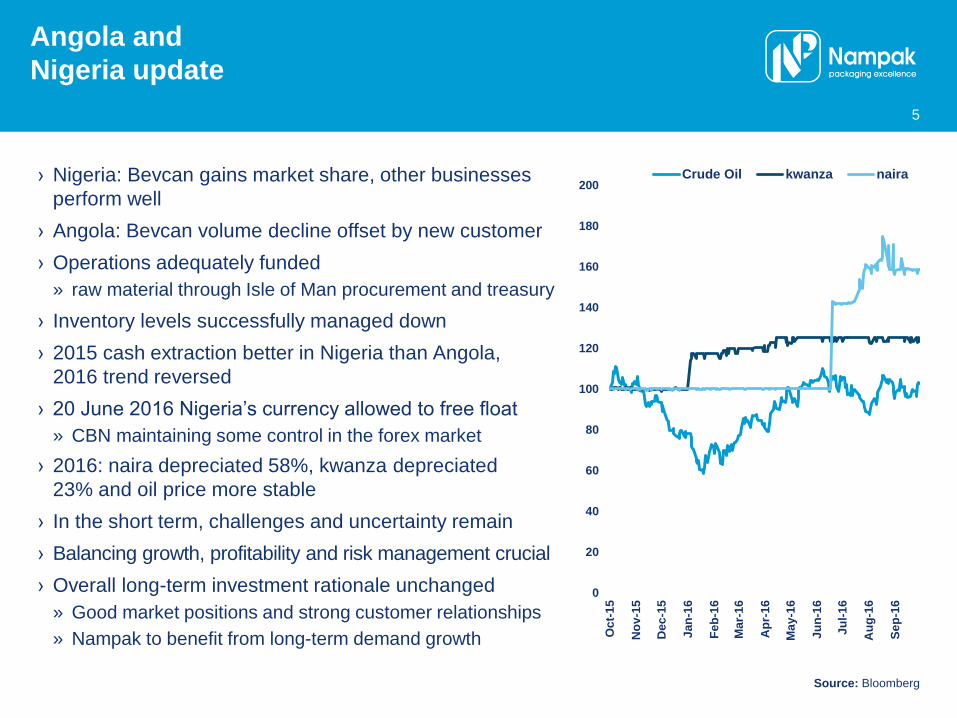
Crude Oil kwanza naira
Angola and
Nigeria update
5
› Nigeria: Bevcan gains market share, other businesses
perform well
› Angola: Bevcan volume decline offset by new customer
› Operations adequately funded
» raw material through Isle of Man procurement and treasury
› Inventory levels successfully managed down
› 2015 cash extraction better in Nigeria than Angola,
2016 trend reversed
› 20 June 2016 Nigeria’s currency allowed to free float
» CBN maintaining some control in the forex market
› 2016: naira depreciated 58%, kwanza depreciated
23% and oil price more stable
› In the short term, challenges and uncertainty remain
› Balancing growth, profitability and risk management crucial
› Overall long-term investment rationale unchanged
» Good market positions and strong customer relationships
» Nampak to benefit from long-term demand growth
Source: Bloomberg
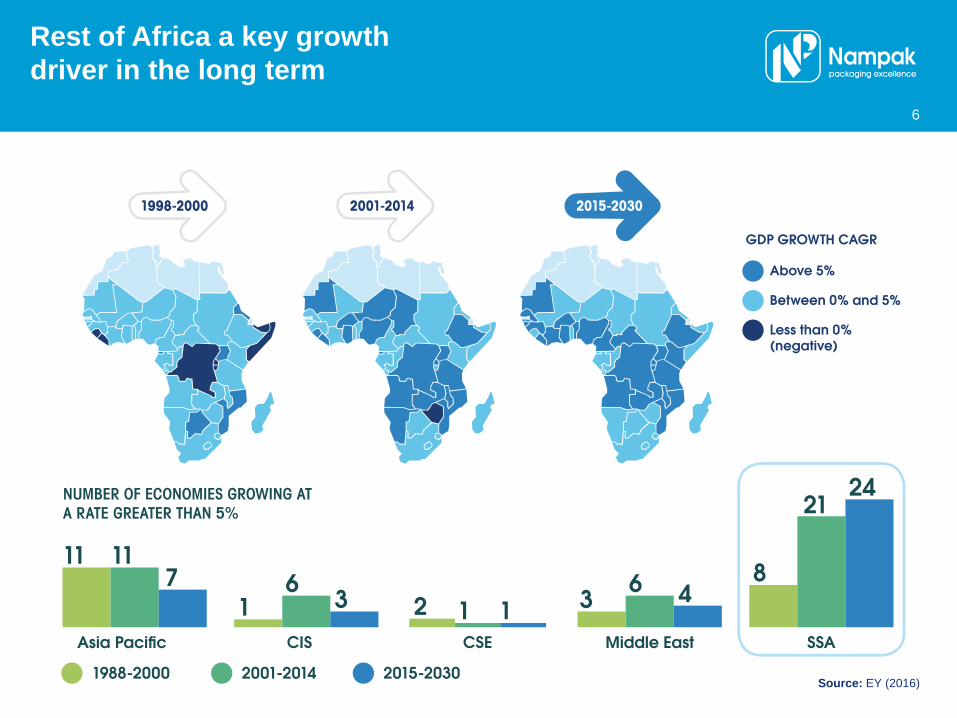
Rest of Africa a key growth
driver in the long term
6
Source: EY (2016)
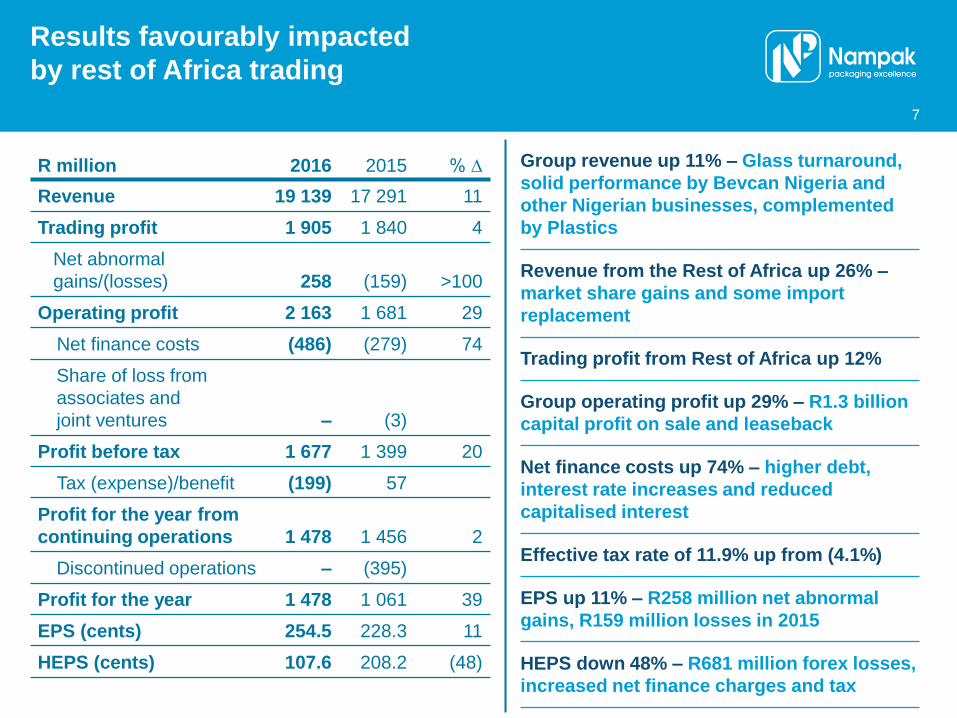
Results favourably impacted
by rest of Africa trading
7
R million 2016 2015 % ∆
Revenue 19 139 17 291 11
Trading profit 1 905 1 840 4
Net abnormal
gains/(losses) 258 (159) >100
Operating profit 2 163 1 681 29
Net finance costs (486) (279) 74
Share of loss from
associates and
joint ventures – (3)
Profit before tax 1 677 1 399 20
Tax (expense)/benefit (199) 57
Profit for the year from
continuing operations 1 478 1 456 2
Discontinued operations – (395)
Profit for the year 1 478 1 061 39
EPS (cents) 254.5 228.3 11
HEPS (cents) 107.6 208.2 (48)
Group revenue up 11% – Glass turnaround,
solid performance by Bevcan Nigeria and
other Nigerian businesses, complemented
by Plastics
Revenue from the Rest of Africa up 26% –
market share gains and some import
replacement
Trading profit from Rest of Africa up 12%
Group operating profit up 29% – R1.3 billion
capital profit on sale and leaseback
Net finance costs up 74% – higher debt,
interest rate increases and reduced
capitalised interest
Effective tax rate of 11.9% up from (4.1%)
EPS up 11% – R258 million net abnormal
gains, R159 million losses in 2015
HEPS down 48% – R681 million forex losses,
increased net finance charges and tax

R million 2016 2015
Trading profit 1 905 1 840
Net abnormal gains/(losses) 258 (159)
Profit on disposal of sale and leaseback properties and other property 1 334 102
Profit on disposal of investments 3 –
Devaluation loss arising from Angolan and Nigerian illiquidity (681) (161)
Impairments (360) (121)
Retrenchment and restructuring costs (34) (77)
Gain on consolidation of Zimbabwe associates – 124
Other (4) (26)
Operating profit 2 163 1 681
Operating profit and trading
profit reconciliation
› R1.3 billion capital profit on sale and leaseback transaction – R1.7 billion received, 1 September 2016
› R681 million forex losses incurred in Nigeria and Angola – currency devaluation and in country
USD shortages
› R278 million impairment relates mainly to Bevcan Angola tinplate line – to be converted to aluminium
8
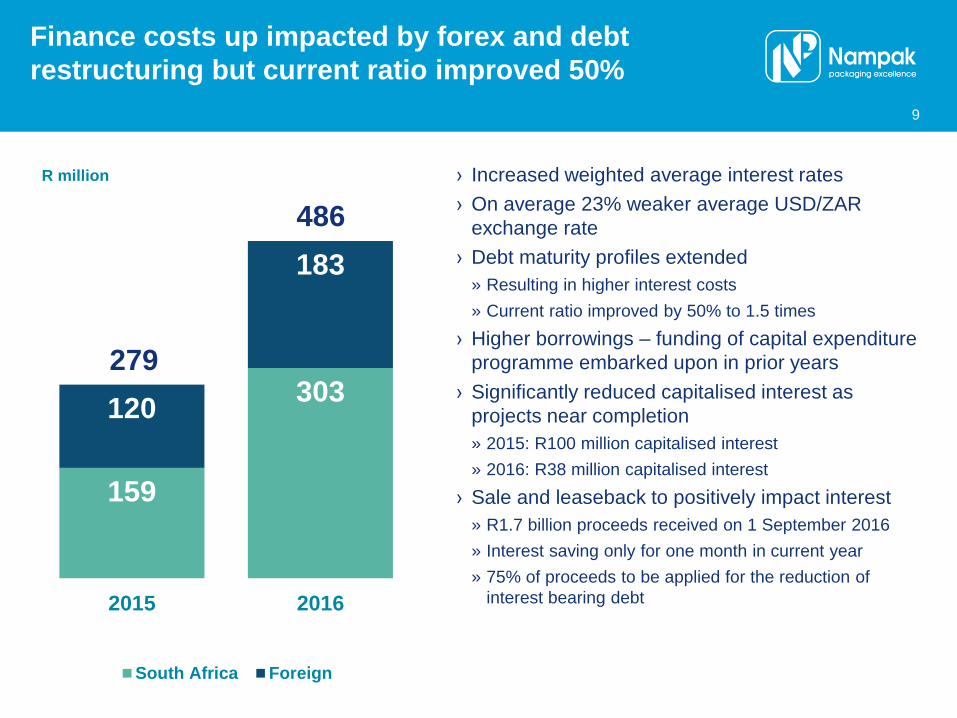
159
303 120
183
2015 2016
R million
South Africa Foreign
279
486
Finance costs up impacted by forex and debt
restructuring but current ratio improved 50%
9
› Increased weighted average interest rates
› On average 23% weaker average USD/ZAR
exchange rate
› Debt maturity profiles extended
» Resulting in higher interest costs
» Current ratio improved by 50% to 1.5 times
› Higher borrowings – funding of capital expenditure
programme embarked upon in prior years
› Significantly reduced capitalised interest as
projects near completion
» 2015: R100 million capitalised interest
» 2016: R38 million capitalised interest
› Sale and leaseback to positively impact interest
» R1.7 billion proceeds received on 1 September 2016
» Interest saving only for one month in current year
» 75% of proceeds to be applied for the reduction of
interest bearing debt
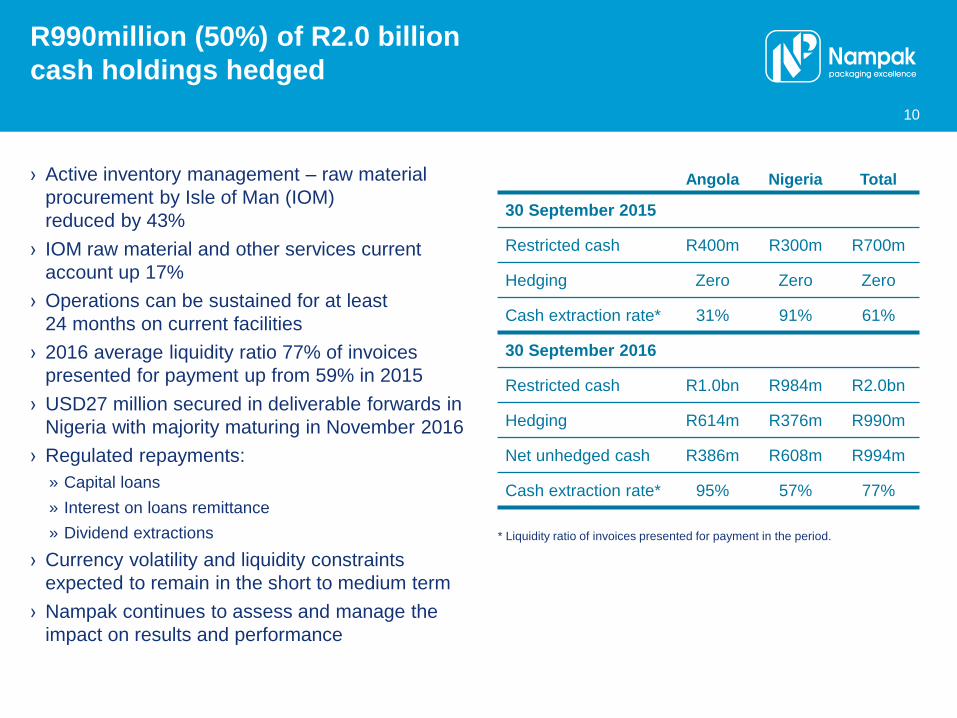
R990million (50%) of R2.0 billion
cash holdings hedged
10
› Active inventory management – raw material
procurement by Isle of Man (IOM)
reduced by 43%
› IOM raw material and other services current
account up 17%
› Operations can be sustained for at least
24 months on current facilities
› 2016 average liquidity ratio 77% of invoices
presented for payment up from 59% in 2015
› USD27 million secured in deliverable forwards in
Nigeria with majority maturing in November 2016
› Regulated repayments:
» Capital loans
» Interest on loans remittance
» Dividend extractions
› Currency volatility and liquidity constraints
expected to remain in the short to medium term
› Nampak continues to assess and manage the
impact on results and performance
Angola Nigeria Total
30 September 2015
Restricted cash R400m R300m R700m
Hedging Zero Zero Zero
Cash extraction rate* 31% 91% 61%
30 September 2016
Restricted cash R1.0bn R984m R2.0bn
Hedging R614m R376m R990m
Net unhedged cash R386m R608m R994m
Cash extraction rate* 95% 57% 77%
* Liquidity ratio of invoices presented for payment in the period.
Prudent approach
to dividend
› Payment of both interim and full year dividend suspended in line with group’s balance
sheet restructuring programme
› Reduction of interest bearing debt and gearing to between 40% – 60%, a key
strategic objective
› Strong cash generation in the Rest of Africa, however, repatriation currently hampered
by in-country USD shortages
› Historic elevated interest bearing debt due to high capex spend, corporate activity
and high dividends over the past five years
› Historic dividend policy of 1.55 times cover with a pay-out ratio of 64.5% of HEPS
not sustainable given change in geographic earnings splits and current restricted
cash holdings
› Future dividends will take into account:
» cash generated in non-cash restricted countries after net interest paid
» replacement capital expenditure requirements
» a 40% pay-out ratio
› Dividend payments expected to resume, if appropriate, in 2017
11
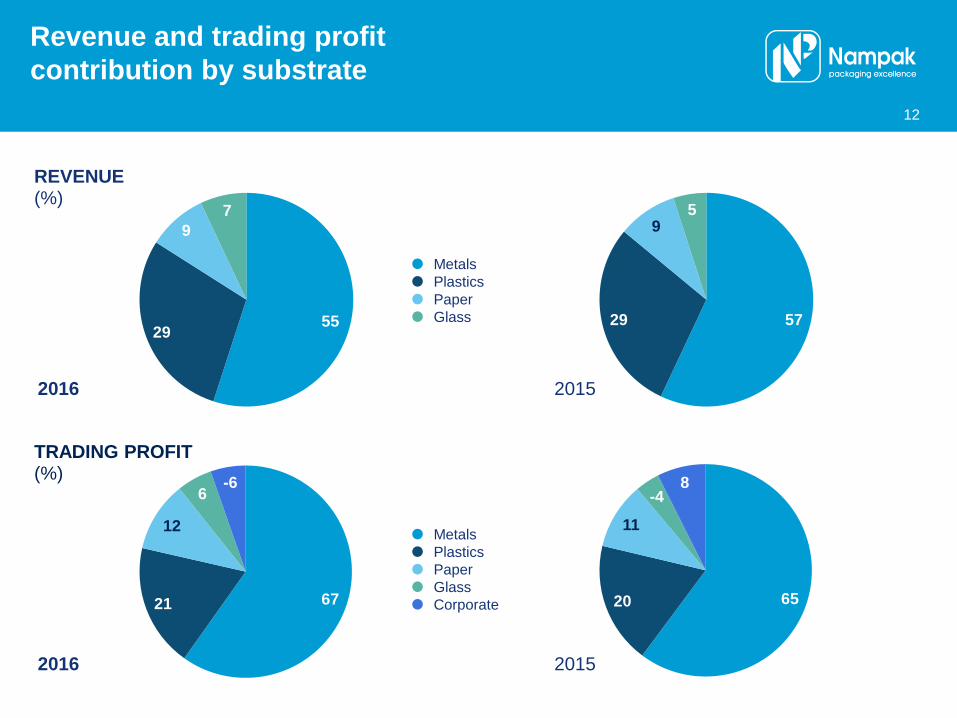
67 21
12
6 -6
TRADING PROFIT (%)
Revenue and trading profit
contribution by substrate
65 20
11
-4 8
57 29
9 5
55 29
9
7
REVENUE (%)
Metals
Plastics
Paper
Glass
Metals
Plastics
Paper
Glass
Corporate
2016 2015
2016 2015
12
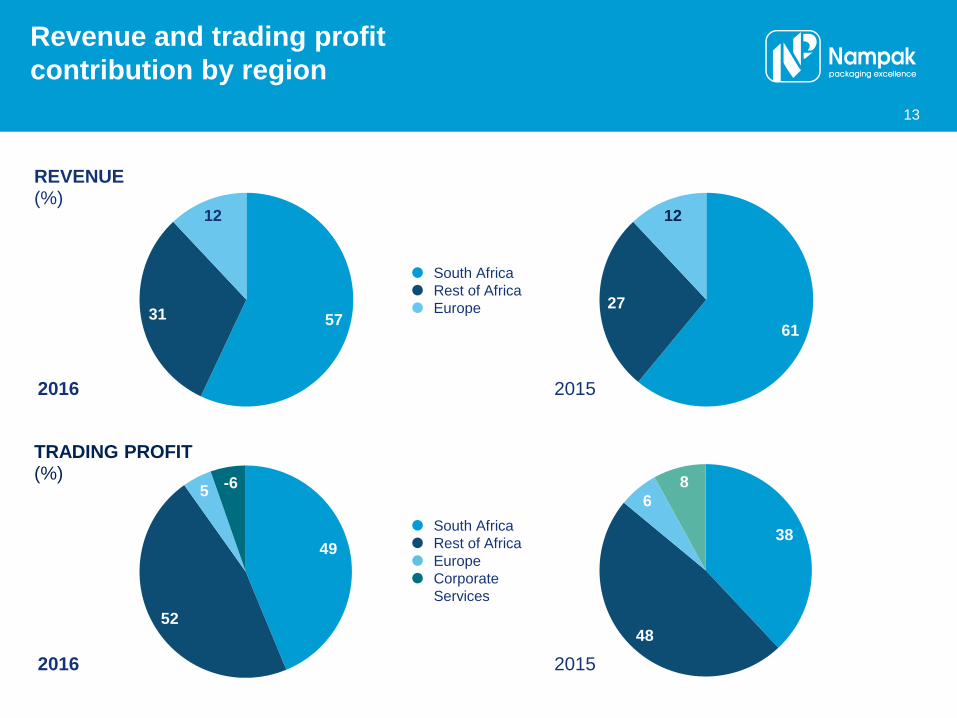
49
52
5 -6
TRADING PROFIT (%)
Revenue and trading profit
contribution by region
38
48
6
8
61
27
12
57 31
12
REVENUE (%)
South Africa
Rest of Africa
Europe
South Africa
Rest of Africa
Europe
Corporate
Services
2016 2015
2016 2015
13
Outlook
› External macroeconomic challenges in key markets expected to prevail in the short term
» Pressure on consumer spending expected to limited volume growth
› Efficiency gains expected to contribute to performance in challenging and uncertain times
» Focus on cost reduction
» Focus on improving cash generation through stringent working capital management
» Leverage latest-generation plant machinery
» Focus on achieving greater plant efficiencies
» Focus on making bottles and cans profitably, while leveraging good partnerships
» Focus on ensuring risks are adequately managed
› Policy and political uncertainty remains a key concern and developments will be
monitored very closely to minimise impact on performance
› Nampak remains optimistic about the long-term outlook in the Rest of Africa
› When macro-economic factors stabilise, Nampak to benefit from long term
demand growth
› The organisation has undergone significant restructuring, most plants operating
efficiently and at world class benchmark rates – optimisation continues
14
Thank you