Embed Size (px)
Citation preview
PECKMAN RIVER BASIN, NEW JERSEY Flood Risk Management Feasibility Study Geotechnical Design Considerations
May 2018
United States Army Corps of Engineers
Peckman River Basin
Geotechnical 2
May 2018
Contents
1.0 Introduction ................................................................................................................................ 3
2.0 Local Geology ............................................................................................................................ 3
3.0 Subsurface Exploration ............................................................................................................. 7
4.0 Local Site Conditions ................................................................................................................ 7
5.0 Geotechnical Analyses .............................................................................................................. 9
5.1 Levees ................................................................................................................................... 10
5.1.1 Seepage Analysis .......................................................................................................... 10
5.1.2 Slope Stability ................................................................................................................ 11
5.1.3 Settlement ....................................................................................................................... 12
5.2 Floodwalls ............................................................................................................................. 12
5.2.1 Stability Analysis ............................................................................................................ 12
5.2.2 Seepage Analysis ........................................................................................................... 14
5.3 Retaining Walls ........................................................................................................................ 14
6.0 Conclusions ............................................................................................................................. 14
7.0 Attachments: ............................................................................................................................ 14
Peckman River Basin
Geotechnical 3
May 2018
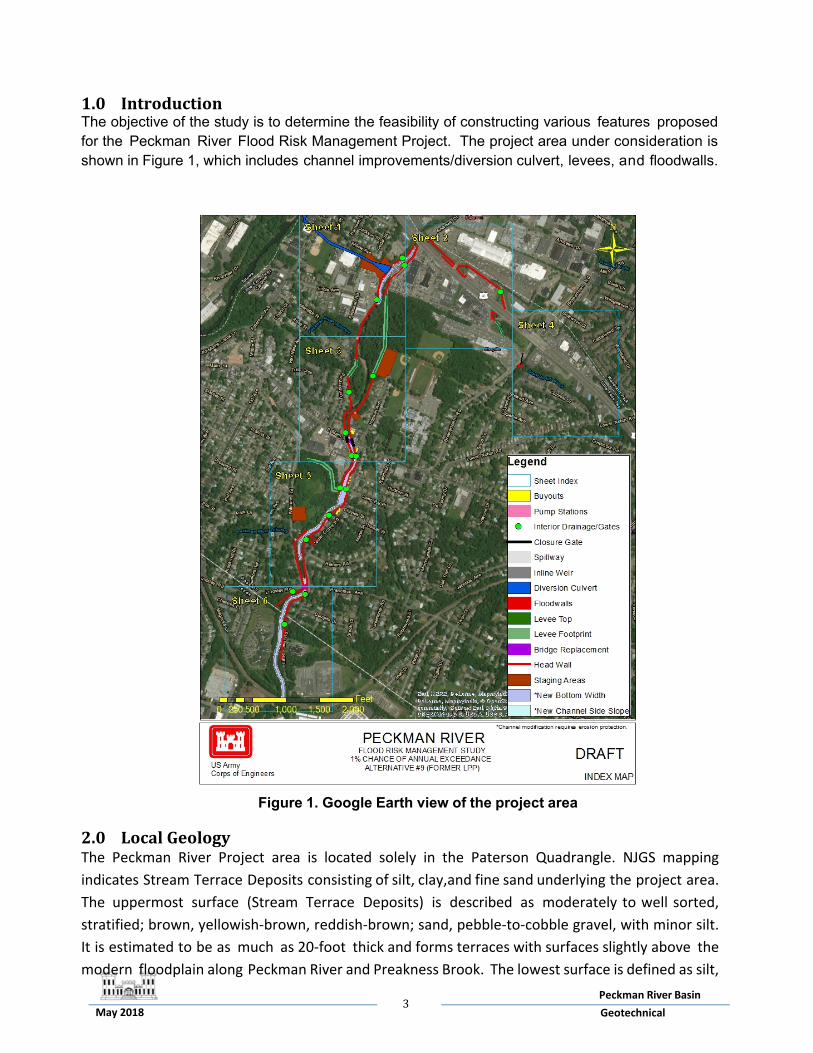
1.0IntroductionThe objective of the study is to determine the feasibility of constructing various features proposed for the Peckman River Flood Risk Management Project. The project area under consideration is shown in Figure 1, which includes channel improvements/diversion culvert, levees, and floodwalls.
Figure 1. Google Earth view of the project area
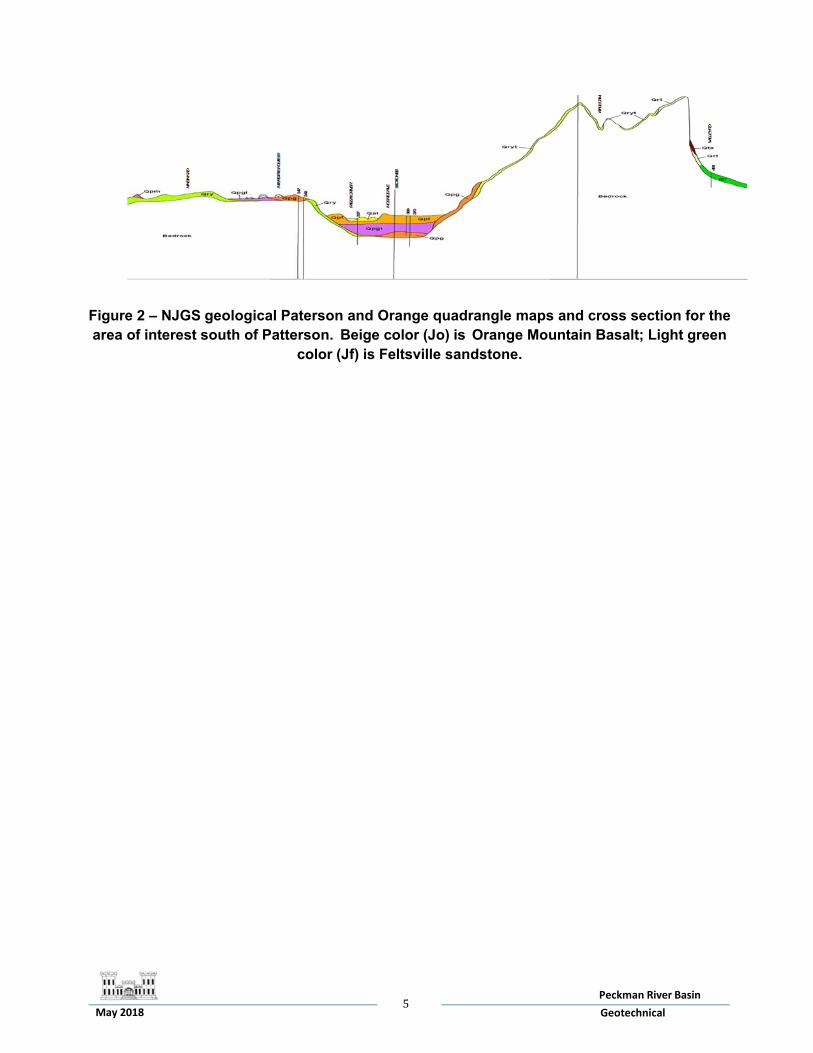
2.0LocalGeologyThe Peckman River Project area is located solely in the Paterson Quadrangle. NJGS mapping
indicates Stream Terrace Deposits consisting of silt, clay,and fine sand underlying the project area.
The uppermost surface (Stream Terrace Deposits) is described as moderately to well sorted,
stratified; brown, yellowish‐brown, reddish‐brown; sand, pebble‐to‐cobble gravel, with minor silt.
It is estimated to be as much as 20‐foot thick and forms terraces with surfaces slightly above the
modern floodplain along Peckman River and Preakness Brook. The lowest surface is defined as silt,
Peckman River Basin
Geotechnical 4
May 2018
clay, and/or fine sand up to 50‐foot in thickness deposited on the lake bottom during the Great
Notch Stage. Although the majority of the project area possesses the previous properties, the far
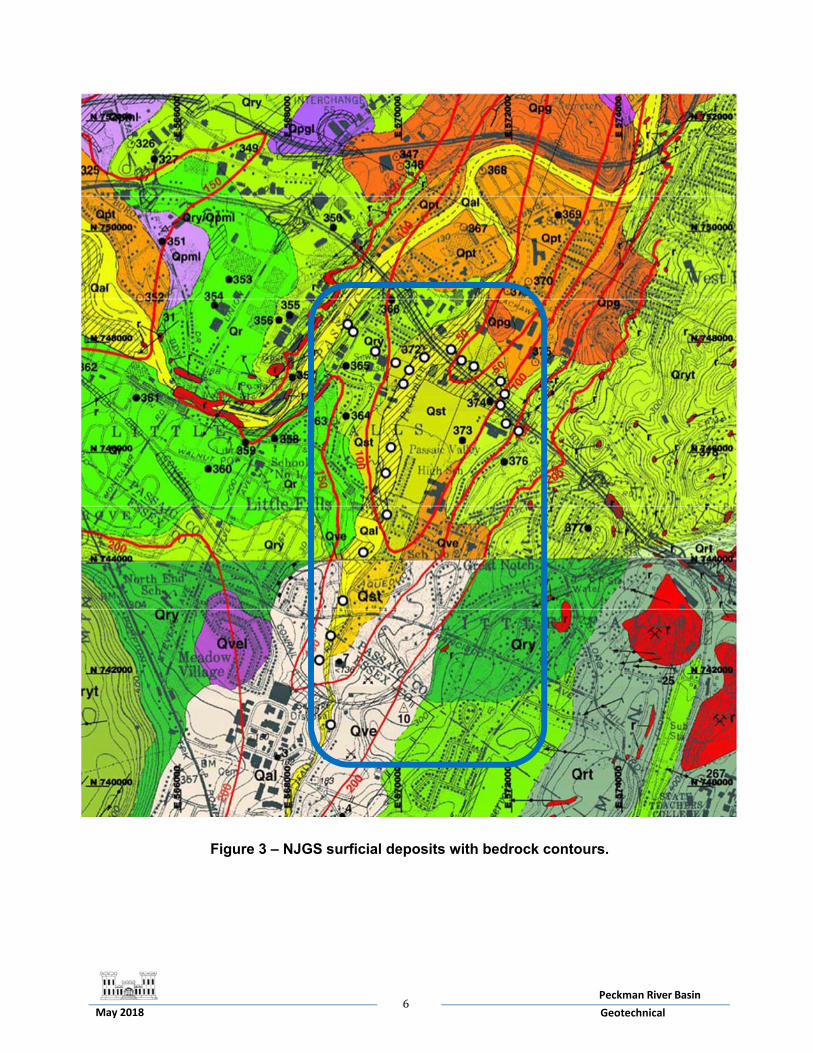
eastern and western portions indicate two different soil types. The eastern edge is identified as
Rahway Till, Yellow Phase, although it is discontinuous and generally less than 20‐foot thick. This
Till is described as silty sand, sandy silt, and silt with some to many subangular and subrounded
pebbles and cobbles. Along the western project section the same soil properties are encountered
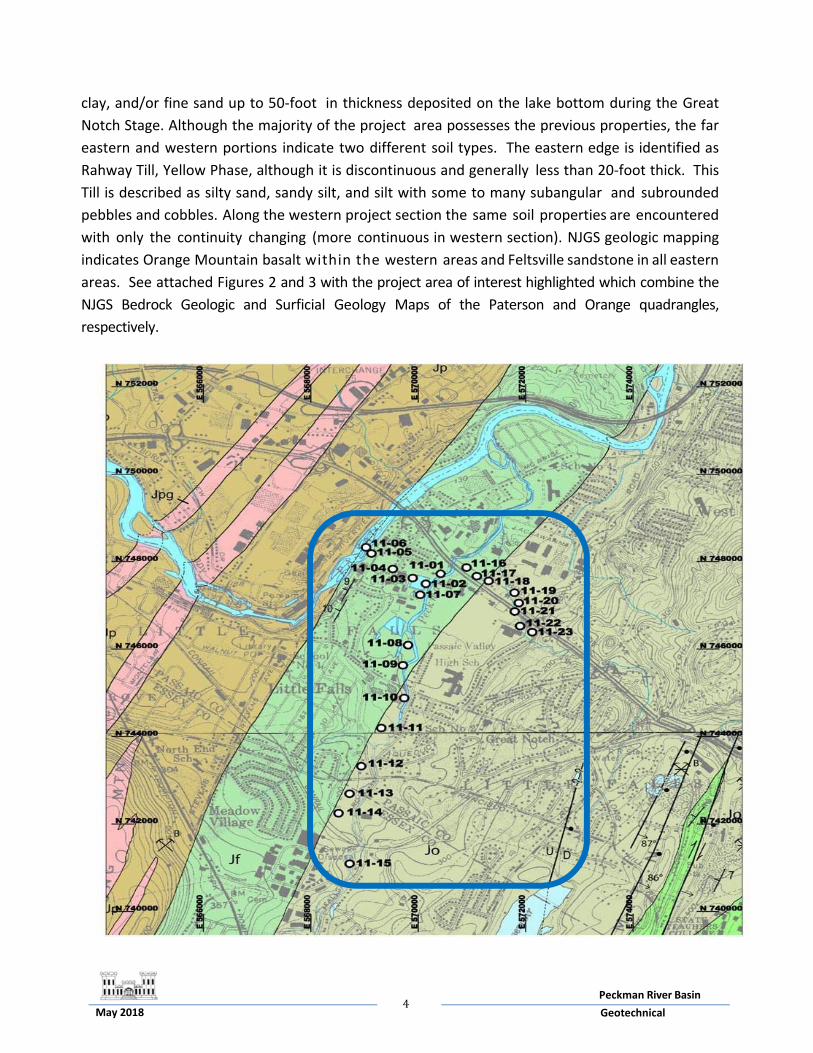
with only the continuity changing (more continuous in western section). NJGS geologic mapping
indicates Orange Mountain basalt within the western areas and Feltsville sandstone in all eastern
areas. See attached Figures 2 and 3 with the project area of interest highlighted which combine the
NJGS Bedrock Geologic and Surficial Geology Maps of the Paterson and Orange quadrangles,
respectively.
Peckman River Basin
Geotechnical 5
May 2018
Figure 2 – NJGS geological Paterson and Orange quadrangle maps and cross section for the area of interest south of Patterson. Beige color (Jo) is Orange Mountain Basalt; Light green
color (Jf) is Feltsville sandstone.
Peckman River Basin
Geotechnical 6
May 2018
Figure 3 – NJGS surficial deposits with bedrock contours.
Peckman River Basin
Geotechnical 7
May 2018
3.0SubsurfaceExplorationA geotechnical investigation was performed for USACE by e4sciences | Earthworks, LLC in January 2012. The work was performed under IDC#204, Contract #W912DS-09-D-0001, Task Order #0026 and included a total of twenty-three (23) geotechnical borings drilled along the Peckman River Basin in New Jersey. Twenty‐one borings were completed in Little Falls, Passaic County while two borings were drilled in Cedar Grove, Essex County. Borings were drilled using the Standard Penetration Methods and Procedures. All SPT borings were drilled following ASTM standard D1586 with two modifications as follows:
‐Blows per 6 inches were allowed to reach 100 blows. ‐A 300 lb sampler was used upon refusal to advance the sample when it was determined that the refusal was due to cobbles. As per Standard Penetration Methods and Procedures: ‐A 140 lb hammer with a 30 inch drop was used to advance a 1 3/8 inch diameter split spoon sampler for drilling. ‐When cohesive soils were present, a 3 inch diameter undisturbed piston tube was used. ‐Any rocks or boulders that were encountered were cut with a NX size core. ‐All soil sampling was continuous to a depth of 10 foot, then every five foot of depth
thereafter.
4.0LocalSiteConditionsThe borings indicate that surficial soils, fill and recent river alluvium overlie glacial deposits that are underlain by bedrock. These deposits are broken down into seven stratigraphic units as follows:
a) Organic soil and silt: The soil and silt encountered is brown organic silt/soil, with
trace sand, grass and roots. Boring PRB-11-08 in the Peckman River channel did not encounter this organic layer. Boring PRB-11-10, drilled through East Main street, did not encounter this layer below the ~one-foot layer of asphalt concrete (AC). N-values for the organic layer trended near 20. The thickness of these materials ranged from 0-foot to four-foot.
b) Fill: Light brown, gray, or red in color, the fill encountered was a mix of silt, sand,
and gravel with trace organic material. Fill material is native to the area and consists of reworked till, sands and gravels. Manmade materials such as glass, plastic, concrete, and asphalt are present in this unit. Fill was observed at all but two borings, PRB-11-08 and PRB-11-23. The uncorrected N-values of the fill ranged from three to 105 depending on the clast size and concentration. The thickness of fill ranged from 0-foot to 18-foot.
c) Till: Red-brown silty sand and gravel, with varying amounts of clay was
encountered in the subsurface investigation. Basalt and sandstone clasts supported by the silty sand matrix include pebbles, cobbles and boulders. Till was recorded at all but three locations, PRB-11-9B, PRB-11-14, and PRB-11-18. The uncorrected N-values of the till ranged from 16 to 200 depending on the clast size, shape and concentration. The thickness of till ranged from 0-foot to >20-foot.
Peckman River Basin
Geotechnical 8
May 2018
d) Sands and gravels: Sands and gravel units encountered were well sorted fluvial
deposits. The uncorrected N-values of the materials ranged from 0 to 134. This unit was encountered at borings PRB- 11-03, PRB-11-08, PRB-11-9B, PRB-11-11, PRB-11-13, and PRB-11-14. The thickness of these materials ranged from 0-foot to 10-foot.
e) Varved sand silt and clay: Red-brown silt, clay, or very fine sand. Clay composition
and cohesive strength of the varved layers varied. Uncorrected N-values ranged between 10 and 132 in these deposits. At boring PRB-11-08 sand, varved clay and silt alternates with sand layers below 13.0 feet. Varved silt and clay deposits were present in 14 of the 23 borings. In 12 of the borings, the varved deposit continued below the limit of the boring depth. The thickness of these materials ranged from 0-foot to 15.3 -foot.
f) Sandstone bedrock: The red/maroon micaceous Jurassic sandstone encountered
is of the Feltville formation. Clasts of this material were encountered in the till and fill deposits. 5 foot rock core runs were advanced in Borings PRB-11-05 and PRB-11-06. The cores revealed intact Feltville sandstone. Coring rates in this formation averaged two minutes per foot. Rock Quality Designation (RQD) of the core retrieved was 33 and 14, respectively, indicating a rock quality rating of poor to very poor in the upper five feet of bedrock.
g) Basalt bedrock: Orange Mountain Basalt is a dark gray to black Jurassic basalt with
Calcite filled vugs. Clasts of this material were encountered in the till and fill deposits. Contact metamorphosed surfaces indicate pillow boundaries. The five foot rock core in PRB-11-23 indicated Orange Mountain Basalt. The coring rate averaged seven minutes per foot with an RQD of 18 indicating a rock quality rating of very poor for the top feet of rock. Basalt was encountered in only one of the borings advanced in the project vicinity.
Laboratory tests included the following: grain size analysis via the hydrometer analysis,
moisture content, specific gravity, Atterberg limits, triaxial testing (when plastic soils were encountered), consolidated‐undrained triaxial compression tests with pore water measurements, unconfined compression strength tests, and density of rock samples. Three of the borings recovered rock cores for testing.
The results of the laboratory tests generally classified the encountered materials into the
following: Fill Materials: The fill materials include sand, gravel and rock fragments with varying
amounts of silt and clay. USCS classifications include GP, GW, GM and SP. Although no transmissivity testing was conducted on the samples retrieved, grain size analyses were conducted. Samples were noted to have 5 to 25 percent passing the #200 sieve; as a result, the soil deposit is considered to be porous.
River & Till Deposits: River deposits have been identified throughout the project. These
deposits are predominantly sand and silt, and have been classified as SP or SW. Most of the till deposits have fines less than 10 percent. These materials are also considered to be porous and pervious.
Peckman River Basin
Geotechnical 9
May 2018
Varved Clay and Silt Deposits: The varved clay and silt deposits include fines (silts and clays) inter-bedded with fine sand. Due to the amount of fine-grained particles the varved clay and silt may be considered relatively impermeable and therefore be suitable for a cutoff barrier.
Bedrock: The bedrock underlying the site consists of sandstone and basalt. Bedrock was
encountered at depths of 11.0, 17.5 to 18.5 feet in three borings. In the remaining 20 borings, no bedrock was encountered.
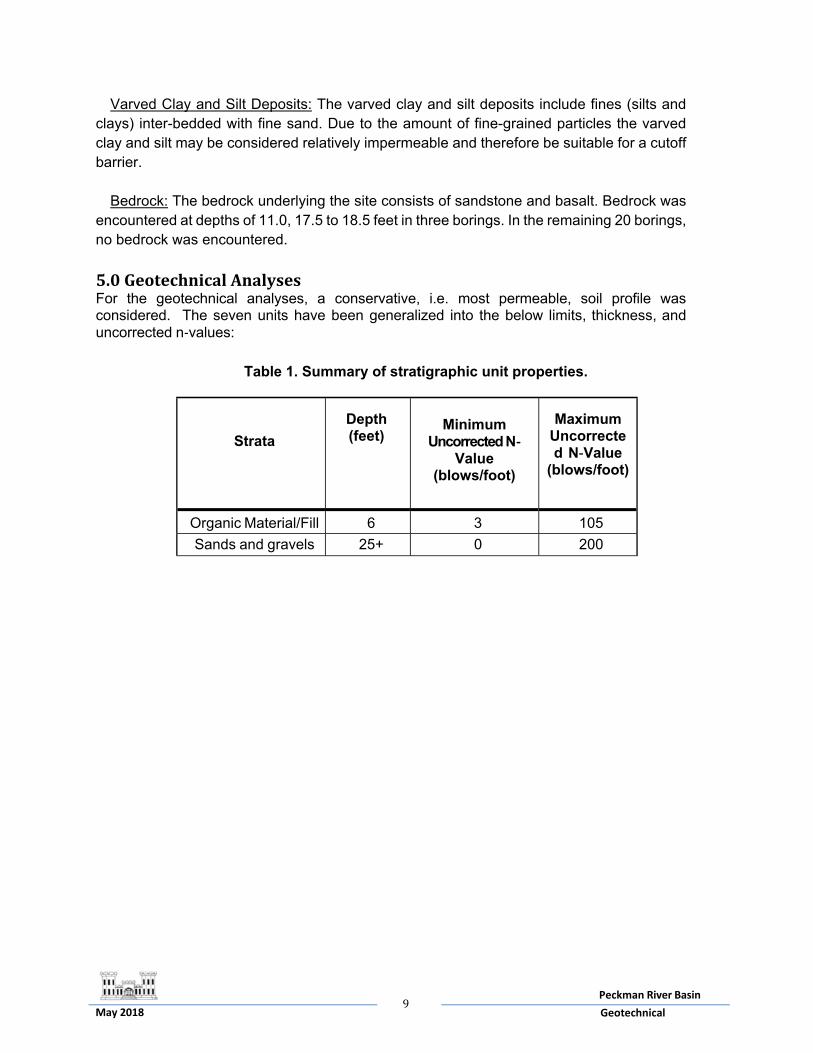
5.0GeotechnicalAnalysesFor the geotechnical analyses, a conservative, i.e. most permeable, soil profile was considered. The seven units have been generalized into the below limits, thickness, and uncorrected n‐values:
Table 1. Summary of stratigraphic unit properties.
Strata
Depth (feet)
Minimum
Uncorrected N‐Value
(blows/foot)
Maximum Uncorrected N‐Value
(blows/foot)
Organic Material/Fill 6 3 105
Sands and gravels 25+ 0 200
Peckman River Basin
Geotechnical 10
May 2018
5.1Levees 5.1.1SeepageAnalysisGeotechnical design parameters were based on the available existing field and laboratory test data obtained from the geotechnical investigation. Embankment materials would likely be comprised of imported silty and/or clayey soil (USCS Type ML/CL) for the impervious core and silty sands (USCS Type SM) for the levee fill materials (embankment shell). The materials would be specified to ensure that they conform to the assumed properties used during design. Fill would be specified to be placed in lifts and be compacted in maximum 12-inch thick loose lifts compacted to 95 percent maximum density, in accordance with Modified Proctor test procedures ASTM D-1557. For embankment construction, it is recommended that the fill be placed two percent above its optimum moisture content.
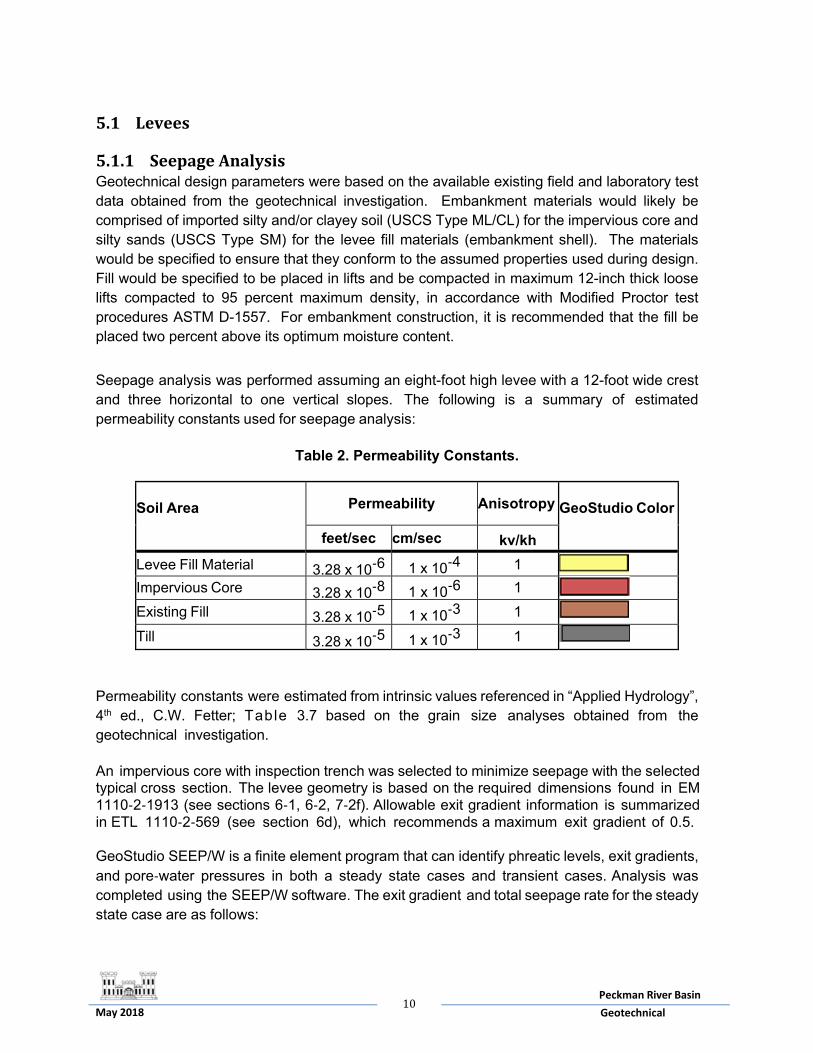
Seepage analysis was performed assuming an eight-foot high levee with a 12-foot wide crest and three horizontal to one vertical slopes. The following is a summary of estimated permeability constants used for seepage analysis:
Table 2. Permeability Constants.
Soil Area Permeability Anisotropy
GeoStudio Color
feet/sec cm/sec kv/kh
Levee Fill Material 3.28 x 10‐6 1 x 10‐4 1 Impervious Core 3.28 x 10‐8 1 x 10‐6 1
Existing Fill 3.28 x 10‐5 1 x 10‐3 1
Till 3.28 x 10‐5 1 x 10‐3 1
Permeability constants were estimated from intrinsic values referenced in “Applied Hydrology”, 4th ed., C.W. Fetter; Table 3.7 based on the grain size analyses obtained from the geotechnical investigation. An impervious core with inspection trench was selected to minimize seepage with the selected typical cross section. The levee geometry is based on the required dimensions found in EM 1110‐2‐1913 (see sections 6‐1, 6‐2, 7‐2f). Allowable exit gradient information is summarized in ETL 1110‐2‐569 (see section 6d), which recommends a maximum exit gradient of 0.5. GeoStudio SEEP/W is a finite element program that can identify phreatic levels, exit gradients, and pore‐water pressures in both a steady state cases and transient cases. Analysis was completed using the SEEP/W software. The exit gradient and total seepage rate for the steady state case are as follows:
Peckman River Basin
Geotechnical 11
May 2018
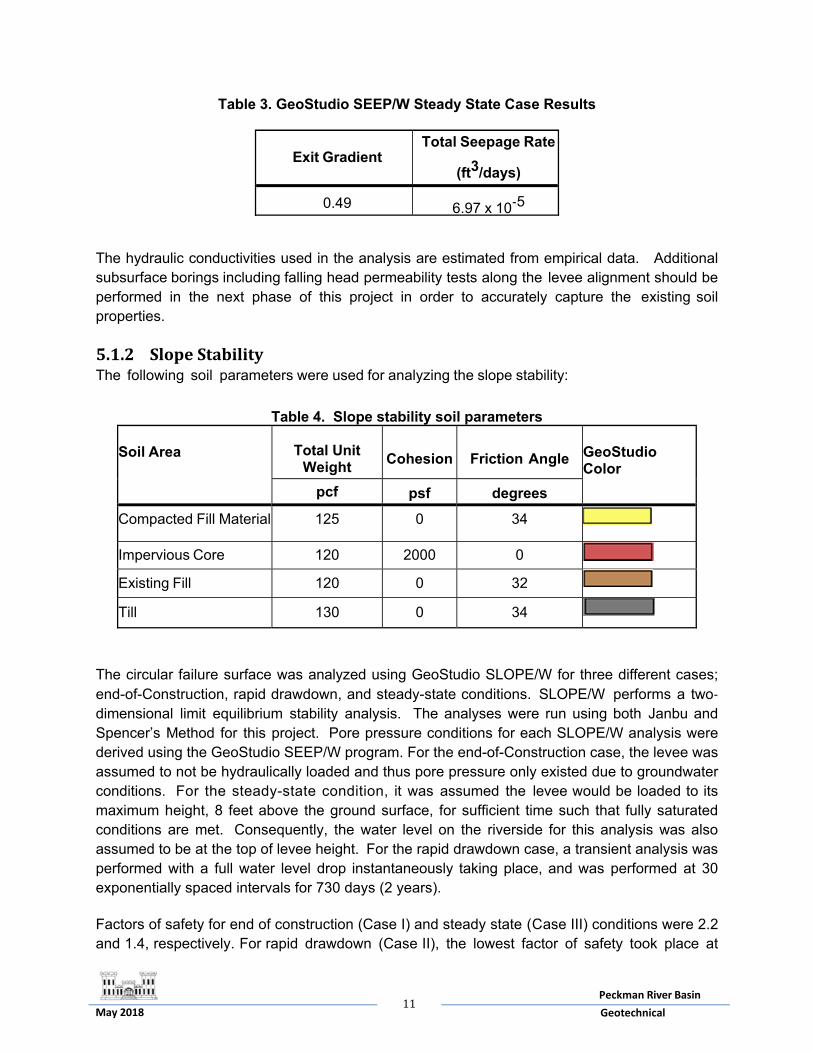
Table 3. GeoStudio SEEP/W Steady State Case Results
Exit Gradient
Total Seepage Rate
(ft3/days)
0.49 6.97 x 10‐5
The hydraulic conductivities used in the analysis are estimated from empirical data. Additional subsurface borings including falling head permeability tests along the levee alignment should be performed in the next phase of this project in order to accurately capture the existing soil properties. 5.1.2SlopeStabilityThe following soil parameters were used for analyzing the slope stability:
Table 4. Slope stability soil parameters
Soil Area Total Unit
Weight Cohesion Friction Angle
GeoStudio Color
pcf psf degrees
Compacted Fill Material 125 0 34
Impervious Core 120 2000 0
Existing Fill 120 0 32
Till 130 0 34
The circular failure surface was analyzed using GeoStudio SLOPE/W for three different cases; end-of-Construction, rapid drawdown, and steady-state conditions. SLOPE/W performs a two‐dimensional limit equilibrium stability analysis. The analyses were run using both Janbu and Spencer’s Method for this project. Pore pressure conditions for each SLOPE/W analysis were derived using the GeoStudio SEEP/W program. For the end-of-Construction case, the levee was assumed to not be hydraulically loaded and thus pore pressure only existed due to groundwater conditions. For the steady-state condition, it was assumed the levee would be loaded to its maximum height, 8 feet above the ground surface, for sufficient time such that fully saturated conditions are met. Consequently, the water level on the riverside for this analysis was also assumed to be at the top of levee height. For the rapid drawdown case, a transient analysis was performed with a full water level drop instantaneously taking place, and was performed at 30 exponentially spaced intervals for 730 days (2 years). Factors of safety for end of construction (Case I) and steady state (Case III) conditions were 2.2 and 1.4, respectively. For rapid drawdown (Case II), the lowest factor of safety took place at
Peckman River Basin
Geotechnical 12
May 2018
the first time interval (44 min), and was calculated as 1.9. 5.1.3SettlementThe borings indicate that the surficial soils are comprised of fill and recent river sediments over glacial deposits that overlie bedrock. The average depth of fill is approximately five-foot throughout the project area, with the exception of one boring where the fill extended to a depth of 18 feet. The fill materials consist primarily of reworked sand and till deposits with fragments of manmade materials. The fill materials include sand, gravel and rock fragments with varying amounts of silt and clay. USCS classifications include GP, GW, GM and SP. Uncorrected N-values range from 10 to 100 blows per foot and indicate that this soil deposit may be used to support the proposed embankments or flood walls providing the deposit is compacted or reworked to achieve the required design strength. In areas where the blow counts are reported to be less than 10 blows per foot, additional investigations or specialized construction activities may be warranted. As this condition is limited in area, the fill deposits are not anticipated to have a significant design or construction impact to the project. The natural deposits underlying the fill are generally medium dense to stiff inconsistency. Settlement calculations were not performed for the proposed levee geometry as part of the feasibility study as the encountered subsurface conditions are not anticipated to impact the feasibility and or cost of implementing the proposed project. However, settlement analyses will be performed during the design phase. It should be understood that localized conditions may require soil replacement, soil stabilization, or other foundation ground improvement methods. 5.2 Floodwalls Where an earthen levee is cost prohibitive, floodwalls are used to provide flood risk management. The type of floodwall used at a particular site depends on its projection above grade, soil conditions which impact the foundation design and space limitations. Only T‐walls were evaluated for preliminary cost purposes. Alternative wall options may need to be considered and evaluated due to space limitations, etc. depending on final layout.
5.2.1 Stability Analysis The following assumptions were utilized in the wall stability analysis:
Basic Data and Assumptions (parameters will need to be refined in the next phase
using boring information available near specific floodwall locations): o Soil Friction Angle = 34 degrees o Soil Cohesion = 0 o Soil Unit Weight (drained) = 125 pcf o Water Weight = 62.4 pcf o Surcharge, earthquake , and wind loads not considered in this phase o Minimum protective earth cover of 3 ft used for frost protection
Stability Analysis o CTWALL-R was used to run analysis and the results of Overturning, Sliding
and Bearing Capacity of each floodwall system can be found in Table 1.
o Calculations correspond to the Design Case I2 for inland floodwalls which requires loading to top of wall. However, the minimum factors of safety shown on the CTWALL-R outputs correspond to the Design Case I1 which are more conservative.
Peckman River Basin
Geotechnical 13
May 2018
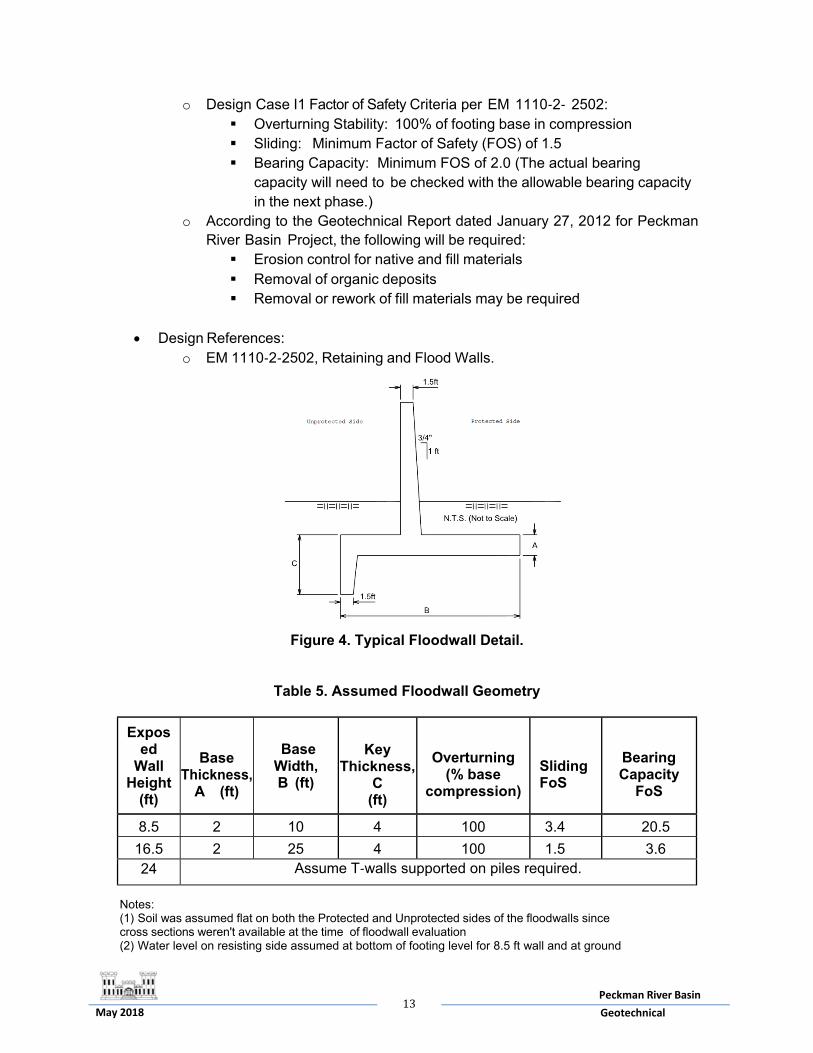
o Design Case I1 Factor of Safety Criteria per EM 1110‐2‐ 2502: Overturning Stability: 100% of footing base in compression Sliding: Minimum Factor of Safety (FOS) of 1.5 Bearing Capacity: Minimum FOS of 2.0 (The actual bearing
capacity will need to be checked with the allowable bearing capacity in the next phase.)
o According to the Geotechnical Report dated January 27, 2012 for Peckman River Basin Project, the following will be required: Erosion control for native and fill materials Removal of organic deposits Removal or rework of fill materials may be required
Design References: o EM 1110‐2‐2502, Retaining and Flood Walls.
Figure 4. Typical Floodwall Detail.
Table 5. Assumed Floodwall Geometry
Exposed
Wall Height
(ft)
Base
Thickness, A (ft)
Base Width, B (ft)
Key
Thickness, C
(ft)
Overturning
(% base compression)
Sliding FoS
Bearing Capacity
FoS
8.5 2 10 4 100 3.4 20.5
16.5 2 25 4 100 1.5 3.6 24 Assume T‐walls supported on piles required.
Notes: (1) Soil was assumed flat on both the Protected and Unprotected sides of the floodwalls since cross sections weren't available at the time of floodwall evaluation (2) Water level on resisting side assumed at bottom of footing level for 8.5 ft wall and at ground
Peckman River Basin
Geotechnical 14
May 2018
surface for 16.5 ft wall. (3) Wall types and distance from the CL of the River may vary and/or change once wall alignment has been determined in the next phase. Due to space restrictions, where T‐walls cannot be accommodated, composite wall system may need to be evaluated (4) Wall cross‐sections are only a representation for preliminary cost estimation purposes. (5) No updated site conditions and utility surveys at the time of evaluation.
5.2.2SeepageAnalysis The exit gradients and flow quantities were analyzed for the wall geometries assumed in Table 5. The maximum exit gradients are listed below:
Table 6. Exit Gradients data.
Floodwall Water Height
(ft)
Exit Gradient Total Seepage Rate
(ft3/days)
8 0.22 1.5 x 10‐4
16 0.44 3.05 x 10‐4 Based on the preliminary results, more robust cutoff walls such as driven sheet piles embedded into the concrete T-wall sections does not appear warranted.
5.3RetainingWallsRetaining walls may be required where grading may take place in areas adjacent to channelization limits that will not be improved with levees or floodwalls. Only T‐walls were evaluated for preliminary cost purposes.
6.0ConclusionsThe information provided in this report is for conceptual purposes only and details and assumptions provided are subject to change. Further evaluation/analysis and information (including, but not limited to, additional borings, field tests, laboratory tests, surveys) will be required in future phases in order to refine feature designs, layout and cost estimates. 7.0Attachments: Geotechnical Calculations GeoStudio Figures Figure 1 - Levee Seepage – Case III: Steady State Figure 2 - Slope Stability – Case I: End of Construction Figure 3 - Slope Stability – Case II: Rapid Drawdown Figure 4 - Slope Stability – Case III: Steady State Figure 5 - 8 ft Floodwall Seepage – Case III: Steady State Figure 6 - 16 ft Floodwall Seepage – Case III: Steady State Flood Wall Stability Calculation CTWALL-R Output – Eight-foot Floodwall CTWALL-R Output – 16-foot Floodwall

Peckman River Basin
Geotechnical 15
May 2018
Geotechnical and HTRW Investigations for Peckman River Basin Project, New Jersey, dated January 27, 2012.

GeoStudio Figures
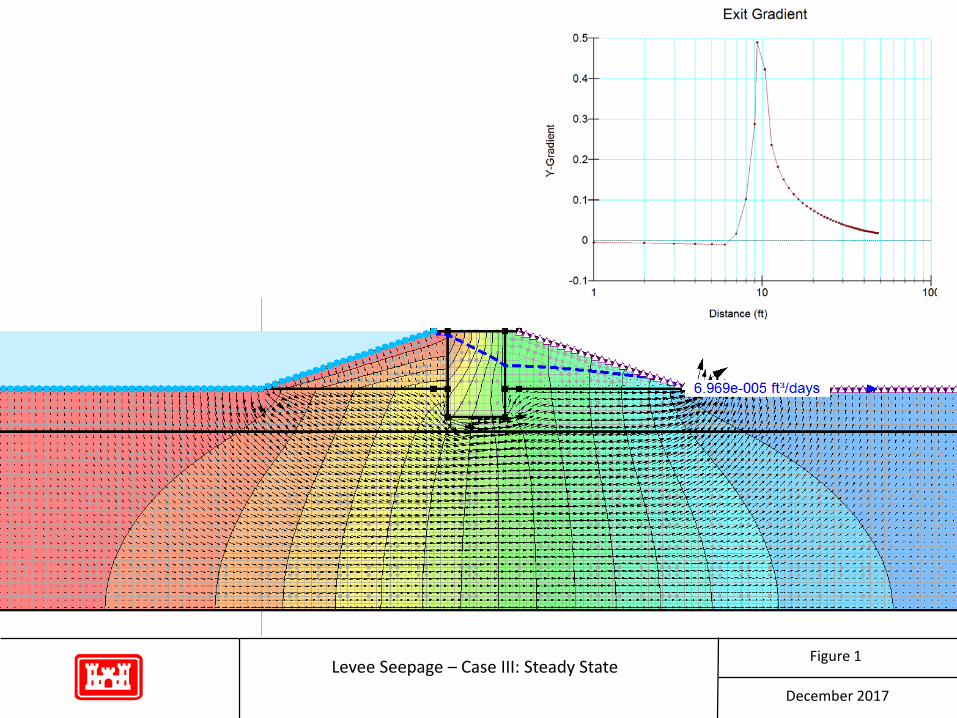
Levee Seepage – Case III: Steady StateDecember 2017
Figure 1
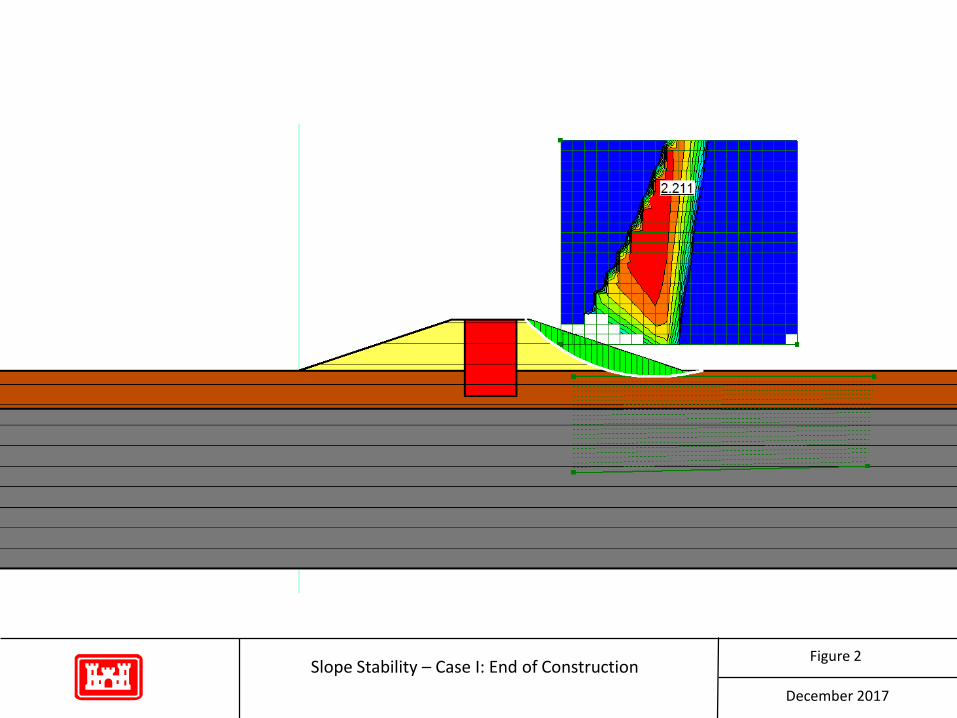
Slope Stability – Case I: End of ConstructionDecember 2017
Figure 2
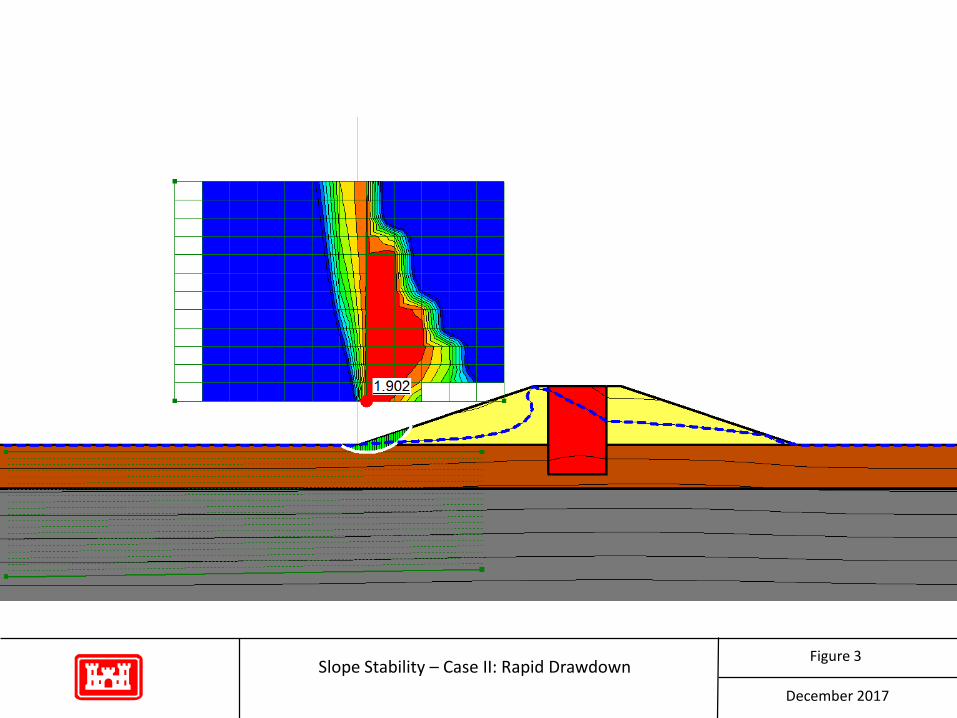
Slope Stability – Case II: Rapid Drawdown December 2017
Figure 3
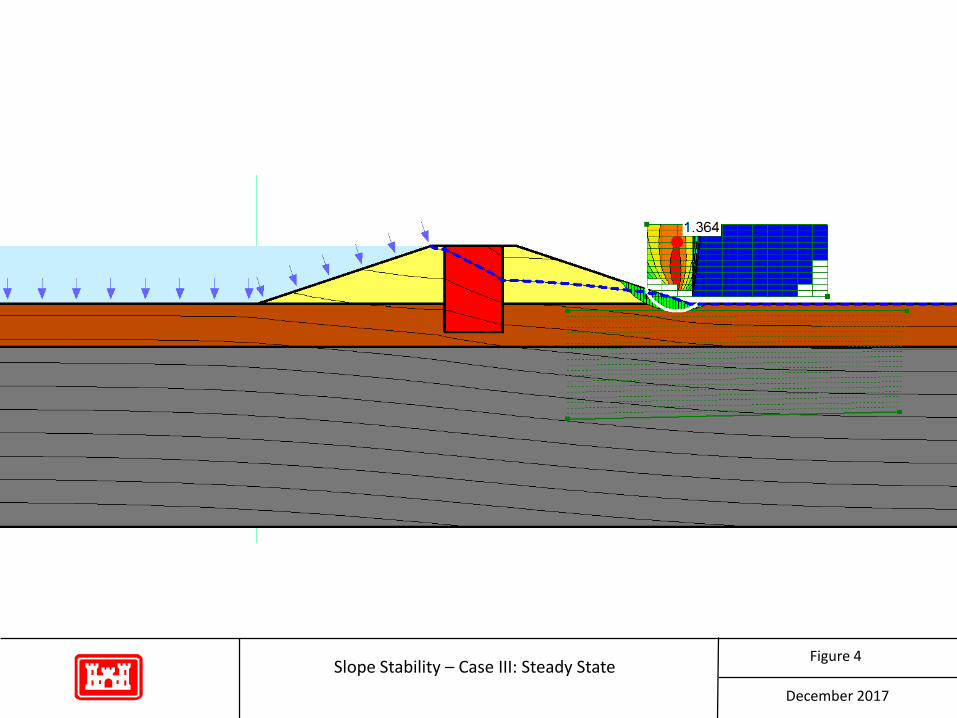
Slope Stability – Case III: Steady StateDecember 2017
Figure 4
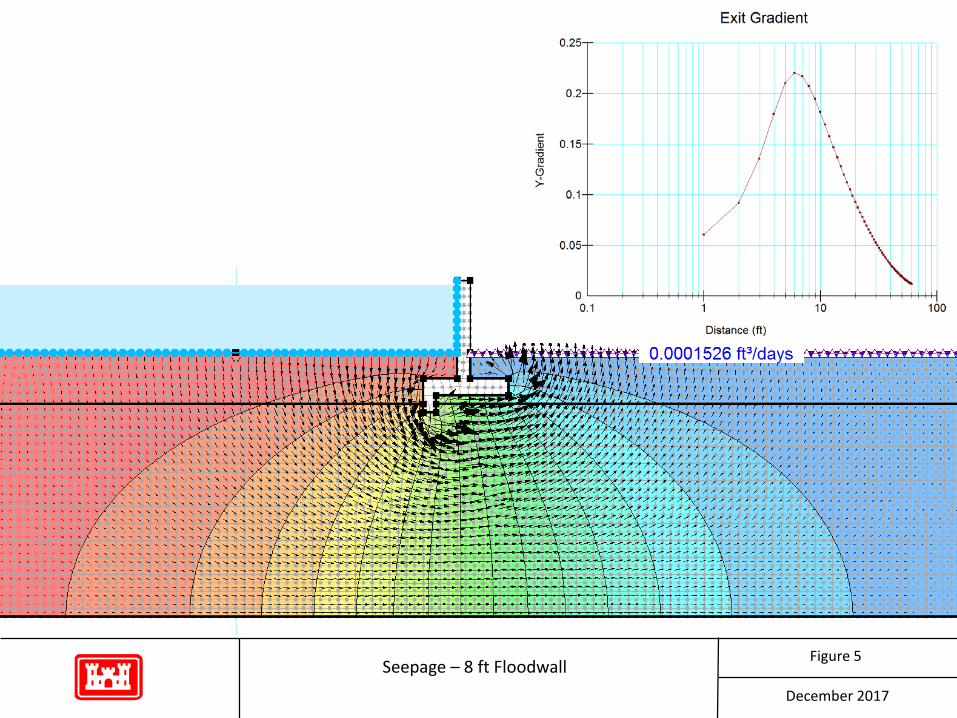
Seepage – 8 ft FloodwallDecember 2017
Figure 5
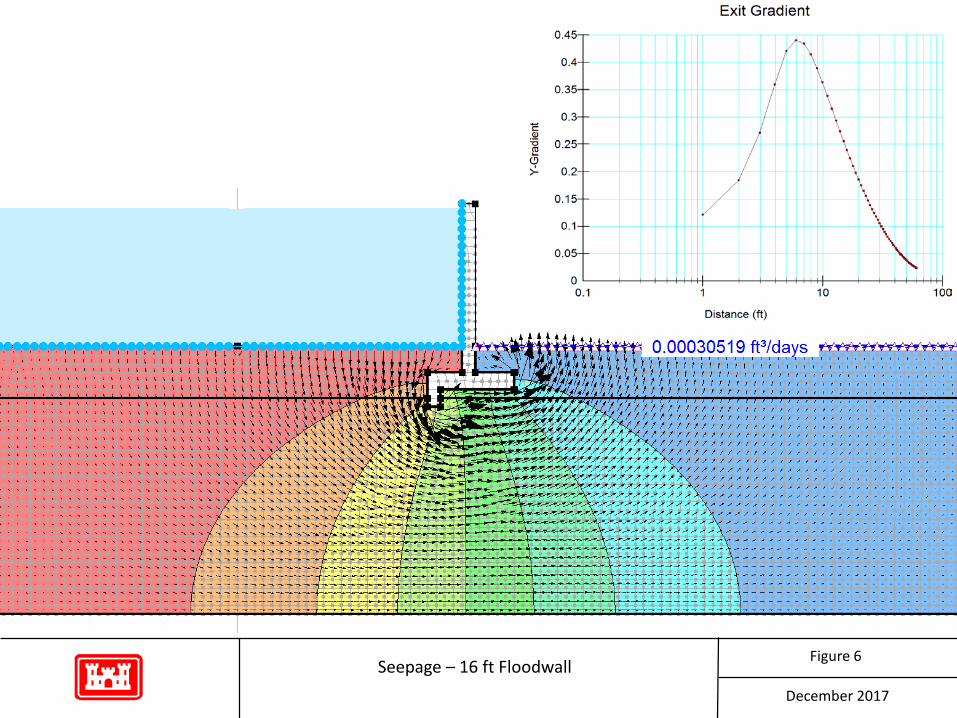
Seepage – 16 ft FloodwallDecember 2017
Figure 6
Floodwall Stability Calculations
Peckman Feasibility 8 ft Wall Results.out.txt[12/6/2017 5:43:57 PM]
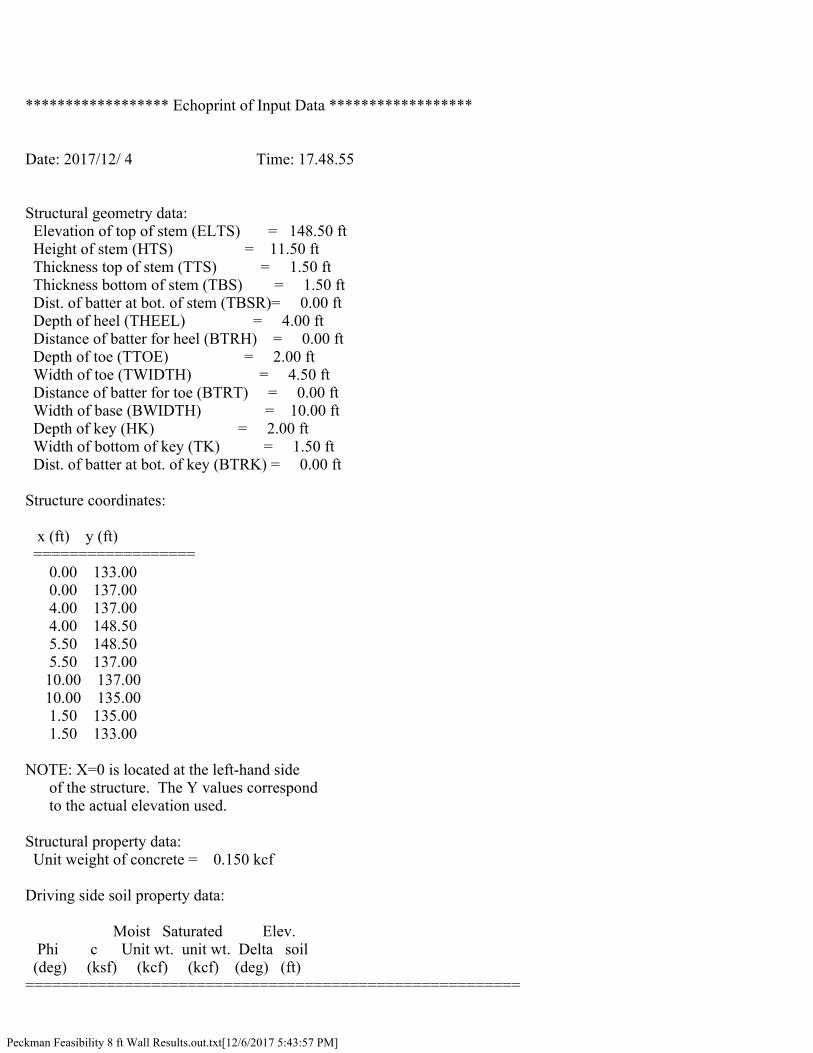
****************** Echoprint of Input Data ******************
Date: 2017/12/ 4 Time: 17.48.55
Structural geometry data: Elevation of top of stem (ELTS) = 148.50 ft Height of stem (HTS) = 11.50 ft Thickness top of stem (TTS) = 1.50 ft Thickness bottom of stem (TBS) = 1.50 ft Dist. of batter at bot. of stem (TBSR)= 0.00 ft Depth of heel (THEEL) = 4.00 ft Distance of batter for heel (BTRH) = 0.00 ft Depth of toe (TTOE) = 2.00 ft Width of toe (TWIDTH) = 4.50 ft Distance of batter for toe (BTRT) = 0.00 ft Width of base (BWIDTH) = 10.00 ft Depth of key (HK) = 2.00 ft Width of bottom of key (TK) = 1.50 ft Dist. of batter at bot. of key (BTRK) = 0.00 ft
Structure coordinates:
x (ft) y (ft) ================== 0.00 133.00 0.00 137.00 4.00 137.00 4.00 148.50 5.50 148.50 5.50 137.00 10.00 137.00 10.00 135.00 1.50 135.00 1.50 133.00
NOTE: X=0 is located at the left-hand side of the structure. The Y values correspond to the actual elevation used.
Structural property data: Unit weight of concrete = 0.150 kcf
Driving side soil property data:
Moist Saturated Elev. Phi c Unit wt. unit wt. Delta soil (deg) (ksf) (kcf) (kcf) (deg) (ft) =======================================================
Peckman Feasibility 8 ft Wall Results.out.txt[12/6/2017 5:43:57 PM]
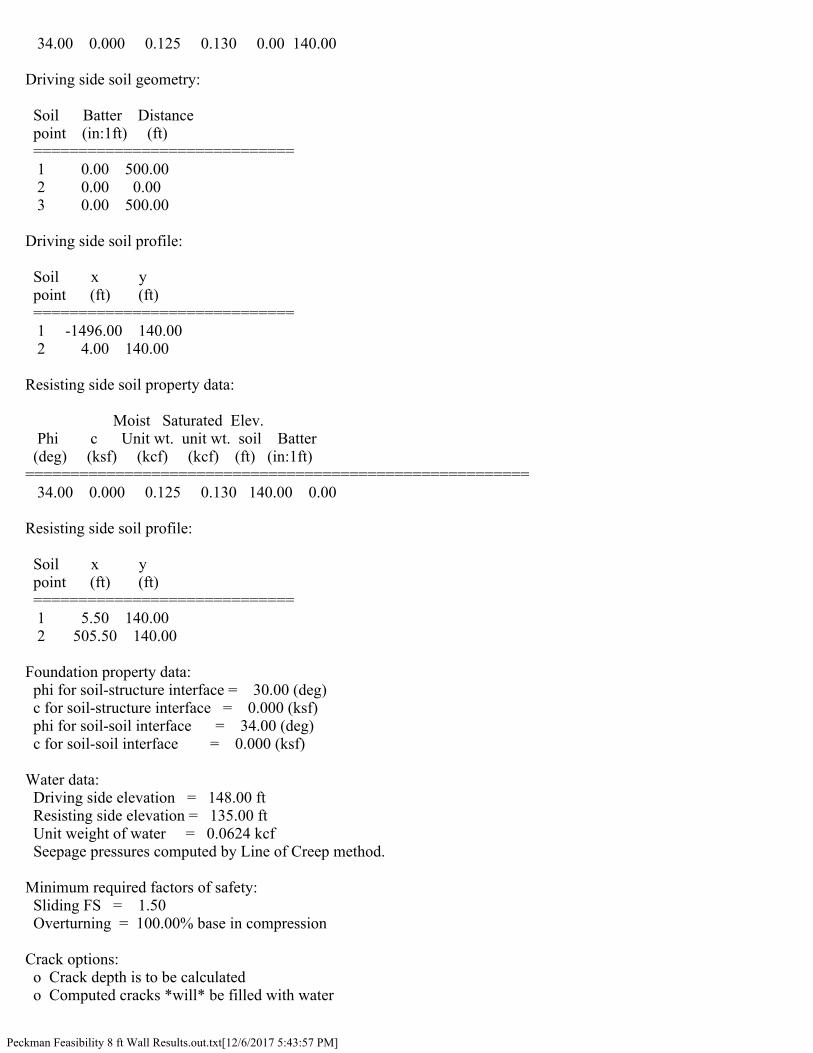
34.00 0.000 0.125 0.130 0.00 140.00
Driving side soil geometry:
Soil Batter Distance point (in:1ft) (ft) ============================= 1 0.00 500.00 2 0.00 0.00 3 0.00 500.00
Driving side soil profile:
Soil x y point (ft) (ft) ============================= 1 -1496.00 140.00 2 4.00 140.00
Resisting side soil property data:
Moist Saturated Elev. Phi c Unit wt. unit wt. soil Batter (deg) (ksf) (kcf) (kcf) (ft) (in:1ft) ======================================================== 34.00 0.000 0.125 0.130 140.00 0.00
Resisting side soil profile:
Soil x y point (ft) (ft) ============================= 1 5.50 140.00 2 505.50 140.00
Foundation property data: phi for soil-structure interface = 30.00 (deg) c for soil-structure interface = 0.000 (ksf) phi for soil-soil interface = 34.00 (deg) c for soil-soil interface = 0.000 (ksf)
Water data: Driving side elevation = 148.00 ft Resisting side elevation = 135.00 ft Unit weight of water = 0.0624 kcf Seepage pressures computed by Line of Creep method.
Minimum required factors of safety: Sliding FS = 1.50 Overturning = 100.00% base in compression
Crack options: o Crack depth is to be calculated o Computed cracks *will* be filled with water
Peckman Feasibility 8 ft Wall Results.out.txt[12/6/2017 5:43:57 PM]
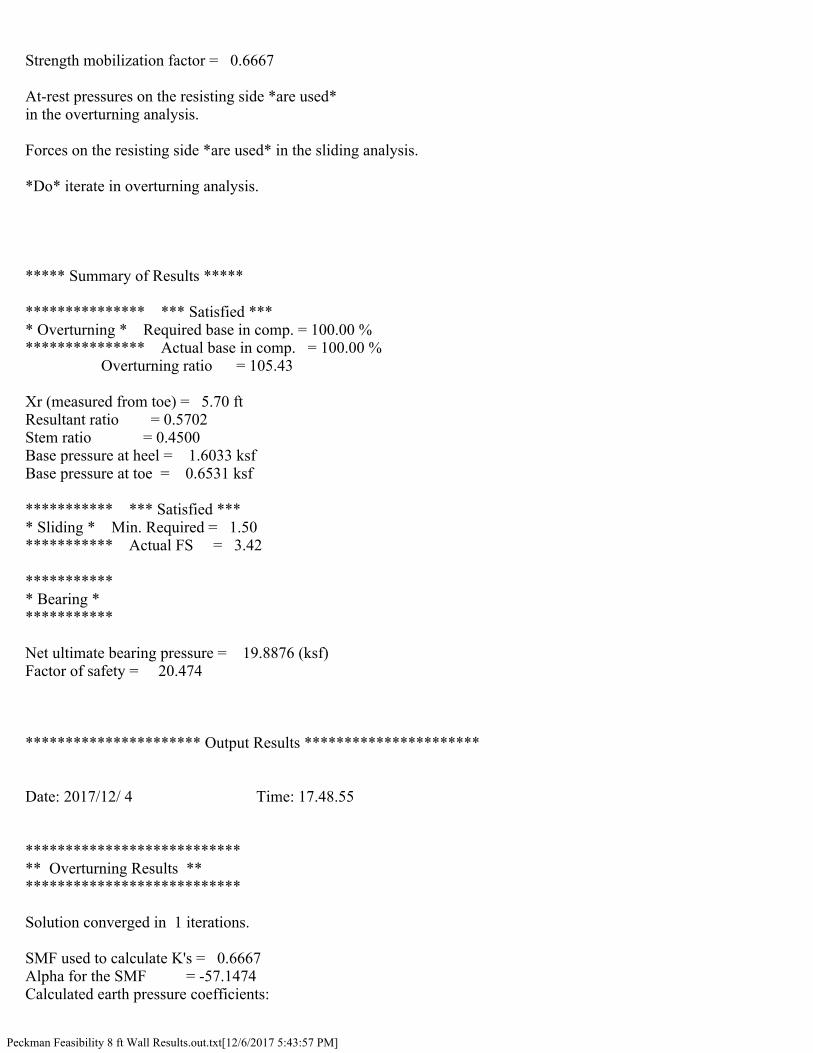
Strength mobilization factor = 0.6667
At-rest pressures on the resisting side *are used* in the overturning analysis.
Forces on the resisting side *are used* in the sliding analysis.
*Do* iterate in overturning analysis.
***** Summary of Results *****
*************** *** Satisfied *** * Overturning * Required base in comp. = 100.00 % *************** Actual base in comp. = 100.00 % Overturning ratio = 105.43
Xr (measured from toe) = 5.70 ft Resultant ratio = 0.5702 Stem ratio = 0.4500 Base pressure at heel = 1.6033 ksf Base pressure at toe = 0.6531 ksf
*********** *** Satisfied *** * Sliding * Min. Required = 1.50 *********** Actual FS = 3.42
*********** * Bearing * ***********
Net ultimate bearing pressure = 19.8876 (ksf) Factor of safety = 20.474
********************** Output Results **********************
Date: 2017/12/ 4 Time: 17.48.55
*************************** ** Overturning Results ** ***************************
Solution converged in 1 iterations.
SMF used to calculate K's = 0.6667 Alpha for the SMF = -57.1474 Calculated earth pressure coefficients:
Peckman Feasibility 8 ft Wall Results.out.txt[12/6/2017 5:43:57 PM]
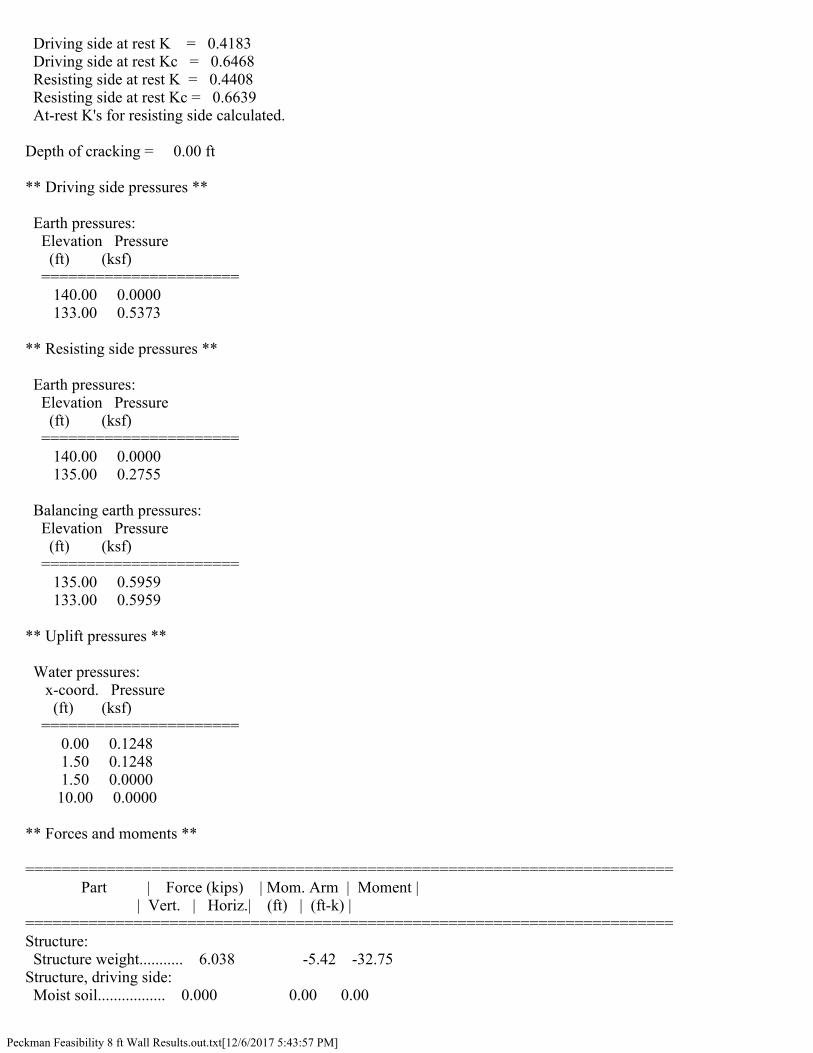
Driving side at rest K = 0.4183 Driving side at rest Kc = 0.6468 Resisting side at rest K = 0.4408 Resisting side at rest Kc = 0.6639 At-rest K's for resisting side calculated.
Depth of cracking = 0.00 ft
** Driving side pressures **
Earth pressures: Elevation Pressure (ft) (ksf) ====================== 140.00 0.0000 133.00 0.5373
** Resisting side pressures **
Earth pressures: Elevation Pressure (ft) (ksf) ====================== 140.00 0.0000 135.00 0.2755
Balancing earth pressures: Elevation Pressure (ft) (ksf) ====================== 135.00 0.5959 133.00 0.5959
** Uplift pressures **
Water pressures: x-coord. Pressure (ft) (ksf) ====================== 0.00 0.1248 1.50 0.1248 1.50 0.0000 10.00 0.0000
** Forces and moments **
======================================================================== Part | Force (kips) | Mom. Arm | Moment | | Vert. | Horiz.| (ft) | (ft-k) | ======================================================================== Structure: Structure weight........... 6.038 -5.42 -32.75 Structure, driving side: Moist soil................. 0.000 0.00 0.00
Peckman Feasibility 8 ft Wall Results.out.txt[12/6/2017 5:43:57 PM]
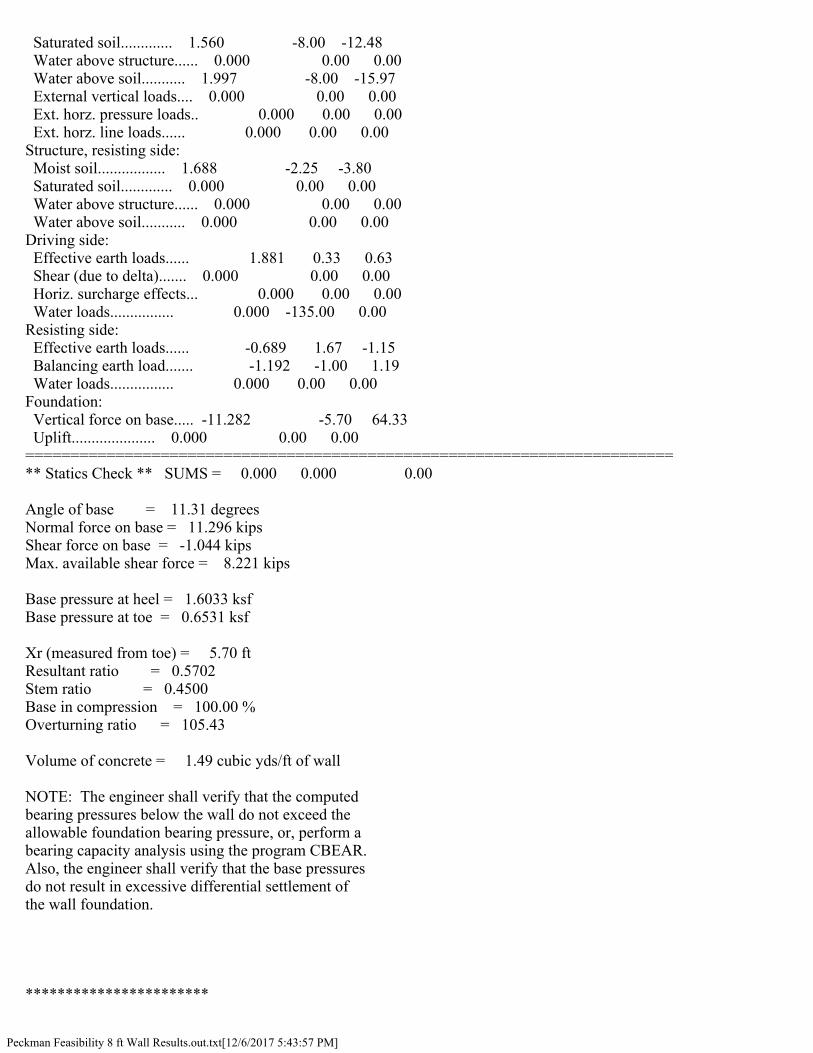
Saturated soil............. 1.560 -8.00 -12.48 Water above structure...... 0.000 0.00 0.00 Water above soil........... 1.997 -8.00 -15.97 External vertical loads.... 0.000 0.00 0.00 Ext. horz. pressure loads.. 0.000 0.00 0.00 Ext. horz. line loads...... 0.000 0.00 0.00 Structure, resisting side: Moist soil................. 1.688 -2.25 -3.80 Saturated soil............. 0.000 0.00 0.00 Water above structure...... 0.000 0.00 0.00 Water above soil........... 0.000 0.00 0.00 Driving side: Effective earth loads...... 1.881 0.33 0.63 Shear (due to delta)....... 0.000 0.00 0.00 Horiz. surcharge effects... 0.000 0.00 0.00 Water loads................ 0.000 -135.00 0.00 Resisting side: Effective earth loads...... -0.689 1.67 -1.15 Balancing earth load....... -1.192 -1.00 1.19 Water loads................ 0.000 0.00 0.00 Foundation: Vertical force on base..... -11.282 -5.70 64.33 Uplift..................... 0.000 0.00 0.00 ======================================================================== ** Statics Check ** SUMS = 0.000 0.000 0.00
Angle of base = 11.31 degrees Normal force on base = 11.296 kips Shear force on base = -1.044 kips Max. available shear force = 8.221 kips
Base pressure at heel = 1.6033 ksf Base pressure at toe = 0.6531 ksf
Xr (measured from toe) = 5.70 ft Resultant ratio = 0.5702 Stem ratio = 0.4500 Base in compression = 100.00 % Overturning ratio = 105.43
Volume of concrete = 1.49 cubic yds/ft of wall
NOTE: The engineer shall verify that the computed bearing pressures below the wall do not exceed the allowable foundation bearing pressure, or, perform a bearing capacity analysis using the program CBEAR. Also, the engineer shall verify that the base pressures do not result in excessive differential settlement of the wall foundation.
***********************
Peckman Feasibility 8 ft Wall Results.out.txt[12/6/2017 5:43:57 PM]
** Sliding Results ** ***********************
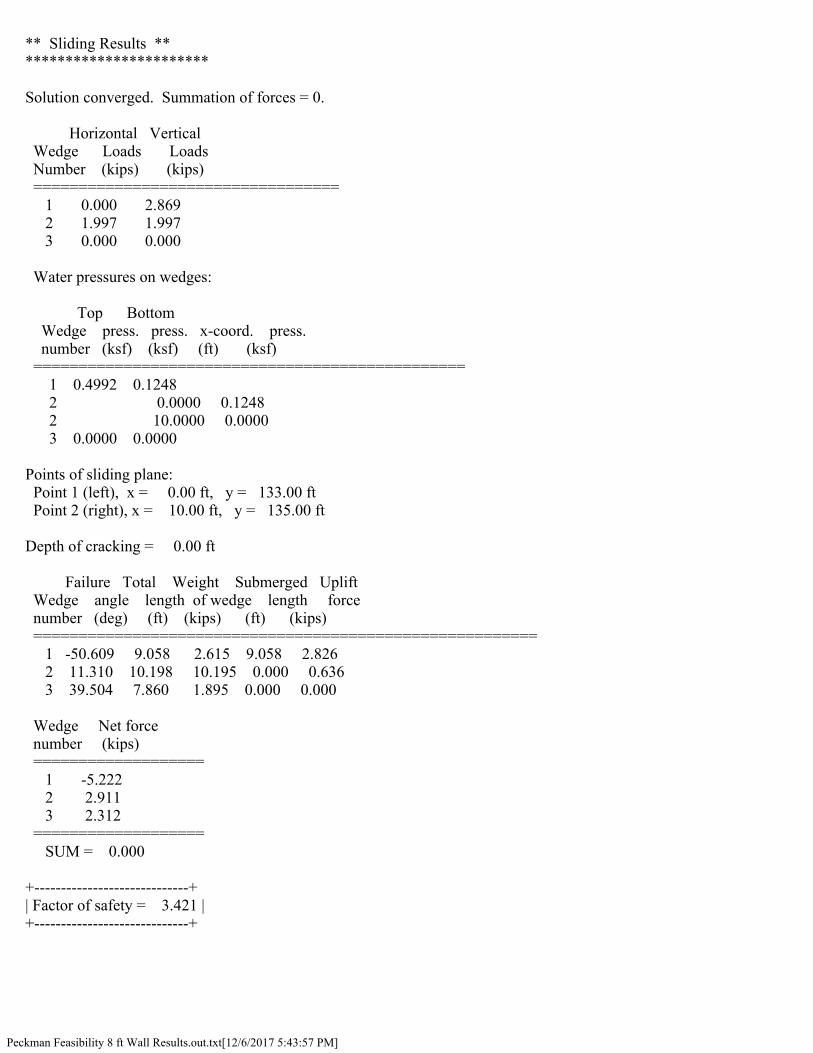
Solution converged. Summation of forces = 0.
Horizontal Vertical Wedge Loads Loads Number (kips) (kips) ================================== 1 0.000 2.869 2 1.997 1.997 3 0.000 0.000
Water pressures on wedges:
Top Bottom Wedge press. press. x-coord. press. number (ksf) (ksf) (ft) (ksf) ================================================ 1 0.4992 0.1248 2 0.0000 0.1248 2 10.0000 0.0000 3 0.0000 0.0000
Points of sliding plane: Point 1 (left), x = 0.00 ft, y = 133.00 ft Point 2 (right), x = 10.00 ft, y = 135.00 ft
Depth of cracking = 0.00 ft
Failure Total Weight Submerged Uplift Wedge angle length of wedge length force number (deg) (ft) (kips) (ft) (kips) ======================================================== 1 -50.609 9.058 2.615 9.058 2.826 2 11.310 10.198 10.195 0.000 0.636 3 39.504 7.860 1.895 0.000 0.000
Wedge Net force number (kips) =================== 1 -5.222 2 2.911 3 2.312 =================== SUM = 0.000
+-----------------------------+ | Factor of safety = 3.421 | +-----------------------------+
Peckman Feasibility 8 ft Wall Results.out.txt[12/6/2017 5:43:57 PM]
*********************** ** Bearing Results ** ***********************
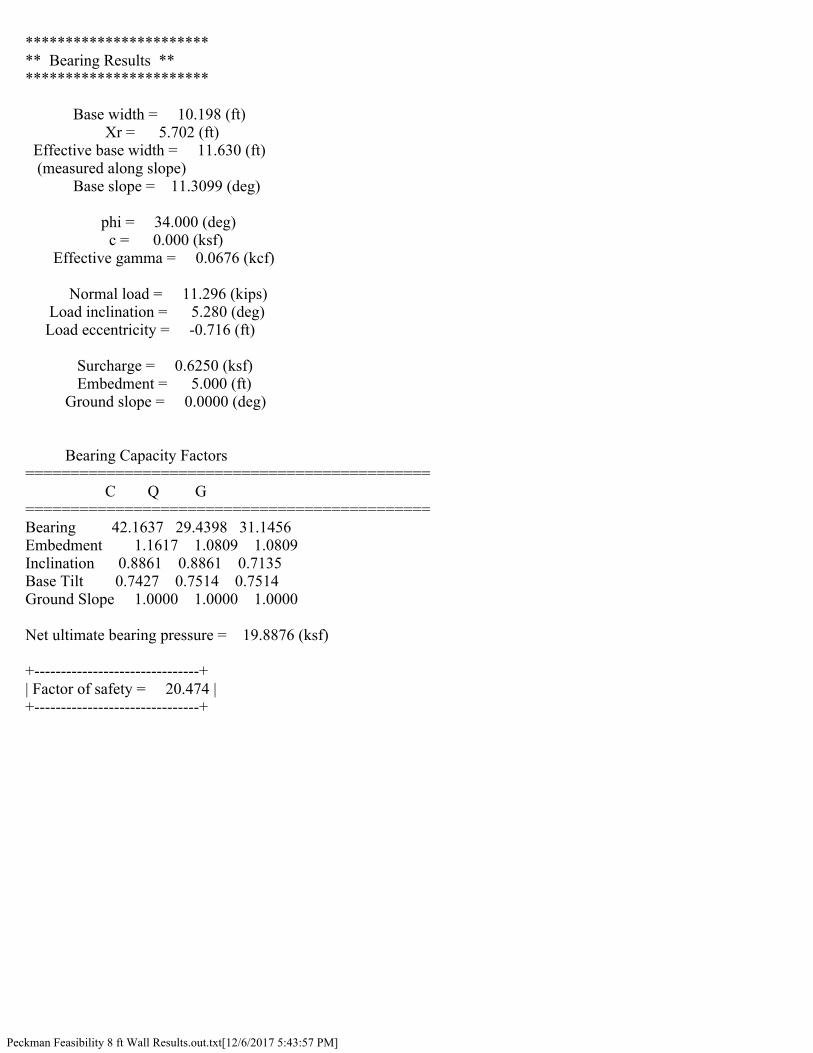
Base width = 10.198 (ft) Xr = 5.702 (ft) Effective base width = 11.630 (ft) (measured along slope) Base slope = 11.3099 (deg)
phi = 34.000 (deg) c = 0.000 (ksf) Effective gamma = 0.0676 (kcf)
Normal load = 11.296 (kips) Load inclination = 5.280 (deg) Load eccentricity = -0.716 (ft)
Surcharge = 0.6250 (ksf) Embedment = 5.000 (ft) Ground slope = 0.0000 (deg)
Bearing Capacity Factors ============================================= C Q G ============================================= Bearing 42.1637 29.4398 31.1456 Embedment 1.1617 1.0809 1.0809 Inclination 0.8861 0.8861 0.7135 Base Tilt 0.7427 0.7514 0.7514 Ground Slope 1.0000 1.0000 1.0000
Net ultimate bearing pressure = 19.8876 (ksf)
+-------------------------------+ | Factor of safety = 20.474 | +-------------------------------+
Peckman Feasibility 16 ft Wall Results H20 132.out.txt[12/6/2017 7:16:17 PM]
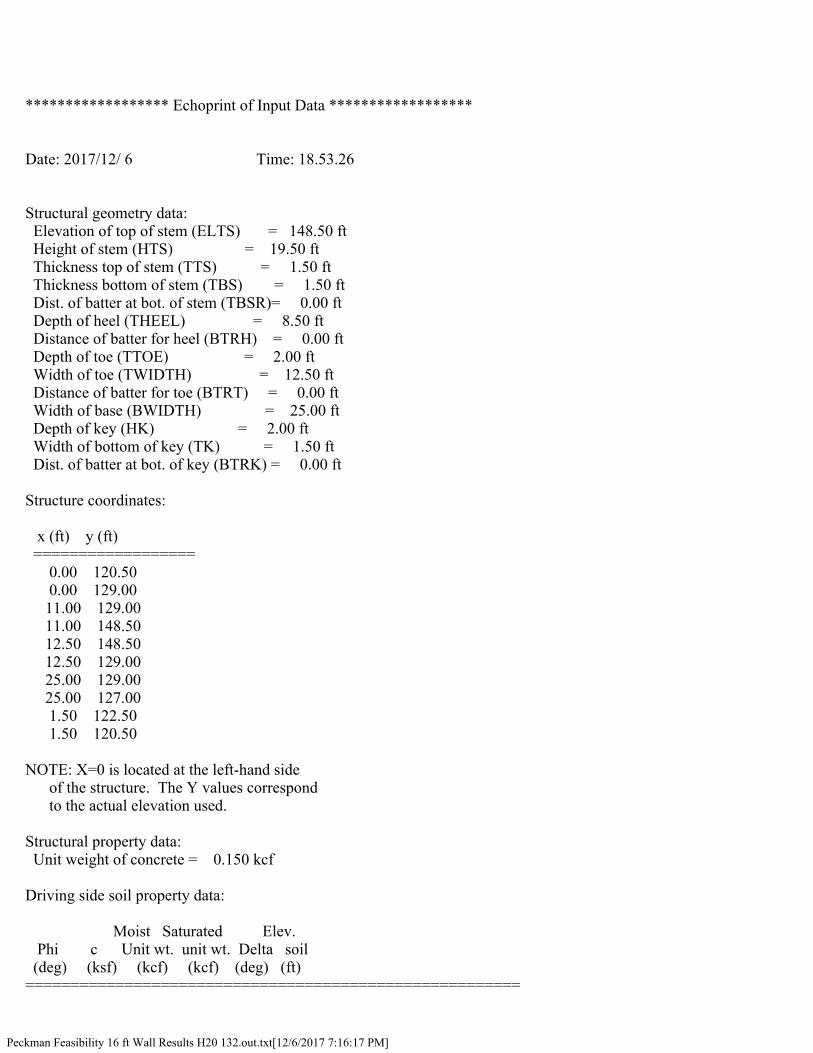
****************** Echoprint of Input Data ******************
Date: 2017/12/ 6 Time: 18.53.26
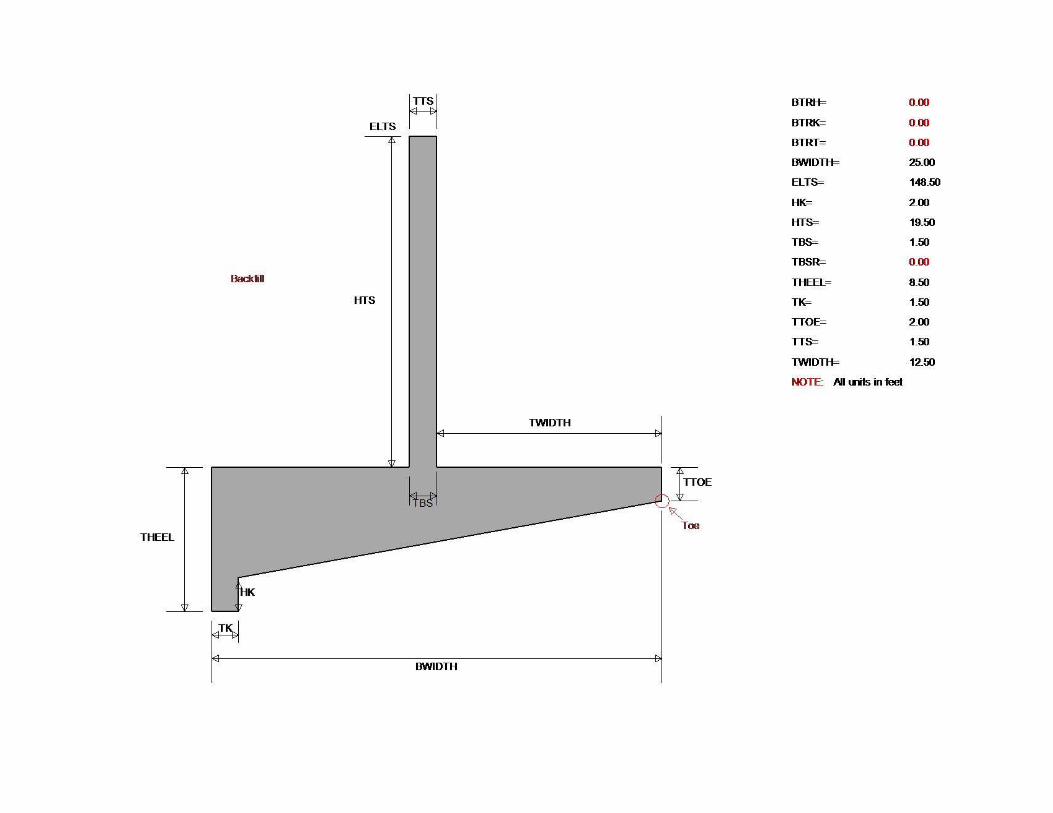
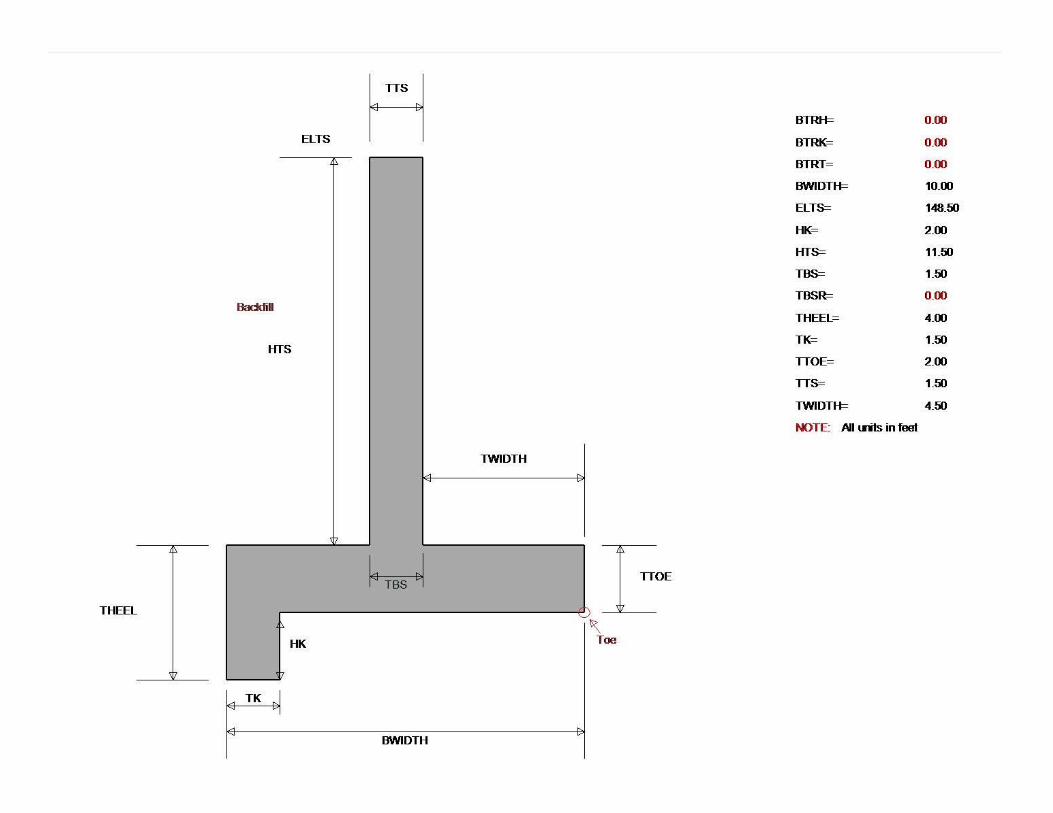
Structural geometry data: Elevation of top of stem (ELTS) = 148.50 ft Height of stem (HTS) = 19.50 ft Thickness top of stem (TTS) = 1.50 ft Thickness bottom of stem (TBS) = 1.50 ft Dist. of batter at bot. of stem (TBSR)= 0.00 ft Depth of heel (THEEL) = 8.50 ft Distance of batter for heel (BTRH) = 0.00 ft Depth of toe (TTOE) = 2.00 ft Width of toe (TWIDTH) = 12.50 ft Distance of batter for toe (BTRT) = 0.00 ft Width of base (BWIDTH) = 25.00 ft Depth of key (HK) = 2.00 ft Width of bottom of key (TK) = 1.50 ft Dist. of batter at bot. of key (BTRK) = 0.00 ft
Structure coordinates:
x (ft) y (ft) ================== 0.00 120.50 0.00 129.00 11.00 129.00 11.00 148.50 12.50 148.50 12.50 129.00 25.00 129.00 25.00 127.00 1.50 122.50 1.50 120.50
NOTE: X=0 is located at the left-hand side of the structure. The Y values correspond to the actual elevation used.
Structural property data: Unit weight of concrete = 0.150 kcf
Driving side soil property data:
Moist Saturated Elev. Phi c Unit wt. unit wt. Delta soil (deg) (ksf) (kcf) (kcf) (deg) (ft) =======================================================

Peckman Feasibility 16 ft Wall Results H20 132.out.txt[12/6/2017 7:16:17 PM]
34.00 0.000 0.125 0.130 0.00 132.00
Driving side soil geometry:
Soil Batter Distance point (in:1ft) (ft) ============================= 1 0.00 500.00 2 0.00 0.00 3 0.00 500.00
Driving side soil profile:
Soil x y point (ft) (ft) ============================= 1 -1489.00 132.00 2 11.00 132.00
Resisting side soil property data:
Moist Saturated Elev. Phi c Unit wt. unit wt. soil Batter (deg) (ksf) (kcf) (kcf) (ft) (in:1ft) ======================================================== 34.00 0.000 0.125 0.130 132.00 0.00
Resisting side soil profile:
Soil x y point (ft) (ft) ============================= 1 12.50 132.00 2 512.50 132.00
Foundation property data: phi for soil-structure interface = 30.00 (deg) c for soil-structure interface = 0.000 (ksf) phi for soil-soil interface = 34.00 (deg) c for soil-soil interface = 0.000 (ksf)
Water data: Driving side elevation = 148.00 ft Resisting side elevation = 132.00 ft Unit weight of water = 0.0624 kcf Seepage pressures computed by Line of Creep method.
Minimum required factors of safety: Sliding FS = 1.50 Overturning = 100.00% base in compression
Crack options: o Crack depth is to be calculated o Computed cracks *will* be filled with water
Peckman Feasibility 16 ft Wall Results H20 132.out.txt[12/6/2017 7:16:17 PM]
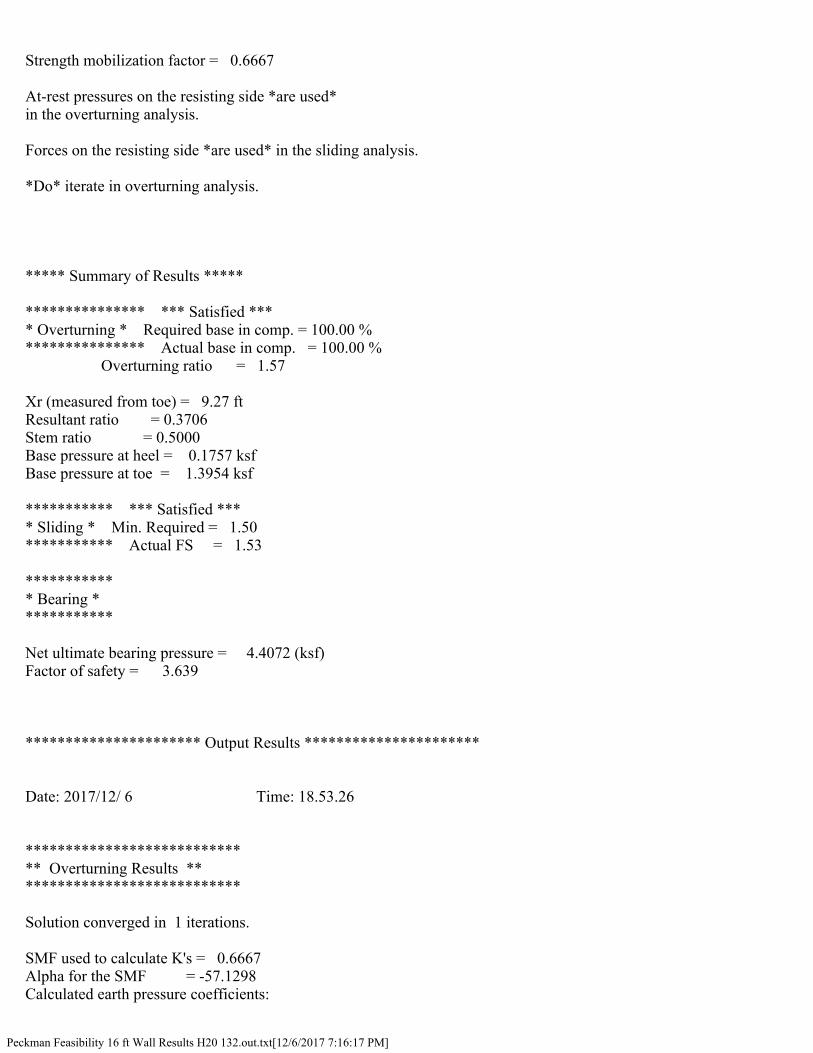
Strength mobilization factor = 0.6667
At-rest pressures on the resisting side *are used* in the overturning analysis.
Forces on the resisting side *are used* in the sliding analysis.
*Do* iterate in overturning analysis.
***** Summary of Results *****
*************** *** Satisfied *** * Overturning * Required base in comp. = 100.00 % *************** Actual base in comp. = 100.00 % Overturning ratio = 1.57
Xr (measured from toe) = 9.27 ft Resultant ratio = 0.3706 Stem ratio = 0.5000 Base pressure at heel = 0.1757 ksf Base pressure at toe = 1.3954 ksf
*********** *** Satisfied *** * Sliding * Min. Required = 1.50 *********** Actual FS = 1.53
*********** * Bearing * ***********
Net ultimate bearing pressure = 4.4072 (ksf) Factor of safety = 3.639
********************** Output Results **********************
Date: 2017/12/ 6 Time: 18.53.26
*************************** ** Overturning Results ** ***************************
Solution converged in 1 iterations.
SMF used to calculate K's = 0.6667 Alpha for the SMF = -57.1298 Calculated earth pressure coefficients:
Peckman Feasibility 16 ft Wall Results H20 132.out.txt[12/6/2017 7:16:17 PM]
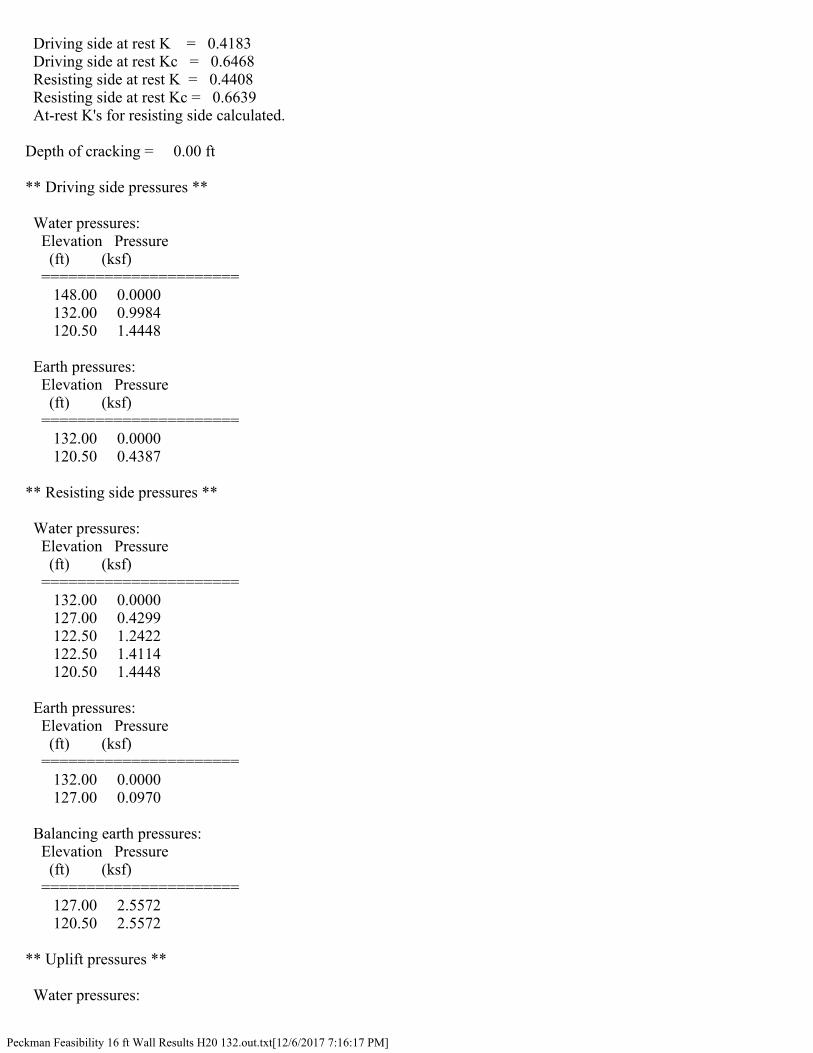
Driving side at rest K = 0.4183 Driving side at rest Kc = 0.6468 Resisting side at rest K = 0.4408 Resisting side at rest Kc = 0.6639 At-rest K's for resisting side calculated.
Depth of cracking = 0.00 ft
** Driving side pressures **
Water pressures: Elevation Pressure (ft) (ksf) ====================== 148.00 0.0000 132.00 0.9984 120.50 1.4448
Earth pressures: Elevation Pressure (ft) (ksf) ====================== 132.00 0.0000 120.50 0.4387
** Resisting side pressures **
Water pressures: Elevation Pressure (ft) (ksf) ====================== 132.00 0.0000 127.00 0.4299 122.50 1.2422 122.50 1.4114 120.50 1.4448
Earth pressures: Elevation Pressure (ft) (ksf) ====================== 132.00 0.0000 127.00 0.0970
Balancing earth pressures: Elevation Pressure (ft) (ksf) ====================== 127.00 2.5572 120.50 2.5572
** Uplift pressures **
Water pressures:
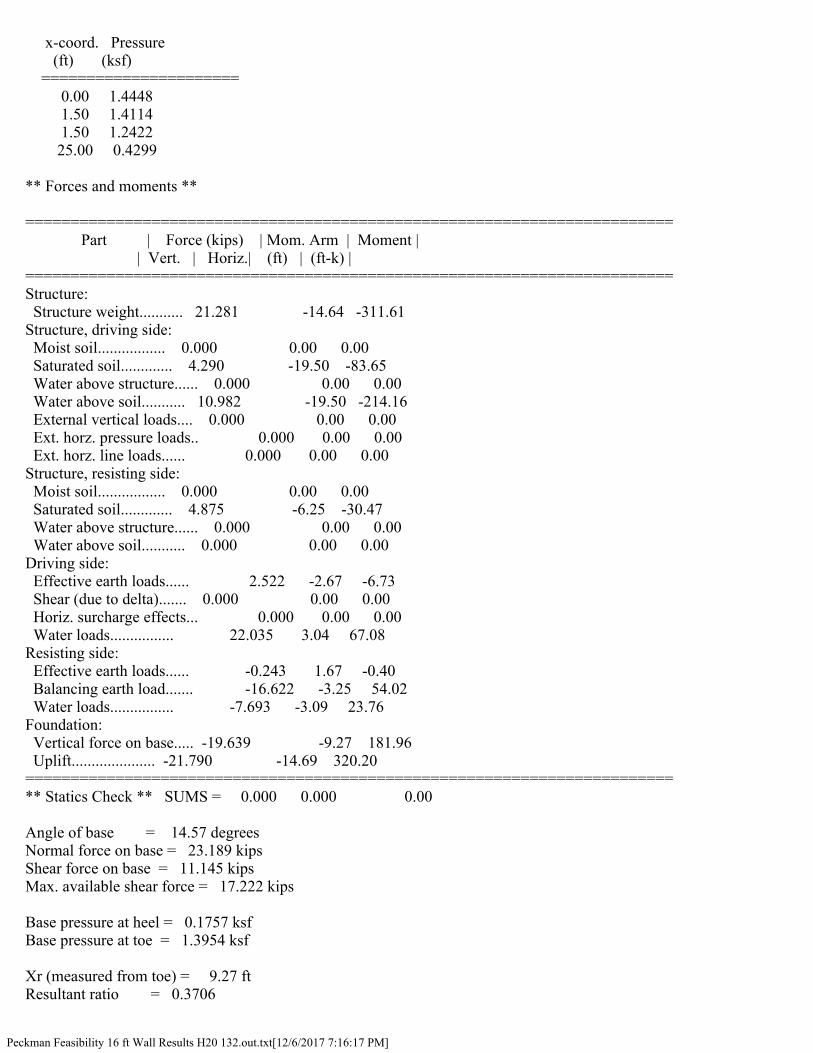
Peckman Feasibility 16 ft Wall Results H20 132.out.txt[12/6/2017 7:16:17 PM]
x-coord. Pressure (ft) (ksf) ====================== 0.00 1.4448 1.50 1.4114 1.50 1.2422 25.00 0.4299
** Forces and moments **
======================================================================== Part | Force (kips) | Mom. Arm | Moment | | Vert. | Horiz.| (ft) | (ft-k) | ======================================================================== Structure: Structure weight........... 21.281 -14.64 -311.61 Structure, driving side: Moist soil................. 0.000 0.00 0.00 Saturated soil............. 4.290 -19.50 -83.65 Water above structure...... 0.000 0.00 0.00 Water above soil........... 10.982 -19.50 -214.16 External vertical loads.... 0.000 0.00 0.00 Ext. horz. pressure loads.. 0.000 0.00 0.00 Ext. horz. line loads...... 0.000 0.00 0.00 Structure, resisting side: Moist soil................. 0.000 0.00 0.00 Saturated soil............. 4.875 -6.25 -30.47 Water above structure...... 0.000 0.00 0.00 Water above soil........... 0.000 0.00 0.00 Driving side: Effective earth loads...... 2.522 -2.67 -6.73 Shear (due to delta)....... 0.000 0.00 0.00 Horiz. surcharge effects... 0.000 0.00 0.00 Water loads................ 22.035 3.04 67.08 Resisting side: Effective earth loads...... -0.243 1.67 -0.40 Balancing earth load....... -16.622 -3.25 54.02 Water loads................ -7.693 -3.09 23.76 Foundation: Vertical force on base..... -19.639 -9.27 181.96 Uplift..................... -21.790 -14.69 320.20 ======================================================================== ** Statics Check ** SUMS = 0.000 0.000 0.00
Angle of base = 14.57 degrees Normal force on base = 23.189 kips Shear force on base = 11.145 kips Max. available shear force = 17.222 kips
Base pressure at heel = 0.1757 ksf Base pressure at toe = 1.3954 ksf
Xr (measured from toe) = 9.27 ft Resultant ratio = 0.3706
Peckman Feasibility 16 ft Wall Results H20 132.out.txt[12/6/2017 7:16:17 PM]
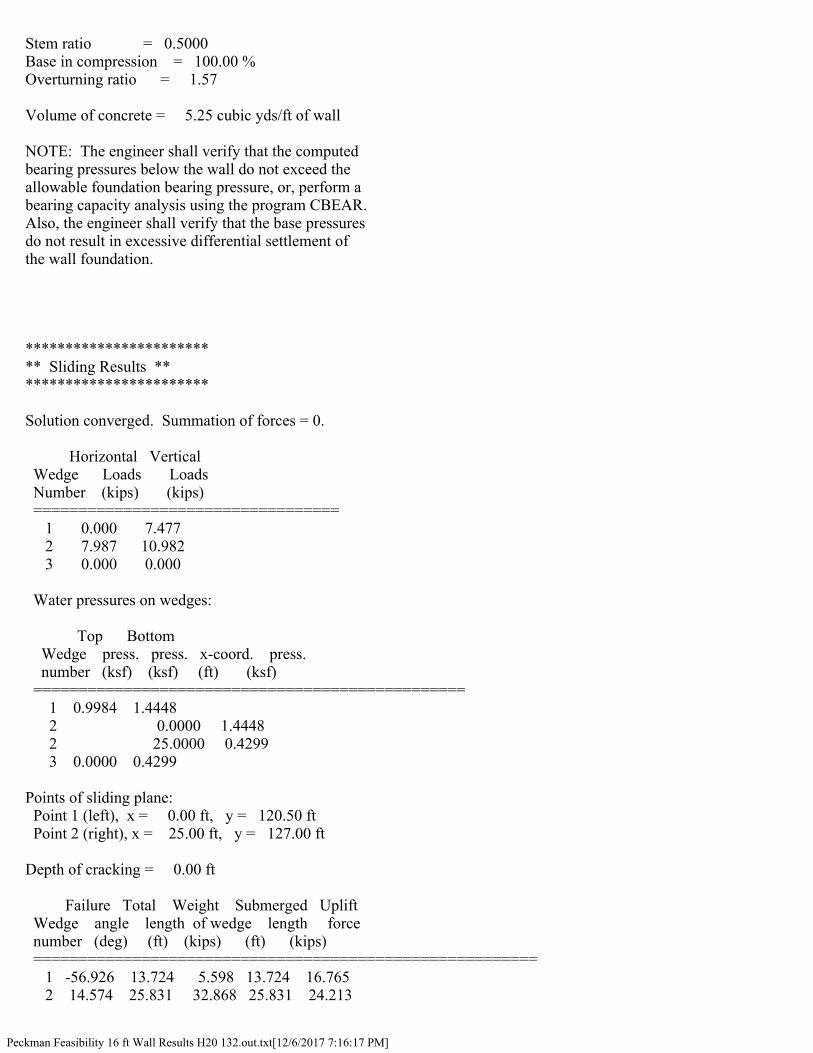
Stem ratio = 0.5000 Base in compression = 100.00 % Overturning ratio = 1.57
Volume of concrete = 5.25 cubic yds/ft of wall
NOTE: The engineer shall verify that the computed bearing pressures below the wall do not exceed the allowable foundation bearing pressure, or, perform a bearing capacity analysis using the program CBEAR. Also, the engineer shall verify that the base pressures do not result in excessive differential settlement of the wall foundation.
*********************** ** Sliding Results ** ***********************
Solution converged. Summation of forces = 0.
Horizontal Vertical Wedge Loads Loads Number (kips) (kips) ================================== 1 0.000 7.477 2 7.987 10.982 3 0.000 0.000
Water pressures on wedges:
Top Bottom Wedge press. press. x-coord. press. number (ksf) (ksf) (ft) (ksf) ================================================ 1 0.9984 1.4448 2 0.0000 1.4448 2 25.0000 0.4299 3 0.0000 0.4299
Points of sliding plane: Point 1 (left), x = 0.00 ft, y = 120.50 ft Point 2 (right), x = 25.00 ft, y = 127.00 ft
Depth of cracking = 0.00 ft
Failure Total Weight Submerged Uplift Wedge angle length of wedge length force number (deg) (ft) (kips) (ft) (kips) ======================================================== 1 -56.926 13.724 5.598 13.724 16.765 2 14.574 25.831 32.868 25.831 24.213
Peckman Feasibility 16 ft Wall Results H20 132.out.txt[12/6/2017 7:16:17 PM]
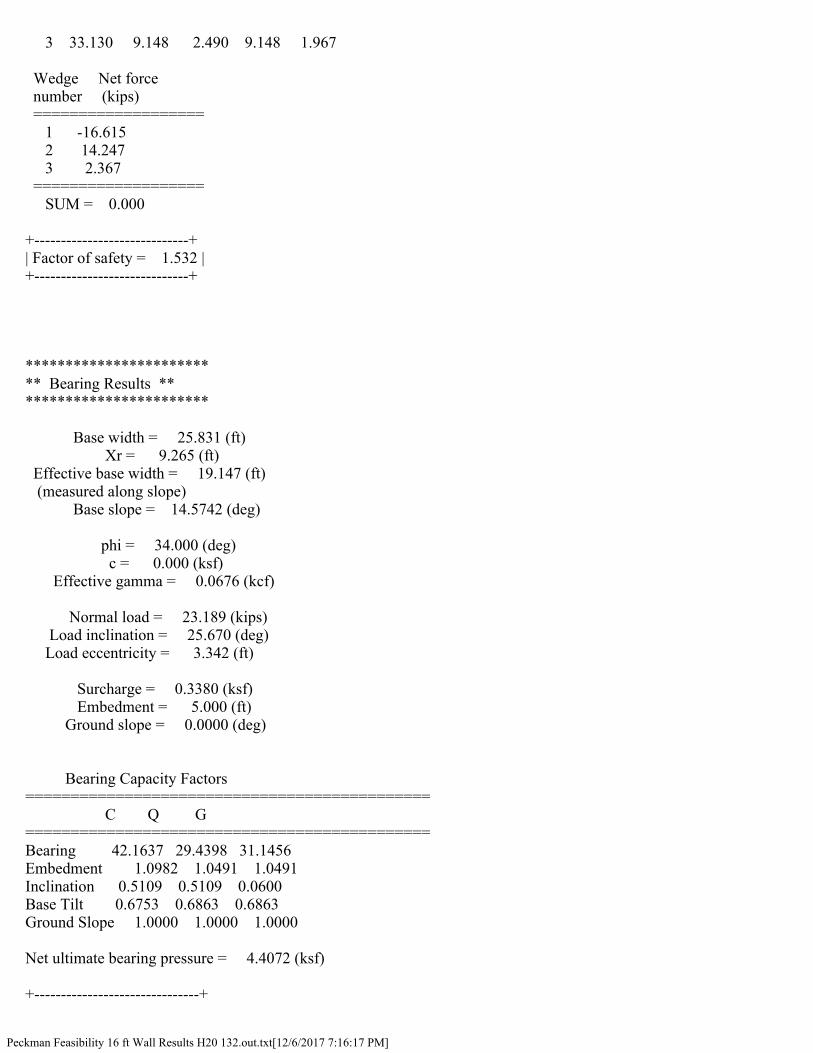
3 33.130 9.148 2.490 9.148 1.967
Wedge Net force number (kips) =================== 1 -16.615 2 14.247 3 2.367 =================== SUM = 0.000
+-----------------------------+ | Factor of safety = 1.532 | +-----------------------------+
*********************** ** Bearing Results ** ***********************
Base width = 25.831 (ft) Xr = 9.265 (ft) Effective base width = 19.147 (ft) (measured along slope) Base slope = 14.5742 (deg)
phi = 34.000 (deg) c = 0.000 (ksf) Effective gamma = 0.0676 (kcf)
Normal load = 23.189 (kips) Load inclination = 25.670 (deg) Load eccentricity = 3.342 (ft)
Surcharge = 0.3380 (ksf) Embedment = 5.000 (ft) Ground slope = 0.0000 (deg)
Bearing Capacity Factors ============================================= C Q G ============================================= Bearing 42.1637 29.4398 31.1456 Embedment 1.0982 1.0491 1.0491 Inclination 0.5109 0.5109 0.0600 Base Tilt 0.6753 0.6863 0.6863 Ground Slope 1.0000 1.0000 1.0000
Net ultimate bearing pressure = 4.4072 (ksf)
+-------------------------------+

Peckman Feasibility 16 ft Wall Results H20 132.out.txt[12/6/2017 7:16:17 PM]
| Factor of safety = 3.639 | +-------------------------------+