Embed Size (px)
Citation preview
Policy Research Working Paper 7944
Pedagogy versus School Readiness
The Impact of a Randomized Reading Instruction Intervention and Community-Based Playgroup
Intervention on Early Grade Reading Outcomes in Tonga
Kevin MacdonaldSally BrinkmanWendy Jarvie
Myrna Machuca-SierraKris McDonall
Souhila Messaoud-GalusiSiosiana Tapueluelu
Binh Thanh Vu
Education Global Practice GroupJanuary 2017
WPS7944P
ublic
Dis
clos
ure
Aut
horiz
edP
ublic
Dis
clos
ure
Aut
horiz
edP
ublic
Dis
clos
ure
Aut
horiz
edP
ublic
Dis
clos
ure
Aut
horiz
ed
Produced by the Research Support Team
Abstract
The Policy Research Working Paper Series disseminates the findings of work in progress to encourage the exchange of ideas about development issues. An objective of the series is to get the findings out quickly, even if the presentations are less than fully polished. The papers carry the names of the authors and should be cited accordingly. The findings, interpretations, and conclusions expressed in this paper are entirely those of the authors. They do not necessarily represent the views of the International Bank for Reconstruction and Development/World Bank and its affiliated organizations, or those of the Executive Directors of the World Bank or the governments they represent.
Policy Research Working Paper 7944
This paper is a product of the Education Global Practice Group. It is part of a larger effort by the World Bank to provide open access to its research and make a contribution to development policy discussions around the world. Policy Research Working Papers are also posted on the Web at http://econ.worldbank.org. The authors may be contacted at [email protected].
Identifying cost-effective interventions to improve early literacy is vital to developing countries, given the impor-tance of early literacy for an individual’s future education outcomes and subsequent human capital formation. This paper presents the impact on early grade reading outcomes of two low-cost randomized interventions in Tonga: a read-ing instruction intervention and a community play-based activity intervention. The first intervention aims to improve early grade reading outcomes specifically; estimated impacts are approximately 0.3 standard deviation, although in some reading domains impacts are substantial, ranging from 0.6 to 0.7 standard deviation. The second intervention aims to improve school readiness and subsequently early grade reading outcomes, by providing communities with sup-port to establish a community play-based activity. Using
an instrumental variables approach, the play-based activity demonstrates positive impacts of around 0.2 standard devi-ation in many but not all reading domains. For the domains where a statistically significant impact is measured, the com-munity play-based activity intervention is as at least as cost effective as the reading instruction intervention. The play-based activity intervention is shown to improve test scores by 0.21 to 0.47 standard deviation per US$100, depending on the reading test domain. The reading instruction interven-tion improves test scores by 0.08 to 0.34 standard deviation per US$100. These findings contribute further evidence on the effectiveness of reading instruction interventions, and possibly the first estimates of the impact of play group-type interventions on primary school reading outcomes.
Pedagogy versus School Readiness: The Impact of a Randomized Reading
Instruction Intervention and Community-Based Playgroup Intervention on
Early Grade Reading Outcomes in Tonga1
Kevin Macdonald, Sally Brinkman, Wendy Jarvie, Myrna Machuca-Sierra, Kris McDonall,
Souhila Messaoud-Galusi, Siosiana Tapueluelu and Binh Thanh Vu
JEL Classification: A00 General Economics and Teaching
Key word: early literacy
1 Funding for this initiative comes from the Pacific Early Age Readiness and Learning (PEARL) programme, funded
by the Global Partnership for Education (GPE) and implemented by the World Bank, provides technical assistance
and analytical work to improve participating countries’ evidence-base on school readiness and early grade literacy.
The programme informs short and medium-term policy agendas, including baseline surveys on school readiness and
early grade reading levels and piloting interventions.
2
1. Introduction
Early age reading skills are recognized as a crucial stepping stone for a child’s future learning,
cognitive development, and subsequent human capital formation. Literacy improves individual
productivity in developing countries through many paths including diffusion of technology (Basu
and Foster 1998; Rosenzweig 1995). Research characterizes literacy as a necessary threshold for
economic development (Azariadis and Drazen 1990). Because gaps in reading skills develop early
and tend to persist as children age (Butler et al. 1985), early literacy is an important determinant
of a child’s future education outcomes including learning achievement, the likelihood of leaving
school early, and transitioning to higher levels of education (Marteleto et al. 2008; Entwisle et al.
2005; Jimerson et al. 2000; Alexander et al. 1997).
While developing countries have made tremendous progress increasing primary school
participation since the establishment of the Education for All goals in 1990, attention has now
focused on the quality of schooling. In many, learning outcomes are poor, especially in the lowest
income countries. For example, the Programme d’analyse des systèmes éducatifs de la confemen
(PASEC) 2014 student assessment found that on average 71.4 percent of 2nd grade students and
57.3 percent of 5th grade students are not proficient in literacy (PASEC 2015:36,50). In addition,
the OECD’s Programme for International Student Assessment studies typically finds a high
proportion of students in middle income countries are below minimum proficiency in reading (e.g.:
OECD 2014:194). In the Pacific, early grade reading assessments in Tonga in 2009 and in Vanuatu
in 2011 revealed that after three years of schooling, only 30 percent of students in Tonga and 25
percent of students in Vanuatu were able to read fluently for comprehension (World Bank 2012a,
2012b, 2012c). Identifying low cost interventions to improve early literacy is of high priority for
developing countries.
Early literacy, however, is a skill that has to be learned by a child (Wolf 2007). For learning to
read in alphabetic languages, international research has identified the basic skills that children need
to acquire (Linan-Thompson and Vaughn 2007; Sprenger and Charolles 2004; Chiappe et al. 2002;
see also: Gove and Cvelich 2011 and National Reading Panel 2000). These include, among others,
an understanding of the relationship between printed letters and sounds (Scarborough 2002), the
speed at which a child can read (Abadzi 2006), and oral reading fluency (Fuchs et al., 2001).
3
Pedagogy, including instructional techniques of teachers, is an important determinant of how well
children acquire reading skills in the early grades of school, but school readiness—the ability of
children to learn in a primary school setting—also plays a crucial role (Sandraluz et al. 2004;
Brooks-Gunn et al 2007). The effectiveness for future education outcomes of early child
interventions that improve health, early stimulation and social-emotional development is well
documented (for reviews: Nadeau et al. 2010; Vegas et al. 2010; Magnuson 2007; Nores and
Barnett 2010). Successfully learning in a school environment depends on various behaviors and
abilities which can be learned and developed (Bowman, Donovan, and Burns 2001).
This paper compares two different but complimentary pathways for improving reading
outcomes—through improved pedagogy at the school and through improved school readiness prior
to school—by evaluating two randomized interventions in the Kingdom of Tonga. The first
intervention, “Come Let’s Read and Write” (CLRW) aims to improve reading instruction
techniques of 1st and 2nd grade primary school teachers. The second intervention supports
communities to establish play-based activities (CPBA) for children aged 0 to 5 to improve their
readiness to learn at school.
2. Interventions
The Kingdom of Tonga is a proud country having never lost indigenous power or sovereignty to a
foreign power. The archipelago is located within the Polynesian region of the Pacific Ocean; it
includes 176 islands covering 718 square kilometers, of which 40 islands are inhabited, although
some are very remote. The kingdom is divided into five main island groups: Tongatapu, Vava’u,
‘Eua, Ha’apai and the Niuas. The capital of Tonga, Nuku’alofa, is over 2,000 kilometers from its
nearest large market, New Zealand, and over 3,000 kilometers from Australia.
The two interventions are funded by the Global Partnerships for Education through the Pacific
Early Age Readiness and Learning (PEARL) program. The US$8.5million PEARL program is
being executed by the World Bank’s Education Global Practice, and aims to support Pacific Island
countries and their development partners to build capacity to design, implement, and monitor
evidence-based integrated policies and programs that prepare children and their families for
4
primary school and to prepare primary schools and teaching professionals to deliver teaching and
learning activities that help students become effective, independent readers. PEARL aims to ensure
(1) that all young children in the Pacific have access to quality early childhood education in their
communities, and benefit from programs that promote healthy, stimulating, and culturally relevant
experiences that prepare them for pre-primary, primary schooling, and life; and (2) all classrooms
in the early grades of primary education are equipped with the knowledge and the resources to
ensure young children become literate in a language they are familiar with, and are able to use
these skills and knowledge to engage in lifelong learning.
The CLRW intervention is designed to support the development of basic reading skills of young
students in grades 1 and 2 of primary education. It includes a combination of activities to promote
reading skills at school and at home. The approach aligns key learning competencies in basic
reading and writing stipulated in the official Tongan curriculum with a greater degree of clarity on
the sequence in which these skills should be taught. This sequencing follows evidence-based
pedagogical approaches for improving literacy skills including a focus on phonemic awareness
(e.g., understanding of letter sounds) and balanced approaches to literacy learning (August and
Shanahan 2006; National Institute for Child Health and Human Development 2000; Pressley 1998;
Snow et al. 1998). A similar intervention in Kenya improved oral reading fluency in both English
and Kiswahili by 0.34 and 0.58 standard deviations (Piper, Zuilkowski, and Mugenda 2014). This
paper contributes to the growing body of evidence on the impact of research-based pedagogy in
developing countries.
The CPBA intervention supports communities to establish play-based activities for children aged
0 to 5. The objective of the CPBA is to improve school readiness across a broad range of child
development domains including cognitive, socio-emotional and physical development.
Communities play a significant role in the education of their children in Tonga and the Pacific
Islands more broadly (Farran 2009; Toganivalu 2008; Huffer 2006; Griffen 2006). Play-based
activities (also known as playgroups) are led by parents, caregivers facilitated by community
volunteers to provide guided interaction and play among young children, exposing them to new
learning opportunities and socialization through play. These interactions occur once or twice a
week and last approximately 2 hours. Children attended an average of 10 sessions per 10 week
5
term, but many children did not attend all three terms. This paper measures the impact of the
CPBA intervention on early literacy; attending a CPBA is expected to improve children’s school
readiness directly as well as parent’s behavior towards education and subsequently their literacy
skills.
Current research on the impact of community play groups is limited. Further, the concept of
community based playgroups varies dramatically across context and countries, additionally
making it difficult to evaluate the limited existing evidence. Non-randomized evaluations from
Australia have shown playgroups to have a positive effect on child development, indeed children
who do not attend playgroups are 1.78 times more likely to be developmentally vulnerable on 1 or
more of the 5 developmental domains of the Australian Early Development Census at school entry,
after adjusting for socio-economic and demographic differences (Gregory, Harman-Smith et al.
2016, Hancock, Cunningham et al. 2015). Playgroups in Australia tend to be small gatherings of
parents and young children providing children with opportunities to develop their physical,
emotional, social, and language skills. Playgroups also provide opportunities for parents and
caregivers to socialize, learn parenting skills, and seek emotional support from one another.
Parent/child interactions are key feature of the Australian community playgroup model.
In Indonesia, community playgroups have also seen a positive effect on child development and
later educational outcomes (Brinkman, Hasan et al. 2015; Nakajami, Hasan et al. 2016). The
analyses resulting from the impact evaluation considered not only the sequence of services children
enrolled in but the age at which they enrolled and the duration for which they enrolled. The
differences in primary school test scores between a child who had no early education exposure and
a child who completed a full sequence at the developmentally appropriate age were 0.417 SD in
language and 0.427 SD in mathematics – a difference roughly equivalent to an additional 0.9 to
1.2 years of primary schooling (Brinkman, Hasan et al. 2015; Nakajami, Hasan et al. 2016).
Essentially the results support the benefit of children enrolling in community playgroups prior to
progressing to preschool/kindergarten and then onto primary school with pedagogy moving from
unstructured play based learning with progressively increasing levels of structure as the child ages
and moves in preschool and onto primary school. In Indonesia, playgroups are typically for
children aged 3-4 that meet three days per week for three hours each day. They are characterized
6
as play-based learning with a combination of both unstructured and structured play activities,
typically facilitated by teachers who have nominal formal early childhood education training.
These community playgroups will often have anywhere between 10 and 40 children in some
instances, and have limited parental involvement.
Although there is much evidence to support the importance of early child development (Black,
Walker, 2016) and quite a bit of research supporting the benefits of kindergarten and preschool
education services (Nores and Barnett 2010), there is very little research to determine the value of
community playgroups as a non-formal alternative to preschool in low resource settings, or as an
additional important step in the transition for children from the family home environment into the
preschool/schooling system. Considering the limited research to date and the differing modalities
of delivering community based playgroups this randomized evaluation adds significant value to
the nominal literature to date. The need for such research has recently been called for in the most
recent series from the Lancet on the importance of Early Child Development (Dhu, Tomlinson et
al. 2016; Shonkof, Radner et al. 2016).
3. Design
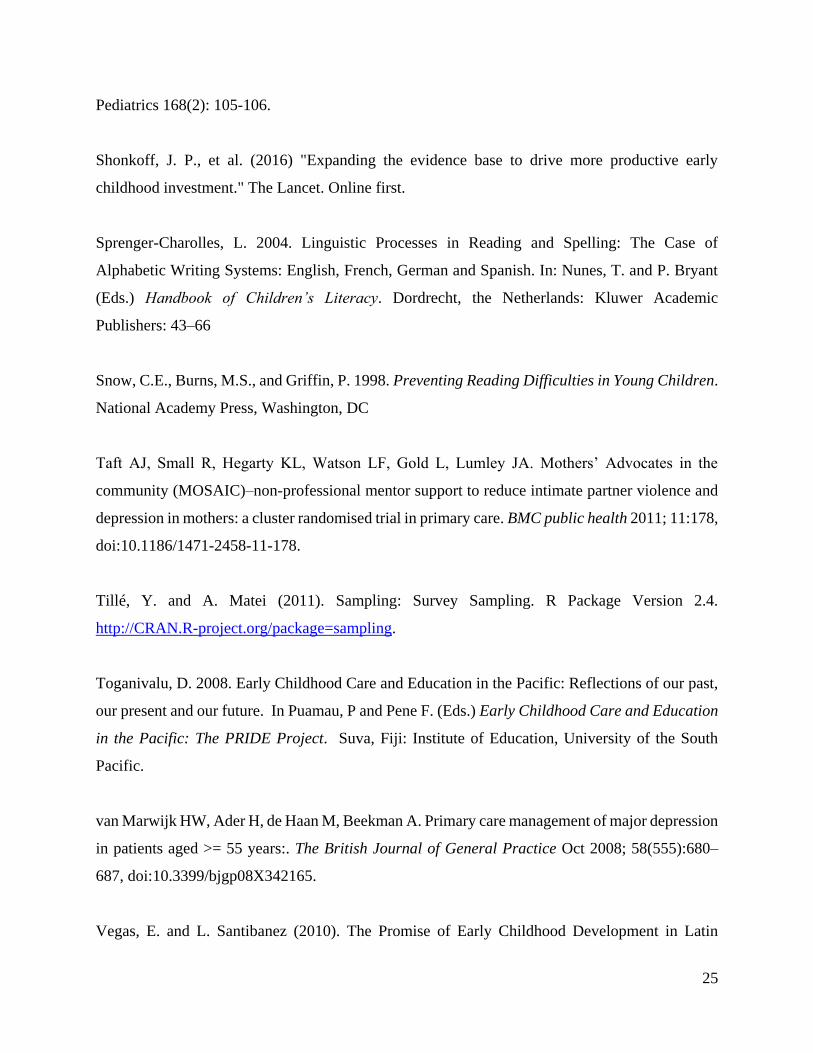
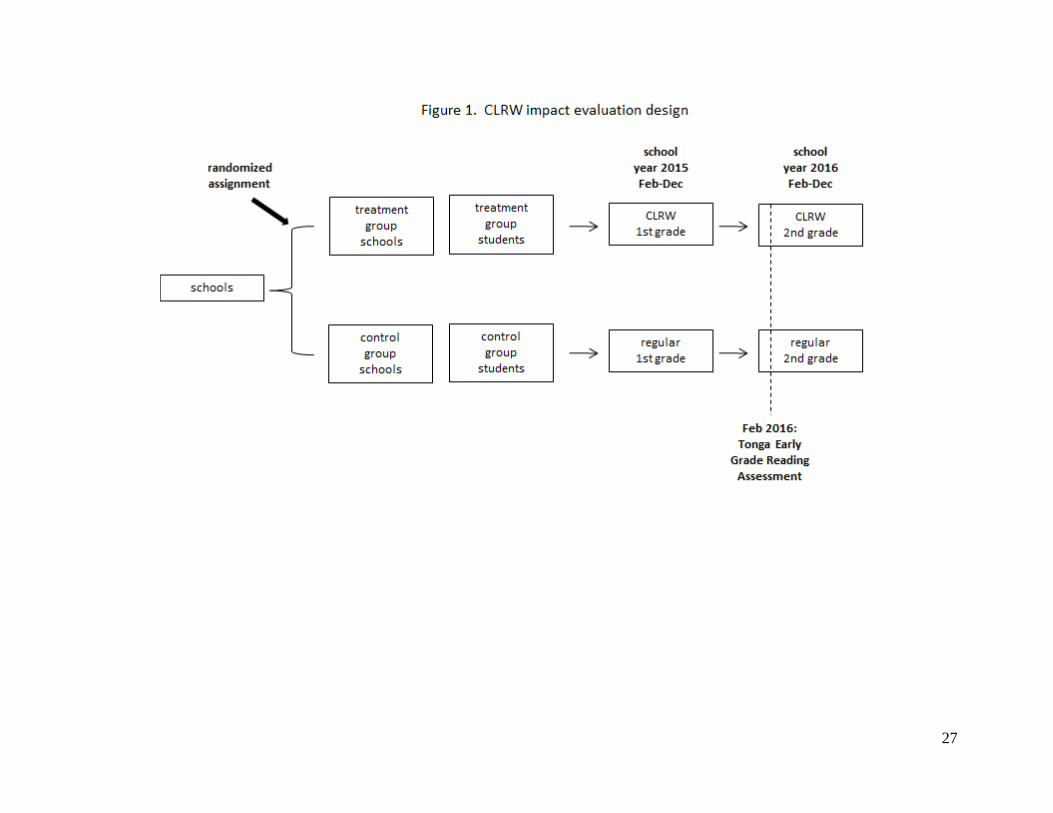
Both the CLRW and CPBA interventions were randomized in order to evaluate their impact on
early literacy and school readiness outcomes. Under the CLRW design, 37 primary schools were
randomly selected into the treatment group while 36 primary schools were randomly selected into
the control group. Selection was stratified by island group, school ownership (public or private),
whether the school received students from communities included in the CPBA intervention, and
the number of children in the first 6 grades. Not all schools were eligible to be selected into the
control or treatment groups: two other primary school interventions were being piloted in several
schools which are excluded from the evaluation’s population. This includes all schools on the
island of ‘Eua. Figure 1 depicts this evaluation design.
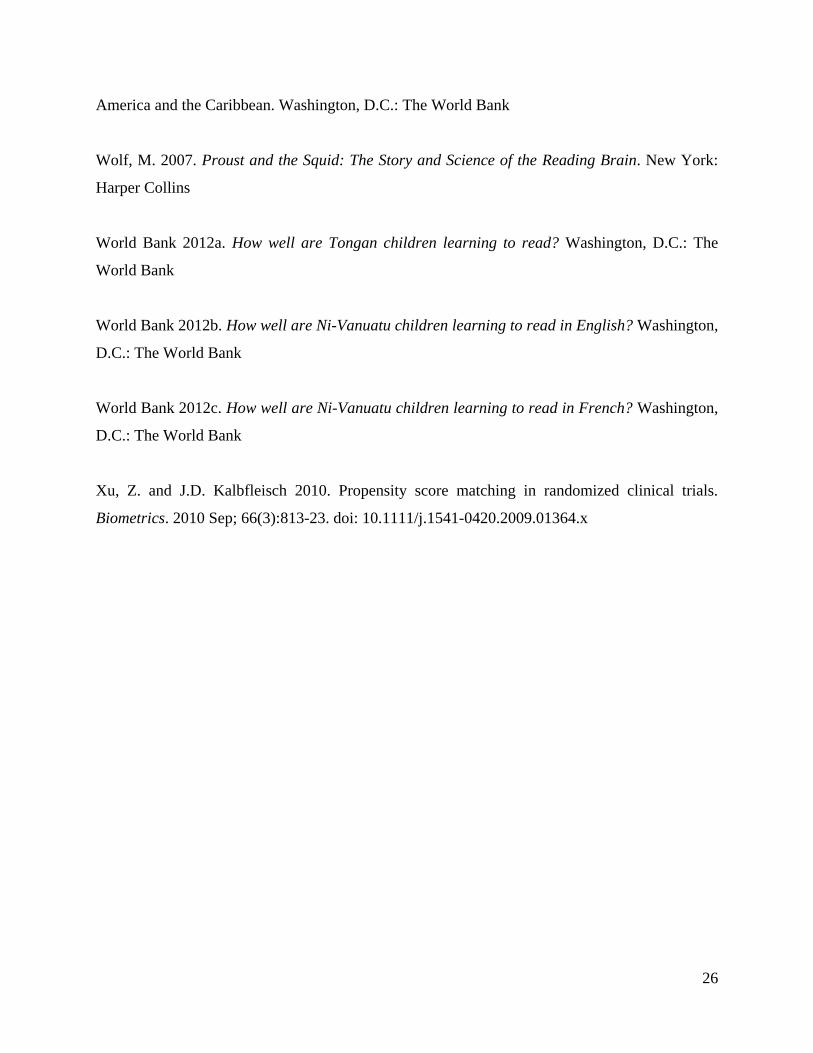
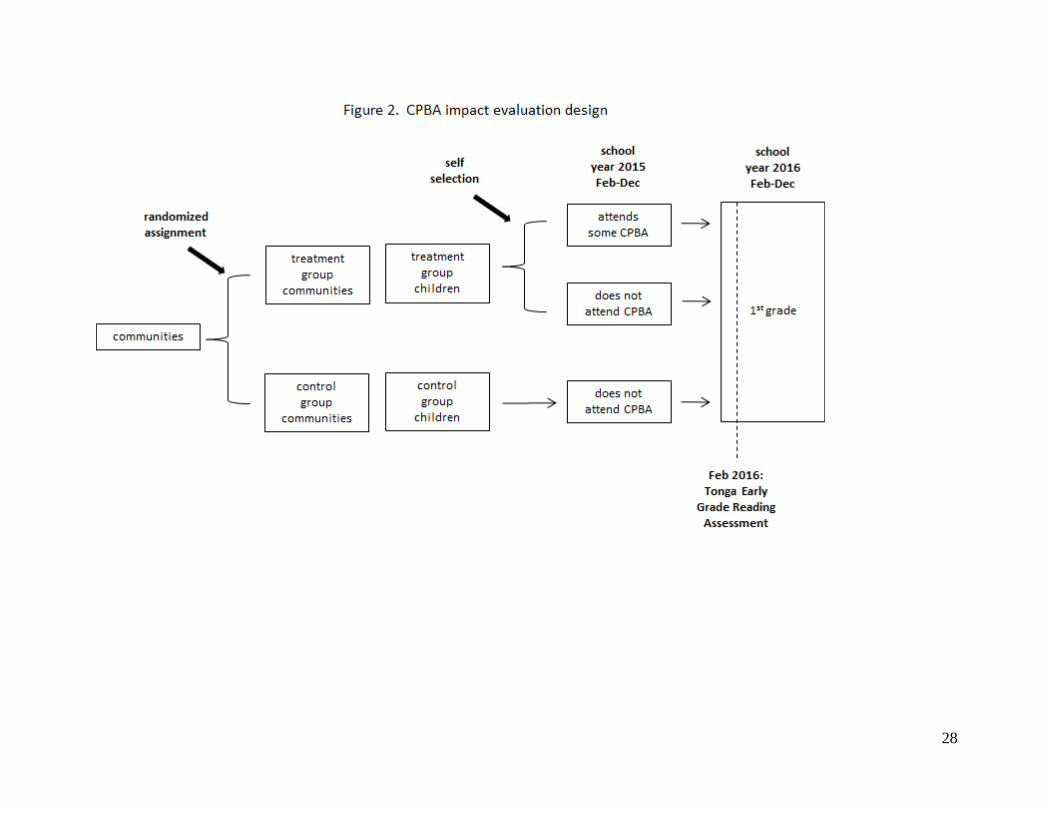
For the CPBA intervention, communities were randomly assigned to a treatment group that
received support to establish a CPBA or a control group that did not receive this support. Forty-
five communities consisting of 59 villages were selected to receive the treatment, while 45 other
communities were selected as control group communities. Assignment was explicitly stratified by
7
island group and implicitly stratified by a measure of average school readiness derived from a
previous survey2 of children ages 3 to 5 years, using the cube method by Deville and Tillé (2004;
2011). At the community level, the intervention consisted of support to communities to establish
a CPBA and, if they did so, continued support and supervision. Whether or not a community
established a CPBA and whether or not parents send their children to attend a CPBA is voluntary
and not randomized. Consequently, the impact evaluation design follows an intent-to-treat
approach using the randomized assignment of communities as an instrument; this assignment is
depicted in Figure 2.
In February, 2016, the Tonga Early Grade Reading Assessment was conducted, assessing reading
outcomes for 1st and 2nd grade students. February is the beginning of the school year; in this
dataset, a subset of 2nd grade students were exposed to the CLRW intervention in the previous year
while a subset of 1st grade students were exposed to the CPBA intervention in the previous year.
Consequently, it is possible to utilize the randomized assignment of the two interventions to
measure their impact on reading outcomes, as depicted in Figures 1 and 2 for the CLRW and
CPBA, respectively.
Both interventions are randomized at the cluster-level (school or community) rather than the
individual (student) level, and the number of clusters is relatively small. Recent research in the
medical evaluation field has contended with poor balancing between treatment and control groups
due to cluster randomization and the subsequent potential for poor inefficient estimates of impact
(van Marwijk et al. 2008; Xu and Kalbfleisch 2010; Ravaud et al. 2009; Roux et al. 2011; Taft et
al. 2011; Schwartz et al 2015; Leyrat et al. 2016). Leyrat et al. 2013 use a Monte Carlo simulation
to assess different methods to address poor balancing in cluster randomized trials; following their
work, this paper includes two additional methods to measure the impact of the interventions that
account for poor balancing between treatment and control groups: linear regression and propensity
score weighting.
For the CLRW intervention, all methods of measuring impact reveal that the program has a
substantial impact on reading outcomes. For example, treatment school students perform 0.56 to
2 This is the Tonga Early Human Capabilities Index (TEHCI) survey conducted in 2014.
8
0.67 standard deviation higher on initial sound knowledge, depending on the method to measure
impact. For letter sounds knowledge, estimates of impact range from 0.59 to 0.75 standard
deviation. Impacts were lower on other reading domains with most between 0.2 and 0.3 standard
deviation. Only letter knowledge did not reveal any clear impact; however, both the treatment and
control groups tend to have high scores on this domain.
For the CPBA intervention, a substantial impact is measured for some of the estimation methods
but not all. By design, estimating the impact of the CPBA follows an intent-to-treat approach
where the randomized assignment of treatment and control communities is used as an instrumental
variable for CPBA attendance. This provides a valid estimate of the impact of the CPBA
intervention as long as the difference in reading outcomes between students from treatment and
control communities can be attributed solely to the CPBA intervention. This identifying
assumption is discussed in detail below. Using this approach, the impact of being in a CPBA is
significant for several reading domains and ranges from 0.14 to 0.36 standard deviation when
accounting for differences in student and school characteristics; no impact is found without
accounting for these differences.
Accounting for differences in student and school characteristics between students from CPBA
treatment and control communities is necessary because of an important data limitation. For just
under half of the students in reading assessment, the community they lived in previously was not
collected; consequently, whether these students were in the treatment or control group is unknown
and cannot be used in the analysis. This creates differences in student and school characteristics
between treatment and control groups; although, there is no systematic pattern of whether known
treatment group students have “better” characteristics than those known to be from the control
group. In subsequent rounds of the early grade reading assessment, the community a child lived
in previously will be collected more carefully.
Comparing the two interventions, the CLRW intervention yields higher impacts on reading
outcomes than the CPBA intervention. The CLRW intervention is more expensive per student
than the CPBA; per dollar, the CPBA intervention yields comparable or higher impacts on reading
outcomes than the CLRW. However, the impact of the CLRW intervention on reading outcomes
9
is more certain than that of the CPBA intervention. A positive impact on reading outcomes for the
CLRW intervention is found for all but one reading domain using all four estimation methods. For
the CPBA intervention, positive impacts are found on fewer reading domains and only when
accounting for differences in student and school characteristics between treatment and control
group. The impact of the CPBA intervention also relies on certain identifying assumptions that
are discussed more thoroughly below.
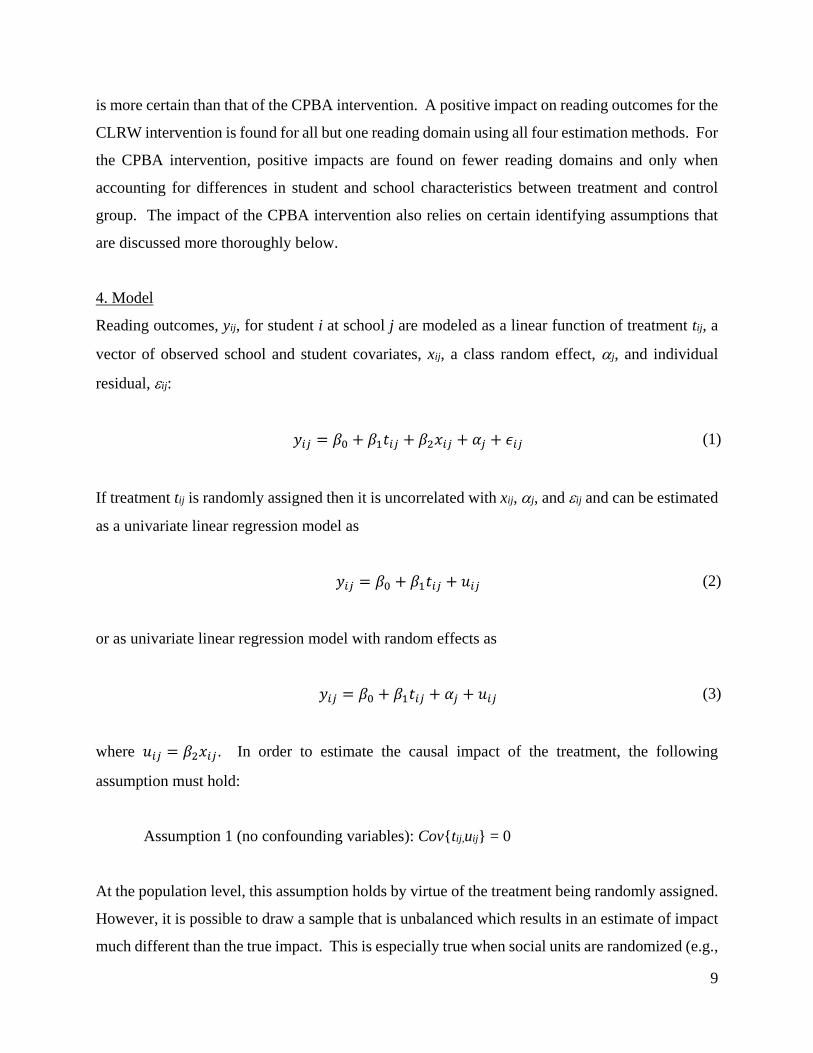
4. Model
Reading outcomes, yij, for student i at school j are modeled as a linear function of treatment tij, a
vector of observed school and student covariates, xij, a class random effect, j, and individual
residual, ij:
𝑦𝑖𝑗 = 𝛽0 + 𝛽1𝑡𝑖𝑗 + 𝛽2𝑥𝑖𝑗 + 𝛼𝑗 + 𝜖𝑖𝑗 (1)
If treatment tij is randomly assigned then it is uncorrelated with xij, j, and ij and can be estimated
as a univariate linear regression model as
𝑦𝑖𝑗 = 𝛽0 + 𝛽1𝑡𝑖𝑗 + 𝑢𝑖𝑗 (2)
or as univariate linear regression model with random effects as
𝑦𝑖𝑗 = 𝛽0 + 𝛽1𝑡𝑖𝑗 + 𝛼𝑗 + 𝑢𝑖𝑗 (3)
where 𝑢𝑖𝑗 = 𝛽2𝑥𝑖𝑗. In order to estimate the causal impact of the treatment, the following
assumption must hold:
Assumption 1 (no confounding variables): Cov{tij,uij} = 0
At the population level, this assumption holds by virtue of the treatment being randomly assigned.
However, it is possible to draw a sample that is unbalanced which results in an estimate of impact
much different than the true impact. This is especially true when social units are randomized (e.g.,
10
school and communities) rather than individuals; it is not possible to balance all characteristics of
individuals by design.
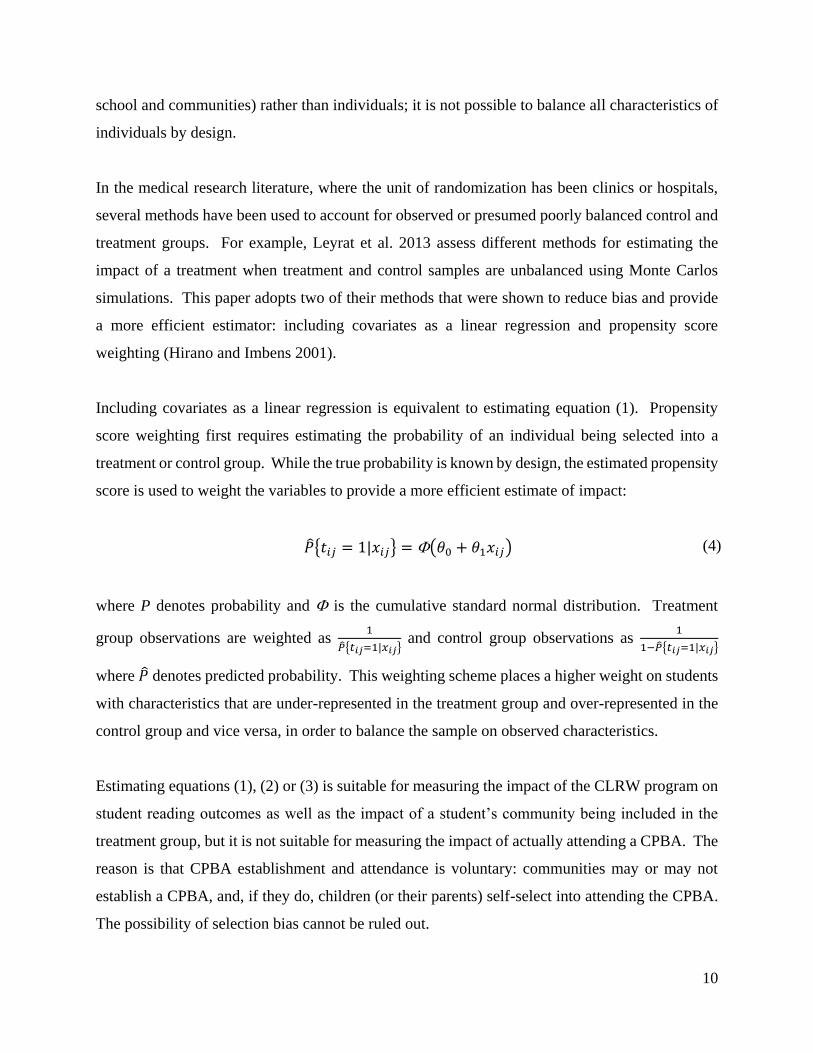
In the medical research literature, where the unit of randomization has been clinics or hospitals,
several methods have been used to account for observed or presumed poorly balanced control and
treatment groups. For example, Leyrat et al. 2013 assess different methods for estimating the
impact of a treatment when treatment and control samples are unbalanced using Monte Carlos
simulations. This paper adopts two of their methods that were shown to reduce bias and provide
a more efficient estimator: including covariates as a linear regression and propensity score
weighting (Hirano and Imbens 2001).
Including covariates as a linear regression is equivalent to estimating equation (1). Propensity
score weighting first requires estimating the probability of an individual being selected into a
treatment or control group. While the true probability is known by design, the estimated propensity
score is used to weight the variables to provide a more efficient estimate of impact:
�̂�{𝑡𝑖𝑗 = 1|𝑥𝑖𝑗} = (𝜃0 + 𝜃1𝑥𝑖𝑗) (4)
where P denotes probability and is the cumulative standard normal distribution. Treatment
group observations are weighted as 1
�̂�{𝑡𝑖𝑗=1|𝑥𝑖𝑗} and control group observations as
1
1−�̂�{𝑡𝑖𝑗=1|𝑥𝑖𝑗}
where �̂� denotes predicted probability. This weighting scheme places a higher weight on students
with characteristics that are under-represented in the treatment group and over-represented in the
control group and vice versa, in order to balance the sample on observed characteristics.
Estimating equations (1), (2) or (3) is suitable for measuring the impact of the CLRW program on
student reading outcomes as well as the impact of a student’s community being included in the
treatment group, but it is not suitable for measuring the impact of actually attending a CPBA. The
reason is that CPBA establishment and attendance is voluntary: communities may or may not
establish a CPBA, and, if they do, children (or their parents) self-select into attending the CPBA.
The possibility of selection bias cannot be ruled out.
11
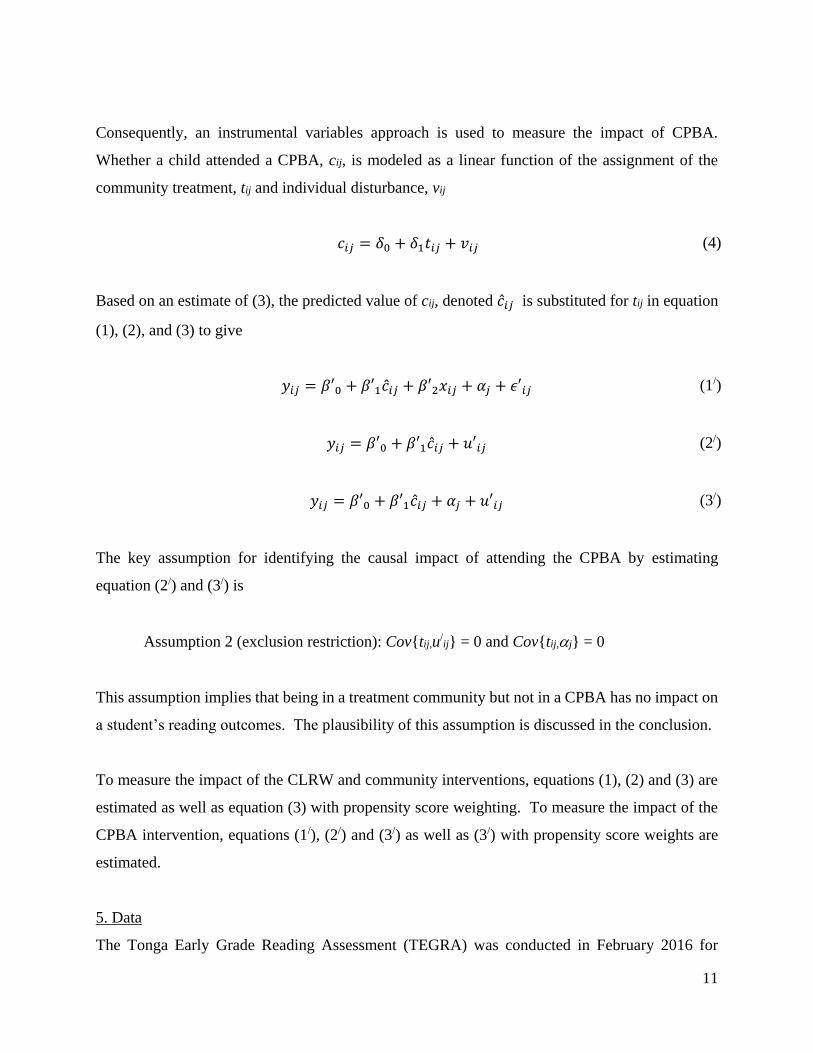
Consequently, an instrumental variables approach is used to measure the impact of CPBA.
Whether a child attended a CPBA, cij, is modeled as a linear function of the assignment of the
community treatment, tij and individual disturbance, vij
𝑐𝑖𝑗 = 𝛿0 + 𝛿1𝑡𝑖𝑗 + 𝑣𝑖𝑗 (4)
Based on an estimate of (3), the predicted value of cij, denoted �̂�𝑖𝑗 is substituted for tij in equation
(1), (2), and (3) to give
𝑦𝑖𝑗 = 𝛽′0 + 𝛽′1�̂�𝑖𝑗 + 𝛽′2𝑥𝑖𝑗 + 𝛼𝑗 + 𝜖′𝑖𝑗 (1/)
𝑦𝑖𝑗 = 𝛽′0 + 𝛽′1�̂�𝑖𝑗 + 𝑢′𝑖𝑗 (2/)
𝑦𝑖𝑗 = 𝛽′0 + 𝛽′1�̂�𝑖𝑗 + 𝛼𝑗 + 𝑢′𝑖𝑗 (3/)
The key assumption for identifying the causal impact of attending the CPBA by estimating
equation (2/) and (3/) is
Assumption 2 (exclusion restriction): Cov{tij,u/ij} = 0 and Cov{tij,j} = 0
This assumption implies that being in a treatment community but not in a CPBA has no impact on
a student’s reading outcomes. The plausibility of this assumption is discussed in the conclusion.
To measure the impact of the CLRW and community interventions, equations (1), (2) and (3) are
estimated as well as equation (3) with propensity score weighting. To measure the impact of the
CPBA intervention, equations (1/), (2/) and (3/) as well as (3/) with propensity score weights are
estimated.
5. Data
The Tonga Early Grade Reading Assessment (TEGRA) was conducted in February 2016 for
12
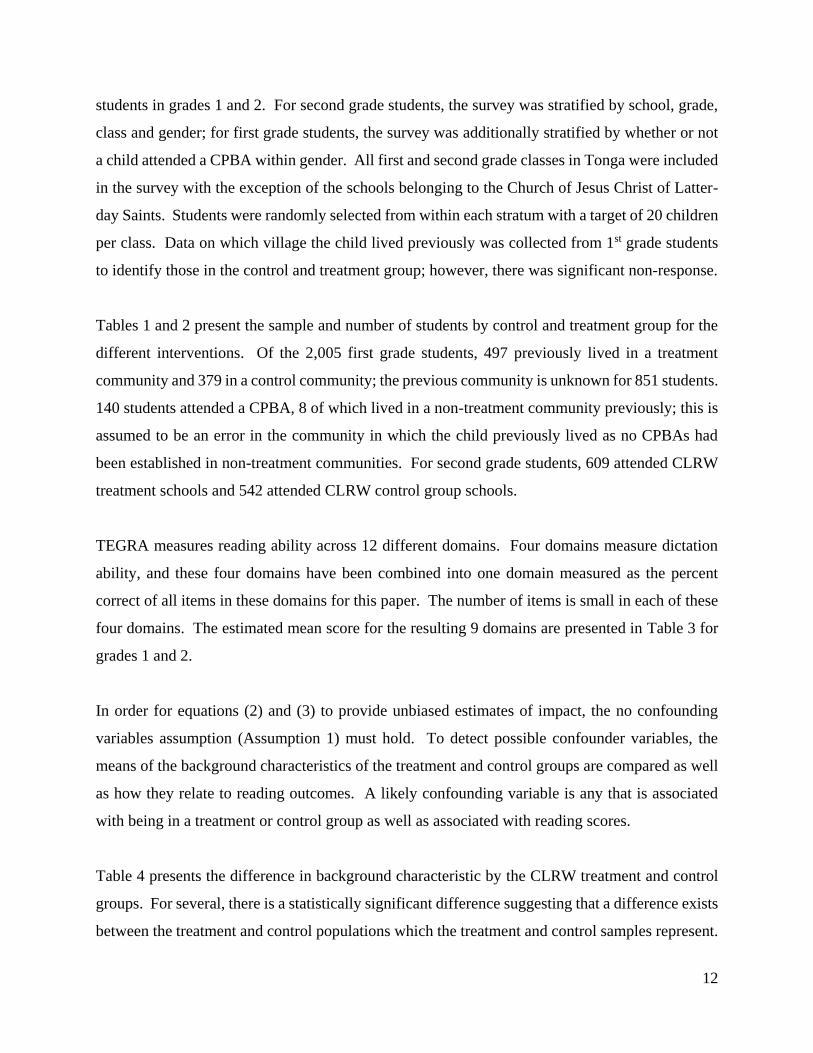
students in grades 1 and 2. For second grade students, the survey was stratified by school, grade,
class and gender; for first grade students, the survey was additionally stratified by whether or not
a child attended a CPBA within gender. All first and second grade classes in Tonga were included
in the survey with the exception of the schools belonging to the Church of Jesus Christ of Latter-
day Saints. Students were randomly selected from within each stratum with a target of 20 children
per class. Data on which village the child lived previously was collected from 1st grade students
to identify those in the control and treatment group; however, there was significant non-response.
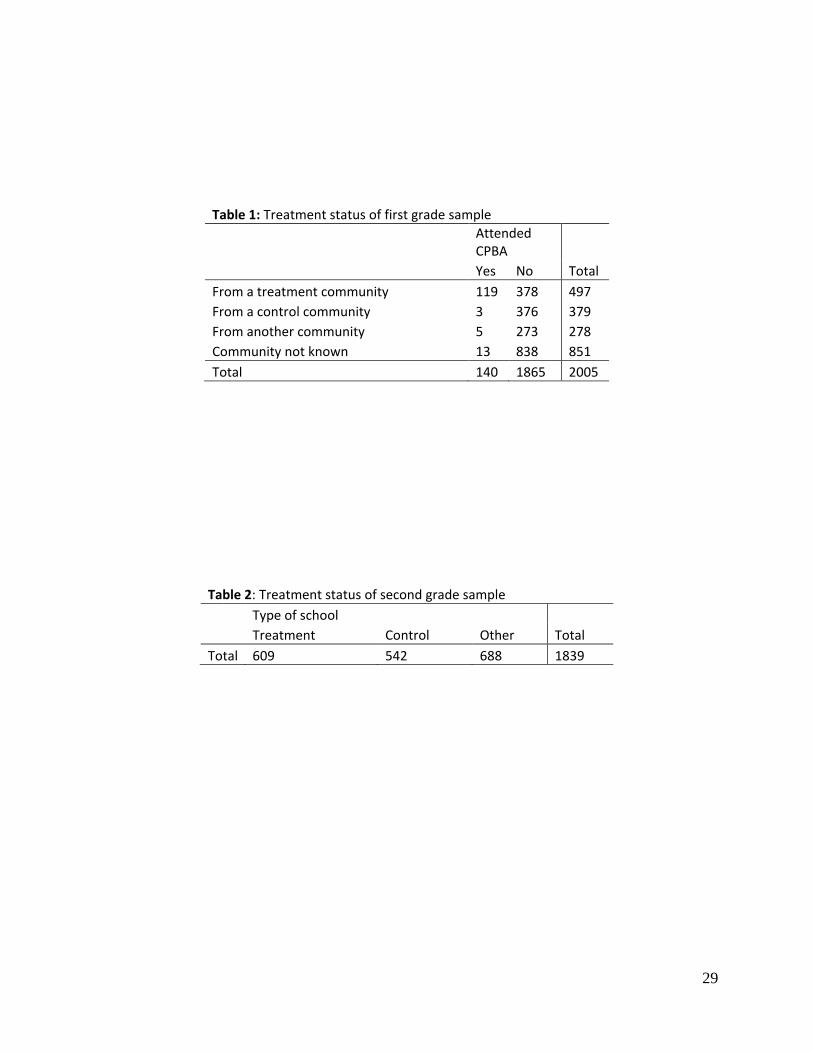
Tables 1 and 2 present the sample and number of students by control and treatment group for the
different interventions. Of the 2,005 first grade students, 497 previously lived in a treatment
community and 379 in a control community; the previous community is unknown for 851 students.
140 students attended a CPBA, 8 of which lived in a non-treatment community previously; this is
assumed to be an error in the community in which the child previously lived as no CPBAs had
been established in non-treatment communities. For second grade students, 609 attended CLRW
treatment schools and 542 attended CLRW control group schools.
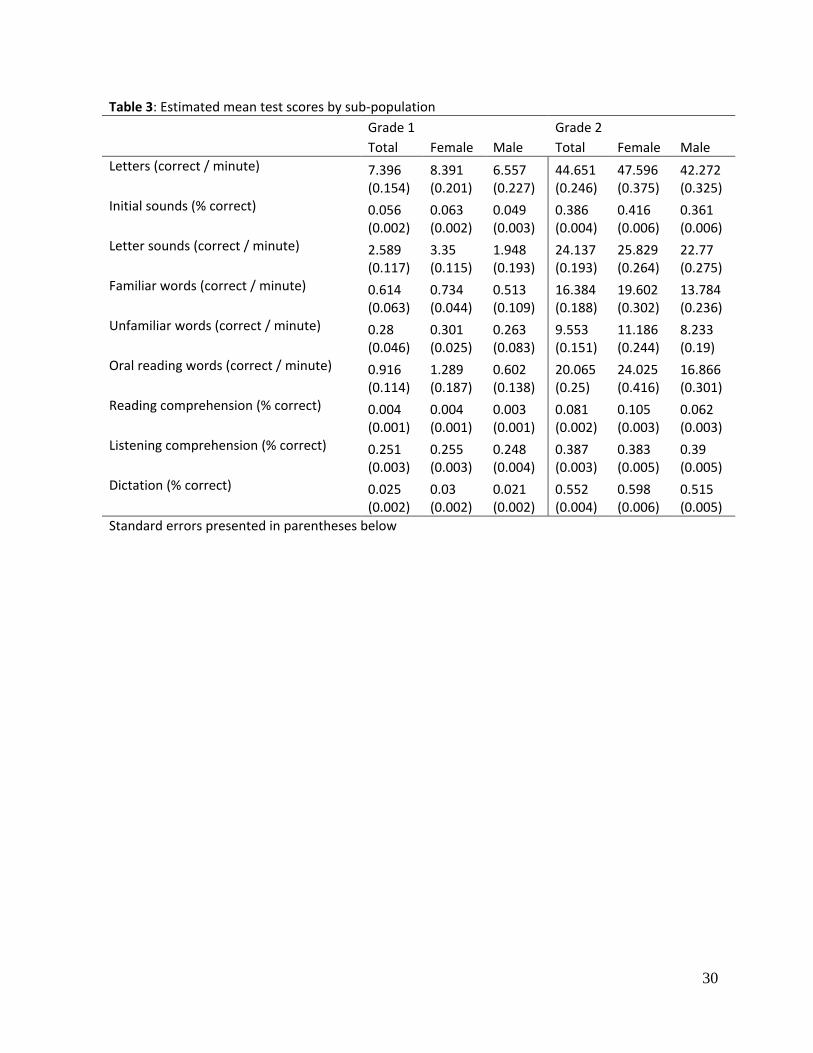
TEGRA measures reading ability across 12 different domains. Four domains measure dictation
ability, and these four domains have been combined into one domain measured as the percent
correct of all items in these domains for this paper. The number of items is small in each of these
four domains. The estimated mean score for the resulting 9 domains are presented in Table 3 for
grades 1 and 2.
In order for equations (2) and (3) to provide unbiased estimates of impact, the no confounding
variables assumption (Assumption 1) must hold. To detect possible confounder variables, the
means of the background characteristics of the treatment and control groups are compared as well
as how they relate to reading outcomes. A likely confounding variable is any that is associated
with being in a treatment or control group as well as associated with reading scores.
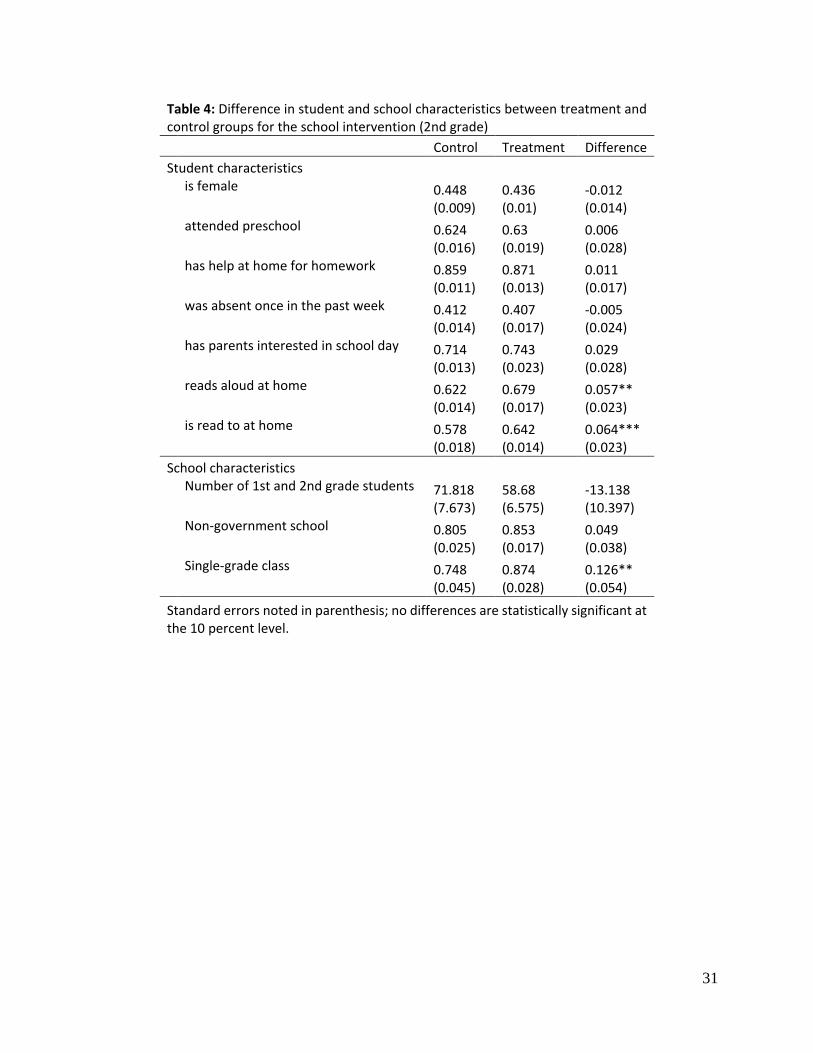
Table 4 presents the difference in background characteristic by the CLRW treatment and control
groups. For several, there is a statistically significant difference suggesting that a difference exists
between the treatment and control populations which the treatment and control samples represent.
13
Children in the CLRW schools are more likely to read aloud at home and more likely to be read to
at home, though the differences are small. There is a large difference between the proportion of
2nd grade students in single grade classes; control group students are 12.6 percent more likely to
be in a single grade class. While equal balance between the treatment and control populations
cannot be ruled out for the other characteristics, large differences can also be ruled out as well.
The exception is the average number of 1st and 2nd grade students in the student’s school: one
cannot reject with confidence that the mean difference is 0 between treatment and control groups
nor that the mean difference is 26.
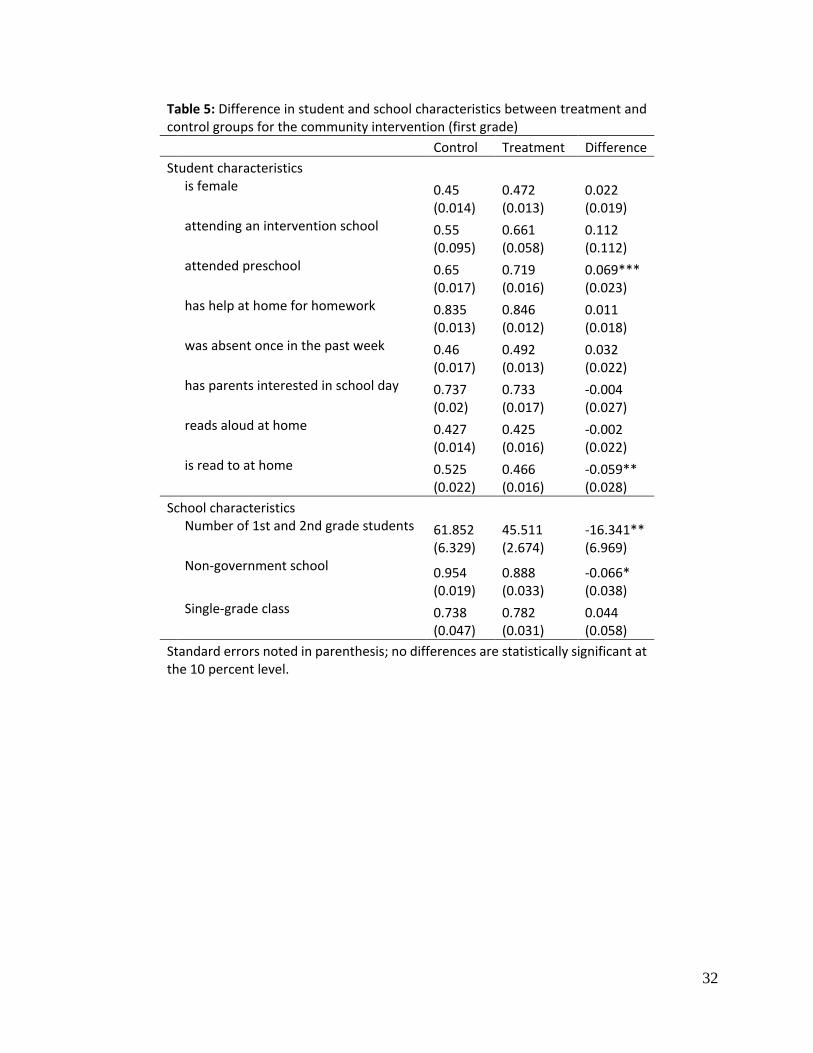
Table 5 compares the data’s student and school characteristics between treatment and control
groups for the community playgroup intervention. Students from treatment communities were
more likely to attend preschool, less likely to have been read to at home, attended a smaller school,
and were less likely to be attending a non-government school. Note that these student and
household characteristics are observed after assignment to the treatment and control group.
Whether these differences in student and household characteristics are a result of treatment
assignment is discussed below as well as the implications.
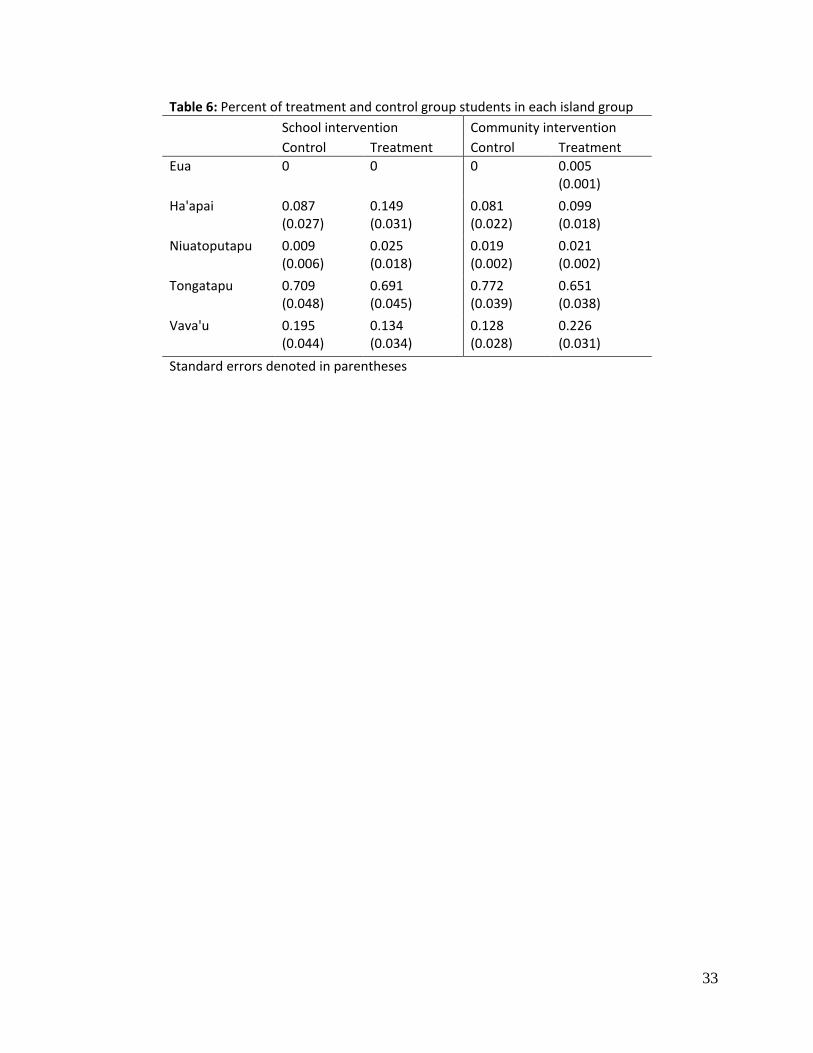
Balancing by island group is presented in Table 6. Both the school and community interventions
assignment of treatment were stratified by island group. For the CLRW intervention, none of the
differences in composition of island groups between treatment and control groups are statistically
significant. However, because of the non-response of previous community, a statistically
significant, higher proportion of students from treatment CBPA communities come from Vava’u
and a lower proportion from Tongatapu.
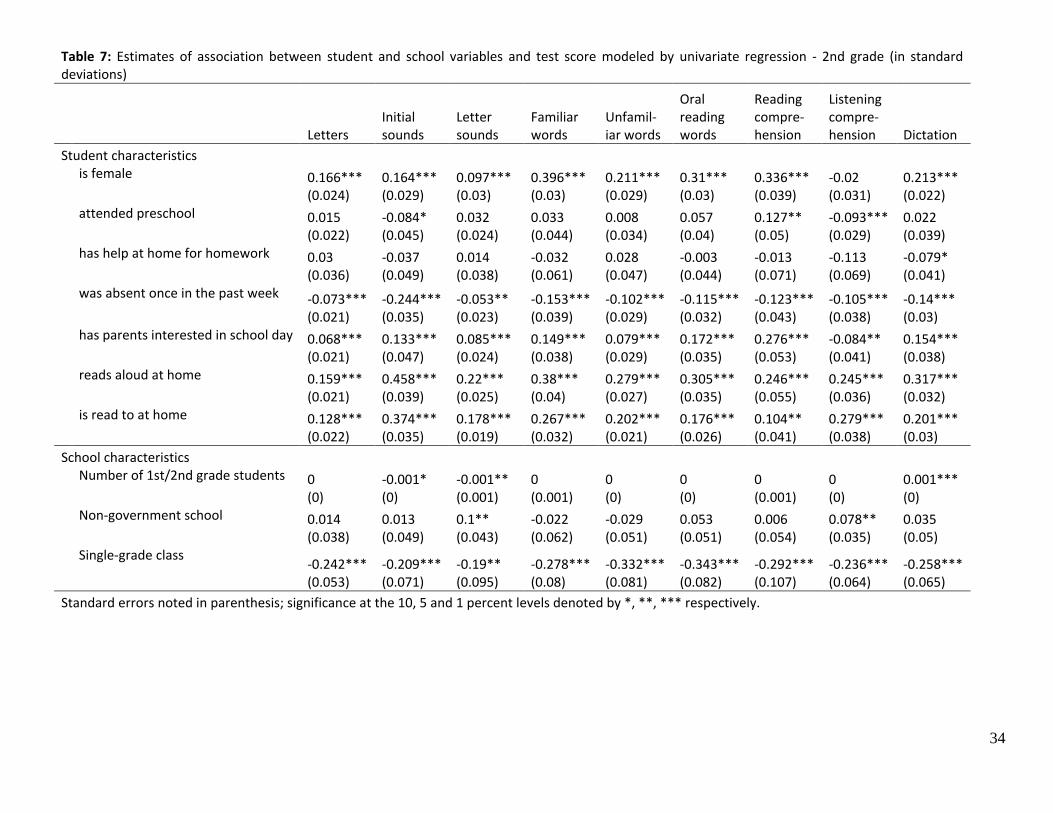
To identify variables that may confound the estimate of the impact of the CLRW intervention,
Table 7 presents the association between each background variable and reading domain score.
Each figure is the coefficient for the denoted variable estimated using a univariate regression with
the denoted variable as the independent variable and test score as the dependent variable. As
depicted in Table 7, being female is positively associated with reading outcomes as is having
parents interested in what the child learned during the school day, and reading at home. Being in
a single grade class as well as being absent is negatively associated with learning outcomes. Three
14
of these variables are also significantly different between the CLRW treatment and control groups
and therefore likely confounders: being read to at home, reading aloud and being in a single grade
class.
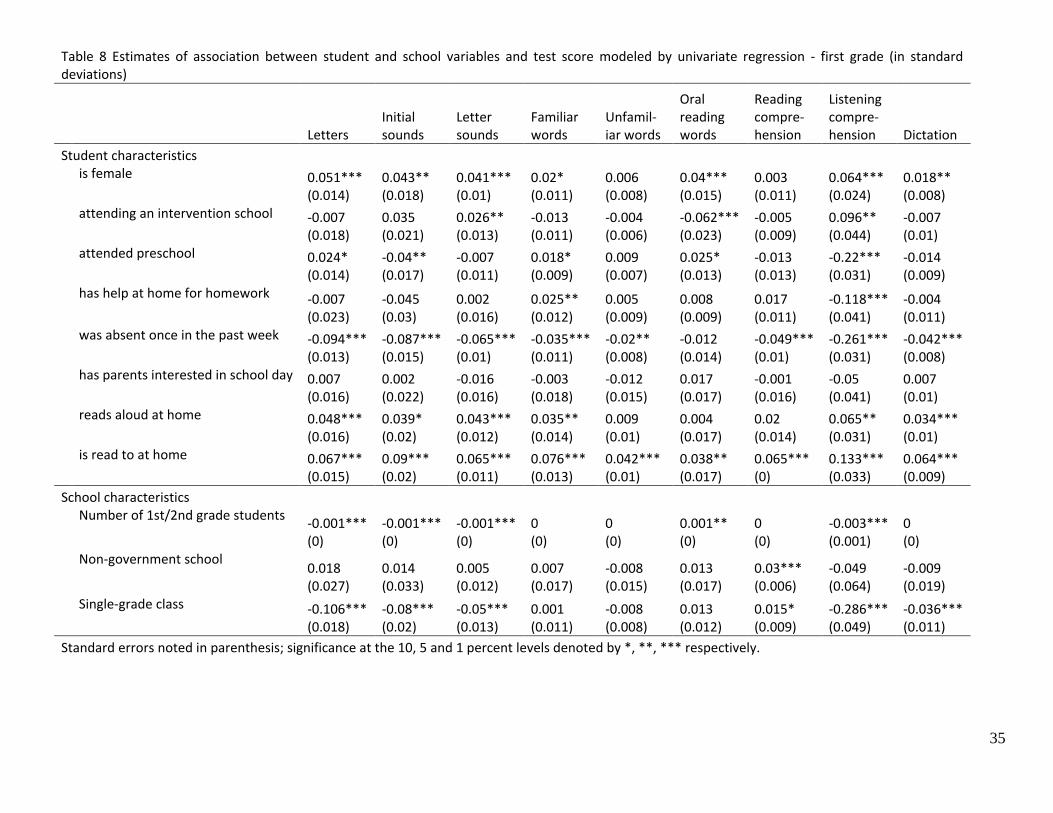
To identify variables that may confound the estimate of the community-level intervention, Table
8 presents the association between each background variable and reading domain score. Being
female, reading aloud at home, being read to at home are each positively associated with reading
score; being absent is negatively associated. Several other variables have a mix of positive,
negative or no conclusive association with learning achievement. Several variables emerge as
likely confounders for measuring the impact of the community intervention: attending preschool,
being read to at home, attending a non-government school and size of the school.
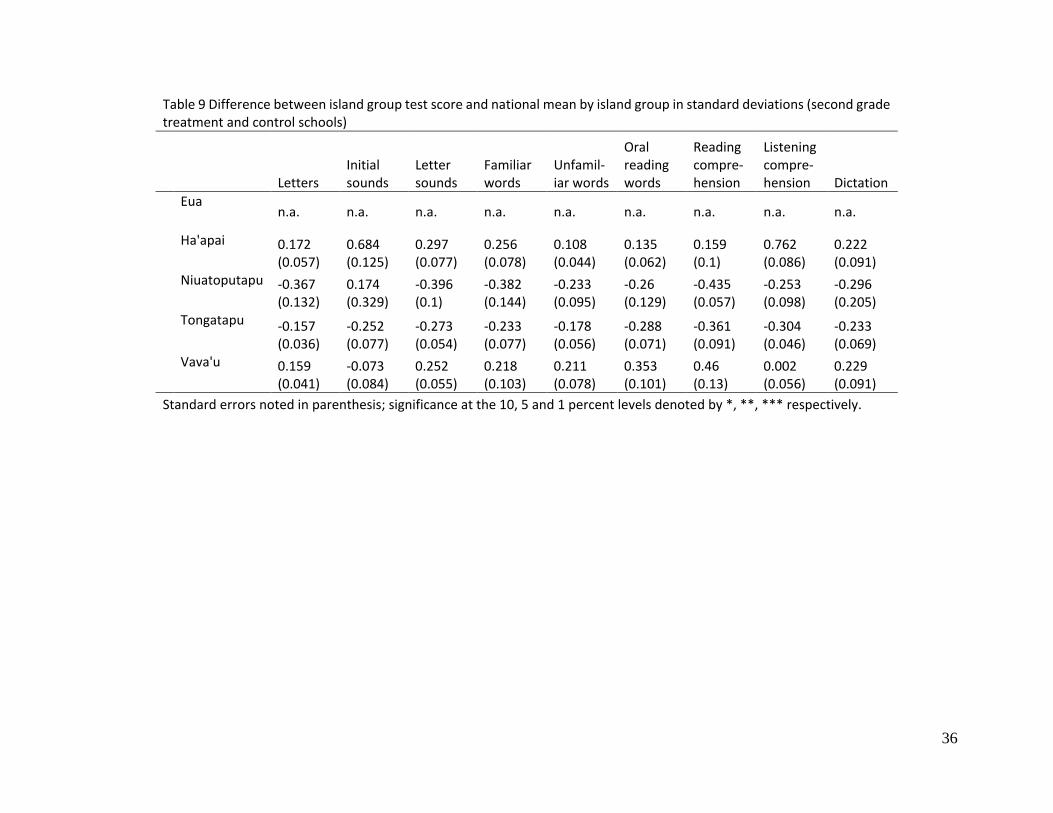
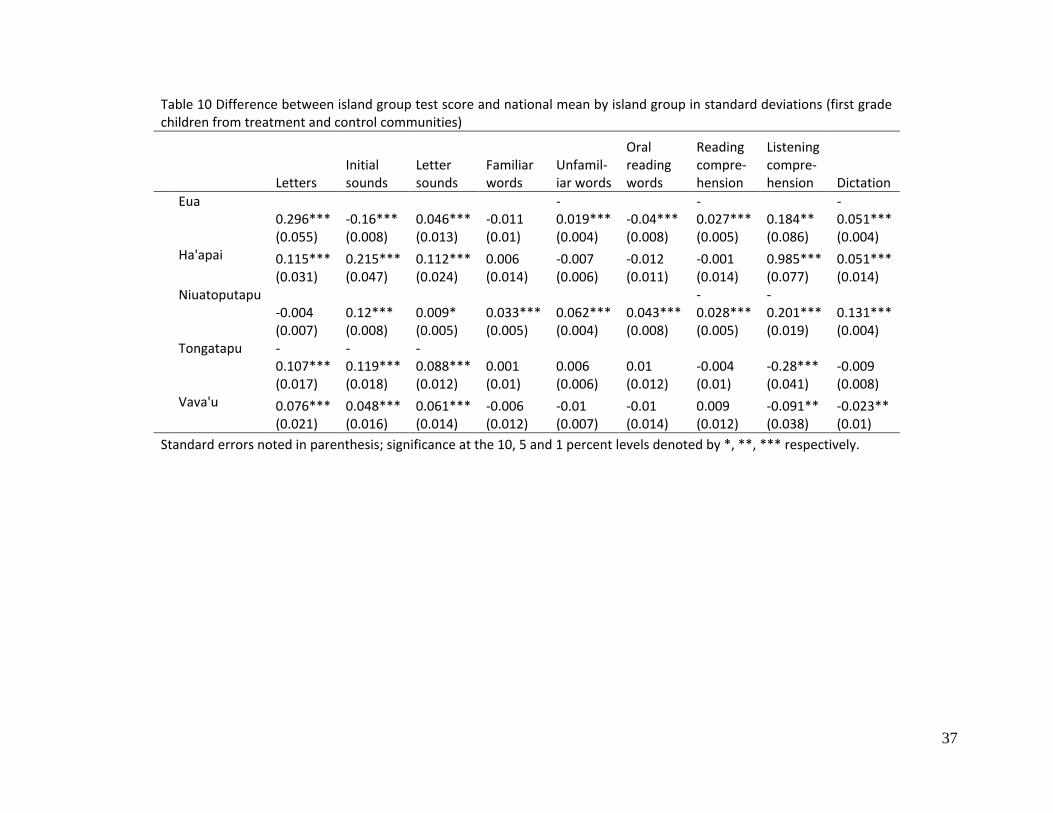
Tables 9 and 10 present the mean reading scores in standard deviations for each island group for
the 2nd grade students in a CLRW treatment or control school and for 1st grade students in a
treatment or control community, respectively. Both depict large differences in achievement
between island groups. For the CLRW intervention, treatment and control groups appear to be
balanced (by design) on representation from island groups. For the community intervention,
because of non-response to which community the child lived in previously, the island group
variable is a likely confounder.
6. Results
The above analysis identified potential confounding variables for both the CLRW and community
intervention. Following the methodology of Leyrat et al. (2013), this section presents estimates of
equations (1), (2), (3) and (3) with propensity score weighting in order to estimate the impact of
these two interventions. All variables included in the previous tables are used as covariates for
calculation of the propensity score and estimates of equation (1). For all estimates, data are
weighted according to the inverse of their selection probability (multiplied by the propensity score
weighting when applicable) and standard errors are estimated robust to clustering at the school
level for the CLRW intervention and at the community level for the community intervention.
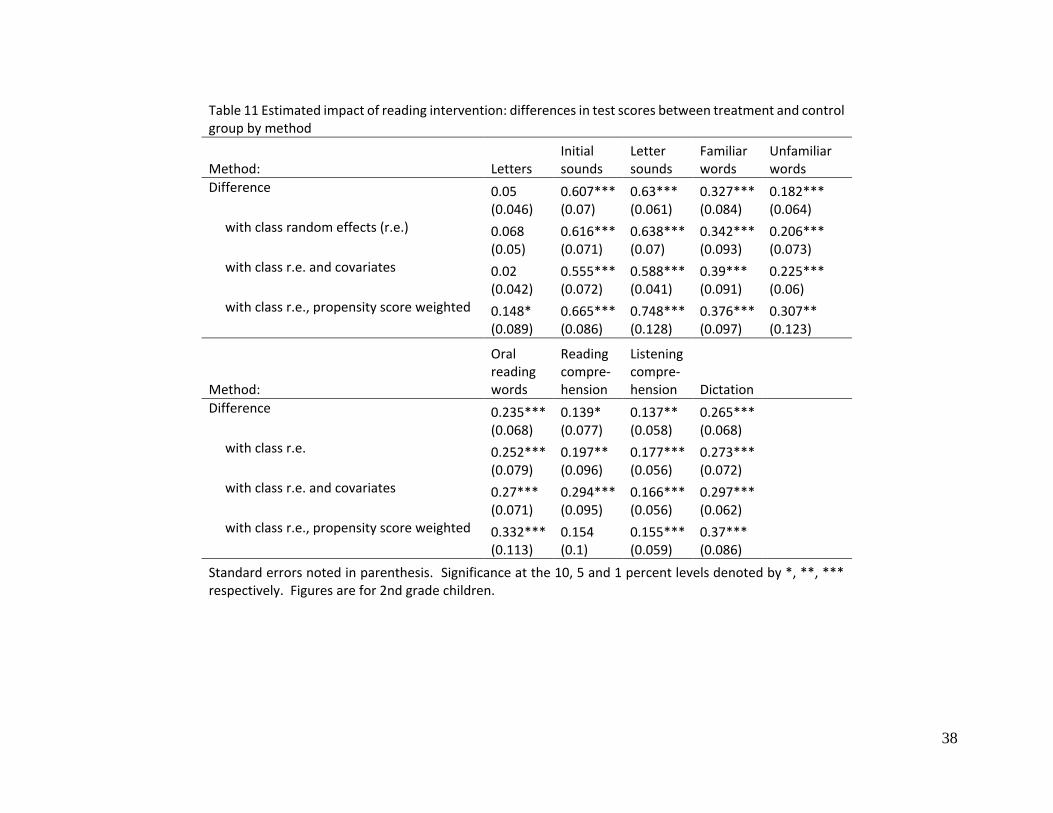
Table 11 presents estimates of impact for the CLRW program by reading domain and method. The
15
figures depict the coefficient for the treatment variable only; all other coefficients are not shown.
The difference method refers to equation (2), the difference with class random effects refers to
estimates of equation (3), with random effects refers to equation (1) and with propensity score
weights refers to equation (3) with propensity score weights. For all domains and methods except
for letters correct per minute, the effect of the CLRW intervention is substantial. The highest
impacts were among the initial and letter sounds; ranging from 0.56 to 0.75 standard deviation
depending on the method. For other domains, impacts were large, mostly around the 0.2 to 0.3
standard deviation range.
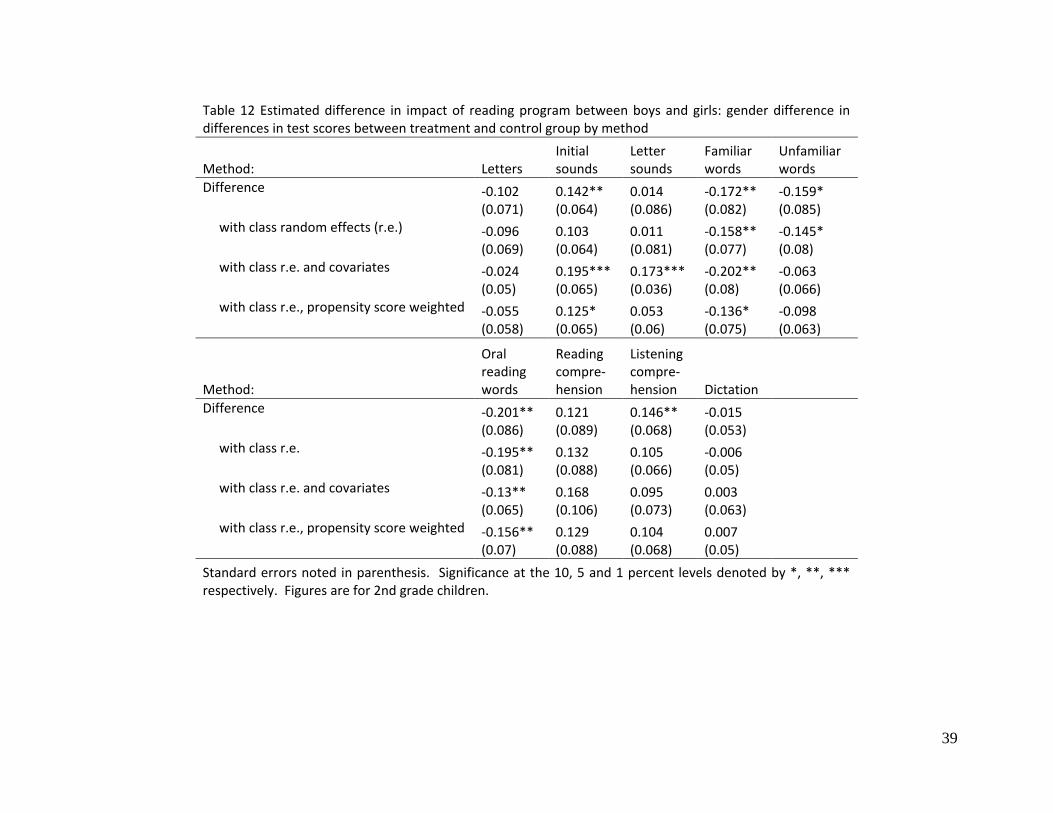
Table 12 measures the difference in effect between boys and girls. These are estimated by
modifying the estimation equations to include a binary variable for gender and an interaction term
for treatment and gender. For nearly half of the domains and estimation methods, a gender
difference in effect is found. In some cases, these benefit boys more (negative values) and in other
cases, they benefit girls more (positive). For example, the intervention tended to impact girls more
for the initial sounds and letter sounds domains and boys more for familiar word, unfamiliar word
and oral reading fluency. Differences range from 0.15 to 0.2 standard deviation.
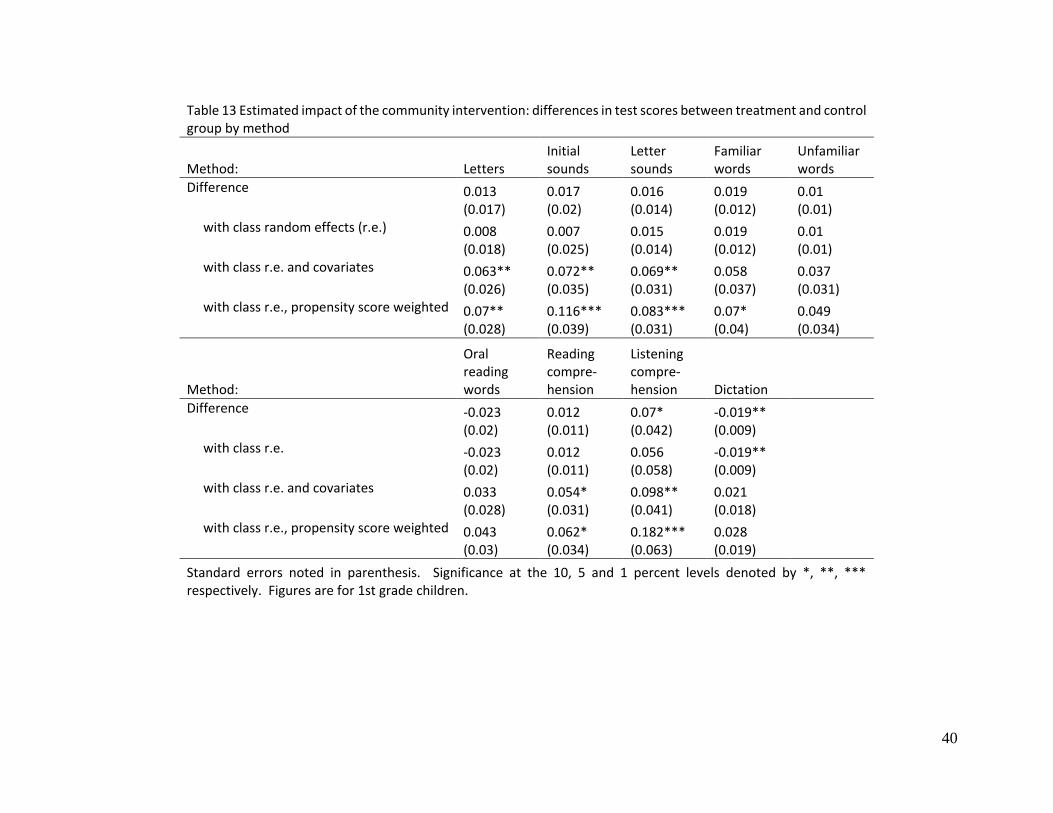
The impact of the community intervention on reading outcomes is presented in Table 13. This is
the impact of being in a treatment group community (not for attending a CPBA which is described
below). Only in two of the estimates of the impact using the difference between treatment and
control groups (equation 2) and that with class random effects (equation 3) are found to be
significant; a positive impact for listening comprehension and a negative impact for dictation.
When adjusting for the covariates (either estimating equation 1 or with propensity score
weighting), positive impacts are found for most domains.
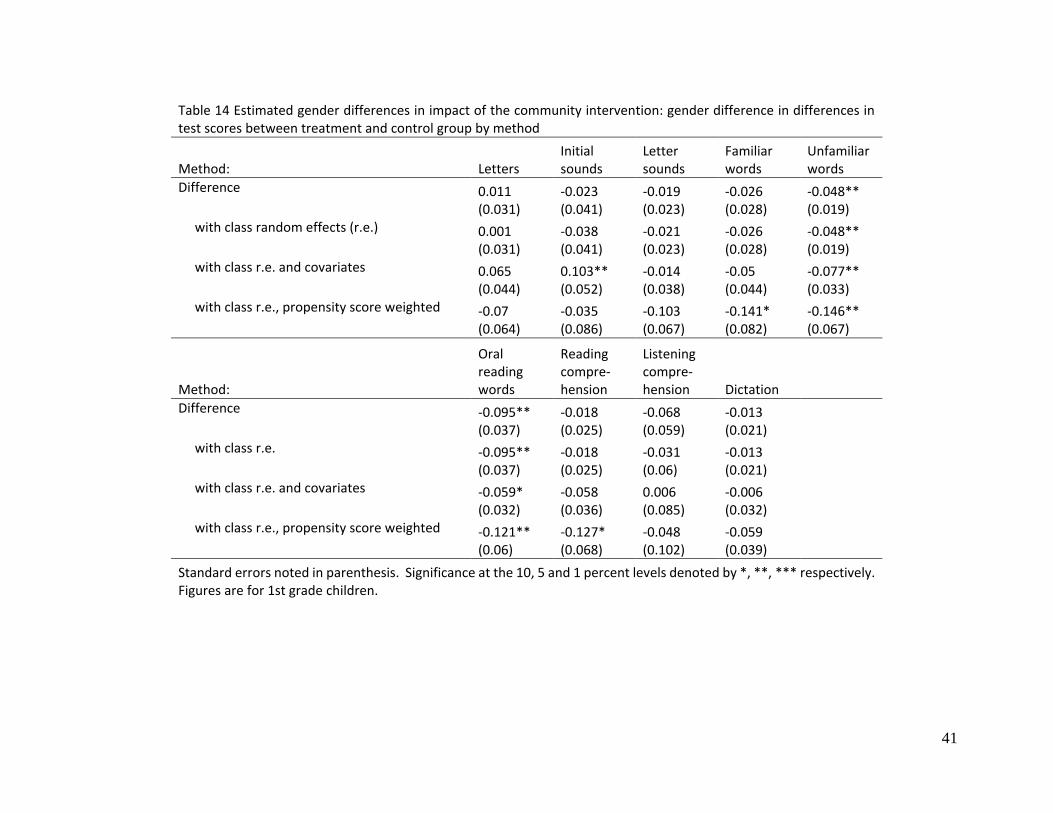
Gender differences in impact of the community intervention are shown in Table 14. The
community intervention tends to have a stronger impact for boys than girls on unfamiliar word
knowledge and oral reading fluency. For most domains, however, no gender difference is detected.
The impact of being in a treatment community is small as shown in Table 13; however, if
assumption (2) holds and this difference can be exclusively attributed to being in a CPBA, then
16
attending a CPBA yields large impacts. Table 15 presents estimates of the impact of being in a
CPBA using treatment status of the children’s community as an instrumental variable (equations
1/, 2/, 3/ and 3/ with propensity score weights). Without adjusting for covariates, no impact of a
CPBA is found except for a negative impact on dictation of negative 0.08 standard deviation.
When controlling for covariates using either method, positive impacts are found for letter
knowledge, letter sounds, familiar words, reading and listening comprehension. Effect sizes range
from 0.14 to 0.36 standard deviation.
7. Cost effectiveness
In order to compare the impact of both interventions, this section presents their impacts in standard
deviations per 100 dollars. Table 16 states the estimated annual operating cost of both the CLRW
and CPBA interventions, based on the actual expenditure during the first year of the intervention.
The CLRW costs include materials produced for the school year, teacher training workshops,
mentoring and supervision visits as well as the time of consultants and government staff in running
the program. It excludes one-time costs related to the design of the program and design of
materials. The total estimated operating cost for CLRW is 255,436 USD or 183 USD per student.
The CPBA costs include training for facilitators, supervision costs, and the costs of consultants
and staff to provide training and supervision. The costs exclude start-up costs provided to
communities as these are incurred only once. They also exclude any materials provided by
communities as well as the opportunity cost of the volunteer facilitators; however, this latter cost
is quite small as volunteers spend about two hours per week. The total number of children
participating in CPBAs for the costing period is 814, and the intervention cost 104 USD per child.
The estimated impacts of the CLRW intervention in standard deviations per 100 dollars are listed
in Table 17. These are the same data presented in Table 11, but divided by the cost per child and
multiplied by 100. Impact of the program per 100 dollars spent ranges between 0.3 and 0.4
standard deviation of initial sounds and letter sounds, and 0.1 to 0.2 standard deviation for the
other domains where a positive impact is found. Table 18 presents the impact in standard
deviations per 100 dollars for the CPBA intervention; this is based on the results presented in Table
15. Impacts range from 0.1 to 0.3 standard deviation using the balancing methods and for which
statistically significant impacts are found.
17
8. Conclusions
With the exception of letter knowledge, the CLRW intervention has a substantial impact on
children’s reading outcomes. The lack of impact on letter knowledge is not surprising given that
it is a basic skill which 2nd grade students would know well already. An interesting pattern emerges
when gender differences are measured. There is evidence that the CLRW is having a different
effect on girls’ and boys’ reading outcomes on some domains, depending on the estimation
method. Boys have lower reading outcomes than girls in all domains according to Table 3 except
for listening comprehension; if the impact were to benefit boys as it seems to for familiar words,
unfamiliar words and oral reading fluency, then this would suggest that the program helps close
the gender gap in reading skills. Alternatively, if the program benefits girls more, as is the case
for initial sound knowledge, then it may be exacerbating the gender gap.
Drawing conclusions on the impact of attending a CPBA is complicated by the identifying
assumption. First, the exclusion restriction—that the impact of being in a treatment community is
exclusively due to attending a CPBA—must hold in order to attribute causality. How plausible is
this assumption? The CPBA is a community run and financed intervention, so community leaders
(town officers, local education officials, etc.) motivate community members to provide volunteers
and attendance. This may raise the profile of supporting education for young children. From the
comparison of background variables in Table 5, treatment communities were more likely to send
their children to preschool but also less likely to read to their children at home. Note that it is not
possible to test empirically whether the exclusion restriction assumption holds; qualitative work
would be useful for understanding the pathways and extent to which the community intervention
could affect reading outcomes.
While the evidence of the impact of the CLRW intervention is stronger than that of the CPBA, the
magnitudes of impact are comparable in several domains when adjusting for cost per child. With
the exception of the initial letter sounds and sound of letters domains, most of the CLRW
interventions which are statistically significant have impacts ranging from 0.1 to 0.2 standard
deviation per 100 USD. For the CPBA intervention, most of the statistically significant impacts
lie in this range as well. The magnitudes of the effect sizes found for the Tongan CPBA
18
intervention are consistent with much of the literature evaluating the impact of early child health,
developmental and education outcomes in the last decade, as pointed out by Shonkof (2014).
Many in the field of early child health and development quote the highly studied “iconic”
programs: Perry Preschool, Abecedarian and Nurse Family Partnerships. All three of these
programs were conducted in America with small sample sizes in the late 1960s - early 1970s. The
relevance of the impact of those programs to current interventions aimed at improving child health
and capabilities in remote communities across the Asia Pacific is hard to see. As such, the findings
of this paper are highly relevant to neighboring countries in the Pacific and indeed other low
resources settings. The findings of small to moderate effect sizes on the basis of a relatively low
cost and small dose intervention are cause for attention in the international literature.
That the CPBA intervention is able to produce impacts comparable to the CLRW intervention in
several reading domains (when adjusted for per child cost) highlights the importance of school
readiness interventions for improving early literacy outcomes. The CLRW intervention is
designed to target the reading skills measured in the early grade reading assessment; a substantial
impact on these skills is in some sense not surprising. That CPBA can improve early literacy
outcomes confirms the importance that school readiness has for a student’s ability to learn in a
school environment and may be as important as pedagogy, at least in some measures.
The objective of the broader PEARL program is to identify, pilot and evaluate interventions that
may boost early literacy outcomes and school readiness. These initial findings demonstrate that
both interventions as implemented are effective at improving early literacy. The randomized
assignment of the CLRW treatment to schools ensures that the measures of its impact are the causal
impact of the intervention. Using the randomized assignment of support to communities as an
instrument for the CPBA intervention also provides a causal measure of impact as long as the
identifying assumptions described above hold. These initial findings provide credible evidence
that both programs have a positive impact on children’s early literacy outcomes and would have
similar impacts if scaled up.
These findings also contribute to a growing body of research on the impact of reading instruction
interventions that are research-based. They also provide for the first time, to the knowledge of the
19
authors, a measure of the impact of community playgroups on literacy outcomes. Further data
collection is planned in Tonga, including follow-up early grade reading assessments and a survey
of school readiness for children aged 3 to 5. The early grade reading assessment will enable
comparing the interaction between both interventions which was not possible with the latest data
set. In addition, a scaling exercise is currently underway which will provide comparable measures
of reading outcomes from the preceding early grade reading assessment in 2012. The upcoming
school readiness assessment will enable measurement of the impact of the CPBA intervention on
school readiness more broadly, including cognitive, socio-emotional and physical development.
Additional research is needed on the applicability of these interventions not only in other countries
in the Pacific, but also the developing world. The CLRW intervention is likely replicable in many
contexts, as it can be implemented by education providers. The CPBA intervention is more
nuanced, as it relies on community social capital to be successful; however, numerous examples
exist of community playgroups and other community-based approaches to health elsewhere.
20
References
Abadzi, H. 2006. Efficient learning for the poor: Insights from the Frontier of Cognitive
Neuroscience. Washington, DC: The World Bank.
Alexander, K.L., Entwisle, D.R., Horsey, C.S., 1997. From first grade forward: early foundations
of high school dropout. Sociology of Education 70 (2), 87–107
August, D., and Shanahan, T. 2006. Developing Literacy in Second-Language Learners: A Report
of the National Literacy Panel on Language, Minority Children, and Youth. Mahwah NJ USA:
Lawrence Erlbaum Associates
Azariadis, C. and A. Drazen 1990. Threshold externalities in economic development. The
Quarterly Journal of Economics. 105 (2): 501-526.
Basu, K. and J. Foster 1998. On measuring literacy. Policy Research Working Paper Series. No.
1997. Washington, D.C.: The World Bank
Black, M. M., et al. (2016) "Early childhood development coming of age: science through the life
course." The Lancet.
Bowman, B., M. Donovan, and M. Burns. 2001. Eager to Learn: Educating our Preschoolers.
Washington, DC: National Academy Press.
Brinkman, S., A. Hasan, H. Jung, A. Kinnell, M. Pradhan. 2015 The Impact of Expanding Access
to Early Childhood Services in Rural Indonesia: Evidence from Two Cohorts of Children. World
Bank Working Paper Series. July 2015. WPS7372.
http://documents.worldbank.org/curated/en/2015/07/24808116/impact-expanding-access-early-
childhood-services-rural-indonesia-evidence-two-cohorts-children
Brooks-Gunn J., C. Rouse, and S. McLanahan. 2007. “School Readiness and the Transition to
Kindergarten.” In Racial and Ethnic Gaps in School Readiness, edited by R. C. Pianta, M J. Cox,
21
and K. Snow, 283–306. Baltimore, MD: Paul H. Brookes.
Butler, S.R., H. W. Marsh, M. J. Sheppard, and J. L. Sheppard 1985. Seven-year longitudinal study
of the early prediction of reading achievement. Journal of Educational Psychology, 77, 349-361
Chiappe, P., L. Siegel, and L. Wade-Woolley. 2002. Linguistic diversity and the development of
reading skills: A longitudinal study. Scientific Studies of Reading 6(4): 369–400
Deville, J. and Y Tillé (2004). Efficient Balanced Sampling: The Cube Method. Biometrika. Vol.
91, No. 4 (Dec. 2004). pp. 893-912.
Dua, T., et al. (2016) "Global research priorities to accelerate early child development in the
sustainable development era." The Lancet Global Health. Online first.
Entwisle, D. R., K. L. Alexander, and L. S. Olson 2005. First grade and educational attainment by
age 22 A New Story. American Journal of Sociology, 110 1458-1502
Farran, S. 2009. Human rights in the South Pacific: Challenges and changes, 181. London:
Routledge Cavendish
Fuchs, L., D. Fuchs, M.K. Hosp, and J. Jenkins. 2001. Oral Reading Fluency as an Indicator of
Reading Competence: A Theoretical, Empirical, and Historical Analysis. Scientific Studies of
Reading 5(3), 239–256.
Hirano K, and Imbens GW 2001. Estimation of causal effects using propensity score weighting:
An application to data on right heart catheterization. Health Services and Outcomes Research
Methodology Dec 2001; 2(3):259–278.
Huffer E (2006), Cultural Rights in the Pacific – What they mean for Children, ‘Children’s Rights
and Culture in the Pacific’ Seminar, 30th October 2006
22
Gove, A. and P. Cvelich. 2011. Early Reading: Igniting Education for All. A report by the Early
Grade Learning Community of Practice. Revised Edition. Research Triangle Park, NC: Research
Triangle Institute.
Gregory, T., Harman-Smith, Y., Sincovich, A., Wilson, A., & Brinkman, S. (2016). It takes a
village to raise a child: The influence and impact of playgroups across Australia. Telethon Kids
Institute, South Australia. ISBN 978-0-9876002-4-0.
Griffen V (2006), Gender Relations in Pacific cultures and their impact on the growth and
development of children, ‘Children’s Rights and Culture in the Pacific’ Seminar, 30th October
2006
Hancock, K. J., et al. (2015). "Playgroup Participation and Social Support Outcomes for Mothers
of Young Children: A Longitudinal Cohort Study." PLoS ONE 10(7: e0133007)
Jimerson, S., Egeland, B., Sroufe, L.A., Carlson, B., 2000. A prospective longitudinal study of
high school dropouts: examining multiple predictors across development. Journal of School
Psychology 38 (1), 525–549
Leyrat, C., A. Caille, A. Donner and B. Giraudeau 2013. Propensity Scores Used for Analysis of
Cluster Randomized Trials with Selection Bias: a Simulation Study. Statistics in Medicine · August
2013.
Leyrat, C., A. Caille, Y. Foucher and B. Giraudeau 2016. Propensity score to detect baseline
imbalance in cluster randomized trials: the role of the c-statistic. BMC Medical Research
Methodology (2016) 16:9DOI 10.1186/s12874-015-0100-4
Linan-Thompson, S., and S. Vaughn. 2007. Research based methods of reading instruction for
English language learners: Grades K–4. Alexandria, VA: Association for Supervision and
Curriculum Development
23
Magnuson, K. A., et al. (2007). "Does prekindergarten improve school preparation and
performance?" Economics of Education Review 26(1): 33-51.
Marteleto, L., D. Lam, V. Ranchhod, 2008. Sexual behavior, pregnancy, and schooling among
young people in urban South Africa. Studies in Family Planning 39 (4), 351–368.
Nakajima, N., Hasan, A., Jung H., Brinkman S., Pradhan M., Kinnell A. (2016) Investing in
School Readiness: An analysis of the Cost Effectiveness of Early Childhood Education Pathways
in Rural Indonesia. WPS 7832. World Bank.
http://documents.worldbank.org/curated/en/656521474904442550/Investing-in-school-readiness-
an-analysis-of-the-cost-effectiveness-of-early-childhood-education-pathways-in-rural-Indonesia
National Institute for Child Health and Human Development 2000. Report of the National Reading
Panel. Teaching Children to Read: An Evidence-based Assessment of the Scientific Research
Literature on Reading and its Implications for Reading Instruction. (NIH Publication No. 00-
4754). Washington, DC: National Institutes of Health
National Reading Panel. 2000. Teaching Children to Read: An Evidence-Based Assessment of the
Scientific Research Literature on Reading and Its Implications for Reading Instruction.
Washington, DC: National Institute of Child Health and Human Development.
Naudeau, S., N. Kataoka, A. Valerio, M. J. Neuman, L. Kennedy Elder (2010). Investing in Young
People. An Early Childhood Development Guide for Policy Dialogue and Project Preparation.
Conference Edition. Washington, D.C.: The World Bank.
Nores, M. and W. S. Barnett (2010). Benefits of early childhood interventions across the world:
(Under) Investing in the very young. Economics of Education Review. 29:271-282.
OECD 2014. PISA 2012 Results: What Students Know and Can do: Student Performance in
Mathematics, Reading and Science (Volume I) [Revised edition February 2014]. Paris: OECD
24
PASEC 2015. PASEC 2014. Education System Performance in Francophone Sub-Saharan Africa.
Competencies and learning factors in primary education. Dakar: CONFEMEN
Pressley, M., 1998. Reading Instruction That Works: The Case for Balanced Teaching.
New York: The Guilford Press
Ravaud P, Flipo R, Boutron I, Roy C, Mahmoudi A, Giraudeau B, Pham T. ARTIST (osteoarthritis
intervention standardized) study of standardised consultation versus usual care for patients with
osteoarthritis of the knee in primary care in France: pragmatic randomised controlled trial. BMJ
(Clinical research ed.) 2009; 338:b421.
Rosenzweig, M. R. 1995. Why are there returns to schooling? The American Economic Review.
Vol. 85, No. 2: 153-158
Roux C, Giraudeau B, Rouanet S, Dubourg G, Perrodeau E, Ravaud P. Monitoring of bone
turnover markers does not improve persistence with ibandronate treatment. Joint, Bone, Spine:
Revue Du Rhumatisme Jun 2011; doi:10.1016/j.jbspin.2011.05.001.
Sandraluz L. C., A. R. Pebley, M. E. Vaiana, and E. Maggio. 2004. Are L.A.’s Children Ready for
School? Santa Monica, CA: RAND Corporation.
Scarborough, H. S. 2002. Connecting Early Language and Literacy to Later Reading (Dis)abilities:
Evidence, Theory, and Practice. In: Dickinson, D.K. and S.B. Neuman. Handbook of Early
Literacy Research (vol. 1). Edited by. New York: The Guilford Press: 97-110
Schwartz R, Vigo Á, Dias de Oliveira L, Justo Giugliani ER (2015) The Effect of a Pro-
Breastfeeding and Healthy Complementary Feeding Intervention Targeting Adolescent Mothers
and Grandmothers on Growth and Prevalence of Overweight of Preschool Children. PLoS ONE
10(7):e0131884. doi:10.1371/journal.pone.0131884
Shonkoff, J. P. (2014). "Changing the Narrative for Early Childhood Investment." JAMA
25
Pediatrics 168(2): 105-106.
Shonkoff, J. P., et al. (2016) "Expanding the evidence base to drive more productive early
childhood investment." The Lancet. Online first.
Sprenger-Charolles, L. 2004. Linguistic Processes in Reading and Spelling: The Case of
Alphabetic Writing Systems: English, French, German and Spanish. In: Nunes, T. and P. Bryant
(Eds.) Handbook of Children’s Literacy. Dordrecht, the Netherlands: Kluwer Academic
Publishers: 43–66
Snow, C.E., Burns, M.S., and Griffin, P. 1998. Preventing Reading Difficulties in Young Children.
National Academy Press, Washington, DC
Taft AJ, Small R, Hegarty KL, Watson LF, Gold L, Lumley JA. Mothers’ Advocates in the
community (MOSAIC)–non-professional mentor support to reduce intimate partner violence and
depression in mothers: a cluster randomised trial in primary care. BMC public health 2011; 11:178,
doi:10.1186/1471-2458-11-178.
Tillé, Y. and A. Matei (2011). Sampling: Survey Sampling. R Package Version 2.4.
http://CRAN.R-project.org/package=sampling.
Toganivalu, D. 2008. Early Childhood Care and Education in the Pacific: Reflections of our past,
our present and our future. In Puamau, P and Pene F. (Eds.) Early Childhood Care and Education
in the Pacific: The PRIDE Project. Suva, Fiji: Institute of Education, University of the South
Pacific.
van Marwijk HW, Ader H, de Haan M, Beekman A. Primary care management of major depression
in patients aged >= 55 years:. The British Journal of General Practice Oct 2008; 58(555):680–
687, doi:10.3399/bjgp08X342165.
Vegas, E. and L. Santibanez (2010). The Promise of Early Childhood Development in Latin
26
America and the Caribbean. Washington, D.C.: The World Bank
Wolf, M. 2007. Proust and the Squid: The Story and Science of the Reading Brain. New York:
Harper Collins
World Bank 2012a. How well are Tongan children learning to read? Washington, D.C.: The
World Bank
World Bank 2012b. How well are Ni-Vanuatu children learning to read in English? Washington,
D.C.: The World Bank
World Bank 2012c. How well are Ni-Vanuatu children learning to read in French? Washington,
D.C.: The World Bank
Xu, Z. and J.D. Kalbfleisch 2010. Propensity score matching in randomized clinical trials.
Biometrics. 2010 Sep; 66(3):813-23. doi: 10.1111/j.1541-0420.2009.01364.x
27
28
29
Table 1: Treatment status of first grade sample
Attended CPBA
Yes No Total
From a treatment community 119 378 497
From a control community 3 376 379
From another community 5 273 278
Community not known 13 838 851
Total 140 1865 2005
Table 2: Treatment status of second grade sample
Type of school
Treatment Control Other Total
Total 609 542 688 1839
30
Table 3: Estimated mean test scores by sub-population
Grade 1 Grade 2
Total Female Male Total Female Male
Letters (correct / minute) 7.396 (0.154)
8.391 (0.201)
6.557 (0.227)
44.651 (0.246)
47.596 (0.375)
42.272 (0.325)
Initial sounds (% correct) 0.056 (0.002)
0.063 (0.002)
0.049 (0.003)
0.386 (0.004)
0.416 (0.006)
0.361 (0.006)
Letter sounds (correct / minute) 2.589 (0.117)
3.35 (0.115)
1.948 (0.193)
24.137 (0.193)
25.829 (0.264)
22.77 (0.275)
Familiar words (correct / minute) 0.614 (0.063)
0.734 (0.044)
0.513 (0.109)
16.384 (0.188)
19.602 (0.302)
13.784 (0.236)
Unfamiliar words (correct / minute) 0.28 (0.046)
0.301 (0.025)
0.263 (0.083)
9.553 (0.151)
11.186 (0.244)
8.233 (0.19)
Oral reading words (correct / minute) 0.916 (0.114)
1.289 (0.187)
0.602 (0.138)
20.065 (0.25)
24.025 (0.416)
16.866 (0.301)
Reading comprehension (% correct) 0.004 (0.001)
0.004 (0.001)
0.003 (0.001)
0.081 (0.002)
0.105 (0.003)
0.062 (0.003)
Listening comprehension (% correct) 0.251 (0.003)
0.255 (0.003)
0.248 (0.004)
0.387 (0.003)
0.383 (0.005)
0.39 (0.005)
Dictation (% correct) 0.025 (0.002)
0.03 (0.002)
0.021 (0.002)
0.552 (0.004)
0.598 (0.006)
0.515 (0.005)
Standard errors presented in parentheses below
31
Table 4: Difference in student and school characteristics between treatment and control groups for the school intervention (2nd grade)
Control Treatment Difference
Student characteristics
is female 0.448 (0.009)
0.436 (0.01)
-0.012 (0.014)
attended preschool 0.624 (0.016)
0.63 (0.019)
0.006 (0.028)
has help at home for homework 0.859 (0.011)
0.871 (0.013)
0.011 (0.017)
was absent once in the past week 0.412 (0.014)
0.407 (0.017)
-0.005 (0.024)
has parents interested in school day 0.714 (0.013)
0.743 (0.023)
0.029 (0.028)
reads aloud at home 0.622 (0.014)
0.679 (0.017)
0.057** (0.023)
is read to at home 0.578 (0.018)
0.642 (0.014)
0.064*** (0.023)
School characteristics
Number of 1st and 2nd grade students 71.818 (7.673)
58.68 (6.575)
-13.138 (10.397)
Non-government school 0.805 (0.025)
0.853 (0.017)
0.049 (0.038)
Single-grade class 0.748 (0.045)
0.874 (0.028)
0.126** (0.054)
Standard errors noted in parenthesis; no differences are statistically significant at the 10 percent level.
32
Table 5: Difference in student and school characteristics between treatment and control groups for the community intervention (first grade)
Control Treatment Difference
Student characteristics
is female 0.45 (0.014)
0.472 (0.013)
0.022 (0.019)
attending an intervention school 0.55 (0.095)
0.661 (0.058)
0.112 (0.112)
attended preschool 0.65 (0.017)
0.719 (0.016)
0.069*** (0.023)
has help at home for homework 0.835 (0.013)
0.846 (0.012)
0.011 (0.018)
was absent once in the past week 0.46 (0.017)
0.492 (0.013)
0.032 (0.022)
has parents interested in school day 0.737 (0.02)
0.733 (0.017)
-0.004 (0.027)
reads aloud at home 0.427 (0.014)
0.425 (0.016)
-0.002 (0.022)
is read to at home 0.525 (0.022)
0.466 (0.016)
-0.059** (0.028)
School characteristics
Number of 1st and 2nd grade students 61.852 (6.329)
45.511 (2.674)
-16.341** (6.969)
Non-government school 0.954 (0.019)
0.888 (0.033)
-0.066* (0.038)
Single-grade class 0.738 (0.047)
0.782 (0.031)
0.044 (0.058)
Standard errors noted in parenthesis; no differences are statistically significant at the 10 percent level.
33
Table 6: Percent of treatment and control group students in each island group
School intervention Community intervention
Control Treatment Control Treatment
Eua 0 0 0 0.005 (0.001)
Ha'apai 0.087 (0.027)
0.149 (0.031)
0.081 (0.022)
0.099 (0.018)
Niuatoputapu 0.009 (0.006)
0.025 (0.018)
0.019 (0.002)
0.021 (0.002)
Tongatapu 0.709 (0.048)
0.691 (0.045)
0.772 (0.039)
0.651 (0.038)
Vava'u 0.195 (0.044)
0.134 (0.034)
0.128 (0.028)
0.226 (0.031)
Standard errors denoted in parentheses
34
Table 7: Estimates of association between student and school variables and test score modeled by univariate regression - 2nd grade (in standard deviations)
Letters Initial sounds
Letter sounds
Familiar words
Unfamil-iar words
Oral reading words
Reading compre-hension
Listening compre-hension Dictation
Student characteristics
is female 0.166*** (0.024)
0.164*** (0.029)
0.097*** (0.03)
0.396*** (0.03)
0.211*** (0.029)
0.31*** (0.03)
0.336*** (0.039)
-0.02 (0.031)
0.213*** (0.022)
attended preschool 0.015 (0.022)
-0.084* (0.045)
0.032 (0.024)
0.033 (0.044)
0.008 (0.034)
0.057 (0.04)
0.127** (0.05)
-0.093*** (0.029)
0.022 (0.039)
has help at home for homework 0.03 (0.036)
-0.037 (0.049)
0.014 (0.038)
-0.032 (0.061)
0.028 (0.047)
-0.003 (0.044)
-0.013 (0.071)
-0.113 (0.069)
-0.079* (0.041)
was absent once in the past week -0.073*** (0.021)
-0.244*** (0.035)
-0.053** (0.023)
-0.153*** (0.039)
-0.102*** (0.029)
-0.115*** (0.032)
-0.123*** (0.043)
-0.105*** (0.038)
-0.14*** (0.03)
has parents interested in school day 0.068*** (0.021)
0.133*** (0.047)
0.085*** (0.024)
0.149*** (0.038)
0.079*** (0.029)
0.172*** (0.035)
0.276*** (0.053)
-0.084** (0.041)
0.154*** (0.038)
reads aloud at home 0.159*** (0.021)
0.458*** (0.039)
0.22*** (0.025)
0.38*** (0.04)
0.279*** (0.027)
0.305*** (0.035)
0.246*** (0.055)
0.245*** (0.036)
0.317*** (0.032)
is read to at home 0.128*** (0.022)
0.374*** (0.035)
0.178*** (0.019)
0.267*** (0.032)
0.202*** (0.021)
0.176*** (0.026)
0.104** (0.041)
0.279*** (0.038)
0.201*** (0.03)
School characteristics
Number of 1st/2nd grade students 0 (0)
-0.001* (0)
-0.001** (0.001)
0 (0.001)
0 (0)
0 (0)
0 (0.001)
0 (0)
0.001*** (0)
Non-government school 0.014 (0.038)
0.013 (0.049)
0.1** (0.043)
-0.022 (0.062)
-0.029 (0.051)
0.053 (0.051)
0.006 (0.054)
0.078** (0.035)
0.035 (0.05)
Single-grade class -0.242*** (0.053)
-0.209*** (0.071)
-0.19** (0.095)
-0.278*** (0.08)
-0.332*** (0.081)
-0.343*** (0.082)
-0.292*** (0.107)
-0.236*** (0.064)
-0.258*** (0.065)
Standard errors noted in parenthesis; significance at the 10, 5 and 1 percent levels denoted by *, **, *** respectively.
35
Table 8 Estimates of association between student and school variables and test score modeled by univariate regression - first grade (in standard deviations)
Letters Initial sounds
Letter sounds
Familiar words
Unfamil-iar words
Oral reading words
Reading compre-hension
Listening compre-hension Dictation
Student characteristics
is female 0.051*** (0.014)
0.043** (0.018)
0.041*** (0.01)
0.02* (0.011)
0.006 (0.008)
0.04*** (0.015)
0.003 (0.011)
0.064*** (0.024)
0.018** (0.008)
attending an intervention school -0.007 (0.018)
0.035 (0.021)
0.026** (0.013)
-0.013 (0.011)
-0.004 (0.006)
-0.062*** (0.023)
-0.005 (0.009)
0.096** (0.044)
-0.007 (0.01)
attended preschool 0.024* (0.014)
-0.04** (0.017)
-0.007 (0.011)
0.018* (0.009)
0.009 (0.007)
0.025* (0.013)
-0.013 (0.013)
-0.22*** (0.031)
-0.014 (0.009)
has help at home for homework -0.007 (0.023)
-0.045 (0.03)
0.002 (0.016)
0.025** (0.012)
0.005 (0.009)
0.008 (0.009)
0.017 (0.011)
-0.118*** (0.041)
-0.004 (0.011)
was absent once in the past week -0.094*** (0.013)
-0.087*** (0.015)
-0.065*** (0.01)
-0.035*** (0.011)
-0.02** (0.008)
-0.012 (0.014)
-0.049*** (0.01)
-0.261*** (0.031)
-0.042*** (0.008)
has parents interested in school day 0.007 (0.016)
0.002 (0.022)
-0.016 (0.016)
-0.003 (0.018)
-0.012 (0.015)
0.017 (0.017)
-0.001 (0.016)
-0.05 (0.041)
0.007 (0.01)
reads aloud at home 0.048*** (0.016)
0.039* (0.02)
0.043*** (0.012)
0.035** (0.014)
0.009 (0.01)
0.004 (0.017)
0.02 (0.014)
0.065** (0.031)
0.034*** (0.01)
is read to at home 0.067*** (0.015)
0.09*** (0.02)
0.065*** (0.011)
0.076*** (0.013)
0.042*** (0.01)
0.038** (0.017)
0.065*** (0)
0.133*** (0.033)
0.064*** (0.009)
School characteristics
Number of 1st/2nd grade students -0.001*** (0)
-0.001*** (0)
-0.001*** (0)
0 (0)
0 (0)
0.001** (0)
0 (0)
-0.003*** (0.001)
0 (0)
Non-government school 0.018 (0.027)
0.014 (0.033)
0.005 (0.012)
0.007 (0.017)
-0.008 (0.015)
0.013 (0.017)
0.03*** (0.006)
-0.049 (0.064)
-0.009 (0.019)
Single-grade class -0.106*** (0.018)
-0.08*** (0.02)
-0.05*** (0.013)
0.001 (0.011)
-0.008 (0.008)
0.013 (0.012)
0.015* (0.009)
-0.286*** (0.049)
-0.036*** (0.011)
Standard errors noted in parenthesis; significance at the 10, 5 and 1 percent levels denoted by *, **, *** respectively.
36
Table 9 Difference between island group test score and national mean by island group in standard deviations (second grade treatment and control schools)
Letters Initial sounds
Letter sounds
Familiar words
Unfamil-iar words
Oral reading words
Reading compre-hension
Listening compre-hension Dictation
Eua n.a. n.a. n.a. n.a. n.a. n.a. n.a. n.a. n.a.
Ha'apai 0.172 (0.057)
0.684 (0.125)
0.297 (0.077)
0.256 (0.078)
0.108 (0.044)
0.135 (0.062)
0.159 (0.1)
0.762 (0.086)
0.222 (0.091)
Niuatoputapu -0.367 (0.132)
0.174 (0.329)
-0.396 (0.1)
-0.382 (0.144)
-0.233 (0.095)
-0.26 (0.129)
-0.435 (0.057)
-0.253 (0.098)
-0.296 (0.205)
Tongatapu -0.157 (0.036)
-0.252 (0.077)
-0.273 (0.054)
-0.233 (0.077)
-0.178 (0.056)
-0.288 (0.071)
-0.361 (0.091)
-0.304 (0.046)
-0.233 (0.069)
Vava'u 0.159 (0.041)
-0.073 (0.084)
0.252 (0.055)
0.218 (0.103)
0.211 (0.078)
0.353 (0.101)
0.46 (0.13)
0.002 (0.056)
0.229 (0.091)
Standard errors noted in parenthesis; significance at the 10, 5 and 1 percent levels denoted by *, **, *** respectively.
37
Table 10 Difference between island group test score and national mean by island group in standard deviations (first grade children from treatment and control communities)
Letters Initial sounds
Letter sounds
Familiar words
Unfamil-iar words
Oral reading words
Reading compre-hension
Listening compre-hension Dictation
Eua 0.296*** (0.055)
-0.16*** (0.008)
0.046*** (0.013)
-0.011 (0.01)
-0.019*** (0.004)
-0.04*** (0.008)
-0.027*** (0.005)
0.184** (0.086)
-0.051*** (0.004)
Ha'apai 0.115*** (0.031)
0.215*** (0.047)
0.112*** (0.024)
0.006 (0.014)
-0.007 (0.006)
-0.012 (0.011)
-0.001 (0.014)
0.985*** (0.077)
0.051*** (0.014)
Niuatoputapu -0.004 (0.007)
0.12*** (0.008)
0.009* (0.005)
0.033*** (0.005)
0.062*** (0.004)
0.043*** (0.008)
-0.028*** (0.005)
-0.201*** (0.019)
0.131*** (0.004)
Tongatapu -0.107*** (0.017)
-0.119*** (0.018)
-0.088*** (0.012)
0.001 (0.01)
0.006 (0.006)
0.01 (0.012)
-0.004 (0.01)
-0.28*** (0.041)
-0.009 (0.008)
Vava'u 0.076*** (0.021)
0.048*** (0.016)
0.061*** (0.014)
-0.006 (0.012)
-0.01 (0.007)
-0.01 (0.014)
0.009 (0.012)
-0.091** (0.038)
-0.023** (0.01)
Standard errors noted in parenthesis; significance at the 10, 5 and 1 percent levels denoted by *, **, *** respectively.
38
Table 11 Estimated impact of reading intervention: differences in test scores between treatment and control group by method
Method: Letters Initial sounds
Letter sounds
Familiar words
Unfamiliar words
Difference 0.05 (0.046)
0.607*** (0.07)
0.63*** (0.061)
0.327*** (0.084)
0.182*** (0.064)
with class random effects (r.e.) 0.068 (0.05)
0.616*** (0.071)
0.638*** (0.07)
0.342*** (0.093)
0.206*** (0.073)
with class r.e. and covariates 0.02 (0.042)
0.555*** (0.072)
0.588*** (0.041)
0.39*** (0.091)
0.225*** (0.06)
with class r.e., propensity score weighted 0.148* (0.089)
0.665*** (0.086)
0.748*** (0.128)
0.376*** (0.097)
0.307** (0.123)
Method:
Oral reading words
Reading compre-hension
Listening compre-hension Dictation
Difference 0.235*** (0.068)
0.139* (0.077)
0.137** (0.058)
0.265*** (0.068)
with class r.e. 0.252*** (0.079)
0.197** (0.096)
0.177*** (0.056)
0.273*** (0.072)
with class r.e. and covariates 0.27*** (0.071)
0.294*** (0.095)
0.166*** (0.056)
0.297*** (0.062)
with class r.e., propensity score weighted 0.332*** (0.113)
0.154 (0.1)
0.155*** (0.059)
0.37*** (0.086)
Standard errors noted in parenthesis. Significance at the 10, 5 and 1 percent levels denoted by *, **, *** respectively. Figures are for 2nd grade children.
39
Table 12 Estimated difference in impact of reading program between boys and girls: gender difference in differences in test scores between treatment and control group by method
Method: Letters Initial sounds
Letter sounds
Familiar words
Unfamiliar words
Difference -0.102 (0.071)
0.142** (0.064)
0.014 (0.086)
-0.172** (0.082)
-0.159* (0.085)
with class random effects (r.e.) -0.096 (0.069)
0.103 (0.064)
0.011 (0.081)
-0.158** (0.077)
-0.145* (0.08)
with class r.e. and covariates -0.024 (0.05)
0.195*** (0.065)
0.173*** (0.036)
-0.202** (0.08)
-0.063 (0.066)
with class r.e., propensity score weighted -0.055 (0.058)
0.125* (0.065)
0.053 (0.06)
-0.136* (0.075)
-0.098 (0.063)
Method:
Oral reading words
Reading compre-hension
Listening compre-hension Dictation
Difference -0.201** (0.086)
0.121 (0.089)
0.146** (0.068)
-0.015 (0.053)
with class r.e. -0.195** (0.081)
0.132 (0.088)
0.105 (0.066)
-0.006 (0.05)
with class r.e. and covariates -0.13** (0.065)
0.168 (0.106)
0.095 (0.073)
0.003 (0.063)
with class r.e., propensity score weighted -0.156** (0.07)
0.129 (0.088)
0.104 (0.068)
0.007 (0.05)
Standard errors noted in parenthesis. Significance at the 10, 5 and 1 percent levels denoted by *, **, *** respectively. Figures are for 2nd grade children.
40
Table 13 Estimated impact of the community intervention: differences in test scores between treatment and control group by method
Method: Letters Initial sounds
Letter sounds
Familiar words
Unfamiliar words
Difference 0.013 (0.017)
0.017 (0.02)
0.016 (0.014)
0.019 (0.012)
0.01 (0.01)
with class random effects (r.e.) 0.008 (0.018)
0.007 (0.025)
0.015 (0.014)
0.019 (0.012)
0.01 (0.01)
with class r.e. and covariates 0.063** (0.026)
0.072** (0.035)
0.069** (0.031)
0.058 (0.037)
0.037 (0.031)
with class r.e., propensity score weighted 0.07** (0.028)
0.116*** (0.039)
0.083*** (0.031)
0.07* (0.04)
0.049 (0.034)
Method:
Oral reading words
Reading compre-hension
Listening compre-hension Dictation
Difference -0.023 (0.02)
0.012 (0.011)
0.07* (0.042)
-0.019** (0.009)
with class r.e. -0.023 (0.02)
0.012 (0.011)
0.056 (0.058)
-0.019** (0.009)
with class r.e. and covariates 0.033 (0.028)
0.054* (0.031)
0.098** (0.041)
0.021 (0.018)
with class r.e., propensity score weighted 0.043 (0.03)
0.062* (0.034)
0.182*** (0.063)
0.028 (0.019)
Standard errors noted in parenthesis. Significance at the 10, 5 and 1 percent levels denoted by *, **, *** respectively. Figures are for 1st grade children.
41
Table 14 Estimated gender differences in impact of the community intervention: gender difference in differences in test scores between treatment and control group by method
Method: Letters Initial sounds
Letter sounds
Familiar words
Unfamiliar words
Difference 0.011 (0.031)
-0.023 (0.041)
-0.019 (0.023)
-0.026 (0.028)
-0.048** (0.019)
with class random effects (r.e.) 0.001 (0.031)
-0.038 (0.041)
-0.021 (0.023)
-0.026 (0.028)
-0.048** (0.019)
with class r.e. and covariates 0.065 (0.044)
0.103** (0.052)
-0.014 (0.038)
-0.05 (0.044)
-0.077** (0.033)
with class r.e., propensity score weighted -0.07 (0.064)
-0.035 (0.086)
-0.103 (0.067)
-0.141* (0.082)
-0.146** (0.067)
Method:
Oral reading words
Reading compre-hension
Listening compre-hension Dictation
Difference -0.095** (0.037)
-0.018 (0.025)
-0.068 (0.059)
-0.013 (0.021)
with class r.e. -0.095** (0.037)
-0.018 (0.025)
-0.031 (0.06)
-0.013 (0.021)
with class r.e. and covariates -0.059* (0.032)
-0.058 (0.036)
0.006 (0.085)
-0.006 (0.032)
with class r.e., propensity score weighted -0.121** (0.06)
-0.127* (0.068)
-0.048 (0.102)
-0.059 (0.039)
Standard errors noted in parenthesis. Significance at the 10, 5 and 1 percent levels denoted by *, **, *** respectively. Figures are for 1st grade children.
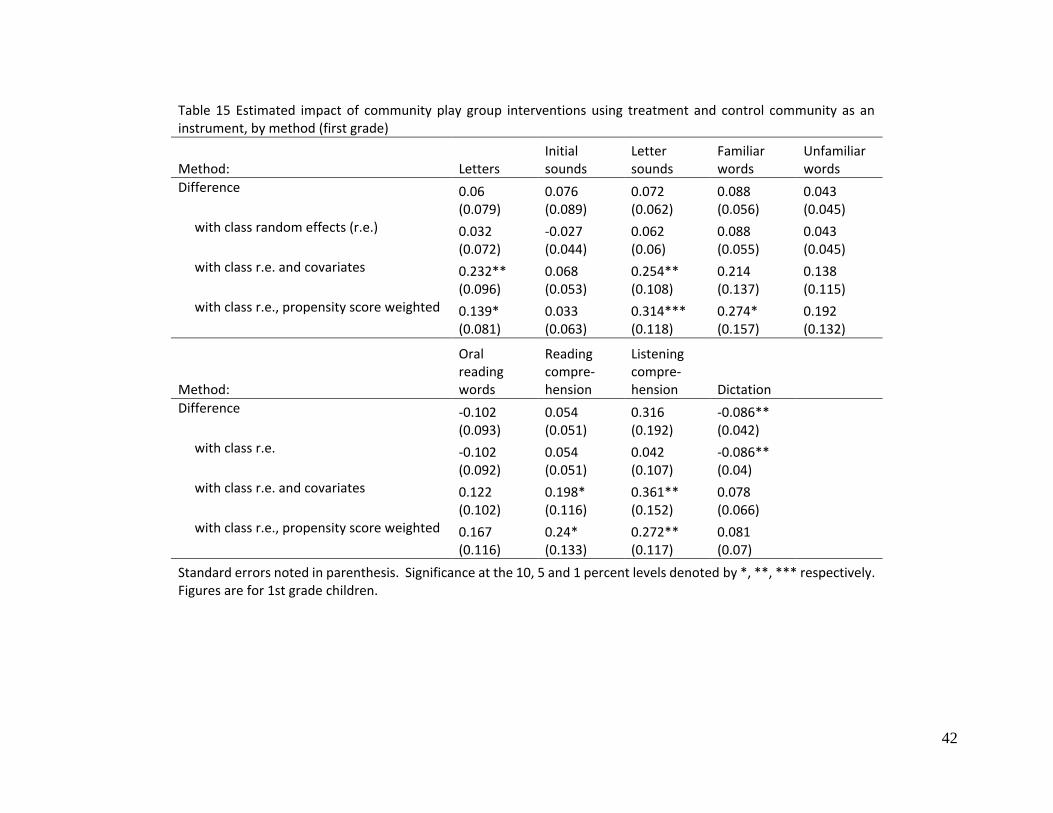
42
Table 15 Estimated impact of community play group interventions using treatment and control community as an instrument, by method (first grade)
Method: Letters Initial sounds
Letter sounds
Familiar words
Unfamiliar words
Difference 0.06 (0.079)
0.076 (0.089)
0.072 (0.062)
0.088 (0.056)
0.043 (0.045)
with class random effects (r.e.) 0.032 (0.072)
-0.027 (0.044)
0.062 (0.06)
0.088 (0.055)
0.043 (0.045)
with class r.e. and covariates 0.232** (0.096)
0.068 (0.053)
0.254** (0.108)
0.214 (0.137)
0.138 (0.115)
with class r.e., propensity score weighted 0.139* (0.081)
0.033 (0.063)
0.314*** (0.118)
0.274* (0.157)
0.192 (0.132)
Method:
Oral reading words
Reading compre-hension
Listening compre-hension Dictation
Difference -0.102 (0.093)
0.054 (0.051)
0.316 (0.192)
-0.086** (0.042)
with class r.e. -0.102 (0.092)
0.054 (0.051)
0.042 (0.107)
-0.086** (0.04)
with class r.e. and covariates 0.122 (0.102)
0.198* (0.116)
0.361** (0.152)
0.078 (0.066)
with class r.e., propensity score weighted 0.167 (0.116)
0.24* (0.133)
0.272** (0.117)
0.081 (0.07)
Standard errors noted in parenthesis. Significance at the 10, 5 and 1 percent levels denoted by *, **, *** respectively. Figures are for 1st grade children.
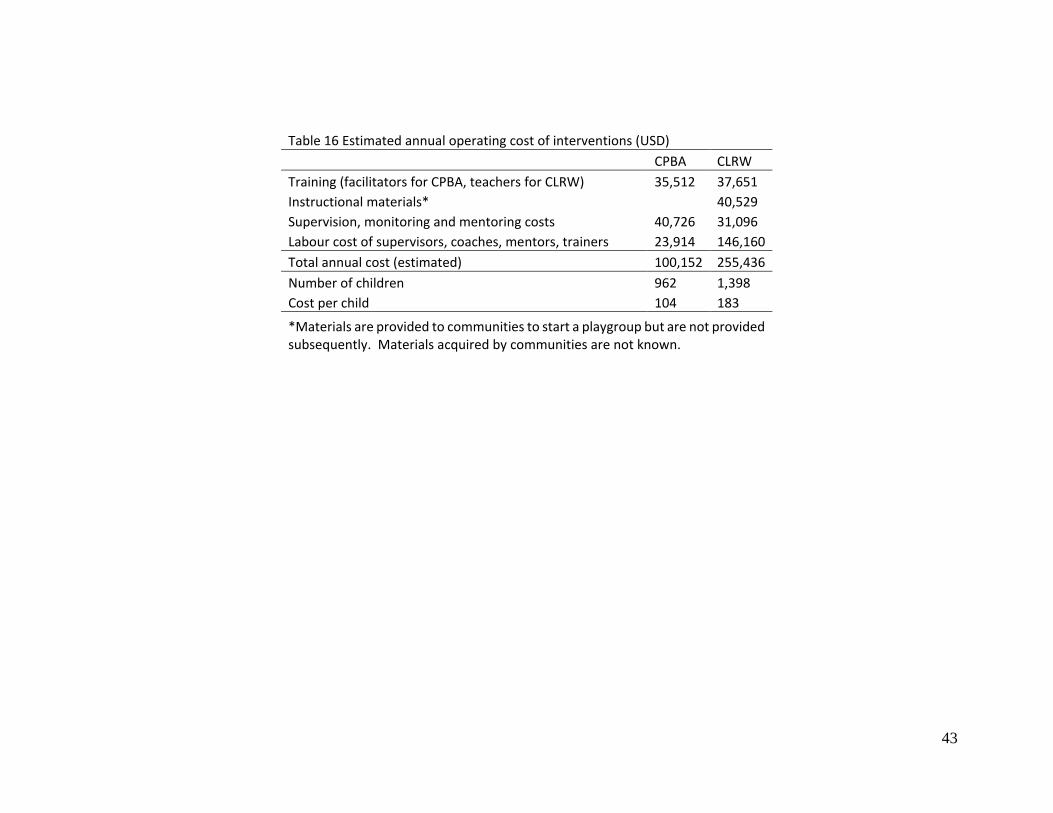
43
Table 16 Estimated annual operating cost of interventions (USD)
CPBA CLRW
Training (facilitators for CPBA, teachers for CLRW) 35,512 37,651
Instructional materials* 40,529
Supervision, monitoring and mentoring costs 40,726 31,096
Labour cost of supervisors, coaches, mentors, trainers 23,914 146,160
Total annual cost (estimated) 100,152 255,436
Number of children 962 1,398
Cost per child 104 183
*Materials are provided to communities to start a playgroup but are not provided subsequently. Materials acquired by communities are not known.
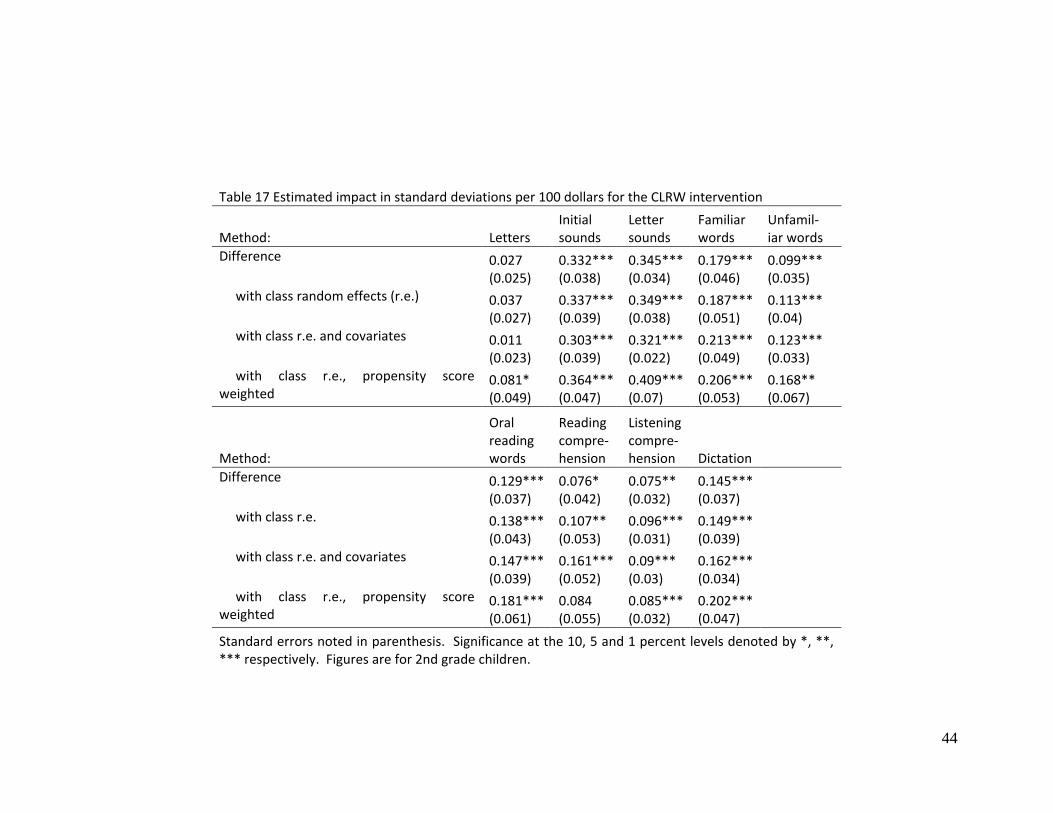
44
Table 17 Estimated impact in standard deviations per 100 dollars for the CLRW intervention
Method: Letters Initial sounds
Letter sounds
Familiar words
Unfamil-iar words
Difference 0.027 (0.025)
0.332*** (0.038)
0.345*** (0.034)
0.179*** (0.046)
0.099*** (0.035)
with class random effects (r.e.) 0.037 (0.027)
0.337*** (0.039)
0.349*** (0.038)
0.187*** (0.051)
0.113*** (0.04)
with class r.e. and covariates 0.011 (0.023)
0.303*** (0.039)
0.321*** (0.022)
0.213*** (0.049)
0.123*** (0.033)
with class r.e., propensity score weighted
0.081* (0.049)
0.364*** (0.047)
0.409*** (0.07)
0.206*** (0.053)
0.168** (0.067)
Method:
Oral reading words
Reading compre-hension
Listening compre-hension Dictation
Difference 0.129*** (0.037)
0.076* (0.042)
0.075** (0.032)
0.145*** (0.037)
with class r.e. 0.138*** (0.043)
0.107** (0.053)
0.096*** (0.031)
0.149*** (0.039)
with class r.e. and covariates 0.147*** (0.039)
0.161*** (0.052)
0.09*** (0.03)
0.162*** (0.034)
with class r.e., propensity score weighted
0.181*** (0.061)
0.084 (0.055)
0.085*** (0.032)
0.202*** (0.047)
Standard errors noted in parenthesis. Significance at the 10, 5 and 1 percent levels denoted by *, **, *** respectively. Figures are for 2nd grade children.
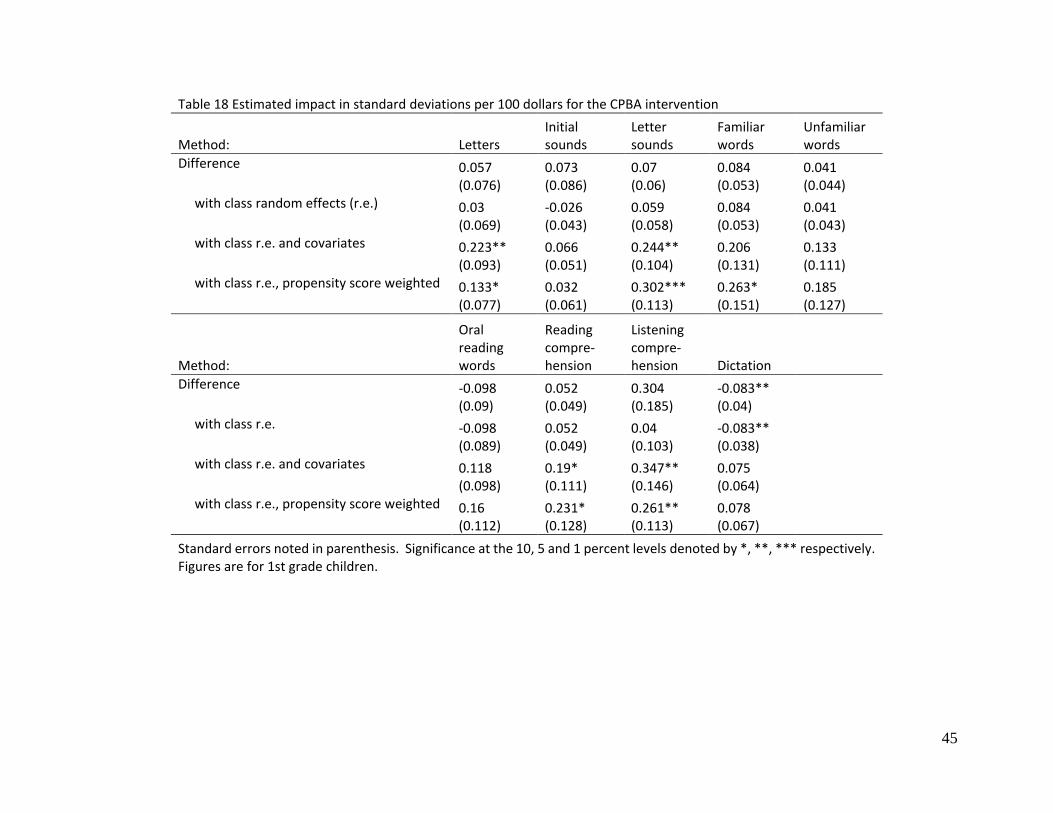
45
Table 18 Estimated impact in standard deviations per 100 dollars for the CPBA intervention
Method: Letters Initial sounds
Letter sounds
Familiar words
Unfamiliar words
Difference 0.057 (0.076)
0.073 (0.086)
0.07 (0.06)
0.084 (0.053)
0.041 (0.044)
with class random effects (r.e.) 0.03 (0.069)
-0.026 (0.043)
0.059 (0.058)
0.084 (0.053)
0.041 (0.043)
with class r.e. and covariates 0.223** (0.093)
0.066 (0.051)
0.244** (0.104)
0.206 (0.131)
0.133 (0.111)
with class r.e., propensity score weighted 0.133* (0.077)
0.032 (0.061)
0.302*** (0.113)
0.263* (0.151)
0.185 (0.127)
Method:
Oral reading words
Reading compre-hension
Listening compre-hension Dictation
Difference -0.098 (0.09)
0.052 (0.049)
0.304 (0.185)
-0.083** (0.04)
with class r.e. -0.098 (0.089)
0.052 (0.049)
0.04 (0.103)
-0.083** (0.038)
with class r.e. and covariates 0.118 (0.098)
0.19* (0.111)
0.347** (0.146)
0.075 (0.064)
with class r.e., propensity score weighted 0.16 (0.112)
0.231* (0.128)
0.261** (0.113)
0.078 (0.067)
Standard errors noted in parenthesis. Significance at the 10, 5 and 1 percent levels denoted by *, **, *** respectively. Figures are for 1st grade children.


![Claudelina machuca v2[1]](https://img.pdfslide.net/doc/110x75/58a6e1b91a28abef698b6811/claudelina-machuca-v21.jpg)