Embed Size (px)
Citation preview
94
CHAPTER 5
LEARNING OBJECTIVES Describe physical examination fi ndings that aid in ■
assessing the cardiovascular status of the critically ill child. Understand arterial pressure measurements and ■
waveforms and how they are affected by various disease states. Understand central venous pressure measurements and ■
waveforms and how they are affected by various disease states. Describe the conservation of mass and Fick principles ■
and how they relate to cardiac output measurement. Describe pulmonary artery pressure monitoring ■
including estimation of cardiac output by thermodilution and measurement of pulmonary capillary wedge pressure. Understand the limitations of pulmonary artery ■
catheterization. Understand what is meant by the assessment of ■
“functional hemodynamics”. Describe novel techniques used for the estimation of ■
cardiac output in critically ill children. Identify and describe biochemical markers of ■
cardiovascular function – specifi cally mixed venous, central venous saturations, lactate and brain natriuretic peptide measurements.
CHAPTER OUTLINELearning ObjectivesIntroductionDeterminants of Cardiac OutputAssessing Cardiovascular Status by Physical Examination
Heart RateTemperatureCapillary Refi llUrine OutputBlood Pressure
Invasive Measures of Cardiovascular FunctionArterial Waveform AnalysisArterial Waveform Technical ConsiderationsVariations in Arterial WaveformsComplications of Invasive Arterial Pressure MonitoringCentral Venous Pressure MonitoringVariations in CVP WaveformComplications of Central Venous Catheters
Measurement of Cardiac OutputConservation of MassDye DilutionFick MethodThermodilutionPulmonary Artery CatheterizationDerived Hemodynamic VariablesNovel Techniques for Cardiac Output Assessment
Mixed Venous Saturation, Central Venous Saturation, Lactate and Brain Natriuretic Peptide as Markers of Cardiovascular FunctionReview QuestionsAnswersSuggested Readings
INTRODUCTION
The study of hemodynamics began in 1628 with William Harvey’s description of the circula-tion of blood. Hemodynamics describes the complex interactions between cardiac function, vascular pressure, resistance and volume. An alteration in any of these variables can have profound physiological consequences. In order to support the cardiovascular system during a variety of disease states, an appreciation of the available assessment tools used to evaluate cardiac function and hemodynamics is essential. This chapter will focus on the utility and limitations of noninvasive and invasive measures of cardiac function and hemodynamics.
Assessment of Cardiovascular Function
FRANK A. MAFFEI

95 C HAPTER 5 • ASS ESS M ENT OF CAR DIOVASC U LAR FU NCTION
DETERMINANTS OF CARDIAC OUTPUT
Cardiac output (CO) is the volume of blood ejected by the heart per unit of time. In adults, this volume is approximately 5–6 L/min. Cardiac index (CI) is a more appropriate measurement in pediatric patients because it normalizes the CO to body surface area. In children, the CI is approximately 3.5–5.5 L/min/m 2 . CO is the product of heart rate (HR) and stroke volume (SV).
CO HR SV= ×
CI CO / BSA= Stroke volume, the amount of blood ejected by the heart with each beat, is determined by three variables: preload, afterload and myocardial contractility. Preload is the volume of blood in the ventricle at the end of diastole. The length of individual cardiac muscle fi bers has a direct relationship with the end diastolic volume. As left ventricular end diastolic vol-ume (LVEDV) and pressure increase, so does the end diastolic fi ber length (EDFL). This increase in fi ber length can be thought as “stored energy” or preload. Increasing the fi ber length, increases the force of subsequent contraction. This holds true until the fi ber is over-stretched, at which point, the force of contraction will decrease. This relationship is repre-sented in the Frank-Starling (Fig. 5-1 ) curve.
Preload can be measured indirectly through physical examination fi ndings such as hydra-tion status, pulse quality, capillary refi ll, and blood pressure. Conditions that decrease the effective circulating volume such as dehydration, blood loss, excessive vasodilation, and cap-illary leakage of intravascular fl uid can decrease preload, and subsequently, reduce cardiac output. Conditions that restrict venous return to the heart such as pericardial fl uid causing tamponade or positive pressure during mechanical ventilation can also impede preload. Physical exam fi ndings consistent with reduced preload include tachycardia, poor peripheral pulses, pulsus paradoxus, cool skin, delayed capillary refi ll and ultimately hypotension.
Afterload (ventricular wall tension) is the sum of forces against which cardiac fi bers must shorten during systole. The determinants of ventricular wall tension include transmural wall pressure, ventricular radius and wall thickness. This relationship is summarized in the law of Laplace where ventricular wall tension is equal to the product of the transmural pressure and radius divided by the wall thickness. Clinical factors affecting afterload include vascular pressure, vascular resistance, intrapleural pressure, and blood viscosity. The complex inter-play of forces affecting afterload are discussed in detail in Chap. 3 .
The force of contraction at a given EDFL refl ects the inherent contractility of cardiac muscle. The factors other than EDFL (preload) that can affect the contractility
End diastolic fiber lengthEnd diastolic volume End diastolic pressure PRELOAD
Car
dia
c o
utp
ut
Str
oke
vo
lum
e
Failing Ventricle
Normal Ventricle
Increased Inotropy
FIGURE 5-1
Frank-Starling Curves. Red curve showing normal relationship, whereas gray curve is refl ective of increased inotropy. Blue curve demonstrates failing ventricle where increasing preload does not increase stroke volume but instead leads to reduction in cardiac output. Note point on normal curve ( arrow ) where fi bers become overstretched and further increase in preload results in reduction of cardiac output

96 F.A. MAFFEI
of the ventricle include b 1 sympathetic stimulation by endogenous or exogenous agonists (epinephrine, dobutamine), nonadrenergic drugs (calcium, digoxin, anesthetics, antiarrhyth-mics, toxins) and diseases that affect the myocardium (myocarditis, cardiomyopathies, coro-nary artery disease, sepsis).
ASSESSING CARDIOVASCULAR STATUS BY PHYSICAL EXAMINATION
Despite inherent limitations, the physical examination remains the primary means by which intensivists assess cardiovascular function. An understanding of the clinical utility and limi-tations of examination fi ndings is essential for the care of the critically ill child.
Heart Rate Perhaps the most easily obtained and earliest indicator of a change in cardiovascular function, heart rate monitoring provides important data regarding cardiovascular status. Tachycardia is an early compensatory sign of cardiac compromise and is present in illnesses that decrease preload (i.e. dehydration, hemorrhage), increase afterload (i.e. catecholamine excess states) and those that compromise contractility (i.e. myocarditis, tamponade). However, tachycardia or bradycardia alone is not a sensitive or specifi c indicator of compromised cardiovascular function. Fear, fever, dyspnea and pain (all rather common in ill children) can produce sub-stantial tachycardia in the setting of normal or even high cardiac output states. Age related differences in heart rates may also lead to the misinterpretation of tachycardia by inexperi-enced examiners. Bradycardia may be due to sinus node dysfunction, atrioventricular block, drug toxicity, raised intracranial pressure or as the end result of hypoxia. Alternatively, benign sinus bradycardia may be seen in the well conditioned athlete or during deep sleep. Abnormalities in the heart rhythm are far more sensitive for cardiac dysfunction. Rhythm alterations may be appreciated on examination, but electrocardiography provides defi nitive data regarding an abnormal rhythm. Electro cardiography should be performed rapidly in all children with suspected cardiovascular dysfunction.
Temperature Cool peripheral body temperature may refl ect poor peripheral perfusion. Decreased cardiac output combined with high systemic vascular resistance produces cool and poorly perfused extremities. Cool and clammy skin was found to be an independent predictor of mortality in adult patients with cardiogenic shock. The current pediatric sepsis practice parameter relies on skin temperature as one of the initial fi ndings to categorize septic shock. Septic shock may be recognized prior to hypotension by the clinical triad that includes hypothermia or hyperthermia, altered mental status, and changes in peripheral vascular tone. Children with cool extremities and delayed capillary refi ll are vasoconstricted and are categorized as being in “cold shock”. Children with warm extremities and hyperbrisk capillary refi ll are vasodi-lated and are categorized as being in “warm shock”.
The peripheral skin temperature is usually measured as a toe temperature and normally is in the range of 32–34°C. Ambient temperature range is approximately 20°C (68°F) to 25°C (77°F). Multiple variations of peripheral temperature measurements exist and include tem-perature gradients. The delta peripheral-to-ambient (dTp-a) and the delta central-to-peripheral (dTc-p) temperature gradients have been studied as early markers of hemodynamic instability. With a stable ambient temperature, the dTp-a decreases and the dTc-p increases during states of high systemic vascular resistance. During vasoconstriction, the temperature of the skin falls thus causing the dTp-a gradient to decrease. Heat conduction from the core decreases during vasoconstriction causing the central temperature to rise and the dTc-p gradient to increase. A normal gradient of 3–5°C occurs in patients with stable hemodynamics. Although toe temperature and gradient measurements are valuable adjuncts to the clinical assessment of cardiovascular function, they lack adequate sensitivity or specifi city to serve as stand-alone
The physical examination remains the primary means to assess cardiovascular function. This includes evaluation of temperature, pulse rate and quality, capillary refi ll and blood pressure.
Cool extremities and delayed capillary refi ll are fi ndings consistent with a vasoconstricted “cold shock”. Warm extremities, wide pulse pressure and hyper-brisk capillary refi ll are fi ndings consistent with a vasodilated “warm shock”.
97 C HAPTER 5 • ASS ESS M ENT OF CAR DIOVASC U LAR FU NCTION
markers of cardiovascular function. Hypothermia, cold ambient temperature (<20°C), medications with vasomotor properties and vasodilatory shock limit the use of these gradients as sole estimates of peripheral perfusion.
Capillary Refi ll Since Beecher’s original description in 1947, the assessment of capillary refi ll time has been both revered and maligned in the medical literature. An appreciation of the usefulness of capillary refi ll time (CRT) comes only with an understanding of its inherent limitations. Normal CRT after applying pressure to the skin is generally accepted to be less than 2 seconds. Like other bedside clinical observations, CRT can be affected by interobserver, environmental and physiologic variables. Environmental factors such as low ambient tem-perature and poor lighting have been shown to decrease CRT utility. Cooler ambient tem-perature produces prolonged CRT versus warmer temperatures. Age variation in CRT also occurs, with older adult normal CRT values ranging from 3 to 4 seconds. The anatomic site where CRT is assessed has important implications for its clinical utility as well. This has been demonstrated in neonates where peripheral CRT (heel) demonstrated a wide scatter of values, while in the same neonates, central CRT (head and chest) approached normal values. This is likely due to a stronger infl uence of ambient temperature on peripheral CRT. It is important to note that in order to assess CRT in an extremity, the extremity should be above the level of the heart to avoid the infl uence of venous congestion. If CRT is assessed at a level lower than the level of the heart, CRT may refl ect venous capillary refi ll as opposed to the desired arteriolar capillary refi ll. Despite these inherent limitations, CRT may be a par-ticularly useful clinical tool. For example, among pediatric patients with cancer, fever, and treatment-induced neutropenia, prolonged CRT was one of only two factors that identifi ed patients at risk of progressive critical illness.
Although prolongation of CRT is a common abnormality associated with cardiovascular dysfunction, the examiner should also be aware of hyperbrisk or “fl ash” capillary refi ll. Disease states associated with low systemic vascular tone due to peripheral vasodilation can produce rapid refi ll time after applying pressure to the skin. Flash capillary refi ll can be seen in certain forms of septic (“warm”) and distributive shock.
Urine Output Although not a true examination fi nding, urine output remains an essential clinical surrogate for cardiovascular function. The kidney receives the second highest blood fl ow (relative to its mass) of any organ in the body. The measurement of urine output serves as an excellent proxy to detect poor cardiac output from abnormalities in preload, afterload or contractility. Urine output refl ects the glomerular fi ltration rate, which in turn refl ects renal blood fl ow, which in the setting of shock, refl ects vital organ perfusion. A normal urine output is approx-imately 1 mL/kg/h and should be a therapeutic target during resuscitation of hypovolemic, septic and distributive shock. Urine output cannot be used as a proxy of organ perfusion when an inappropriate diuresis exists such as may occur in toxic ingestions (osmotic agents, diuretics), hyperosmolar states (diabetic ketoacidosis), diabetes insipidus and cerebral salt wasting. A vigorous urine output in these cases may ultimately lead to intravascular volume depletion. Alternatively, children with inappropriate antidiuretic hormone release may have decreased urine output that may not be refl ective of intravascular volume depletion, but rather may be more consistent with volume overload.
Blood Pressure Clinically important quantitative and qualitative data can be obtained from noninvasive and invasive forms of blood pressure monitoring. Noninvasive methods of blood pressure deter-mination include auscultatory and oscillometric methods. Auscultatory determination of blood pressure requires the identifi cation of Korotkoff sounds as the extremity cuff pressure decreases. The initial sound produced by turbulent fl ow in the artery and the disappearance of these sounds determine the systolic and diastolic pressure respectively. Oscillometric
Environmental factors (low ambient temperature and poor lighting) and venous congestion decrease the reliability of capillary refi ll time.
Normal urine output is approxi-mately 1 mL/kg/h and should be a therapeutic target during resuscitation of hypovolemic, septic and distributive shock.

98 F.A. MAFFEI
determination of blood pressure is accomplished by automated blood pressure devices such as the Dinamap (device for indirect noninvasive mean arterial pressure). As blood fl ows through arteries, the pressure in the cuff oscillates. The start of measurable oscillations mark systolic pressure whereas the maximal level of arterial wall oscillations mark mean arterial pressure (MAP). The diastolic pressure is recorded at the point when the oscillations stabi-lize (Fig. 5-2 ). It is commonly observed that the oscillometric method underestimates dia-stolic blood pressure.
Both auscultatory and oscillometric determination of blood pressure determination are lim-ited by technical and physiologic factors. Inappropriate cuff size can lead to under-estimating (cuff too large) or over-estimating (cuff too small) true arterial pressure. An appropriate size cuff should have a bladder width at least 40% of arm circumference. The infl atable bladder length should cover 80% of the circumference of the arm. Noninvasive methods are less reliable in children with low cardiac output states, peripheral arterial disease, excessive extremity edema, subclavian artery abnormality (Blalock-Thomas-Taussig shunt) and during arrhythmias.
Physiologic factors important in the determination of blood pressure values obtained during invasive or noninvasive monitoring can be summarized as follows:
Systolic arterial pressure – Systolic pressure is determined primarily by the force and volume of the blood ejected by the left ventricle (LV) into the aorta. Ejection results in dis-tention of arterial walls and pulse waves that “bounce” back off the walls of the arterial tree. The pulsatile waves refl ected back from the arterial walls contribute to the systolic pressure. Less compliant arteries as seen with aging produce refl ected waves that contribute more to the systolic pressure than do compliant arteries.
Diastolic arterial pressure – Diastolic pressure is determined primarily by the resistance to volume displacement in the arterial tree (arterial distensibility).
Pulse pressure – Systolic pressure minus the diastolic pressure equals the pulse pressure. Monitoring changes in pulse pressure can be clinically useful. Pulse pressure can be increased with conditions which raise systolic pressure such as hyperadrenergic states (i.e. fever, pain, exogenous catecholamines, hyperthyroidism) and in states with increased arterial rigidity that increase the contribution of refl ected waves to the systolic pressure (i.e. aging, arterio-sclerosis). Pulse pressure may be increased in conditions that lower diastolic pressure due to abnormal runoff of blood into a lower resistance circuit (i.e. aortic regurgitation, patent duc-tus arteriosus, systemic to pulmonary shunts) or due to low systemic vascular resistance (SVR) states (i.e. warm sepsis, anaphylaxis, spinal shock, exogenous vasodilators). During invasive blood pressure monitoring, an underdamped waveform will produce a wide pulse pressure by exaggerating systolic pressure.
A narrowed pulse pressure is seen in children with aortic stenosis or low cardiac output states. Hemorrhage, tamponade and cardiogenic shock can cause progressive narrowing of
160
Pressure in the bladder
Oscillations transmittedto the cuff
syst
olic m
ean
dias
tolic
150140
130120
110100
9080
70
160 150 140 130 120 110 100 90 80 70
mm Hg
mm Hg
FIGURE 5-2
Oscillometric method for obtain-ing systolic, mean and diastolic blood pressure ( www.blood-pres-sure-hypertension.com/graphix )
Too large cuff size can lead to underestimating blood pressure and too small cuff size leads to overestimating blood pressure.

99 C HAPTER 5 • ASS ESS M ENT OF CAR DIOVASC U LAR FU NCTION
pulse pressure and is an ominous sign. During invasive blood pressure monitoring, an over-damped waveform will artifi cially narrow the pulse pressure.
Mean arterial pressure – The MAP is not halfway between the diastolic and systolic pres-sures because the duration of diastole is longer than that of systole. Numerically, it can be approximated by the formula:
MAP DP 1/ 3 pulse pressure= +
Physiologically, the MAP is determined by the force of blood ejected from the LV and the vascular tone of the arterial system (Fig. 5-3 ). This relationship is refl ected in the formula:
MAP CO SVR.= ×
INVASIVE MEASURES OF CARDIOVASCULAR FUNCTION
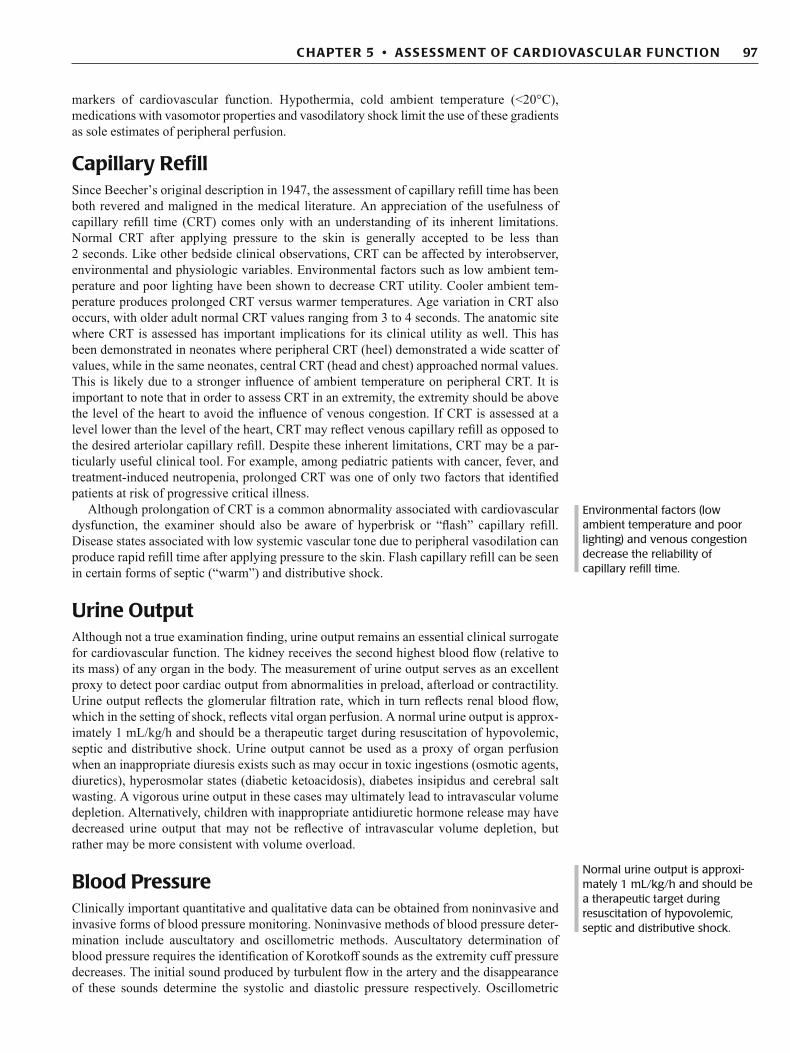
Arterial Waveform Analysis Intravascular arterial pressure monitoring allows for interpretation of the arterial waveform in addition to continuous numeric data. The normal waveform begins with aortic valve open-ing and the onset of LV ejection (Fig. 5-4 ). This is seen as a sharp upstroke in the waveform referred to as the anacrotic limb . After its peak, aortic pressure declines as LV ejection slows. The descending limb is interrupted by a small rise in pressure. When arterial pressure is measured in the aorta, this rise in pressure produces a notch termed the incisura and is related to the elastic recoil of the aortic valve after its closure. When arterial pressure is measured peripherally, the rise in pressure is referred to as the dicrotic notch. During periph-eral intra-arterial monitoring, the notch is not due to aortic valve closure as is commonly thought, but rather, it is due to refl ected waves back from distal arterial walls and branch sites. Diastolic runoff and end diastolic pressure complete the waveform.
Several changes occur as the normal arterial pulse wave is transmitted distally. The sys-tolic peak increases, the dicrotic notch occurs later, the diastolic pressure becomes lower, and consequently, a larger pulse pressure is measured. Despite these changes, the MAP is only slightly lower in the periphery than in the aorta. These changes are due to the phenomenon of distal wave amplifi cation . Although blood fl ow from the aorta to the distal arteries falls only slightly, fl ow falls markedly at the arteriolar level. This is due to the signifi cant increase in resistance encountered at the arteriolar level. The high resistance to fl ow diminishes pressure
Diastolic pressure
Mean arterialpressure
MAP = DP + 1/3(SP - DP)
Pre
ssur
e m
m H
gSystolic pressure
Time
FIGURE 5-3
Calculation of mean arterial blood pressure
Narrow pulse pressure is seen in aortic stenosis or low cardiac output states such as occurs with hemorrhage, tamponade and cardiogenic shock. Widened pulse pressure is seen with PDA, systemic to pulmonary shunts, distributive shock, vasodilated septic shock and with severe aortic regurgitation.
100 F.A. MAFFEI
pulsations to the small downstream vessels, but also causes pressure pulsations to refl ect back upstream. Therefore, the contour of a peripheral arterial waveform is a determined by both forward pulsations originating from LV ejection (stroke volume) and refl ected pulsatile waves from distal vessel walls and bifurcation points. Clinically, these refl ected waves become more pronounced with stiff noncompliant arteries. In the elderly, systolic hypertension is due, in part, to a loss in the arterial distensibility causing refl ected waves to add to the systolic peak.
Arterial Waveform Technical Considerations Prior to ascribing an abnormal arterial waveform to a physiological perturbation, it is essen-tial that mechanical causes of a waveform change be ruled out (i.e. over and underdamping, bubbles in the circuit, thrombus in the catheter, improper zeroing). To better understand the technical limitations of intra-arterial monitoring, a brief discussion regarding the technical principles that govern pressure waves is warranted.
Wave Frequency and Resonance
Invasive arterial monitoring systems consist of an intravascular catheter connected to a low- compliance, saline-fi lled tube that provides a continuous fl uid column to an electronic transducer. The pressure waveform of the arterial pulse is transmitted via the column of fl uid to the pressure transducer where it is converted into an electrical signal. These signals are then amplifi ed, dis-played, and recorded. The pressure waveform generated by a pulse is not a simple single sine wave that is transmitted down the fl uid column. Instead, it is a combination of a fundamental wave (the pulse rate) and a series of harmonic waves (pressure waves refl ected from the vascular tree). Harmonics are smaller waves whose frequencies are multiples of the fundamental frequency.
4
6
5
3
2
1
FIGURE 5-4
Normal arterial waveform analysis: ( 1 ) sharp upstroke – anacrotic limb ( 2 ) peak arterial pressure, ( 3 ) decline in aortic pressure as LV ejection slows, ( 4 ) notch in descending limb – incisura or dicrotic notch, ( 5 ) diastolic runoff and ( 6 ) end diastolic pressure
The contour of a peripheral arterial waveform is a determined by both forward pulsations originating from LV ejection and refl ected waves from distal vessels and bifurcation points.
101 C HAPTER 5 • ASS ESS M ENT OF CAR DIOVASC U LAR FU NCTION
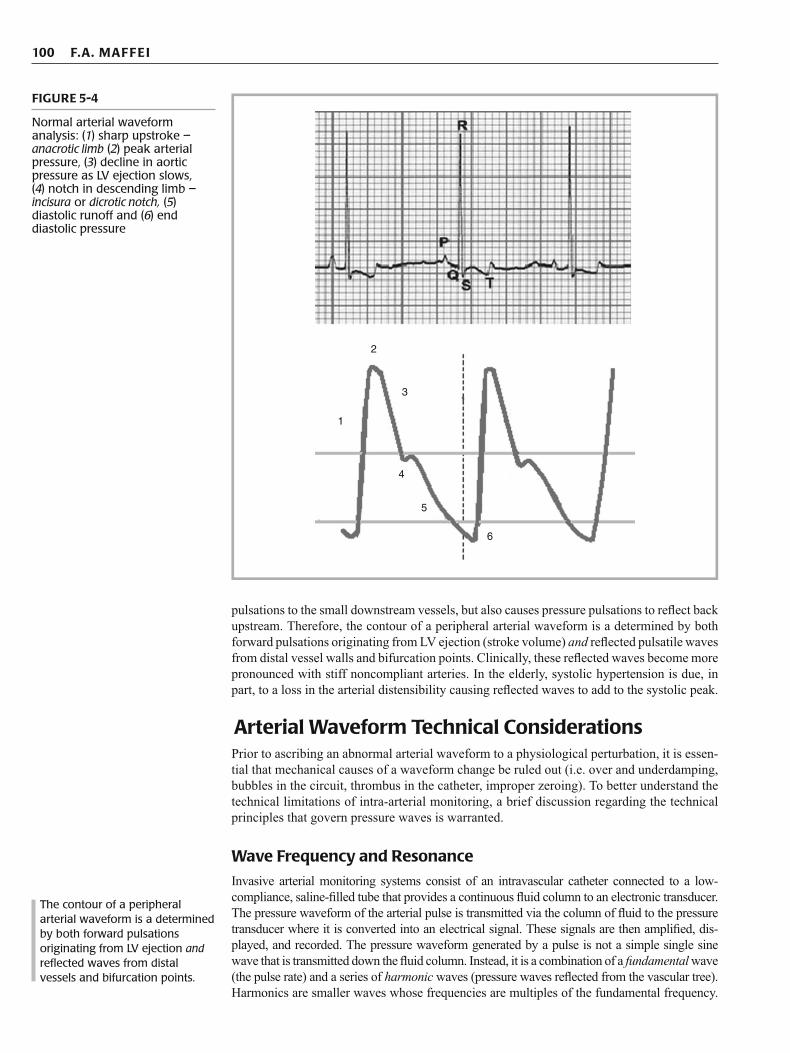
If the fundamental frequency is 1 Hz or 60 bpm, then the harmonic waves could be 2, 3, 4 Hz, etc. The fundamental frequency is also referred to as the fi rst harmonic wave. Fourier’s theory states that any complex waveform, such as an arterial pressure waveform, is constructed from the sum of all waveform frequencies (Fig. 5-5 ). Fourier analysis is the mathematical process of converting a complex waveform (with all its constituent sine waves) into a single pressure waveform.
In an ideal environment, the pressure wave that the arterial pulse generates would be the only wave the transducer would convert into an electrical signal. As in any complex system, the ideal is seldom realized. Instead, the arterial pressure wave causes the monitoring system to oscillate freely, and thus, produce its own set of sine waves. The frequency of the oscilla-tions is called the system’s natural frequency . If the natural frequency of the system is in the same range as the natural frequency of the arterial waveform, the amplitudes of the waves become additive or resonant . Clinically, resonant augmentation of the arterial pressure wave causes an artifactual increase in systolic pressure, (also called pressure overshoot, ringing, or resonance), and an artifactual decrease in diastolic pressure. Systolic pressures may be falsely increased by as much as 30%. Resonance becomes problematic when the monitoring system has a low natural frequency and the heart rate is high. Recall that the arterial pulse is made up of multiple constituent wave forms. Therefore, resonance amplifi cation can occur when the natural frequency of the system approximates the frequency of any of the constitu-ent sine waves that make up the arterial pulse. Accurate measurement of an arterial pressure is accomplished by assuring the natural frequency of the measurement system is at least eight times higher than the frequency of the arterial pressure wave, which is equal to the heart rate. An accurate monitoring system at heart rates of 180 bpm should have its natural frequency be equal to 24 Hz (180/60 x 8 = 24 Hz).
Damping
In addition to the effects of the natural frequency of the monitoring system (potential for reso-nance), the system’s own physical forces may interfere with accurate measurement of the arte-rial pressure. Damping describes the interaction between the oscillatory energy of a wave and the physical properties of the monitoring system. Damping causes a progressive diminution of systems inherent oscillations. In an ideal system with no damping effects, the oscillations of a wave would continue indefi nitely at the system’s undamped natural frequency . The undamped natural frequency is only a theoretical value; it can be calculated, but not measured. In the real world, oscillations are always affected by the physical forces of the monitoring system (i.e. friction, compliance and elastance) so that the frequency of oscillations occurs at the system’s damped natural frequency . A monitoring system is optimally damped if it dissipates the physi-cal forces produced by its components and selectively conducts the oscillations of the pressure waveform. Optimal damping is diffi cult to achieve. Inadequately damped systems ( under-damping) will result in the production of many sequentially decreasing “reverberation” waves that occur in response to each pulse wave. When the frequency of these reverberation waves (also referred to as ringing) approach the arterial pulse wave frequency, resonance occurs and systolic pressure is overestimated. An underdamped waveform is characterized by a high
Accurate measurement of an arterial pressure is accomplished by assuring the natural frequency of the measurement system is at least eight times higher than the frequency of the arterial pressure wave.
Resonant augmentation of the arterial pressure wave can cause an artifactual increase in systolic pressure and an artifactual decrease in diastolic pressure with systolic pressures falsely increased by as much as 30%.
Underdamping results in exces-sive resonance which in turn artifi cially increases systolic pressure. Overdamping causes the oscillatory energy of the pressure wave to be reduced by the system’s physical forces and results in an artifi cially low systolic blood pressure.
Fundamental sine wave(1st harmonic wave)
PLUS
Second harmonic wave
Summation waveresemblingarterial waveform
FIGURE 5-5
The arterial waveform is made up the sum of the fundamental sine wave and the harmonic waves. Although a simplifi ed representation, the shape of the arterial waveform can be appreciated by superimposing the harmonic wave onto the fundamental wave

102 F.A. MAFFEI
initial spike in the waveform. Underdamped systems may be due to excessive tubing length or vasoconstriction. A system is overdamped when the oscillatory energy of the pressure wave is reduced by the physical forces of the system. O verdamping results in an artifi cially low systolic blood pressure. Causes of overdamping include multiple stopcocks, leaks, bubbles, clots, com-pliant tubing or kinks in the cannula or tubing (Fig. 5-6 ).
Fast Flush Test
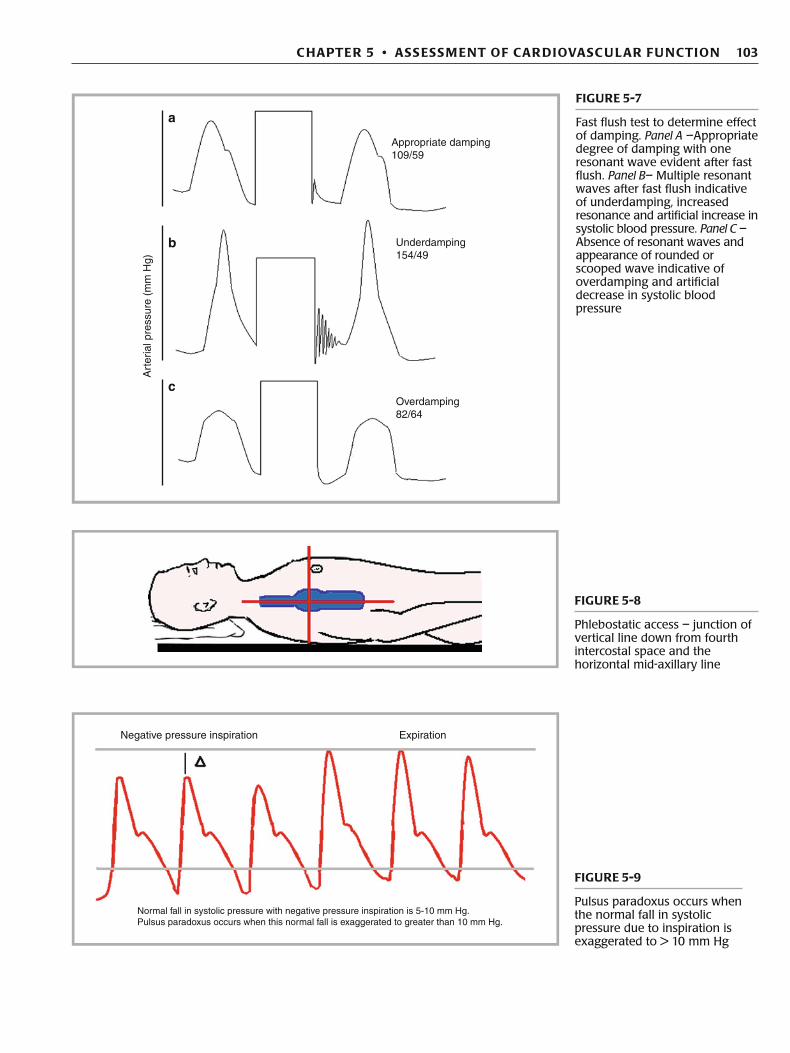
Understanding that underdamped systems can lead to resonance, a simple bedside test can iden-tify the presence of resonant waves. Delivering a small “fast fl ush” to the system allows quan-tifi cation of excessive resonance within the system. The initial change on the arterial waveform monitor consists of a large square wave refl ecting the abrupt and large pressure change the sys-tem has undergone due to the fast fl ush. The large square wave is followed by a series of reso-nant waves prior to returning to the arterial pressure wave. In an appropriately damped system, only one resonant wave is seen. In an underdamped system, multiple waves are seen prior to the return to the artifi cially elevated systolic pressure waveform (often due to excessive tubing length). In an overdamped system, no waves are seen (Fig. 5-7 ). There may be a rounded or scooped appearance on the tracing prior to returning to the artifi cially lowered systolic pressure waveform. This is often due to excessive tubing compliance, bubbles or leaks.
Leveling and Zeroing
Pressure monitoring devices must be leveled to the phlebostatic access and have the contribu-tion of atmospheric pressure negated. The phlebostatic axis is the external reference point of the atria and is found by locating the junction of the vertical line drawn down from the fourth inter-costal space (usually located near the nipple) and the horizontal mid-axillary line (Fig. 5-8 ). Atmospheric pressure is discounted from the pressure measurement by opening the system to the atmosphere and calibrating the pressure reading to zero at the phlebostatic axis. Failure to level the system results in an error due to the addition of hydrostatic pressure of the fl uid in the column to the blood pressure. Every 10 cm error in leveling can result in a 7.4 mm Hg error in the pressure measured. It is not the transducer per se but the point at which the system is opened to the atmosphere during zeroing that must be level with the phlebostatic axis. A transducer that is zeroed to a point below the patient’s heart will produce falsely elevated pressures and a trans-ducer that is zeroed to a point above the patient’s heart will produce falsely low pressures.
Variations in Arterial Waveforms Pulsus Paradoxus
Pulsus paradoxus is a true misnomer. It is not a paradoxical phenomenon, but instead, an exag-geration of a normal hemodynamic response to inspiration (Fig. 5-9 ). Classically, pulsus
160
120
80
40
Damping:
Possible causes:
Appropriate damping Overdamping
Overly compliant tubingAir bubbles, clots, stopcocks
Excessive system resonanceExcessive tubing length
Underdamping
FIGURE 5-6
Effect of damping on arterial waveform appearance
The fast fl ush test allows for quantifi cation of excessive resonance within the system.
103 C HAPTER 5 • ASS ESS M ENT OF CAR DIOVASC U LAR FU NCTION
FIGURE 5-8
Phlebostatic access – junction of vertical line down from fourth intercostal space and the horizontal mid-axillary line
Negative pressure inspiration Expiration
Normal fall in systolic pressure with negative pressure inspiration is 5-10 mm Hg.Pulsus paradoxus occurs when this normal fall is exaggerated to greater than 10 mm Hg.
FIGURE 5-9
Pulsus paradoxus occurs when the normal fall in systolic pressure due to inspiration is exaggerated to > 10 mm Hg
Appropriate damping109/59
a
b
c
Underdamping154/49
Art
eria
l pre
ssur
e (m
m H
g)
Overdamping82/64
FIGURE 5-7
Fast fl ush test to determine effect of damping. Panel A –Appropriate degree of damping with one resonant wave evident after fast fl ush. Panel B – Multiple resonant waves after fast fl ush indicative of underdamping, increased resonance and artifi cial increase in systolic blood pressure. Panel C – Absence of resonant waves and appearance of rounded or scooped wave indicative of overdamping and artifi cial decrease in systolic blood pressure

104 F.A. MAFFEI
paradoxus is defi ned in a patient, not undergoing positive pressure ventilation, as an exaggerated fall in systolic blood pressure, usually greater than 10 mm Hg (normal is about 5 mm Hg), upon inspiration. There are several mechanisms responsible for this fall in systolic pressure. It is impor-tant to appreciate these mechanisms in the healthy state to better understand how their affects are increased in pathological states such as hypovolemia, tamponade and obstructive airway disease.
The normal fall in systolic pressure during inspiration is due to several hemodynamic events.
1. Inspiration causes pooling of pulmonary venous blood, and therefore, decreased left heart preload. 2. Inspiration causes increased venous return to the right heart. However, this is not immediately trans-
lated to increasing LV preload. Instead, the increased right ventricular volume actually causes a further decrease in LV size and preload by the mechanism of ventricular interdependence . That is, the increased right ventricular (RV) size causes septal bulging to the left, and hence, transient decreased LV size.
3. Negative intrathoracic pressure also causes an increase in transmural pressure leading to an increase in LV afterload.
Exaggerated falls in systolic pressure during inspiration occur in a variety of pathological states. In diseases that create lower airways obstruction (i.e. asthma, COPD), the greater negative intrathoracic pressure generated during inspiration accentuates the above effects. In tamponade states, compromised LV fi lling by pericardial forces and the leftward septal bulg-ing that occurs during inspiration further accentuates pulsus paradoxus. Any condition asso-ciated with hypovolemia and decreased circulating volume will also result in an exaggerated fall in systolic blood pressure during inspiration.
Systolic Pressure Variation
Systolic pressure variation refers to the arterial pressure waveform changes that occur during posi-tive pressure mechanical ventilation. The hemodynamic principles are similar to those in pulsus paradoxus, but instead of a fall in pressure during negative pressure breathing, there is a rise in pressure during positive pressure breathing. This has led some to refer to this phenomenon as “reverse pulsus paradoxus”; however systolic pressure variation (SPV) is the more correct term.
A single positive pressure breath normally affects the arterial pressure in a biphasic man-ner (Fig. 5-10 ). The initial hemodynamic effect of a positive pressure breath is to “squeeze” pulmonary vascular blood into the LA (recall, the opposite, “pooling” of blood occurs with negative pressure inspiration) leading to a rise in systolic pressure. In addition, positive intrathoracic pressure reduces the afterload on the LV further augmenting this early rise in arterial pressure. This is referred to as the D up component of SPV . Note, while LA preload
The hemodynamic principles that govern systolic pressure variation are similar to those in pulsus paradoxus. Instead of a fall in pressure during negative pressure breathing there is an early rise in pressure during positive pressure breathing.
DeltaUp
DeltaDown
Positive pressure breath
Inspiration Expiration
Baseline systolic pressure
Art
eria
l pre
ssur
e m
m H
gA
irway
pre
ssur
e cm
H20
SPV
FIGURE 5-10
Systolic pressure variation during single positive pressure breath. Delta up – Increase in systolic pressure at the initiation of positive pressure breath. Delta down – Decrease in systolic pressure later in positive pressure breath. SPV - systolic pressure variation (both delta up and down components)
Pulsus paradoxus is not a paradoxical phenomenon but rather is an exaggeration of the normal fall in systolic pressure in response to the hemodynamic changes induced by negative pressure inspiration.
105 C HAPTER 5 • ASS ESS M ENT OF CAR DIOVASC U LAR FU NCTION
is augmented early in the positive pressure breath, the RA preload is decreased as the posi-tive intrathoracic pressure decreases venous return. Following the D up, a fall in systolic pressure follows due to the initial decreased venous return to the right heart “catching up”, and ultimately, resulting in decreased left sided preload. The reduction in LV preload and output leads to a smaller LV stroke volume and a brief reduction in arterial pressure that occurs later in the positive pressure breath ( D down).
An exaggerated SPV (>10 mm Hg) can occur if the D down component is lowered or if the D up component is elevated. Hypovolemia has consistently been found to cause an increased SPV (>10 mm Hg). Positive pressure amplifi es the effects of decreased effective circulating volume and causes a greater fall in the D down component of SPV. Several stud-ies have demonstrated that an increase in the SPV occurs prior to a fall in the arterial pres-sure, and may be predictive of clinically signifi cant hypovolemia (PAWP <10 mm Hg). A decreasing D down component can also occur due to excessive airway pressure causing decreased venous return, and subsequent, decreased LV stroke volume.
An increased SPV may also be seen when the initial D up component is increased. During a positive pressure breath, the D up component refl ects a transient augmentation in the left ventricu-lar stroke volume by increased LV preload and decreased LV afterload. This effect is increased in the setting of myocardial dysfunction. Therefore, a patient in CHF may actually have an increased SPV while on positive pressure ventilation. However, this increased SPV is not due to hypov-olemia; but rather, the result of improved left ventricular ejection secondary to reducing afterload with each positive pressure breath.
The measurement of SPV in mechanically ventilated children is an excellent example of functional hemodynamics . Traditionally, many hemodynamic measurements such as central venous pressure have been static values taken at the bedside. When hemodynamic measure-ments are taken in the context of a physical maneuver (i.e. application of a positive pressure breath, straight leg raise) or a therapeutic challenge (i.e. volume infusion), the hemodynamic data are dynamic and often provide far more useful information than static measurements alone. Stroke volume variation (SVV) is also a functional measurement taken during positive pressure breathing that provides valuable information regarding volume responsiveness. Using pulse con-tour analysis (see novel techniques in cardiac output assessment) distinct variations of left ven-tricular stroke volume during positive pressure breathing can be quantifi ed. Like SPV, SVV has been reported to predict fl uid responsiveness in mechanically ventilated adults. These functional measurements have been proven to be more accurate than central venous pressure alone in pre-dicting which patient will benefi t from further volume replacement.
Pulsus Alternans
Alternating beats of larger and smaller pulse pressures in the setting of a normal rhythm is termed pulsus alternans. It is most often seen in the setting of severe left ventricular systolic dysfunction (Fig. 5-11 ). It should be distinguished from electrical alternans where alternat-ing pressures are due to a bigeminal rhythm.
Pulsus Parvus et Tardus
A decreased (parvus) and delayed (tardus) upstroke in the arterial waveform is referred to as pulsus parvus et tardus and is characteristic of severe LV outfl ow obstruction such as aortic stenosis (Fig. 5-12 ). Mechanical causes of a low amplitude waveform (i.e. overdamping) may produce a similar waveform.
Pulsus Bisferiens and Dicrotic Pulse
Pulsus bisferiens produces a brisk arterial upstroke followed by two systolic peaks. The two peaks represent an initial percussive wave caused by LV ejection followed by a refl ected tidal wave. A bisferiens pulse is seen in hyperdynamic states, aortic regurgitation and hyper-trophic cardiomyopathy.
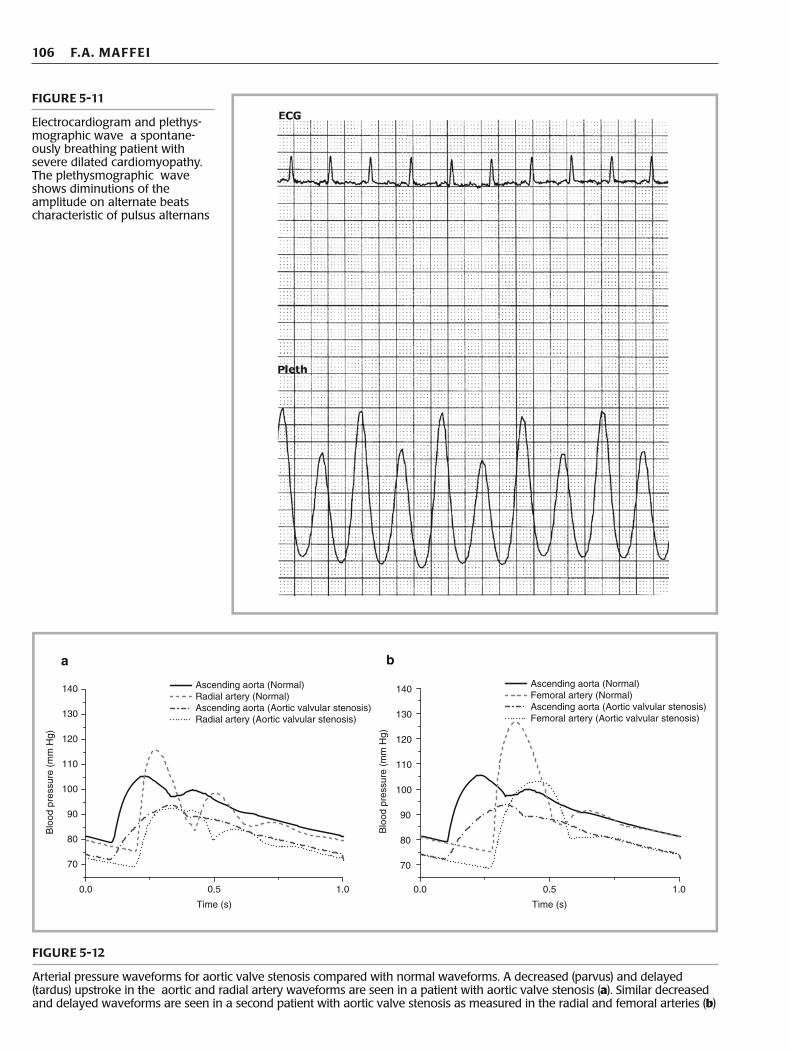
A dicrotic pulse (Fig. 5-13 ) may have the same appearance of pulsus biferiens but the second peak occurs in diastole. It is seen in low cardiac output states but may also occur in hyperdynamic states. It has also been reported following aortic valve surgery including the Ross procedure.
Functional hemodynamics such as systolic pressure variation are measurements taken in the context of a physical maneuver (i.e. application of a positive pressure breath, straight leg raise) or therapeutic challenge (i.e. volume infusion).
The D up component of SPV refl ects augmentation of systolic blood pressure early in the positive pressure breath due to an initial increase in LV preload and decrease in LV afterload. The D down refl ects a fall in systolic pressure later in the positive pressure breath as decreased venous return to the RV results in a subsequent decrease in LV preload.
106 F.A. MAFFEI
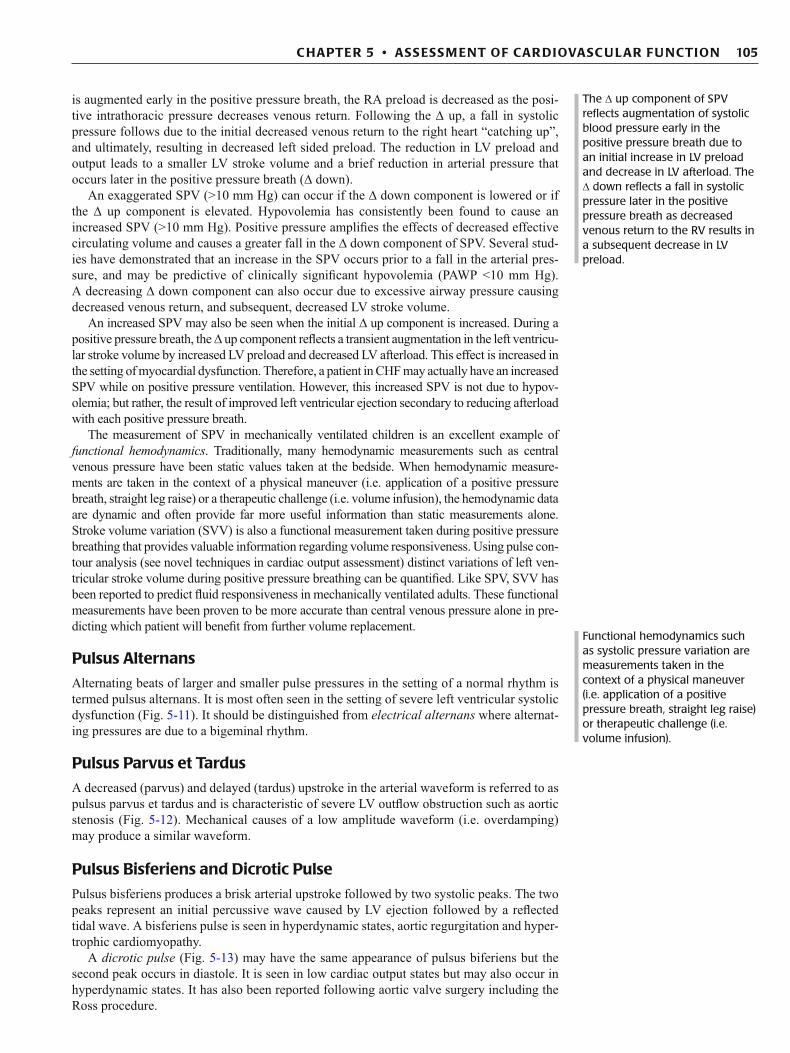
FIGURE 5-11
Electrocardiogram and plethys-mographic wave a spontane-ously breathing patient with severe dilated cardiomyopathy. The plethysmographic wave shows diminutions of the amplitude on alternate beats characteristic of pulsus alternans
1.00.50.0
70
80
90
100
110
120
130
140
Blo
od p
ress
ure
(mm
Hg)
Time (s)
1.00.50.0
Time (s)
Ascending aorta (Normal)Radial artery (Normal)Ascending aorta (Aortic valvular stenosis)Radial artery (Aortic valvular stenosis)
70
80
90
100
110
120
130
140 Ascending aorta (Normal)Femoral artery (Normal)Ascending aorta (Aortic valvular stenosis)Femoral artery (Aortic valvular stenosis)
Blo
od p
ress
ure
(mm
Hg)
a b
FIGURE 5-12
Arterial pressure waveforms for aortic valve stenosis compared with normal waveforms. A decreased (parvus) and delayed (tardus) upstroke in the aortic and radial artery waveforms are seen in a patient with aortic valve stenosis ( a ). Similar decreased and delayed waveforms are seen in a second patient with aortic valve stenosis as measured in the radial and femoral arteries ( b )
107 C HAPTER 5 • ASS ESS M ENT OF CAR DIOVASC U LAR FU NCTION
Complications of Invasive Arterial Pressure Monitoring There are multiple complications that may occur during placement and maintenance of an arterial line (Table 5-1 ). A large retrospective pediatric cohort study demonstrated that up to 10% of indwelling arterial lines resulted in complications. Two complications that deserve special consideration are ischemia and infection.
Ischemic Injury
Radial artery catheterization is a relatively safe procedure with a very low incidence of per-manent distal ischemic injury. Although vascular supply to the hand varies greatly, adequate collateral fl ow is present in most children. Procedures that use the radial artery as a harvest graft for coronary artery bypass and as an entry site for cardiac catheterization have provided new insight into the assessment of ulnar collateral blood fl ow to the hand – specifi cally the utility of the Allen test. The modifi ed Allen test has been the most frequently used method to clinically assess adequacy of ulnar artery collateral fl ow. It is performed by instructing the patient to clench his/her fi st, or if the patient is unable, the hand is closed tightly. Direct occlusive pressure is applied to both the ulnar and radial arteries thereby temporarily obstruct-ing blood fl ow to the hand. Blanching of the palm and fi ngers should occur. The occlusive pressure on the ulnar artery is released and the hand should reperfuse and fl ush within 5–10 seconds. Flushing denotes that the ulnar artery is patent and provides good collateral blood fl ow. If the hand does not fl ush, the ulnar circulation is inadequate, and the radial artery should not be instrumented. However, t he utility of the modifi ed Allen test has been ques-tioned and it may have no direct correlation with ischemic complications of radial artery catheterization. It is a subjective clinical test that lacks interobserver reliability. Multiple reports have documented adequate collateral fl ow via doppler or angiography when the modi-fi ed Allen test suggested a lack of ulnar collateral fl ow. Its use may be limited as a bedside screening test. An Allen test that demonstrates no collateral fl ow from the ulnar artery may not preclude the use of a radial arterial line. A doppler or angiographic study should be obtained to verify an Allen test that suggests no collateral fl ow.
The femoral, axillary, dorsalis pedis and posterior tibial arteries are alternative sites for arterial line placement. The placement of an arterial catheter in the brachial artery has
ARTERIAL LINE COMPLICATIONS
Vasospasm Distal ischemia Arterial thrombosis Embolism Infection Hematoma Hemorrhage from inadvertent disconnection Nerve injury Aneurysm formation
TABLE 5-1
COMPLICATIONS OF ARTERIAL CANNULATION
FIGURE 5-13
Dicrotic pulse-Systolic upstroke (s) followed by a second diastolic peak (d). (Barber et al. 2007 )
108 F.A. MAFFEI
traditionally been avoided due to lack of suffi cient collateral fl ow. However, recent adult and pediatric studies have demonstrated that brachial artery catheterization may not carry an increased risk of ischemic complications as previously believed. Nonetheless, until larger studies are conducted regarding the safety of brachial artery catheterization, it should not be used as a primary site for intraarterial pressure monitoring.
Infection
Arterial catheters have traditionally been believed to have a lower infection rate compared to venous catheters due to the high fl ow and high oxygen tension present in arteries. The true incidence of arterial-related catheter infections has been diffi cult to ascertain as children with an arterial catheter often have a concomitant central venous line. Recent data has sug-gested that the rate of blood stream infections due to arterial lines may approach those observed in central venous catheters especially those placed in the femoral artery. As with central venous catheters, the risk increases incrementally with the duration of intra-arterial catheter use. Understanding the tremendous impact that blood stream infections (BSI) have on intensive care morbidity and mortality, arterial catheters should be treated with the same vigilance as central venous catheters. Methods to decrease BSI from arterial catheters should include selective use, early removal and adherence to the proven protocols to assure appropriate insertion and maintenance techniques.
Central Venous Pressure Monitoring The central venous pressure (CVP) may provide important hemodynamic information in a variety of disease states encountered in the PICU. The optimal site for monitoring CVP is at the junction of the superior vena cava and the upper portion of the RA. However, signifi cant data can be obtained from any centrally placed catheter (i.e. femoral, internal jugular, or subclavian vein). CVP varies with changes in intrapleural pressures. The measured CVP most closely approximates transmural fi lling pressures at end expiration when the intrapleu-ral pressure approaches atmospheric pressure.
A true CVP refl ects right ventricular end diastolic pressure (RVEDP), which has been used to estimate right ventricular volume (RVEDV). The RVEDP is also dependent on the underlying status of the RV, hence:
It is critical to appreciate that CVP provides information regarding RVEDP, however, it may not accurately predict how the ventricle will respond to volume administration. Right ven-tricular end-diastolic volume is affected by tricuspid regurgitation and poor ventricular com-pliance, both of which are common in hemodynamically unstable children. Multiple adult studies have documented that CVP does not correlate well with LVEDV. Although very high or very low values for the CVP may provide important data regarding the status of the RV; most intermediate readings provide little clinically useful information.
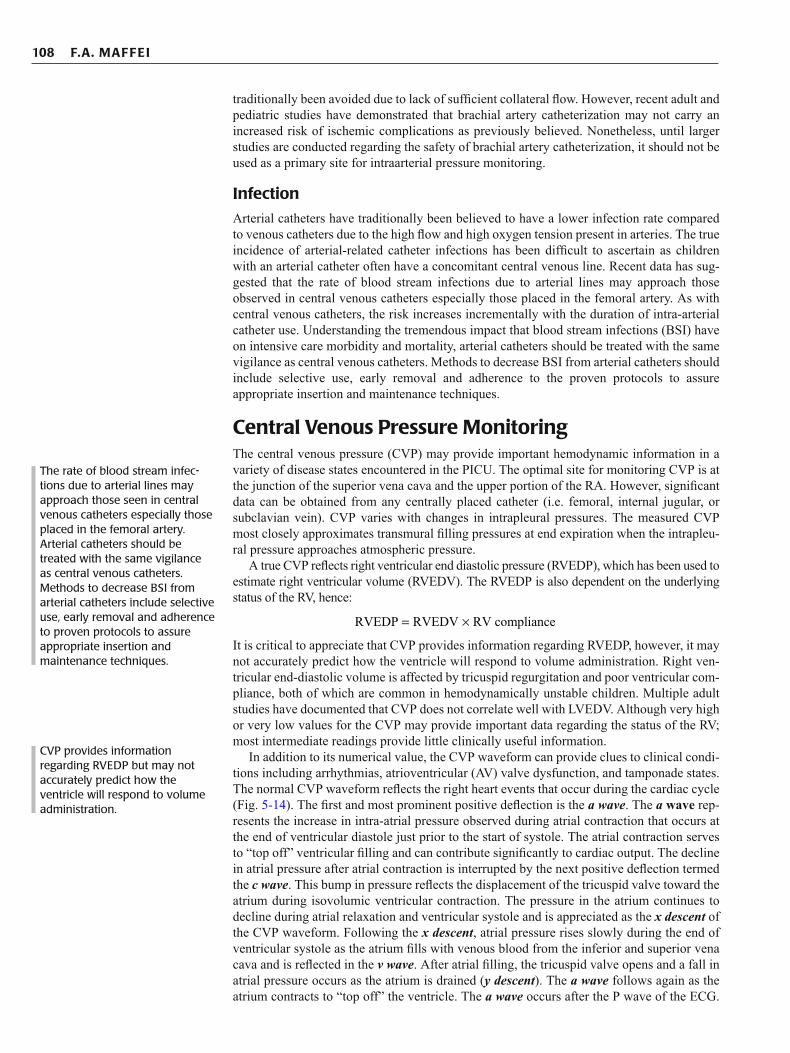
In addition to its numerical value, the CVP waveform can provide clues to clinical condi-tions including arrhythmias, atrioventricular (AV) valve dysfunction, and tamponade states. The normal CVP waveform refl ects the right heart events that occur during the cardiac cycle (Fig. 5-14 ). The fi rst and most prominent positive defl ection is the a wave . The a wave rep-resents the increase in intra-atrial pressure observed during atrial contraction that occurs at the end of ventricular diastole just prior to the start of systole. The atrial contraction serves to “top off” ventricular fi lling and can contribute signifi cantly to cardiac output. The decline in atrial pressure after atrial contraction is interrupted by the next positive defl ection termed the c wave . This bump in pressure refl ects the displacement of the tricuspid valve toward the atrium during isovolumic ventricular contraction. The pressure in the atrium continues to decline during atrial relaxation and ventricular systole and is appreciated as the x descent of the CVP waveform. Following the x descent , atrial pressure rises slowly during the end of ventricular systole as the atrium fi lls with venous blood from the inferior and superior vena cava and is refl ected in the v wave . After atrial fi lling, the tricuspid valve opens and a fall in atrial pressure occurs as the atrium is drained ( y descent ). The a wave follows again as the atrium contracts to “top off” the ventricle. The a wave occurs after the P wave of the ECG.
RVEDP RVEDV RV compliance= ×
The rate of blood stream infec-tions due to arterial lines may approach those seen in central venous catheters especially those placed in the femoral artery. Arterial catheters should be treated with the same vigilance as central venous catheters. Methods to decrease BSI from arterial catheters include selective use, early removal and adherence to proven protocols to assure appropriate insertion and maintenance techniques.
CVP provides information regarding RVEDP but may not accurately predict how the ventricle will respond to volume administration.
109 C HAPTER 5 • ASS ESS M ENT OF CAR DIOVASC U LAR FU NCTION
The c wave, if present, occurs at the end of the QRS complex and the v wave occurs after the T wave of the ECG. To obtain a numerical value of the CVP, it is best to measure the mean pressure of the a wave .
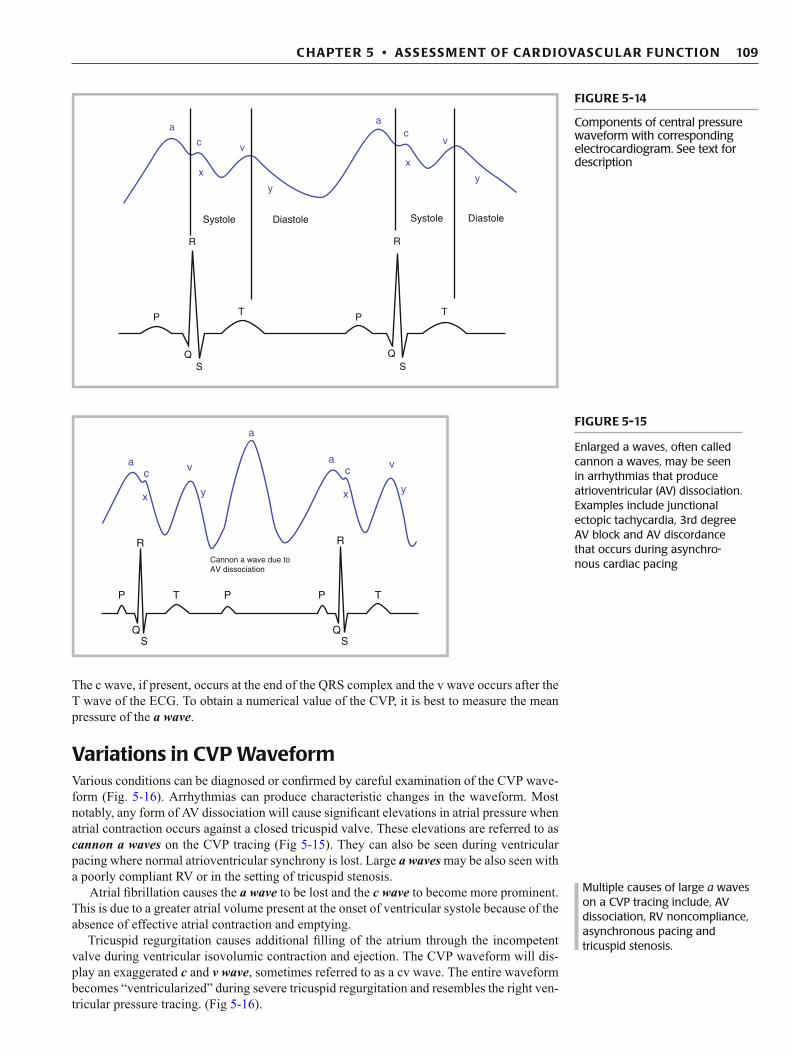
Variations in CVP Waveform Various conditions can be diagnosed or confi rmed by careful examination of the CVP wave-form (Fig. 5-16 ). Arrhythmias can produce characteristic changes in the waveform. Most notably, any form of AV dissociation will cause signifi cant elevations in atrial pressure when atrial contraction occurs against a closed tricuspid valve. These elevations are referred to as cannon a waves on the CVP tracing (Fig 5-15 ). They can also be seen during ventricular pacing where normal atrioventricular synchrony is lost. Large a waves may be also seen with a poorly compliant RV or in the setting of tricuspid stenosis.
Atrial fi brillation causes the a wave to be lost and the c wave to become more prominent. This is due to a greater atrial volume present at the onset of ventricular systole because of the absence of effective atrial contraction and emptying.
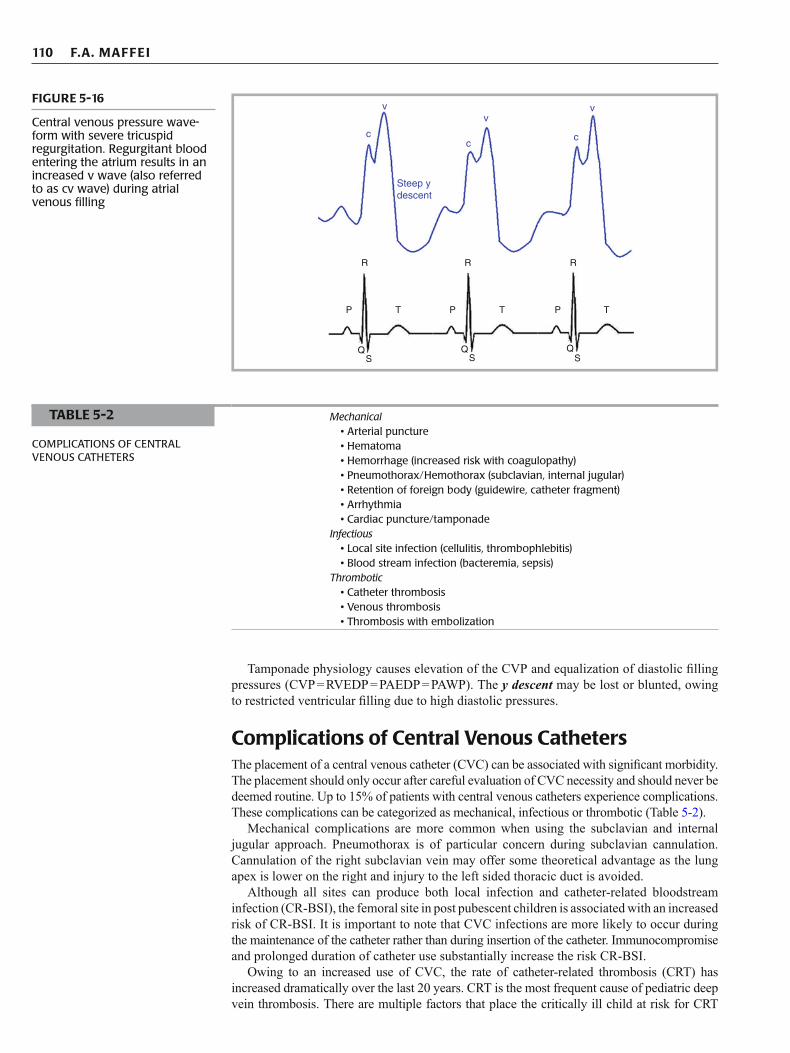
Tricuspid regurgitation causes additional fi lling of the atrium through the incompetent valve during ventricular isovolumic contraction and ejection. The CVP waveform will dis-play an exaggerated c and v wave , sometimes referred to as a cv wave. The entire waveform becomes “ventricularized” during severe tricuspid regurgitation and resembles the right ven-tricular pressure tracing. (Fig 5-16 ).
Multiple causes of large a waves on a CVP tracing include, AV dissociation, RV noncompliance, asynchronous pacing and tricuspid stenosis.
FIGURE 5-14
Components of central pressure waveform with corresponding electrocardiogram. See text for description
a
c
x
Systole
RR
P
QS
T P
QS
T
Diastole Systole Diastole
v
y
ac
x
v
y
a
a
cv
y
Cannon a wave due toAV dissociation
x
ac
v
yx
P T P
R
QS
QS
P T
R
FIGURE 5-15
Enlarged a waves, often called cannon a waves, may be seen in arrhythmias that produce atrioventricular (AV) dissociation. Examples include junctional ectopic tachycardia, 3rd degree AV block and AV discordance that occurs during asynchro-nous cardiac pacing
110 F.A. MAFFEI
Tamponade physiology causes elevation of the CVP and equalization of diastolic fi lling pressures (CVP = RVEDP = PAEDP = PAWP). The y descent may be lost or blunted, owing to restricted ventricular fi lling due to high diastolic pressures.
Complications of Central Venous Catheters The placement of a central venous catheter (CVC) can be associated with signifi cant morbidity. The placement should only occur after careful evaluation of CVC necessity and should never be deemed routine. Up to 15% of patients with central venous catheters experience complications. These complications can be categorized as mechanical, infectious or thrombotic (Table 5-2 ).
Mechanical complications are more common when using the subclavian and internal jugular approach. Pneumothorax is of particular concern during subclavian cannulation. Cannulation of the right subclavian vein may offer some theoretical advantage as the lung apex is lower on the right and injury to the left sided thoracic duct is avoided.
Although all sites can produce both local infection and catheter-related bloodstream infection (CR-BSI), the femoral site in post pubescent children is associated with an increased risk of CR-BSI. It is important to note that CVC infections are more likely to occur during the maintenance of the catheter rather than during insertion of the catheter. Immunocompromise and prolonged duration of catheter use substantially increase the risk CR-BSI.
Owing to an increased use of CVC, the rate of catheter-related thrombosis (CRT) has increased dramatically over the last 20 years. CRT is the most frequent cause of pediatric deep vein thrombosis. There are multiple factors that place the critically ill child at risk for CRT
c
v
c
Steep ydescent
v
c
v
R R R
P
QS
QS
QS
T P T P T
FIGURE 5-16
Central venous pressure wave-form with severe tricuspid regurgitation. Regurgitant blood entering the atrium results in an increased v wave (also referred to as cv wave) during atrial venous fi lling
Mechanical • Arterial puncture • Hematoma • Hemorrhage (increased risk with coagulopathy) • Pneumothorax/Hemothorax (subclavian, internal jugular) • Retention of foreign body (guidewire, catheter fragment) • Arrhythmia • Cardiac puncture/tamponade Infectious • Local site infection (cellulitis, thrombophlebitis) • Blood stream infection (bacteremia, sepsis) Thrombotic • Catheter thrombosis • Venous thrombosis • Thrombosis with embolization
TABLE 5-2
COMPLICATIONS OF CENTRAL VENOUS CATHETERS
111 C HAPTER 5 • ASS ESS M ENT OF CAR DIOVASC U LAR FU NCTION
(Table 5-3 ). The incidence of CRT is increased in children with malignancies and those at risk for hyperviscosity such as children with diabetic ketoacidosis. Small vessel size in relation to catheter size and venous stasis has been implicated as increasing CRT risk in children. Technical issues during insertion play a signifi cant role in the thrombus initiation. Multiple failed attempts causes endothelial injury and tissue factor release from damaged endothelium. Tissue factor (thromboplastin) forms a complex with factor VIIa and activates factor IX, thereby initiating a procoagulant cascade that generates thrombin. Thrombin is a potent platelet activator. Activated platelets arrive at the area of endothelial injury and act to propagate the thrombus.
All mechanical, infectious and thrombotic complications can be dramatically reduced by proper insertion and maintenance techniques such as using proper sedation, applying adequate local anesthesia, following strict aseptic techniques and understanding the regional anatomy at each site. Recent evidence suggests that the use of bedside ultrasound at the internal jugular and femoral sites can reduce insertion attempts and reduce overall complication rates.
MEASUREMENT OF CARDIAC OUTPUT
Physical examination, waveform analysis, biochemical markers and imaging provide indirect assessments of cardiac output (CO). At times, direct measurement of CO and intracardiac pressures is required. A review of the principles behind CO determination is important in understanding the utility and limitations of directly measuring CO. The following principles will be discussed:
Conservation of mass ■ Dye dilution method of determining cardiac output ■ Thermodilution method of determining cardiac output ■ Fick method of determining cardiac output ■
Underlying disease • Malignancy • Sepsis • Hypercoaguable states (i.e. malignancy, nephrotic syndrome, cyanotic congenital heart
disease, sepsis, endogenous anticoagulant defi ciency) • Dehydration (i.e. diabetic ketoacidosis) Multiple initial attempts Prolonged duration of use Use of hyperosmolar solutions Immobility Procoagulant medications (i.e. oral contraceptives)
TABLE 5-3
FACTORS INCREASING RISK OF CATHETER RELATED THROMBOSIS
Volume (liter) = Amount of substance A (gm)Conc. A (gm/I) final - Conc. A (gm/I) initial
Concentration (grams/liter)Volume (liters)
Amout of substance A(grams)
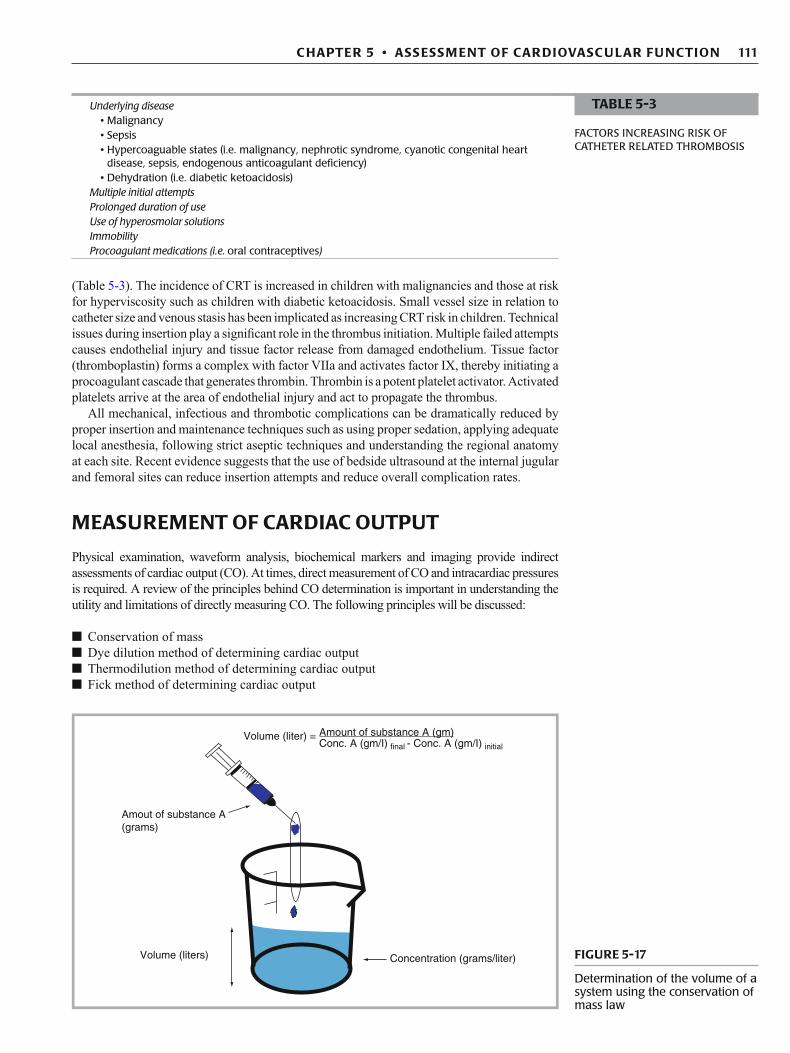
FIGURE 5-17
Determination of the volume of a system using the conservation of mass law
112 F.A. MAFFEI
Conservation of Mass The law of conservation of mass states that mass can neither be created nor destroyed, but that it can be changed. In other words, the output of a system must equal the input plus or minus any change that occurred within the system. The measurement of an unknown volume in a static system (i.e. a beaker) can be determined using this principle (Fig. 5-17 ). If a substance is added to a solution, and the initial and fi nal concentrations of the solution is known, than the volume of the beaker can be determined. The volume of the beaker can be solved by:
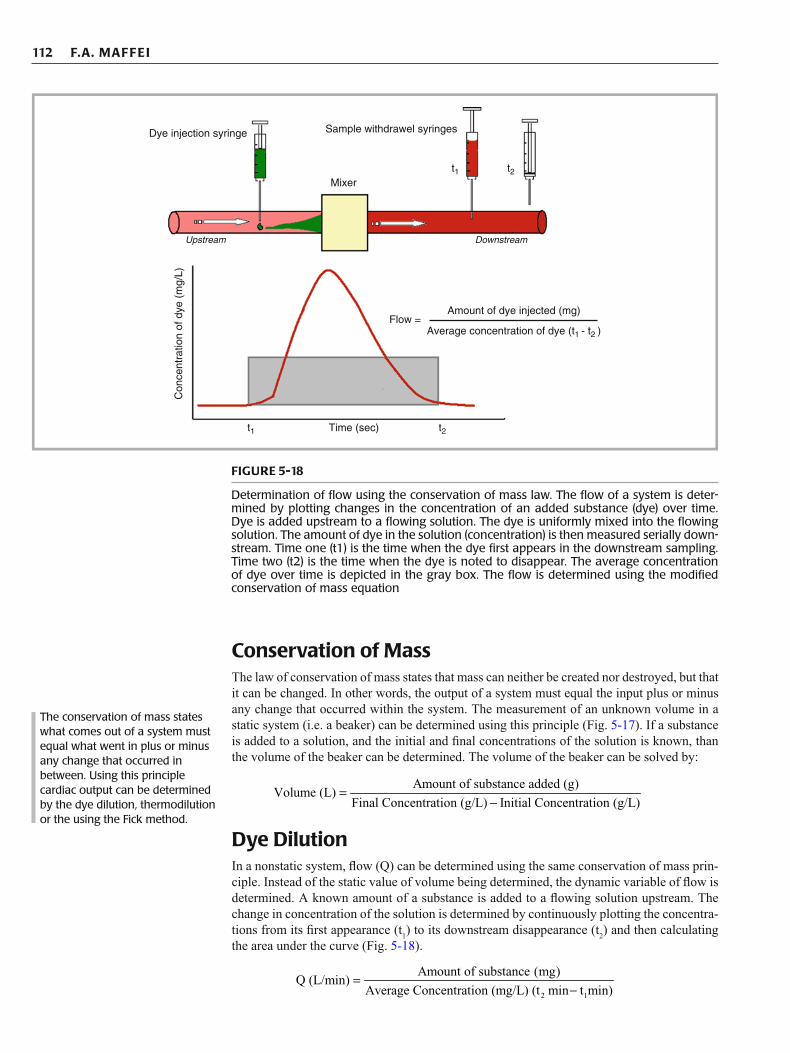
Dye Dilution In a nonstatic system, fl ow (Q) can be determined using the same conservation of mass prin-ciple. Instead of the static value of volume being determined, the dynamic variable of fl ow is determined. A known amount of a substance is added to a fl owing solution upstream. The change in concentration of the solution is determined by continuously plotting the concentra-tions from its fi rst appearance (t 1 ) to its downstream disappearance (t 2 ) and then calculating the area under the curve (Fig. 5-18 ).
Amount of substance added (g)Volume (L)
Final Concentration (g/L) Initial Concentration
(g/L)=
−
2 1
Amount of substance (mg)Q (L/min)
Average Concentration (mg/L) (t min t min)=
−
The conservation of mass states what comes out of a system must equal what went in plus or minus any change that occurred in between. Using this principle cardiac output can be determined by the dye dilution, thermodilution or the using the Fick method.
t1 t2
t1 t2
Time (sec)
Flow =Amount of dye injected (mg)
Average concentration of dye (t1 - t2 )
Dye injection syringe
Con
cent
ratio
n of
dye
(m
g/L)
Sample withdrawel syringes
Mixer
Upstream Downstream
FIGURE 5-18
Determination of fl ow using the conservation of mass law. The fl ow of a system is deter-mined by plotting changes in the concentration of an added substance (dye) over time. Dye is added upstream to a fl owing solution. The dye is uniformly mixed into the fl owing solution. The amount of dye in the solution (concentration) is then measured serially down-stream. Time one (t1) is the time when the dye fi rst appears in the downstream sampling. Time two (t2) is the time when the dye is noted to disappear. The average concentration of dye over time is depicted in the gray box. The fl ow is determined using the modifi ed conservation of mass equation

113 C HAPTER 5 • ASS ESS M ENT OF CAR DIOVASC U LAR FU NCTION
The equation to determine fl ow in a dynamic system essentially describes the dye dilution method for determining cardiac output. Substance I is the indicator dye that is injected into the venous side of the circulation (“upstream”). The heart serves as a mixer of the dye and sampling of the dye occurs at a distal artery (“downstream”).
Measurement of the dye in the distal artery is made problematic due to the recirculation phenomenon. Concentration of the dye will peak early on, and subsequently drop off as the slower particles arrive. However, before all the slower ones arrive, the faster particles recir-culate causing a falsely elevated value for the arterial concentration. To correct for this recir-culation phenomenon, the downslope of the curve is extrapolated (Fig. 5-19 ).
Fick Method In 1870, Adolph Fick, using the conservation of mass principle, described a physiological method of determining CO. Instead of using a dye as the “indicator”, oxygen is used. He postulated, in a steady state, that the oxygen leaving the lung via the pulmonary veins should equal the amount entering the lung via the pulmonary artery plus the amount of oxygen entrained during breathing (Fig. 5-20 ). That is, oxygen uptake by the lungs equals the oxy-gen consumed by the body’s metabolism (VO 2 ).
Cardiac output can be determined mathematically using the Fick method by fi rst account-ing for fl ow (Q) on both ends of the circuit. For the pulmonary circuit, the “in” is equal to the pulmonary blood fl ow (Q pul ) multiplied by the pulmonary artery content of oxygen (C pa O 2 )
I amount (g) 60 s/minCO (L/min) =
Concentration (g/L) t(s)
××
Time after injection (seconds)
Extrapolation of downwardportion of curve to avoidrecirculation error
Con
cenr
atio
n of
dye
inje
cted
(mg/
L bl
ood)
FIGURE 5-19
To avoid error due to recircula-tion of dye, the downslope of the area under the curve is mathematically extrapolated
Conservation of Mass – System outputmust equal system input plus or minus anychange that occurred within the system
Oxygen = Indicator
In = Pulm artery O2 + Entrained O2
Out = Pulm vein O2
Entrained O2 = Vo2Oxygen
Q × Cpa o2 + Vo2 in = Q × C pv o2 out
Cpa o2 ≈ C right atrium 02
Cpv o2 ≈ C arterial 02
Q in Q out
CpvO2CpaO2
V.
FIGURE 5-20
Fick method for determination of cardiac output by using oxygen as the physiologic indicator
114 F.A. MAFFEI
plus the entrained oxygen from the lungs which is equal to oxygen consumed by the body’s metabolism (VO 2 ). Since oxygen is added across the pulmonary circuit, the entrained oxy-gen is added to the input. The “out” is equal to the pulmonary blood fl ow (Q pul ) multiplied by the pulmonary vein content of oxygen (C pv O 2 ). Since the output must equal the input plus or minus any change that occurred within the system, the equation can be described mathe-matically as:
Systemic blood fl ow (Q syst ) can be similarly calculated. The “in” for the systemic circuit is the systemic blood fl ow (Q syst ) multiplied by the oxygen content of the aorta (C Ao O 2 ) minus the oxygen consumed by the body’s metabolism (VO 2 ). Since oxygen is consumed across the systemic bed, the oxygen consumption is subtracted from the input. Mathematically, the “in” and “out” of the systemic bed can be described with the following equation:
C Ao O 2 = Aortic O2 content (can also use distal artery) C pa O 2 = pulmonary artery O2 content (can also use right atrial-superior cava junction sample).
If the PA is unable to be sampled, blood from the superior portion of the RA can be used. Sampling from the inferior RA should be avoided as it may result in a lower oxygen content due to the infl ow of poorly saturated coronary venous blood. During shock states, sampling in the low portion of the RA may result in lower saturations than a true mixed venous satura-tion due to the infl ow of poorly saturated IVC blood (see below discussion on mixed venous and central venous saturations).
Assuming no intracardiac shunt, blood fl ow through the lungs is virtually equal to that through the body, that is Q pul = Q syst = cardiac output.
If an intracardiac shunt is present, the magnitude of the shunt can be calculated as Q pul /Q syst.
By convention, the intracardiac shunt fraction can be expressed as follows after canceling VO 2 , cross multiplying, and substituting oxygen saturation for oxygen content.
The clinical importance of a left to right (L to R) shunt must be interpreted in the context of the child’s underlying anatomy and physiology. Calculation of Q pul /Q syst may identify an otherwise unappreciated L to R lesion (i.e. PDA, major aortopulmonary collateral arteries). Alternatively, the presence of an unexpected shunt following congenital heart disease
pul pa 2 2 pul pv 2[Q (C O )] VO Q (C O )+ =
2pul pul
pv 2 pa 2
VOSolving for Q : Q
C O C O=
−
syst Ao 2 2 syst pa 2[Q (C O )] VO Q (C O )− =
2syst syst
Ao 2 pa 2
VOSolving for Q : Q
C O C O=
−
2
Ao 2 ra 2
VOCO
C O C O=
−
2pul
pv 2 pa 2
2syst
Ao 2 pa 2
VOQ
C O C O
VOQ
C O C O
=−
=−
Ao rapul syst
pv or la pa
Sat SatQ / Q
Sat Sat
−=
−
115 C HAPTER 5 • ASS ESS M ENT OF CAR DIOVASC U LAR FU NCTION
surgery may refl ect a residual lesion that requires repair (i.e. patch leak across a repaired VSD). The degree of a surgically placed left to right shunt (i.e. modifi ed Blalock -Taussig shunt) can also be quantifi ed. A Q pul /Q syst > 1 is indicative of some degree of L to R shunting. Generally, a Q pul /Q syst of > 2/1 is considered clinically signifi cant.
Measurement of cardiac output by Fick method requires independent measurement of oxy-gen consumption (indirect calorimetry) or assumption of oxygen consumption by application of normal standards. The latter is not accurate since oxygen consumption varies greatly with criti-cal illness. Conversely, one can estimate oxygen consumption using the Fick equations if car-diac output is measured independently. The classic bedside approach used in many of the early studies of shock states in critically ill children utilized a pulmonary artery catheter to measure cardiac output by thermodilution and CaO2-CmvO2 to calculate oxygen consumption.
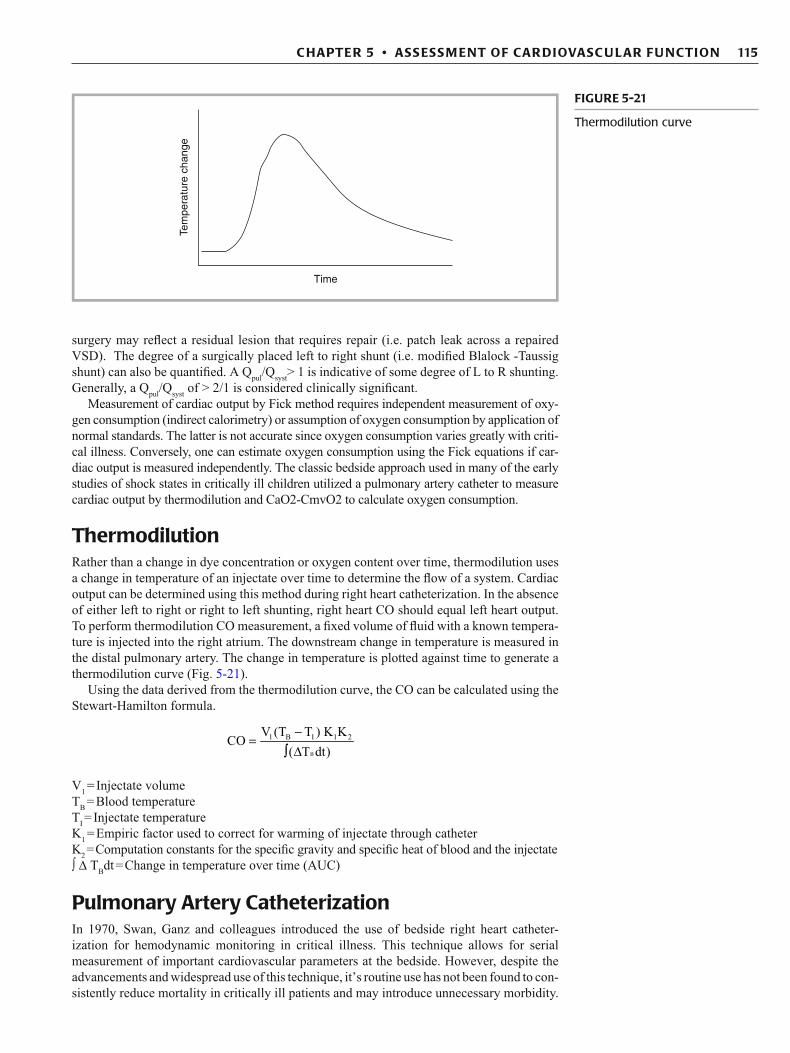
Thermodilution Rather than a change in dye concentration or oxygen content over time, thermodilution uses a change in temperature of an injectate over time to determine the fl ow of a system. Cardiac output can be determined using this method during right heart catheterization. In the absence of either left to right or right to left shunting, right heart CO should equal left heart output. To perform thermodilution CO measurement, a fi xed volume of fl uid with a known tempera-ture is injected into the right atrium. The downstream change in temperature is measured in the distal pulmonary artery. The change in temperature is plotted against time to generate a thermodilution curve (Fig. 5-21 ).
Using the data derived from the thermodilution curve, the CO can be calculated using the Stewart-Hamilton formula.
V 1 = Injectate volume T B = Blood temperature T I = Injectate temperature K 1 = Empiric factor used to correct for warming of injectate through catheter K 2 = Computation constants for the specifi c gravity and specifi c heat of blood and the injectate ∫ D T B dt = Change in temperature over time (AUC)
Pulmonary Artery Catheterization In 1970, Swan, Ganz and colleagues introduced the use of bedside right heart catheter-ization for hemodynamic monitoring in critical illness. This technique allows for serial measurement of important cardiovascular parameters at the bedside. However, despite the advancements and widespread use of this technique, it’s routine use has not been found to con-sistently reduce mortality in critically ill patients and may introduce unnecessary morbidity.
B
1 B I 1 2V (T T ) K KCO
( T dt)
-Ú
=Δ
Time
Tem
pera
ture
cha
nge
FIGURE 5-21
Thermodilution curve
116 F.A. MAFFEI
A pulmonary artery catheter should only be placed if a specifi c question regarding the hemo-dynamic status of a patient cannot be satisfactorily answered by using standard hemody-namic tools (examination, waveform analysis, echocardiography, biochemical markers) and if the answer could impact therapy. In all cases, a careful risk versus benefi t assessment is necessary prior to placement. When used appropriately, pulmonary artery catheters can be clinically useful allowing for: the measurement of the CO, detection of shunts, monitoring of intracardiac pressures, and the determination of other important hemodynamic parameters.
Cardiac Output Determination Using Pulmonary Artery Catheterization
As previously noted, PA catheterization utilizes thermodilution to determine CO. Although right ventricular output is only measured, in the absence an intracardiac shunt, the right heart CO should equal the left heart output. To perform thermodilution CO measurement, a fi xed volume of fl uid with a known temperature is injected into the RA via the proximal port of the pulmonary artery catheter. The downstream change in temperature is measured in the pulmonary artery by a thermistor located at the distal end of the catheter. After a thermodilu-tion curve is generated, CO can be determined using the Stewart-Hamilton formula.
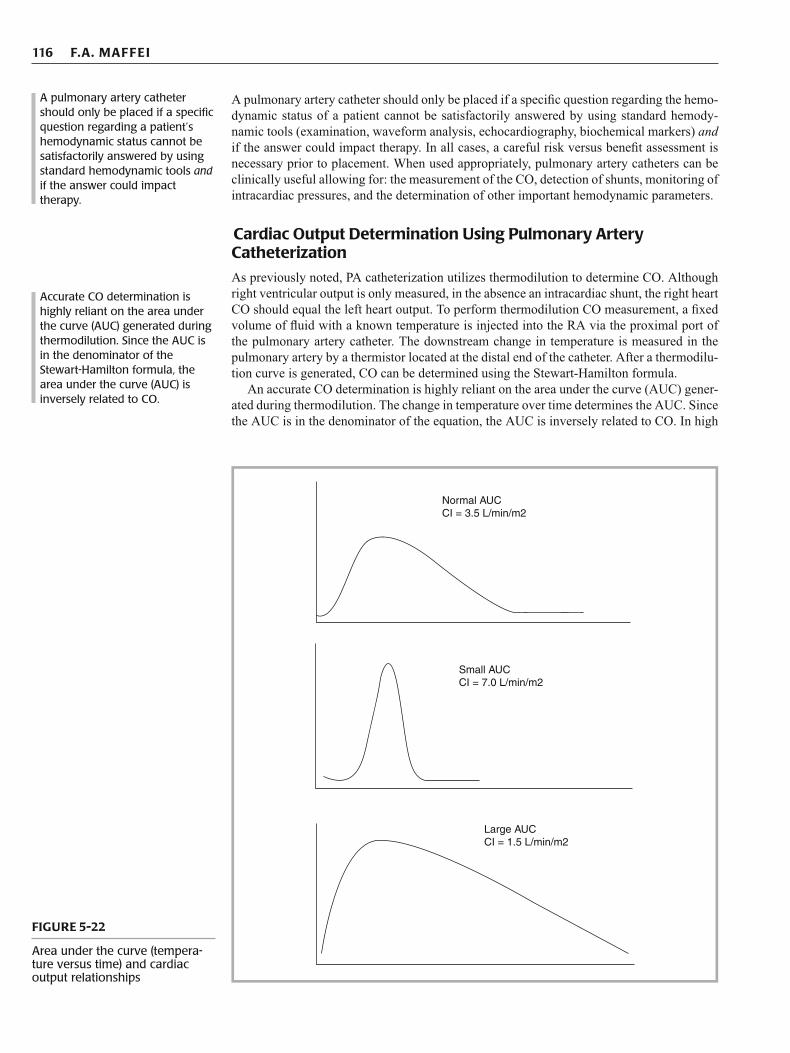
An accurate CO determination is highly reliant on the area under the curve (AUC) gener-ated during thermodilution. The change in temperature over time determines the AUC. Since the AUC is in the denominator of the equation, the AUC is inversely related to CO. In high
A pulmonary artery catheter should only be placed if a specifi c question regarding a patient’s hemodynamic status cannot be satisfactorily answered by using standard hemodynamic tools and if the answer could impact therapy.
Accurate CO determination is highly reliant on the area under the curve (AUC) generated during thermodilution. Since the AUC is in the denominator of the Stewart-Hamilton formula, the area under the curve (AUC) is inversely related to CO.
Normal AUCCI = 3.5 L/min/m2
Small AUCCI = 7.0 L/min/m2
Large AUCCI = 1.5 L/min/m2
FIGURE 5-22
Area under the curve (tempera-ture versus time) and cardiac output relationships
117 C HAPTER 5 • ASS ESS M ENT OF CAR DIOVASC U LAR FU NCTION
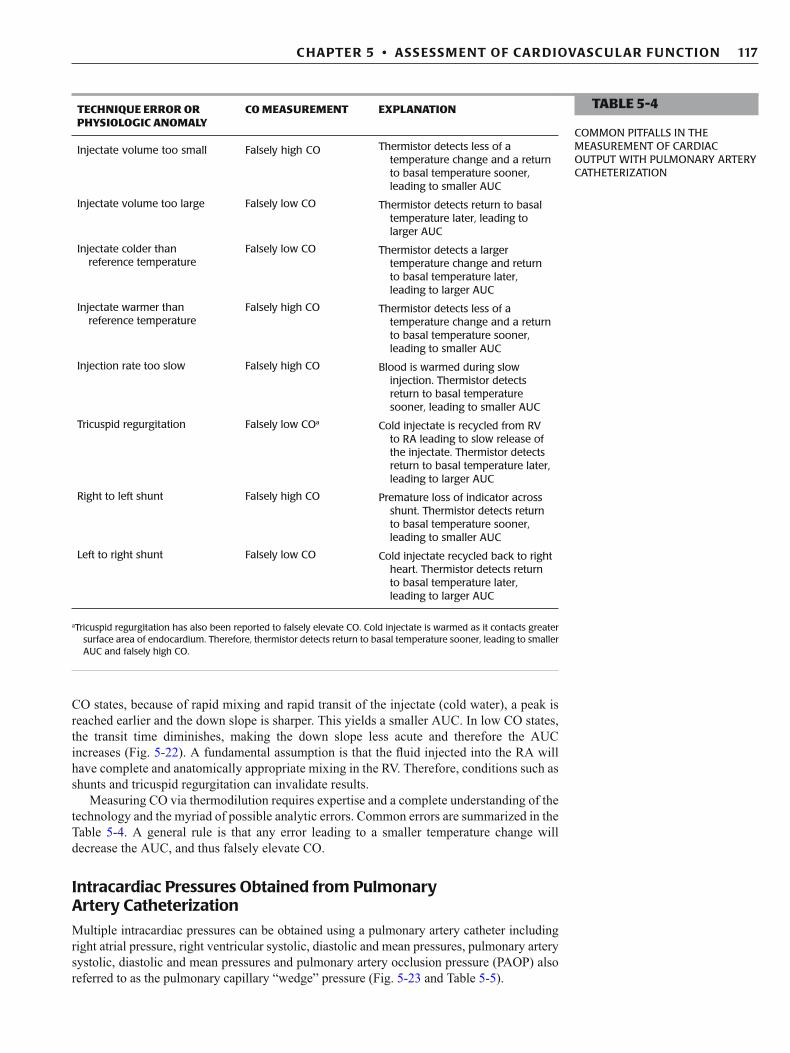
CO states, because of rapid mixing and rapid transit of the injectate (cold water), a peak is reached earlier and the down slope is sharper. This yields a smaller AUC. In low CO states, the transit time diminishes, making the down slope less acute and therefore the AUC increases (Fig. 5-22 ). A fundamental assumption is that the fl uid injected into the RA will have complete and anatomically appropriate mixing in the RV. Therefore, conditions such as shunts and tricuspid regurgitation can invalidate results.
Measuring CO via thermodilution requires expertise and a complete understanding of the technology and the myriad of possible analytic errors. Common errors are summarized in the Table 5-4 . A general rule is that any error leading to a smaller temperature change will decrease the AUC, and thus falsely elevate CO.
Intracardiac Pressures Obtained from Pulmonary Artery Catheterization
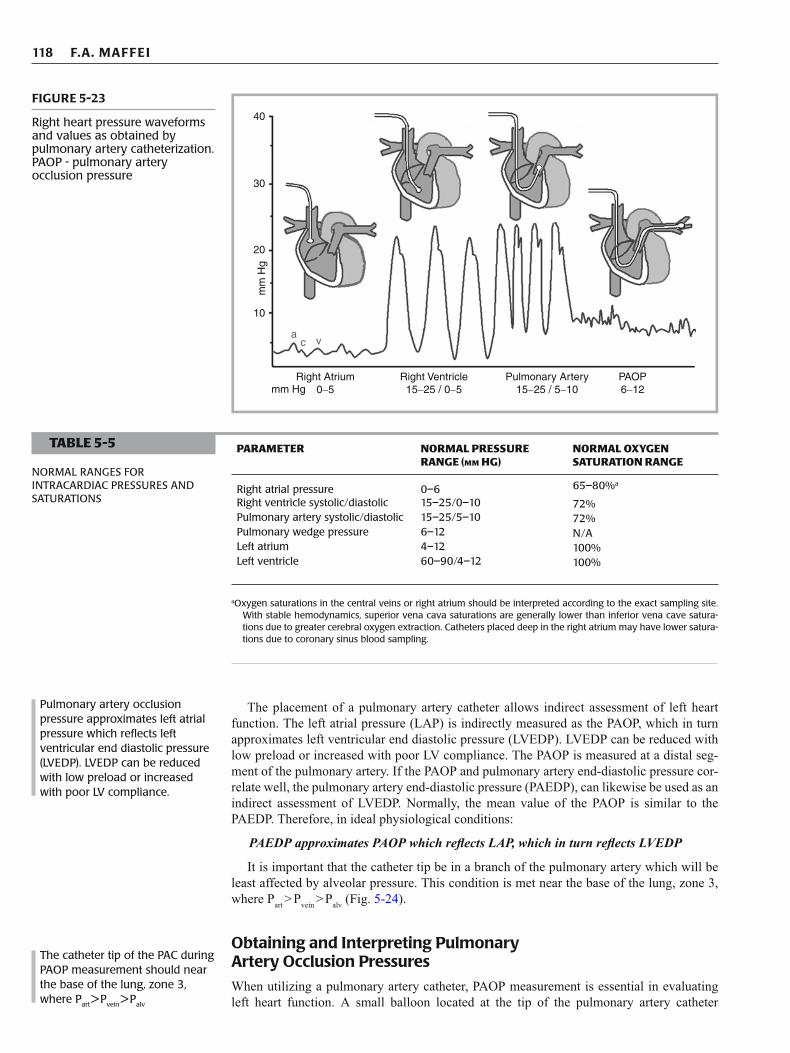
Multiple intracardiac pressures can be obtained using a pulmonary artery catheter including right atrial pressure, right ventricular systolic, diastolic and mean pressures, pulmonary artery systolic, diastolic and mean pressures and pulmonary artery occlusion pressure (PAOP) also referred to as the pulmonary capillary “wedge” pressure (Fig. 5-23 and Table 5-5 ).
TECHNIQUE ERROR OR PHYSIOLOGIC ANOMALY
CO MEASUREMENT EXPLANATION
Injectate volume too small Falsely high CO Thermistor detects less of a temperature change and a return to basal temperature sooner, leading to smaller AUC
Injectate volume too large Falsely low CO Thermistor detects return to basal temperature later, leading to larger AUC
Injectate colder than reference temperature
Falsely low CO Thermistor detects a larger temperature change and return to basal temperature later, leading to larger AUC
Injectate warmer than reference temperature
Falsely high CO Thermistor detects less of a temperature change and a return to basal temperature sooner, leading to smaller AUC
Injection rate too slow Falsely high CO Blood is warmed during slow injection. Thermistor detects return to basal temperature sooner, leading to smaller AUC
Tricuspid regurgitation Falsely low CO a Cold injectate is recycled from RV to RA leading to slow release of the injectate. Thermistor detects return to basal temperature later, leading to larger AUC
Right to left shunt Falsely high CO Premature loss of indicator across shunt. Thermistor detects return to basal temperature sooner, leading to smaller AUC
Left to right shunt Falsely low CO Cold injectate recycled back to right heart. Thermistor detects return to basal temperature later, leading to larger AUC
TABLE 5-4
COMMON PITFALLS IN THE MEASUREMENT OF CARDIAC OUTPUT WITH PULMONARY ARTERY CATHETERIZATION
a Tricuspid regurgitation has also been reported to falsely elevate CO. Cold injectate is warmed as it contacts greater surface area of endocardium. Therefore, thermistor detects return to basal temperature sooner, leading to smaller AUC and falsely high CO.
118 F.A. MAFFEI
40
30
20m
m H
g
10
ac v
Right Atrium0-5mm Hg
Right Ventricle15-25 / 0-5
Pulmonary Artery15-25 / 5-10
PAOP6-12
FIGURE 5-23
Right heart pressure waveforms and values as obtained by pulmonary artery catheterization. PAOP - pulmonary artery occlusion pressure
Pulmonary artery occlusion pressure approximates left atrial pressure which refl ects left ventricular end diastolic pressure (LVEDP). LVEDP can be reduced with low preload or increased with poor LV compliance.
TABLE 5-5
NORMAL RANGES FOR INTRACARDIAC PRESSURES AND SATURATIONS
PARAMETER NORMAL PRESSURE RANGE (MM HG)
NORMAL OXYGEN SATURATION RANGE
Right atrial pressure 0–6 65–80% a
Right ventricle systolic/diastolic 15–25/0–10 72% Pulmonary artery systolic/diastolic 15–25/5–10 72% Pulmonary wedge pressure 6–12 N/A Left atrium 4–12 100% Left ventricle 60–90/4–12 100%
a Oxygen saturations in the central veins or right atrium should be interpreted according to the exact sampling site. With stable hemodynamics, superior vena cava saturations are generally lower than inferior vena cave satura-tions due to greater cerebral oxygen extraction. Catheters placed deep in the right atrium may have lower satura-tions due to coronary sinus blood sampling.
The placement of a pulmonary artery catheter allows indirect assessment of left heart function. The left atrial pressure (LAP) is indirectly measured as the PAOP, which in turn approximates left ventricular end diastolic pressure (LVEDP). LVEDP can be reduced with low preload or increased with poor LV compliance. The PAOP is measured at a distal seg-ment of the pulmonary artery. If the PAOP and pulmonary artery end-diastolic pressure cor-relate well, the pulmonary artery end-diastolic pressure (PAEDP), can likewise be used as an indirect assessment of LVEDP. Normally, the mean value of the PAOP is similar to the PAEDP. Therefore, in ideal physiological conditions:
PAEDP approximates PAOP which refl ects LAP, which in turn refl ects LVEDP
It is important that the catheter tip be in a branch of the pulmonary artery which will be least affected by alveolar pressure. This condition is met near the base of the lung, zone 3, where P art > P vein > P alv (Fig. 5-24 ).
Obtaining and Interpreting Pulmonary Artery Occlusion Pressures
When utilizing a pulmonary artery catheter, PAOP measurement is essential in evaluating left heart function. A small balloon located at the tip of the pulmonary artery catheter
The catheter tip of the PAC during PAOP measurement should near the base of the lung, zone 3, where P art > P vein > P alv

119 C HAPTER 5 • ASS ESS M ENT OF CAR DIOVASC U LAR FU NCTION
facilitates the measurement of PAOP. The balloon is infl ated and “fl oated” into a distal branch of the pulmonary artery where it becomes “wedged”. With the balloon infl ated, fl ow in the distal segment of the pulmonary artery is occluded creating a continuous uninterrupted column of blood from the tip of the pulmonary artery catheter to the left atrium. Once wedged, the waveform changes from a pulmonary artery waveform to an atrial waveform with characteristic a and v waves. Once the PAOP measurement is obtained, the balloon should be defl ated to avoid distal pulmonary artery injury.
A normal PAOP is 6–12 mm Hg. An abnormally high or low PAOP values should be assessed in the context of myocardial performance which is best refl ected by the stroke volume index (SVI). An elevated PAOP (>18 mm Hg) and decreased SVI refl ect poor LV compliance. Conditions such as congestive heart failure, myocardial infarction, cardiac tamponade, and cardiomyopathy are associated with a high PAOP and low SVI. In these circumstances, titrat-ing fl uid management to PAOP can help avoid worsening of cardiogenic pulmonary edema. Since echocardiography cannot reliably estimate LVEDP, serial PAOP measurements may aid in minimizing the risk of driving pulmonary venous pressures too high with injudicious fl uid administration. A low PAOP <6 mm Hg and decreased SVI are consistent with decreased LV preload that may occur in conditions such as dehydration, hemorrhage, and loss of effective circulating volume (e.g. third spacing of vascular fl uid from capillary leak).
The interpretation of PAOP and its relationship to LVEDP requires an appreciation of possible coexisting pathologies and technical limitations (Table 5-6 ). Valvular disease, in particular, affects the ability of PAOP to accurately refl ect LVEDP. PAOP will overestimate the LVEDP in mitral valve disease such as mitral stenosis. The high LAP (and therefore, PAOP) associated with mitral stenosis does not refl ect the lusitropic state of the LV. The PAOP may at times not be refl ective of the true LVEDP during states of increased pulmonary vascular resistance as the fl uid column transmits the high pressure in the vascular bed, and
RA
RV
PA
Lung
Zone 3
LV
PV
Zone 2
Zone 1
PA > Pa > Pv
Pa > PA > Pv
Pa > Pv > PA
FIGURE 5-24
West zones and the relationship alveolar, pulmonary artery and pulmonary vein pres-sures: Zone 1 – P alv > P art > P vein , Zone 2 – P art > P alv > P vein, and Zone 3 – P art > P vein > P alv . The PAC should ideally wedge into a branch of the pulmonary vasculature contributing to west zone 3 of the lung. Because this zone does not contain collapsing vasculature, the stag-nate column of blood distal to the balloon uninterruptedly courses through the lung to emerge in the pulmonary vein. This forms a column of blood from the pulmonary veins (where fl ow from collaterals is still occurring) back through the lungs and up through the PAC to the transducer. Although right-sided valvular disease and pulmonary arterial dis-ease are bypassed by the PAC, pulmonary venous disease and mitral valve disease may still disrupt the ability to measure left ventricular end-diastolic pressure which, itself, is only a surrogate for left ventricular end-diastolic volume. PA—alveolar pressure; Pa—arteriolar pressure; PA—pulmonary artery; PV—venous pressure; PV—pulmonary vein; LA—left atrium; LV—left ventricle; RA—right atrium; RV—right ventricle
Abnormal PAOP values should be assessed concomitantly with stroke volume index (SVI). An elevated PAOP (>18 mm Hg) and low SVI is consistent with poor LV compliance. A low PAOP < 6 mm Hg in the context of a low SVI is consistent with decreased LV preload.
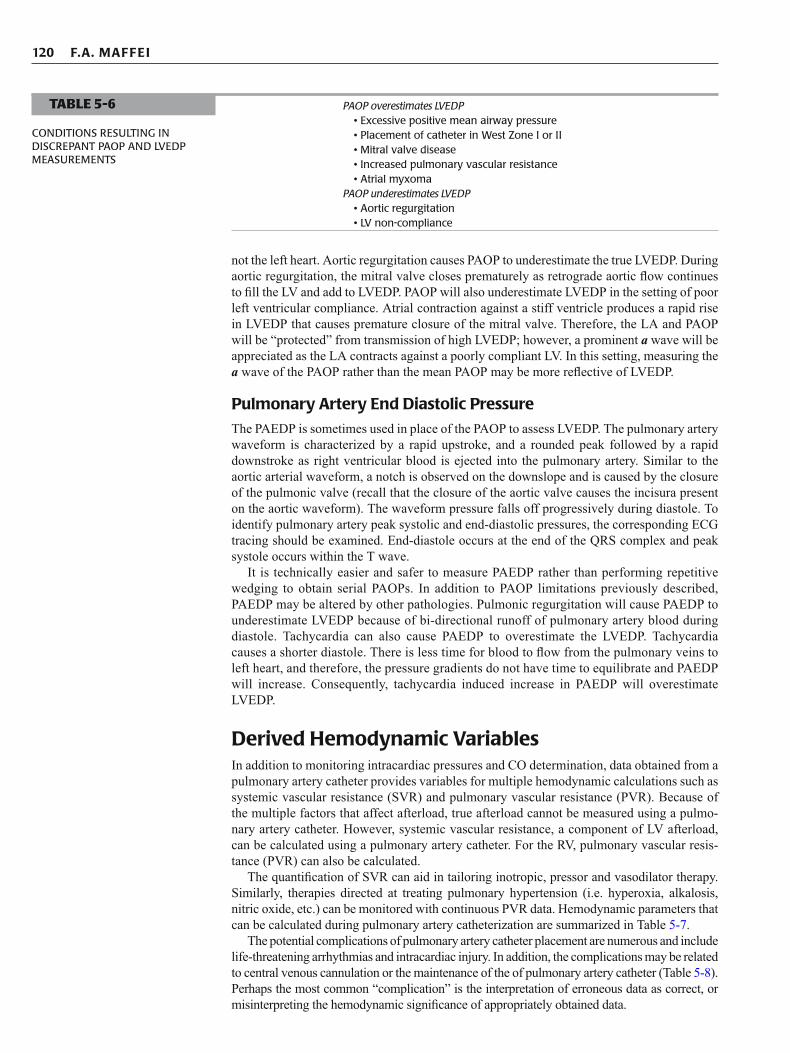
120 F.A. MAFFEI
not the left heart. Aortic regurgitation causes PAOP to underestimate the true LVEDP. During aortic regurgitation, the mitral valve closes prematurely as retrograde aortic fl ow continues to fi ll the LV and add to LVEDP. PAOP will also underestimate LVEDP in the setting of poor left ventricular compliance. Atrial contraction against a stiff ventricle produces a rapid rise in LVEDP that causes premature closure of the mitral valve. Therefore, the LA and PAOP will be “protected” from transmission of high LVEDP; however, a prominent a wave will be appreciated as the LA contracts against a poorly compliant LV. In this setting, measuring the a wave of the PAOP rather than the mean PAOP may be more refl ective of LVEDP.
Pulmonary Artery End Diastolic Pressure
The PAEDP is sometimes used in place of the PAOP to assess LVEDP. The pulmonary artery waveform is characterized by a rapid upstroke, and a rounded peak followed by a rapid downstroke as right ventricular blood is ejected into the pulmonary artery. Similar to the aortic arterial waveform, a notch is observed on the downslope and is caused by the closure of the pulmonic valve (recall that the closure of the aortic valve causes the incisura present on the aortic waveform). The waveform pressure falls off progressively during diastole. To identify pulmonary artery peak systolic and end-diastolic pressures, the corresponding ECG tracing should be examined. End-diastole occurs at the end of the QRS complex and peak systole occurs within the T wave.
It is technically easier and safer to measure PAEDP rather than performing repetitive wedging to obtain serial PAOPs. In addition to PAOP limitations previously described, PAEDP may be altered by other pathologies. Pulmonic regurgitation will cause PAEDP to underestimate LVEDP because of bi-directional runoff of pulmonary artery blood during diastole. Tachycardia can also cause PAEDP to overestimate the LVEDP. Tachycardia causes a shorter diastole. There is less time for blood to fl ow from the pulmonary veins to left heart, and therefore, the pressure gradients do not have time to equilibrate and PAEDP will increase. Consequently, tachycardia induced increase in PAEDP will overestimate LVEDP.
Derived Hemodynamic Variables In addition to monitoring intracardiac pressures and CO determination, data obtained from a pulmonary artery catheter provides variables for multiple hemodynamic calculations such as systemic vascular resistance (SVR) and pulmonary vascular resistance (PVR). Because of the multiple factors that affect afterload, true afterload cannot be measured using a pulmo-nary artery catheter. However, systemic vascular resistance, a component of LV afterload, can be calculated using a pulmonary artery catheter. For the RV, pulmonary vascular resis-tance (PVR) can also be calculated.
The quantifi cation of SVR can aid in tailoring inotropic, pressor and vasodilator therapy. Similarly, therapies directed at treating pulmonary hypertension (i.e. hyperoxia, alkalosis, nitric oxide, etc.) can be monitored with continuous PVR data. Hemodynamic parameters that can be calculated during pulmonary artery catheterization are summarized in Table 5-7 .
The potential complications of pulmonary artery catheter placement are numerous and include life-threatening arrhythmias and intracardiac injury. In addition, the complications may be related to central venous cannulation or the maintenance of the of pulmonary artery catheter (Table 5-8 ). Perhaps the most common “complication” is the interpretation of erroneous data as correct, or misinterpreting the hemodynamic signifi cance of appropriately obtained data.
PAOP overestimates LVEDP • Excessive positive mean airway pressure • Placement of catheter in West Zone I or II • Mitral valve disease • Increased pulmonary vascular resistance • Atrial myxoma PAOP underestimates LVEDP • Aortic regurgitation • LV non-compliance
TABLE 5-6
CONDITIONS RESULTING IN DISCREPANT PAOP AND LVEDP MEASUREMENTS
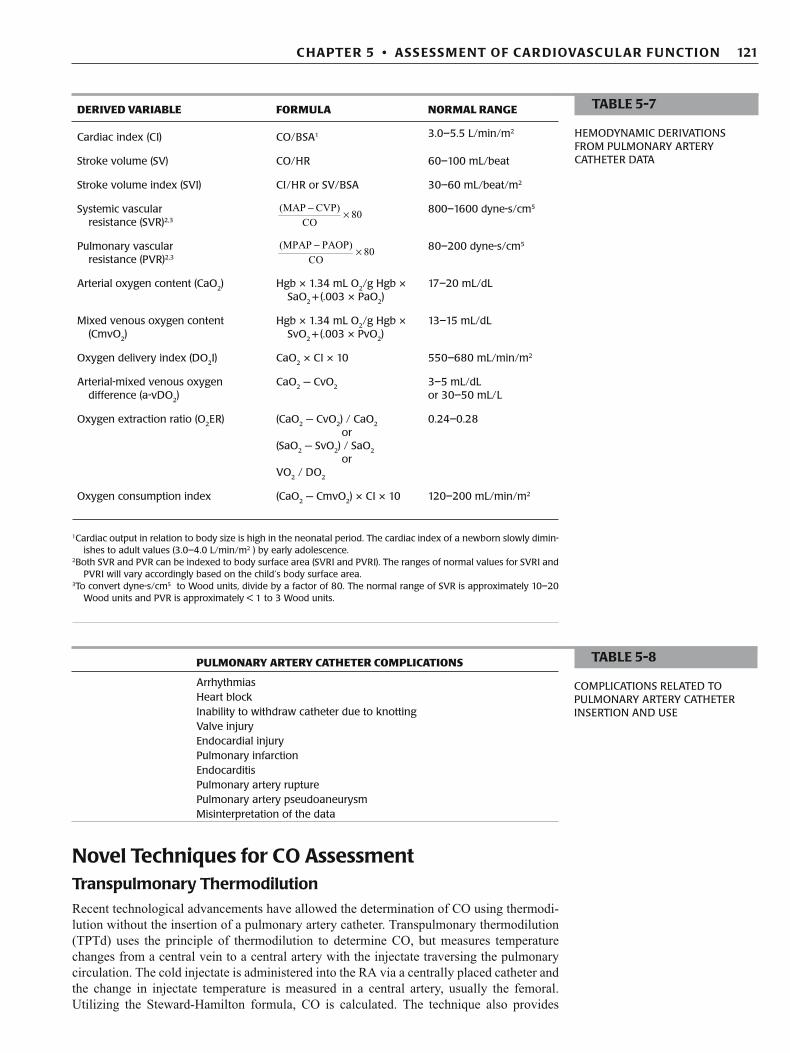
121 C HAPTER 5 • ASS ESS M ENT OF CAR DIOVASC U LAR FU NCTION
Novel Techniques for CO Assessment Transpulmonary Thermodilution
Recent technological advancements have allowed the determination of CO using thermodi-lution without the insertion of a pulmonary artery catheter. Transpulmonary thermodilution (TPTd) uses the principle of thermodilution to determine CO, but measures temperature changes from a central vein to a central artery with the injectate traversing the pulmonary circulation. The cold injectate is administered into the RA via a centrally placed catheter and the change in injectate temperature is measured in a central artery, usually the femoral. Utilizing the Steward-Hamilton formula, CO is calculated. The technique also provides
TABLE 5-7
HEMODYNAMIC DERIVATIONS FROM PULMONARY ARTERY CATHETER DATA
DERIVED VARIABLE FORMULA NORMAL RANGE
Cardiac index (CI) CO/BSA 1 3.0–5.5 L/min/m 2
Stroke volume (SV) CO/HR 60–100 mL/beat
Stroke volume index (SVI) CI/HR or SV/BSA 30–60 mL/beat/m 2
Systemic vascular resistance (SVR)2,3
(MAP CVP)
80CO
− ×
800–1600 dyne-s/cm 5
Pulmonary vascular resistance (PVR)2,3
(MPAP PAOP)
80CO
− ×
80–200 dyne-s/cm 5
Arterial oxygen content (CaO 2 ) Hgb × 1.34 mL O 2 /g Hgb × SaO 2 + (.003 × PaO 2 )
17–20 mL/dL
Mixed venous oxygen content (CmvO 2 )
Hgb × 1.34 mL O 2 /g Hgb × SvO 2 + (.003 × PvO 2 )
13–15 mL/dL
Oxygen delivery index (DO 2 I) CaO 2 × CI × 10 550–680 mL/min/m 2
Arterial-mixed venous oxygen difference (a-vDO 2 )
CaO 2 − CvO 2 3–5 mL/dL or 30–50 mL/L
Oxygen extraction ratio (O 2 ER) (CaO 2 − CvO 2 ) / CaO 2 0.24–0.28 or
(SaO 2 − SvO 2 ) / SaO 2 or
VO 2 / DO 2
Oxygen consumption index (CaO 2 − CmvO 2 ) × CI × 10 120–200 mL/min/m 2
1Cardiac output in relation to body size is high in the neonatal period. The cardiac index of a newborn slowly dimin-ishes to adult values (3.0–4.0 L/min/m2 ) by early adolescence.
2Both SVR and PVR can be indexed to body surface area (SVRI and PVRI). The ranges of normal values for SVRI and PVRI will vary accordingly based on the child’s body surface area.
3To convert dyne-s/cm5 to Wood units, divide by a factor of 80. The normal range of SVR is approximately 10–20 Wood units and PVR is approximately < 1 to 3 Wood units.
PULMONARY ARTERY CATHETER COMPLICATIONS
Arrhythmias Heart block Inability to withdraw catheter due to knotting Valve injury Endocardial injury Pulmonary infarction Endocarditis Pulmonary artery rupture Pulmonary artery pseudoaneurysm Misinterpretation of the data
TABLE 5-8
COMPLICATIONS RELATED TO PULMONARY ARTERY CATHETER INSERTION AND USE
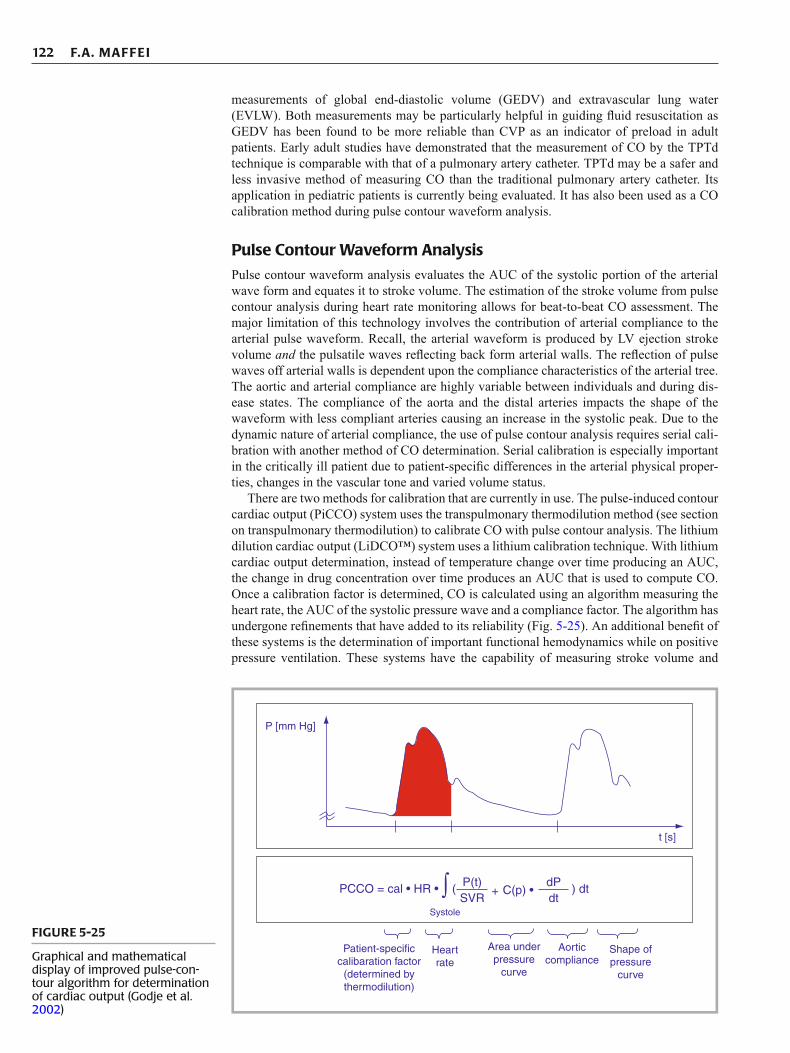
122 F.A. MAFFEI
measurements of global end-diastolic volume (GEDV) and extravascular lung water (EVLW). Both measurements may be particularly helpful in guiding fl uid resuscitation as GEDV has been found to be more reliable than CVP as an indicator of preload in adult patients. Early adult studies have demonstrated that the measurement of CO by the TPTd technique is comparable with that of a pulmonary artery catheter. TPTd may be a safer and less invasive method of measuring CO than the traditional pulmonary artery catheter. Its application in pediatric patients is currently being evaluated. It has also been used as a CO calibration method during pulse contour waveform analysis.
Pulse Contour Waveform Analysis
Pulse contour waveform analysis evaluates the AUC of the systolic portion of the arterial wave form and equates it to stroke volume. The estimation of the stroke volume from pulse contour analysis during heart rate monitoring allows for beat-to-beat CO assessment. The major limitation of this technology involves the contribution of arterial compliance to the arterial pulse waveform. Recall, the arterial waveform is produced by LV ejection stroke volume and the pulsatile waves refl ecting back form arterial walls. The refl ection of pulse waves off arterial walls is dependent upon the compliance characteristics of the arterial tree. The aortic and arterial compliance are highly variable between individuals and during dis-ease states. The compliance of the aorta and the distal arteries impacts the shape of the waveform with less compliant arteries causing an increase in the systolic peak. Due to the dynamic nature of arterial compliance, the use of pulse contour analysis requires serial cali-bration with another method of CO determination. Serial calibration is especially important in the critically ill patient due to patient-specifi c differences in the arterial physical proper-ties, changes in the vascular tone and varied volume status.
There are two methods for calibration that are currently in use. The pulse-induced contour cardiac output (PiCCO) system uses the transpulmonary thermodilution method (see section on transpulmonary thermodilution) to calibrate CO with pulse contour analysis. The lithium dilution cardiac output (LiDCO™) system uses a lithium calibration technique. With lithium cardiac output determination, instead of temperature change over time producing an AUC, the change in drug concentration over time produces an AUC that is used to compute CO. Once a calibration factor is determined, CO is calculated using an algorithm measuring the heart rate, the AUC of the systolic pressure wave and a compliance factor. The algorithm has undergone refi nements that have added to its reliability (Fig. 5-25 ). An additional benefi t of these systems is the determination of important functional hemodynamics while on positive pressure ventilation. These systems have the capability of measuring stroke volume and
P [mm Hg]
t [s]
Patient-specificcalibaration factor
(determined bythermodilution)
Heartrate
Area underpressure
curve
Shape ofpressure
curve
Aorticcompliance
PCCO = cal • HR • ∫ ( P(t)SVR
dPdt
+ C(p) •
Systole
) dt
FIGURE 5-25
Graphical and mathematical display of improved pulse-con-tour algorithm for determination of cardiac output (Godje et al. 2002 )
123 C HAPTER 5 • ASS ESS M ENT OF CAR DIOVASC U LAR FU NCTION
pulse pressure variation; both of which have been found to accurately refl ect preload respon-siveness in patients with cardiac dysfunction and sepsis.
Other systems (Flow Trac, Vigileo) do not use a second method of CO determination for calibration. In contrast to the PiCCO and LiDCO, these systems use the patient’s demo-graphic and physical characteristics (age, height, gender, and weight) to estimate predicted SV. Currently, both the calibrated and non-calibrated systems are undergoing validation studies on their ability to estimate CO compared to the traditional pulmonary artery catheter in different clinical conditions.
Transesophageal Doppler Echocardiography
Cardiac echocardiography is a proven tool in the evaluation of cardiac anatomy and function in critically ill children. Transesophageal doppler echocardiography (TDE) measures aortic fl ow velocity via a carefully positioned doppler probe. Cardiac output can then be calculated by the product of the aortic velocity time integral (VTI), the cross sectional area (CSA) of the aorta and the heart rate: CO = Aortic CSA cm2 ¥ VTI ¥ heart rate. These measurements require optimal positioning of the probe and precise timing during systole when fl ow is mea-sured. The technique requires specialized training and equipment. Although studies in chil-dren have found good correlation between TDE and thermodilution, the technique is highly dependent upon proper positioning of the probe with overestimation and underestimation of CO not uncommon. In addition, the value of TDE may be limited in clinical practice due to the need for precise probe placement, the lack of continuous data, the need for sedation dur-ing probe placement and operator variability.
MIXED VENOUS SATURATION, CENTRAL VENOUS SATURATION, LACTATE AND BRAIN NATRIURETIC PEPTIDE AS MARKERS OF CARDIOVASCULAR FUNCTION
Mixed Venous and Central Venous Saturation
At rest, the body normally extracts only 25% of the total amount of oxygen delivered. In a healthy steady state, DO 2 is luxurious when compared to oxygen demands with approximately 75% of the oxygen delivered remaining unused. Oxygen extraction varies across organ beds with some organs being high extractors (i.e. brain and myocardium) and other organs being low extractors (i.e. skin and kidneys). A true mixed venous saturation (SmvO 2 ) allows for a global assessment of the body’s oxygen extraction. The measurement must occur after venous return from all organ beds is “mixed” to avoid having the SmvO 2 be refl ective of a single organ’s bed oxygen extraction. Using a pulmonary artery catheter, the SmvO 2 is obtained in the pulmonary artery. Without a pulmonary artery catheter in place, the pulmonary artery SmvO 2 can be closely approximated by sampling venous blood from a central catheter with its tip at the SVC – RA junction. When a venous blood saturation is determined from the SVC-RA junction or other central site it is referred to as a central venous saturation (ScvO 2 ) or right atrial saturation. The normal oxygen saturation of central venous blood returning to the right heart (ScvO 2 ) is between 65% and 80%. Central venous oxygen saturation values below 60% indicate increased oxygen extraction by the tissues. This may be due to either a decrease in oxygen delivery or an increase in tissue oxygen demands. Common causes of decreased oxygen delivery include reduced cardiac output, anemia, and/or low arterial oxy-gen saturation (hypoxia). Alternatively, a low ScvO 2 may be refl ective of increased tissue oxygen demands in the setting of increased work of breathing, fever, seizures, shivering, pain, physical activity or catheter migration to the coronary sinus. Low ScvO 2 values below 60% are often accompanied by acidosis due to a shift to anaerobic metabolism (see lactate below). A normal or high ScvO 2 may also be associated with tissue hypoxia. An elevated ScvO 2 may occur with appropriate or even supranormal DO 2 in the setting of impaired cellular and or mitochondrial oxygen uptake. This may lead to cellular hypoxia and may be observed in the setting of severe vasodilatory sepsis or mitochondrial poisoning (i.e. cyanide toxicity).
Pulse contour waveform analysis evaluates the AUC of the systolic portion of the arterial wave form and equates it to stroke volume. The estimation of the stroke volume from pulse contour analysis during heart rate monitoring allows for beat-to-beat CO assessment. The compliance of the arterial tree must be considered when using pulse contour analysis.
Due to the dynamic nature of arterial compliance, the use of pulse contour analysis requires serial calibration with another method of CO determination such as transpulmonary thermodilution.

124 F.A. MAFFEI
It is important to note, that although a good surrogate for SmvO 2 , ScvO 2 may vary based on catheter position, disease state and even age of the child. In the healthy state, the superior vena cava (SVC) has a slightly lower venous saturation than the inferior vena cava (IVC) in part due to high cerebral oxygen extraction and low renal oxygen extraction. This is espe-cially true in small children where the relatively large growing brain is a major oxygen extractor. Therefore, the SmvO 2 is greater than ScvO 2 by about 2-3%. The relationship between the SVC and IVC saturation may reverse in the setting of shock. (Figure 5-26 ). During cardiogenic or hypovolemic shock, mesenteric and renal blood fl ow decrease and oxygen extraction increases causing the IVC saturation to become lower than the SVC. Therefore, during certain shock states, the ScvO 2 may become greater than SmvO 2 . Despite these important differences, most authors believe that changes in ScvO 2 closely refl ect changes in SmvO 2 and therefore remains a good marker of tissue perfusion.
In summary, a decreased ScvO 2 is associated with decrements in cardiac output, hemoglo-bin concentration and arterial saturation and it varies inversely with oxygen consumption. It is an extremely useful marker for tissue hypoperfusion and can be followed serially to deter-mine the impact of therapeutic maneuvers such as fl uid resuscitation, blood transfusion and inotropic support (Table 5-9 ). Achievement of ScvO 2 ³ 70% is a therapeutic endpoint in the resuscitation from sepsis and septic shock as articulated in the Surviving Sepsis Campaign sponsored by the Society of Critical Care Medicine.
Lactate
Lactate metabolism is complex and its production is highly dependent upon physiological conditions at the cellular level. Although lactic acidosis is often used as a marker of cellular hypoxia, it may be elevated in non-hypoxemic environments. A biochemical review of lactate production is helpful in understanding hyperlactatemia during critical illness.
LOW SCVO 2 HIGH SCVO 2
• Anemia • High cardiac output states
• Low cardiac output states • Defect in oxygen extraction • Hypoxia • Decreased metabolic rate • Increased metabolic rate • Supranormal oxygen delivery
TABLE 5-9
TROUBLESHOOTING ABNORMALITIES IN MIXED OR CENTRAL VENOUS SATURATIONS
Low SvO 2 is associated with decreased cardiac output anemia, arterial desaturation or with states of high oxygen consump-tion. It is an extremely useful marker for tissue hypoperfusion and can be followed serially to determine the impact of thera-peutic maneuvers such as fl uid resuscitation, and inotropic support.
SVCSVC
74%ScvO2
64%
RARA
78%54%
IVCIVC
RVRV
76%60%
PAPA
CSCS40%
38%SmvO2
SmvO2
ScvO2
FIGURE 5-26
Relationship between central venous saturation (ScvO 2 ) and mixed venous saturation (SmvO 2 ) during health (left) and cardiogenic or hypovolemic shock (right). Normally, the SmvO 2 will be slightly higher than the ScvO 2 , whereas shock states may produce a reversal of this relationship. SVC -superior vena cava, IVC - inferior vena cava, RA - right atrium CS - coronary sinus, RV - right ventricle

125 C HAPTER 5 • ASS ESS M ENT OF CAR DIOVASC U LAR FU NCTION
Cellular respiration is the process by which glucose is utilized to produce cellular energy in the form of adenosine triphosphate (ATP) (Fig. 5-27 ). The cytosolic component of the process does not require oxygen and consists of glycolysis whereas the mitochondrial por-tion is highly dependent on oxygen and consists of the tricarboxylic acid (TCA) cycle (also known as citric acid cycle or Krebs cycle) and oxidative phosphorylation (also referred to as mitochondrial membrane electron transport). During glycolysis, glucose is converted to pyruvate with the net production of 2 molecules of ATP. The majority of energy production occurs in the mitochondria during the tricarboxylic acid cycle (2 ATP) and oxidative phos-phorylation (32 ATP). A small amount of lactate is normally produced during glycolysis, but it is rapidly metabolized by the liver and excreted by the kidney. Thus, normal serum lactate levels remain less than 2 mmol/L. Lactate production is increased dramatically during hypoxia. Due to low oxygen tension, pyruvate can no longer undergo aerobic metabolism in the mitochondria and is shunted toward lactate production. Hypoxia is also known to decrease the activity of pyruvate dehydrogenase which converts pyruvate to acetyl CoA. The contin-ued shunting of pyruvate towards lactate production results in an elevated serum lactate and an elevation in the lactate to pyruvate ratio (normal 10:1).
Lactic acidosis due to hypoperfusion has been traditionally referred to as type A lactic acidosis and is associated with an elevated lactate to pyruvate ratio. Elevated lactate in the setting of acidosis has been use as marker of tissue hypoperfusion and anaerobic metabolism. Multiple studies have correlated rising lactate levels and mortality in patients with a variety of critical illnesses. However, studies utilizing lactate as a resuscitation endpoint to improve sur-vival have been inconclusive. An explanation for the diffi culty in using lactate as a sole marker of successful resuscitation is that lactate production occurs due to non-hypoxemic stimuli.
Hyperlactatemia in critical illness is often not solely due to cellular hypoxia. Described as nonhypoxemic or type B lactic acidosis, elevations of serum lactate may occur during normal perfusion or after hypoperfusion has been corrected. Lactate production may be increased during states of “hyperglycolysis”. Excessive catecholamine states have been found to stimu-late glycolysis at a rate that exceeds the oxidative capacity of the mitochondria and lead to type b lactic acidosis. Increased skeletal muscle and hepatic glycolysis results in increases in bolth pyruvate and lactate production thus maintaining the lactate to pyruvate ratio. The resul-tant increased pyruvate is then metabolized to lactate at a much higher than normal rate. Hyperadrenergic states are common in the pediatric ICU and include exogenous administra-tion of catecholamines and disorders associated with a vigorous systemic infl ammatory response (e.g. acute lung injury, trauma, sepsis, burns). Type A or type B lactic acidosis may be further accentuated in the setting of decreased hepatic metabolism and/or renal clearance.
Serum lactate is increased during low oxygen conditions as pyruvate can no longer undergo aerobic metabolism in the mitochondria and is shunted toward lactate production.
FIGURE 5-27
Overview of cellular respiration and lactate production
Acetyl CoA
NAD
NADH 2 ATP
Aerobic conditions
Anaerobic conditions
Lactate
Glucose
Glucose
Pyruvate
34 ATP
Oxidative Phosphorylation
Glycolysis

126 F.A. MAFFEI
REVIEW QUESTIONS
1. Which statement accurately refl ects the utility of the physical assessment of the cardiovascular status of a child? A. Capillary refi ll time is independent of ambient temperature. B. Pulse pressure will be decreased in conditions characterized
by low systemic vascular resistance. C. Tachycardia, in and of itself, is a sensitive and specifi c sign
of hemodynamic instability. D. The peripheral skin to ambient temperature gradient (dTp-a)
decreases during states of high systemic vascular resistance. E. Urine output is infl uenced by many factors and therefore
should not serve as a proxy for distal tissue perfusion.
2. In the following illustration of an arterial waveform, which number identifi es the incisura or dicrotic notch?
A
2
3
1
45
Hyperlactatemia may also occur due to drug or toxin effects. Any drug that interferes with the TCA cycle or oxidative phosphorylation may lead to excessive lactate production. These medications includes metformin, salicylates, HMG CoA reductase inhibitors, cya-nide, iron and propofol. Inborn errors of metabolism may also present with profound eleva-tions in the serum lactate. Examples of inborn errors of metabolism that may present with lactic acidosis include pyruvate dehydrogenase defi ciency, pyruvate decarboxylase defi -ciency, glucose-6-phosphatase defi ciency, fructose-1,6-diphosphatase defi ciency and mito-chondrial disorders. In addition, certain malignancies may be associated with hyperlactemia. Finally, hyperlactatemia may be caused by elevation in the D -isomer of lactate. This is usu-ally observed in states of intestinal bacterial overgrowth as occurs in short gut syndrome.
Brain Natriuretic Peptide
Although initially isolated in porcine brains, the majority of brain natriuretic peptide (BNP) is made by ventricular myocytes as a precursor molecule known as pro-BNP. Pro-BNP is enzymatically cleaved to N-terminal pro-BNP (NTproBNP) and the physiologically active BNP. BNP synthesis occurs in response to ventricular wall stress caused by volume or pres-sure overload. BNP has several physiologic effects that contribute to cardiovascular com-pensation in the setting of heart failure. The peptide causes an increase in cGMP in vascular smooth muscle resulting in vasodilation and afterload reduction. BNP suppresses the renin–angiotensin–aldosterone system, thus promoting diuresis and natriuresis. In addition, BNP may have a benefi cial role in the prevention of pathologic myocardial remodeling that may occur in advanced heart failure.
Both BNP and NTproBNP can be easily measured in whole blood. The advantage of measuring NTproBNP versus BNP is its longer half life (1-2 hrs versus 20 minutes) and longer stability at room temperature (72 hrs versus 24 hrs).
Multiple adult studies have confi rmed the utility of BNP as a marker to rule-out heart failure. Using a cut off of 100 pg/ml, the BNP assay has a clinical specifi city for heart failure of > 96%. The ability to rule-in heart failure (i.e. sensitivity) is somewhat lower. Preliminary data suggest the assay shows promise as an aid to the diagnosis and management of a variety of pediatric cardiovascular diseases (i.e. congenital heart defects, cardiomyopathy and pul-monary hypertension). Normal pediatric values are a BNP of less than 25 pg/ml and a NTproBNP level less than 70 pg/ml. Levels of both peptides are higher in newborns but normalize by the second week of postnatal life.

127 C HAPTER 5 • ASS ESS M ENT OF CAR DIOVASC U LAR FU NCTION
A. 1 B. 2 C. 3 D. 4 E. 5
3. Which statement best describes wave frequency and resonance? A. A system with high resonance may falsely increase the dia-
stolic pressure by as much as 30%. B. An accurate monitoring system at heart rates of 180 beats per
minute (bpm) should have its natural frequency be equal to 6 Hz.
C. If the frequency of the system is in the same range as the fre-quency of the arterial waveform, the amplitudes of the waves become additive and can overestimate the systolic pressure.
D. Resonant augmentation of the arterial pressure wave causes an artifactual increase in both systolic and diastolic recorded pressures.
E. The effect of resonance becomes less problematic when the monitoring system has a low natural frequency and the heart rate is high.
4. Which statement is correct regarding arterial monitoring sys-tems? A. Damping describes the interaction between the oscillatory
energy of a wave and the electrical properties of the monitor-ing system.
B. Due to the turbulent fl ow and the high oxygen tension found in arteries, infections associated with arterial catheters are extremely uncommon.
C. Pressure monitoring devices must be leveled to the point at which the catheter enters the artery.
D. The delivery of a small “fast fl ush” to the arterial catheter allows for quantifi cation of excessive resonance within the system.
E. The phlebostatic axis is the determined by locating the junc-tion of the vertical line drawn down from the clavicle and the horizontal mid-axillary line.
5. Which of the following describes the alternating beats of larger and smaller pulse pressures observed in the setting of a normal rhythm with severe left ventricular systolic dysfunction? A. Pulsus alternans B. Pulsus bisferiens C. Pulsus paradoxicus D. Pulsus parvus et tardus E. Systolic pressure variation
6. Which of the following describes the exaggerated fall in the systolic blood pressure observed during inspiration? A. Pulsus alternans B. Pulsus bisferiens C. Pulsus paradoxicus D. Pulsus parvus et tardus E. Systolic pressure variation
7. Which of the following describes the decreased and delayed upstroke in the arterial waveform characteristic of severe left ventricular outfl ow obstruction? A. Pulsus alternans B. Pulsus bisferiens C. Pulsus paradoxicus D. Pulsus parvus et tardus E. Systolic pressure variation
8. Which of the following describes the rise in systolic blood pressure observed early in a positive pressure breath? A. Pulsus alternans B. Pulsus bisferiens C. Pulsus paradoxicus D. Pulsus parvus et tardus E. Systolic pressure variation
9. Which of the following describes the brisk arterial upstroke followed by two peaks observed in hyperdynamic states? A. Pulsus alternans B. Pulsus bisferiens C. Pulsus paradoxicus D. Pulsus parvus et tardus E. Systolic pressure variation
10. A 6 month old male infant, 2 weeks following the repair of Tetralogy of Fallot (patch closure of the ventricular septal defect and relief of the right ventricular outfl ow obstruction with sparing of the pulmonary valve) develops pneumonia, respiratory failure and septic shock. He is endotracheally in-tubated and administered two normal saline fl uid boluses (to-tal = 40 mL/kg). His positive end expiratory pressure (PEEP) is set at 7 cm H 2 O and his peak inspiratory pressures range from 27 to 30 cm H 2 O. An internal jugular central venous catheter with the tip positioned at the superior vena cava/right atrial junction and a radial arterial catheter are placed. His arterial catheter demonstrates a 20 mm Hg systolic gradient during a positive pressure breath. The following hemodynamic data are available: Heart rate 179 bpm Blood pressure 67/45 mm Hg Central venous pressure 14 mm Hg Central venous oxygen saturation 53% Arterial oxygen saturation 89% on 80% FiO 2 Arterial lactate 6 mmol/L Which of the following statements is MOST correct? A. The central venous pressure is refl ective of adequate volume
replacement. B. The decreased arterial saturation is likely due to left to right
shunting across a residual ventricular septal defect. C. The hypotension is best corrected by the addition of an infu-
sion of epinephrine. D. The positive end expiratory needs to be reduced to increase
right ventricular preload. E. There is a need for additional intravenous volume replacement.
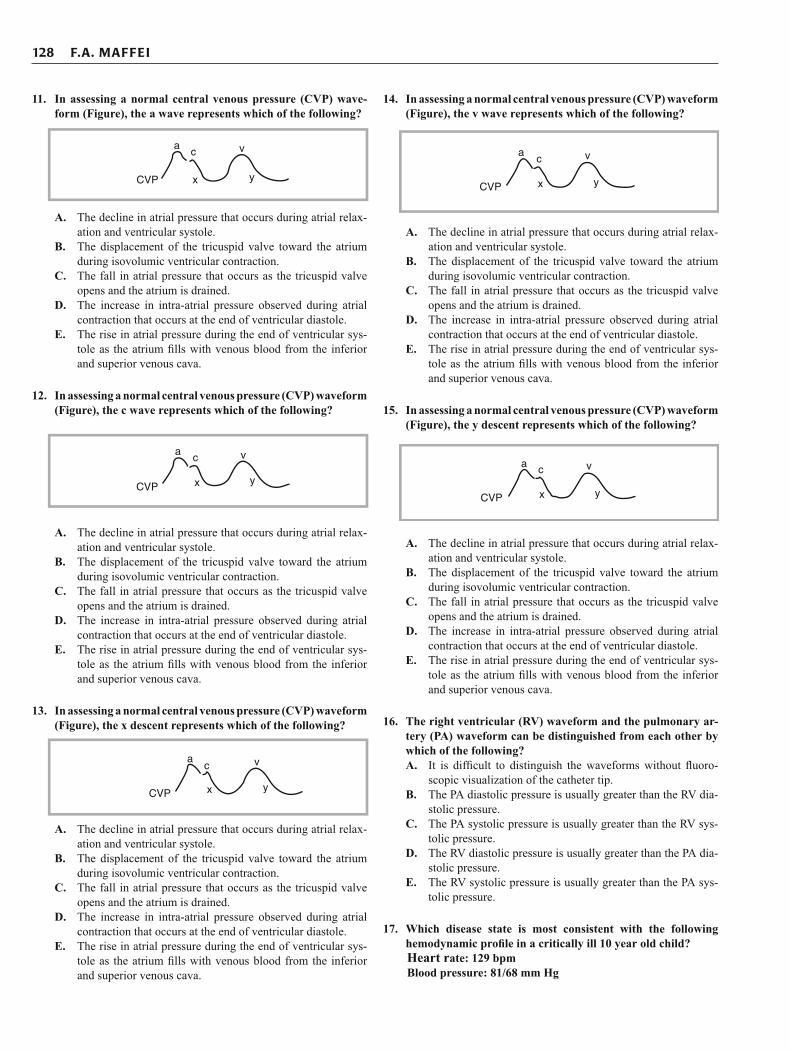
128 F.A. MAFFEI
11. In assessing a normal central venous pressure (CVP) wave-form (Figure), the a wave represents which of the following?
CVP
ac v
x y
A. The decline in atrial pressure that occurs during atrial relax-ation and ventricular systole.
B. The displacement of the tricuspid valve toward the atrium during isovolumic ventricular contraction.
C. The fall in atrial pressure that occurs as the tricuspid valve opens and the atrium is drained.
D. The increase in intra-atrial pressure observed during atrial contraction that occurs at the end of ventricular diastole.
E. The rise in atrial pressure during the end of ventricular sys-tole as the atrium fi lls with venous blood from the inferior and superior venous cava.
12. In assessing a normal central venous pressure (CVP) waveform (Figure), the c wave represents which of the following?
CVP
ac
x
v
y
A. The decline in atrial pressure that occurs during atrial relax-ation and ventricular systole.
B. The displacement of the tricuspid valve toward the atrium during isovolumic ventricular contraction.
C. The fall in atrial pressure that occurs as the tricuspid valve opens and the atrium is drained.
D. The increase in intra-atrial pressure observed during atrial contraction that occurs at the end of ventricular diastole.
E. The rise in atrial pressure during the end of ventricular sys-tole as the atrium fi lls with venous blood from the inferior and superior venous cava.
13. In assessing a normal central venous pressure (CVP) waveform (Figure), the x descent represents which of the following?
CVP
ac v
yx
A. The decline in atrial pressure that occurs during atrial relax-ation and ventricular systole.
B. The displacement of the tricuspid valve toward the atrium during isovolumic ventricular contraction.
C. The fall in atrial pressure that occurs as the tricuspid valve opens and the atrium is drained.
D. The increase in intra-atrial pressure observed during atrial contraction that occurs at the end of ventricular diastole.
E. The rise in atrial pressure during the end of ventricular sys-tole as the atrium fi lls with venous blood from the inferior and superior venous cava.
14. In assessing a normal central venous pressure (CVP) waveform (Figure), the v wave represents which of the following?
CVP
ac v
yx
A. The decline in atrial pressure that occurs during atrial relax-ation and ventricular systole.
B. The displacement of the tricuspid valve toward the atrium during isovolumic ventricular contraction.
C. The fall in atrial pressure that occurs as the tricuspid valve opens and the atrium is drained.
D. The increase in intra-atrial pressure observed during atrial contraction that occurs at the end of ventricular diastole.
E. The rise in atrial pressure during the end of ventricular sys-tole as the atrium fi lls with venous blood from the inferior and superior venous cava.
15. In assessing a normal central venous pressure (CVP) waveform (Figure), the y descent represents which of the following?
CVP
a c
x
v
y
A. The decline in atrial pressure that occurs during atrial relax-ation and ventricular systole.
B. The displacement of the tricuspid valve toward the atrium during isovolumic ventricular contraction.
C. The fall in atrial pressure that occurs as the tricuspid valve opens and the atrium is drained.
D. The increase in intra-atrial pressure observed during atrial contraction that occurs at the end of ventricular diastole.
E. The rise in atrial pressure during the end of ventricular sys-tole as the atrium fi lls with venous blood from the inferior and superior venous cava.
16. The right ventricular (RV) waveform and the pulmonary ar-tery (PA) waveform can be distinguished from each other by which of the following? A. It is diffi cult to distinguish the waveforms without fl uoro-
scopic visualization of the catheter tip. B. The PA diastolic pressure is usually greater than the RV dia-
stolic pressure. C. The PA systolic pressure is usually greater than the RV sys-
tolic pressure. D. The RV diastolic pressure is usually greater than the PA dia-
stolic pressure. E. The RV systolic pressure is usually greater than the PA sys-
tolic pressure.
17. Which disease state is most consistent with the following hemodynamic profi le in a critically ill 10 year old child? Heart rate: 129 bpm Blood pressure: 81/68 mm Hg
129 C HAPTER 5 • ASS ESS M ENT OF CAR DIOVASC U LAR FU NCTION
Pulmonary artery occlusion pressure (PAOP): 24 mm Hg Pulmonary vascular resistance index (PVRI): 128 dyne-s/cm 5 /m 2 Cardiac index (CI): 2.0 L/min/m 2 Central venous/right atrial pressure: 6 mm Hg Stroke volume index (SVI): 20 mL/beat/m 2 Lactate: 10 mmol/L SmvO 2 : 50% SaO 2 : 91% A. Cardiomyopathy with biventricular dysfunction B. Congestive heart failure secondary to a large atrial septal
defect with left to right shunting C. Gastroenteritis with hypovolemia D. Myocarditis with left ventricular dysfunction E. Pulmonary hypertension with right ventricular dysfunction
18. Which of the following Fick derived equations is correct?
A.
B.
C. D.
E.
19. Which statement regarding the use of thermodilution to determine cardiac output is MOST correct? A. A fundamental assumption during thermodilution is that the fl uid
injected into the right atrium will have complete and anatomi-cally appropriate mixing prior to reaching the pulmonary artery.
B. A high cardiac output state results in a large area under the thermodilution curve.
C. Right heart cardiac output should equal left heart output even in the presence of an intracardiac shunt.
D. The area under the thermodilution curve is determined by the change in fl ow over time.
E. The area under the thermodilution curve is in the numerator of the Stewart-Hamilton formula used to calculate cardiac output.
20. Which of the following is correct regarding central venous saturation (ScvO 2 ) and mixed venous saturation (SmvO 2 ) ? A. Decreased oxygen delivery raises both ScvO 2 and SmvO 2 B. Decreased oxygen consumption lowers both ScvO 2 and
SmvO 2 C. In normal conditions, SmvO 2 is slightly higher than the ScvO 2 D. ScvO 2 is best measured in the lower right atrium to reliably
predict SmvO 2 E. SmvO 2 is best measured in the right ventricle just below the
tricuspid valve.
21. A 6 year old boy with chronic granulomatous disease presents with septic shock. Prior to arrival in the pediatric intensive care unit, he is intubated, treated with antibiotics, receives fl uid resuscitation with 80 mL/kg of crystalloid and is started on an infusion of dopamine at 15 mcg/kg/min. He has central
arterial and venous catheters placed that allow for intermit-tent transpulmonary thermodilution and continuous pulse contour analysis for determination of the cardiac output. The following hemodynamic data are obtained: Heart rate: 170 bpm Blood pressure: 70/54 mm Hg Cardiac index (CI): 1.5 L/min/m 2 Central venous pressure: 6 mm Hg Stroke volume index (SVI): 21 mL/beats/m 2 Stroke volume variation (SVV) > 20% (normal <10%) Systemic vascular resistance index (SVRI): 1,600 dyne-s/cm 5 /m 2 Lactate: 12 mmol/L ScvO 2 : 45% (Right atrium) SaO 2 : 91% Hemoglobin: 7.5 mg/dL Positive End Expiratory Pressure (PEEP): 8 cm H 2 O Fraction of inspired oxygen (FiO 2 ): 0.65 The most appropriate next step in the management of this boy would be to: A. begin an infusion of epinephrine at 0.05 mcg/kg/min. B. begin an infusion of milrinone at 0.5 mcg/kg/min. C. begin an infusion of norepinephrine at 0.05 mcg/kg/min. D. continue volume resuscitation with a packed red cell
transfusion. E. increase his PEEP to 10 cm H 2 O.
22. A 9 month old infant with dilated cardiomyopathy presents in shock with severe left ventricular dysfunction. He requires intubation and the initiation of a milrinone infusion. He requires the addition of a nitroprusside infusion for afterload reduction. The infusion is titrated to 4 mcg/kg/min to maintain systolic blood pressure between 70-85 mm Hg. On the 6th PICU day he develops a new metabolic acidosis with a base defi cit (−7). A serum lactate level is elevated (7.3 mmol/L) and the superior vena cava oxygen saturation is 88%. Which of the following explanations for an elevated lactate level is most worrisome in this clinical scenario? A. Decreased lactate clearance secondary to impaired renal clearance. B. Elevated lactate production secondary to catecholamine-
induced “hyperglycolysis”. C. Impaired lactate metabolism secondary to an inborn error of
metabolism. D. Increased lactate production from tissue hypoperfusion. E. Increased lactate production secondary to cellular inability to
extract delivered oxygen.
23. A 12 year old girl with acute lymphoblastic leukemia is neutro-penic and develops septic shock. Prior to arrival in the pediat-ric intensive care unit, she is treated with antibiotics and is fl uid resuscitated with 80 mL/kg of isotonic intravenous crystalloid fl uids. She has both central arterial and venous catheters placed that allow intermittent transpulmonary thermodilution and con-tinuous pulse contour analysis for cardiac output determination. She appears toxic, fl ushed and has a hyperbrisk capillary refi ll. The following hemodynamic data are obtained: Heart rate: 150 bpm Blood pressure: 100/34 mm Hg Cardiac index (CI): 6.5 L/min/m 2 Central venous pressure: 16 mm Hg Stroke volume index (SVI): 51 mL/beats/m 2 Storke volume variation (SVV) < 10% (normal <10%) Systemic vascular resistance index (SVRI): 400 dynes-s/cm 5 /m 2
2
Ao 2 pa 2
DOCO
C O C O=
−
Ao 2pul
pv 2 pa 2
C OQ
C O C O=
−
pul pv 2 pul pa 2 2Q C O Q C O D( ) ( ) O⎡ ⎤= +⎣ ⎦
syst pv 2 syst Ao 2 2Q C O Q( ) ( O V)C O⎡ ⎤= −⎣ ⎦
2syst
Ao 2 pa 2
VOQ
C O C O=
−

130 F.A. MAFFEI
Lactate: 9 mmol/L ScvO 2 : 88% (Right atrium) SaO 2 : 100% Hemoglobin: 9.5 mg/dL The most appropriate next step would be to: A. begin an infusion of epinephrine at 0.05 mcg/kg/min. B. begin an infusion of milrinone at 0.5 mcg/kg/min. C. begin an infusion of norepinephrine at 0.05 mcg/kg/min. D. continue volume resuscitation with a packed red cell transfusion. E. diurese with furosemide (1 mg/kg).
24. A 12 year old girl with acute lymphoblastic leukemia is neutro-penic and develops septic shock. Prior to arrival in the pediat-ric intensive care unit, she is treated with antibiotics and is fl uid resuscitated with 80 mL/kg of isotonic intravenous crystalloid fl uids. She has both central arterial and venous catheters placed that allow intermittent transpulmonary thermodilution and con-tinuous pulse contour analysis for cardiac output determination. She appears toxic, fl ushed and has a hyperbrisk capillary refi ll. The following hemodynamic data are obtained: Heart rate: 150 bpm Blood pressure: 100/34 mm Hg Cardiac index (CI): 6.5 L/min/m 2 Central venous pressure: 16 mm Hg Stroke volume index (SVI): 51 mL/beats/m 2 Stroke volume variation (SVV) < 10% (normal <10%) Systemic vascular resistance index (SVRI): 400 dynes-s/cm 5 /m 2 Lactate: 9 mmol/L ScvO 2 : 88% (Right atrium) SaO 2 : 100% Hemoglobin: 9.5 mg/dL The elevated S CV O 2 (88%) is likely indicative of which of the following? A. Catheter tip positioning near the orifi ce of the coronary sinus B. Drug toxicity C. Inadequate oxygen uptake at the cellular level D. Insuffi cient cardiac output to provide tissue perfusion E. Successful resuscitation
25. In the following illustration of an arterial waveform, which number identifi es peak left ventricular ejection?
A
2
3
45
1
A. 1 B. 2 C. 3 D. 4 E. 5
26. In the following illustration of an arterial waveform, which number identifi es the anacrotic limb?
A
2
3
45
1
A. 1 B. 2 C. 3 D. 4 E. 5
27. In the following illustration of an arterial waveform, which number identifi es diastolic runoff?
A. 1 B. 2 C. 3 D. 4 E. 5
1
3
2
A
45

131 C HAPTER 5 • ASS ESS M ENT OF CAR DIOVASC U LAR FU NCTION
SUGGESTED READINGS
Texts
Bissonnette B. Pediatric anesthesia: principles and practices. 1st ed. New York: McGraw-Hill; 2002.
Civetta JM, Taylor RW, Kirby RR. Critical care. 3rd ed. Philadelphia: Williams and Wilkins; 1997.
Marino PL. The ICU book. 2nd ed. Philadelphia: Williams and Wilkins; 1997.
Mark JB. Atlas of cardiovascular monitoring. 1st ed. New York: Churchill Livingstone; 1998.
Mihm FG, Rosenthal MH. Pulmonary artery catheterization. In: Benito JL, editor. Clinical procedures in anesthesia and intensive care. Philadelphia: JB Lippincott; 1994. p. 416.
Miller RD. Anesthesia. 5th ed. Philadelphia: Churchill Livingstone; 2000.
Pulmonary artery education project http://www.pacep.org/pages/htm-los/10409.15.579661138558047482. Released 2001, Reviewed 2004, 2007.
Rhoades RA, Tanner GA. Medical physiology. 1st ed. Baltimore: Williams and Wilkins; 1995.
Rogers MC, Nichols DG. Textbook of pediatric intensive care. 3rd ed. Baltimore: Williams and Wilkins; 1996.
Sparkes HV, Rooke TW. Essentials of cardiovascular physiology. Minneapolis: University of Minnesota Press; 1987.
Tobin MJ. Principles and practices of intensive care monitoring. New York: McGraw-Hill; 1998.
Articles
Barach P. Pulsus paradoxus. Hosp Physician. 2000;1:49–50. Barbeito A, Marks JB. Arterial and central pressure monitoring.
Anesthesiol Clin. 2006;24:717–35. Barber BJ, Donnerstein RL, Secomb TW, et al. Dicrotic pulse follow-
ing Ross procedure. Pediatr Cardiol. 2007;28:247–9. Bloos F, Reinhart K. Venous oximetry. Intensive Care Med
2005;31:911–913. Cholley BP, Payen D. Noninvasive techniques for the measurement of
cardiac output. Curr Opin Crit Care. 2005;11:424–9.
Connors A, Speroff T, Dawson NV, et al. The effectiveness of right heart catheterization in the initial care of critically ill patients. JAMA. 1995;274:1591–8.
Das BB. Plasma B-type natriuretic peptides in children with cardiovas-cular diseases. Pediatr Cardiol. 2010;31:1135–1145.
Godje O et al. Reliability of a new algorithm for continuous cardiac output determination by pulse-contour analysis during hemody-namic instability. Crit Care Med. 2002;30:52–8.
Hadian M, Pinsky MR. Functional hemodynamic monitoring. Curr Opin Crit Care. 2007;13:318–23.
Hofer CK, Ganter MT, Zollinger A. What technique should I use to measure cardiac output? Curr Opin Crit Care. 2007;13:308–17.
King MA, Garrison MM, Vavilala MS, et al. Complications associated with arterial catheterization in children. Pediatr Crit Care Med. 2008;9:367–71.
Kleinman B. Understanding natural frequency and damping and how they relate to the measurement of blood pressure. J Clin Monit. 1989;5:137–47.
Lorente L, Santacreu R, Martin M, et al. Arterial catheter-related infec-tion of 2,949 catheters. Crit Care. 2006;10:1–7.
Lucet JC, Bouadma L, Zahar JR, et al. Infectious risk associated with arterial catheters compared to central venous catheters. Crit Care Med. 2010;38:1030–5.
McGee DC, Gould MK. Preventing complications of central venous catheterization. N Engl J Med. 2003;348:1123–33.
McGhee BH, Bridges EJ. Monitoring arterial blood pressure: what you may not know. Crit Care Nurs. 2002;22:60–79.
McLaughlin DP. Pulsus alternans. N Engl J Med. 1999;341(13):955. Mohan UR, Britto J, Habibi C, et al. Noninvasive measurement of car-
diac output in children. Pediatr Cardiol. 2002;23:58–61. Morgan P, Al-Subaie N, Rhodes A. Minimally invasive cardiac output
monitoring. Curr Opin Crit Care. 2008;14:322–6. Pizov R, Cohen M, Weiss Y, et al. Positive end expiratory pressure-
induced hemodynamic changes are refl ected in the arterial pres-sure waveform. Crit Care Med. 1996;24:1381–7.
Preisman S, Pfi effer U, Lieberman N, Perel A. New monitors of intra-vascular volume: a comparison of arterial pressure waveform analysis and the intrathoracic blood volume. Intensive Care Med. 1997;23:651–7.
1. D 2. D 3. C 4. D 5. A 6. C 7. D 8. E 9. B 10. E 11. D 12. B 13. A 14. E
15. C 16. B 17. D 18. E 19. A 20. C 21. D 22. E 23. C 24. C 25. B 26. A 27. E
ANSWERS

132 F.A. MAFFEI
Ricardo Vieira Carlos, Cristina Salvadori Bittar, Marcel Rezende Lopes, José Otávio Costa Auler Júnior Systolic pressure variation as diagnostic method for hypovolemia during anesthesia for car-diac surgery Brazilian Journal of Anesthesiology, 2005;55:1:3–18.
Reuter DA, Kirchner A, Felbinger TW et al. Usefulness of left ven-tricular stroke volume variation to assess fl uid responsiveness in patients with reduced cardiac function. Crit Care Med. 2003;31:1399–1404.
Rivers EP, Ander DS, Powell D. Central venous saturation monitoring in the critically ill patient. Curr Opin Crit Care. 2001;7:204–11.
Sevransky J. Clinical assessment of hemodynamically unstable patients. Curr Opin Crit Care. 2009;15:234–8.
Shekerdemian L, Bohn D. Cardiovascular effects of mechanical venti-lation. Arch Dis Child. 1999;80:475–80.
Tavernier B, Malchotine O, Lebuffe G, et al. Systolic pressure varia-tion as a guide to fl uid therapy in patients with sepsis-induced hypotension. Anesthesiology. 1998;89:1313–21.
Vernon C, Letourneau JL. Lactic acidosis: recognition, kinetics and associated prognosis. Crit Care Clin. 2010;26:255–83.
Yoshioka N. Do radial arterial pressure curves have diagnostic validity for identify severe aortic stenosis? J Anesth. 2010;24(1):7–10.