Embed Size (px)
Citation preview
PEER REVIEW OF THE NORWEGIAN SHIPBUILDING INDUSTRY
PEER REVIEW OF THE NORWEGIAN SHIPBUILDING INDUSTRY
2
FOREWORD
This report was prepared under the Council Working Party on Shipbuilding (WP6) peer review process. Delegates discussed a draft at the WP6 meeting on 2 December 2016. No substantive comments were received and delegates agreed to declassify the report. The report will be made available on the WP6 website: http://www.oecd.org/sti/shipbuilding.
© OECD 2017 Cover photo: © Ulstein Group/Per Eide Applications for permission to reproduce or translate all or part of this material should be made to: OECD Publications, 2 rue André-Pascal, 75775 Paris, Cedex 16, France; e-mail: [email protected]. This document, as well as any data and any map included herein, are without prejudice to the status of or sovereignty over any territory, to the delimitation of international frontiers and boundaries and to the name of any territory, city or area.
PEER REVIEW OF THE NORWEGIAN SHIPBUILDING INDUSTRY
3
TABLE OF CONTENTS
ISSUES FOR DISCUSSION .......................................................................................................................... 4
EXECUTIVE SUMMARY ............................................................................................................................. 6
PEER REVIEW OF THE NORWEGIAN SHIPBUILDING INDUSTRY .................................................... 9
GLOBAL PERSPECTIVE ............................................................................................................................ 10
FEATURES OF NORWAY'S SHIPBUILDING AND OFFSHORE INDUSTRY ...................................... 13
Overview .................................................................................................................................................... 13 Shipbuilding ............................................................................................................................................... 14
Structure of the industry ......................................................................................................................... 14 Employment ........................................................................................................................................... 18 Technology and Research, Development and Innovation ...................................................................... 20 Production and New Orders ................................................................................................................... 22 Yard capacity and supply of vessels ....................................................................................................... 28 Financial performance ............................................................................................................................ 29
Maritime Equipment Suppliers .................................................................................................................. 32 Maritime Clusters ...................................................................................................................................... 35 Finance industry ......................................................................................................................................... 38 Industry challenges .................................................................................................................................... 39
GOVERNMENT POLICIES IN NORWAY'S SHIPBUILDING INDUSTRY ........................................... 41
Strategy for maritime sector ....................................................................................................................... 41 Oil and Gas Industry .............................................................................................................................. 44
Support measures ....................................................................................................................................... 44 Export and home credits ......................................................................................................................... 44 Direct finance to the shipyards ............................................................................................................... 46 Research, Development and Innovation (RDI) ...................................................................................... 48
Evaluation of selected support measures ................................................................................................... 53 Export and home credit .......................................................................................................................... 53 Direct finance to shipyards ..................................................................................................................... 54 Research and development ..................................................................................................................... 55 Policies to promote the construction and operation of greener ships ..................................................... 57
Analysis of consistency of selected policy measures with international commitments ............................. 59 Possible suggestions for the future reporting in the Inventory .................................................................. 60
REFERENCES .............................................................................................................................................. 69
ANNEX I SELECTED NORWEGIAN INSTITUTIONS INVOLVED IN THE MARITIME INDUSTRY61
ANNEX II LIST OF NORWEGIAN YARDS AND MAIN SHAREHOLDERS OF LISTED YARDS ..... 63
ANNEX III ANALYSIS ON NORWEGIAN EXPORT CREDITS FOR SHIPS ........................................ 64
PEER REVIEW OF THE NORWEGIAN SHIPBUILDING INDUSTRY
4
ISSUES FOR DISCUSSION
The aim of the WP6’s peer review process is to provide a robust analysis of shipbuilding industry support measures at the country level, accompanied by industry detail, so as to facilitate discussion on the soundness of shipbuilding policy and its impact by the WP6, this section provides tentative issues for discussion on the Norwegian shipbuilding industry and accompanying policies.
Lower oil price environment and possible structural changes
This peer review of Norway has shown that shipbuilding is a very important industry for Norway. The Norwegian industry benefited from the oil price increase before 2008 but was hit by the lower price environment especially since 2015. Norwegian yards apparently managed to successfully shift towards other market segments including fishing vessels, fish-carrying vessels, and specialised cruise ships. However, these ships generate less value added than offshore vessels and raise some questions regarding how the Norwegian shipbuilding industry can adapt to this lower oil price environment:
• How Norwegian yards will address, on the medium term, the challenges of a lower oil price environment?
• Do some yards envisage conducting restructuring plans given this adverse demand environment?
• Do we expect a greater use of foreign countries in the value chain?
• What lessons does Norwegian yards’ agility to shift to other market segments hold for other shipbuilding economies?
• Are Norwegian yards expected to take advantage of the rebound of the oil price that has been trading above USD 50 per barrel since October 2016?
High labour costs and access to qualified workers
As mentioned above in the Peer Review report, Norway is a high-cost country and needs to focus on high value added and knowledge based products. As a consequence, the access to competence and innovation is vital to Norwegian shipbuilding industry’s competitiveness; and this involves notably the following issues:
• What can/should government and industry do to create the right conditions for attracting young and talented people to the shipbuilding industry?
• What can be done to support a more systematic approach to improving workers’ skills?
• What are the positive and negative implications of the increasingly extensive use of subcontracted workers?
Importance of clusters and synergies between maritime sectors
The performance of Norway’s maritime industry is notably supported by a network of dynamic maritime clusters. These clusters are supported by the public sector, notably Innovation Norway and gather many stakeholders.
PEER REVIEW OF THE NORWEGIAN SHIPBUILDING INDUSTRY
5
• What are the advantages of gathering all elements of the maritime value chain?
• In particular, how do you assess the role played by the fact that Norwegian fleet is one of the largest in the world?
• How can Norwegian policies best contribute to maritime clusters?
Slow progress in terms of international environmental regulations
Norway is at the forefront of international efforts towards more ambitious international environmental regulations. However, according to many experts, the progress of these regulations is relatively slow which raises some issues for Norway.
• What are the trends in terms of greener ship production in Norway?
• What are the impacts of Emission Control Areas?
• What are the main challenges of the Norwegian policymakers regarding the slow progress of international environmental regulations?
General assessment of shipbuilding policy
Norwegian government has implemented several measures based on its maritime strategy “Maritime Opportunities – Blue Growth for a Green Future” launched in August 2015 and "Steady as she goes" launched in November 2007. Remarkable features of Norwegian support measures include the provision of export credits which records the second largest in transaction volume and the third largest in transaction number. Moreover, various types of R&D supports are provided to the maritime sector. Some new support measures such as a scrapping scheme targeting older ferries are included in the maritime strategy released in 2015.
• How does the Norwegian government assess the efficiency of each of the policies supporting the maritime sector?
• Does this policy evaluation, notably regarding the provision of officially supported export credits, include the assessment of a potential market distorting effects?
PEER REVIEW OF THE NORWEGIAN SHIPBUILDING INDUSTRY
6
EXECUTIVE SUMMARY
In 2012, the OECD’s Council Working Party on Shipbuilding (WP6) introduced a peer review process, focused on support measures provided by governments to their shipbuilding sectors. Under this process, each economy participating in the WP6 will undergo an in-depth study of their shipbuilding industry and related government measures. Norway is the fifth country to be subject to a WP6 peer review, following the reviews of Japan (2012), Portugal (2013), Korea (2014) and Germany (2015).
This report has been prepared to support the review, which will take place at the 2 December 2016 WP6 meeting. Following are key points:
Industry features
Norway is a very open country where labour costs are higher than in most other maritime economies and where labour costs in the maritime sector are higher than the average of manufacturing sectors in Norway (Norsk Industri, 2015). As a consequence, to be competitive, Norway’s maritime industry has to focus on high value-added segments of the market and be knowledge-based. To this end, Norway’s competitive advantage is based on high investment in research and development.
The Norwegian shipbuilding industry is part of a maritime cluster which also includes international shipping companies (6th largest fleet in the world), equipment manufacturers, classification societies, ship designers, brokers, and providers of insurance and financial services.
The maritime industry accounted for around 6.7% of GDP in 2014 with the shipping, maritime equipment supply and shipbuilding sectors representing 3.9%, 1.2% and 0.3%, respectively. Norway is the 19th largest shipbuilding economy in the world, accounting for 0.25% of global ship completions in 2014.
With 109 600 employees, the Norwegian maritime industry represented 4% of the labour force in 2014, with the 10 400 people working in the shipbuilding sector accounting for 0.4% of the labour force. Because of the weaker offshore market, the number of employees in the maritime sector is estimated to have dropped by 10% in 2015, a sharper decrease than in 2009/2010. Most of the cut occurred within shipping companies and equipment manufacturers.
Structural change
The increase of the oil price before 2008 drove the strong growth of Norwegian offshore ship production. The global financial crisis in 2007/2008 and the sharp decrease in the oil price in the second half of 2008 (from USD 145 per barrel to USD 35 per barrel for the Brent) led to a drop in offshore vessel orders. However, because of the fast recovery of the oil price and the lag between orders and deliveries, the Norwegian yards went through this period relatively smoothly.
The current lower oil price environment which followed the drop in the oil price that occurred in the second half of 2014 is far more challenging for the Norwegian yards involved in offshore vessel construction. This period is indeed longer with no expectations for a significant recovery of oil prices to the 2011-mid-2014 levels (USD 110 per barrel on average) in the foreseeable future. As a consequence, offshore vessel orders decreased sharply and many offshore vessels owned by Norwegian operators are currently idle. In 2015, ships and rigs in lay-up and owned by Norwegian owners increased from 0 to 100 out of about 600 offshore vessels and, as a consequence, 7 300 jobs were cut in Norwegian shipping companies.
PEER REVIEW OF THE NORWEGIAN SHIPBUILDING INDUSTRY
7
The Norwegian shipbuilding industry managed to adapt quickly to this new and challenging environment by focusing on the production of other vessel types including fishing vessels and fish carrying vessels and the upgrading of other segments, such as specialized vessels and workboats. However, it will be difficult to equal the turnover of the past few years given the drop in orders for higher value offshore vessels.
The industry and policymakers want to maintain the skills within the maritime industry to be ready when demand rebounds. The maritime ecosystem in Norway facilitates the use of the skills originally developed to serve the production of offshore vessels for other purposes in the maritime sector (for instance building complex aquaculture offshore farms).
Government support
The Norwegian government plays an important role for the shipbuilding industry. In May 2015, the Norwegian Government presented its maritime strategy, "Maritime Opportunities – Blue Growth for a Green Future". The goal of this policy is to help Norway to be one of the leading maritime nations. The government and the industry work in close collaboration to design and implement the Maritime Strategy.
The Norwegian Government takes part in the demand side of the shipbuilding industry through government procurement. In its budget for 2016, the Norwegian Government allocated funds for the upgrading and maintenance of government research vessels, the maintenance of vessels for the Norwegian Navy and the building of a new vessel for the Norwegian Coastal Administration. In addition the Government committed funds to a recycling scheme for Norwegian registered short sea vessels.
These procurements are subject to public tenders not excluding foreign ship builders, and contracts awarded on a market-basis and in line with EU regulations on state aid. Several contracts have been awarded to foreign ship builders.
The establishment of the Norwegian International Ship Register (NIS) in 1987, as well as revised tonnage tax and a tax refund scheme for employing seafarers, are recognised by the Norwegian shipping industry as an important driver for the development of the Norwegian fleet as it allowed competing with the flags of convenience. However, the number of vessels in the NIS register decreased from 896 vessels in 1991 to 524 vessels in 2015. The number has since increased to 567, as of August 2016.
Support for Research & Development
Norway's public support for Research & Development and innovation include sector neutral and targeted schemes. Some of the schemes mentioned in this report target the maritime industry specifically, some all industries. Two institutions play a major role in the provision of public support for Research & Development (R&D) and innovation: Innovation Norway and the Norwegian Research Council. The Research Council is a national strategic and funding agency for research activities and an adviser on research policy for the Norwegian government and the research community. Innovation Norway supports companies in developing innovation within private companies.
Export credits and export guarantees
Export financing and guarantee system are managed by two separate entities: the Norwegian Export Credit Guarantee Agency (GIEK), providing export guarantee schemes; and Export Credit Norway, providing loan schemes.
PEER REVIEW OF THE NORWEGIAN SHIPBUILDING INDUSTRY
8
GIEK issues guarantees for loans offered by Export Credit Norway or commercial banks or investors. GIEK is a part of the Norwegian State and its maximum exposure (NOK 145 billion in 2016 for GIEK's general scheme) is determined by the Norwegian Parliament. GIEK's export guarantees are priced commercially and in accordance with the rules in the OECD-affiliated Arrangement of Officially Supported Export Credits (the Arrangement) and its Sector Understanding on Export Credits for Ships (SSU).
Export Credit Norway is a state-owned limited liability company and provides loans which require full guarantee coverage by GIEK or by other financial institutions. Export Credit Norway’s lending activities are fully financed by fiscal budget allocations. Export Credit Norway can offer both fixed interest rate CIRR-loans (short for Commercial Interest Reference Rate) in accordance with the Arrangement and floating rate market loans (which must also qualify for financing on CIRR-terms in accordance with Arrangement).
Policies supporting more environmentally friendly ships
The NOx Fund was established by the Environmental Agreement on NOx for the period 2011-2017 signed on the 14th of December 2010 by 15 business organisations and the Ministry of the Environment. The Agreement's main objective is to help Norway meet international commitments to the Gothenburg Protocol through support for emitting firms who undertake emission-reducing investments, including vessels. The NOx fund had by the end of 2014 financed NOx reducing measures on 480 vessels.
As part of its Maritime Strategy, the Norwegian government established a temporary recycling scheme for Norwegian registered short sea vessels in March 2016. The aim of the scheme is to contribute to a more environmental friendly short sea shipping fleet. The aid recipients have the option to apply for financing of a new ship through the Innovation Loan Scheme. Both schemes are administrated by Innovation Norway.
Norway also implemented environmental requirements in ferry tenders. The Government has ensured that all future tenders on state road ferry services will have requirements for low emission and zero emission technology, when the technology warrants this. Both Norwegian and European suppliers have the opportunity to apply for the ferry tenders.
PEER REVIEW OF THE NORWEGIAN SHIPBUILDING INDUSTRY
9
PEER REVIEW OF THE NORWEGIAN SHIPBUILDING INDUSTRY
In 2012, the OECD’s Council Working Party on Shipbuilding (WP6) introduced a peer review process, focused on support measures provided by governments to their shipbuilding sectors. Under this process, each economy participating in the WP6 will undergo an in-depth study of their shipbuilding industry and related government measures. Non-WP6 economies may also join the process and be the subject of a WP6 review.
The main goal of the peer review process is to strengthen the identification of government policies, practices and measures affecting the shipbuilding sector and to support discussion of these within the WP6. The analysis of support measures is accompanied by contextual detail of the industry, so as to enable a richer discussion of shipbuilding policy and its impact. A key element of the process is active debate and discussion of peer review drafts by WP6 participants, with a view to promoting transparency and experience-sharing.
Norway is the fifth country to be subject to a WP6 peer review, following the reviews of Japan (2012), Portugal (2013), Korea (2014) and Germany (2015).
The information in the report is drawn from public information sources, statistical series available to the Secretariat, Norway’s response to the peer review questionnaire and discussions with government officials and stakeholders. The Secretariat expresses its gratitude to the government and industry stakeholders who participated in the review.
The analysis focuses on the shipbuilding industry (including repair and conversion facilities), but also provides information on the marine supply industry, which manufactures the components that are used in ships. The report has four principal parts:
• Global perspective: This part provides a brief overview of the global market and the role that Norway plays in it.
• Structure and features of the Norwegian shipbuilding and marine supply industry: This part analyses the structure of the Norwegian industry and assesses industry and market developments in recent years.
• Government policies affecting the shipbuilding industry: This part reviews the policy measures that have been adopted to support the industry in recent years.
• Outlook: This part provides a brief assessment of the current situation and outlook, from the perspective of the Norwegian government.
PEER REVIEW OF THE NORWEGIAN SHIPBUILDING INDUSTRY
10
GLOBAL PERSPECTIVE
Norway is an open economy with exports accounting for one fifth of GDP. It is also highly dependent on the oil market. The value added of the oil and gas sector accounted for 22% of GDP in 2014 (OECD, 2016). However, according to the OECD Economic Survey of Norway (2016), the activity of the oil and gas sector decreased by 11.1% in 2015 and is expected to decrease further by 8.6% in 2016 and 4.9% in 2017.
The Norwegian shipbuilding industry is part of a maritime cluster which also includes international shipping companies (6th largest fleet in the world), equipment manufacturers, classification societies, ship designers, brokers, and providers of insurance and financial services (Norsk Industri, 2015). The maritime industry accounted for 6.7% of GDP in 2014 with the shipping, marine equipment and shipbuilding sectors representing 3.9%, 1.2% and 0.3%, respectively, according to Maritimt Forum, Menon and Statistics Norway.
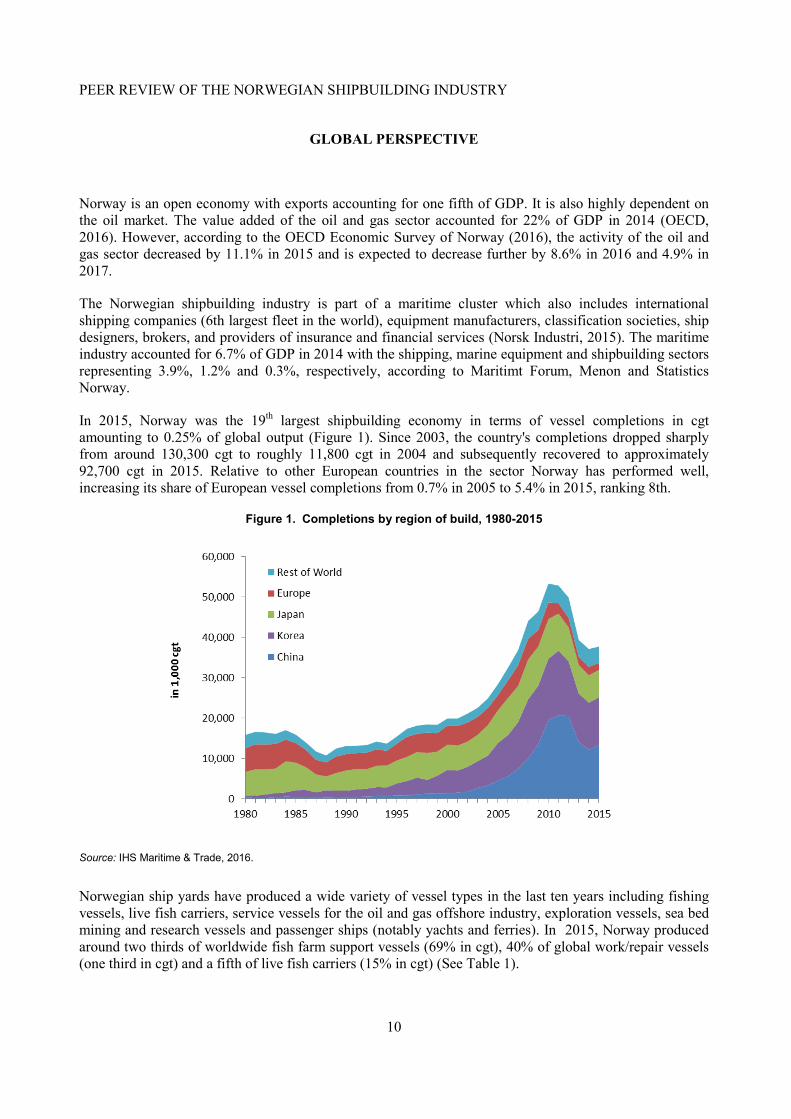
In 2015, Norway was the 19th largest shipbuilding economy in terms of vessel completions in cgt amounting to 0.25% of global output (Figure 1). Since 2003, the country's completions dropped sharply from around 130,300 cgt to roughly 11,800 cgt in 2004 and subsequently recovered to approximately 92,700 cgt in 2015. Relative to other European countries in the sector Norway has performed well, increasing its share of European vessel completions from 0.7% in 2005 to 5.4% in 2015, ranking 8th.
Figure 1. Completions by region of build, 1980-2015
Source: IHS Maritime & Trade, 2016.
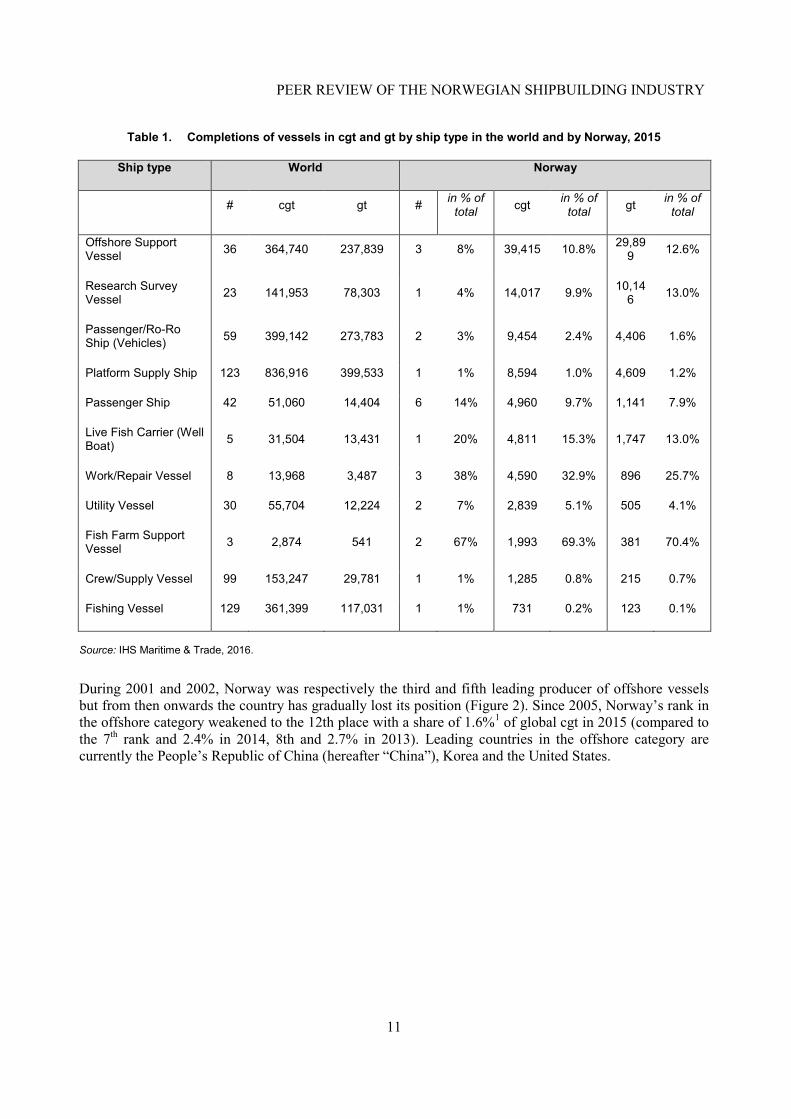
Norwegian ship yards have produced a wide variety of vessel types in the last ten years including fishing vessels, live fish carriers, service vessels for the oil and gas offshore industry, exploration vessels, sea bed mining and research vessels and passenger ships (notably yachts and ferries). In 2015, Norway produced around two thirds of worldwide fish farm support vessels (69% in cgt), 40% of global work/repair vessels (one third in cgt) and a fifth of live fish carriers (15% in cgt) (See Table 1).
PEER REVIEW OF THE NORWEGIAN SHIPBUILDING INDUSTRY
11
Table 1. Completions of vessels in cgt and gt by ship type in the world and by Norway, 2015
Ship type World Norway
# cgt gt # in % of
total cgt in % of total gt in % of
total
Offshore Support Vessel 36 364,740 237,839 3 8% 39,415 10.8% 29,89
9 12.6%
Research Survey Vessel 23 141,953 78,303 1 4% 14,017 9.9% 10,14
6 13.0%
Passenger/Ro-Ro Ship (Vehicles) 59 399,142 273,783 2 3% 9,454 2.4% 4,406 1.6%
Platform Supply Ship 123 836,916 399,533 1 1% 8,594 1.0% 4,609 1.2%
Passenger Ship 42 51,060 14,404 6 14% 4,960 9.7% 1,141 7.9%
Live Fish Carrier (Well Boat) 5 31,504 13,431 1 20% 4,811 15.3% 1,747 13.0%
Work/Repair Vessel 8 13,968 3,487 3 38% 4,590 32.9% 896 25.7%
Utility Vessel 30 55,704 12,224 2 7% 2,839 5.1% 505 4.1%
Fish Farm Support Vessel 3 2,874 541 2 67% 1,993 69.3% 381 70.4%
Crew/Supply Vessel 99 153,247 29,781 1 1% 1,285 0.8% 215 0.7%
Fishing Vessel 129 361,399 117,031 1 1% 731 0.2% 123 0.1%
Source: IHS Maritime & Trade, 2016.
During 2001 and 2002, Norway was respectively the third and fifth leading producer of offshore vessels but from then onwards the country has gradually lost its position (Figure 2). Since 2005, Norway’s rank in the offshore category weakened to the 12th place with a share of 1.6%1 of global cgt in 2015 (compared to the 7th rank and 2.4% in 2014, 8th and 2.7% in 2013). Leading countries in the offshore category are currently the People’s Republic of China (hereafter “China”), Korea and the United States.
PEER REVIEW OF THE NORWEGIAN SHIPBUILDING INDUSTRY
12
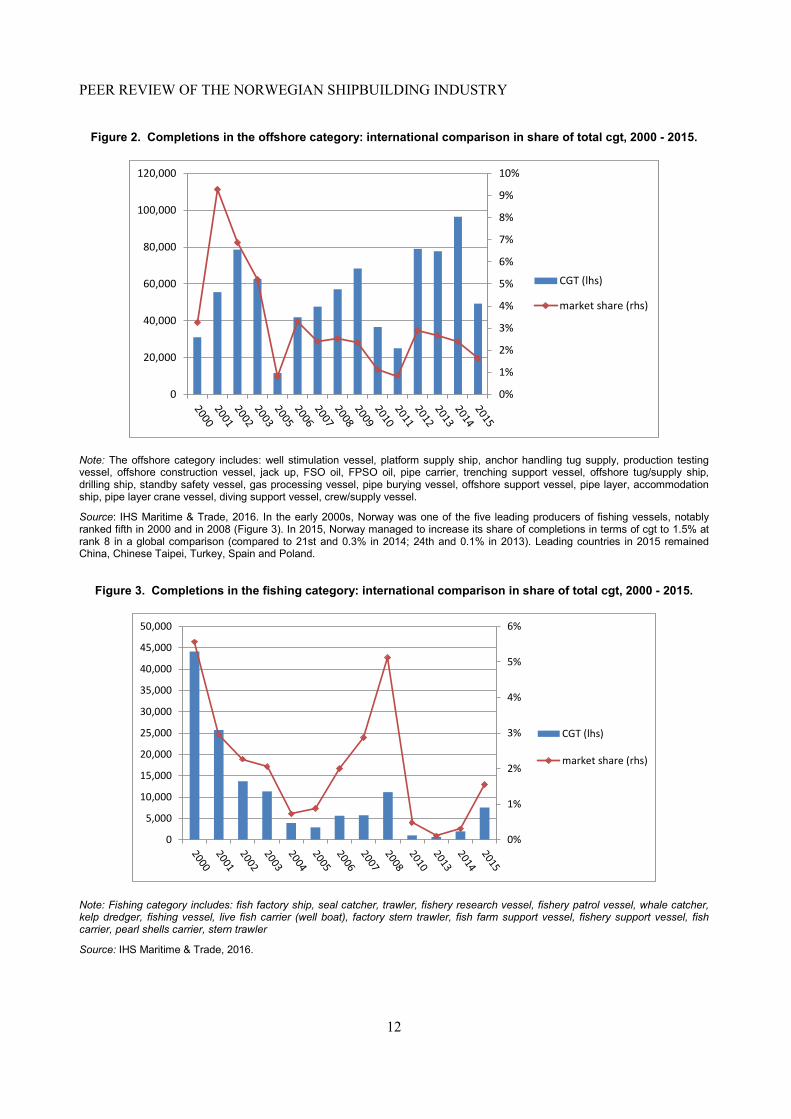
Figure 2. Completions in the offshore category: international comparison in share of total cgt, 2000 - 2015.
Note: The offshore category includes: well stimulation vessel, platform supply ship, anchor handling tug supply, production testing vessel, offshore construction vessel, jack up, FSO oil, FPSO oil, pipe carrier, trenching support vessel, offshore tug/supply ship, drilling ship, standby safety vessel, gas processing vessel, pipe burying vessel, offshore support vessel, pipe layer, accommodation ship, pipe layer crane vessel, diving support vessel, crew/supply vessel.
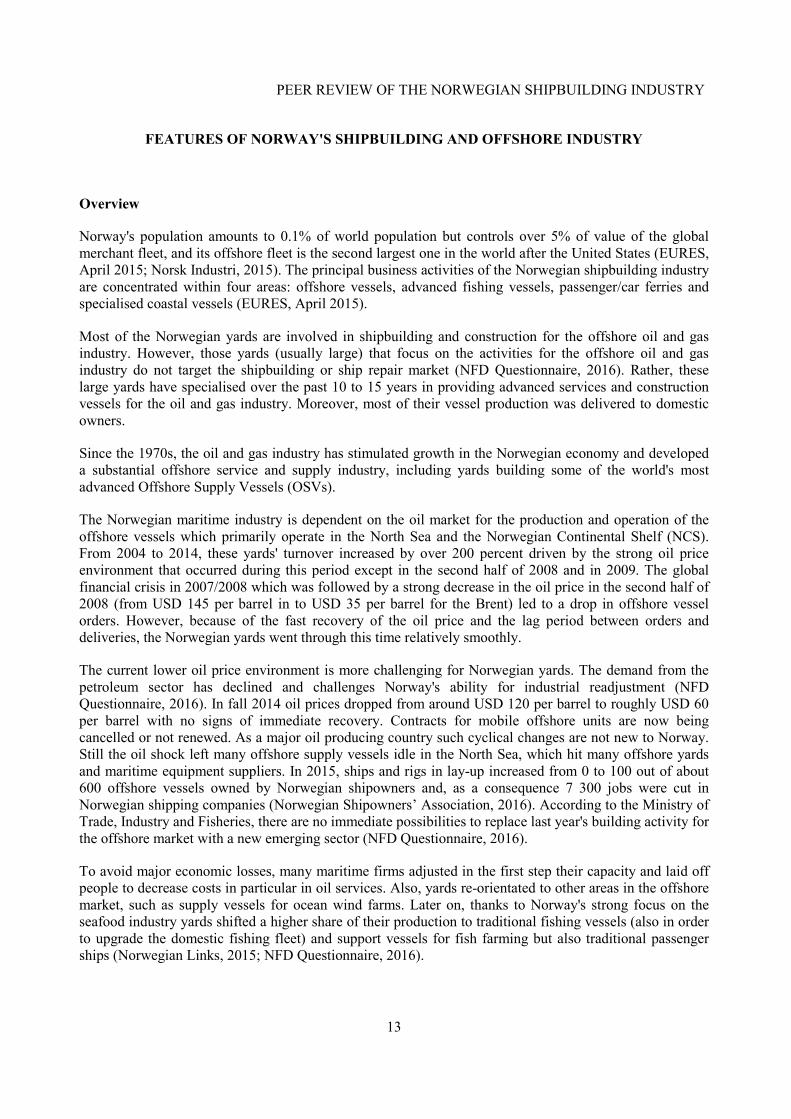
Source: IHS Maritime & Trade, 2016. In the early 2000s, Norway was one of the five leading producers of fishing vessels, notably ranked fifth in 2000 and in 2008 (Figure 3). In 2015, Norway managed to increase its share of completions in terms of cgt to 1.5% at rank 8 in a global comparison (compared to 21st and 0.3% in 2014; 24th and 0.1% in 2013). Leading countries in 2015 remained China, Chinese Taipei, Turkey, Spain and Poland.
Figure 3. Completions in the fishing category: international comparison in share of total cgt, 2000 - 2015.
Note: Fishing category includes: fish factory ship, seal catcher, trawler, fishery research vessel, fishery patrol vessel, whale catcher, kelp dredger, fishing vessel, live fish carrier (well boat), factory stern trawler, fish farm support vessel, fishery support vessel, fish carrier, pearl shells carrier, stern trawler
Source: IHS Maritime & Trade, 2016.
0%
1%
2%
3%
4%
5%
6%
7%
8%
9%
10%
0
20,000
40,000
60,000
80,000
100,000
120,000
CGT (lhs)
market share (rhs)
0%
1%
2%
3%
4%
5%
6%
0
5,000
10,000
15,000
20,000
25,000
30,000
35,000
40,000
45,000
50,000
CGT (lhs)
market share (rhs)
PEER REVIEW OF THE NORWEGIAN SHIPBUILDING INDUSTRY
13
FEATURES OF NORWAY'S SHIPBUILDING AND OFFSHORE INDUSTRY
Overview
Norway's population amounts to 0.1% of world population but controls over 5% of value of the global merchant fleet, and its offshore fleet is the second largest one in the world after the United States (EURES, April 2015; Norsk Industri, 2015). The principal business activities of the Norwegian shipbuilding industry are concentrated within four areas: offshore vessels, advanced fishing vessels, passenger/car ferries and specialised coastal vessels (EURES, April 2015).
Most of the Norwegian yards are involved in shipbuilding and construction for the offshore oil and gas industry. However, those yards (usually large) that focus on the activities for the offshore oil and gas industry do not target the shipbuilding or ship repair market (NFD Questionnaire, 2016). Rather, these large yards have specialised over the past 10 to 15 years in providing advanced services and construction vessels for the oil and gas industry. Moreover, most of their vessel production was delivered to domestic owners.
Since the 1970s, the oil and gas industry has stimulated growth in the Norwegian economy and developed a substantial offshore service and supply industry, including yards building some of the world's most advanced Offshore Supply Vessels (OSVs).
The Norwegian maritime industry is dependent on the oil market for the production and operation of the offshore vessels which primarily operate in the North Sea and the Norwegian Continental Shelf (NCS). From 2004 to 2014, these yards' turnover increased by over 200 percent driven by the strong oil price environment that occurred during this period except in the second half of 2008 and in 2009. The global financial crisis in 2007/2008 which was followed by a strong decrease in the oil price in the second half of 2008 (from USD 145 per barrel in to USD 35 per barrel for the Brent) led to a drop in offshore vessel orders. However, because of the fast recovery of the oil price and the lag period between orders and deliveries, the Norwegian yards went through this time relatively smoothly.
The current lower oil price environment is more challenging for Norwegian yards. The demand from the petroleum sector has declined and challenges Norway's ability for industrial readjustment (NFD Questionnaire, 2016). In fall 2014 oil prices dropped from around USD 120 per barrel to roughly USD 60 per barrel with no signs of immediate recovery. Contracts for mobile offshore units are now being cancelled or not renewed. As a major oil producing country such cyclical changes are not new to Norway. Still the oil shock left many offshore supply vessels idle in the North Sea, which hit many offshore yards and maritime equipment suppliers. In 2015, ships and rigs in lay-up increased from 0 to 100 out of about 600 offshore vessels owned by Norwegian shipowners and, as a consequence 7 300 jobs were cut in Norwegian shipping companies (Norwegian Shipowners’ Association, 2016). According to the Ministry of Trade, Industry and Fisheries, there are no immediate possibilities to replace last year's building activity for the offshore market with a new emerging sector (NFD Questionnaire, 2016).
To avoid major economic losses, many maritime firms adjusted in the first step their capacity and laid off people to decrease costs in particular in oil services. Also, yards re-orientated to other areas in the offshore market, such as supply vessels for ocean wind farms. Later on, thanks to Norway's strong focus on the seafood industry yards shifted a higher share of their production to traditional fishing vessels (also in order to upgrade the domestic fishing fleet) and support vessels for fish farming but also traditional passenger ships (Norwegian Links, 2015; NFD Questionnaire, 2016).
PEER REVIEW OF THE NORWEGIAN SHIPBUILDING INDUSTRY
14
The industry and policymakers want to maintain the skills within the maritime industry so that it will be ready should energy markets recover. The maritime ecosystem in Norway facilitates the use of the skills originally developed to serve the production of offshore vessels for other purposes in the maritime sector (for instance building complex aquaculture offshore farms). Furthermore, to support the readjustment process and promote competitiveness in the country's industries Norway prioritized in its latest national budget education, industrial R&D, tax reductions and infrastructure projects (NFD Questionnaire, 2016).
Around 75 yards operate in the industry that focus on new building and ship repair while about 25 yards focus mainly on pure new buildings - a number that remained stable over the last ten years. All the yards are purely private, without any state-owned enterprises (NFD Questionnaire, 2016). Of those yards, one operates in both new building and ship repair (i.e. multi-tasking) (EURES, April 2015). The largest vessels being built at Norwegian yards today reachs a size of about 135 meters (Length overall, LOA). Therefore, yards that are capable of building vessels LOA above 40 meters are described as large in this report (NFD Questionnaire, 2016).
Differences between small and larger shipyards in Norway are reflected in the latter yards' focus on the new building market and higher investments in production facilities, standardizing procurement and logistical routines in order to achieve value creation throughout all parts of the newbuilding process. Over the past 15 years, these yards delivered almost 100% of all offshore service vessels built in Norway (NFD Questionnaire, 2016).
In contrast, the small to medium shipyards focus on the repair and ship market, or at least a combination of repair and conversion activities as well as new buildings of specialised vessels, such as high-speed catamarans for passenger transport or workboats/fish carriers for the salmon industry (fish farming). According to Norwegian Ministry of Trade, Industry and Fisheries the majority of these specialized vessels are built from aluminium and range between 15 to 35/40 meters LOA. The shipyards carry out the entire construction of these vessels including the manufacturing of hulls. Finally, the smaller yards - such as Viknes, Windy, Goldfish, Saga, Ibiza and Skibsplast - are specialised in building recreational boats (NFD Questionnaire, 2016).
Shipbuilding
Structure of the industry
Large shipyards are concentrated on the North-Western coast of Norway. Small and medium yards are located all along the Norwegian coast. Most of the shipyards in Norway are privately run and family owned, such as SIMEK AS, Kleven Maritime AS, Ulstein Verft AS, Fiskerstrand Verft AS, and around 40 more yards. Some of these yards also have foreign interests, such as the Ulstein Group that has four offices abroad that operate under the general heading of “Design and Solutions”, notably Ulstein Design & Solutions BV and Ulstein Equipment BV in the Netherlands, Ulstein Poland Ltd Sp. Z.O.O in Poland and Ulstein Marine Systems Co. Ltd in Shanghai (NFD Questionnaire, 2016).
Some other shipyards have been acquired by larger holding companies, such as the Vard Group AS - a company listed on the Singapore stock exchange and controlled by the Italian shipyard consortium Fincantieri. The Group operates - additionally to its five yards in Norway - two yards in Romania, two in Brazil and one in Vietnam (NFD Questionnaire, 2016). The group had a turnover of around NOK 10 billion (USD 1.6 billion2) in 2014 (NFD Questionnaire, 2016).
Furthermore, Havyard Group ASA is registered on the Oslo Stock Exchange and is a fully integrated ship technology company delivering products and services within the entire value chain ranging from vessel design and construction to support of vessels in operation. It has a design office in Poland and a hull yard
PEER REVIEW OF THE NORWEGIAN SHIPBUILDING INDUSTRY
15
in Turkey, as well as representative offices in China, Singapore and Brazil. Bergen Group ASA registered at the Oslo Stock Exchange used to own Noryards AS, but it has been sold to a Luxembourg based company.
Finally, Aker ASA (listed on the Oslo Stock Exchange) was an important player in Norway's shipbuilding industry until it decided to diversify to the offshore oil and gas industry. Still it has a subsidiary located in the U.S., Philadelphia Shipyard (NFD Questionnaire, 2016).
Table 2 shows an overview of Norwegian ship groups and ship yards in 2014.
PEER REVIEW OF THE NORWEGIAN SHIPBUILDING INDUSTRY
16
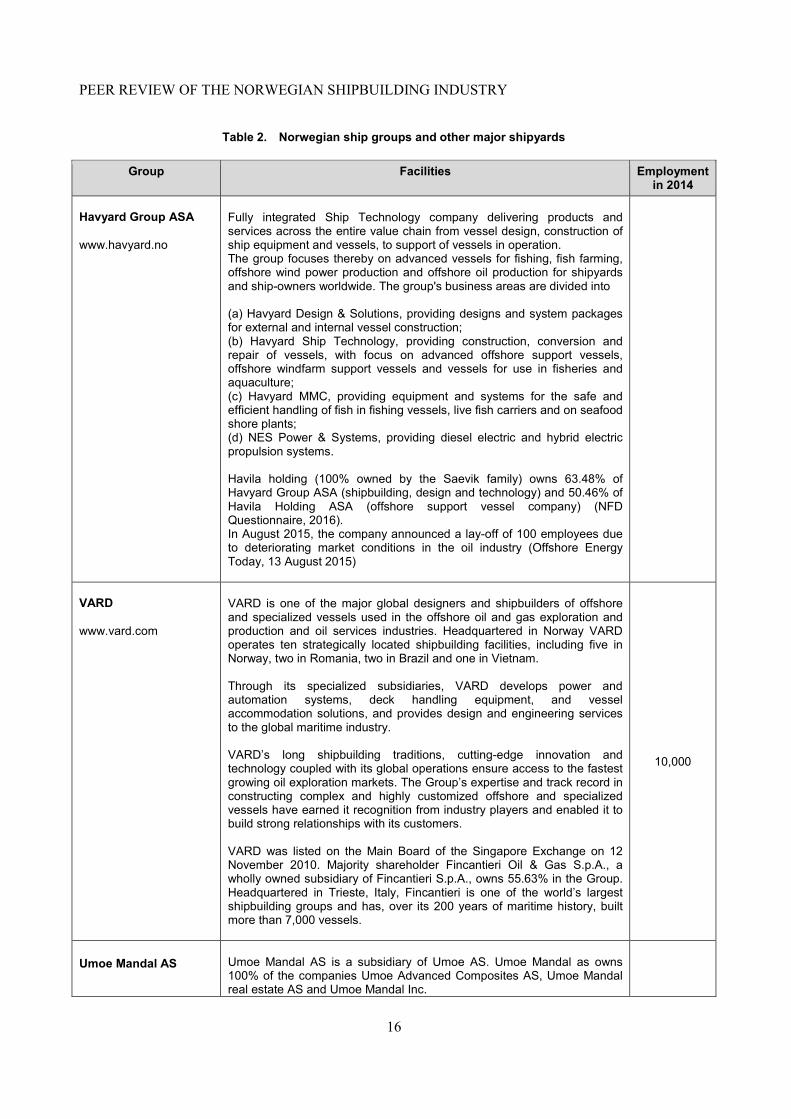
Table 2. Norwegian ship groups and other major shipyards
Group Facilities Employment in 2014
Havyard Group ASA www.havyard.no
Fully integrated Ship Technology company delivering products and services across the entire value chain from vessel design, construction of ship equipment and vessels, to support of vessels in operation. The group focuses thereby on advanced vessels for fishing, fish farming, offshore wind power production and offshore oil production for shipyards and ship-owners worldwide. The group's business areas are divided into (a) Havyard Design & Solutions, providing designs and system packages for external and internal vessel construction; (b) Havyard Ship Technology, providing construction, conversion and repair of vessels, with focus on advanced offshore support vessels, offshore windfarm support vessels and vessels for use in fisheries and aquaculture; (c) Havyard MMC, providing equipment and systems for the safe and efficient handling of fish in fishing vessels, live fish carriers and on seafood shore plants; (d) NES Power & Systems, providing diesel electric and hybrid electric propulsion systems. Havila holding (100% owned by the Saevik family) owns 63.48% of Havyard Group ASA (shipbuilding, design and technology) and 50.46% of Havila Holding ASA (offshore support vessel company) (NFD Questionnaire, 2016). In August 2015, the company announced a lay-off of 100 employees due to deteriorating market conditions in the oil industry (Offshore Energy Today, 13 August 2015)
VARD www.vard.com
VARD is one of the major global designers and shipbuilders of offshore and specialized vessels used in the offshore oil and gas exploration and production and oil services industries. Headquartered in Norway VARD operates ten strategically located shipbuilding facilities, including five in Norway, two in Romania, two in Brazil and one in Vietnam. Through its specialized subsidiaries, VARD develops power and automation systems, deck handling equipment, and vessel accommodation solutions, and provides design and engineering services to the global maritime industry. VARD’s long shipbuilding traditions, cutting-edge innovation and technology coupled with its global operations ensure access to the fastest growing oil exploration markets. The Group’s expertise and track record in constructing complex and highly customized offshore and specialized vessels have earned it recognition from industry players and enabled it to build strong relationships with its customers. VARD was listed on the Main Board of the Singapore Exchange on 12 November 2010. Majority shareholder Fincantieri Oil & Gas S.p.A., a wholly owned subsidiary of Fincantieri S.p.A., owns 55.63% in the Group. Headquartered in Trieste, Italy, Fincantieri is one of the world’s largest shipbuilding groups and has, over its 200 years of maritime history, built more than 7,000 vessels.
10,000
Umoe Mandal AS
Umoe Mandal AS is a subsidiary of Umoe AS. Umoe Mandal as owns 100% of the companies Umoe Advanced Composites AS, Umoe Mandal real estate AS and Umoe Mandal Inc.
PEER REVIEW OF THE NORWEGIAN SHIPBUILDING INDUSTRY
17
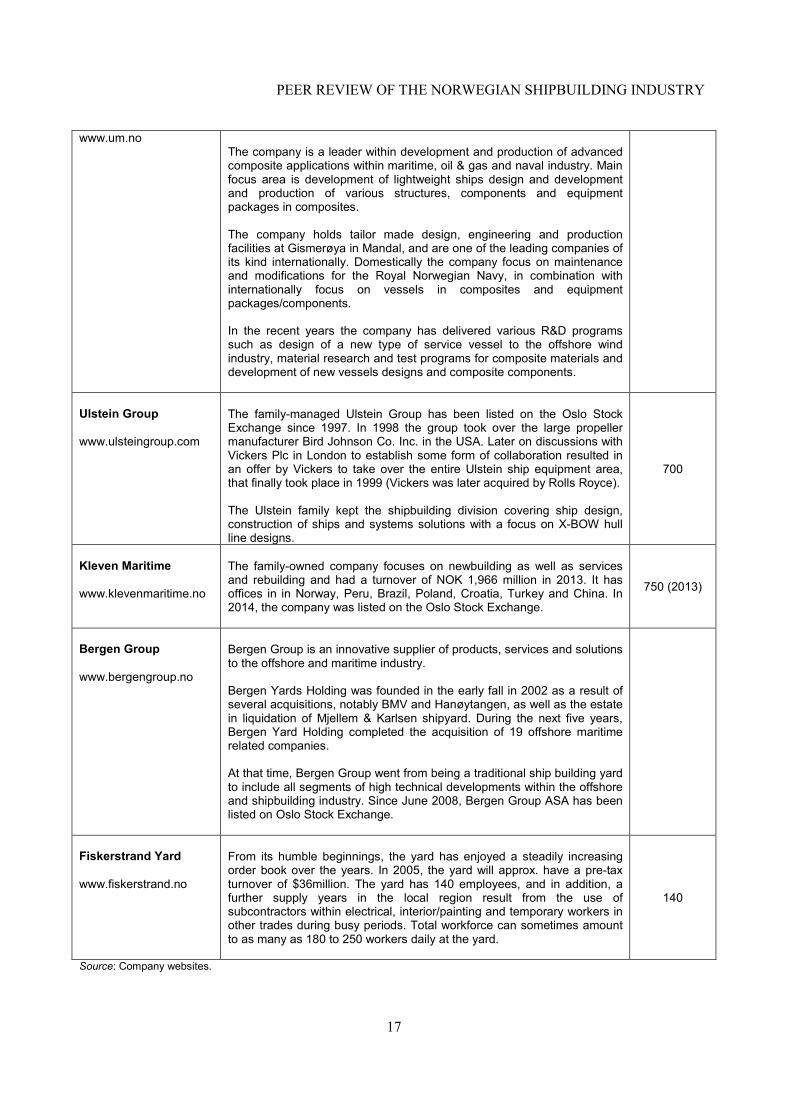
www.um.no
The company is a leader within development and production of advanced composite applications within maritime, oil & gas and naval industry. Main focus area is development of lightweight ships design and development and production of various structures, components and equipment packages in composites. The company holds tailor made design, engineering and production facilities at Gismerøya in Mandal, and are one of the leading companies of its kind internationally. Domestically the company focus on maintenance and modifications for the Royal Norwegian Navy, in combination with internationally focus on vessels in composites and equipment packages/components. In the recent years the company has delivered various R&D programs such as design of a new type of service vessel to the offshore wind industry, material research and test programs for composite materials and development of new vessels designs and composite components.
Ulstein Group www.ulsteingroup.com
The family-managed Ulstein Group has been listed on the Oslo Stock Exchange since 1997. In 1998 the group took over the large propeller manufacturer Bird Johnson Co. Inc. in the USA. Later on discussions with Vickers Plc in London to establish some form of collaboration resulted in an offer by Vickers to take over the entire Ulstein ship equipment area, that finally took place in 1999 (Vickers was later acquired by Rolls Royce). The Ulstein family kept the shipbuilding division covering ship design, construction of ships and systems solutions with a focus on X-BOW hull line designs.
700
Kleven Maritime www.klevenmaritime.no
The family-owned company focuses on newbuilding as well as services and rebuilding and had a turnover of NOK 1,966 million in 2013. It has offices in in Norway, Peru, Brazil, Poland, Croatia, Turkey and China. In 2014, the company was listed on the Oslo Stock Exchange.
750 (2013)
Bergen Group www.bergengroup.no
Bergen Group is an innovative supplier of products, services and solutions to the offshore and maritime industry. Bergen Yards Holding was founded in the early fall in 2002 as a result of several acquisitions, notably BMV and Hanøytangen, as well as the estate in liquidation of Mjellem & Karlsen shipyard. During the next five years, Bergen Yard Holding completed the acquisition of 19 offshore maritime related companies. At that time, Bergen Group went from being a traditional ship building yard to include all segments of high technical developments within the offshore and shipbuilding industry. Since June 2008, Bergen Group ASA has been listed on Oslo Stock Exchange.
Fiskerstrand Yard www.fiskerstrand.no
From its humble beginnings, the yard has enjoyed a steadily increasing order book over the years. In 2005, the yard will approx. have a pre-tax turnover of $36million. The yard has 140 employees, and in addition, a further supply years in the local region result from the use of subcontractors within electrical, interior/painting and temporary workers in other trades during busy periods. Total workforce can sometimes amount to as many as 180 to 250 workers daily at the yard.
140
Source: Company websites.
PEER REVIEW OF THE NORWEGIAN SHIPBUILDING INDUSTRY
18
Employment
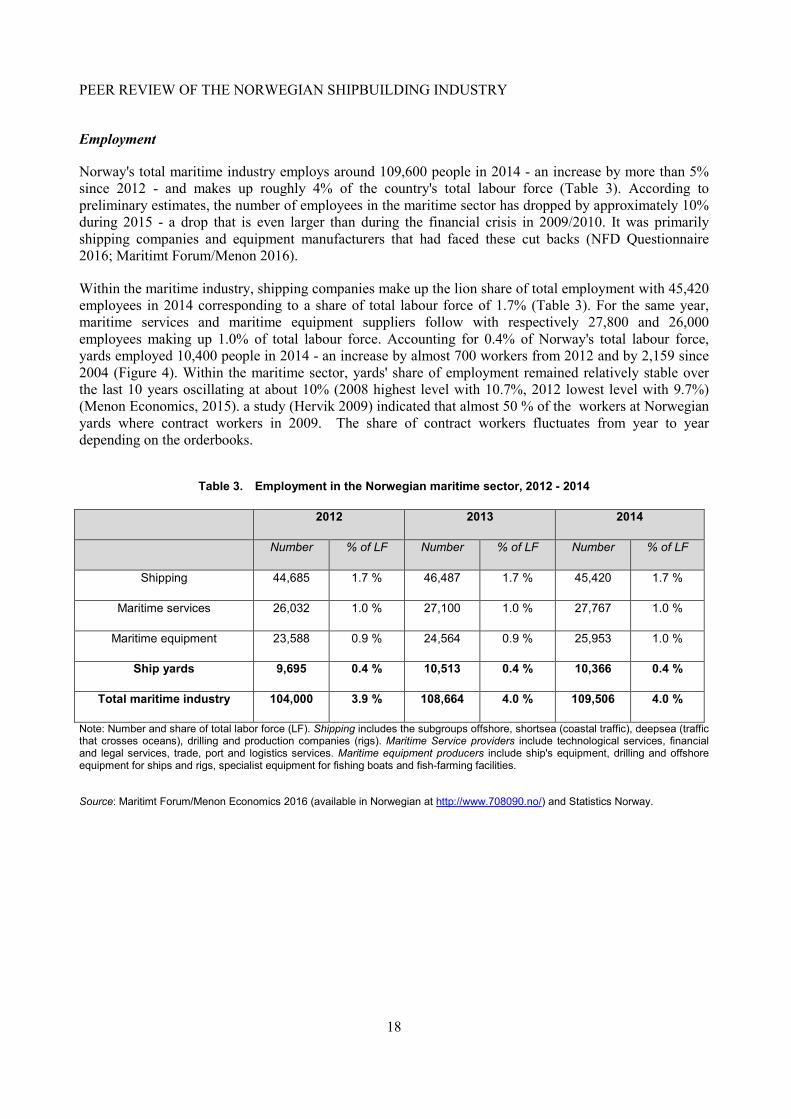
Norway's total maritime industry employs around 109,600 people in 2014 - an increase by more than 5% since 2012 - and makes up roughly 4% of the country's total labour force (Table 3). According to preliminary estimates, the number of employees in the maritime sector has dropped by approximately 10% during 2015 - a drop that is even larger than during the financial crisis in 2009/2010. It was primarily shipping companies and equipment manufacturers that had faced these cut backs (NFD Questionnaire 2016; Maritimt Forum/Menon 2016).
Within the maritime industry, shipping companies make up the lion share of total employment with 45,420 employees in 2014 corresponding to a share of total labour force of 1.7% (Table 3). For the same year, maritime services and maritime equipment suppliers follow with respectively 27,800 and 26,000 employees making up 1.0% of total labour force. Accounting for 0.4% of Norway's total labour force, yards employed 10,400 people in 2014 - an increase by almost 700 workers from 2012 and by 2,159 since 2004 (Figure 4). Within the maritime sector, yards' share of employment remained relatively stable over the last 10 years oscillating at about 10% (2008 highest level with 10.7%, 2012 lowest level with 9.7%) (Menon Economics, 2015). a study (Hervik 2009) indicated that almost 50 % of the workers at Norwegian yards where contract workers in 2009. The share of contract workers fluctuates from year to year depending on the orderbooks.
Table 3. Employment in the Norwegian maritime sector, 2012 - 2014
2012 2013 2014
Number % of LF Number % of LF Number % of LF
Shipping 44,685 1.7 % 46,487 1.7 % 45,420 1.7 %
Maritime services 26,032 1.0 % 27,100 1.0 % 27,767 1.0 %
Maritime equipment 23,588 0.9 % 24,564 0.9 % 25,953 1.0 %
Ship yards 9,695 0.4 % 10,513 0.4 % 10,366 0.4 %
Total maritime industry 104,000 3.9 % 108,664 4.0 % 109,506 4.0 %
Note: Number and share of total labor force (LF). Shipping includes the subgroups offshore, shortsea (coastal traffic), deepsea (traffic that crosses oceans), drilling and production companies (rigs). Maritime Service providers include technological services, financial and legal services, trade, port and logistics services. Maritime equipment producers include ship's equipment, drilling and offshore equipment for ships and rigs, specialist equipment for fishing boats and fish-farming facilities.
Source: Maritimt Forum/Menon Economics 2016 (available in Norwegian at http://www.708090.no/) and Statistics Norway.
PEER REVIEW OF THE NORWEGIAN SHIPBUILDING INDUSTRY
19
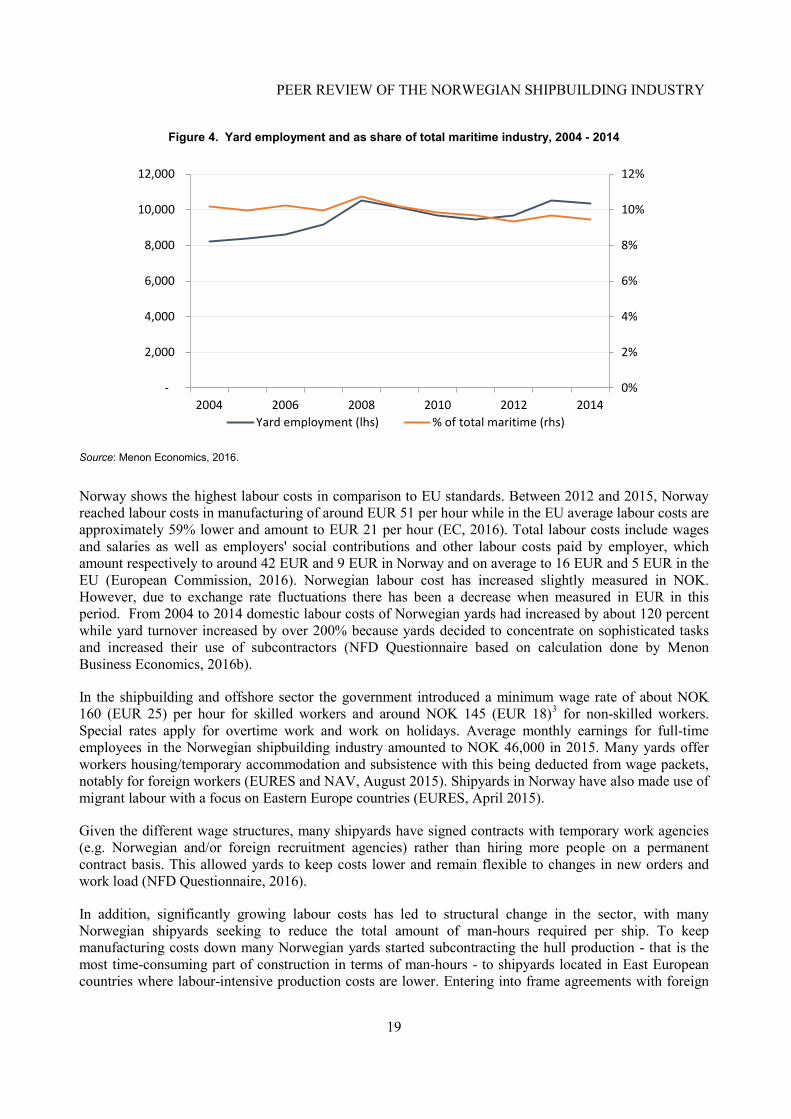
Figure 4. Yard employment and as share of total maritime industry, 2004 - 2014
Source: Menon Economics, 2016.
Norway shows the highest labour costs in comparison to EU standards. Between 2012 and 2015, Norway reached labour costs in manufacturing of around EUR 51 per hour while in the EU average labour costs are approximately 59% lower and amount to EUR 21 per hour (EC, 2016). Total labour costs include wages and salaries as well as employers' social contributions and other labour costs paid by employer, which amount respectively to around 42 EUR and 9 EUR in Norway and on average to 16 EUR and 5 EUR in the EU (European Commission, 2016). Norwegian labour cost has increased slightly measured in NOK. However, due to exchange rate fluctuations there has been a decrease when measured in EUR in this period. From 2004 to 2014 domestic labour costs of Norwegian yards had increased by about 120 percent while yard turnover increased by over 200% because yards decided to concentrate on sophisticated tasks and increased their use of subcontractors (NFD Questionnaire based on calculation done by Menon Business Economics, 2016b).
In the shipbuilding and offshore sector the government introduced a minimum wage rate of about NOK 160 (EUR 25) per hour for skilled workers and around NOK 145 (EUR 18)3 for non-skilled workers. Special rates apply for overtime work and work on holidays. Average monthly earnings for full-time employees in the Norwegian shipbuilding industry amounted to NOK 46,000 in 2015. Many yards offer workers housing/temporary accommodation and subsistence with this being deducted from wage packets, notably for foreign workers (EURES and NAV, August 2015). Shipyards in Norway have also made use of migrant labour with a focus on Eastern Europe countries (EURES, April 2015).
Given the different wage structures, many shipyards have signed contracts with temporary work agencies (e.g. Norwegian and/or foreign recruitment agencies) rather than hiring more people on a permanent contract basis. This allowed yards to keep costs lower and remain flexible to changes in new orders and work load (NFD Questionnaire, 2016).
In addition, significantly growing labour costs has led to structural change in the sector, with many Norwegian shipyards seeking to reduce the total amount of man-hours required per ship. To keep manufacturing costs down many Norwegian yards started subcontracting the hull production - that is the most time-consuming part of construction in terms of man-hours - to shipyards located in East European countries where labour-intensive production costs are lower. Entering into frame agreements with foreign
0%
2%
4%
6%
8%
10%
12%
-
2,000
4,000
6,000
8,000
10,000
12,000
2004 2006 2008 2010 2012 2014Yard employment (lhs) % of total maritime (rhs)
PEER REVIEW OF THE NORWEGIAN SHIPBUILDING INDUSTRY
20
yards enabled Norwegian shipbuilders not only to secure acceptable pricing due to lower production costs but also to ensure required quality levels, adhere to delivery needs and increase yards' production capacity. At the same time, local yards4 have sought to shift to more robotised production technology and innovative management systems in order to increase yard productivity and thereby decreasing unit costs (NFD Questionnaire, 2016).
Technology and Research, Development and Innovation
1. A backbone of the Norwegian shipbuilding industry is its strong focus on innovation in design, engineering and construction of specialized vessels for the offshore sector. These vessels are customised to the needs of the clients. Although this strategy is considered to be very costly the industry has proven to be successful thanks to its innovativeness and its leading position in systems integration (Grabot et al., 2014).
Despite operating in a high-cost country, Norway's shipbuilding industry has a knowledge-based competitive advantage, and can deliver a variety of technology-based products. As described above, the industry is competitive within specialised shipbuilding segments, notably offshore service vessels as well as fishing vessels. Within these segments, the industry exploits its access to competence (i.e. practical experience from the sea and research) to maintain and develop its competitiveness and value creation across all sectors in its maritime industry (NFD Questionnaire, 2016).
Key prerequisites for Norway's leading position as a maritime nation lie on the one hand in the industry's own ability to adapt and innovate, and on the other hand in the public support system focussing on R&D&I, and particularly for environmentally-friendly solutions and offshore (see Section on Government Support). The financing and guarantee schemes available in Norway's industries aim at supporting Norwegian exporters to compete based on price and quality of goods and services rather than on the financing terms that are offered through public export financing schemes (NFD Questionnaire, 2016).
Furthermore, Norway's maritime clusters enable the country to benefit from spill-over effects in technological advancement from other industries (Section "Maritime Clusters"). In these clusters, the industry works closely with research and educational institutions to create innovative technology and solutions (NFD, Questionnaire 2016).
R&D activities
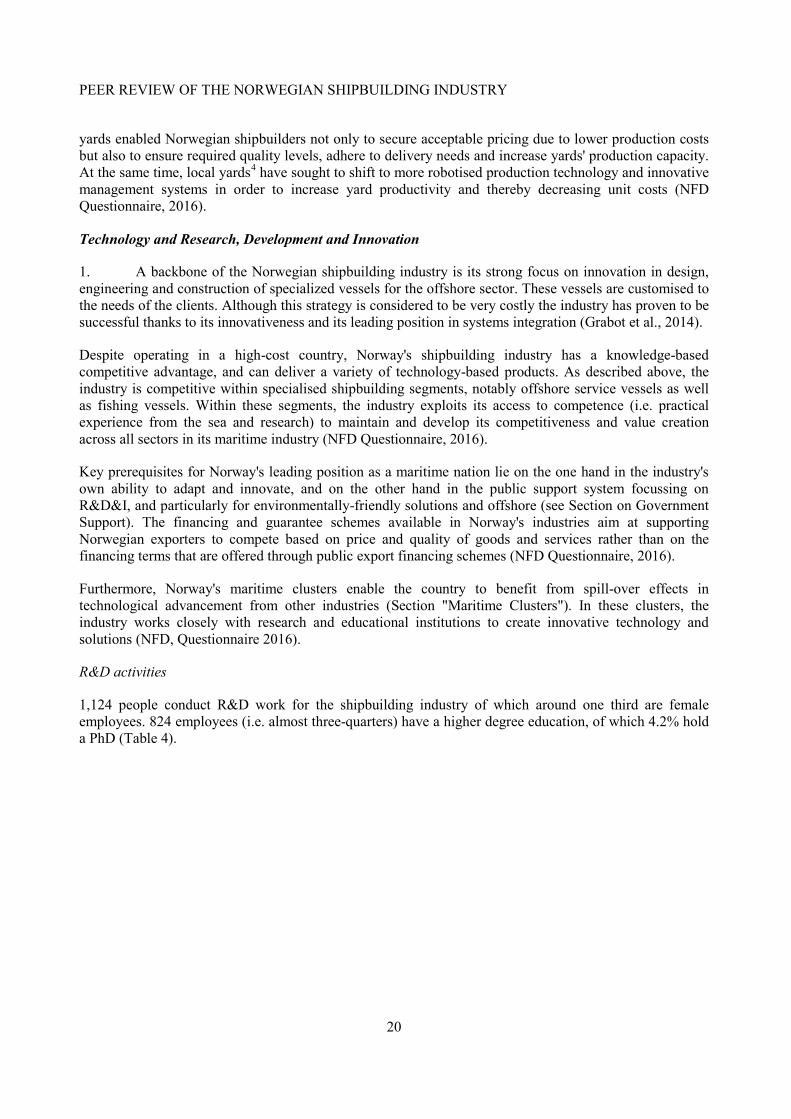
1,124 people conduct R&D work for the shipbuilding industry of which around one third are female employees. 824 employees (i.e. almost three-quarters) have a higher degree education, of which 4.2% hold a PhD (Table 4).
PEER REVIEW OF THE NORWEGIAN SHIPBUILDING INDUSTRY
21
Table 4. R&D institutions and employment in the shipbuilding industry 2010 - 2014
2010 2011 2012 2013 2014
Establishments performing R&D 41 44 45 46 37
R&D personnel (% female)
571 (13.7%)
743 (22.2%)
897 (26.2%)
1119 (27.0%)
1124 (27.1%)
R&D personnel with higher degree education (% PhD)
289 (4.8%)
455 (7.3%)
621 (5.6%)
833 (4.2%)
824 (4.2%)
Note: SIC 2007: C30.1 Building of ships and boats
Source: Statistics Norway (SBB).
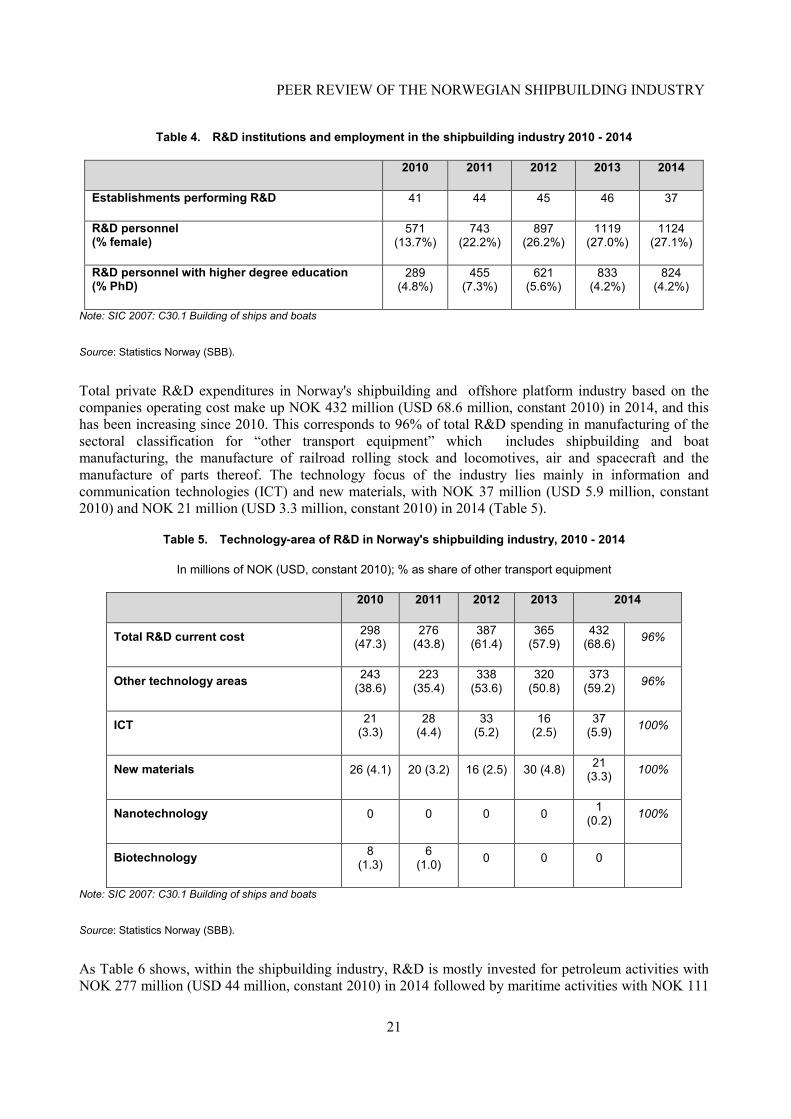
Total private R&D expenditures in Norway's shipbuilding and offshore platform industry based on the companies operating cost make up NOK 432 million (USD 68.6 million, constant 2010) in 2014, and this has been increasing since 2010. This corresponds to 96% of total R&D spending in manufacturing of the sectoral classification for “other transport equipment” which includes shipbuilding and boat manufacturing, the manufacture of railroad rolling stock and locomotives, air and spacecraft and the manufacture of parts thereof. The technology focus of the industry lies mainly in information and communication technologies (ICT) and new materials, with NOK 37 million (USD 5.9 million, constant 2010) and NOK 21 million (USD 3.3 million, constant 2010) in 2014 (Table 5).
Table 5. Technology-area of R&D in Norway's shipbuilding industry, 2010 - 2014
In millions of NOK (USD, constant 2010); % as share of other transport equipment
2010 2011 2012 2013 2014
Total R&D current cost 298 (47.3)
276 (43.8)
387 (61.4)
365 (57.9)
432 (68.6) 96%
Other technology areas 243 (38.6)
223 (35.4)
338 (53.6)
320 (50.8)
373 (59.2) 96%
ICT 21 (3.3)
28 (4.4)
33 (5.2)
16 (2.5)
37 (5.9) 100%
New materials 26 (4.1) 20 (3.2) 16 (2.5) 30 (4.8) 21 (3.3) 100%
Nanotechnology 0 0 0 0 1 (0.2) 100%
Biotechnology 8 (1.3)
6 (1.0) 0 0 0
Note: SIC 2007: C30.1 Building of ships and boats
Source: Statistics Norway (SBB).
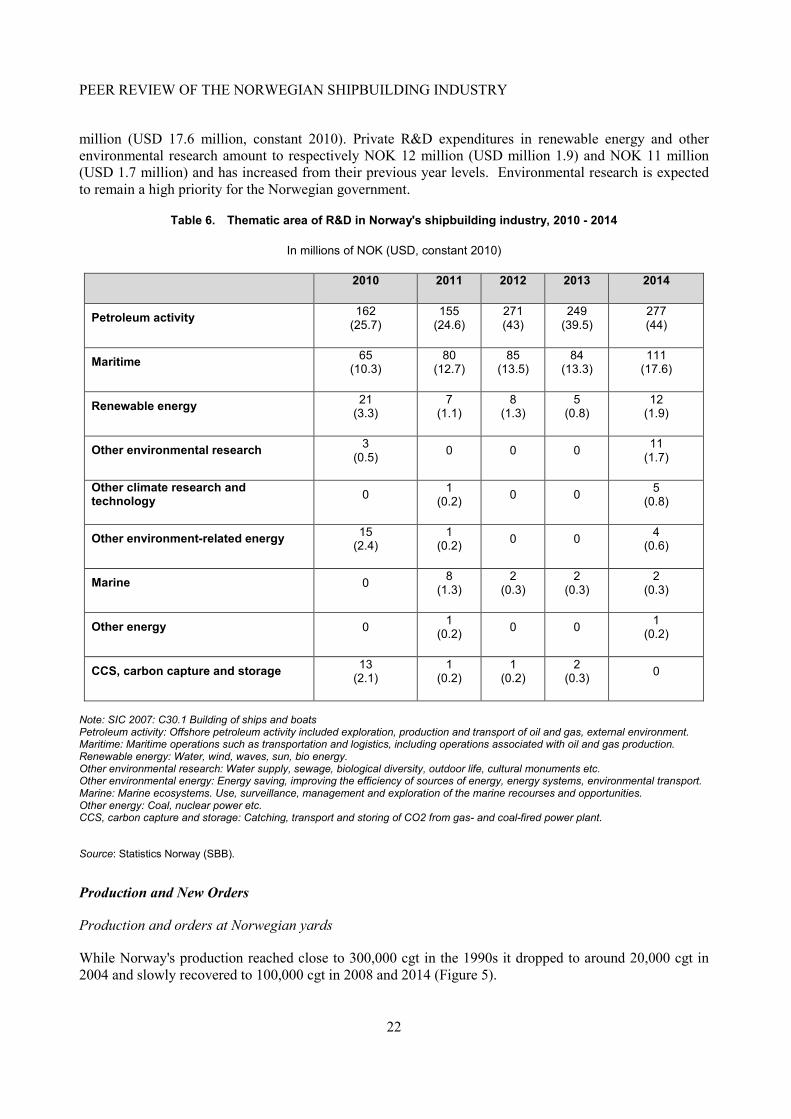
As Table 6 shows, within the shipbuilding industry, R&D is mostly invested for petroleum activities with NOK 277 million (USD 44 million, constant 2010) in 2014 followed by maritime activities with NOK 111
PEER REVIEW OF THE NORWEGIAN SHIPBUILDING INDUSTRY
22
million (USD 17.6 million, constant 2010). Private R&D expenditures in renewable energy and other environmental research amount to respectively NOK 12 million (USD million 1.9) and NOK 11 million (USD 1.7 million) and has increased from their previous year levels. Environmental research is expected to remain a high priority for the Norwegian government.
Table 6. Thematic area of R&D in Norway's shipbuilding industry, 2010 - 2014
In millions of NOK (USD, constant 2010)
2010 2011 2012 2013 2014
Petroleum activity 162 (25.7)
155 (24.6)
271 (43)
249 (39.5)
277 (44)
Maritime 65 (10.3)
80 (12.7)
85 (13.5)
84 (13.3)
111 (17.6)
Renewable energy 21 (3.3)
7 (1.1)
8 (1.3)
5 (0.8)
12 (1.9)
Other environmental research 3 (0.5) 0 0 0 11
(1.7)
Other climate research and technology 0 1
(0.2) 0 0 5 (0.8)
Other environment-related energy 15 (2.4)
1 (0.2) 0 0 4
(0.6)
Marine 0 8 (1.3)
2 (0.3)
2 (0.3)
2 (0.3)
Other energy 0 1 (0.2) 0 0 1
(0.2)
CCS, carbon capture and storage 13 (2.1)
1 (0.2)
1 (0.2)
2 (0.3) 0
Note: SIC 2007: C30.1 Building of ships and boats Petroleum activity: Offshore petroleum activity included exploration, production and transport of oil and gas, external environment. Maritime: Maritime operations such as transportation and logistics, including operations associated with oil and gas production. Renewable energy: Water, wind, waves, sun, bio energy. Other environmental research: Water supply, sewage, biological diversity, outdoor life, cultural monuments etc. Other environmental energy: Energy saving, improving the efficiency of sources of energy, energy systems, environmental transport. Marine: Marine ecosystems. Use, surveillance, management and exploration of the marine recourses and opportunities. Other energy: Coal, nuclear power etc. CCS, carbon capture and storage: Catching, transport and storing of CO2 from gas- and coal-fired power plant.
Source: Statistics Norway (SBB).
Production and New Orders
Production and orders at Norwegian yards
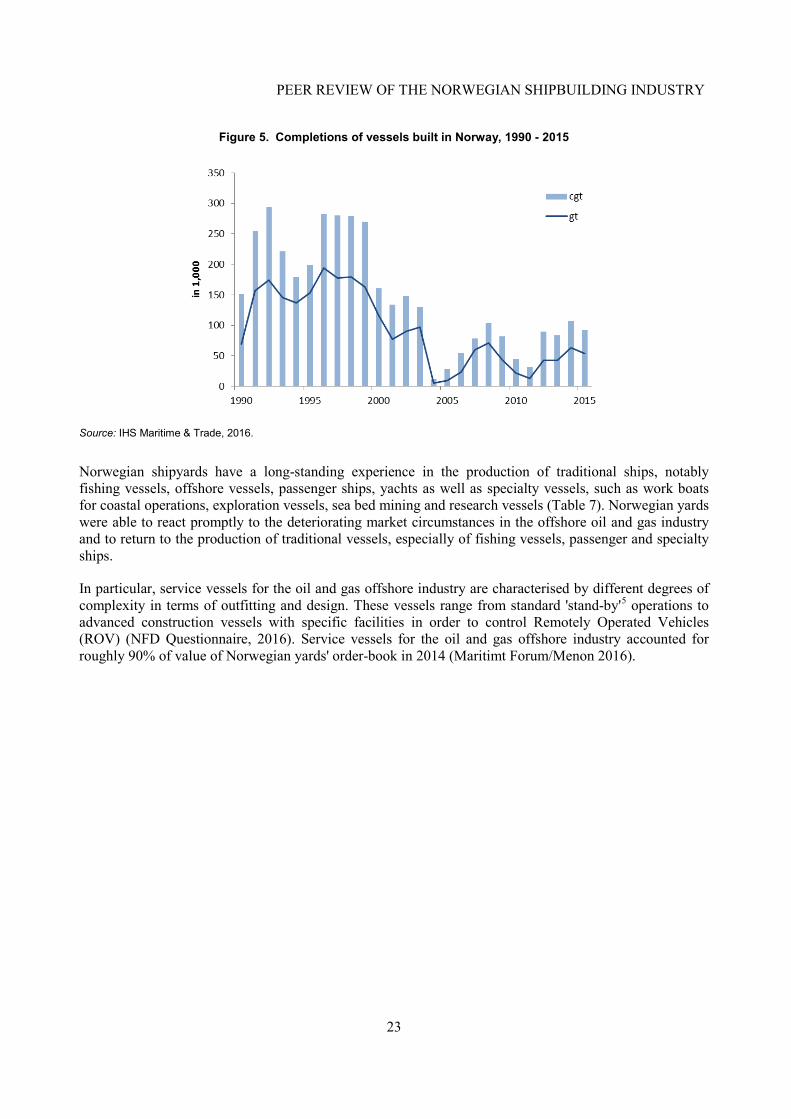
While Norway's production reached close to 300,000 cgt in the 1990s it dropped to around 20,000 cgt in 2004 and slowly recovered to 100,000 cgt in 2008 and 2014 (Figure 5).
PEER REVIEW OF THE NORWEGIAN SHIPBUILDING INDUSTRY
23
Figure 5. Completions of vessels built in Norway, 1990 - 2015
Source: IHS Maritime & Trade, 2016.
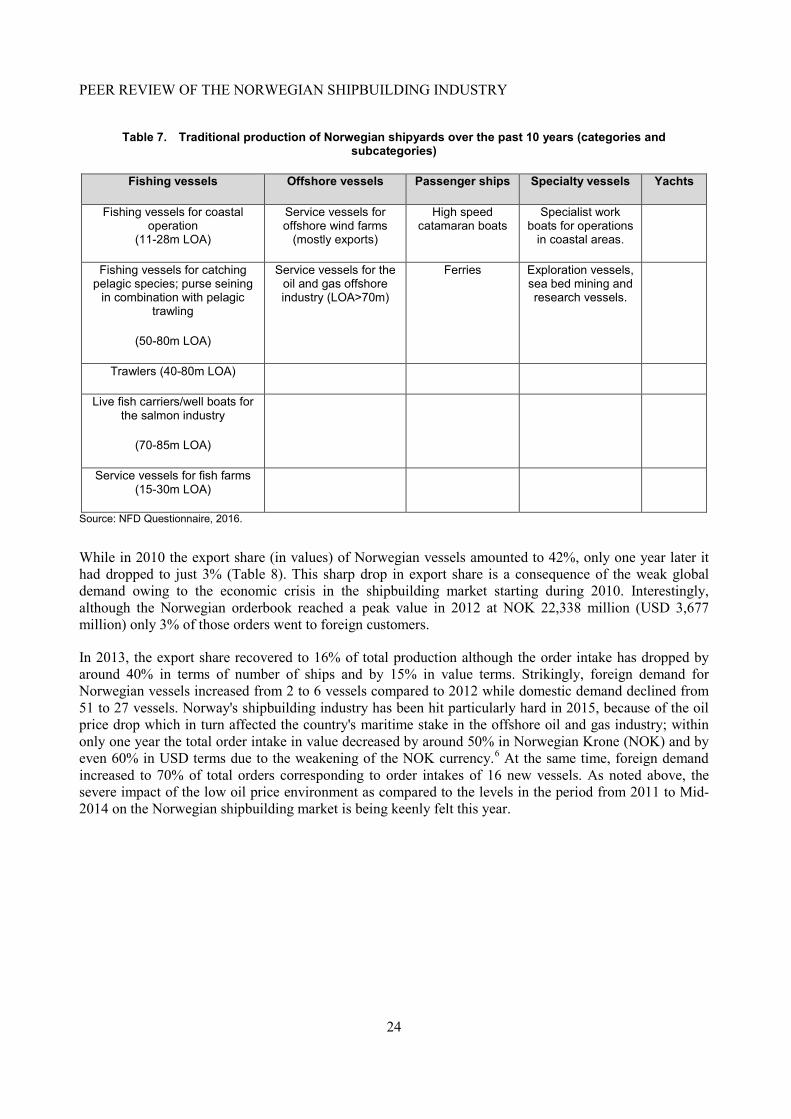
Norwegian shipyards have a long-standing experience in the production of traditional ships, notably fishing vessels, offshore vessels, passenger ships, yachts as well as specialty vessels, such as work boats for coastal operations, exploration vessels, sea bed mining and research vessels (Table 7). Norwegian yards were able to react promptly to the deteriorating market circumstances in the offshore oil and gas industry and to return to the production of traditional vessels, especially of fishing vessels, passenger and specialty ships.
In particular, service vessels for the oil and gas offshore industry are characterised by different degrees of complexity in terms of outfitting and design. These vessels range from standard 'stand-by'5 operations to advanced construction vessels with specific facilities in order to control Remotely Operated Vehicles (ROV) (NFD Questionnaire, 2016). Service vessels for the oil and gas offshore industry accounted for roughly 90% of value of Norwegian yards' order-book in 2014 (Maritimt Forum/Menon 2016).
PEER REVIEW OF THE NORWEGIAN SHIPBUILDING INDUSTRY
24
Table 7. Traditional production of Norwegian shipyards over the past 10 years (categories and subcategories)
Fishing vessels Offshore vessels Passenger ships Specialty vessels Yachts
Fishing vessels for coastal operation
(11-28m LOA)
Service vessels for offshore wind farms
(mostly exports)
High speed catamaran boats
Specialist work boats for operations
in coastal areas.
Fishing vessels for catching pelagic species; purse seining
in combination with pelagic trawling
(50-80m LOA)
Service vessels for the oil and gas offshore industry (LOA>70m)
Ferries Exploration vessels, sea bed mining and research vessels.
Trawlers (40-80m LOA)
Live fish carriers/well boats for the salmon industry
(70-85m LOA)
Service vessels for fish farms (15-30m LOA)
Source: NFD Questionnaire, 2016.
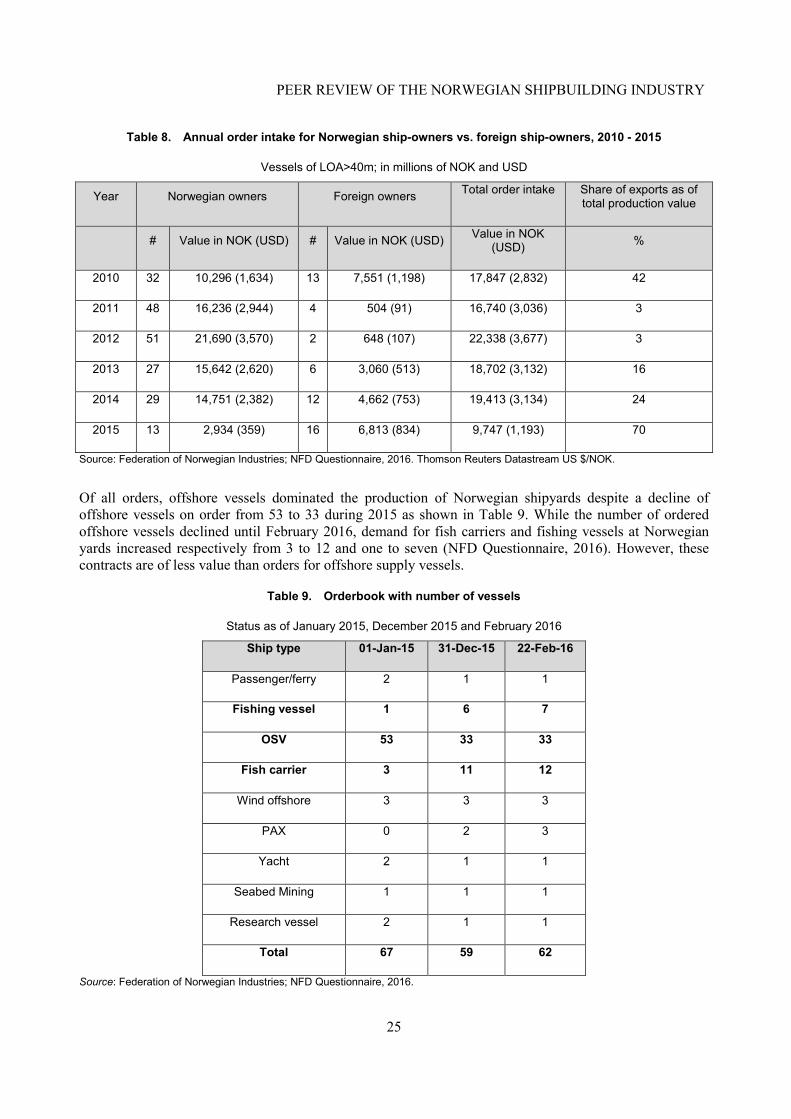
While in 2010 the export share (in values) of Norwegian vessels amounted to 42%, only one year later it had dropped to just 3% (Table 8). This sharp drop in export share is a consequence of the weak global demand owing to the economic crisis in the shipbuilding market starting during 2010. Interestingly, although the Norwegian orderbook reached a peak value in 2012 at NOK 22,338 million (USD 3,677 million) only 3% of those orders went to foreign customers.
In 2013, the export share recovered to 16% of total production although the order intake has dropped by around 40% in terms of number of ships and by 15% in value terms. Strikingly, foreign demand for Norwegian vessels increased from 2 to 6 vessels compared to 2012 while domestic demand declined from 51 to 27 vessels. Norway's shipbuilding industry has been hit particularly hard in 2015, because of the oil price drop which in turn affected the country's maritime stake in the offshore oil and gas industry; within only one year the total order intake in value decreased by around 50% in Norwegian Krone (NOK) and by even 60% in USD terms due to the weakening of the NOK currency.6 At the same time, foreign demand increased to 70% of total orders corresponding to order intakes of 16 new vessels. As noted above, the severe impact of the low oil price environment as compared to the levels in the period from 2011 to Mid-2014 on the Norwegian shipbuilding market is being keenly felt this year.
PEER REVIEW OF THE NORWEGIAN SHIPBUILDING INDUSTRY
25
Table 8. Annual order intake for Norwegian ship-owners vs. foreign ship-owners, 2010 - 2015
Vessels of LOA>40m; in millions of NOK and USD
Year Norwegian owners Foreign owners Total order intake Share of exports as of total production value
# Value in NOK (USD) # Value in NOK (USD) Value in NOK (USD) %
2010 32 10,296 (1,634) 13 7,551 (1,198) 17,847 (2,832) 42
2011 48 16,236 (2,944) 4 504 (91) 16,740 (3,036) 3
2012 51 21,690 (3,570) 2 648 (107) 22,338 (3,677) 3
2013 27 15,642 (2,620) 6 3,060 (513) 18,702 (3,132) 16
2014 29 14,751 (2,382) 12 4,662 (753) 19,413 (3,134) 24
2015 13 2,934 (359) 16 6,813 (834) 9,747 (1,193) 70
Source: Federation of Norwegian Industries; NFD Questionnaire, 2016. Thomson Reuters Datastream US $/NOK.
Of all orders, offshore vessels dominated the production of Norwegian shipyards despite a decline of offshore vessels on order from 53 to 33 during 2015 as shown in Table 9. While the number of ordered offshore vessels declined until February 2016, demand for fish carriers and fishing vessels at Norwegian yards increased respectively from 3 to 12 and one to seven (NFD Questionnaire, 2016). However, these contracts are of less value than orders for offshore supply vessels.
Table 9. Orderbook with number of vessels
Status as of January 2015, December 2015 and February 2016
Ship type 01-Jan-15 31-Dec-15 22-Feb-16
Passenger/ferry 2 1 1
Fishing vessel 1 6 7
OSV 53 33 33
Fish carrier 3 11 12
Wind offshore 3 3 3
PAX 0 2 3
Yacht 2 1 1
Seabed Mining 1 1 1
Research vessel 2 1 1
Total 67 59 62
Source: Federation of Norwegian Industries; NFD Questionnaire, 2016.
PEER REVIEW OF THE NORWEGIAN SHIPBUILDING INDUSTRY
26
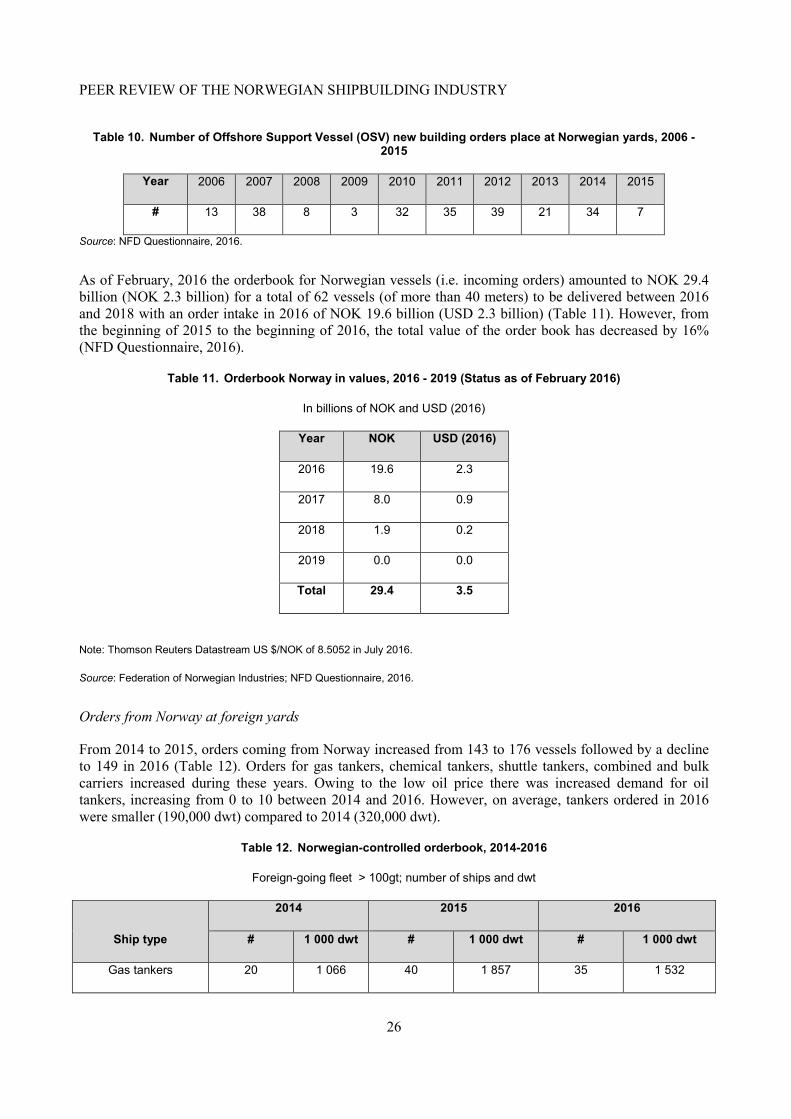
Table 10. Number of Offshore Support Vessel (OSV) new building orders place at Norwegian yards, 2006 - 2015
Year 2006 2007 2008 2009 2010 2011 2012 2013 2014 2015
# 13 38 8 3 32 35 39 21 34 7
Source: NFD Questionnaire, 2016.
As of February, 2016 the orderbook for Norwegian vessels (i.e. incoming orders) amounted to NOK 29.4 billion (NOK 2.3 billion) for a total of 62 vessels (of more than 40 meters) to be delivered between 2016 and 2018 with an order intake in 2016 of NOK 19.6 billion (USD 2.3 billion) (Table 11). However, from the beginning of 2015 to the beginning of 2016, the total value of the order book has decreased by 16% (NFD Questionnaire, 2016).
Table 11. Orderbook Norway in values, 2016 - 2019 (Status as of February 2016)
In billions of NOK and USD (2016)
Year NOK USD (2016)
2016 19.6 2.3
2017 8.0 0.9
2018 1.9 0.2
2019 0.0 0.0
Total 29.4 3.5
Note: Thomson Reuters Datastream US $/NOK of 8.5052 in July 2016.
Source: Federation of Norwegian Industries; NFD Questionnaire, 2016.
Orders from Norway at foreign yards
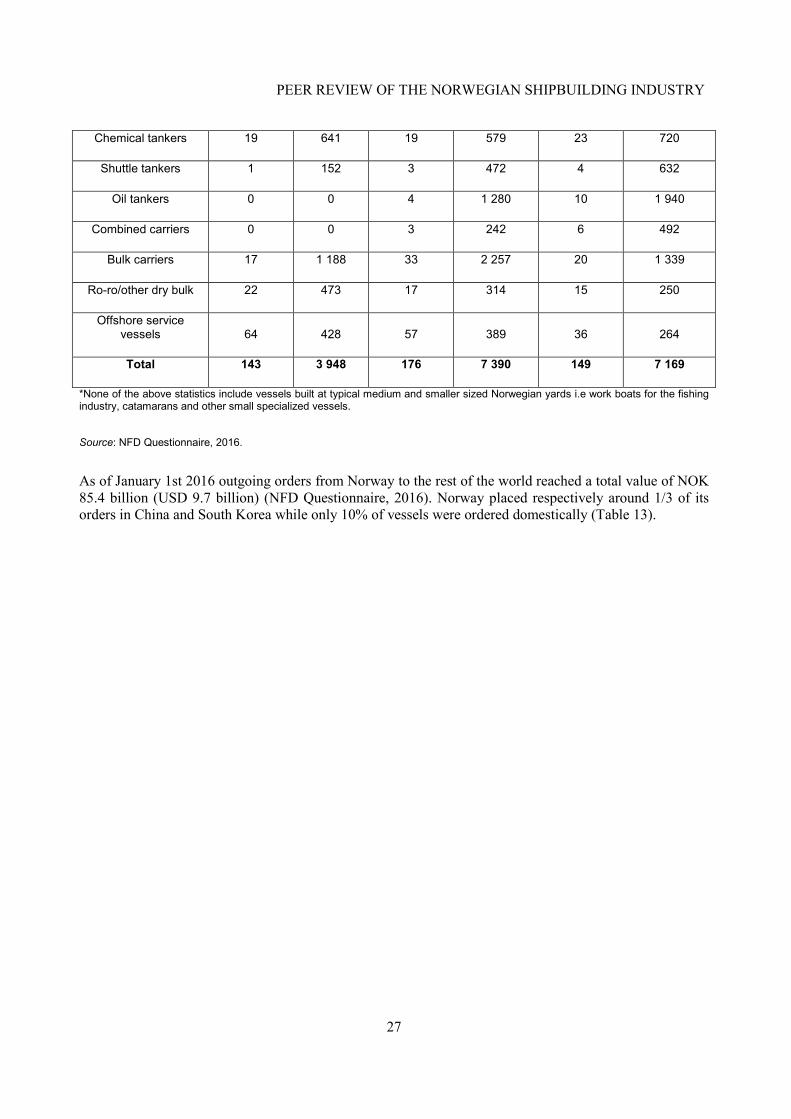
From 2014 to 2015, orders coming from Norway increased from 143 to 176 vessels followed by a decline to 149 in 2016 (Table 12). Orders for gas tankers, chemical tankers, shuttle tankers, combined and bulk carriers increased during these years. Owing to the low oil price there was increased demand for oil tankers, increasing from 0 to 10 between 2014 and 2016. However, on average, tankers ordered in 2016 were smaller (190,000 dwt) compared to 2014 (320,000 dwt).
Table 12. Norwegian-controlled orderbook, 2014-2016
Foreign-going fleet > 100gt; number of ships and dwt
Ship type
2014 2015 2016
# 1 000 dwt # 1 000 dwt # 1 000 dwt
Gas tankers 20 1 066 40 1 857 35 1 532
PEER REVIEW OF THE NORWEGIAN SHIPBUILDING INDUSTRY
27
Chemical tankers 19 641 19 579 23 720
Shuttle tankers 1 152 3 472 4 632
Oil tankers 0 0 4 1 280 10 1 940
Combined carriers 0 0 3 242 6 492
Bulk carriers 17 1 188 33 2 257 20 1 339
Ro-ro/other dry bulk 22 473 17 314 15 250
Offshore service vessels 64 428 57 389 36 264
Total 143 3 948 176 7 390 149 7 169
*None of the above statistics include vessels built at typical medium and smaller sized Norwegian yards i.e work boats for the fishing industry, catamarans and other small specialized vessels.
Source: NFD Questionnaire, 2016.
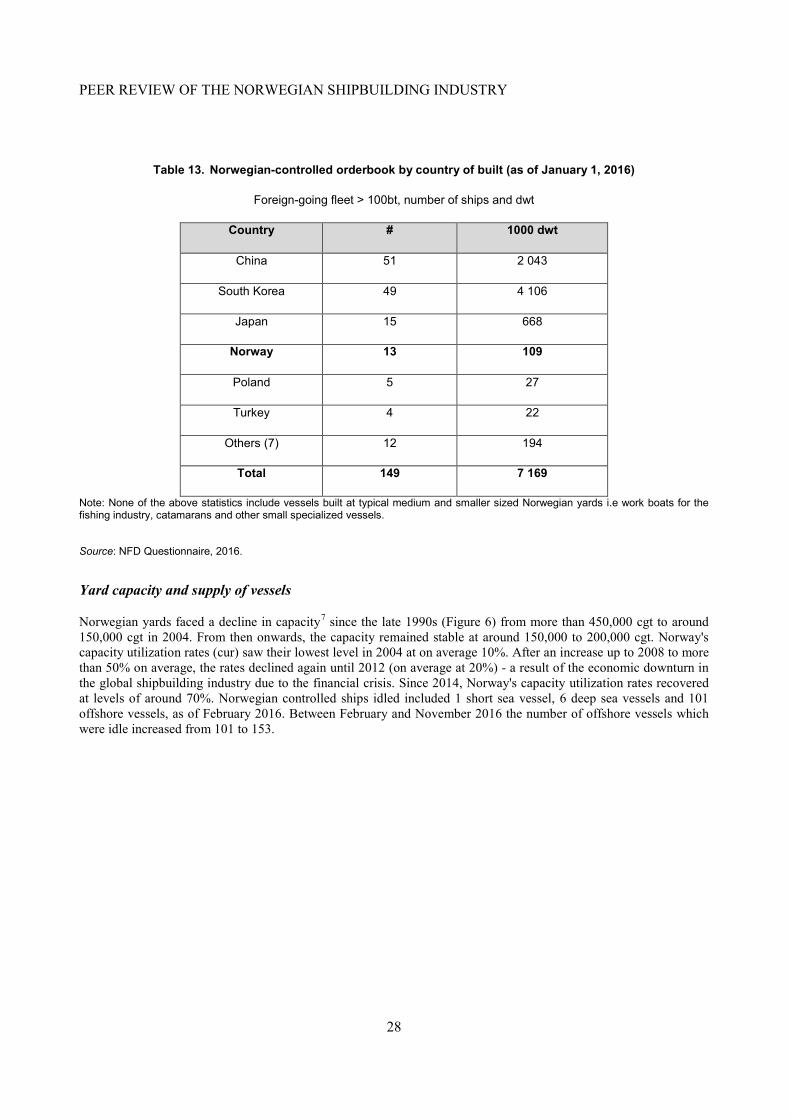
As of January 1st 2016 outgoing orders from Norway to the rest of the world reached a total value of NOK 85.4 billion (USD 9.7 billion) (NFD Questionnaire, 2016). Norway placed respectively around 1/3 of its orders in China and South Korea while only 10% of vessels were ordered domestically (Table 13).
PEER REVIEW OF THE NORWEGIAN SHIPBUILDING INDUSTRY
28
Table 13. Norwegian-controlled orderbook by country of built (as of January 1, 2016)
Foreign-going fleet > 100bt, number of ships and dwt
Country # 1000 dwt
China 51 2 043
South Korea 49 4 106
Japan 15 668
Norway 13 109
Poland 5 27
Turkey 4 22
Others (7) 12 194
Total 149 7 169
Note: None of the above statistics include vessels built at typical medium and smaller sized Norwegian yards i.e work boats for the fishing industry, catamarans and other small specialized vessels.
Source: NFD Questionnaire, 2016.
Yard capacity and supply of vessels
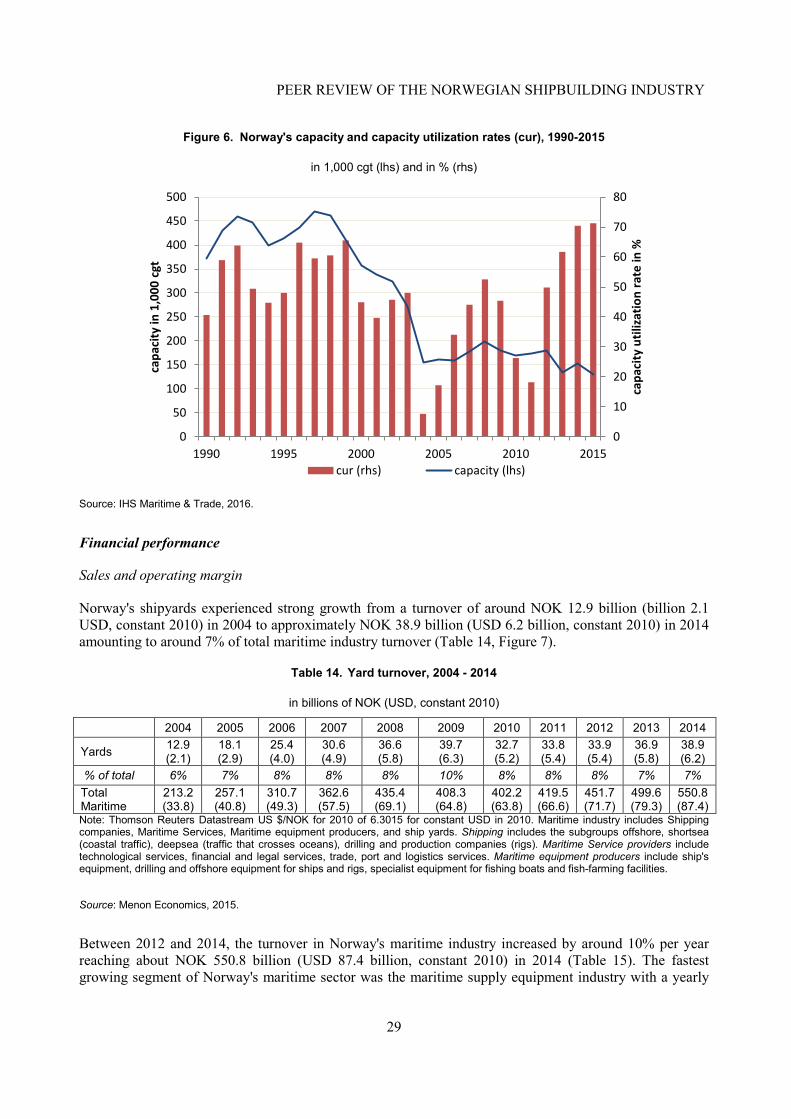
Norwegian yards faced a decline in capacity7 since the late 1990s (Figure 6) from more than 450,000 cgt to around 150,000 cgt in 2004. From then onwards, the capacity remained stable at around 150,000 to 200,000 cgt. Norway's capacity utilization rates (cur) saw their lowest level in 2004 at on average 10%. After an increase up to 2008 to more than 50% on average, the rates declined again until 2012 (on average at 20%) - a result of the economic downturn in the global shipbuilding industry due to the financial crisis. Since 2014, Norway's capacity utilization rates recovered at levels of around 70%. Norwegian controlled ships idled included 1 short sea vessel, 6 deep sea vessels and 101 offshore vessels, as of February 2016. Between February and November 2016 the number of offshore vessels which were idle increased from 101 to 153.
PEER REVIEW OF THE NORWEGIAN SHIPBUILDING INDUSTRY
29
Figure 6. Norway's capacity and capacity utilization rates (cur), 1990-2015
in 1,000 cgt (lhs) and in % (rhs)
Source: IHS Maritime & Trade, 2016.
Financial performance
Sales and operating margin
Norway's shipyards experienced strong growth from a turnover of around NOK 12.9 billion (billion 2.1 USD, constant 2010) in 2004 to approximately NOK 38.9 billion (USD 6.2 billion, constant 2010) in 2014 amounting to around 7% of total maritime industry turnover (Table 14, Figure 7).
Table 14. Yard turnover, 2004 - 2014
in billions of NOK (USD, constant 2010)
2004 2005 2006 2007 2008 2009 2010 2011 2012 2013 2014
Yards 12.9 (2.1)
18.1 (2.9)
25.4 (4.0)
30.6 (4.9)
36.6 (5.8)
39.7 (6.3)
32.7 (5.2)
33.8 (5.4)
33.9 (5.4)
36.9 (5.8)
38.9 (6.2)
% of total 6% 7% 8% 8% 8% 10% 8% 8% 8% 7% 7% Total Maritime
213.2 (33.8)
257.1 (40.8)
310.7 (49.3)
362.6 (57.5)
435.4 (69.1)
408.3 (64.8)
402.2 (63.8)
419.5 (66.6)
451.7 (71.7)
499.6 (79.3)
550.8 (87.4)
Note: Thomson Reuters Datastream US $/NOK for 2010 of 6.3015 for constant USD in 2010. Maritime industry includes Shipping companies, Maritime Services, Maritime equipment producers, and ship yards. Shipping includes the subgroups offshore, shortsea (coastal traffic), deepsea (traffic that crosses oceans), drilling and production companies (rigs). Maritime Service providers include technological services, financial and legal services, trade, port and logistics services. Maritime equipment producers include ship's equipment, drilling and offshore equipment for ships and rigs, specialist equipment for fishing boats and fish-farming facilities.
Source: Menon Economics, 2015.
Between 2012 and 2014, the turnover in Norway's maritime industry increased by around 10% per year reaching about NOK 550.8 billion (USD 87.4 billion, constant 2010) in 2014 (Table 15). The fastest growing segment of Norway's maritime sector was the maritime supply equipment industry with a yearly
0
10
20
30
40
50
60
70
80
0
50
100
150
200
250
300
350
400
450
500
1990 1995 2000 2005 2010 2015
capa
city
util
izat
ion
rate
in %
capa
city
in 1
,000
cgt
cur (rhs) capacity (lhs)
PEER REVIEW OF THE NORWEGIAN SHIPBUILDING INDUSTRY
30
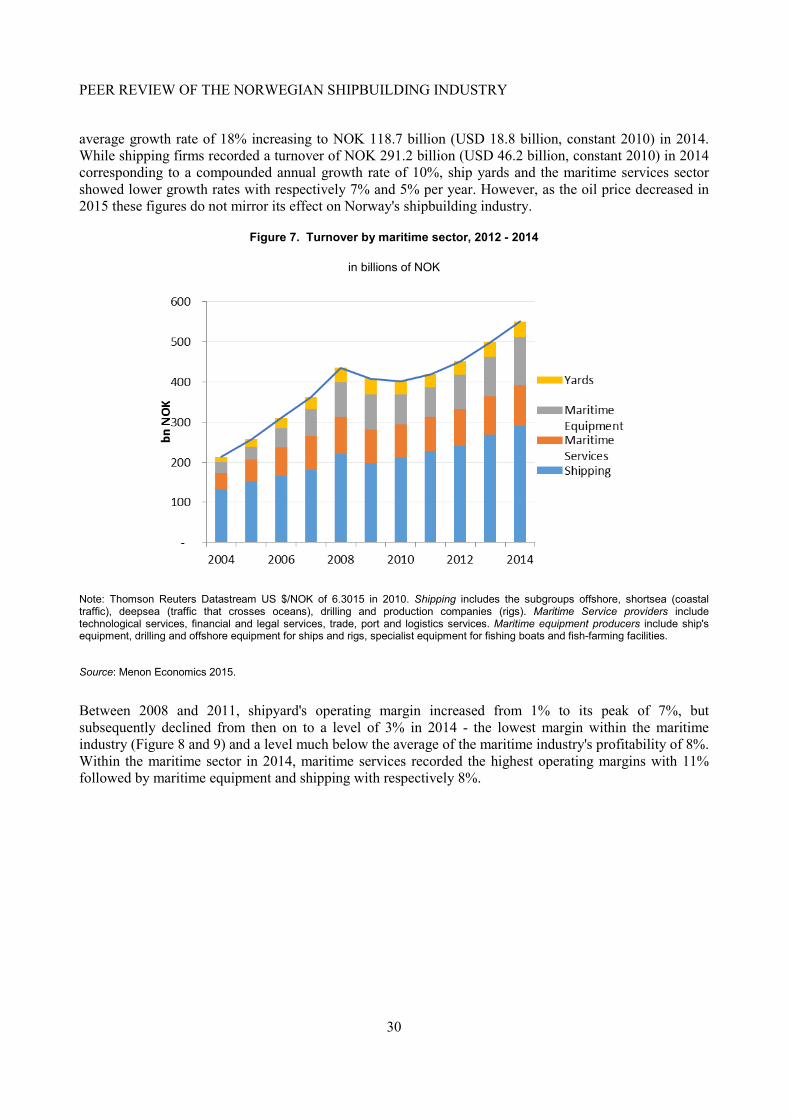
average growth rate of 18% increasing to NOK 118.7 billion (USD 18.8 billion, constant 2010) in 2014. While shipping firms recorded a turnover of NOK 291.2 billion (USD 46.2 billion, constant 2010) in 2014 corresponding to a compounded annual growth rate of 10%, ship yards and the maritime services sector showed lower growth rates with respectively 7% and 5% per year. However, as the oil price decreased in 2015 these figures do not mirror its effect on Norway's shipbuilding industry.
Figure 7. Turnover by maritime sector, 2012 - 2014
in billions of NOK
Note: Thomson Reuters Datastream US $/NOK of 6.3015 in 2010. Shipping includes the subgroups offshore, shortsea (coastal traffic), deepsea (traffic that crosses oceans), drilling and production companies (rigs). Maritime Service providers include technological services, financial and legal services, trade, port and logistics services. Maritime equipment producers include ship's equipment, drilling and offshore equipment for ships and rigs, specialist equipment for fishing boats and fish-farming facilities.
Source: Menon Economics 2015.
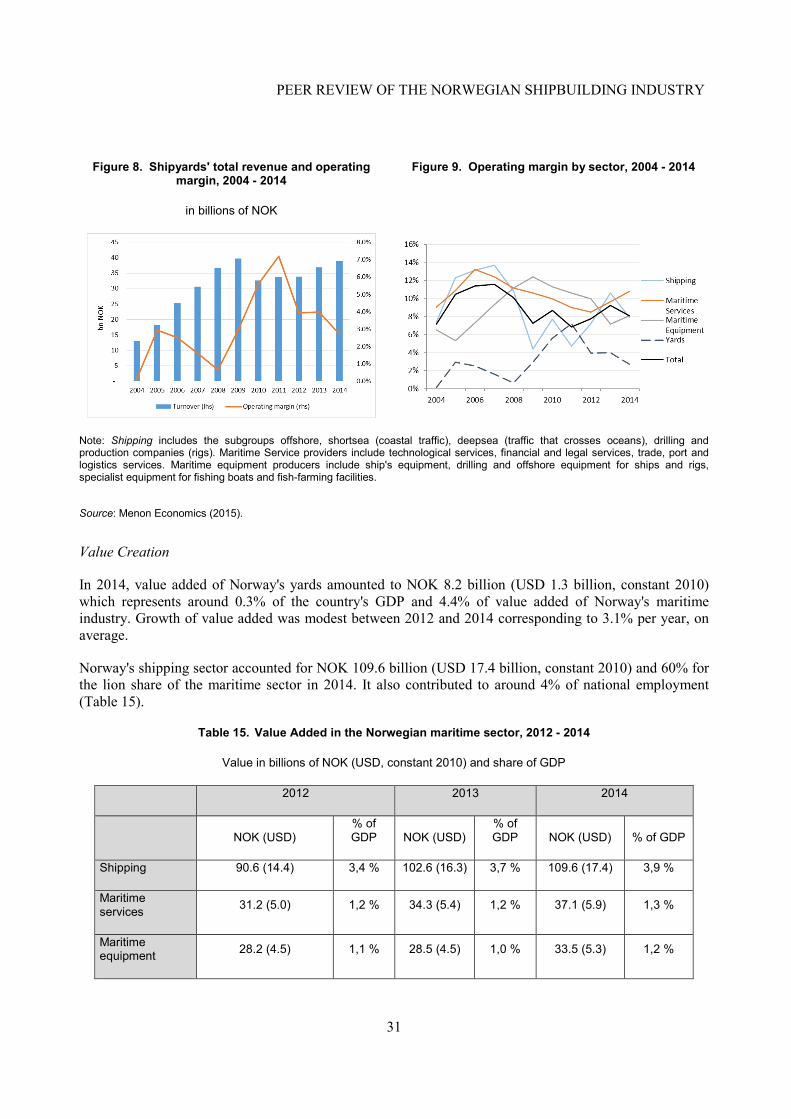
Between 2008 and 2011, shipyard's operating margin increased from 1% to its peak of 7%, but subsequently declined from then on to a level of 3% in 2014 - the lowest margin within the maritime industry (Figure 8 and 9) and a level much below the average of the maritime industry's profitability of 8%. Within the maritime sector in 2014, maritime services recorded the highest operating margins with 11% followed by maritime equipment and shipping with respectively 8%.
PEER REVIEW OF THE NORWEGIAN SHIPBUILDING INDUSTRY
31
Figure 8. Shipyards' total revenue and operating margin, 2004 - 2014
in billions of NOK
Figure 9. Operating margin by sector, 2004 - 2014
Note: Shipping includes the subgroups offshore, shortsea (coastal traffic), deepsea (traffic that crosses oceans), drilling and production companies (rigs). Maritime Service providers include technological services, financial and legal services, trade, port and logistics services. Maritime equipment producers include ship's equipment, drilling and offshore equipment for ships and rigs, specialist equipment for fishing boats and fish-farming facilities.
Source: Menon Economics (2015).
Value Creation
In 2014, value added of Norway's yards amounted to NOK 8.2 billion (USD 1.3 billion, constant 2010) which represents around 0.3% of the country's GDP and 4.4% of value added of Norway's maritime industry. Growth of value added was modest between 2012 and 2014 corresponding to 3.1% per year, on average.
Norway's shipping sector accounted for NOK 109.6 billion (USD 17.4 billion, constant 2010) and 60% for the lion share of the maritime sector in 2014. It also contributed to around 4% of national employment (Table 15).
Table 15. Value Added in the Norwegian maritime sector, 2012 - 2014
Value in billions of NOK (USD, constant 2010) and share of GDP
2012 2013 2014
NOK (USD)
% of GDP NOK (USD)
% of GDP NOK (USD) % of GDP
Shipping 90.6 (14.4) 3,4 % 102.6 (16.3) 3,7 % 109.6 (17.4) 3,9 %
Maritime services 31.2 (5.0) 1,2 % 34.3 (5.4) 1,2 % 37.1 (5.9) 1,3 %
Maritime equipment 28.2 (4.5) 1,1 % 28.5 (4.5) 1,0 % 33.5 (5.3) 1,2 %
PEER REVIEW OF THE NORWEGIAN SHIPBUILDING INDUSTRY
32
Yards 7.7 (1.2) 0,3 % 8.4 (1.3) 0,3 % 8.2 (1.3) 0,3 %
Total maritime industry 157.7 (25.0) 5,9 % 173.8 (27.6) 6,3 % 188.4 (29.9) 6,7 %
Note: Shipping includes the subgroups offshore, shortsea (coastal traffic), deepsea (traffic that crosses oceans), drilling and production companies (rigs). Maritime Service providers include technological services, financial and legal services, trade, port and logistics services. Maritime equipment producers include ship's equipment, drilling and offshore equipment for ships and rigs, specialist equipment for fishing boats and fish-farming facilities.
Source: Maritimt Forum/Menon 2016 and Statistics Norway
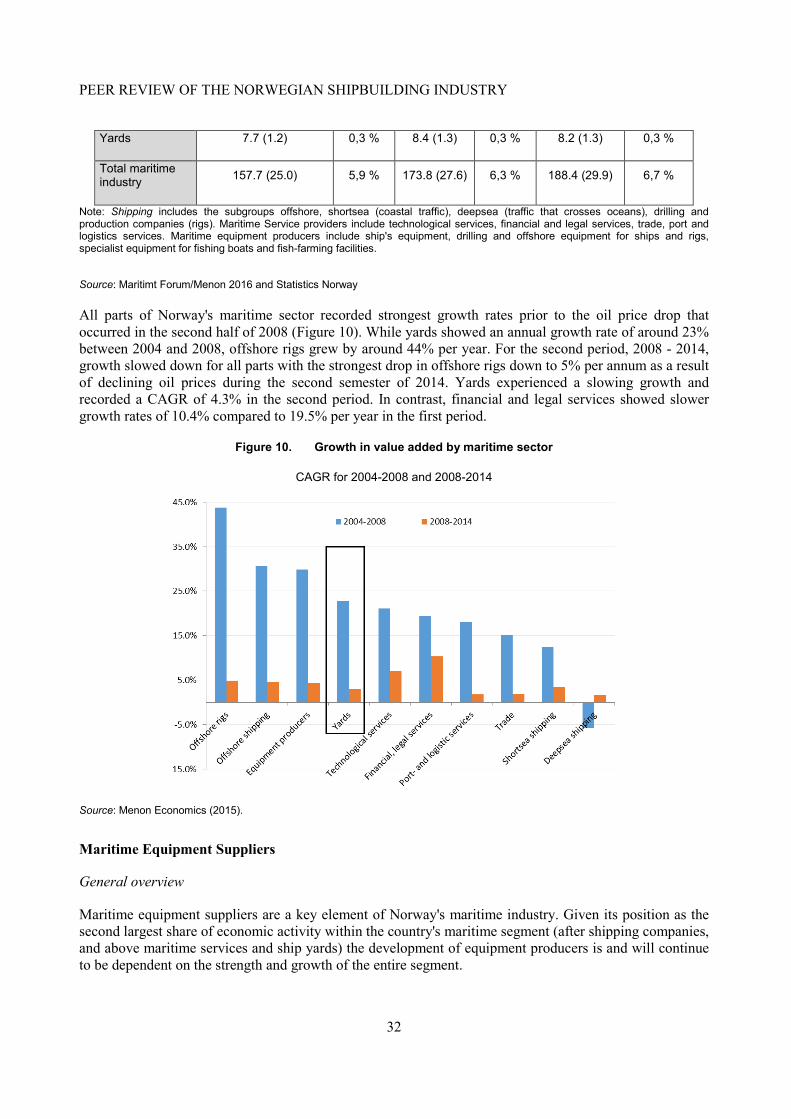
All parts of Norway's maritime sector recorded strongest growth rates prior to the oil price drop that occurred in the second half of 2008 (Figure 10). While yards showed an annual growth rate of around 23% between 2004 and 2008, offshore rigs grew by around 44% per year. For the second period, 2008 - 2014, growth slowed down for all parts with the strongest drop in offshore rigs down to 5% per annum as a result of declining oil prices during the second semester of 2014. Yards experienced a slowing growth and recorded a CAGR of 4.3% in the second period. In contrast, financial and legal services showed slower growth rates of 10.4% compared to 19.5% per year in the first period.
Figure 10. Growth in value added by maritime sector
CAGR for 2004-2008 and 2008-2014
Source: Menon Economics (2015).
Maritime Equipment Suppliers
General overview
Maritime equipment suppliers are a key element of Norway's maritime industry. Given its position as the second largest share of economic activity within the country's maritime segment (after shipping companies, and above maritime services and ship yards) the development of equipment producers is and will continue to be dependent on the strength and growth of the entire segment.
PEER REVIEW OF THE NORWEGIAN SHIPBUILDING INDUSTRY
33
The industry is mainly located along Norway's coastline and is the main factor of wealth creation in the local economy for certain coastal communities (Norsk Industri, 2015) - thereby representing an important source of employment.
As a general understanding, maritime equipment suppliers are defined as "all businesses that own, operate, design, build, supply equipment or specialist services to all types of ships and other floating entities" (Norsk Industri, 2015) and covers producers of:
• ships' equipment o mechanical equipment (e.g. supplier of cranes winches, propellers and engines) o electrical and electronic equipment (e.g. specialist hardware, software, electrical
propulsion systems, bridge equipment or dynamic positioning systems) o design companies o other operating equipment (e.g. suppliers of marine paint, lubricants, cables, chains,
lifeboats) o trade of ship equipment
• drilling and offshore equipment for ships and rigs (e.g. blow out preventer, drill bits, risers)
• specialised equipment for fishing boats and fish-farming facilities.
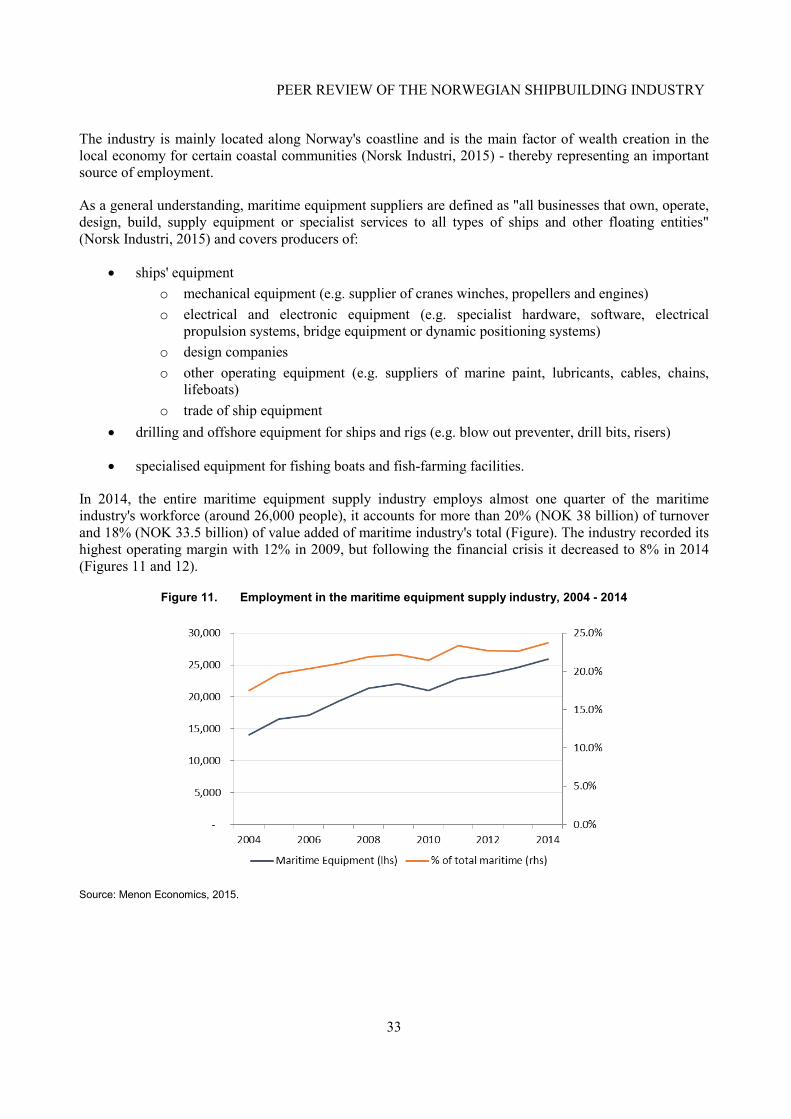
In 2014, the entire maritime equipment supply industry employs almost one quarter of the maritime industry's workforce (around 26,000 people), it accounts for more than 20% (NOK 38 billion) of turnover and 18% (NOK 33.5 billion) of value added of maritime industry's total (Figure). The industry recorded its highest operating margin with 12% in 2009, but following the financial crisis it decreased to 8% in 2014 (Figures 11 and 12).
Figure 11. Employment in the maritime equipment supply industry, 2004 - 2014
Source: Menon Economics, 2015.
PEER REVIEW OF THE NORWEGIAN SHIPBUILDING INDUSTRY
34
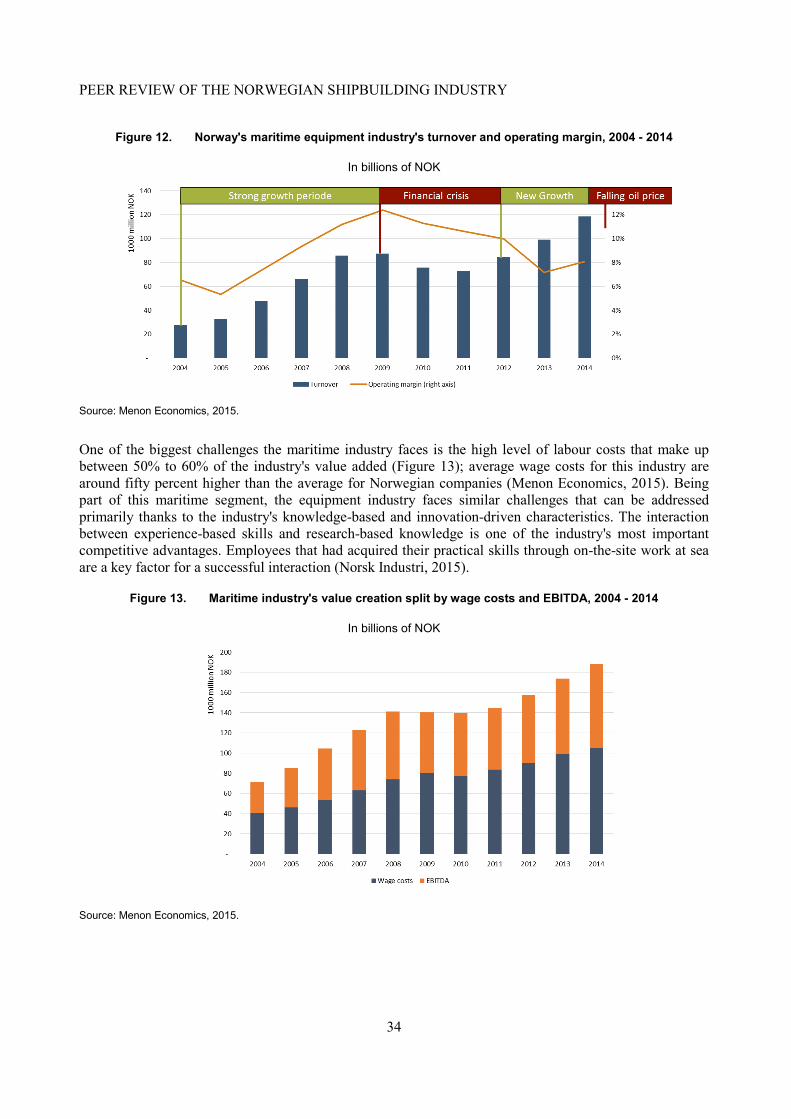
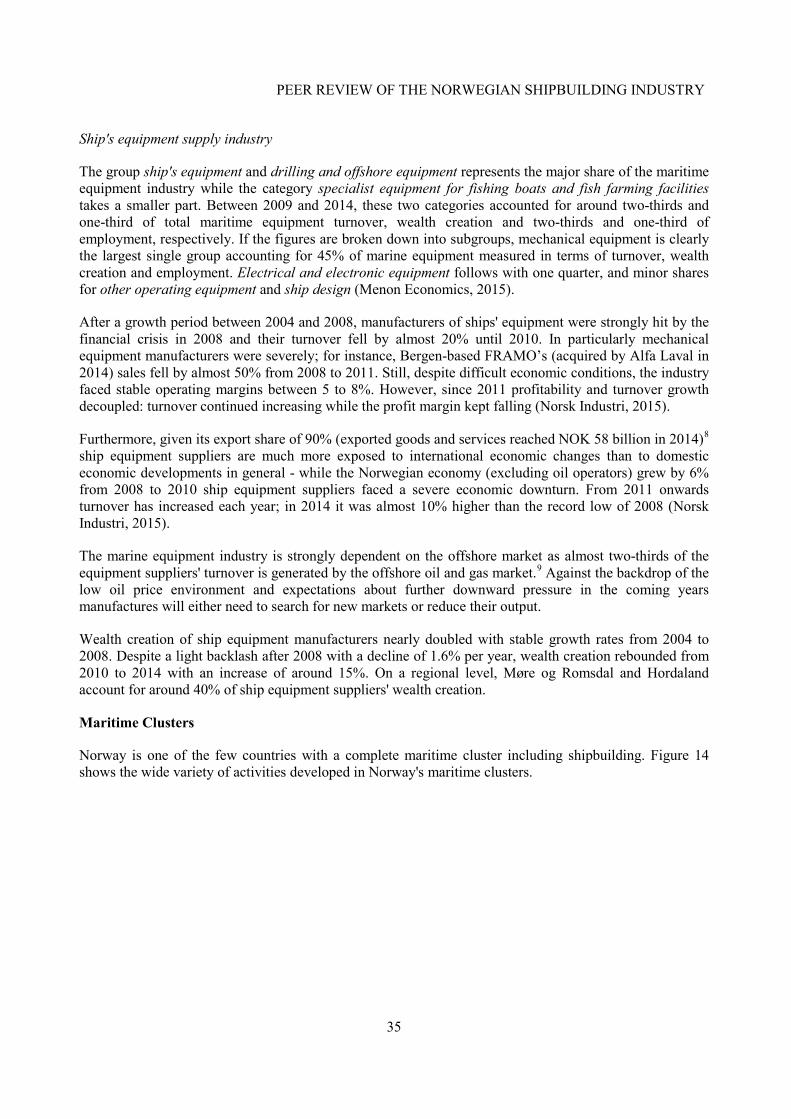
Figure 12. Norway's maritime equipment industry's turnover and operating margin, 2004 - 2014
In billions of NOK
Source: Menon Economics, 2015.
One of the biggest challenges the maritime industry faces is the high level of labour costs that make up between 50% to 60% of the industry's value added (Figure 13); average wage costs for this industry are around fifty percent higher than the average for Norwegian companies (Menon Economics, 2015). Being part of this maritime segment, the equipment industry faces similar challenges that can be addressed primarily thanks to the industry's knowledge-based and innovation-driven characteristics. The interaction between experience-based skills and research-based knowledge is one of the industry's most important competitive advantages. Employees that had acquired their practical skills through on-the-site work at sea are a key factor for a successful interaction (Norsk Industri, 2015).
Figure 13. Maritime industry's value creation split by wage costs and EBITDA, 2004 - 2014
In billions of NOK
Source: Menon Economics, 2015.
PEER REVIEW OF THE NORWEGIAN SHIPBUILDING INDUSTRY
35
Ship's equipment supply industry
The group ship's equipment and drilling and offshore equipment represents the major share of the maritime equipment industry while the category specialist equipment for fishing boats and fish farming facilities takes a smaller part. Between 2009 and 2014, these two categories accounted for around two-thirds and one-third of total maritime equipment turnover, wealth creation and two-thirds and one-third of employment, respectively. If the figures are broken down into subgroups, mechanical equipment is clearly the largest single group accounting for 45% of marine equipment measured in terms of turnover, wealth creation and employment. Electrical and electronic equipment follows with one quarter, and minor shares for other operating equipment and ship design (Menon Economics, 2015).
After a growth period between 2004 and 2008, manufacturers of ships' equipment were strongly hit by the financial crisis in 2008 and their turnover fell by almost 20% until 2010. In particularly mechanical equipment manufacturers were severely; for instance, Bergen-based FRAMO’s (acquired by Alfa Laval in 2014) sales fell by almost 50% from 2008 to 2011. Still, despite difficult economic conditions, the industry faced stable operating margins between 5 to 8%. However, since 2011 profitability and turnover growth decoupled: turnover continued increasing while the profit margin kept falling (Norsk Industri, 2015).
Furthermore, given its export share of 90% (exported goods and services reached NOK 58 billion in 2014)8 ship equipment suppliers are much more exposed to international economic changes than to domestic economic developments in general - while the Norwegian economy (excluding oil operators) grew by 6% from 2008 to 2010 ship equipment suppliers faced a severe economic downturn. From 2011 onwards turnover has increased each year; in 2014 it was almost 10% higher than the record low of 2008 (Norsk Industri, 2015).
The marine equipment industry is strongly dependent on the offshore market as almost two-thirds of the equipment suppliers' turnover is generated by the offshore oil and gas market.9 Against the backdrop of the low oil price environment and expectations about further downward pressure in the coming years manufactures will either need to search for new markets or reduce their output.
Wealth creation of ship equipment manufacturers nearly doubled with stable growth rates from 2004 to 2008. Despite a light backlash after 2008 with a decline of 1.6% per year, wealth creation rebounded from 2010 to 2014 with an increase of around 15%. On a regional level, Møre og Romsdal and Hordaland account for around 40% of ship equipment suppliers' wealth creation.
Maritime Clusters
Norway is one of the few countries with a complete maritime cluster including shipbuilding. Figure 14 shows the wide variety of activities developed in Norway's maritime clusters.
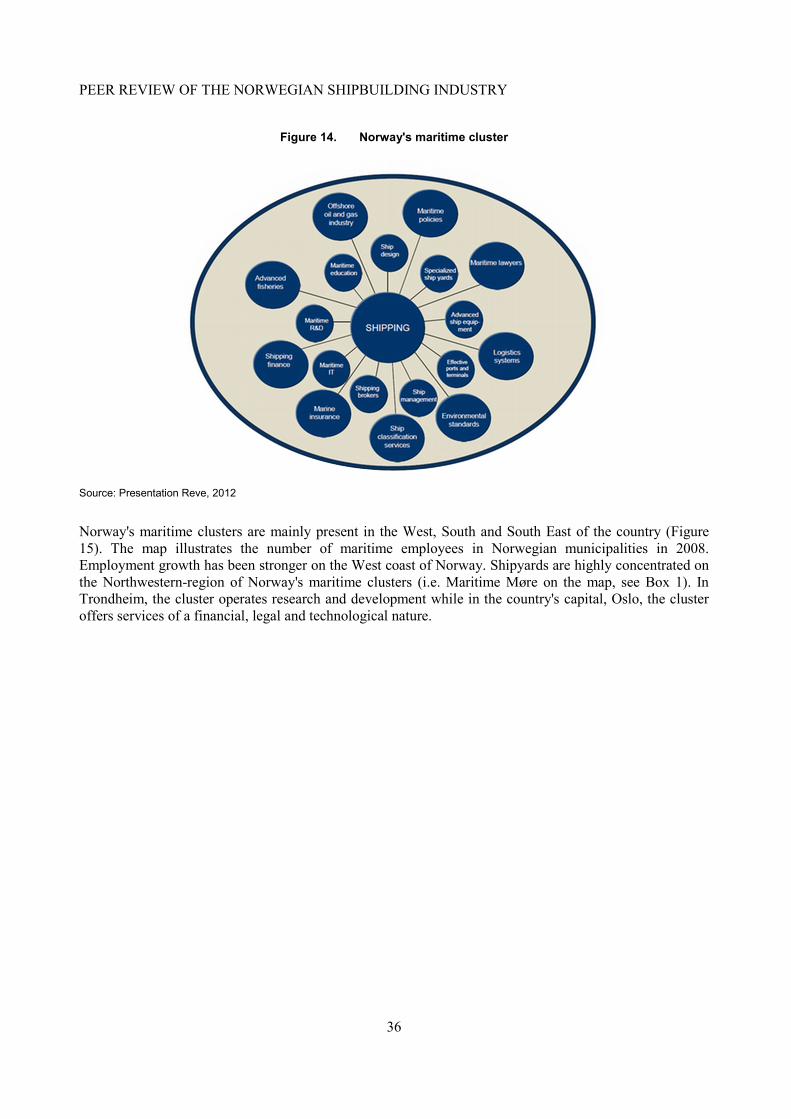
PEER REVIEW OF THE NORWEGIAN SHIPBUILDING INDUSTRY
36
Figure 14. Norway's maritime cluster
Source: Presentation Reve, 2012
Norway's maritime clusters are mainly present in the West, South and South East of the country (Figure 15). The map illustrates the number of maritime employees in Norwegian municipalities in 2008. Employment growth has been stronger on the West coast of Norway. Shipyards are highly concentrated on the Northwestern-region of Norway's maritime clusters (i.e. Maritime Møre on the map, see Box 1). In Trondheim, the cluster operates research and development while in the country's capital, Oslo, the cluster offers services of a financial, legal and technological nature.
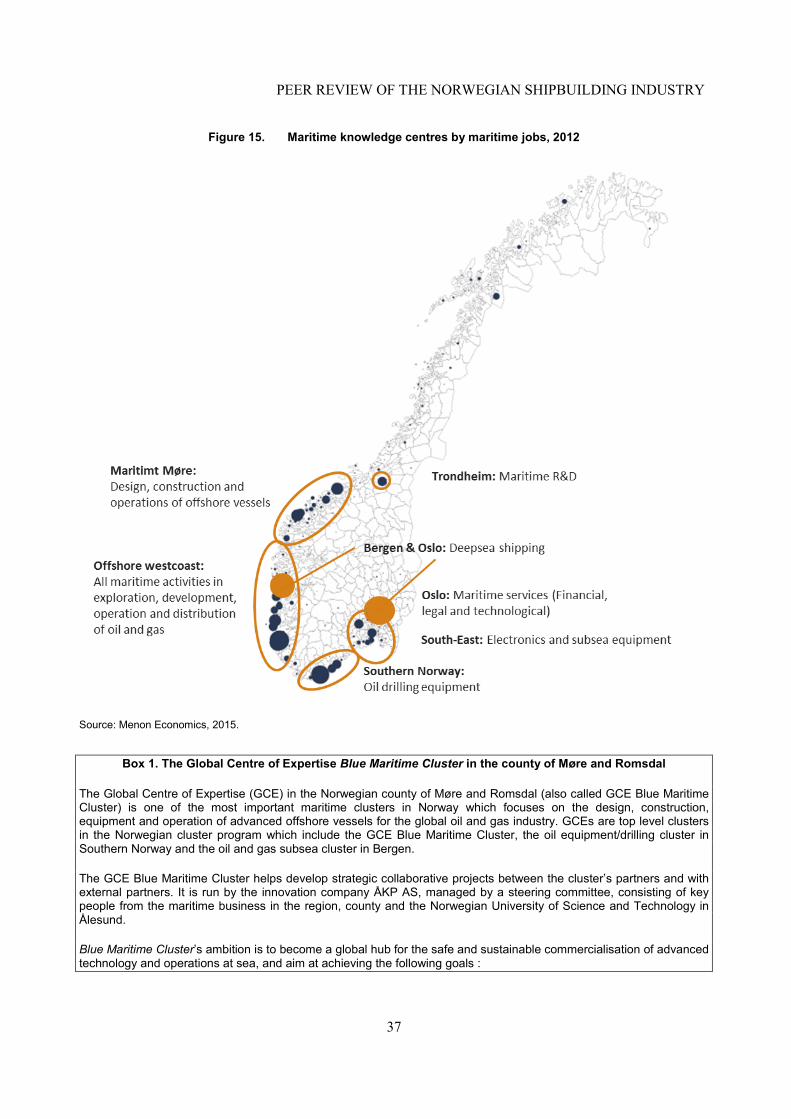
PEER REVIEW OF THE NORWEGIAN SHIPBUILDING INDUSTRY
37
Figure 15. Maritime knowledge centres by maritime jobs, 2012
Source: Menon Economics, 2015.
Box 1. The Global Centre of Expertise Blue Maritime Cluster in the county of Møre and Romsdal
The Global Centre of Expertise (GCE) in the Norwegian county of Møre and Romsdal (also called GCE Blue Maritime Cluster) is one of the most important maritime clusters in Norway which focuses on the design, construction, equipment and operation of advanced offshore vessels for the global oil and gas industry. GCEs are top level clusters in the Norwegian cluster program which include the GCE Blue Maritime Cluster, the oil equipment/drilling cluster in Southern Norway and the oil and gas subsea cluster in Bergen.
The GCE Blue Maritime Cluster helps develop strategic collaborative projects between the cluster’s partners and with external partners. It is run by the innovation company ÅKP AS, managed by a steering committee, consisting of key people from the maritime business in the region, county and the Norwegian University of Science and Technology in Ålesund.
Blue Maritime Cluster’s ambition is to become a global hub for the safe and sustainable commercialisation of advanced technology and operations at sea, and aim at achieving the following goals :
PEER REVIEW OF THE NORWEGIAN SHIPBUILDING INDUSTRY
38
• Be Norway's central hub for commercial and sustainable 'blue' activities.
• Contribute to make 'the blue' Norway's new growth industry.
• Seize and exploit new 'blue' opportunities through high innovation rate.
• Be the leading hub of 'blue' knowledge and innovation.
• Be the most attractive cluster for establishing 'blue' operations.
• Be the most interesting cluster to work in – for 'blue' experts and talents.
The Blue Maritime Cluster includes notably a building, the Norwegian Maritime Competence Centre (NMCC), located on Campus Ålesund, which provides 800 jobs and hosts Rolls-Royce Marine’s technology and training Centre, numerous training activities and high tech Offshore Simulator Center, dedicated to the designers and users of offshore vessels and other maritime equipment. The owners of the MNCC are now investing NOK 500 million to construct a new building (NMCC2) and expand the premises by 15,000 square meters in addition to the existing 23,000.
According to an evaluation conducted by Menon (2015), the Blue Maritime Cluster’s turnover amounted to NOK 70 billion and employed 18,000 people in 2014. The aggregated turnover of the yards in this cluster grew by 300% between 2004 and 2014 as compared to +100% for other Norwegian yards. The value added per person engaged in 2013 across GCE Blue Maritime-segments amounted to EUR 170,000 far more than in the maritime sector in other economies.
Sources: Blue maritime cluster (2016) at http://www.bluemaritimecluster.no/gce/the-cluster/our-blue-vision/ and Menon (2015)
Finance industry
The finance industry is considered to be an important supporter of Norway's maritime industry. DNB, a Norwegian commercial bank, is, for example, the largest provider of financing for the shipping industry in the world.
At the end of August 2016, total loans from all Norwegian financial corporations - including banks, finance companies, mortgage companies and state lending institutions – to the domestic shipbuilding industry amounted to NOK 15,068 million (Figure 16). Over the last six years, banks accounted for the highest share of total loans with 90% to 95%, followed by finance corporations (2-5%), state lending institutions (2%-4%) and mortgage companies (below 0.3%).
From November 2009 to May 2011, lending to the shipbuilding industry dropped by 57%, mostly owing to a decline of bank lending (-59%) compared to a growth in state lending by 10% (Figure 16). This drop in financing is most likely related to the economic downturn in the aftermath of the financial crisis that particularly hit the shipbuilding industry around late 2009 as well as the drop in oil price that happened during the same period. Loans were then oriented upwards between May 2011 and November 2015. From November 2015 to August 2016, total lending to the shipbuilding industry decreased by 15% because of the weakening of the market for offshore vessels driven by the lower oil price environment. The state lending activity increased by 6% during this recent period may be as a result of lower supply from private finance institutions.
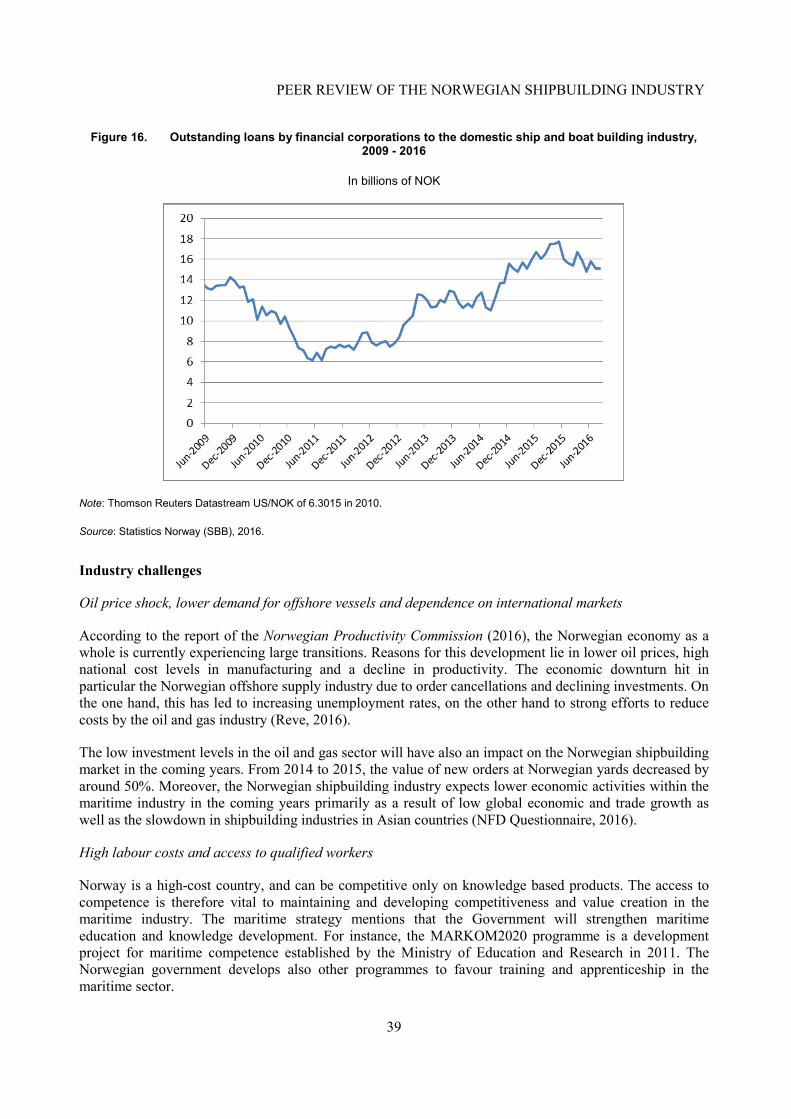
PEER REVIEW OF THE NORWEGIAN SHIPBUILDING INDUSTRY
39
Figure 16. Outstanding loans by financial corporations to the domestic ship and boat building industry, 2009 - 2016
In billions of NOK
Note: Thomson Reuters Datastream US/NOK of 6.3015 in 2010.
Source: Statistics Norway (SBB), 2016.
Industry challenges
Oil price shock, lower demand for offshore vessels and dependence on international markets
According to the report of the Norwegian Productivity Commission (2016), the Norwegian economy as a whole is currently experiencing large transitions. Reasons for this development lie in lower oil prices, high national cost levels in manufacturing and a decline in productivity. The economic downturn hit in particular the Norwegian offshore supply industry due to order cancellations and declining investments. On the one hand, this has led to increasing unemployment rates, on the other hand to strong efforts to reduce costs by the oil and gas industry (Reve, 2016).
The low investment levels in the oil and gas sector will have also an impact on the Norwegian shipbuilding market in the coming years. From 2014 to 2015, the value of new orders at Norwegian yards decreased by around 50%. Moreover, the Norwegian shipbuilding industry expects lower economic activities within the maritime industry in the coming years primarily as a result of low global economic and trade growth as well as the slowdown in shipbuilding industries in Asian countries (NFD Questionnaire, 2016).
High labour costs and access to qualified workers
Norway is a high-cost country, and can be competitive only on knowledge based products. The access to competence is therefore vital to maintaining and developing competitiveness and value creation in the maritime industry. The maritime strategy mentions that the Government will strengthen maritime education and knowledge development. For instance, the MARKOM2020 programme is a development project for maritime competence established by the Ministry of Education and Research in 2011. The Norwegian government develops also other programmes to favour training and apprenticeship in the maritime sector.
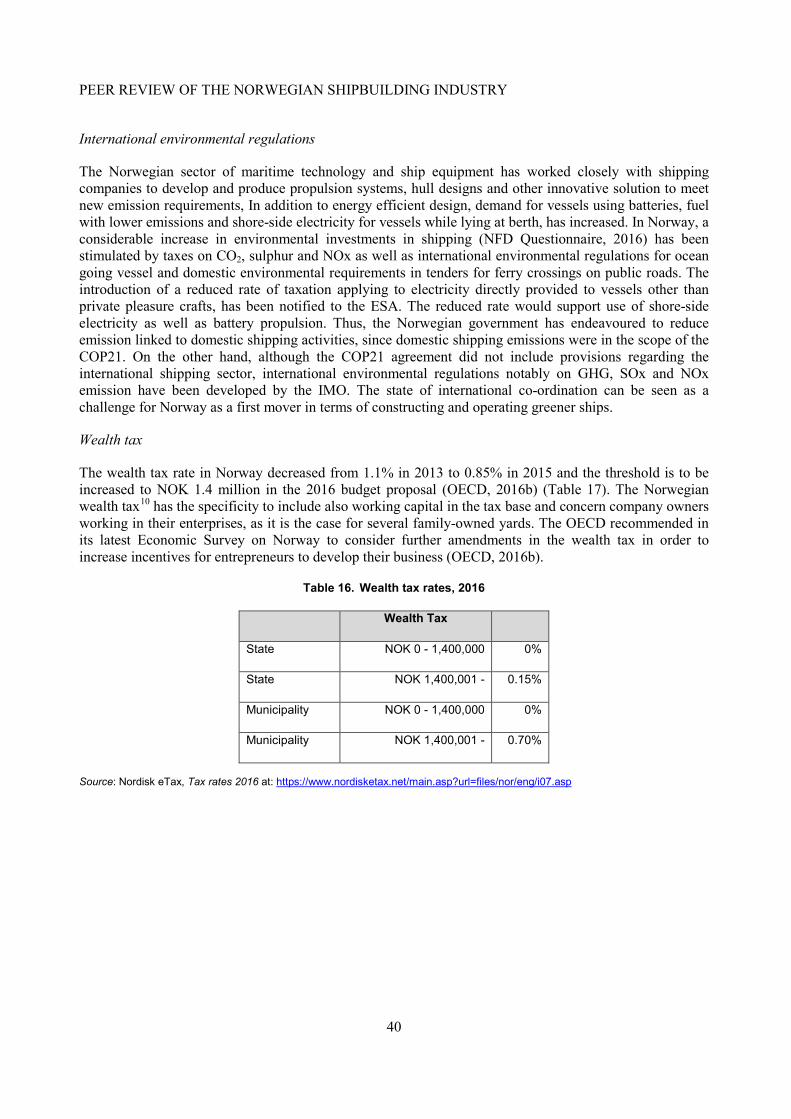
PEER REVIEW OF THE NORWEGIAN SHIPBUILDING INDUSTRY
40
International environmental regulations
The Norwegian sector of maritime technology and ship equipment has worked closely with shipping companies to develop and produce propulsion systems, hull designs and other innovative solution to meet new emission requirements, In addition to energy efficient design, demand for vessels using batteries, fuel with lower emissions and shore-side electricity for vessels while lying at berth, has increased. In Norway, a considerable increase in environmental investments in shipping (NFD Questionnaire, 2016) has been stimulated by taxes on CO2, sulphur and NOx as well as international environmental regulations for ocean going vessel and domestic environmental requirements in tenders for ferry crossings on public roads. The introduction of a reduced rate of taxation applying to electricity directly provided to vessels other than private pleasure crafts, has been notified to the ESA. The reduced rate would support use of shore-side electricity as well as battery propulsion. Thus, the Norwegian government has endeavoured to reduce emission linked to domestic shipping activities, since domestic shipping emissions were in the scope of the COP21. On the other hand, although the COP21 agreement did not include provisions regarding the international shipping sector, international environmental regulations notably on GHG, SOx and NOx emission have been developed by the IMO. The state of international co-ordination can be seen as a challenge for Norway as a first mover in terms of constructing and operating greener ships.
Wealth tax
The wealth tax rate in Norway decreased from 1.1% in 2013 to 0.85% in 2015 and the threshold is to be increased to NOK 1.4 million in the 2016 budget proposal (OECD, 2016b) (Table 17). The Norwegian wealth tax10 has the specificity to include also working capital in the tax base and concern company owners working in their enterprises, as it is the case for several family-owned yards. The OECD recommended in its latest Economic Survey on Norway to consider further amendments in the wealth tax in order to increase incentives for entrepreneurs to develop their business (OECD, 2016b).
Table 16. Wealth tax rates, 2016
Wealth Tax
State NOK 0 - 1,400,000 0%
State NOK 1,400,001 - 0.15%
Municipality NOK 0 - 1,400,000 0%
Municipality NOK 1,400,001 - 0.70%
Source: Nordisk eTax, Tax rates 2016 at: https://www.nordisketax.net/main.asp?url=files/nor/eng/i07.asp
PEER REVIEW OF THE NORWEGIAN SHIPBUILDING INDUSTRY
41
GOVERNMENT POLICIES IN NORWAY'S SHIPBUILDING INDUSTRY
Strategy for maritime sector
Maritime strategy 2015 “Maritime Opportunities – Blue Growth for a Green Future
The Norwegian government launched a new maritime strategy called "Maritime Opportunities – Blue Growth for a Green Future" in August 2015. This strategy contains a review of the authorities' efforts and the measures relevant to develop and create value in the maritime industry, and proposes specific actions to be undertaken.
According to the strategy, the government's main goals are to ensure sustainable growth and value creation for the maritime industry. In order to reach these goals, the strategy includes specific actions (See box 2) in terms of Norwegian fleet registration, green growth, maritime administration, access to qualified personnel, research, development, and innovation, global regulatory framework, ocean related cluster, and maritime value creation in the High North. The Ministry of Trade, Industry and Fisheries is responsible for the overall maritime policy, while other ministries and agencies are also partially responsible depending on specific policies.
Box 2. Selected actions mentioned in Norway’s maritime strategy
The Norwegian maritime strategy includes notably the following actions:
o To ensure that Norway continues to be a leading maritime power with a large fleet registred in Norway, the Government will continue the shipping tax regime, strengthen the net wage scheme, and ease the trade area limitations for NIS vessels
o Norway will stimulate green growth for the Norwegian maritime industry as well as the use of environmental friendly technology and alternative fuel for vessels
o The Government will ensure an efficient and customer oriented maritime administration and competitive ship's registers
o Norway will strengthen the Norwegian maritime industry's access to qualified personnel.
o The government will stimulate increased research, development, and innovation in order to strengthen the value creation and competitiveness of the maritime industry
o Norway will work for a harmonized global regulatory framework, open markets, high requirements for maritime safety, environment, and social standards.
o The government will develop a strong Norwegian ocean related cluster by stimulating increased interaction between the ocean industries as the maritime, seafood, oil and gas industries can grow more by learning from each other.
o Norway will ensure sustainable maritime value creation in the High North while taking into account issues such as increased activity, safety, and the environment.
Source: MTIF (2015)
In terms of fleet registrations, the strategy notes that sustaining large fleet registered in Norway is vital for development of Norwegian maritime industry, and shows specific actions to soften the trade area limitations for NIS registered vessels.
PEER REVIEW OF THE NORWEGIAN SHIPBUILDING INDUSTRY
42
The Norwegian government has ambitious environmental goals for the maritime industry, as green growth will contribute to strengthening value creation in the industry and give a competitive edge. The strategy sets a wide range of actions to stimulate greener ship construction. These actions include R&Ds for environmentally friendly shipping (e.g, LNG hybrid, bio fuel and electrical operation), implementation of an environmental fee regime and the NOx fund, investments in environmental and climate initiatives and establishment of international regulatory frameworks.
In view of stimulating research, development, and innovation, the strategy mentions that the government will strengthen the general support system through the Research Council of Norway and Innovation Norway. In addition, the strategy supports continuation and update of Maritime 21 (see below), a comprehensive research and innovation strategy developed by the Norwegian maritime industry.
The strategy also aims at harmonizing global regulatory frameworks, in order to realize open market and high requirements for maritime safety, environment, and social standards. As specific actions, Norwegian government will actively participate in international forums such as IMO, ILO, WTO, EFTA and OECD WP6.
In addition to the maritime industry which includes shipping, shipbuilding and maritime equipment, the strategy emphasizes interaction between the ocean industries, a broader concept than the maritime industry, including the oil and gas industry and the seafood industry. According to the strategy, Norwegian government will stimulate such interaction through inter-industrial joint initiatives.
The Norwegian maritime industry has extensive competence on the specific conditions and challenges prevailing in the Arctic. The strategy notes that deglaciation could lead to increasing economic activity with potential new sea routes, which offer opportunities for growth and value creation in the Northern areas. In accordance with the strategy, Norwegian government will establish legislative frameworks to secure safety and environment in the High North, and will develop necessary infrastructure to support the activities.
Maritim21 Strategy
Maritim21 is a comprehensive research and innovation strategy for the maritime industry in Norway, developed by the industry on request from the government. It is aimed at proposing policies stimulating research, development and innovation that contribute to sustainable growth and value creation, increasing competitiveness in the maritime industry, and realizing synergies between the maritime and other ocean based industries. It covers comprehensive sectors of the maritime industry and suggests priority areas for maritime research as well as research and funding structure. The previous strategy was presented in 2010. A new Maritim21 strategy was published on November 1, 2016. The strategy will be an important input to the development to the government’s maritime RD&I policy.
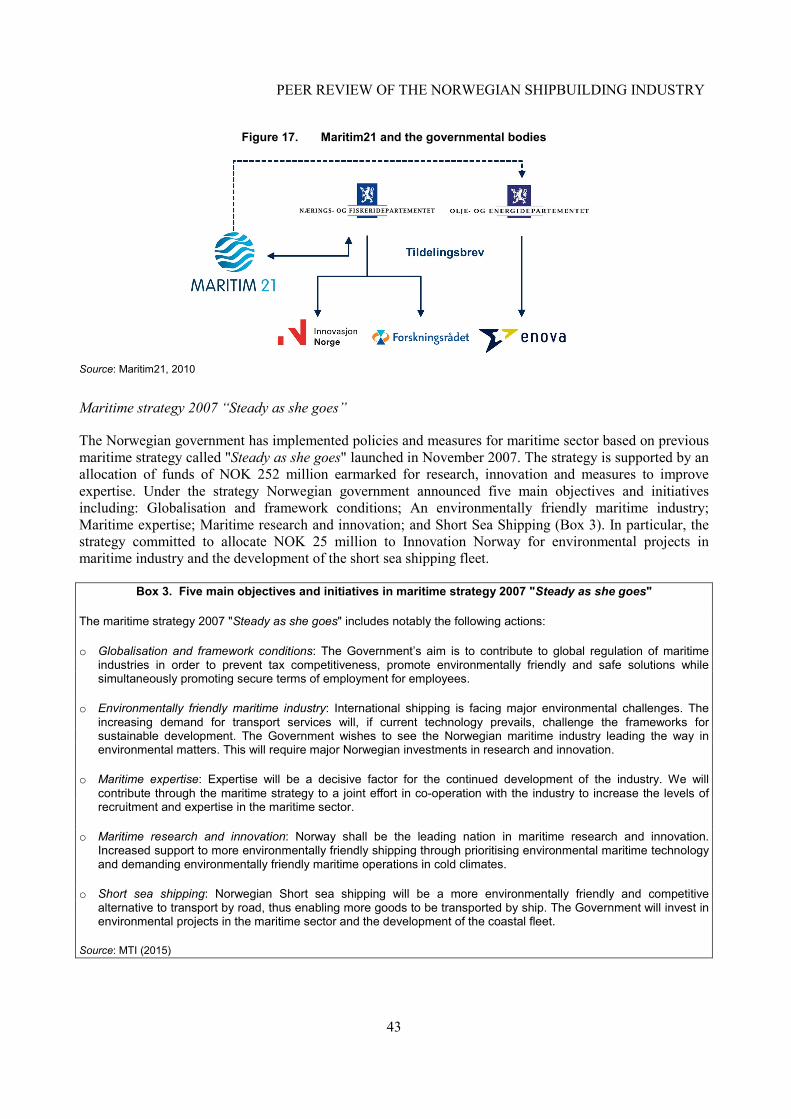
PEER REVIEW OF THE NORWEGIAN SHIPBUILDING INDUSTRY
43
Figure 17. Maritim21 and the governmental bodies
Source: Maritim21, 2010
Maritime strategy 2007 “Steady as she goes”
The Norwegian government has implemented policies and measures for maritime sector based on previous maritime strategy called "Steady as she goes" launched in November 2007. The strategy is supported by an allocation of funds of NOK 252 million earmarked for research, innovation and measures to improve expertise. Under the strategy Norwegian government announced five main objectives and initiatives including: Globalisation and framework conditions; An environmentally friendly maritime industry; Maritime expertise; Maritime research and innovation; and Short Sea Shipping (Box 3). In particular, the strategy committed to allocate NOK 25 million to Innovation Norway for environmental projects in maritime industry and the development of the short sea shipping fleet.
Box 3. Five main objectives and initiatives in maritime strategy 2007 "Steady as she goes"
The maritime strategy 2007 "Steady as she goes" includes notably the following actions:
o Globalisation and framework conditions: The Government’s aim is to contribute to global regulation of maritime industries in order to prevent tax competitiveness, promote environmentally friendly and safe solutions while simultaneously promoting secure terms of employment for employees.
o Environmentally friendly maritime industry: International shipping is facing major environmental challenges. The increasing demand for transport services will, if current technology prevails, challenge the frameworks for sustainable development. The Government wishes to see the Norwegian maritime industry leading the way in environmental matters. This will require major Norwegian investments in research and innovation.
o Maritime expertise: Expertise will be a decisive factor for the continued development of the industry. We will contribute through the maritime strategy to a joint effort in co-operation with the industry to increase the levels of recruitment and expertise in the maritime sector.
o Maritime research and innovation: Norway shall be the leading nation in maritime research and innovation. Increased support to more environmentally friendly shipping through prioritising environmental maritime technology and demanding environmentally friendly maritime operations in cold climates.
o Short sea shipping: Norwegian Short sea shipping will be a more environmentally friendly and competitive alternative to transport by road, thus enabling more goods to be transported by ship. The Government will invest in environmental projects in the maritime sector and the development of the coastal fleet.
Source: MTI (2015)
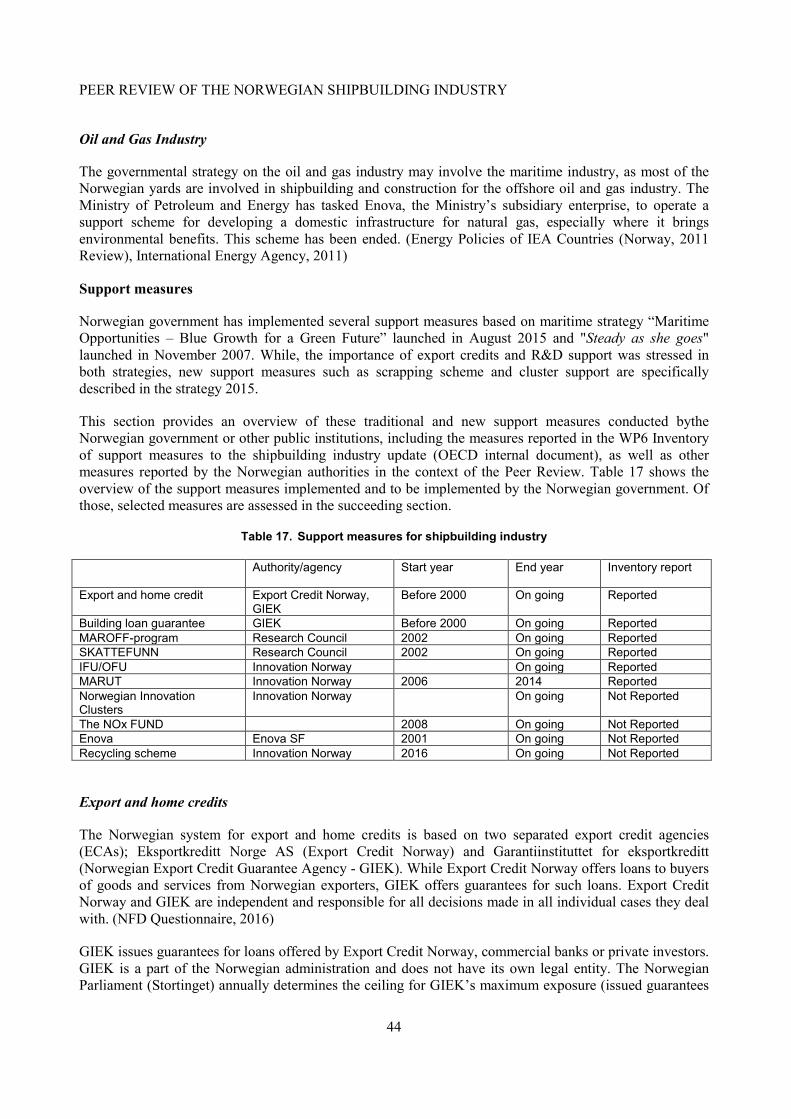
PEER REVIEW OF THE NORWEGIAN SHIPBUILDING INDUSTRY
44
Oil and Gas Industry
The governmental strategy on the oil and gas industry may involve the maritime industry, as most of the Norwegian yards are involved in shipbuilding and construction for the offshore oil and gas industry. The Ministry of Petroleum and Energy has tasked Enova, the Ministry’s subsidiary enterprise, to operate a support scheme for developing a domestic infrastructure for natural gas, especially where it brings environmental benefits. This scheme has been ended. (Energy Policies of IEA Countries (Norway, 2011 Review), International Energy Agency, 2011)
Support measures
Norwegian government has implemented several support measures based on maritime strategy “Maritime Opportunities – Blue Growth for a Green Future” launched in August 2015 and "Steady as she goes" launched in November 2007. While, the importance of export credits and R&D support was stressed in both strategies, new support measures such as scrapping scheme and cluster support are specifically described in the strategy 2015.
This section provides an overview of these traditional and new support measures conducted bythe Norwegian government or other public institutions, including the measures reported in the WP6 Inventory of support measures to the shipbuilding industry update (OECD internal document), as well as other measures reported by the Norwegian authorities in the context of the Peer Review. Table 17 shows the overview of the support measures implemented and to be implemented by the Norwegian government. Of those, selected measures are assessed in the succeeding section.
Table 17. Support measures for shipbuilding industry
Authority/agency Start year End year Inventory report
Export and home credit Export Credit Norway, GIEK
Before 2000 On going Reported
Building loan guarantee GIEK Before 2000 On going Reported MAROFF-program Research Council 2002 On going Reported SKATTEFUNN Research Council 2002 On going Reported IFU/OFU Innovation Norway On going Reported MARUT Innovation Norway 2006 2014 Reported Norwegian Innovation Clusters
Innovation Norway On going Not Reported
The NOx FUND 2008 On going Not Reported Enova Enova SF 2001 On going Not Reported Recycling scheme Innovation Norway 2016 On going Not Reported
Export and home credits
The Norwegian system for export and home credits is based on two separated export credit agencies (ECAs); Eksportkreditt Norge AS (Export Credit Norway) and Garantiinstituttet for eksportkreditt (Norwegian Export Credit Guarantee Agency - GIEK). While Export Credit Norway offers loans to buyers of goods and services from Norwegian exporters, GIEK offers guarantees for such loans. Export Credit Norway and GIEK are independent and responsible for all decisions made in all individual cases they deal with. (NFD Questionnaire, 2016)
GIEK issues guarantees for loans offered by Export Credit Norway, commercial banks or private investors. GIEK is a part of the Norwegian administration and does not have its own legal entity. The Norwegian Parliament (Stortinget) annually determines the ceiling for GIEK’s maximum exposure (issued guarantees
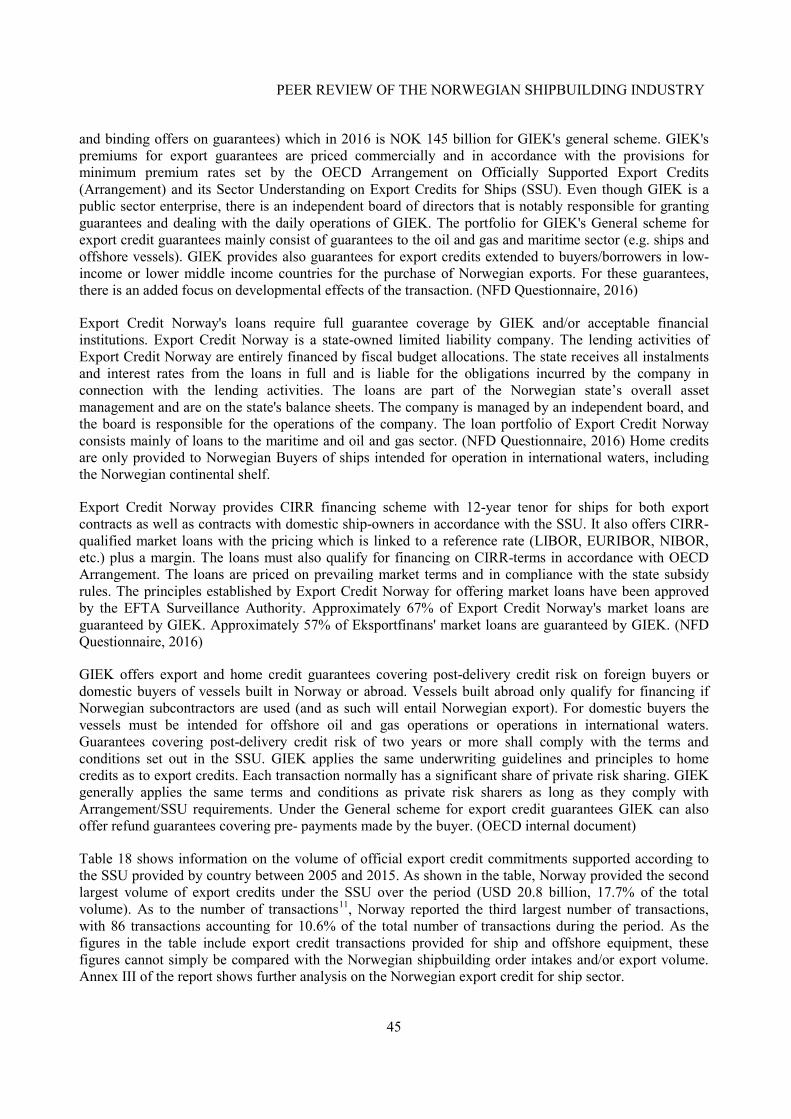
PEER REVIEW OF THE NORWEGIAN SHIPBUILDING INDUSTRY
45
and binding offers on guarantees) which in 2016 is NOK 145 billion for GIEK's general scheme. GIEK's premiums for export guarantees are priced commercially and in accordance with the provisions for minimum premium rates set by the OECD Arrangement on Officially Supported Export Credits (Arrangement) and its Sector Understanding on Export Credits for Ships (SSU). Even though GIEK is a public sector enterprise, there is an independent board of directors that is notably responsible for granting guarantees and dealing with the daily operations of GIEK. The portfolio for GIEK's General scheme for export credit guarantees mainly consist of guarantees to the oil and gas and maritime sector (e.g. ships and offshore vessels). GIEK provides also guarantees for export credits extended to buyers/borrowers in low-income or lower middle income countries for the purchase of Norwegian exports. For these guarantees, there is an added focus on developmental effects of the transaction. (NFD Questionnaire, 2016)
Export Credit Norway's loans require full guarantee coverage by GIEK and/or acceptable financial institutions. Export Credit Norway is a state-owned limited liability company. The lending activities of Export Credit Norway are entirely financed by fiscal budget allocations. The state receives all instalments and interest rates from the loans in full and is liable for the obligations incurred by the company in connection with the lending activities. The loans are part of the Norwegian state’s overall asset management and are on the state's balance sheets. The company is managed by an independent board, and the board is responsible for the operations of the company. The loan portfolio of Export Credit Norway consists mainly of loans to the maritime and oil and gas sector. (NFD Questionnaire, 2016) Home credits are only provided to Norwegian Buyers of ships intended for operation in international waters, including the Norwegian continental shelf.
Export Credit Norway provides CIRR financing scheme with 12-year tenor for ships for both export contracts as well as contracts with domestic ship-owners in accordance with the SSU. It also offers CIRR-qualified market loans with the pricing which is linked to a reference rate (LIBOR, EURIBOR, NIBOR, etc.) plus a margin. The loans must also qualify for financing on CIRR-terms in accordance with OECD Arrangement. The loans are priced on prevailing market terms and in compliance with the state subsidy rules. The principles established by Export Credit Norway for offering market loans have been approved by the EFTA Surveillance Authority. Approximately 67% of Export Credit Norway's market loans are guaranteed by GIEK. Approximately 57% of Eksportfinans' market loans are guaranteed by GIEK. (NFD Questionnaire, 2016)
GIEK offers export and home credit guarantees covering post-delivery credit risk on foreign buyers or domestic buyers of vessels built in Norway or abroad. Vessels built abroad only qualify for financing if Norwegian subcontractors are used (and as such will entail Norwegian export). For domestic buyers the vessels must be intended for offshore oil and gas operations or operations in international waters. Guarantees covering post-delivery credit risk of two years or more shall comply with the terms and conditions set out in the SSU. GIEK applies the same underwriting guidelines and principles to home credits as to export credits. Each transaction normally has a significant share of private risk sharing. GIEK generally applies the same terms and conditions as private risk sharers as long as they comply with Arrangement/SSU requirements. Under the General scheme for export credit guarantees GIEK can also offer refund guarantees covering pre- payments made by the buyer. (OECD internal document)
Table 18 shows information on the volume of official export credit commitments supported according to the SSU provided by country between 2005 and 2015. As shown in the table, Norway provided the second largest volume of export credits under the SSU over the period (USD 20.8 billion, 17.7% of the total volume). As to the number of transactions11, Norway reported the third largest number of transactions, with 86 transactions accounting for 10.6% of the total number of transactions during the period. As the figures in the table include export credit transactions provided for ship and offshore equipment, these figures cannot simply be compared with the Norwegian shipbuilding order intakes and/or export volume. Annex III of the report shows further analysis on the Norwegian export credit for ship sector.
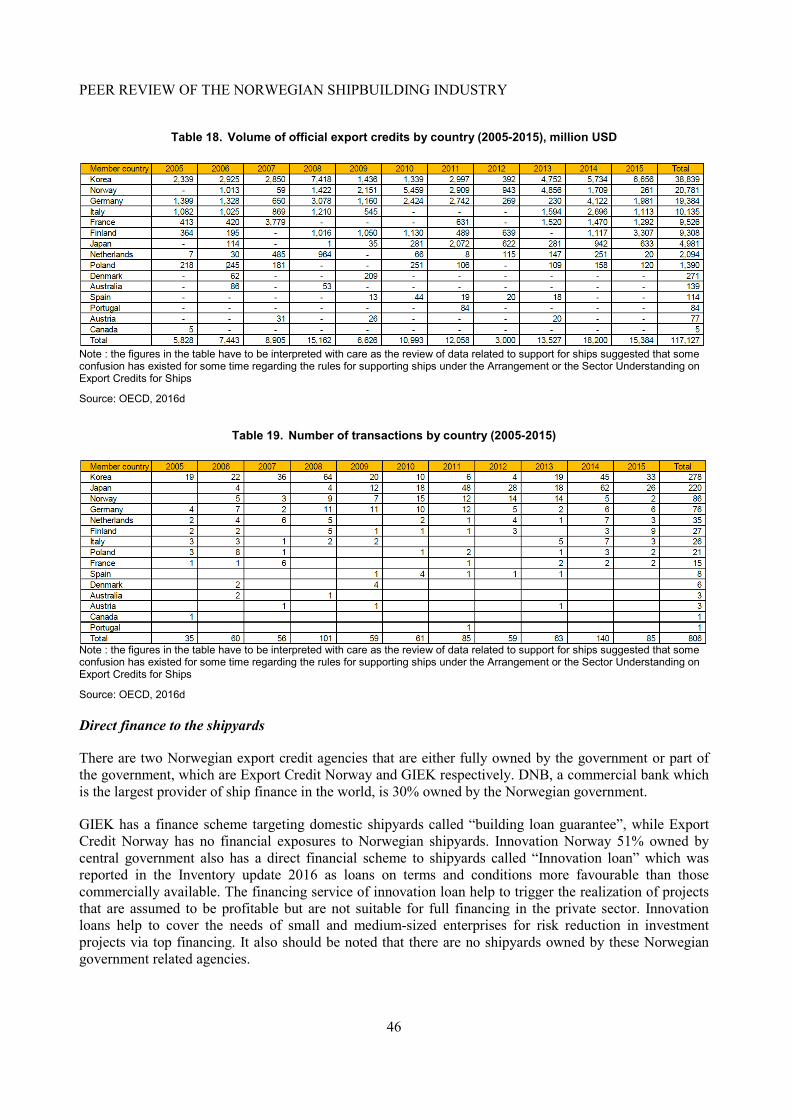
PEER REVIEW OF THE NORWEGIAN SHIPBUILDING INDUSTRY
46
Table 18. Volume of official export credits by country (2005-2015), million USD
Note : the figures in the table have to be interpreted with care as the review of data related to support for ships suggested that some confusion has existed for some time regarding the rules for supporting ships under the Arrangement or the Sector Understanding on Export Credits for Ships
Source: OECD, 2016d
Table 19. Number of transactions by country (2005-2015)
Note : the figures in the table have to be interpreted with care as the review of data related to support for ships suggested that some confusion has existed for some time regarding the rules for supporting ships under the Arrangement or the Sector Understanding on Export Credits for Ships
Source: OECD, 2016d
Direct finance to the shipyards
There are two Norwegian export credit agencies that are either fully owned by the government or part of the government, which are Export Credit Norway and GIEK respectively. DNB, a commercial bank which is the largest provider of ship finance in the world, is 30% owned by the Norwegian government.
GIEK has a finance scheme targeting domestic shipyards called “building loan guarantee”, while Export Credit Norway has no financial exposures to Norwegian shipyards. Innovation Norway 51% owned by central government also has a direct financial scheme to shipyards called “Innovation loan” which was reported in the Inventory update 2016 as loans on terms and conditions more favourable than those commercially available. The financing service of innovation loan help to trigger the realization of projects that are assumed to be profitable but are not suitable for full financing in the private sector. Innovation loans help to cover the needs of small and medium-sized enterprises for risk reduction in investment projects via top financing. It also should be noted that there are no shipyards owned by these Norwegian government related agencies.
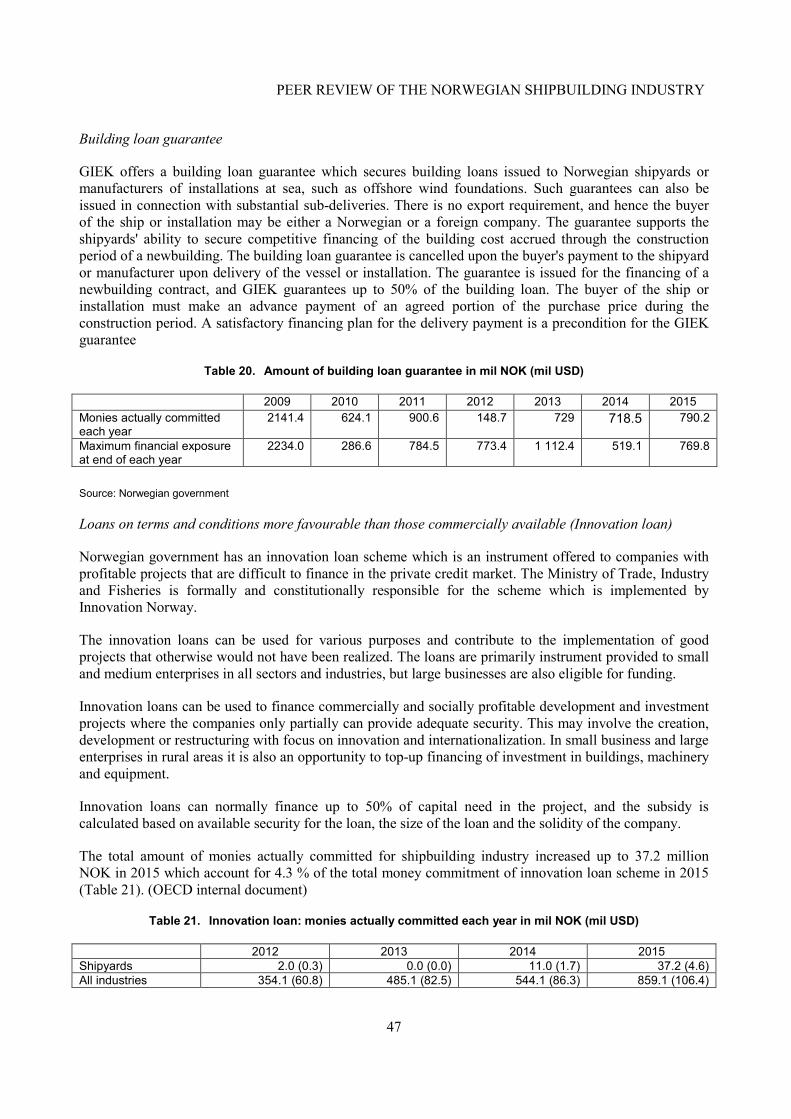
PEER REVIEW OF THE NORWEGIAN SHIPBUILDING INDUSTRY
47
Building loan guarantee
GIEK offers a building loan guarantee which secures building loans issued to Norwegian shipyards or manufacturers of installations at sea, such as offshore wind foundations. Such guarantees can also be issued in connection with substantial sub-deliveries. There is no export requirement, and hence the buyer of the ship or installation may be either a Norwegian or a foreign company. The guarantee supports the shipyards' ability to secure competitive financing of the building cost accrued through the construction period of a newbuilding. The building loan guarantee is cancelled upon the buyer's payment to the shipyard or manufacturer upon delivery of the vessel or installation. The guarantee is issued for the financing of a newbuilding contract, and GIEK guarantees up to 50% of the building loan. The buyer of the ship or installation must make an advance payment of an agreed portion of the purchase price during the construction period. A satisfactory financing plan for the delivery payment is a precondition for the GIEK guarantee
Table 20. Amount of building loan guarantee in mil NOK (mil USD)
2009 2010 2011 2012 2013 2014 2015 Monies actually committed each year
2141.4 624.1 900.6 148.7 729 718.5 790.2
Maximum financial exposure at end of each year
2234.0 286.6 784.5 773.4 1 112.4 519.1 769.8
Source: Norwegian government
Loans on terms and conditions more favourable than those commercially available (Innovation loan)
Norwegian government has an innovation loan scheme which is an instrument offered to companies with profitable projects that are difficult to finance in the private credit market. The Ministry of Trade, Industry and Fisheries is formally and constitutionally responsible for the scheme which is implemented by Innovation Norway.
The innovation loans can be used for various purposes and contribute to the implementation of good projects that otherwise would not have been realized. The loans are primarily instrument provided to small and medium enterprises in all sectors and industries, but large businesses are also eligible for funding.
Innovation loans can be used to finance commercially and socially profitable development and investment projects where the companies only partially can provide adequate security. This may involve the creation, development or restructuring with focus on innovation and internationalization. In small business and large enterprises in rural areas it is also an opportunity to top-up financing of investment in buildings, machinery and equipment.
Innovation loans can normally finance up to 50% of capital need in the project, and the subsidy is calculated based on available security for the loan, the size of the loan and the solidity of the company.
The total amount of monies actually committed for shipbuilding industry increased up to 37.2 million NOK in 2015 which account for 4.3 % of the total money commitment of innovation loan scheme in 2015 (Table 21). (OECD internal document)
Table 21. Innovation loan: monies actually committed each year in mil NOK (mil USD)
2012 2013 2014 2015 Shipyards 2.0 (0.3) 0.0 (0.0) 11.0 (1.7) 37.2 (4.6) All industries 354.1 (60.8) 485.1 (82.5) 544.1 (86.3) 859.1 (106.4)
PEER REVIEW OF THE NORWEGIAN SHIPBUILDING INDUSTRY
48
Source: OECD (internal document)
Research, Development and Innovation (RDI)
The Norwegian government has a long term priority in providing basic incentives, institutional frameworks and support measures for R&D and innovation, notably through The Research Council of Norway and Innovation Norway.
The Research Council of Norway is a national strategic and funding agency for activities within all thematic fields of research, and a central adviser on research policy and research activities for the Norwegian Government, the central government administration and the overall research community. The major instruments that are used by the ship building industry are Skattefunn and MAROFF program.
Innovation Norway is the Norwegian Government's instrument for innovation and development of Norwegian enterprises and industry. Innovation Norway supports companies in developing their competitive advantage and innovation. As for Innovation Norway, a large share of the funding is made available on an expected value added basis and the main schemes are thematic and technology neutral (NFD Questionnaire, 2016). Innovation Norway provides several schemes with the objective to increase RDI (research, development and innovation) efforts within all sectors in Norway, including the ship building industry. The major instruments that are used by ship building industry are the MILTEK, IFU/OFU (Industrial Research and Development Program) and MARUT (Maritime Development/Coastal Shipping instrument).
MAROFF-program
The Research Council of Norway grants support to maritime research, development and innovation through the MAROFF-program with yearly budget for 2015 is NOK 137.5 million. The overall objective of the scheme is to promote innovation and value creation in the maritime industry.
This scheme targets the maritime industry, including the ship-owners, the shipbuilding industry and equipment vendors. The program supports projects that are oriented toward the research challenges in three key innovation areas including the environment, advanced transport and logistics as well as demanding maritime operations. The research projects are assessed in terms of criteria such as level of innovation, potential for value creation for industrial partners, realization of the innovation, level of research, R&D project quality, implementation capacity, relevance of the research for innovation, and other socio-economic benefits.
Companies and research institutions are encouraged to cooperate in order to ensure that new knowledge and competence are diffused. A research project cannot receive more than 50 % financing from the program. Private actors are required to supply a minimum of 50 % of the funding, but they usually contribute with a greater proportion of the financing. (NFD Questionnaire, 2016)
Skattefunn Tax Incentive Scheme
The Skattefunn R&D tax incentive scheme is designed to stimulate research and development (R&D) in Norwegian trade and industry. Businesses that are subject to corporate taxation in Norway are eligible.
To be eligible, the R&D contents of a project must be pre-approved by the Research Council. Incurred cost are documented as part of the annual tax returns, and scrutinized by the tax authorities. Businesses with
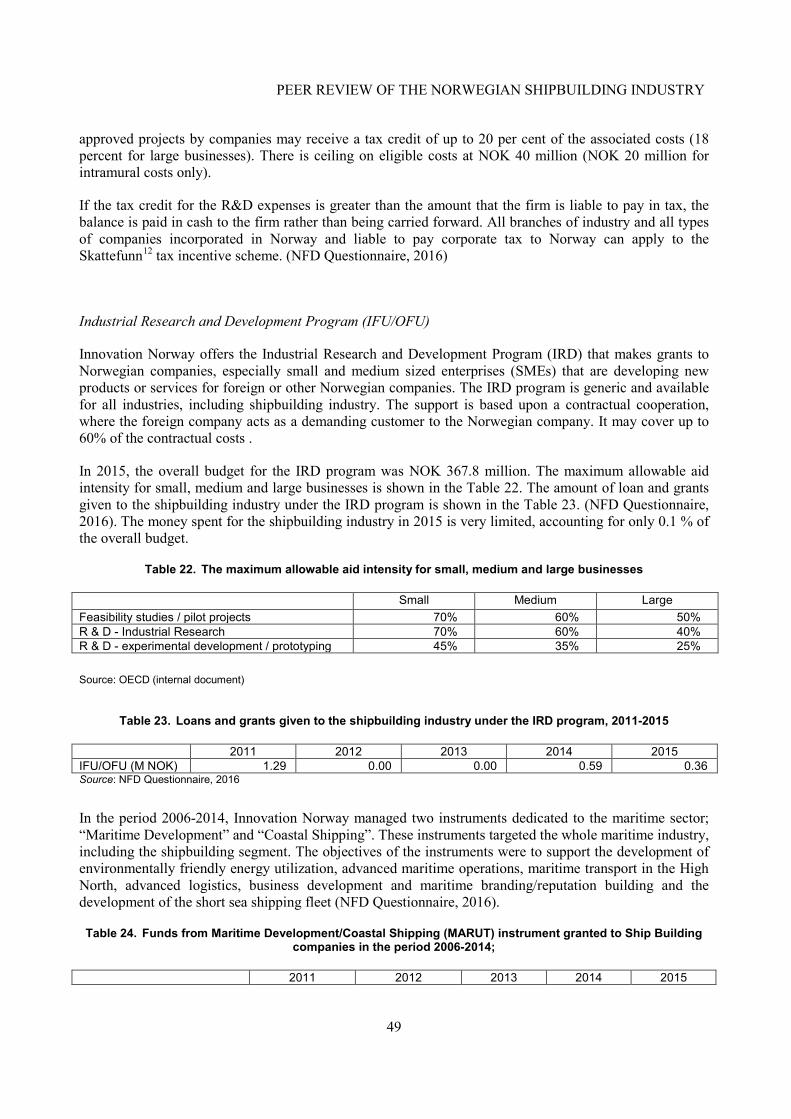
PEER REVIEW OF THE NORWEGIAN SHIPBUILDING INDUSTRY
49
approved projects by companies may receive a tax credit of up to 20 per cent of the associated costs (18 percent for large businesses). There is ceiling on eligible costs at NOK 40 million (NOK 20 million for intramural costs only).
If the tax credit for the R&D expenses is greater than the amount that the firm is liable to pay in tax, the balance is paid in cash to the firm rather than being carried forward. All branches of industry and all types of companies incorporated in Norway and liable to pay corporate tax to Norway can apply to the Skattefunn12 tax incentive scheme. (NFD Questionnaire, 2016)
Industrial Research and Development Program (IFU/OFU)
Innovation Norway offers the Industrial Research and Development Program (IRD) that makes grants to Norwegian companies, especially small and medium sized enterprises (SMEs) that are developing new products or services for foreign or other Norwegian companies. The IRD program is generic and available for all industries, including shipbuilding industry. The support is based upon a contractual cooperation, where the foreign company acts as a demanding customer to the Norwegian company. It may cover up to 60% of the contractual costs .
In 2015, the overall budget for the IRD program was NOK 367.8 million. The maximum allowable aid intensity for small, medium and large businesses is shown in the Table 22. The amount of loan and grants given to the shipbuilding industry under the IRD program is shown in the Table 23. (NFD Questionnaire, 2016). The money spent for the shipbuilding industry in 2015 is very limited, accounting for only 0.1 % of the overall budget.
Table 22. The maximum allowable aid intensity for small, medium and large businesses
Small Medium Large Feasibility studies / pilot projects 70% 60% 50% R & D - Industrial Research 70% 60% 40% R & D - experimental development / prototyping 45% 35% 25%
Source: OECD (internal document)
Table 23. Loans and grants given to the shipbuilding industry under the IRD program, 2011-2015
2011 2012 2013 2014 2015 IFU/OFU (M NOK) 1.29 0.00 0.00 0.59 0.36 Source: NFD Questionnaire, 2016
In the period 2006-2014, Innovation Norway managed two instruments dedicated to the maritime sector; “Maritime Development” and “Coastal Shipping”. These instruments targeted the whole maritime industry, including the shipbuilding segment. The objectives of the instruments were to support the development of environmentally friendly energy utilization, advanced maritime operations, maritime transport in the High North, advanced logistics, business development and maritime branding/reputation building and the development of the short sea shipping fleet (NFD Questionnaire, 2016).
Table 24. Funds from Maritime Development/Coastal Shipping (MARUT) instrument granted to Ship Building companies in the period 2006-2014;
2011 2012 2013 2014 2015
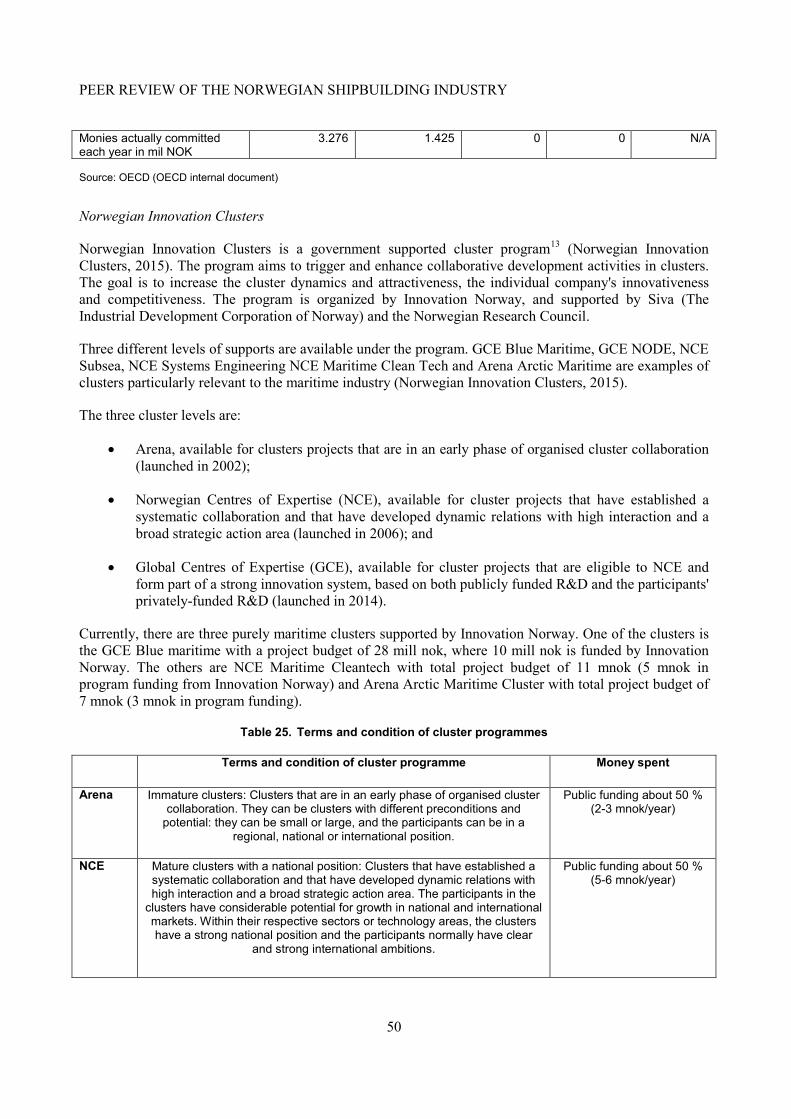
PEER REVIEW OF THE NORWEGIAN SHIPBUILDING INDUSTRY
50
Monies actually committed each year in mil NOK
3.276 1.425 0 0 N/A
Source: OECD (OECD internal document)
Norwegian Innovation Clusters
Norwegian Innovation Clusters is a government supported cluster program13 (Norwegian Innovation Clusters, 2015). The program aims to trigger and enhance collaborative development activities in clusters. The goal is to increase the cluster dynamics and attractiveness, the individual company's innovativeness and competitiveness. The program is organized by Innovation Norway, and supported by Siva (The Industrial Development Corporation of Norway) and the Norwegian Research Council.
Three different levels of supports are available under the program. GCE Blue Maritime, GCE NODE, NCE Subsea, NCE Systems Engineering NCE Maritime Clean Tech and Arena Arctic Maritime are examples of clusters particularly relevant to the maritime industry (Norwegian Innovation Clusters, 2015).
The three cluster levels are:
• Arena, available for clusters projects that are in an early phase of organised cluster collaboration (launched in 2002);
• Norwegian Centres of Expertise (NCE), available for cluster projects that have established a systematic collaboration and that have developed dynamic relations with high interaction and a broad strategic action area (launched in 2006); and
• Global Centres of Expertise (GCE), available for cluster projects that are eligible to NCE and form part of a strong innovation system, based on both publicly funded R&D and the participants' privately-funded R&D (launched in 2014).
Currently, there are three purely maritime clusters supported by Innovation Norway. One of the clusters is the GCE Blue maritime with a project budget of 28 mill nok, where 10 mill nok is funded by Innovation Norway. The others are NCE Maritime Cleantech with total project budget of 11 mnok (5 mnok in program funding from Innovation Norway) and Arena Arctic Maritime Cluster with total project budget of 7 mnok (3 mnok in program funding).
Table 25. Terms and condition of cluster programmes
Terms and condition of cluster programme Money spent
Arena Immature clusters: Clusters that are in an early phase of organised cluster collaboration. They can be clusters with different preconditions and
potential: they can be small or large, and the participants can be in a regional, national or international position.
Public funding about 50 % (2-3 mnok/year)
NCE Mature clusters with a national position: Clusters that have established a systematic collaboration and that have developed dynamic relations with high interaction and a broad strategic action area. The participants in the
clusters have considerable potential for growth in national and international markets. Within their respective sectors or technology areas, the clusters have a strong national position and the participants normally have clear
and strong international ambitions.
Public funding about 50 % (5-6 mnok/year)
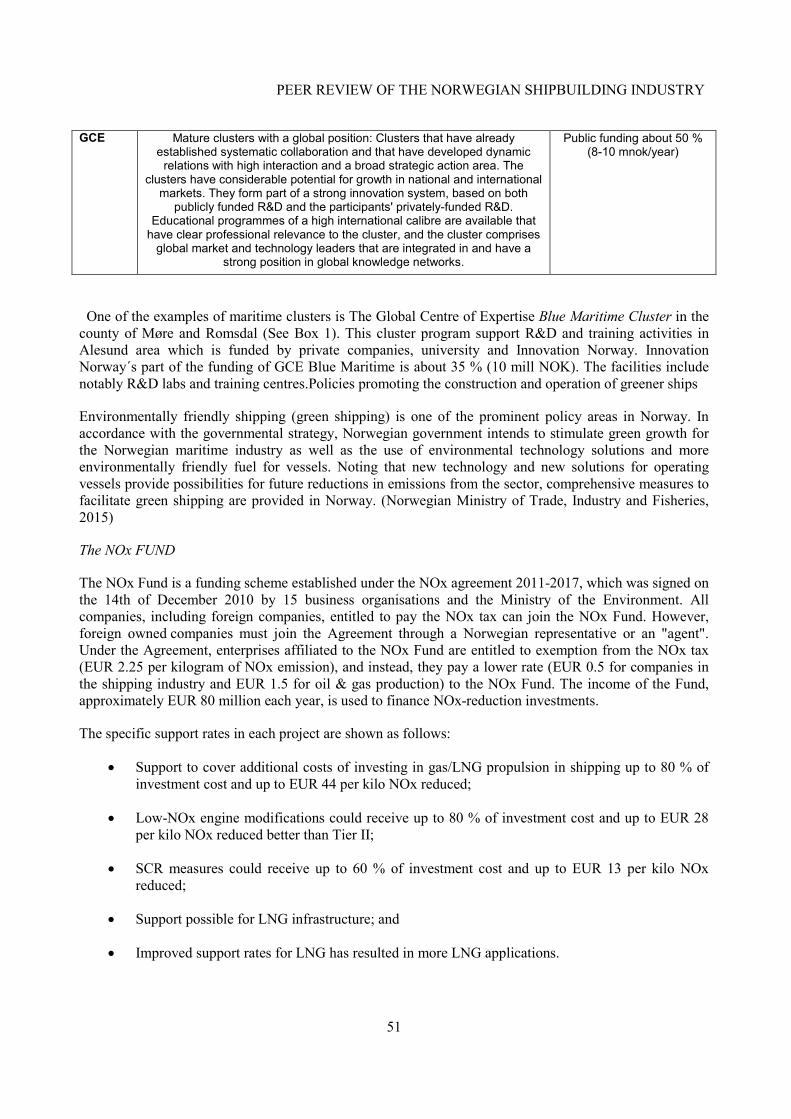
PEER REVIEW OF THE NORWEGIAN SHIPBUILDING INDUSTRY
51
GCE Mature clusters with a global position: Clusters that have already established systematic collaboration and that have developed dynamic
relations with high interaction and a broad strategic action area. The clusters have considerable potential for growth in national and international
markets. They form part of a strong innovation system, based on both publicly funded R&D and the participants' privately-funded R&D.
Educational programmes of a high international calibre are available that have clear professional relevance to the cluster, and the cluster comprises
global market and technology leaders that are integrated in and have a strong position in global knowledge networks.
Public funding about 50 % (8-10 mnok/year)
One of the examples of maritime clusters is The Global Centre of Expertise Blue Maritime Cluster in the county of Møre and Romsdal (See Box 1). This cluster program support R&D and training activities in Alesund area which is funded by private companies, university and Innovation Norway. Innovation Norway´s part of the funding of GCE Blue Maritime is about 35 % (10 mill NOK). The facilities include notably R&D labs and training centres.Policies promoting the construction and operation of greener ships
Environmentally friendly shipping (green shipping) is one of the prominent policy areas in Norway. In accordance with the governmental strategy, Norwegian government intends to stimulate green growth for the Norwegian maritime industry as well as the use of environmental technology solutions and more environmentally friendly fuel for vessels. Noting that new technology and new solutions for operating vessels provide possibilities for future reductions in emissions from the sector, comprehensive measures to facilitate green shipping are provided in Norway. (Norwegian Ministry of Trade, Industry and Fisheries, 2015)
The NOx FUND
The NOx Fund is a funding scheme established under the NOx agreement 2011-2017, which was signed on the 14th of December 2010 by 15 business organisations and the Ministry of the Environment. All companies, including foreign companies, entitled to pay the NOx tax can join the NOx Fund. However, foreign owned companies must join the Agreement through a Norwegian representative or an "agent". Under the Agreement, enterprises affiliated to the NOx Fund are entitled to exemption from the NOx tax (EUR 2.25 per kilogram of NOx emission), and instead, they pay a lower rate (EUR 0.5 for companies in the shipping industry and EUR 1.5 for oil & gas production) to the NOx Fund. The income of the Fund, approximately EUR 80 million each year, is used to finance NOx-reduction investments.
The specific support rates in each project are shown as follows:
• Support to cover additional costs of investing in gas/LNG propulsion in shipping up to 80 % of investment cost and up to EUR 44 per kilo NOx reduced;
• Low-NOx engine modifications could receive up to 80 % of investment cost and up to EUR 28 per kilo NOx reduced better than Tier II;
• SCR measures could receive up to 60 % of investment cost and up to EUR 13 per kilo NOx reduced;
• Support possible for LNG infrastructure; and
• Improved support rates for LNG has resulted in more LNG applications.
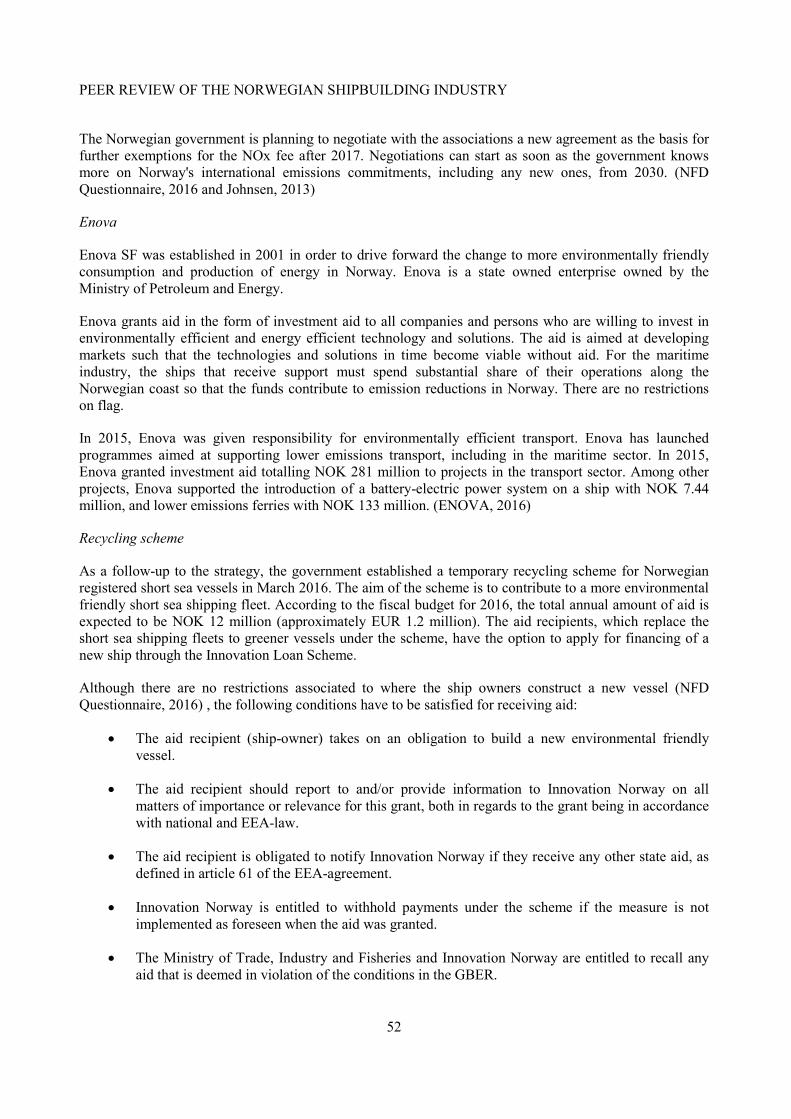
PEER REVIEW OF THE NORWEGIAN SHIPBUILDING INDUSTRY
52
The Norwegian government is planning to negotiate with the associations a new agreement as the basis for further exemptions for the NOx fee after 2017. Negotiations can start as soon as the government knows more on Norway's international emissions commitments, including any new ones, from 2030. (NFD Questionnaire, 2016 and Johnsen, 2013)
Enova
Enova SF was established in 2001 in order to drive forward the change to more environmentally friendly consumption and production of energy in Norway. Enova is a state owned enterprise owned by the Ministry of Petroleum and Energy.
Enova grants aid in the form of investment aid to all companies and persons who are willing to invest in environmentally efficient and energy efficient technology and solutions. The aid is aimed at developing markets such that the technologies and solutions in time become viable without aid. For the maritime industry, the ships that receive support must spend substantial share of their operations along the Norwegian coast so that the funds contribute to emission reductions in Norway. There are no restrictions on flag.
In 2015, Enova was given responsibility for environmentally efficient transport. Enova has launched programmes aimed at supporting lower emissions transport, including in the maritime sector. In 2015, Enova granted investment aid totalling NOK 281 million to projects in the transport sector. Among other projects, Enova supported the introduction of a battery-electric power system on a ship with NOK 7.44 million, and lower emissions ferries with NOK 133 million. (ENOVA, 2016)
Recycling scheme
As a follow-up to the strategy, the government established a temporary recycling scheme for Norwegian registered short sea vessels in March 2016. The aim of the scheme is to contribute to a more environmental friendly short sea shipping fleet. According to the fiscal budget for 2016, the total annual amount of aid is expected to be NOK 12 million (approximately EUR 1.2 million). The aid recipients, which replace the short sea shipping fleets to greener vessels under the scheme, have the option to apply for financing of a new ship through the Innovation Loan Scheme.
Although there are no restrictions associated to where the ship owners construct a new vessel (NFD Questionnaire, 2016) , the following conditions have to be satisfied for receiving aid:
• The aid recipient (ship-owner) takes on an obligation to build a new environmental friendly vessel.
• The aid recipient should report to and/or provide information to Innovation Norway on all matters of importance or relevance for this grant, both in regards to the grant being in accordance with national and EEA-law.
• The aid recipient is obligated to notify Innovation Norway if they receive any other state aid, as defined in article 61 of the EEA-agreement.
• Innovation Norway is entitled to withhold payments under the scheme if the measure is not implemented as foreseen when the aid was granted.
• The Ministry of Trade, Industry and Fisheries and Innovation Norway are entitled to recall any aid that is deemed in violation of the conditions in the GBER.
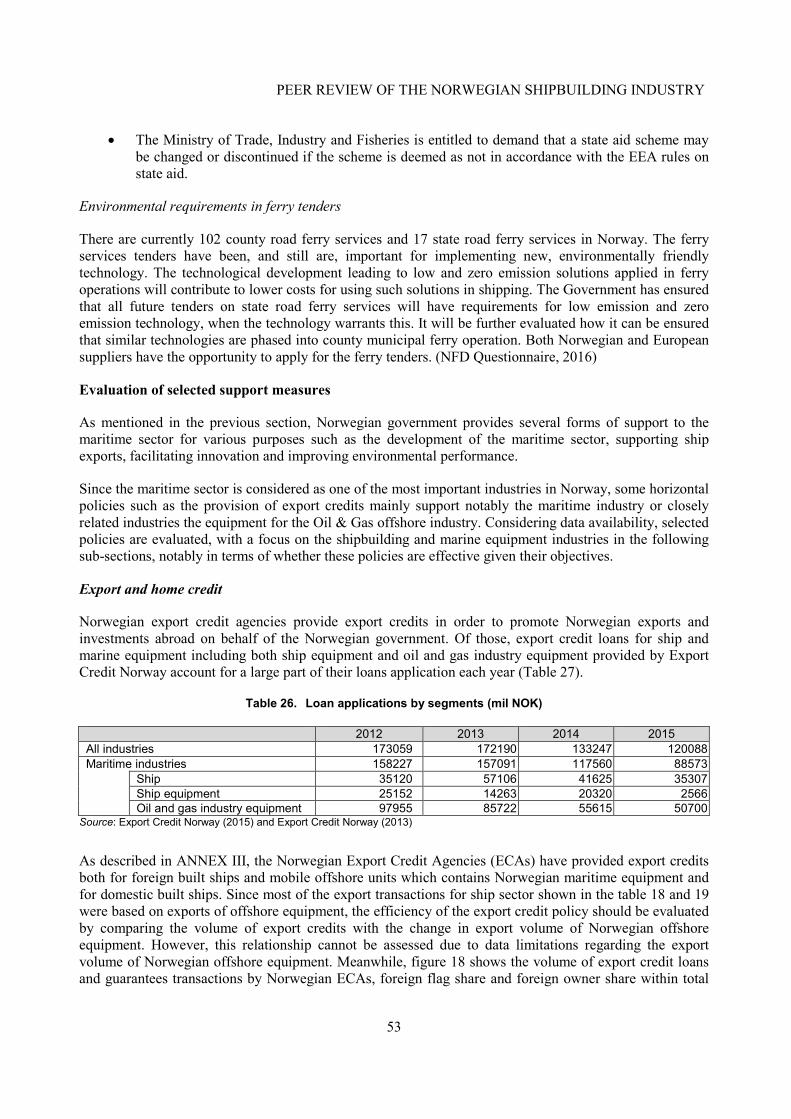
PEER REVIEW OF THE NORWEGIAN SHIPBUILDING INDUSTRY
53
• The Ministry of Trade, Industry and Fisheries is entitled to demand that a state aid scheme may be changed or discontinued if the scheme is deemed as not in accordance with the EEA rules on state aid.
Environmental requirements in ferry tenders
There are currently 102 county road ferry services and 17 state road ferry services in Norway. The ferry services tenders have been, and still are, important for implementing new, environmentally friendly technology. The technological development leading to low and zero emission solutions applied in ferry operations will contribute to lower costs for using such solutions in shipping. The Government has ensured that all future tenders on state road ferry services will have requirements for low emission and zero emission technology, when the technology warrants this. It will be further evaluated how it can be ensured that similar technologies are phased into county municipal ferry operation. Both Norwegian and European suppliers have the opportunity to apply for the ferry tenders. (NFD Questionnaire, 2016)
Evaluation of selected support measures
As mentioned in the previous section, Norwegian government provides several forms of support to the maritime sector for various purposes such as the development of the maritime sector, supporting ship exports, facilitating innovation and improving environmental performance.
Since the maritime sector is considered as one of the most important industries in Norway, some horizontal policies such as the provision of export credits mainly support notably the maritime industry or closely related industries the equipment for the Oil & Gas offshore industry. Considering data availability, selected policies are evaluated, with a focus on the shipbuilding and marine equipment industries in the following sub-sections, notably in terms of whether these policies are effective given their objectives.
Export and home credit
Norwegian export credit agencies provide export credits in order to promote Norwegian exports and investments abroad on behalf of the Norwegian government. Of those, export credit loans for ship and marine equipment including both ship equipment and oil and gas industry equipment provided by Export Credit Norway account for a large part of their loans application each year (Table 27).
Table 26. Loan applications by segments (mil NOK)
2012 2013 2014 2015 All industries 173059 172190 133247 120088 Maritime industries 158227 157091 117560 88573 Ship 35120 57106 41625 35307 Ship equipment 25152 14263 20320 2566 Oil and gas industry equipment 97955 85722 55615 50700
Source: Export Credit Norway (2015) and Export Credit Norway (2013)
As described in ANNEX III, the Norwegian Export Credit Agencies (ECAs) have provided export credits both for foreign built ships and mobile offshore units which contains Norwegian maritime equipment and for domestic built ships. Since most of the export transactions for ship sector shown in the table 18 and 19 were based on exports of offshore equipment, the efficiency of the export credit policy should be evaluated by comparing the volume of export credits with the change in export volume of Norwegian offshore equipment. However, this relationship cannot be assessed due to data limitations regarding the export volume of Norwegian offshore equipment. Meanwhile, figure 18 shows the volume of export credit loans and guarantees transactions by Norwegian ECAs, foreign flag share and foreign owner share within total
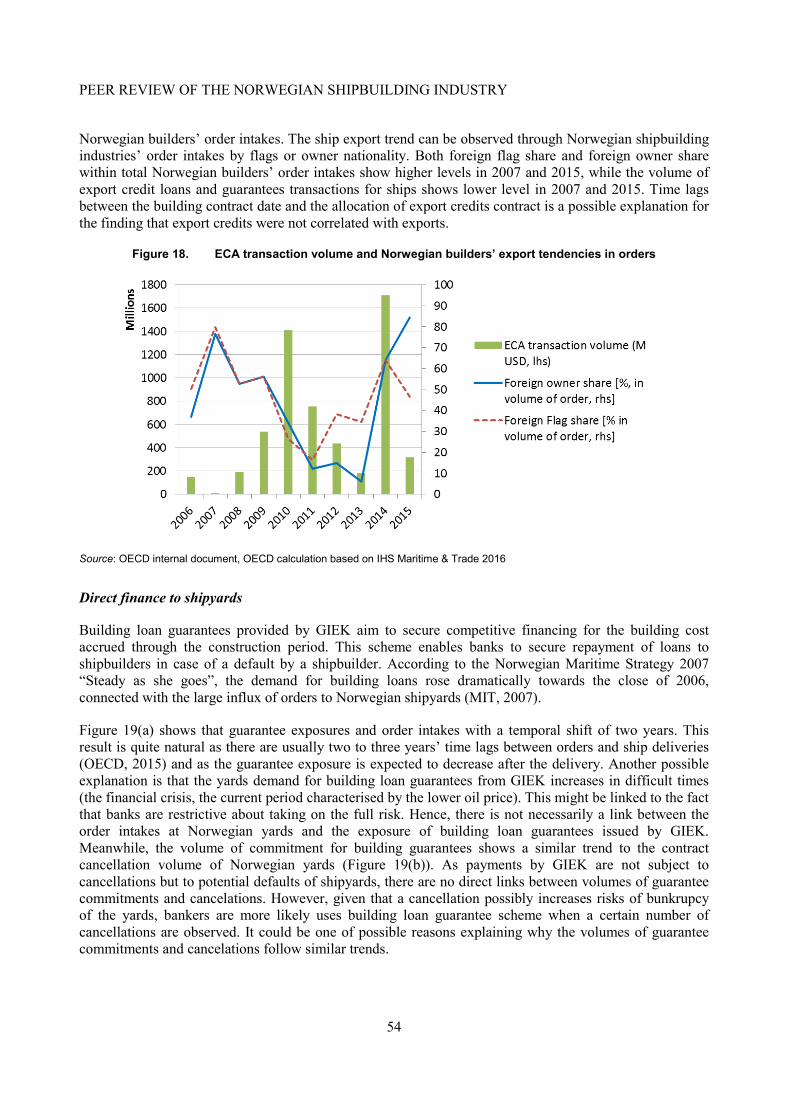
PEER REVIEW OF THE NORWEGIAN SHIPBUILDING INDUSTRY
54
Norwegian builders’ order intakes. The ship export trend can be observed through Norwegian shipbuilding industries’ order intakes by flags or owner nationality. Both foreign flag share and foreign owner share within total Norwegian builders’ order intakes show higher levels in 2007 and 2015, while the volume of export credit loans and guarantees transactions for ships shows lower level in 2007 and 2015. Time lags between the building contract date and the allocation of export credits contract is a possible explanation for the finding that export credits were not correlated with exports.
Figure 18. ECA transaction volume and Norwegian builders’ export tendencies in orders
Source: OECD internal document, OECD calculation based on IHS Maritime & Trade 2016
Direct finance to shipyards
Building loan guarantees provided by GIEK aim to secure competitive financing for the building cost accrued through the construction period. This scheme enables banks to secure repayment of loans to shipbuilders in case of a default by a shipbuilder. According to the Norwegian Maritime Strategy 2007 “Steady as she goes”, the demand for building loans rose dramatically towards the close of 2006, connected with the large influx of orders to Norwegian shipyards (MIT, 2007).
Figure 19(a) shows that guarantee exposures and order intakes with a temporal shift of two years. This result is quite natural as there are usually two to three years’ time lags between orders and ship deliveries (OECD, 2015) and as the guarantee exposure is expected to decrease after the delivery. Another possible explanation is that the yards demand for building loan guarantees from GIEK increases in difficult times (the financial crisis, the current period characterised by the lower oil price). This might be linked to the fact that banks are restrictive about taking on the full risk. Hence, there is not necessarily a link between the order intakes at Norwegian yards and the exposure of building loan guarantees issued by GIEK. Meanwhile, the volume of commitment for building guarantees shows a similar trend to the contract cancellation volume of Norwegian yards (Figure 19(b)). As payments by GIEK are not subject to cancellations but to potential defaults of shipyards, there are no direct links between volumes of guarantee commitments and cancelations. However, given that a cancellation possibly increases risks of bunkrupcy of the yards, bankers are more likely uses building loan guarantee scheme when a certain number of cancellations are observed. It could be one of possible reasons explaining why the volumes of guarantee commitments and cancelations follow similar trends.
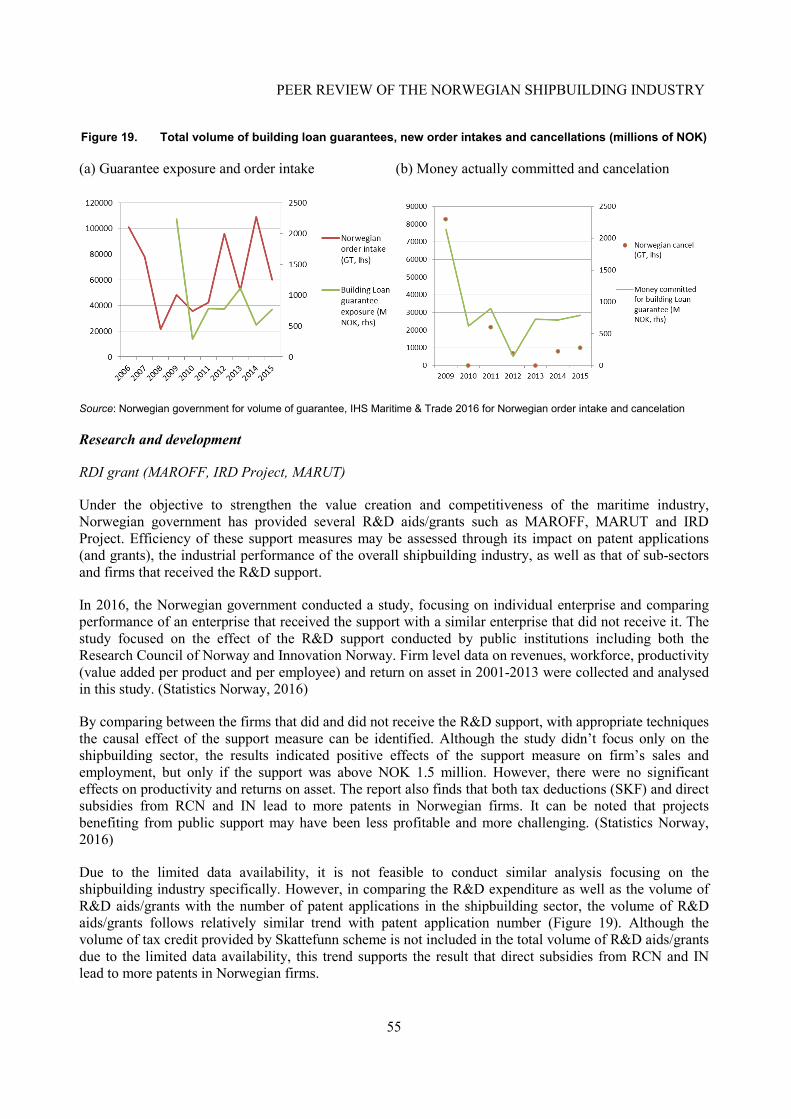
PEER REVIEW OF THE NORWEGIAN SHIPBUILDING INDUSTRY
55
Figure 19. Total volume of building loan guarantees, new order intakes and cancellations (millions of NOK)
(a) Guarantee exposure and order intake (b) Money actually committed and cancelation
Source: Norwegian government for volume of guarantee, IHS Maritime & Trade 2016 for Norwegian order intake and cancelation
Research and development
RDI grant (MAROFF, IRD Project, MARUT)
Under the objective to strengthen the value creation and competitiveness of the maritime industry, Norwegian government has provided several R&D aids/grants such as MAROFF, MARUT and IRD Project. Efficiency of these support measures may be assessed through its impact on patent applications (and grants), the industrial performance of the overall shipbuilding industry, as well as that of sub-sectors and firms that received the R&D support.
In 2016, the Norwegian government conducted a study, focusing on individual enterprise and comparing performance of an enterprise that received the support with a similar enterprise that did not receive it. The study focused on the effect of the R&D support conducted by public institutions including both the Research Council of Norway and Innovation Norway. Firm level data on revenues, workforce, productivity (value added per product and per employee) and return on asset in 2001-2013 were collected and analysed in this study. (Statistics Norway, 2016)
By comparing between the firms that did and did not receive the R&D support, with appropriate techniques the causal effect of the support measure can be identified. Although the study didn’t focus only on the shipbuilding sector, the results indicated positive effects of the support measure on firm’s sales and employment, but only if the support was above NOK 1.5 million. However, there were no significant effects on productivity and returns on asset. The report also finds that both tax deductions (SKF) and direct subsidies from RCN and IN lead to more patents in Norwegian firms. It can be noted that projects benefiting from public support may have been less profitable and more challenging. (Statistics Norway, 2016)
Due to the limited data availability, it is not feasible to conduct similar analysis focusing on the shipbuilding industry specifically. However, in comparing the R&D expenditure as well as the volume of R&D aids/grants with the number of patent applications in the shipbuilding sector, the volume of R&D aids/grants follows relatively similar trend with patent application number (Figure 19). Although the volume of tax credit provided by Skattefunn scheme is not included in the total volume of R&D aids/grants due to the limited data availability, this trend supports the result that direct subsidies from RCN and IN lead to more patents in Norwegian firms.
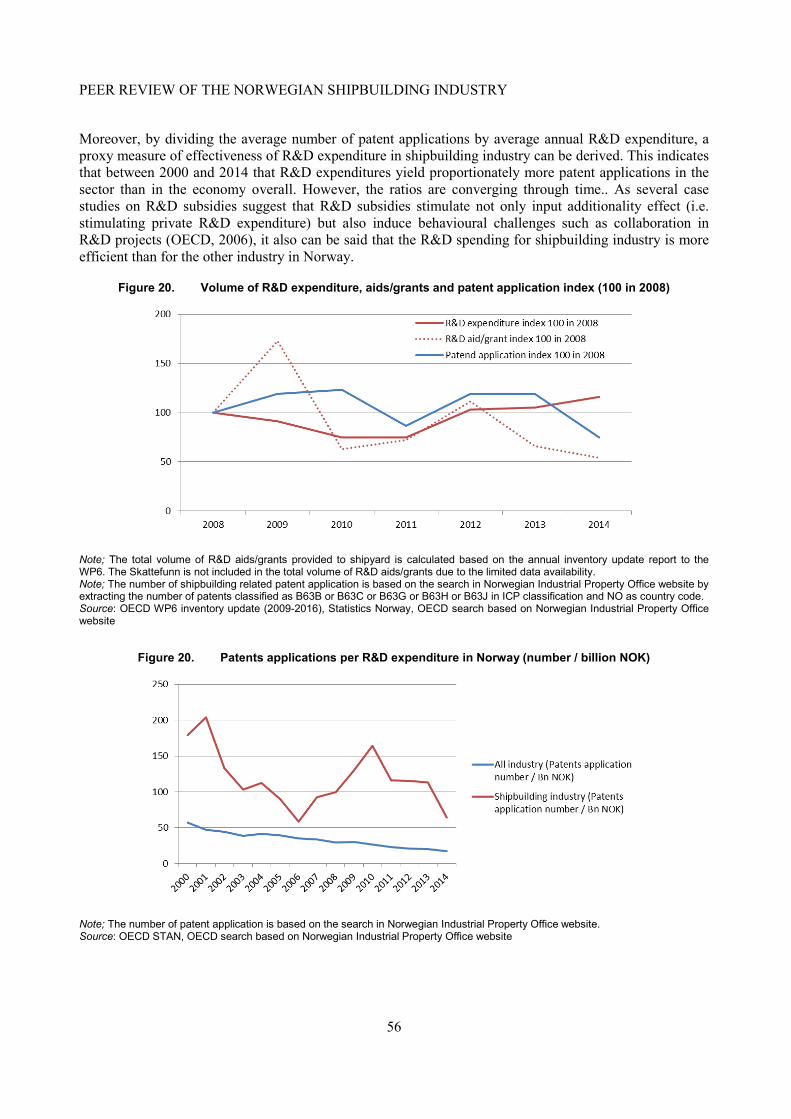
PEER REVIEW OF THE NORWEGIAN SHIPBUILDING INDUSTRY
56
Moreover, by dividing the average number of patent applications by average annual R&D expenditure, a proxy measure of effectiveness of R&D expenditure in shipbuilding industry can be derived. This indicates that between 2000 and 2014 that R&D expenditures yield proportionately more patent applications in the sector than in the economy overall. However, the ratios are converging through time.. As several case studies on R&D subsidies suggest that R&D subsidies stimulate not only input additionality effect (i.e. stimulating private R&D expenditure) but also induce behavioural challenges such as collaboration in R&D projects (OECD, 2006), it also can be said that the R&D spending for shipbuilding industry is more efficient than for the other industry in Norway.
Figure 20. Volume of R&D expenditure, aids/grants and patent application index (100 in 2008)
Note; The total volume of R&D aids/grants provided to shipyard is calculated based on the annual inventory update report to the WP6. The Skattefunn is not included in the total volume of R&D aids/grants due to the limited data availability. Note; The number of shipbuilding related patent application is based on the search in Norwegian Industrial Property Office website by extracting the number of patents classified as B63B or B63C or B63G or B63H or B63J in ICP classification and NO as country code. Source: OECD WP6 inventory update (2009-2016), Statistics Norway, OECD search based on Norwegian Industrial Property Office website
Figure 20. Patents applications per R&D expenditure in Norway (number / billion NOK)
Note; The number of patent application is based on the search in Norwegian Industrial Property Office website. Source: OECD STAN, OECD search based on Norwegian Industrial Property Office website
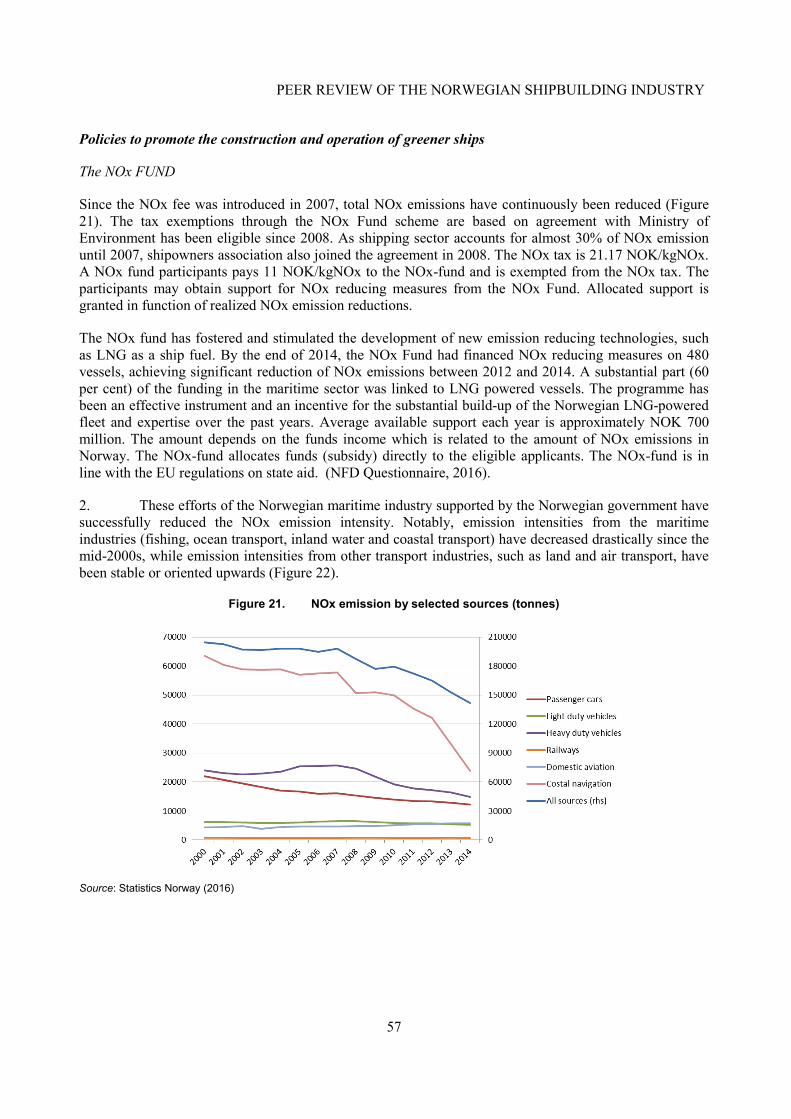
PEER REVIEW OF THE NORWEGIAN SHIPBUILDING INDUSTRY
57
Policies to promote the construction and operation of greener ships
The NOx FUND
Since the NOx fee was introduced in 2007, total NOx emissions have continuously been reduced (Figure 21). The tax exemptions through the NOx Fund scheme are based on agreement with Ministry of Environment has been eligible since 2008. As shipping sector accounts for almost 30% of NOx emission until 2007, shipowners association also joined the agreement in 2008. The NOx tax is 21.17 NOK/kgNOx. A NOx fund participants pays 11 NOK/kgNOx to the NOx-fund and is exempted from the NOx tax. The participants may obtain support for NOx reducing measures from the NOx Fund. Allocated support is granted in function of realized NOx emission reductions.
The NOx fund has fostered and stimulated the development of new emission reducing technologies, such as LNG as a ship fuel. By the end of 2014, the NOx Fund had financed NOx reducing measures on 480 vessels, achieving significant reduction of NOx emissions between 2012 and 2014. A substantial part (60 per cent) of the funding in the maritime sector was linked to LNG powered vessels. The programme has been an effective instrument and an incentive for the substantial build-up of the Norwegian LNG-powered fleet and expertise over the past years. Average available support each year is approximately NOK 700 million. The amount depends on the funds income which is related to the amount of NOx emissions in Norway. The NOx-fund allocates funds (subsidy) directly to the eligible applicants. The NOx-fund is in line with the EU regulations on state aid. (NFD Questionnaire, 2016).
2. These efforts of the Norwegian maritime industry supported by the Norwegian government have successfully reduced the NOx emission intensity. Notably, emission intensities from the maritime industries (fishing, ocean transport, inland water and coastal transport) have decreased drastically since the mid-2000s, while emission intensities from other transport industries, such as land and air transport, have been stable or oriented upwards (Figure 22).
Figure 21. NOx emission by selected sources (tonnes)
Source: Statistics Norway (2016)
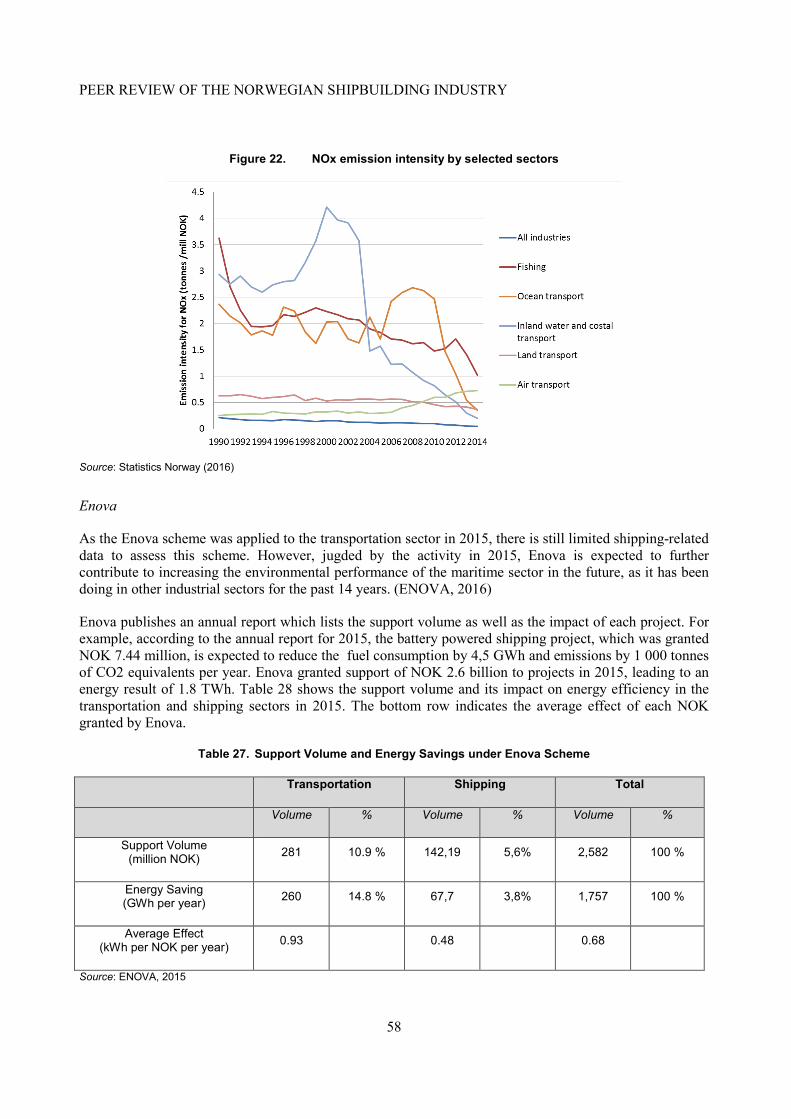
PEER REVIEW OF THE NORWEGIAN SHIPBUILDING INDUSTRY
58
Figure 22. NOx emission intensity by selected sectors
Source: Statistics Norway (2016)
Enova
As the Enova scheme was applied to the transportation sector in 2015, there is still limited shipping-related data to assess this scheme. However, jugded by the activity in 2015, Enova is expected to further contribute to increasing the environmental performance of the maritime sector in the future, as it has been doing in other industrial sectors for the past 14 years. (ENOVA, 2016)
Enova publishes an annual report which lists the support volume as well as the impact of each project. For example, according to the annual report for 2015, the battery powered shipping project, which was granted NOK 7.44 million, is expected to reduce the fuel consumption by 4,5 GWh and emissions by 1 000 tonnes of CO2 equivalents per year. Enova granted support of NOK 2.6 billion to projects in 2015, leading to an energy result of 1.8 TWh. Table 28 shows the support volume and its impact on energy efficiency in the transportation and shipping sectors in 2015. The bottom row indicates the average effect of each NOK granted by Enova.
Table 27. Support Volume and Energy Savings under Enova Scheme
Transportation Shipping Total
Volume % Volume % Volume %
Support Volume (million NOK) 281 10.9 % 142,19 5,6% 2,582 100 %
Energy Saving (GWh per year) 260 14.8 % 67,7 3,8% 1,757 100 %
Average Effect (kWh per NOK per year) 0.93 0.48 0.68
Source: ENOVA, 2015
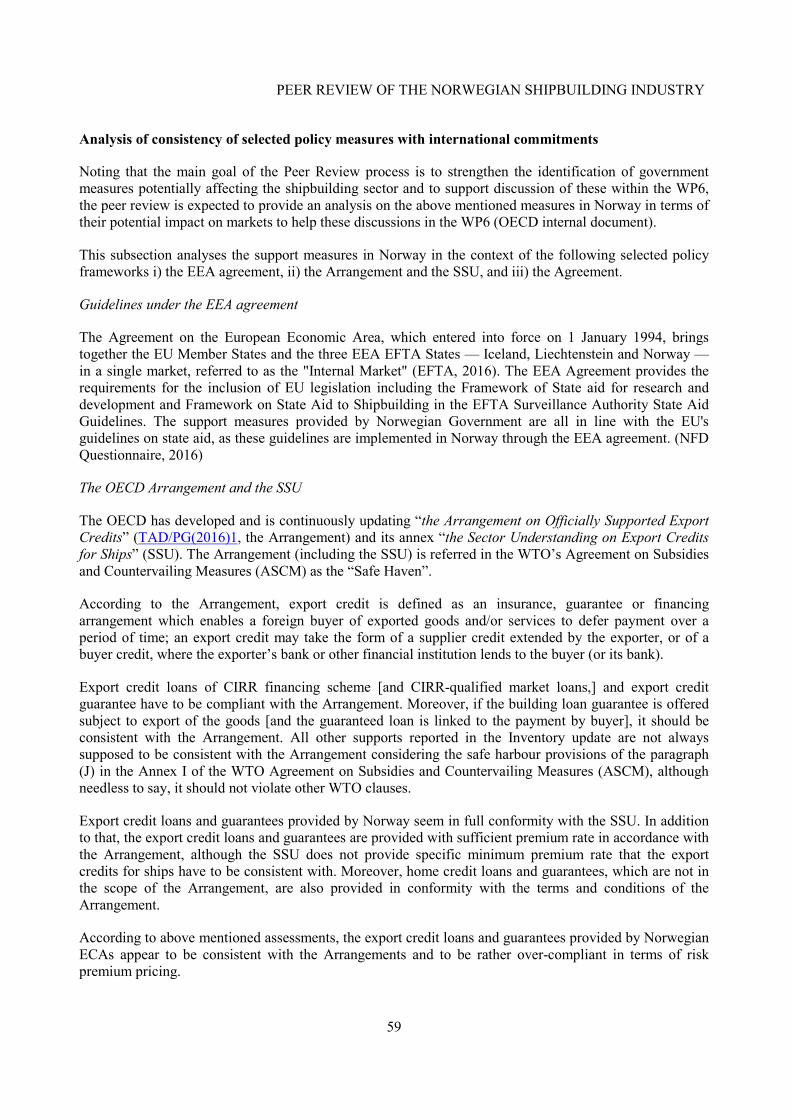
PEER REVIEW OF THE NORWEGIAN SHIPBUILDING INDUSTRY
59
Analysis of consistency of selected policy measures with international commitments
Noting that the main goal of the Peer Review process is to strengthen the identification of government measures potentially affecting the shipbuilding sector and to support discussion of these within the WP6, the peer review is expected to provide an analysis on the above mentioned measures in Norway in terms of their potential impact on markets to help these discussions in the WP6 (OECD internal document).
This subsection analyses the support measures in Norway in the context of the following selected policy frameworks i) the EEA agreement, ii) the Arrangement and the SSU, and iii) the Agreement.
Guidelines under the EEA agreement
The Agreement on the European Economic Area, which entered into force on 1 January 1994, brings together the EU Member States and the three EEA EFTA States — Iceland, Liechtenstein and Norway — in a single market, referred to as the "Internal Market" (EFTA, 2016). The EEA Agreement provides the requirements for the inclusion of EU legislation including the Framework of State aid for research and development and Framework on State Aid to Shipbuilding in the EFTA Surveillance Authority State Aid Guidelines. The support measures provided by Norwegian Government are all in line with the EU's guidelines on state aid, as these guidelines are implemented in Norway through the EEA agreement. (NFD Questionnaire, 2016)
The OECD Arrangement and the SSU
The OECD has developed and is continuously updating “the Arrangement on Officially Supported Export Credits” (TAD/PG(2016)1, the Arrangement) and its annex “the Sector Understanding on Export Credits for Ships” (SSU). The Arrangement (including the SSU) is referred in the WTO’s Agreement on Subsidies and Countervailing Measures (ASCM) as the “Safe Haven”.
According to the Arrangement, export credit is defined as an insurance, guarantee or financing arrangement which enables a foreign buyer of exported goods and/or services to defer payment over a period of time; an export credit may take the form of a supplier credit extended by the exporter, or of a buyer credit, where the exporter’s bank or other financial institution lends to the buyer (or its bank).
Export credit loans of CIRR financing scheme [and CIRR-qualified market loans,] and export credit guarantee have to be compliant with the Arrangement. Moreover, if the building loan guarantee is offered subject to export of the goods [and the guaranteed loan is linked to the payment by buyer], it should be consistent with the Arrangement. All other supports reported in the Inventory update are not always supposed to be consistent with the Arrangement considering the safe harbour provisions of the paragraph (J) in the Annex I of the WTO Agreement on Subsidies and Countervailing Measures (ASCM), although needless to say, it should not violate other WTO clauses.
Export credit loans and guarantees provided by Norway seem in full conformity with the SSU. In addition to that, the export credit loans and guarantees are provided with sufficient premium rate in accordance with the Arrangement, although the SSU does not provide specific minimum premium rate that the export credits for ships have to be consistent with. Moreover, home credit loans and guarantees, which are not in the scope of the Arrangement, are also provided in conformity with the terms and conditions of the Arrangement.
According to above mentioned assessments, the export credit loans and guarantees provided by Norwegian ECAs appear to be consistent with the Arrangements and to be rather over-compliant in terms of risk premium pricing.
PEER REVIEW OF THE NORWEGIAN SHIPBUILDING INDUSTRY
60
WP6 Instruments
As the instruments addressing overall measures in the global shipbuilding industry, the WP6 has approved the “Revised General Arrangement for the Progressive Removal of Obstacles to Normal Competitive Conditions in the Shipbuilding Industry” (C(82)194/FINAL), the “Revised General Guidelines for Government Policies in the Shipbuilding Industry and Shipbuilding Agreement” (C(83)27) and the “Agreement Respecting Normal Competitive Conditions in the Commercial Shipbuilding and Repair Industry” (the Agreement), while the Agreement has no entered in force. Still, it should be noted that the Agreement stipulates some concrete criteria in its Annex I, including the list of the prohibited measures. Therefore, relevance with these instruments could help the WP6 for the discussion on policy measures.
Box 4. Preliminary analysis of support measures with the provisions of the “Agreement”
Prohibited measures in the Agreement includes export credits inconsistent with the SSU, export subsidies, direct and indirect domestic support, R&D assistance, and regulations and practices such as domestic build requirement. Therefore, by referring to the Agreement, “the support for R&D” (MAROFF-program, SKATTEFUNN tax incentive IRD program, and two maritime specific instruments (“Maritime Development” and “Coastal Shipping”)) and “Loans on terms and conditions more favourable than those commercially available” (Innovation loan) can be discussed here.
For the support for R&D, the Agreement allows several types of R&D assistances including: a. Fundamental research14; b. Basic industrial research15, where the aid intensity is limited to 50 per cent of the eligible costs; c. Applied research16, where the aid intensity is limited to 35 percent of the eligible costs; or d. Development17, where the aid intensity is limited to 25 percent of the eligible costs.18 (Annex I, B 3.)
o MAROFF-program is considered as a program for basic industrial research, applied research or development, depending on the project. According to the shipbuilding agreement, since the program is basically related to the environment, the limit of total support should be 75% of the eligible costs for basic industrial research, 60% of the eligible costs for applied research, and 50% of the eligible costs for development, subject to the consensus of the parties of the Agreement (the Annex I, B 3.). Therefore, MAROFF-program, which requires private actors to supply a minimum of 50%, is considered to be provided within the range of exceptions of prohibited subsidies in the Agreement.
o SKATTEFUNN tax incentive scheme enables Norwegian registered companies to receive a tax deduction of up to 20 percent of the eligible costs related to R&D activity. Although it is used broadly, this scheme is considered to be consistent with the Agreement since the incentive amount is less than 25 percent of eligible costs (the Annex I, B 3.)
o IRD Program is considered as a program for basic industrial research, applied research or development, depending on the project. The limit of the support depends on the size of the business, which may be up to 70% for feasibility study and industrial research, and up to 45% for development. Therefore, it is difficult to find out whether this program is consistent with the principle stated under the Agreement as it depends on the detailed terms and condition of each R&D project. The loans on terms and conditions more favourable than those commercially available are categorized as domestic supports which is basically recognized as prohibited subsidies listed in the Annex I (the Annex I, B 1, 2.) of the Agreement. However, it is difficult to prove whether the scheme is favorable or not. Furthermore, in case that the loans are not provided for the purpose of restructuring, it could be subject to the exception. Therefore Innovation Loan may not be regarded as prohibited subsidies in the Agreement.
Possible suggestions for the future reporting in the Inventory
Data on export and home credit could be reported separately.
The policies and measures which are reported in the 2016 Inventory update don’t include any direct support measures to shipbuilding companies. However, some of these measures such as the cluster program, Enova’s financial support, and recycling scheme might indirectly give benefits to some shipbuilders through a third party.
PEER REVIEW OF THE NORWEGIAN SHIPBUILDING INDUSTRY
61
ANNEX I SELECTED NORWEGIAN INSTITUTIONS INVOLVED IN THE MARITIME INDUSTRY
• www.nssm.no (Norwegian shipbuilders’ association) is part of www.norskindustri.no (Federation of Norwegian Industries): The organization represents approximately 2550 member companies with 130.000 employees. Member companies' interests are the Federation's main focus. The Federation of Norwegian Industries engages in the most important industrial and business policy issues.
• www.lo.no (The Norwegian Confederation of Trade Unions): The Norwegian Confederation of Trade Unions (LO) is decidedly the largest and most influential workers' organisation in Norway. LO has a strong position in society and has set its stamp on society's development for more than 100 years. About 900 000 workers are affiliated to the 22 national unions which in turn are affiliated to LO.
• www.ncemaritime.no (Norwegian Centre of Expertise, Maritime) The shipbuilding and maritime technology companies include ship designers, maritime equipment manufacturers are all united in one federation on a national level in Norway. It operates with its administration under the umbrella of the Federation of Norwegian Industries – the largest industrial association in Norway affiliated with the
• Norwegian Federation of Enterprises (NHO). The Federation of Norwegian Industries (maritime department) is a member of Sea Europe.
• The maritime equipment manufacturers are also organized under their marketing organisation, Norwegian Maritime Exporters, which organises common marketing activities such as international trade shows around the world.
• The Norwegian Shipowners’ Association - NSA, (https://www.rederi.no/en/) represents 150 shipping companies. NSA represents 1800 vessels and rigs operating worldwide. Half of the Norwegian fleet is engaged in the transport of goods and people, while the other half are working on offshore oil and gas. The fleet is characterized by specialized vessels both in intercontinental transport services and offshore operations in particular. The companies’ presence is highly global with approximately 740 offices in 100 countries. NSA also has two offices abroad, in Brussels and in Rio de Janeiro. On 1 January 2016, Norwegian shipowners had 149 ships on order, including 13 contracted with Norwegian shipyards. All rigs, 7 in number, are contracted abroad. Both the ordering of ships and rigs has decreased since last year. NSA enjoys a close dialogue and cooperation with all maritime sectors which constitute the Norwegian maritime cluster. The Norwegian Shipowners’ Association is a member of European Community Shipowners' Associations (http://www.ecsa.eu/) and the International Chamber of Shipping (http://www.ics-shipping.org/)
• Maritime Forum represents the maritime cluster in Norway. NSA is a Board Member of Maritime Forum. Maritime Forum was established in 1990 as a forum for persons employed in shipbuilding and technology, shipbrokers and maritime insurance, research and education, suppliers and unions. Maritime Forum is a network and advocacy organisation, bringing together industry, R&D representatives and trade unions, working to promote the interests of the Norwegian maritime sector. All of the above mentioned organizations are members of Maritimt Forum. The tri-partite relationship between labour unions, employers' organisations and the
PEER REVIEW OF THE NORWEGIAN SHIPBUILDING INDUSTRY
62
Government is a key feature of the Nordic model. It reduces the level of conflict and serves as an arena for broad discussions and negotiations. Within a company, similar relations between employer-employee improve and stimulate innovation and restructuring processes, and make changes easier to agree on.
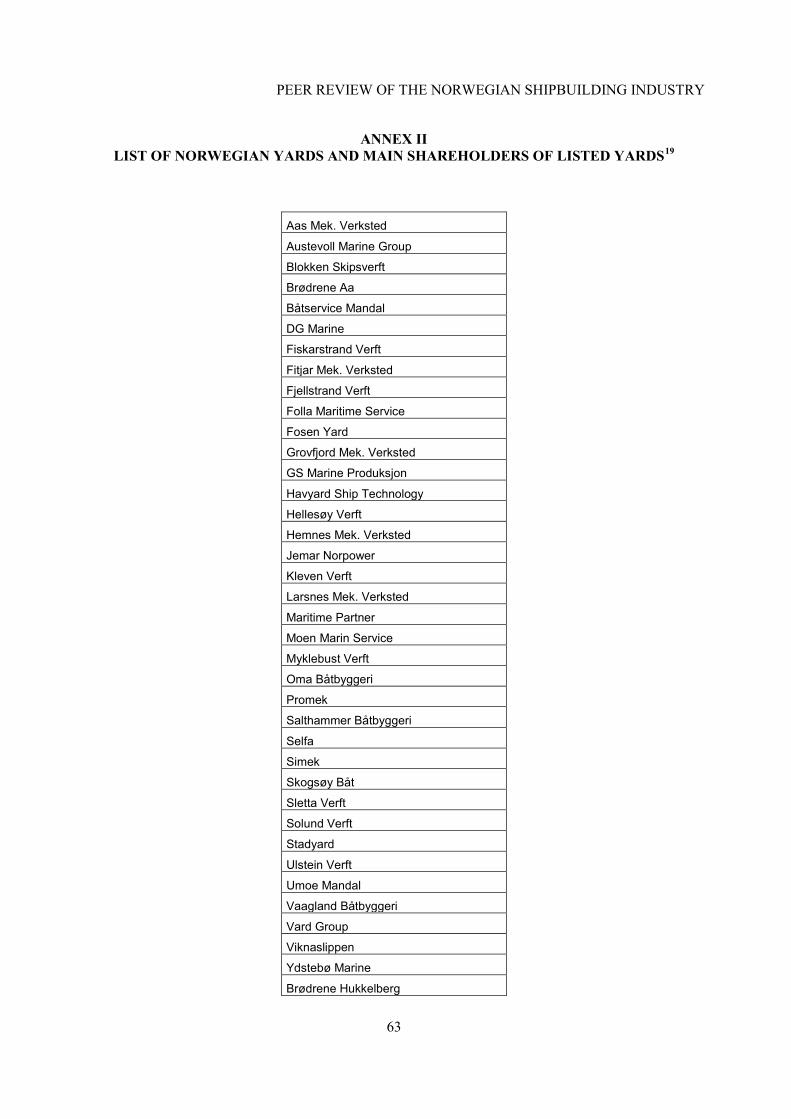
PEER REVIEW OF THE NORWEGIAN SHIPBUILDING INDUSTRY
63
ANNEX II LIST OF NORWEGIAN YARDS AND MAIN SHAREHOLDERS OF LISTED YARDS19
Aas Mek. Verksted
Austevoll Marine Group
Blokken Skipsverft
Brødrene Aa
Båtservice Mandal
DG Marine
Fiskarstrand Verft
Fitjar Mek. Verksted
Fjellstrand Verft
Folla Maritime Service
Fosen Yard
Grovfjord Mek. Verksted
GS Marine Produksjon
Havyard Ship Technology
Hellesøy Verft
Hemnes Mek. Verksted
Jemar Norpower
Kleven Verft
Larsnes Mek. Verksted
Maritime Partner
Moen Marin Service
Myklebust Verft
Oma Båtbyggeri
Promek
Salthammer Båtbyggeri
Selfa
Simek
Skogsøy Båt
Sletta Verft
Solund Verft
Stadyard
Ulstein Verft
Umoe Mandal
Vaagland Båtbyggeri
Vard Group
Viknaslippen
Ydstebø Marine
Brødrene Hukkelberg
PEER REVIEW OF THE NORWEGIAN SHIPBUILDING INDUSTRY
64
Noryards BMW
Ballstad Slip
Barents Skipsservice
Båtbygg
Drammen Yard
Frydenbø Øksfjord Slip
GMC Maritime
Grovfjord Båtbyggeri
Halsnøy Dokk
Hammerfest Industriservcie
Harstad Mek. Verksted
Havøysund Patentslipp
KIMEK
Kvernhusvik Skipsverft
Maritim Slip & Motor
Mundal Båt
Patentslipen
Solstrand Verft
Ørnli Slipp Main shareholders of Havyard ASA Havila Holding AS 63.47% Geir Johan Bakke AS 5.33% Skandinaviska Enskilda Banken S.a. 2.20% Morgan Stanley & Co. Llc 2.19% Goldman Sachs & Co Equity Segregat 2.17% Erle Invest AS 1.80% Main shareholders of Bergen Group Brian Chang Holdings 33.1% AS FLYFISK 29.5% KØHLERGRUPPEN AS 10% MP Pensjon PK 1.7% Ola Rustad AS 1.5% SØR-VARANGER INVEST 1.5%
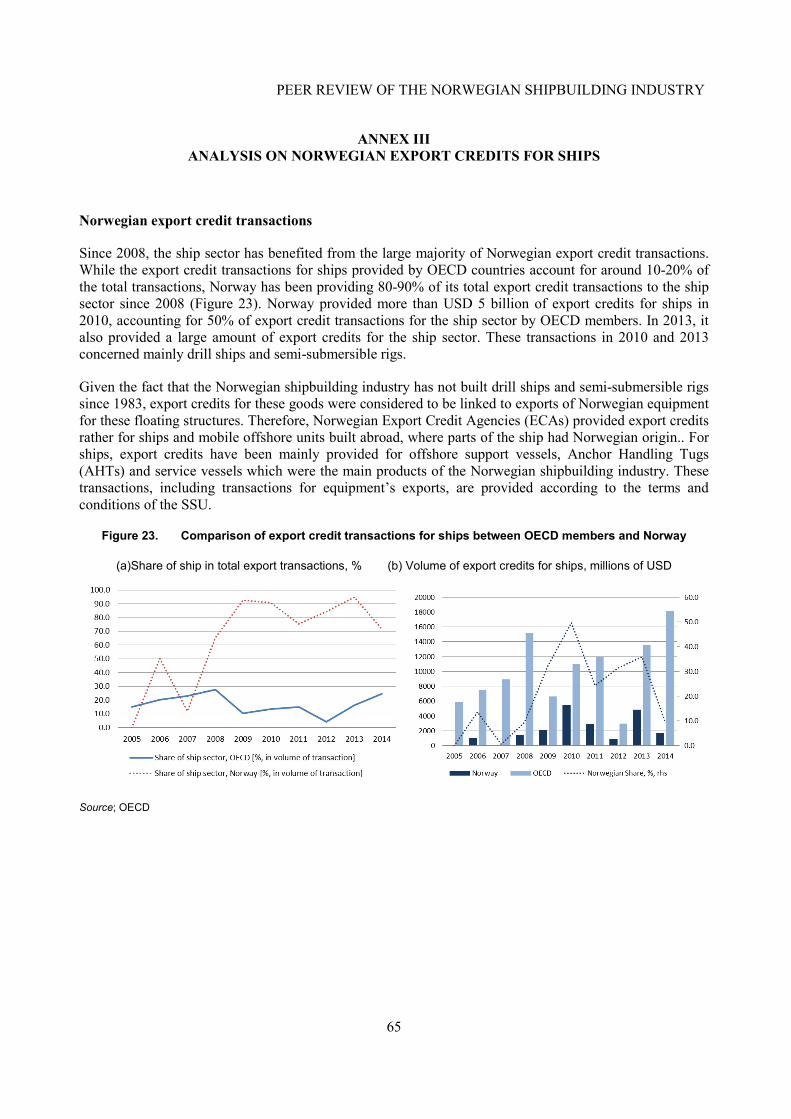
PEER REVIEW OF THE NORWEGIAN SHIPBUILDING INDUSTRY
65
ANNEX III ANALYSIS ON NORWEGIAN EXPORT CREDITS FOR SHIPS
Norwegian export credit transactions
Since 2008, the ship sector has benefited from the large majority of Norwegian export credit transactions. While the export credit transactions for ships provided by OECD countries account for around 10-20% of the total transactions, Norway has been providing 80-90% of its total export credit transactions to the ship sector since 2008 (Figure 23). Norway provided more than USD 5 billion of export credits for ships in 2010, accounting for 50% of export credit transactions for the ship sector by OECD members. In 2013, it also provided a large amount of export credits for the ship sector. These transactions in 2010 and 2013 concerned mainly drill ships and semi-submersible rigs.
Given the fact that the Norwegian shipbuilding industry has not built drill ships and semi-submersible rigs since 1983, export credits for these goods were considered to be linked to exports of Norwegian equipment for these floating structures. Therefore, Norwegian Export Credit Agencies (ECAs) provided export credits rather for ships and mobile offshore units built abroad, where parts of the ship had Norwegian origin.. For ships, export credits have been mainly provided for offshore support vessels, Anchor Handling Tugs (AHTs) and service vessels which were the main products of the Norwegian shipbuilding industry. These transactions, including transactions for equipment’s exports, are provided according to the terms and conditions of the SSU.
Figure 23. Comparison of export credit transactions for ships between OECD members and Norway
(a)Share of ship in total export transactions, % (b) Volume of export credits for ships, millions of USD
Source; OECD
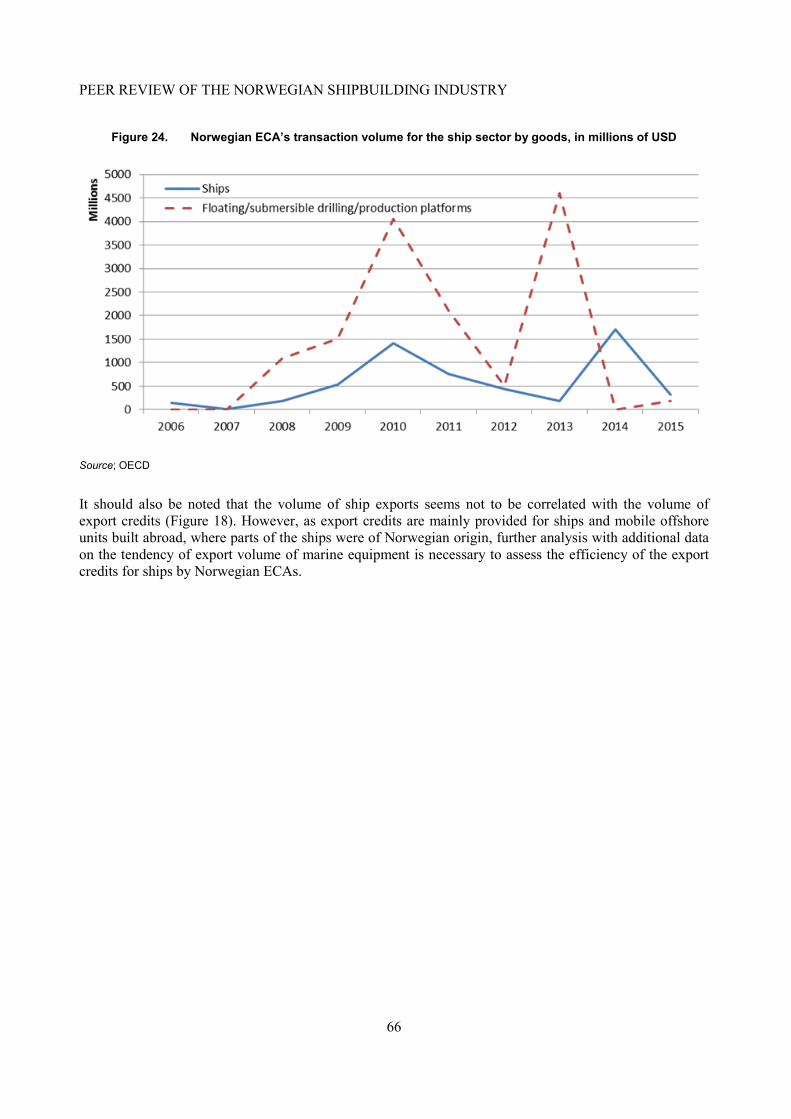
PEER REVIEW OF THE NORWEGIAN SHIPBUILDING INDUSTRY
66
Figure 24. Norwegian ECA’s transaction volume for the ship sector by goods, in millions of USD
Source; OECD
It should also be noted that the volume of ship exports seems not to be correlated with the volume of export credits (Figure 18). However, as export credits are mainly provided for ships and mobile offshore units built abroad, where parts of the ships were of Norwegian origin, further analysis with additional data on the tendency of export volume of marine equipment is necessary to assess the efficiency of the export credits for ships by Norwegian ECAs.
PEER REVIEW OF THE NORWEGIAN SHIPBUILDING INDUSTRY
67
NOTES
1 The offshore category includes well stimulation vessel, platform supply ship, anchor handling tug supply,
production testing vessel, offshore construction vessel, jack up, FSO oil, FPSO oil, pipe carrier, trenching support vessel, offshore tug/supply ship, drilling ship, standby safety vessel, gas processing vessel, pipe burying vessel, offshore support vessel, pipe layer, accommodation ship, pipe layer crane vessel, diving support vessel, crew/supply vessel. This explains the difference between the production shares (in cgt) for OSV (10.8%) and the whole offshore category (1.6%).
2 Thomson Reuters Datastream US $/NOK for 2014 of 6.1938 and for 2010 of 6.3015 for constant USD in 2010.
3 A revision of the relevant regulation, including new minimum wage rates, was undergoing a public consultation process in the summer of 2016. The draft regulation suggested increasing the minimum wage rate to 169 NOK for skilled workers and 154 NOK for non-skilled workers. The new minimum wage rates was adopted in September 2016.
4 For instance, the Norwegian shipbuilding company Kleven has been using robots for some years.
5 A standby vessel is a vessel located at an offshore installation and forming part of the offshore installation’s emergency preparedness. The standby vessel is arranged and equipped so that it is capable of retrieving persons from the water, providing first aid and temporarily accommodating everyone from the offshore installation or drilling ship.
6 USD/NOK fell to 8.17 in 2015 from 6.19 in 2014 (Thomson Reuters Datastream).
7 Capacity of yard i in time t is calculated on the basis of the maximum completions i over the last 15 years (t-15):
𝑐𝑐𝑐𝑐𝑐𝑐𝑐𝑐𝑐𝑐𝑐𝑐𝑐𝑐𝑐𝑐𝑖𝑖,𝑡𝑡 = max (𝑐𝑐𝑐𝑐𝑐𝑐𝑐𝑐𝑐𝑐𝑐𝑐𝑐𝑐𝑐𝑐𝑐𝑐𝑐𝑐𝑖𝑖,)𝑡𝑡,𝑡𝑡−15
Capacity calculations are based on data of six ship categories, notably offshore, bulk carrier, dry cargo passenger, fishing, tanker and miscellaneous. Furthermore, this calculation takes into account the shift of yards into ship repair and conversion activities under the assumption that no capacity increase has been undertaken that is devoted to repair operations.
Capacity utilization rates (cur) of yard i in time t are based on the ratio of completions i to its capacity:
𝑐𝑐𝑐𝑐𝑐𝑐𝑖𝑖,𝑡𝑡 =𝑐𝑐𝑐𝑐𝑐𝑐𝑐𝑐𝑐𝑐𝑐𝑐𝑐𝑐𝑐𝑐𝑐𝑐𝑐𝑐𝑐𝑐𝑖𝑖,𝑡𝑡𝑐𝑐𝑐𝑐𝑐𝑐𝑐𝑐𝑐𝑐𝑐𝑐𝑐𝑐𝑐𝑐𝑖𝑖 ,𝑡𝑡
Please note, due to data limitations capacity utilization rates do not account for capacity utilization devoted to ship repair or other yard activities except shipbuilding.
8 The ship equipment manufacturers' export values equals around 9% of total Norwegian exports of goods and services (excluding exports of crude oil and natural gas), and when adding drilling equipment the share amounts to 12.5%. As a comparison, one of Norway's most important export industries, the seafood industry, exported a value of NOK 67 billion in 2014 (Norsk Industri, 2015).
9 One third of equipment suppliers' turnover is related to the merchant fleet or speciality fleet such as navy, fishing vessels or vessels for the marine industry.
10 More details on the wealth tax: Individuals pay net wealth tax at a rate of 0.85% on their taxable net wealth, i.e. gross wealth less debt, in excess of a basic allowance of NOK 1.4 million in 2016. Spouses are granted one basic allowance each. As a general rule, all assets, including shares and business assets, are taxable and the
PEER REVIEW OF THE NORWEGIAN SHIPBUILDING INDUSTRY
68
taxable value of assets is equal to their market value. There are however some exceptions, such as intangible assets and goodwill, which are exempt from net wealth tax. Furthermore, homes and other immovable properties are valued partly well below market value. On average, commercial immovable property other than power plants, agricultural property and forestry property is valued at about 80% of market value in 2016 for wealth tax purposes. The taxable value of a primary residence (the home in which one lives) averages 25% of market value, whilst it is 80% for second dwellings (homes other than the primary residence, which are not commercial property or holiday homes.
11 In this report, a transaction means an export credit transaction by any export credit agency. In case of co-financing from multiple export credit agencies, a commitment from each export credit agency was counted as a separate transaction.
12 More information available at: http://www.skattefunn.no/prognett-skattefunn/Home_page/1222340152176 for further information
13 More information available at: http://www.innovationclusters.no/globalassets/filer/nic/publikasjoner/norwegian-clusters-2015.pdf
14 The term "fundamental research" means research activities independently conducted by higher education or research establishments for the enlargement of general scientific and technical knowledge, not linked to industrial or commercial objectives.
15 "Basic industrial research" is understood to mean original theoretical and experimental work whose objective is to achieve new and better understanding of the laws of science and engineering in general and as they might apply to an industrial sector or to the activities of a particular undertaking.
16 "Applied research" is understood to mean investigation or experimental work on the basis of the results of the basic research with a view to facilitating the attainment of specific practical objectives such as the creation of new products, production processes and services. It normally ends with the creation of a first prototype and does not include efforts whose principal aim is the design, development or testing of specific items of services to be considered for sale.
17 "Development" is understood to mean work based on the systematic use of scientific and technical knowledge in a design, development, testing or evaluation of a potential new product, production processes or service or of an improvement of an existing product or service to meet specific performance requirements and objectives. This stage will normally include pre-production models such as pilot and demonstration projects but does not include industrial application and commercial exploitation.
18 The maximum allowable aid intensity for research and development related to safety and the environment may be 25 percentage points higher than those percentages mentioned under b., c. and d. above, under the condition that the Parties Group has approved the project by consensus minus one, or more than 25 percentage points higher if the Parties Group has approved the project by consensus.
The maximum allowable aid intensity for research and development carried out by small and medium sized shipbuilding enterprises shall be 20 percentage points higher than those percentages mentioned at b., c. and d. above. Small and medium sized enterprises are those with less than 300 employees whose yearly sales figure does not exceed 20 million ECU and which are not more than twenty five percent owned by a large company.
19 Havyard and Bergen Group are the only ones that are listed on the Oslo Stock Exchange. Most of the yards are family controlled.
PEER REVIEW OF THE NORWEGIAN SHIPBUILDING INDUSTRY
69
REFERENCES
Blue maritime cluster (2016), Our blue vision, at http://www.bluemaritimecluster.no/gce/the-cluster/our-blue-vision/, accessed on 2 Februaly 2017
EFTA (2016), EEA agreement, at http://www.efta.int/eea/eea-agreement, accessed on 29 July 2016
ENOVA (2016), Open Enova SF Annual Report 2015, at https://www.enova.no/about-enova, accessed on 29 July 2016
Eures (April 2015), Working in the maritime and shipping sector in Norway, at http://www.eures.sk/clanok_detail.php?id=164, accessed on 2 Februaly 2017
Eures and NAV (Norwegian Labour and Welfare Administration) (August 2015), working on Working on the Norwegian shipyard industry, at https://www.google.fr/url?sa=t&rct=j&q=&esrc=s&source=web&cd=2&cad=rja&uact=8&ved=0ahUKEwirudjZs4fOAhWCvRQKHVoeCp0QFgglMAE&url=https%3A%2F%2Fwww.nav.no%2Fen%2FHome%2FWork%2Band%2Bstay%2Bin%2BNorway%2FRelatert%2Binformasjon%2F_attachment%2F275600%3F_download%3Dtrue%26_ts%3D14f64e0c018&usg=AFQjCNEaCP9utjCWrPOGl-GRBoRR4BRiBg&sig2=F5JPIq53LYocHl8RcTthpA, accessed on 2 Februaly 2017
European Commission (EC) (2016), Labour costs in the EU, at http://ec.europa.eu/eurostat/documents/2995521/7224742/3-01042016-AP-EN.pdf/453419da-91a5-4529-b6fd-708c2a47dc7f, accessed on 2 Februaly 2017
Export Credit Norway (2015), Export Credit Norway Annual report 2015, at https://www.eksportkreditt.no/Documents/WEB_dok/Finansielle%20rapporter/Export%20Credit%20Norway%20Annual%20Report%202015%20ENG.pdf, accessed on 29 July 2016
Export Credit Norway (2013), Export Credit Norway Annual report 2013, at https://www.eksportkreditt.no/Documents/WEB_dok/Finansielle%20rapporter/Eksportkreditt%20Norge_rapport%202013_ENG.pdf, accessed on 29 July 2016
IHS Maritime & Trade (2016), IHS Sea-web (dataset), at http://www.sea-web.com/seaweb_welcome.aspx, accessed on 3 September 2016
International Energy Agency (2011), Energy Policies of IEA Countries - Norway 2011 Review, at https://www.iea.org/publications/freepublications/publication/Norway2011_web.pdf, accessed on 2 Februaly 2017
GIEK (2015), Annual report 2015, at http://www.giek.no/resources/rapporter/GIEK_12953_Annual-Report_ENGELSK_WEB.pdf, accessed on 27 July 2016
Grabot, Bernard; Vallespir, Bruno; Samuel, Gomes; Bouras, Abdelaziz; Kiritsis, Dimitris (2014), Advances in Production Management Systems: Innovative and Knowledge Part 1
Maritim21 (2010), Om Maritim21, at http://www.maritim21.no/prognett-Maritim21/Om_Maritim21/1254006265213, accessed on 27 July 2016
PEER REVIEW OF THE NORWEGIAN SHIPBUILDING INDUSTRY
70
Menon economics (2015), Erik W. Jakobsen, Christian Svane Mellbye, Yuriy Zhovtobryukh, Global performance Benchmark - GCE Blue Maritime klyngekonferanse, at http://www.menon.no/wp-content/uploads/29klyngekonferansen-25-09.pdf, accessed on 2 Februaly 2017
Maritimt Forum/Menon Economics (2016), available in Norwegian at http://www.708090.no/, accessed on 2 Februaly 2017
NFD Questionnaire (2016) - Norwegian Ministry of Trade, Industry and Fisheries, unpublished information provided by the Ministry to the OECD Secretariat and discussions with government officials
Norsk Industri (2015), Norwegian Maritime Equipment Suppliers 2015 - Key performance indicators and future expectations, at http://www.menon.no/wp-content/uploads/28maritime-equipment-suppliers_2015.pdf, accessed on 2 Februaly 2017
Norwegian Innovation Clusters (2015), Norwegian Clusters 2015 – for the future’s innovative industries, at http://www.innovationclusters.no/globalassets/filer/nic/publikasjoner/norwegian-clusters-2015.pdf, accessed on 2 Februaly 2017
Norwegian Links (2015), ISSUE 2/2015 - The Maritime Industry, at http://www.norway.cn/Global/SiteFolders/webbeij/NL_022015_full.pdf, accessed on 2 Februaly 2017
Norwegian Shipowners’ Association (2016), Maritime outlook 2016, at http://online.fliphtml5.com/xmiv/puta/, accessed on 2 Februaly 2017
MTIF (2015), Maritime Opportunities – Blue Growth for a Green Future, at https://www.regjeringen.no/contentassets/05c0e04689cf4fc895398bf8814ab04c/maritim_strategi_engelsk_trykk.pdf, accessed on 27 July 2016
MTI (2007), The Norwegian Maritime Strategy 2007 “Steady as she goes”, at https://www.regjeringen.no/globalassets/upload/nhd/vedlegg/strategier2007/steadyasshegoes_2007.pdf, accessed on 2 Februaly 2017
OECD (1982), Revised General Arrangement for the Progressive Removal of Obstacles to Normal Competitive Conditions in the Shipbuilding Industry (C(82)194/FINAL), at http://acts.oecd.org/Instruments/ShowInstrumentView.aspx?InstrumentID=164&InstrumentPID=160&Lang=en&Book=, accessed on 2 Februaly 2017
OECD (1983), Revised General Guidelines for Government Policies in the Shipbuilding Industry and Shipbuilding Agreement (C(83)27), at http://acts.oecd.org/Instruments/ShowInstrumentView.aspx?InstrumentID=163&InstrumentPID=159&Lang=en&Book=, accessed on 2 Februaly 2017
OECD (1994), Agreement respecting normal competitive conditions in the commercial shipbuilding and repair industry, at http://www.oecd.org/sti/ind/1880215.pdf, accessed on 27 July 2016
OECD (1997), Policy Evaluation in Innovation and Technology: Towards Best Practices, at http://www.oecd.org/sti/inno/policyevaluationininnovationandtechnologytowardsbestpractices.htm, accessed on 2 Februaly 2017
OECD (2006), Government R&D Funding and Company Behaviour, measuring behavioural additionality, at http://www.oecd-ilibrary.org/science-and-technology/government-r-d-funding-and-company-behaviour_9789264025851-en, accessed on 2 Februaly 2017
PEER REVIEW OF THE NORWEGIAN SHIPBUILDING INDUSTRY
71
OECD (2016a), The Arrangement on Officially Supported Export Credits, at http://www.oecd.org/officialdocuments/publicdisplaydocumentpdf/?doclanguage=en&cote=tad/pg(2017)1, accessed on 8 February 2017
OECD (2016b), Economic survey of Norway, at http://www.oecd.org/eco/surveys/economic-survey-norway.htm, accessed on 2 Februaly 2017
Offshore Energy Today (13 August 2015), Havyard to let go 100 employees, at http://www.offshoreenergytoday.com/havyard-to-let-go-100-employees, accessed on 2 Februaly 2017
Reve Torger (2016), Competing in the Ocean Industries, at https://www.bi.edu/research/business-review/articles/2016/06/competing-in-the-ocean-industries/, accessed on 2 Februaly 2017
Statistics Norway (SBB) (2016), Statistics Norway (dataset), at https://www.ssb.no/en/, accessed on 22 July 2016
Tommy Johnsen (2013), The Norwegian NOx Fund – how does it work and results so far, at http://www.ndptl.org/c/document_library/get_file?folderId=19620&name=DLFE-1547.pdf, accessed on 2 Februaly 2017


![Weber aero dec2012-layup+rtm-low resolution [compatibility mode]](https://img.pdfslide.net/doc/110x75/555f138bd8b42a5c388b535d/weber-aero-dec2012-layuprtm-low-resolution-compatibility-mode.jpg)