Embed Size (px)
Citation preview
P a g e | 1
PENNDOT STRUCTURE BORING LOG INSTRUCTIONS
gINT
1. Prior to exporting and creating the structure boring logs check that the following information
has been input into gINT for each boring.
Subsurface data from the field investigation
Survey information: Stations, Offsets, and Elevation
Complete laboratory test data
Substructure Unit, substructure number
Foundation type, foundation elevations, and Top of Rock (If applicable).
0 hour and 24 hour groundwater level readings
Include all other information that is required for Structure Boring Logs as follows:
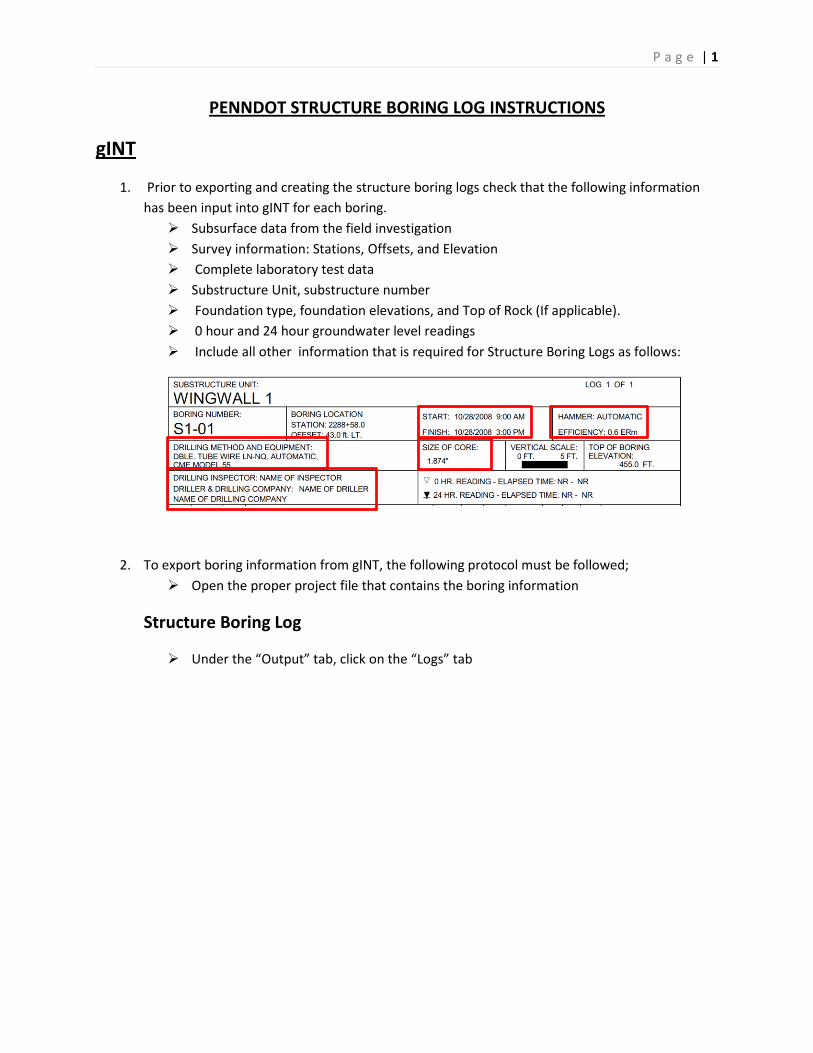
2. To export boring information from gINT, the following protocol must be followed;
Open the proper project file that contains the boring information
Structure Boring Log
Under the “Output” tab, click on the “Logs” tab
P a g e | 2
From the drop down menu at the top of the page (bright yellow), select “PENNDOT
STRUCTURE BORING LOG”
o Change paper size to 12” by 18”
Click the printer icon at the top left side of the page
P a g e | 3
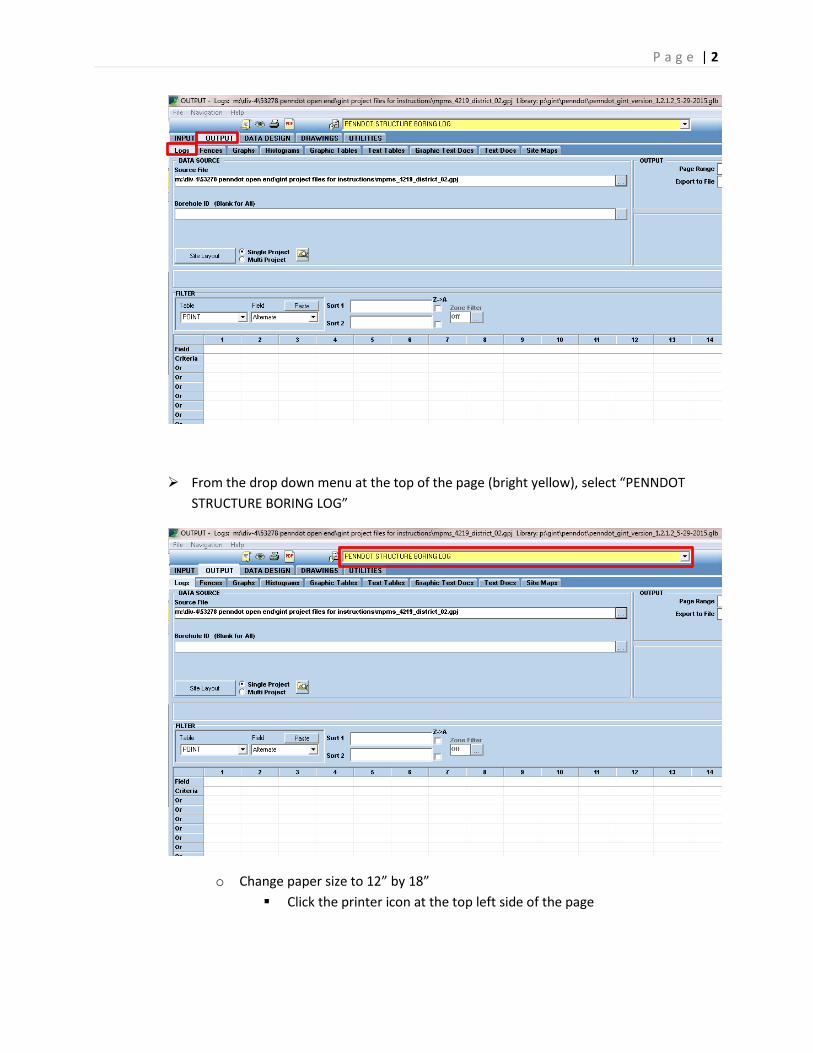
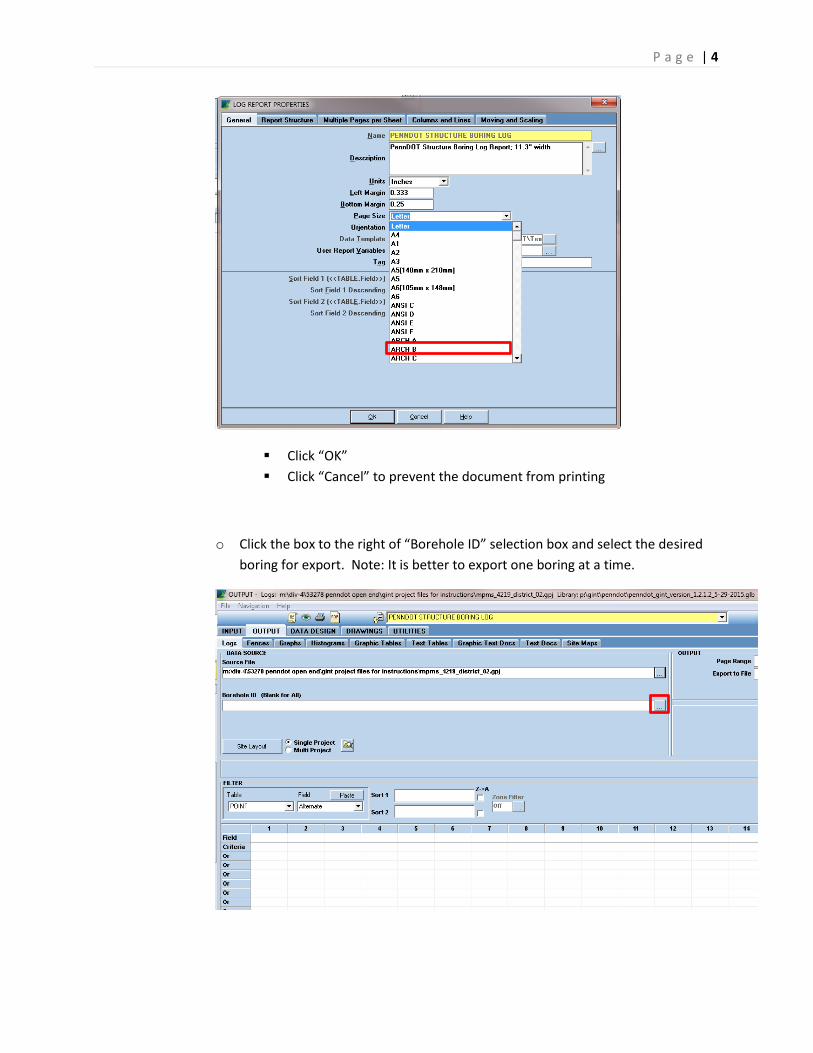
Select “Page”
From the “Page Size” drop down menu, select 12” x 18” or “Arch B”
depending on the default printer configuration
P a g e | 4
Click “OK”
Click “Cancel” to prevent the document from printing
o Click the box to the right of “Borehole ID” selection box and select the desired
boring for export. Note: It is better to export one boring at a time.
P a g e | 5
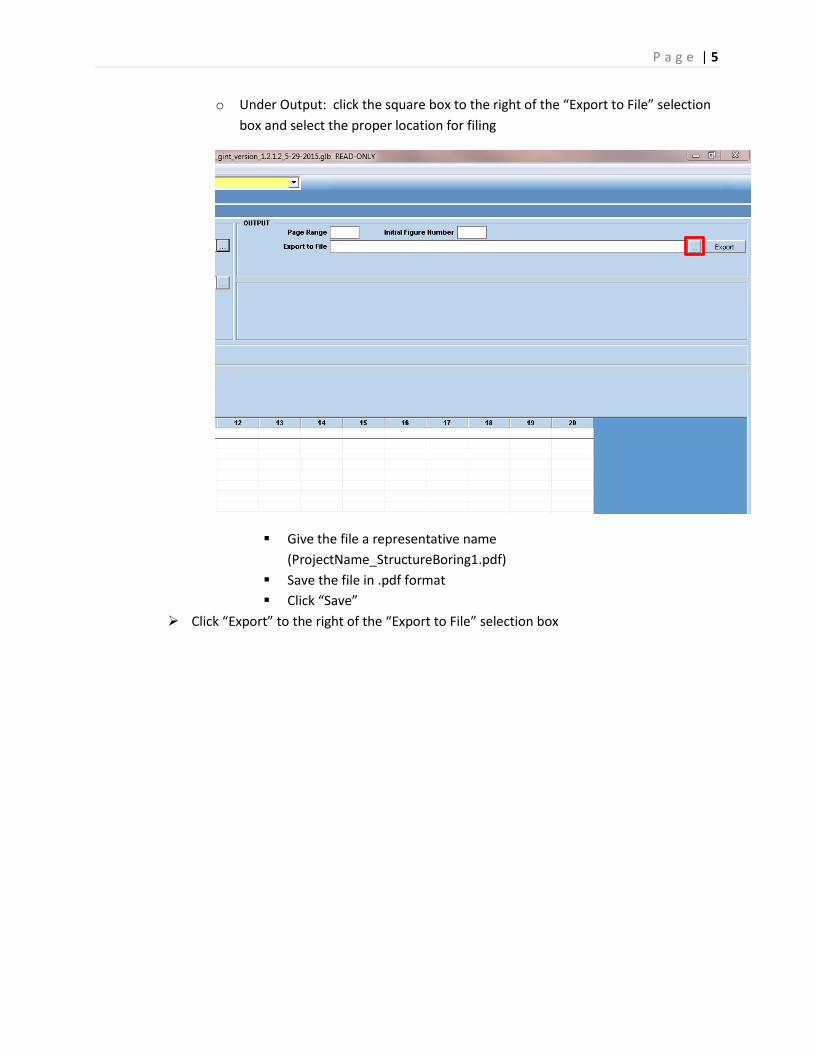
o Under Output: click the square box to the right of the “Export to File” selection
box and select the proper location for filing
Give the file a representative name
(ProjectName_StructureBoring1.pdf)
Save the file in .pdf format
Click “Save”
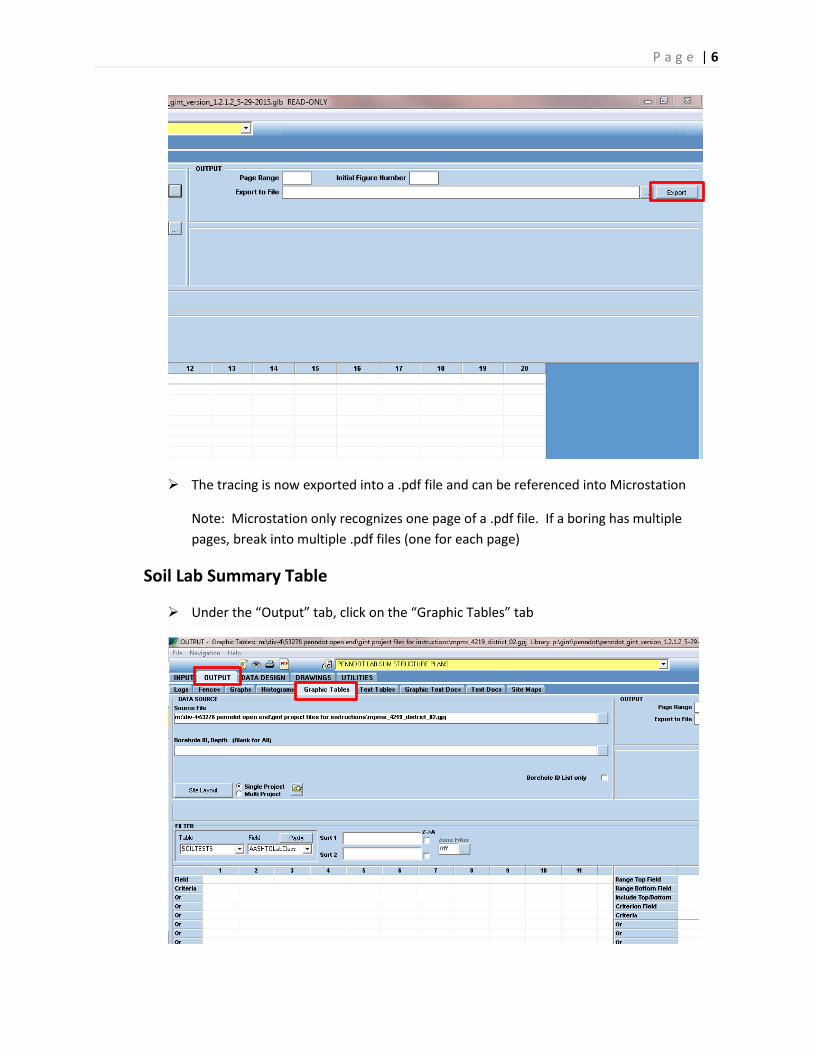
Click “Export” to the right of the “Export to File” selection box
P a g e | 6
The tracing is now exported into a .pdf file and can be referenced into Microstation
Note: Microstation only recognizes one page of a .pdf file. If a boring has multiple
pages, break into multiple .pdf files (one for each page)
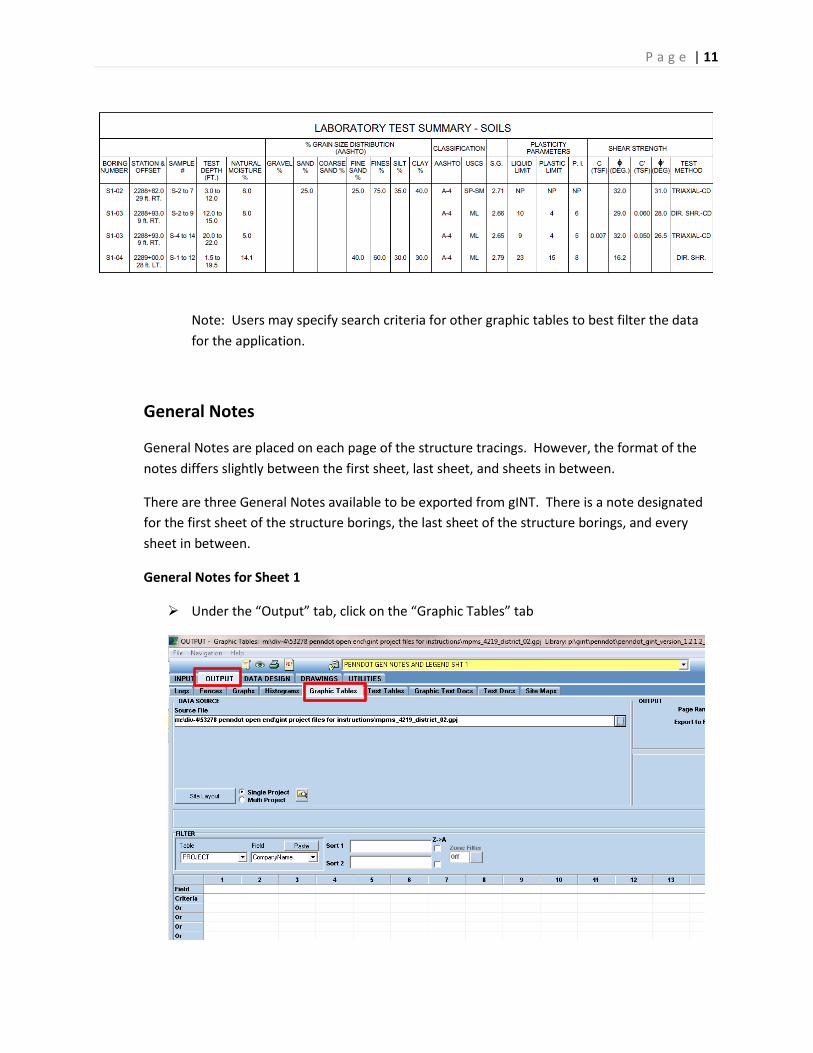
Soil Lab Summary Table
Under the “Output” tab, click on the “Graphic Tables” tab
P a g e | 7
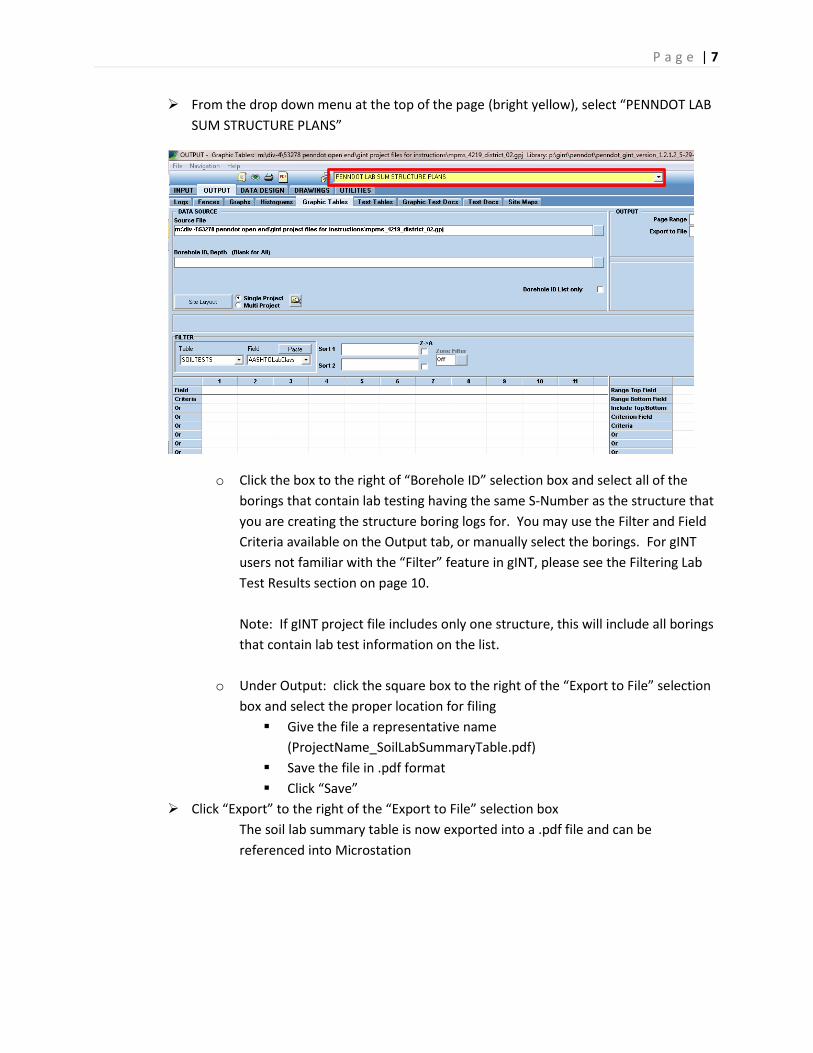
From the drop down menu at the top of the page (bright yellow), select “PENNDOT LAB
SUM STRUCTURE PLANS”
o Click the box to the right of “Borehole ID” selection box and select all of the
borings that contain lab testing having the same S-Number as the structure that
you are creating the structure boring logs for. You may use the Filter and Field
Criteria available on the Output tab, or manually select the borings. For gINT
users not familiar with the “Filter” feature in gINT, please see the Filtering Lab
Test Results section on page 10.
Note: If gINT project file includes only one structure, this will include all borings
that contain lab test information on the list.
o Under Output: click the square box to the right of the “Export to File” selection
box and select the proper location for filing
Give the file a representative name
(ProjectName_SoilLabSummaryTable.pdf)
Save the file in .pdf format
Click “Save”
Click “Export” to the right of the “Export to File” selection box
The soil lab summary table is now exported into a .pdf file and can be
referenced into Microstation
P a g e | 8
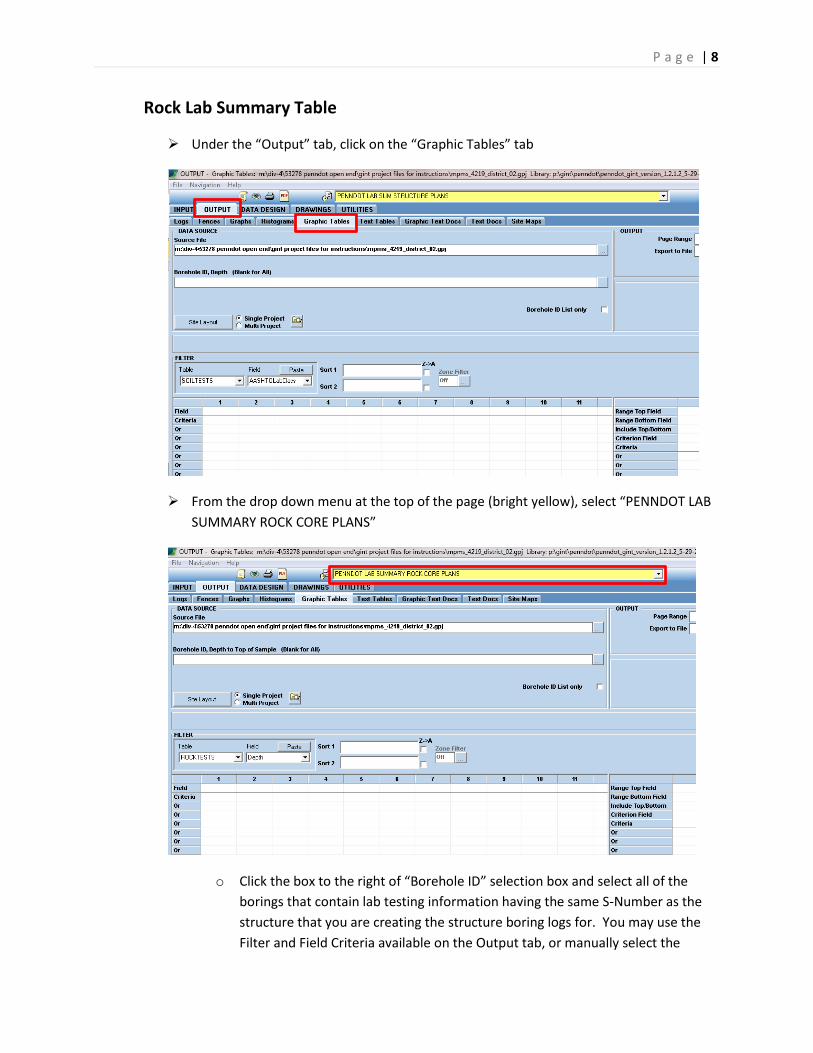
Rock Lab Summary Table
Under the “Output” tab, click on the “Graphic Tables” tab
From the drop down menu at the top of the page (bright yellow), select “PENNDOT LAB
SUMMARY ROCK CORE PLANS”
o Click the box to the right of “Borehole ID” selection box and select all of the
borings that contain lab testing information having the same S-Number as the
structure that you are creating the structure boring logs for. You may use the
Filter and Field Criteria available on the Output tab, or manually select the
P a g e | 9
borings. For gINT users not familiar with the “Filter” feature in gINT, please see
the Filtering Lab Test Results section on page 10.
Note: If gINT project file includes only one structure, this will include all borings
that contain lab test information on the list.
o Under Output: click the square box to the right of the “Export to File” selection
box and select the proper location for filing
Give the file a representative name
(ProjectName_RockLabSummaryTable.pdf)
Save the file in .pdf format
Click “Save”
Click “Export” to the right of the “Export to File” selection box
The rock lab summary table is now exported into a .pdf file and can be
referenced into Microstation
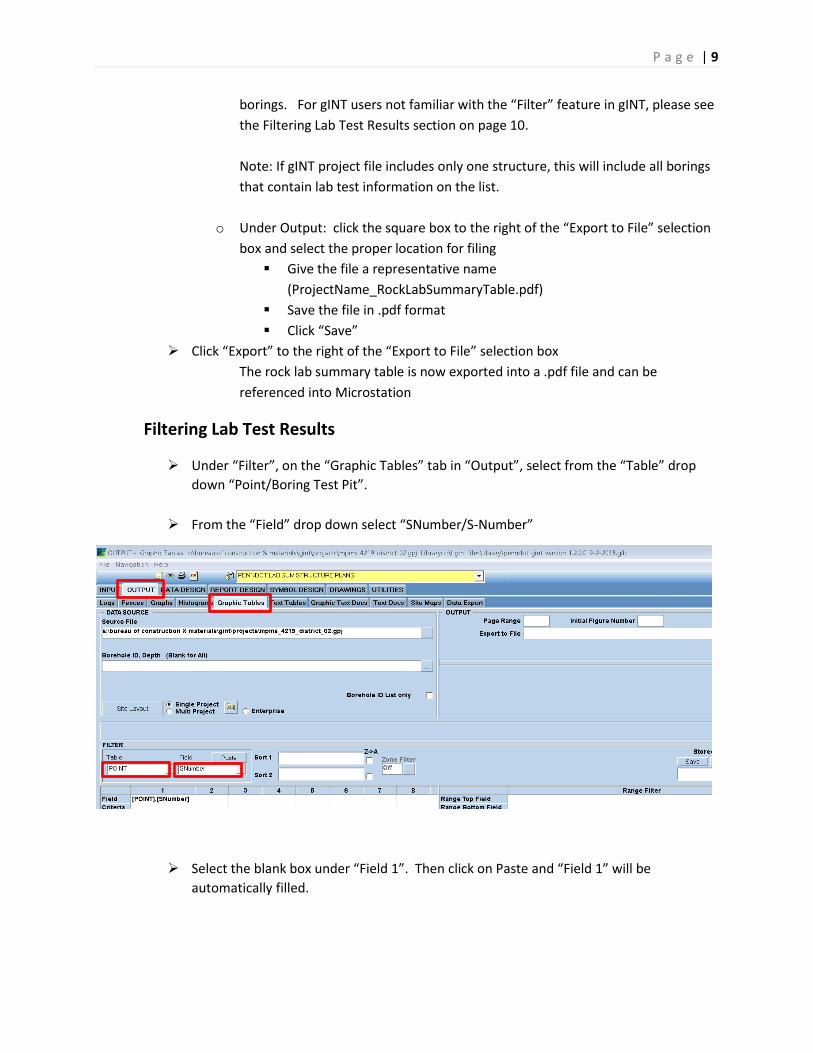
Filtering Lab Test Results
Under “Filter”, on the “Graphic Tables” tab in “Output”, select from the “Table” drop
down “Point/Boring Test Pit”.
From the “Field” drop down select “SNumber/S-Number”
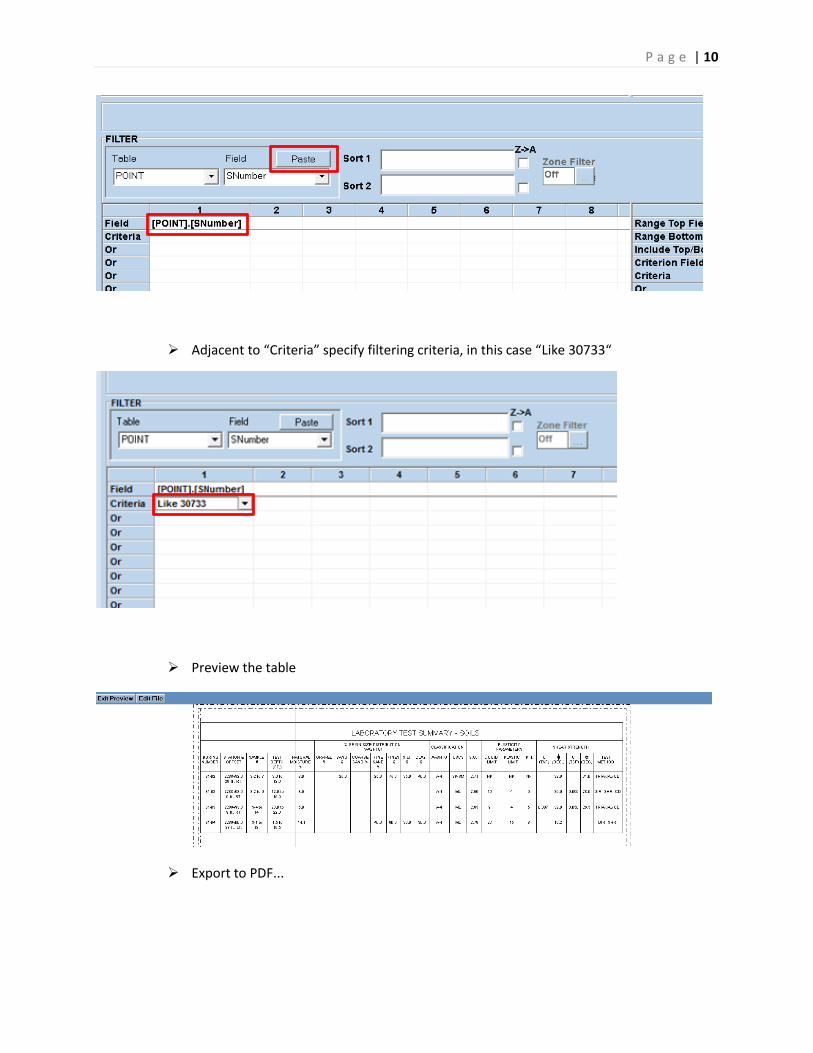
Select the blank box under “Field 1”. Then click on Paste and “Field 1” will be
automatically filled.
P a g e | 10
Adjacent to “Criteria” specify filtering criteria, in this case “Like 30733“
Preview the table
Export to PDF...
P a g e | 11
Note: Users may specify search criteria for other graphic tables to best filter the data
for the application.
General Notes
General Notes are placed on each page of the structure tracings. However, the format of the
notes differs slightly between the first sheet, last sheet, and sheets in between.
There are three General Notes available to be exported from gINT. There is a note designated
for the first sheet of the structure borings, the last sheet of the structure borings, and every
sheet in between.
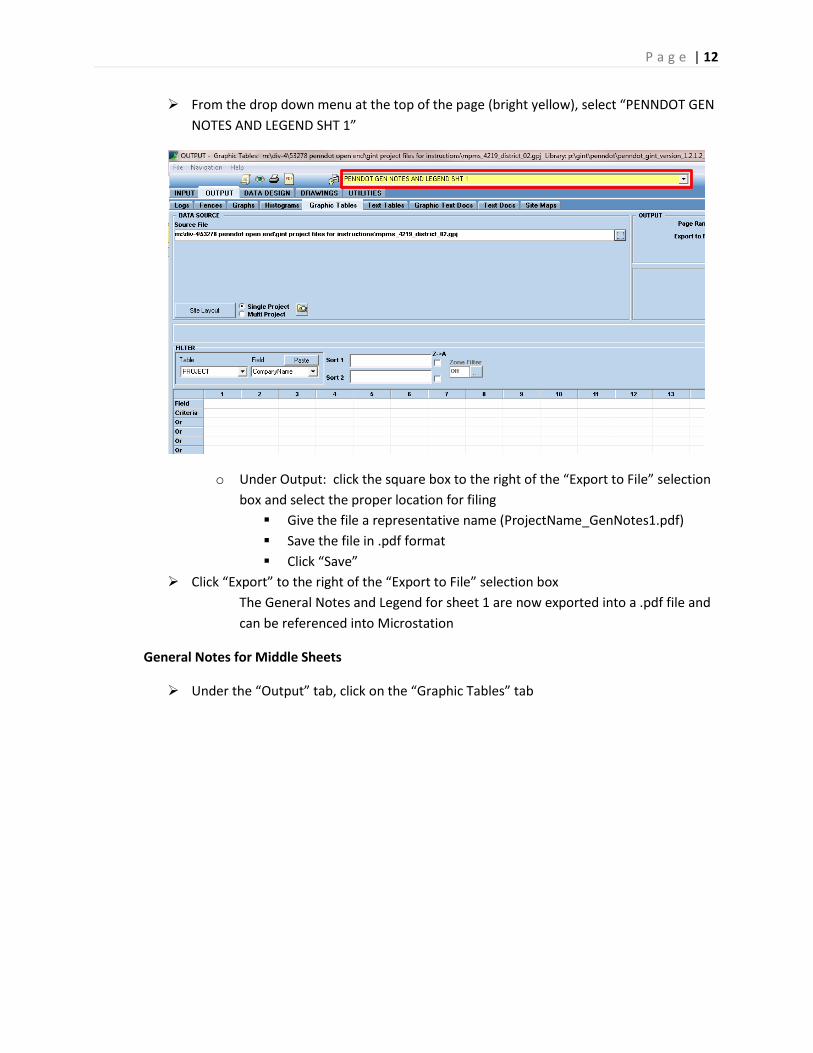
General Notes for Sheet 1
Under the “Output” tab, click on the “Graphic Tables” tab
P a g e | 12
From the drop down menu at the top of the page (bright yellow), select “PENNDOT GEN
NOTES AND LEGEND SHT 1”
o Under Output: click the square box to the right of the “Export to File” selection
box and select the proper location for filing
Give the file a representative name (ProjectName_GenNotes1.pdf)
Save the file in .pdf format
Click “Save”
Click “Export” to the right of the “Export to File” selection box
The General Notes and Legend for sheet 1 are now exported into a .pdf file and
can be referenced into Microstation
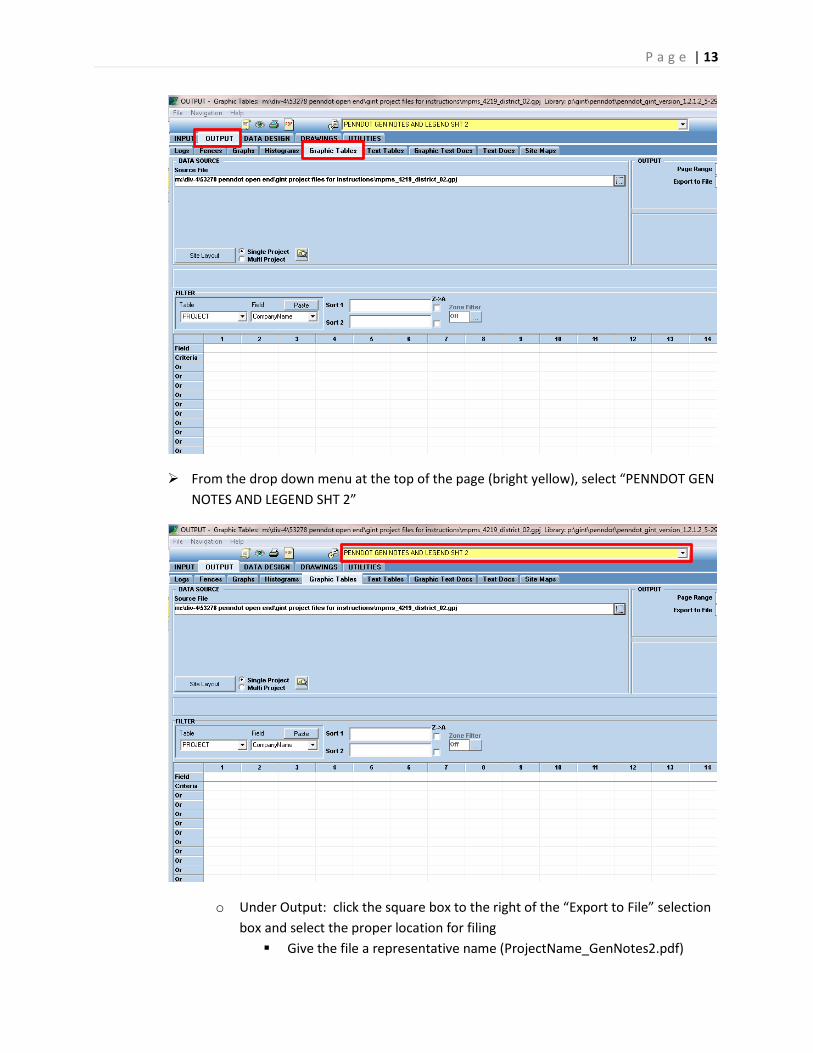
General Notes for Middle Sheets
Under the “Output” tab, click on the “Graphic Tables” tab
P a g e | 13
From the drop down menu at the top of the page (bright yellow), select “PENNDOT GEN
NOTES AND LEGEND SHT 2”
o Under Output: click the square box to the right of the “Export to File” selection
box and select the proper location for filing
Give the file a representative name (ProjectName_GenNotes2.pdf)
P a g e | 14
Save the file in .pdf format
Click “Save”
Click “Export” to the right of the “Export to File” selection box
The General Notes and Legend for the middle sheets are now exported into a
.pdf file and can be referenced into Microstation
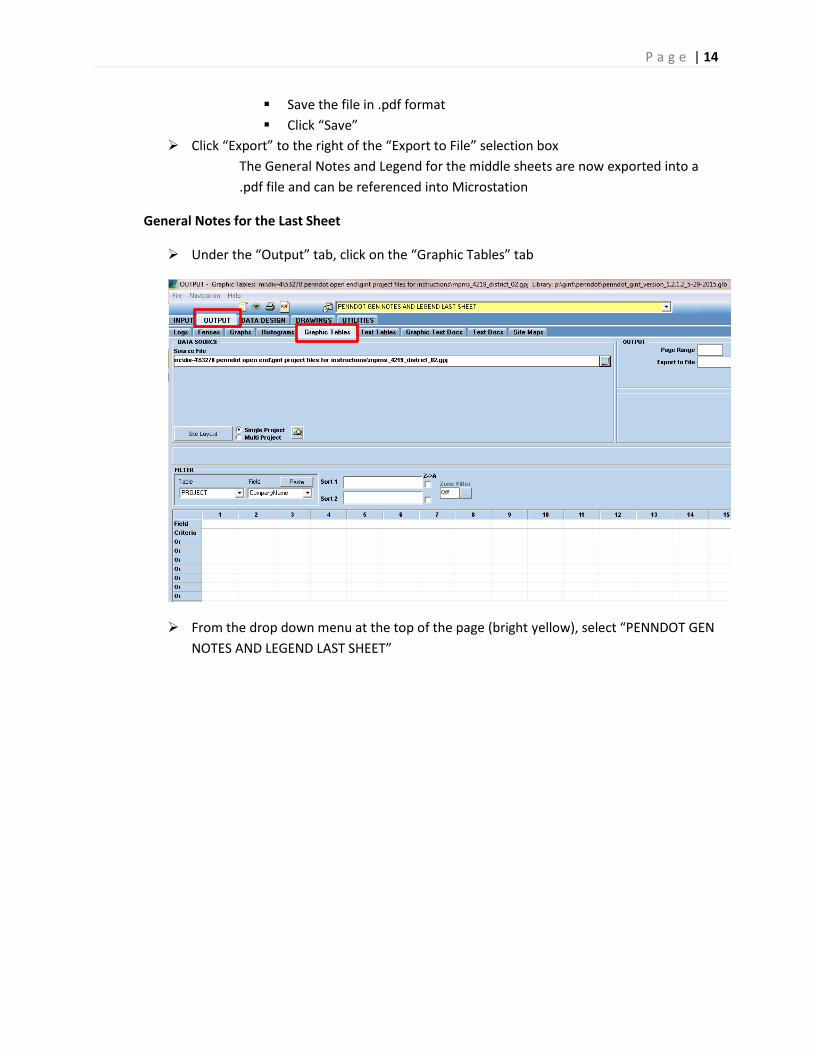
General Notes for the Last Sheet
Under the “Output” tab, click on the “Graphic Tables” tab
From the drop down menu at the top of the page (bright yellow), select “PENNDOT GEN
NOTES AND LEGEND LAST SHEET”
P a g e | 15
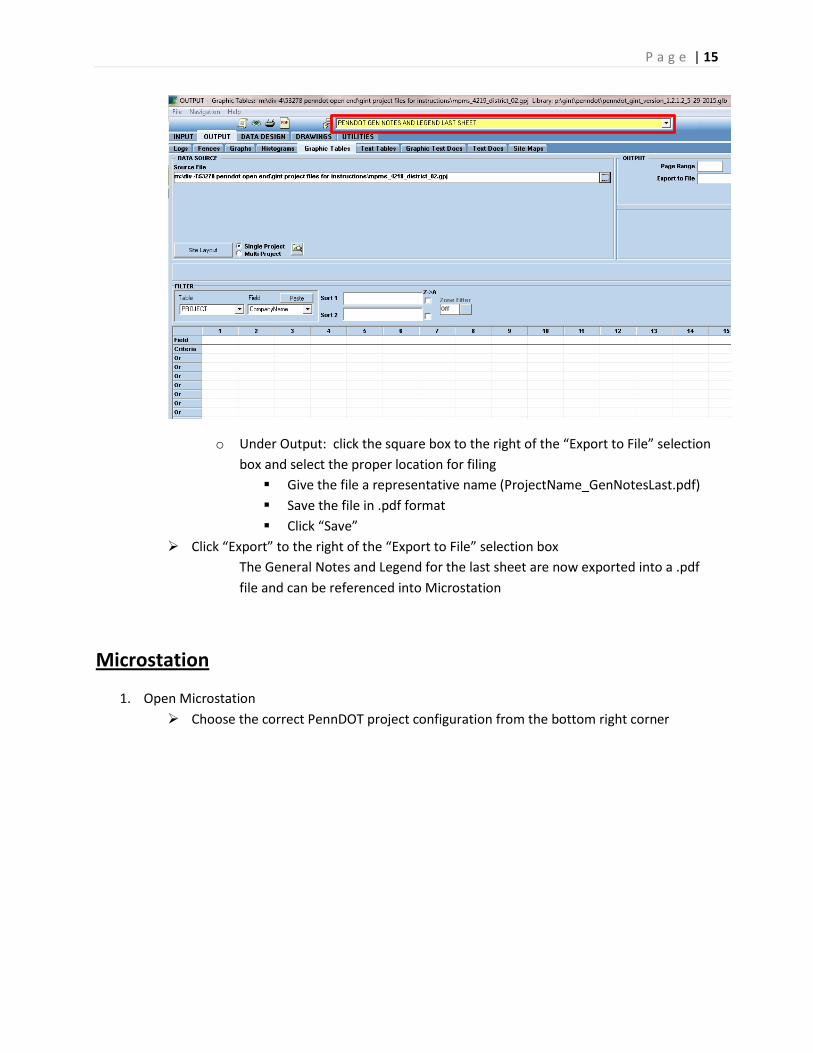
o Under Output: click the square box to the right of the “Export to File” selection
box and select the proper location for filing
Give the file a representative name (ProjectName_GenNotesLast.pdf)
Save the file in .pdf format
Click “Save”
Click “Export” to the right of the “Export to File” selection box
The General Notes and Legend for the last sheet are now exported into a .pdf
file and can be referenced into Microstation
Microstation
1. Open Microstation
Choose the correct PennDOT project configuration from the bottom right corner
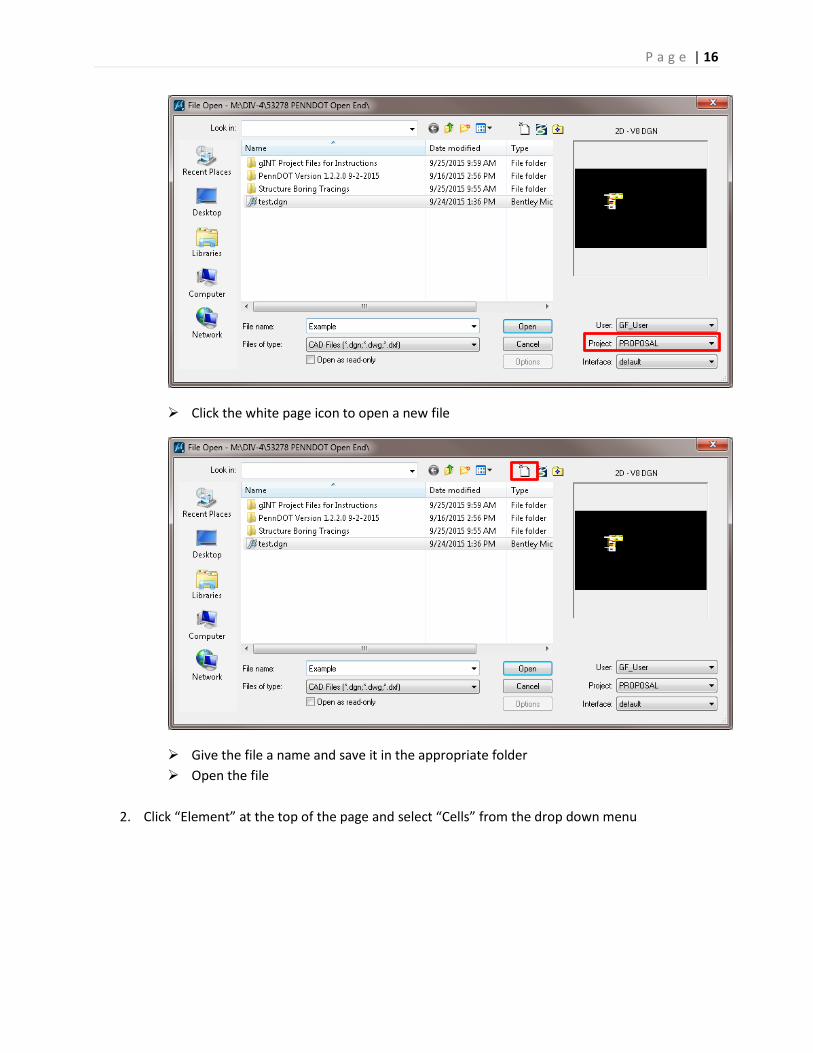
P a g e | 16
Click the white page icon to open a new file
Give the file a name and save it in the appropriate folder
Open the file
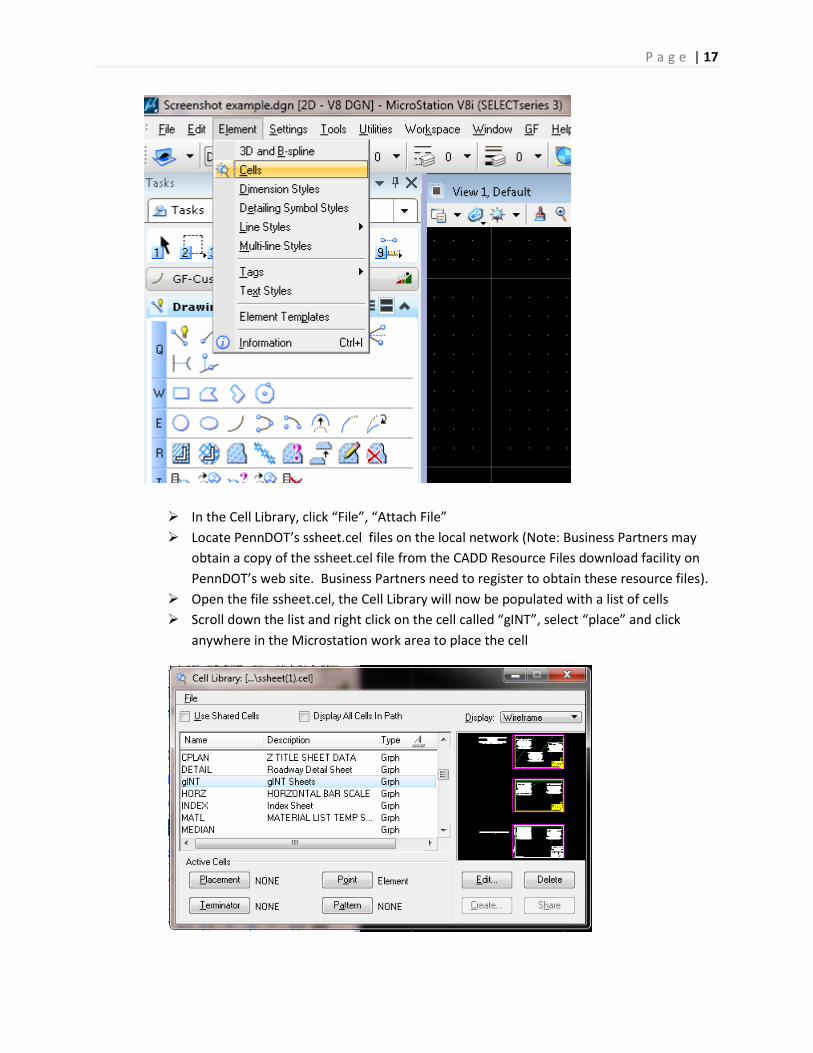
2. Click “Element” at the top of the page and select “Cells” from the drop down menu
P a g e | 17
In the Cell Library, click “File”, “Attach File”
Locate PennDOT’s ssheet.cel files on the local network (Note: Business Partners may
obtain a copy of the ssheet.cel file from the CADD Resource Files download facility on
PennDOT’s web site. Business Partners need to register to obtain these resource files).
Open the file ssheet.cel, the Cell Library will now be populated with a list of cells
Scroll down the list and right click on the cell called “gINT”, select “place” and click
anywhere in the Microstation work area to place the cell
P a g e | 18
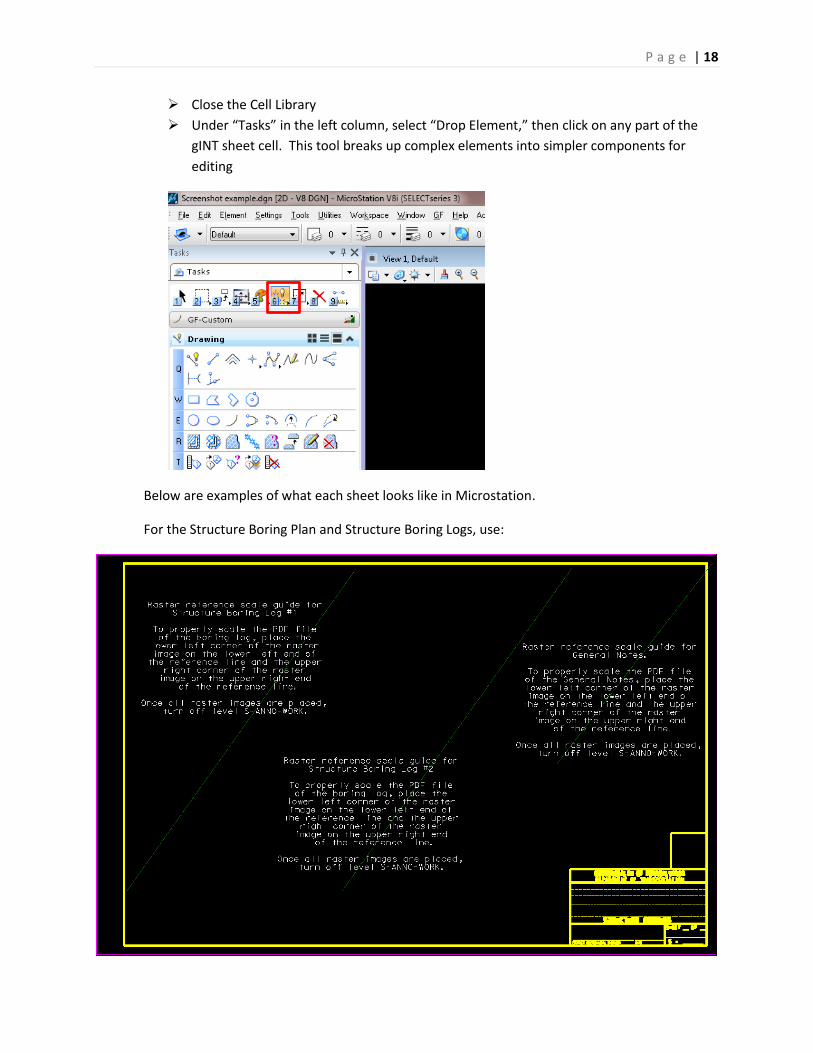
Close the Cell Library
Under “Tasks” in the left column, select “Drop Element,” then click on any part of the
gINT sheet cell. This tool breaks up complex elements into simpler components for
editing
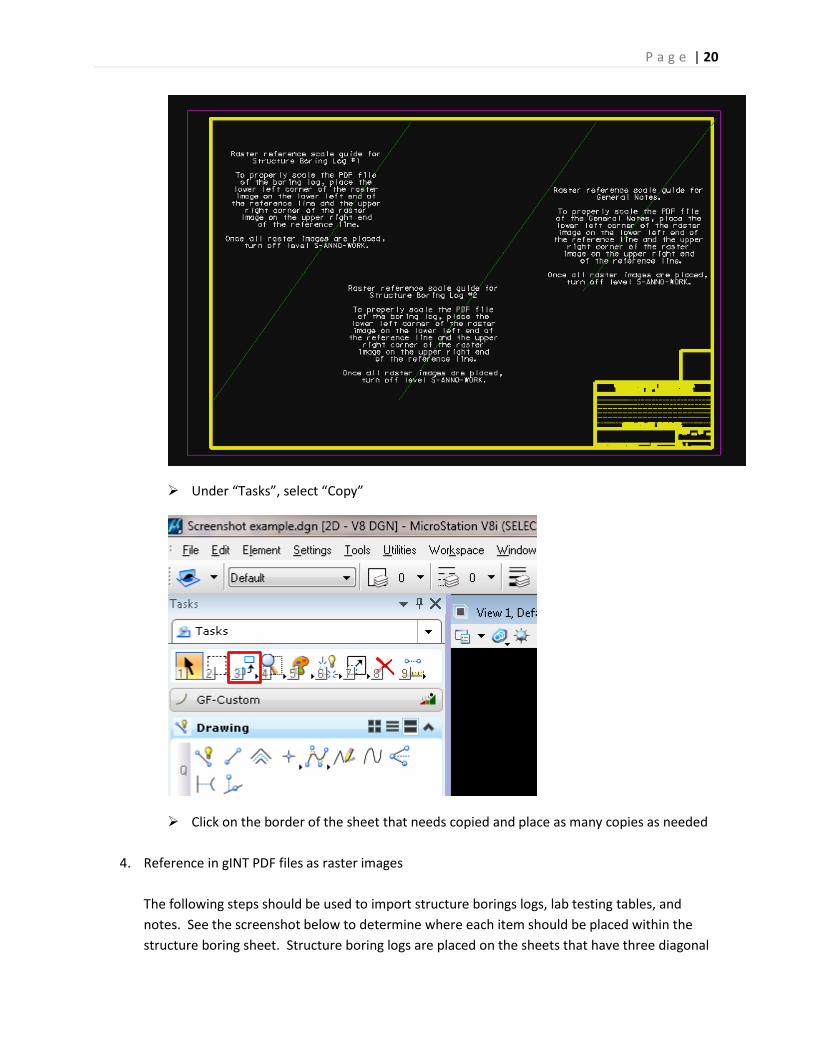
Below are examples of what each sheet looks like in Microstation.
For the Structure Boring Plan and Structure Boring Logs, use:
P a g e | 19
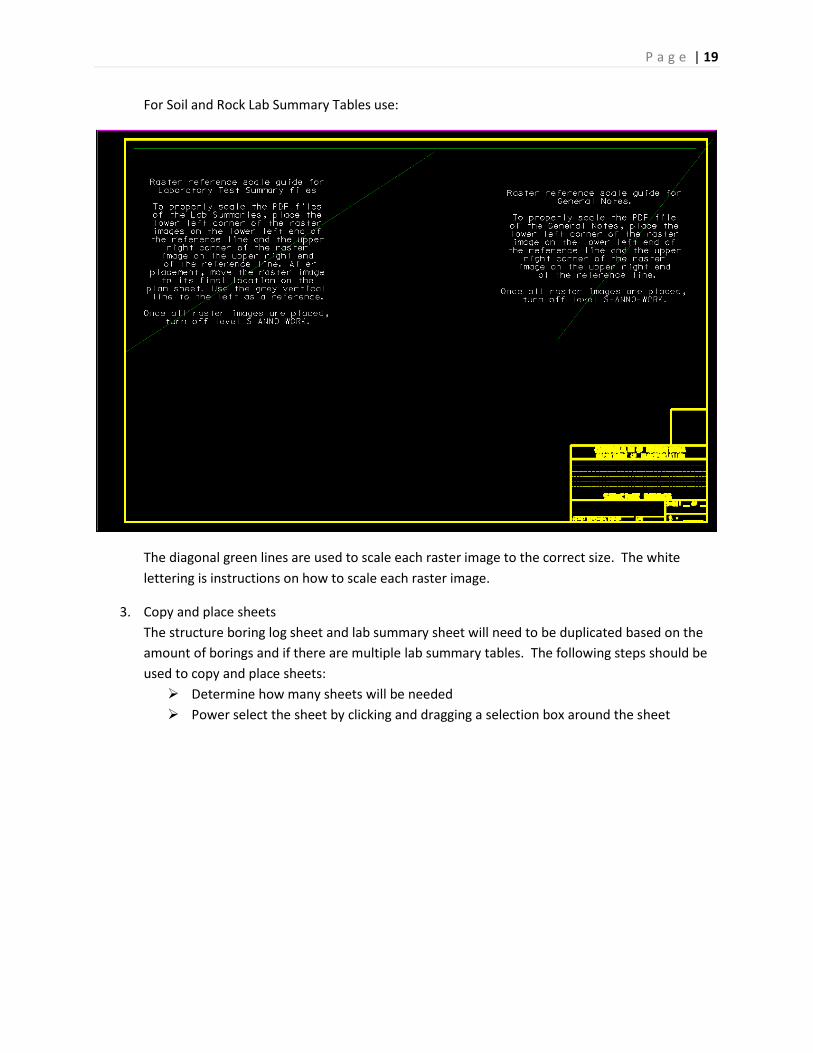
For Soil and Rock Lab Summary Tables use:
The diagonal green lines are used to scale each raster image to the correct size. The white
lettering is instructions on how to scale each raster image.
3. Copy and place sheets
The structure boring log sheet and lab summary sheet will need to be duplicated based on the
amount of borings and if there are multiple lab summary tables. The following steps should be
used to copy and place sheets:
Determine how many sheets will be needed
Power select the sheet by clicking and dragging a selection box around the sheet
P a g e | 20
Under “Tasks”, select “Copy”
Click on the border of the sheet that needs copied and place as many copies as needed
4. Reference in gINT PDF files as raster images
The following steps should be used to import structure borings logs, lab testing tables, and
notes. See the screenshot below to determine where each item should be placed within the
structure boring sheet. Structure boring logs are placed on the sheets that have three diagonal
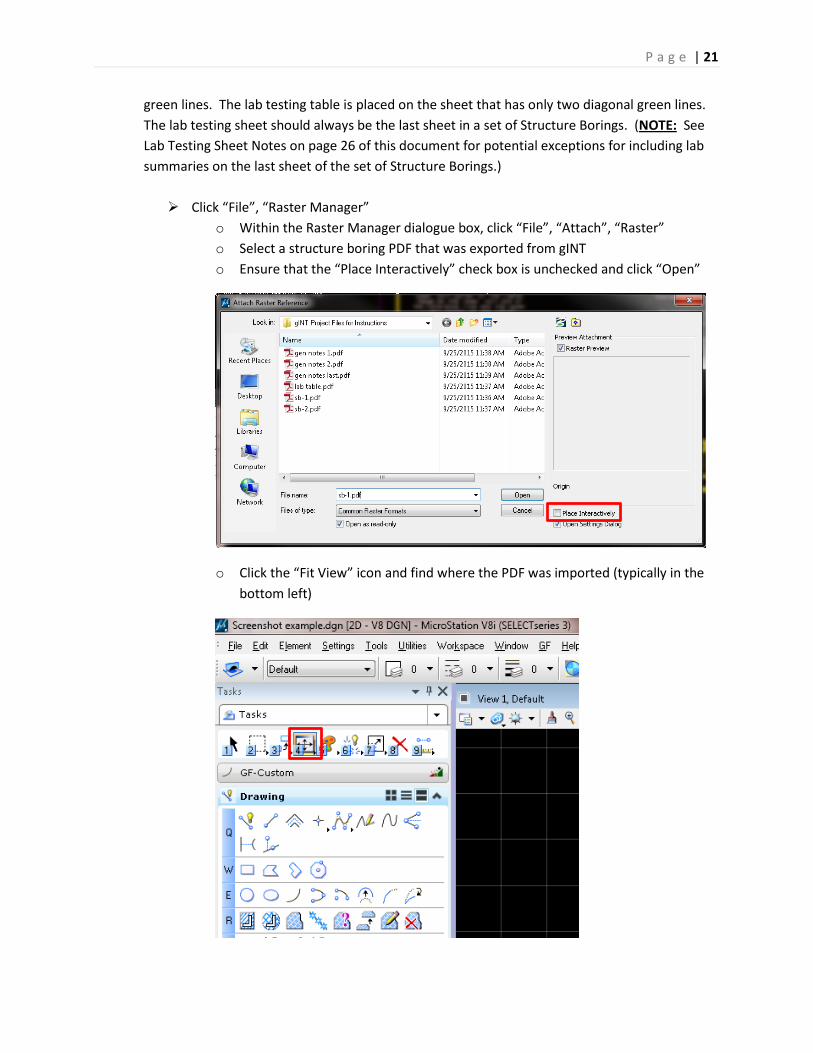
P a g e | 21
green lines. The lab testing table is placed on the sheet that has only two diagonal green lines.
The lab testing sheet should always be the last sheet in a set of Structure Borings. (NOTE: See
Lab Testing Sheet Notes on page 26 of this document for potential exceptions for including lab
summaries on the last sheet of the set of Structure Borings.)
Click “File”, “Raster Manager”
o Within the Raster Manager dialogue box, click “File”, “Attach”, “Raster”
o Select a structure boring PDF that was exported from gINT
o Ensure that the “Place Interactively” check box is unchecked and click “Open”
o Click the “Fit View” icon and find where the PDF was imported (typically in the
bottom left)
P a g e | 22
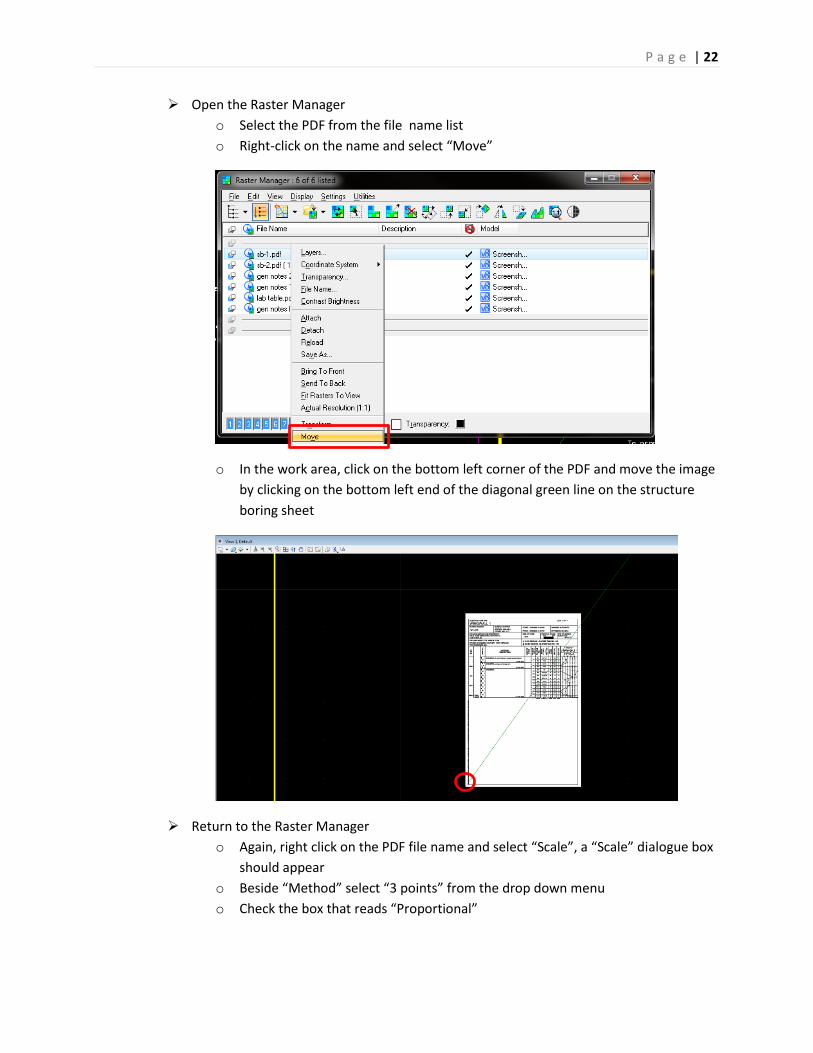
Open the Raster Manager
o Select the PDF from the file name list
o Right-click on the name and select “Move”
o In the work area, click on the bottom left corner of the PDF and move the image
by clicking on the bottom left end of the diagonal green line on the structure
boring sheet
Return to the Raster Manager
o Again, right click on the PDF file name and select “Scale”, a “Scale” dialogue box
should appear
o Beside “Method” select “3 points” from the drop down menu
o Check the box that reads “Proportional”
P a g e | 23
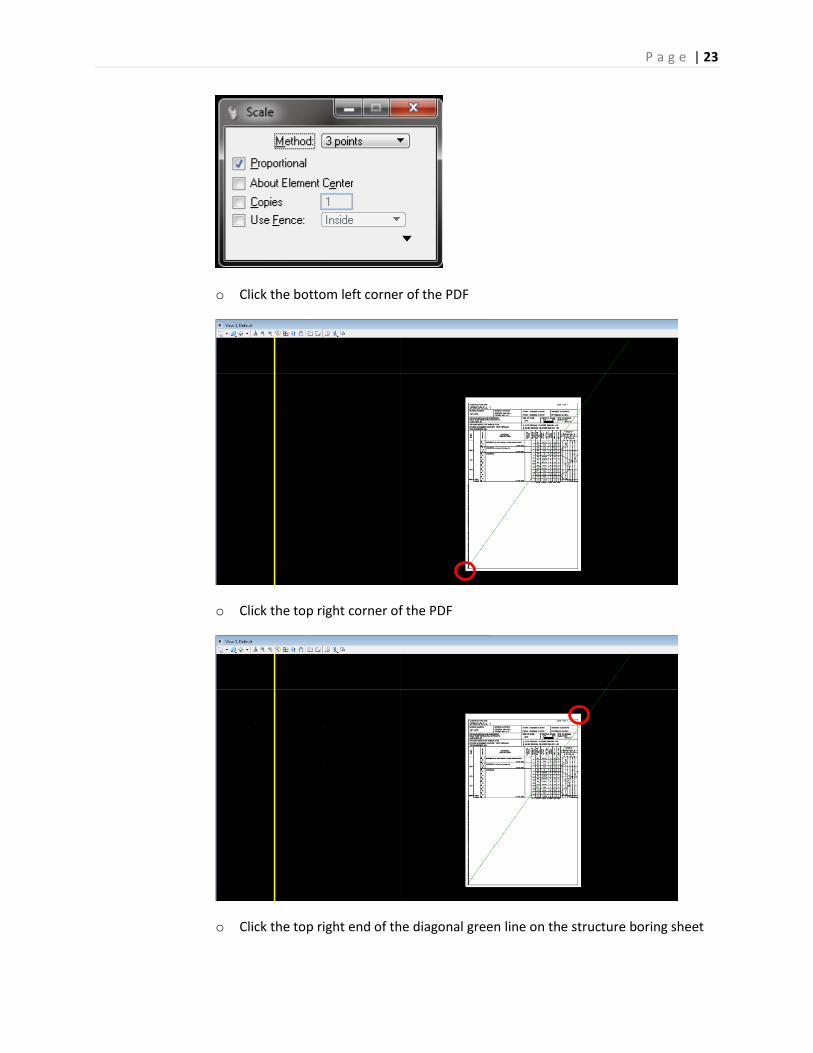
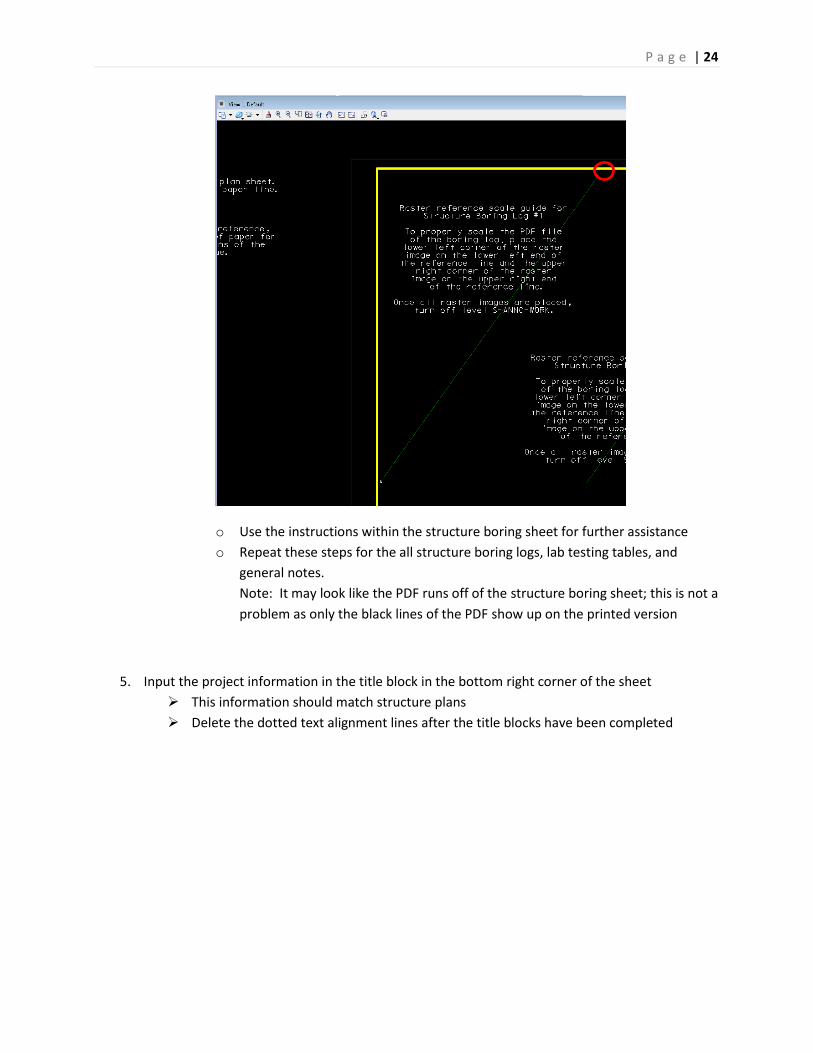
o Click the bottom left corner of the PDF
o Click the top right corner of the PDF
o Click the top right end of the diagonal green line on the structure boring sheet
P a g e | 24
o Use the instructions within the structure boring sheet for further assistance
o Repeat these steps for the all structure boring logs, lab testing tables, and
general notes.
Note: It may look like the PDF runs off of the structure boring sheet; this is not a
problem as only the black lines of the PDF show up on the printed version
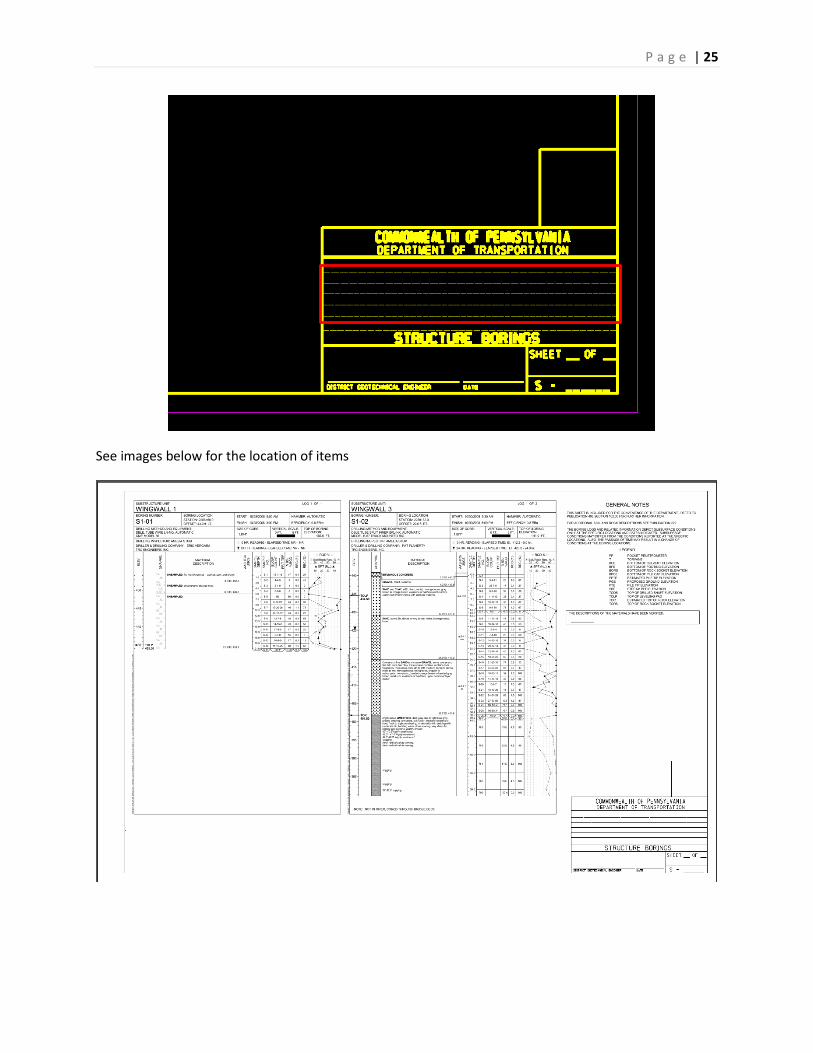
5. Input the project information in the title block in the bottom right corner of the sheet
This information should match structure plans
Delete the dotted text alignment lines after the title blocks have been completed
P a g e | 25
See images below for the location of items
P a g e | 26
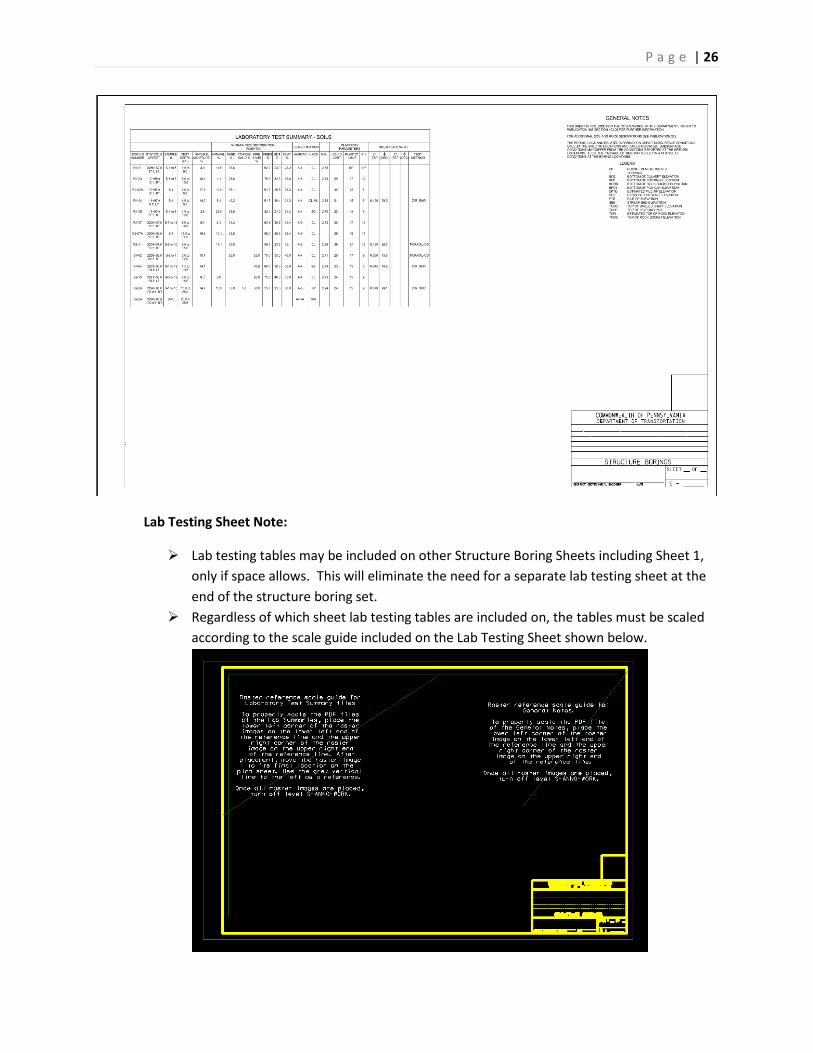
Lab Testing Sheet Note:
Lab testing tables may be included on other Structure Boring Sheets including Sheet 1,
only if space allows. This will eliminate the need for a separate lab testing sheet at the
end of the structure boring set.
Regardless of which sheet lab testing tables are included on, the tables must be scaled
according to the scale guide included on the Lab Testing Sheet shown below.
P a g e | 27
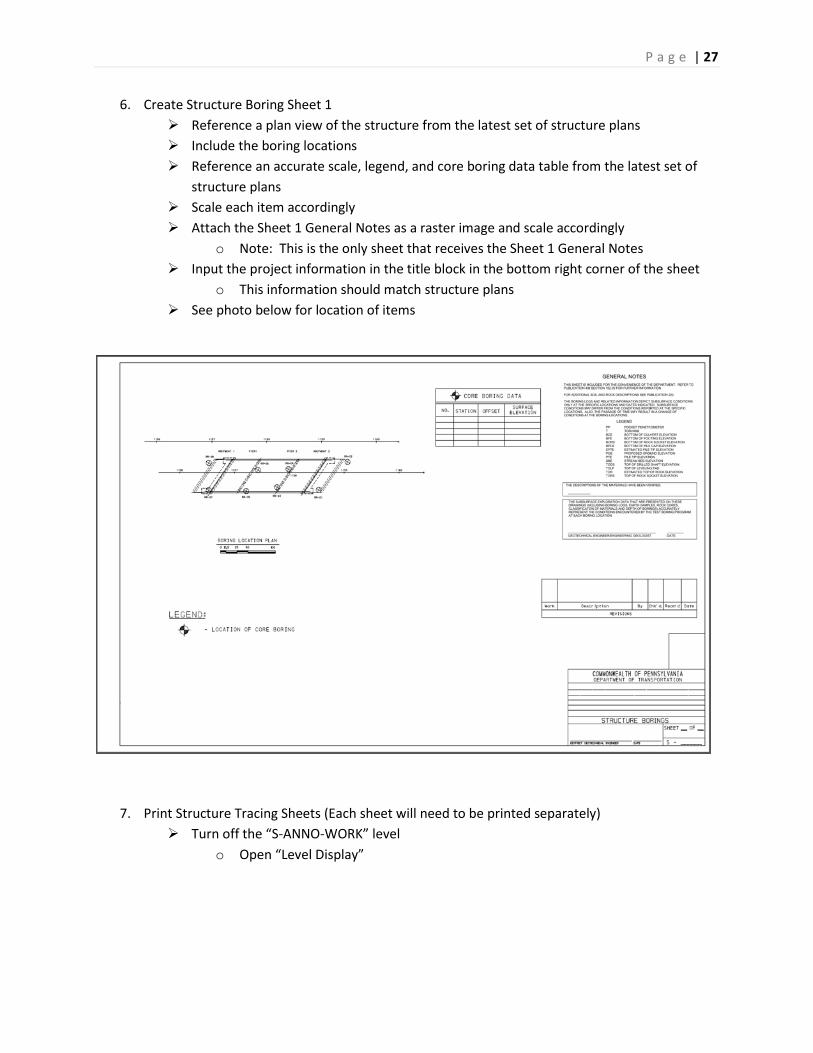
6. Create Structure Boring Sheet 1
Reference a plan view of the structure from the latest set of structure plans
Include the boring locations
Reference an accurate scale, legend, and core boring data table from the latest set of
structure plans
Scale each item accordingly
Attach the Sheet 1 General Notes as a raster image and scale accordingly
o Note: This is the only sheet that receives the Sheet 1 General Notes
Input the project information in the title block in the bottom right corner of the sheet
o This information should match structure plans
See photo below for location of items
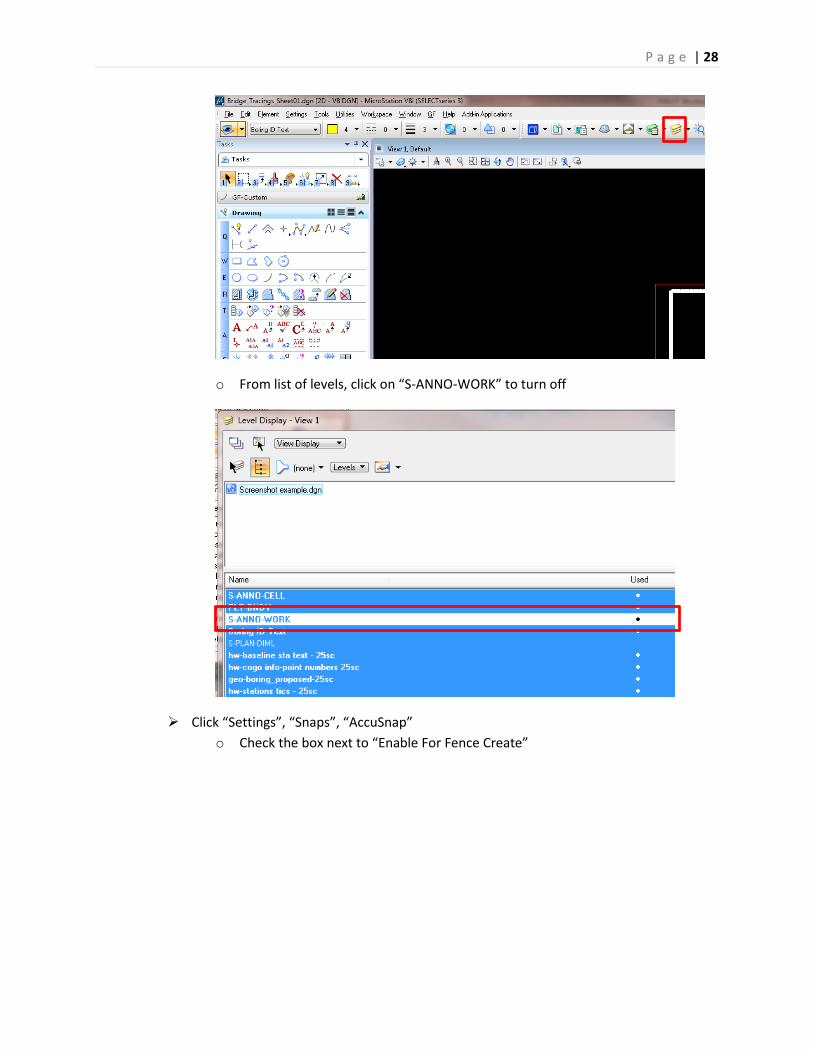
7. Print Structure Tracing Sheets (Each sheet will need to be printed separately)
Turn off the “S-ANNO-WORK” level
o Open “Level Display”
P a g e | 28
o From list of levels, click on “S-ANNO-WORK” to turn off
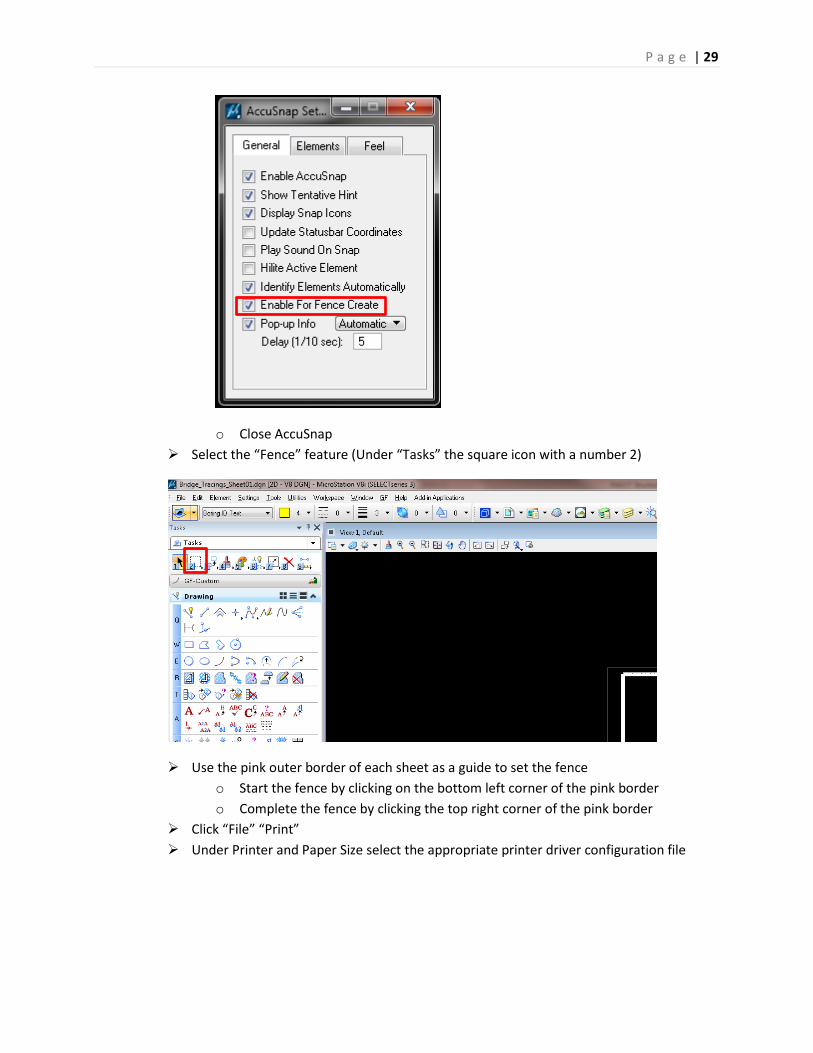
Click “Settings”, “Snaps”, “AccuSnap”
o Check the box next to “Enable For Fence Create”
P a g e | 29
o Close AccuSnap
Select the “Fence” feature (Under “Tasks” the square icon with a number 2)
Use the pink outer border of each sheet as a guide to set the fence
o Start the fence by clicking on the bottom left corner of the pink border
o Complete the fence by clicking the top right corner of the pink border
Click “File” “Print”
Under Printer and Paper Size select the appropriate printer driver configuration file
P a g e | 30
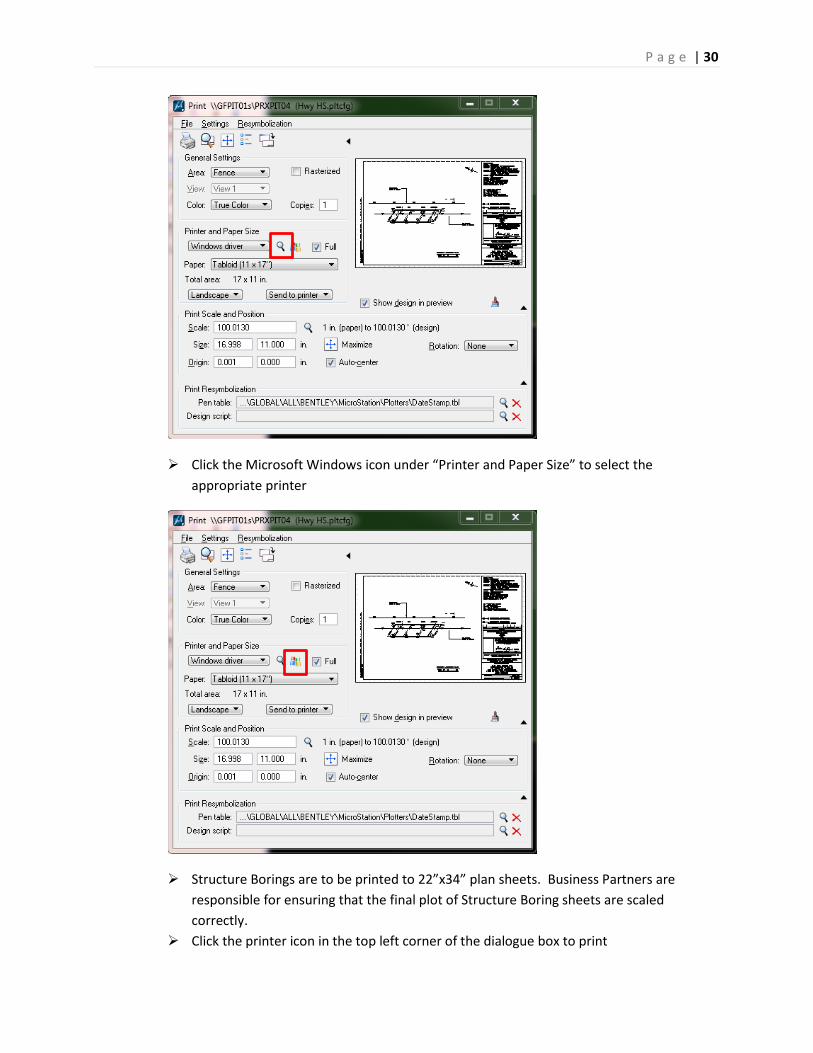
Click the Microsoft Windows icon under “Printer and Paper Size” to select the
appropriate printer
Structure Borings are to be printed to 22”x34” plan sheets. Business Partners are
responsible for ensuring that the final plot of Structure Boring sheets are scaled
correctly.
Click the printer icon in the top left corner of the dialogue box to print