Embed Size (px)
Citation preview
UNIVERSIDADE DE LISBOA
FACULDADE DE FARMÁCIA
DEPARTAMENTO DE BIOQUÍMICA
PENTOSE PHOSPHATE PATHWAY IN HEALTH AND DISEASE:
FROM METABOLIC DYSFUNCTION TO BIOMARKERS
Rúben José Jesus Faustino Ramos
Orientador: Professora Doutora Maria Isabel Ginestal Tavares de Almeida
Mestrado em Análises Clínicas
2013

Pentose Phosphate Pathway in health and disease:
From metabolic dysfunction to biomarkers
Via das Pentoses Fosfato na saúde e na doença:
Da disfunção metabólica aos biomarcadores
Dissertação apresentada à Faculdade de Farmácia da Universidade de Lisboa para
obtenção do grau de Mestre em Análises Clínicas
Rúben José Jesus Faustino Ramos
Lisboa
2013
Orientador: Professora Doutora Maria Isabel Ginestal Tavares de Almeida
The studies presented in this thesis were performed at the Metabolism and Genetics group,
iMed.UL (Research Institute for Medicines and Pharmaceutical Sciences), Faculdade de
Farmácia da Universidade de Lisboa, Portugal, under the supervision of Prof. Maria Isabel
Ginestal Tavares de Almeida, and in collaboration with the Department of Clinical Chemistry,
VU University Medical Center, Amsterdam, The Netherlands, Dr. Mirjam Wamelink.
De acordo com o disposto no ponto 1 do artigo nº 41 do Regulamento de Estudos Pós-
Graduados da Universidade de Lisboa, deliberação nº 93/2006, publicada em Diário da
Republica – II série nº 153 – de 5 julho de 2003, o autor desta dissertação declara que participou
na conceção e execução do trabalho experimental, interpretação dos resultados obtidos e
redação dos manuscritos.

Para os meus pais e irmão

Contents
vii
Table of Contents
Abbreviations
ix
Summary
xi
Sumário
xiii
Chapter 1 Aims and outline of the thesis
1
Chapter 2 General introduction
7
Chapter 3 Gas-Chromatography (GC) analysis of sugars and polyols:
optimization of a GC-FID and a GC-MS method
37
Chapter 4 Pentose phosphate pathway intermediates: a study in adult
patients with liver dysfunction
69
Chapter 5 Pentose phosphate pathway intermediates involved in liver
dysfunction: a study in a pediatric group
83
Chapter 6 Final remarks and perspectives
97
Acknowledgments/Agradecimentos
101
Annexes 105

Abbreviations
ix
Abbreviations
6PGD 6-phosphogluconolactone-dehydrogenase
AFLD Alcoholic fatty liver disease
ALT Alanine aminotransferase
AST Aspartate aminotransferase
A-T Ataxia telangiectasia
ATM Ataxia-telangiectasia mutated
ATP Adenosine triphosphate
bp Base-pair
BSTFA Bis(trimethylsilyl)trifluoroacetamide
CAS Chemical abstract service
cDNA Complementary DNA
CMV Cytomegalovirus
CNSHA Chronic non-spherocytic hemolytic anemia
CO2 Carbon dioxide
CSF Cerebrospinal fluid
DHA Dihydroxyacetone
DNA Deoxyribonucleic acid
dNTP Deoxyribonucleotide triphosphates
DSBs Double-strand breaks
E4P Erythrose-4-phosphate
F6P Fructose-6-phosphate
FBP Fructose-1,6-biphosphate
FBPase-1 Fructose 1,6-biphosphatase 1
G3P Glyceraldehyde-3-phosphate
G6P Glucose-6-phosphate
G6PD Glucose-6-phosphate dehydrogenase
GPX Glutathione peroxidase
GR Glutathione reductase
GSH Glutathione (reduced form)
GSSG Glutathione (oxidized form)
GXP Glucoronate-xylulose pathway
H2O2 Hydrogen peroxide
Abbreviations
x
HCC Hepatocellular carcinoma
ICDH Isocitrate dehydrogenase
IEM Inborn errors of metabolism
IUGR Intrauterine growth restriction
Km Michaelis-Menten constant
LT Liver transplantation
MDH Malate dehydrogenase
mRNA Messenger RNA
MW Molecular weight
NADP+ Nicotinamide adenine dinucleotide phosphate (oxidized form)
NADPH Nicotinamide adenine dinucleotide phosphate (reduced form)
NASH Non-alcoholic steatohepatitis
NMR Nuclear magnetic resonance
OMIM Online Mendelian Inheritance in Man
PCR Polymerase chain reaction
PPP Pentose Phosphate Pathway
qPCR Real-time polymerase chain reaction
R5P Ribose 5-phosphate
RNA Ribonucleic acid
ROS Reactive oxygen species
RPI Ribose-5-phosphate isomerase
Ru5P Ribulose-5-phosphate
S7P Sedoheptulose-7-phosphate
SHPK Sedoheptulokinase
TALDO Transaldolase
ThDP Thiamine diphosphate
TKT Transketolase
TKTL1 Transketolase-like 1 protein
TKTL2 Transketolase-like 2 protein
Tri-Sil-TBT Trimethylsilyl N-trimethylsilylacetamidate in chlorotrimethylsilane
WHO World Health Organization
XR Xylulose reductase
Xu5P Xylulose-5-phosphate
Summary
xi
Summary
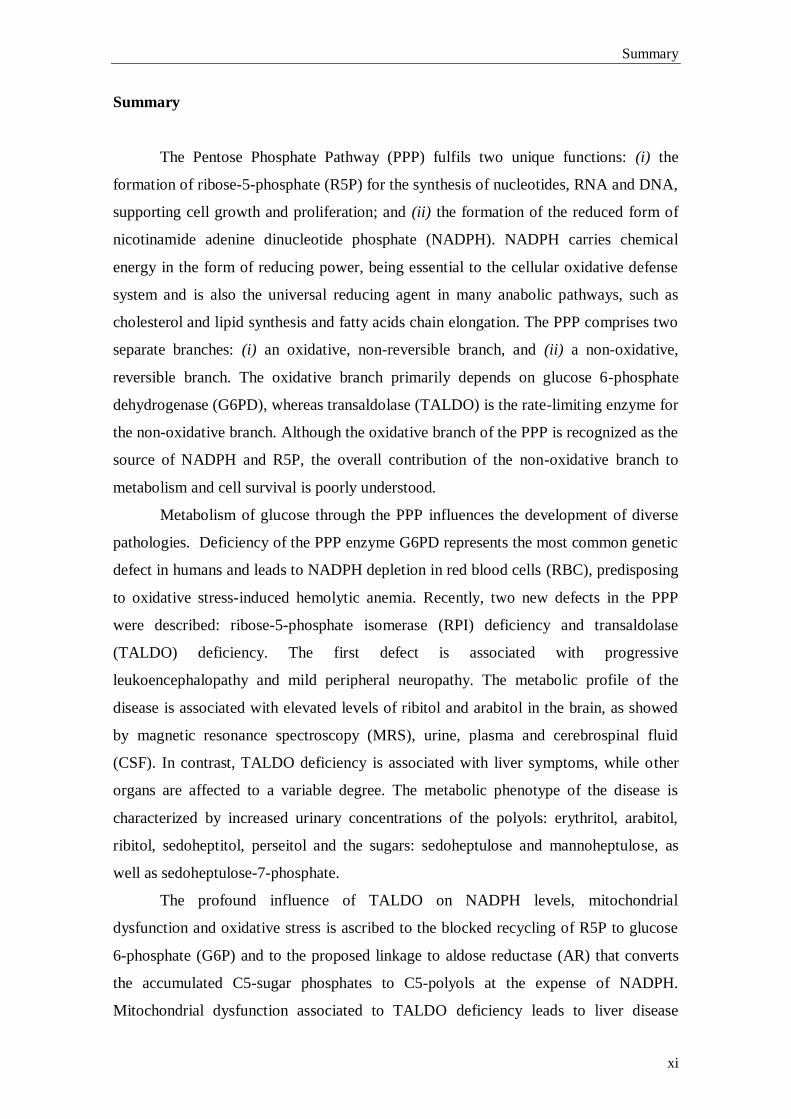
The Pentose Phosphate Pathway (PPP) fulfils two unique functions: (i) the
formation of ribose-5-phosphate (R5P) for the synthesis of nucleotides, RNA and DNA,
supporting cell growth and proliferation; and (ii) the formation of the reduced form of
nicotinamide adenine dinucleotide phosphate (NADPH). NADPH carries chemical
energy in the form of reducing power, being essential to the cellular oxidative defense
system and is also the universal reducing agent in many anabolic pathways, such as
cholesterol and lipid synthesis and fatty acids chain elongation. The PPP comprises two
separate branches: (i) an oxidative, non-reversible branch, and (ii) a non-oxidative,
reversible branch. The oxidative branch primarily depends on glucose 6-phosphate
dehydrogenase (G6PD), whereas transaldolase (TALDO) is the rate-limiting enzyme for
the non-oxidative branch. Although the oxidative branch of the PPP is recognized as the
source of NADPH and R5P, the overall contribution of the non-oxidative branch to
metabolism and cell survival is poorly understood.
Metabolism of glucose through the PPP influences the development of diverse
pathologies. Deficiency of the PPP enzyme G6PD represents the most common genetic
defect in humans and leads to NADPH depletion in red blood cells (RBC), predisposing
to oxidative stress-induced hemolytic anemia. Recently, two new defects in the PPP
were described: ribose-5-phosphate isomerase (RPI) deficiency and transaldolase
(TALDO) deficiency. The first defect is associated with progressive
leukoencephalopathy and mild peripheral neuropathy. The metabolic profile of the
disease is associated with elevated levels of ribitol and arabitol in the brain, as showed
by magnetic resonance spectroscopy (MRS), urine, plasma and cerebrospinal fluid
(CSF). In contrast, TALDO deficiency is associated with liver symptoms, while other
organs are affected to a variable degree. The metabolic phenotype of the disease is
characterized by increased urinary concentrations of the polyols: erythritol, arabitol,
ribitol, sedoheptitol, perseitol and the sugars: sedoheptulose and mannoheptulose, as
well as sedoheptulose-7-phosphate.
The profound influence of TALDO on NADPH levels, mitochondrial
dysfunction and oxidative stress is ascribed to the blocked recycling of R5P to glucose
6-phosphate (G6P) and to the proposed linkage to aldose reductase (AR) that converts
the accumulated C5-sugar phosphates to C5-polyols at the expense of NADPH.
Mitochondrial dysfunction associated to TALDO deficiency leads to liver disease
Summary
xii
progressing from non-alcoholic fatty liver disease (NAFLD) to non-alcoholic
steatohepatitis (NASH), cirrhosis and hepatocellular carcinoma (HCC). Therefore,
TALDO deficiency can account for liver disease of variable severity.
The diagnosis of the PPP deficiencies is possible by biochemical evaluation of
polyols’ and sugars’ profiles in body fluids. Abnormal concentrations of these
compounds occur in a number of pathological conditions such as diabetes mellitus,
renal and liver disease and several inborn errors of carbohydrate metabolism, such as
galactosemia. Therefore, it is necessary to take into account the variability of metabolic
profiles and to understand their meaning.
Along the thesis, it is our goal to revise the metabolic pathway of pentose
phosphates and its implication in the associated disease states. Furthermore, the
development and validation of the analytical methods (GC-FID and GC-MS) will be
presented and discussed. We will also present our preliminary results upcoming from
two separated studies, focused on the characterization of the PPP intermediate
metabolites profile in (1) pre-selected cases with unexplained hepatosplenomegaly
and/or liver dysfunction in a pediatric population; and (2) in adult patients with liver
dysfunction (NAFLD or AFLD). We hope to find new biomarkers and metabolic signs
which may open new perspectives of research for better understanding liver
dysfunction.
Interesting data is described, in the pediatric population, where a patient with an
isolated sedoheptulokinase (SHPK) deficiency is reported. All the subsequent studies,
some still in course, seem to confirm this new defect in the PPP.
In the adult population our findings point to the putative importance of polyols
as possible biomarkers of liver dysfunction progression.
Keywords: Pentose Phosphate Pathway; ribose-5-phosphate isomerase deficiency;
transaldolase deficiency; non-alcoholic fatty liver disease; sedoheptulokinase deficiency.
Sumário
xiii
Sumário
A via das pentoses fosfato tem dois objectivos principais: (i) a formação de
ribose-5-fosfato (R5P) para a síntese de nucleótidos, ARN e ADN, essenciais para o
crescimento e proliferação celular; e (ii) a redução de nicotinamida adenina dinucleótido
fosfato (NADPH). A NADPH transporta energia química sob a forma de poder redutor,
sendo essencial para o sistema de defesa oxidativo das células e sendo ainda o agente
redutor universal de inúmeras reacções anabólicas, tais como a síntese de colesterol e
lípidos e o prolongamento das cadeias dos ácidos gordos.
A via das pentoses fosfato é constituída por dois ramos: (i) um ramo oxidativo,
não reversível, e (ii) um ramo não-oxidativo, completamente reversível. O ramo
oxidativo é dependente da actividade da enzima glucose-6-fosfato desidrogenase
(G6PD), enquanto a transaldolase (TALDO) é a enzima limitante do ramo não-
oxidativo. Apesar do reconhecido papel do ramo oxidativo da via das pentoses fosfato
como fonte de NADPH e R5P, a contribuição da via não-oxidativa no metabolismo e
sobrevivência celular é pouco conhecida.
O metabolismo da glucose na via das pentoses fosfato influencia o
desenvolvimento de diversas patologias. A deficiência em G6PD é o defeito genético
mais comum na população humana, levando a níveis reduzidos de NADPH nos
eritrócitos e predispondo ao aparecimento de anemia hemolítica induzida por stress
oxidativo. Recentemente, foram descritas duas novas deficiências enzimáticas na via
das pentoses fosfato: a deficiência em ribose-5-fosfato isomerase (RPI) e a deficiência
em transaldolase (TALDO). A primeira deficiência enzimática está associada a
leucoencefalopatia progressiva e ligeira neuropatia periférica. O perfil metabólico da
doença revela níveis elevados dos polióis: ribitol e arabitol no cérebro, tal como
demonstrado por ressonância magnética, na urina, plasma e líquido cefalorraquidiano
(LCR). Por outro lado, a deficiência em transaldolase está associada a alterações
hepáticas, havendo um grau variado de comprometimento por parte de outros órgãos. O
fenótipo metabólico desta deficiência está associado à excreção de níveis elevados dos
polióis: eritritol, arabitol, ribitol, sedoheptitol, perseitol e dos açúcares: sedoheptulose e
manoheptulose, bem como de sedoheptulose-7-fosfato.
A forte influência da transaldolase nos níveis de NADPH em situações de
disfunção mitocondrial e stress oxidativo é atribuída ao bloqueio da reciclagem da
glucose-6-fosfato a partir da ribose-5-fosfato e à hipotética ligação à actividade de
Sumário
xiv
aldoses redutases (AR), responsáveis pela conversão dos açúcares-C5-fosfatados a C5-
polióis, às custas de NADPH. A disfunção mitocondrial associada à deficiência em
transaldolase leva a uma doença hepática progressiva que se inicia com o aparecimento
do fígado gordo não alcoólico (NAFLD), passando a esteatohepatite não alcoólica
(NASH), cirrose e carcinoma hepatocelular (CHC). Assim, a deficiência em
transaldolase está associada a doença hepática de variado grau de severidade.
O diagnóstico dos defeitos da via das pentoses fosfato é possível pela análise dos
perfis bioquímico dos açúcares e polióis nos fluidos biológicos. Concentrações elevadas
destes compostos aparecem em diversas situações patológicas, tais como a diabetes
mellitus, a doença renal e hepática e vários erros hereditários do metabolismo dos
hidratos de carbono, tais como a galactosemia. Assim, torna-se imperativo ter em conta
a grande variabilidade de perfis metabólicos e o conhecimento dos seus significados.
Ao longo desta tese, é nosso objectivo fazer uma revisão sistematizada da via
das pentoses fosfato e a sua implicação em estados de doença. Será ainda apresentado e
discutido o desenvolvimento e validação dos métodos cromatográficos (GC-FID e GC-
MS) desenvolvidos. Finalmente, apresentaremos os resultados preliminares de dois
estudos, iniciados com o objectivo de caracterizar os metabolitos intermediários da via
das pentoses fosfato em (i) uma população pediátrica de casos pré-seleccionados com
hepatoesplenomegália de causa desconhecida e/ou com disfunção hepática; e (ii) uma
população de adultos com disfunção hepática (fígado gordo não alcoólico ou doença
hepática devida ao abuso do consumo de álcool). Esperamos descobrir novos
biomarcadores ou alterações metabólicas importantes, que possam abrir a porta a
futuros estudos para melhor compreender a disfunção hepática.
No estudo efectuado na população pediátrica são apresentados resultados
interessantes de um doente em que se descreve pela primeira vez um défice isolado da
enzima sedoheptulose cinase (SHPK). Todos os estudos subsequentes, alguns ainda em
curso, apoiam a descoberta desta nova deficiência enzimática na via das pentoses
fosfato.
No estudo da população adulta com disfunção hepática, os nossos resultados
apontam para uma possível importância do perfil dos polióis como biomarcadores da
progressão da disfunção hepática.
Palavras-chave: Via das pentoses fosfato; deficiência em ribose-5-fosfato isomerase;
deficiência em transaldolase; fígado gordo não alcoólico; deficiência em sedoheptulose cinase.

CHAPTER 1
Aims and outline of the thesis

Aims and outline of the thesis
3
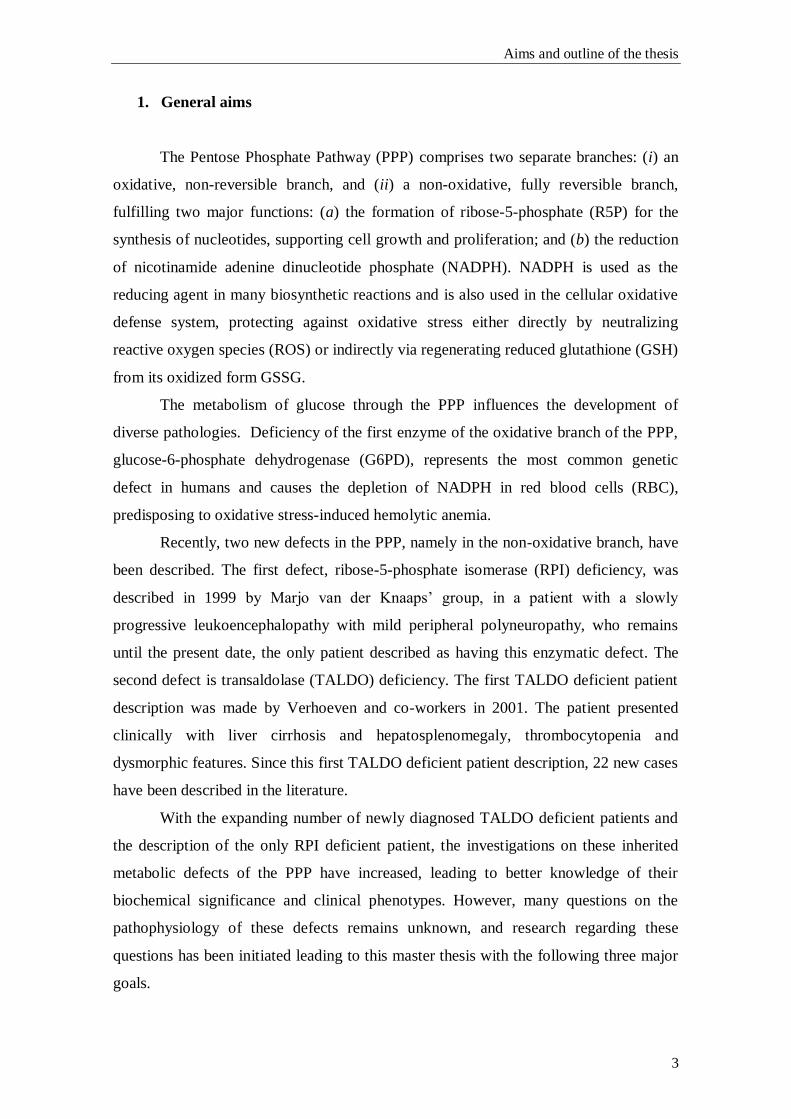
1. General aims
The Pentose Phosphate Pathway (PPP) comprises two separate branches: (i) an
oxidative, non-reversible branch, and (ii) a non-oxidative, fully reversible branch,
fulfilling two major functions: (a) the formation of ribose-5-phosphate (R5P) for the
synthesis of nucleotides, supporting cell growth and proliferation; and (b) the reduction
of nicotinamide adenine dinucleotide phosphate (NADPH). NADPH is used as the
reducing agent in many biosynthetic reactions and is also used in the cellular oxidative
defense system, protecting against oxidative stress either directly by neutralizing
reactive oxygen species (ROS) or indirectly via regenerating reduced glutathione (GSH)
from its oxidized form GSSG.
The metabolism of glucose through the PPP influences the development of
diverse pathologies. Deficiency of the first enzyme of the oxidative branch of the PPP,
glucose-6-phosphate dehydrogenase (G6PD), represents the most common genetic
defect in humans and causes the depletion of NADPH in red blood cells (RBC),
predisposing to oxidative stress-induced hemolytic anemia.
Recently, two new defects in the PPP, namely in the non-oxidative branch, have
been described. The first defect, ribose-5-phosphate isomerase (RPI) deficiency, was
described in 1999 by Marjo van der Knaaps’ group, in a patient with a slowly
progressive leukoencephalopathy with mild peripheral polyneuropathy, who remains
until the present date, the only patient described as having this enzymatic defect. The
second defect is transaldolase (TALDO) deficiency. The first TALDO deficient patient
description was made by Verhoeven and co-workers in 2001. The patient presented
clinically with liver cirrhosis and hepatosplenomegaly, thrombocytopenia and
dysmorphic features. Since this first TALDO deficient patient description, 22 new cases
have been described in the literature.
With the expanding number of newly diagnosed TALDO deficient patients and
the description of the only RPI deficient patient, the investigations on these inherited
metabolic defects of the PPP have increased, leading to better knowledge of their
biochemical significance and clinical phenotypes. However, many questions on the
pathophysiology of these defects remains unknown, and research regarding these
questions has been initiated leading to this master thesis with the following three major
goals.
Chapter 1
4
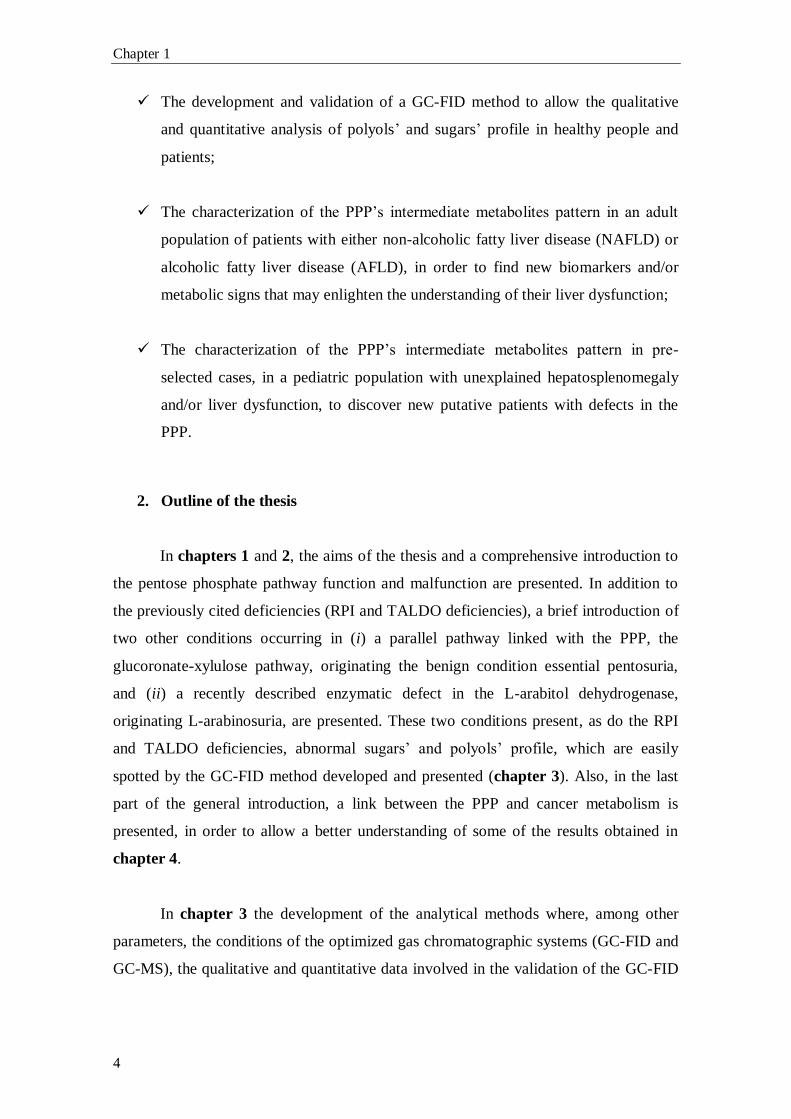
The development and validation of a GC-FID method to allow the qualitative
and quantitative analysis of polyols’ and sugars’ profile in healthy people and
patients;
The characterization of the PPP’s intermediate metabolites pattern in an adult
population of patients with either non-alcoholic fatty liver disease (NAFLD) or
alcoholic fatty liver disease (AFLD), in order to find new biomarkers and/or
metabolic signs that may enlighten the understanding of their liver dysfunction;
The characterization of the PPP’s intermediate metabolites pattern in pre-
selected cases, in a pediatric population with unexplained hepatosplenomegaly
and/or liver dysfunction, to discover new putative patients with defects in the
PPP.
2. Outline of the thesis
In chapters 1 and 2, the aims of the thesis and a comprehensive introduction to
the pentose phosphate pathway function and malfunction are presented. In addition to
the previously cited deficiencies (RPI and TALDO deficiencies), a brief introduction of
two other conditions occurring in (i) a parallel pathway linked with the PPP, the
glucoronate-xylulose pathway, originating the benign condition essential pentosuria,
and (ii) a recently described enzymatic defect in the L-arabitol dehydrogenase,
originating L-arabinosuria, are presented. These two conditions present, as do the RPI
and TALDO deficiencies, abnormal sugars’ and polyols’ profile, which are easily
spotted by the GC-FID method developed and presented (chapter 3). Also, in the last
part of the general introduction, a link between the PPP and cancer metabolism is
presented, in order to allow a better understanding of some of the results obtained in
chapter 4.
In chapter 3 the development of the analytical methods where, among other
parameters, the conditions of the optimized gas chromatographic systems (GC-FID and
GC-MS), the qualitative and quantitative data involved in the validation of the GC-FID
Aims and outline of the thesis
5
method, plus the preliminary results for the building up of the laboratory’s reference
values are described.
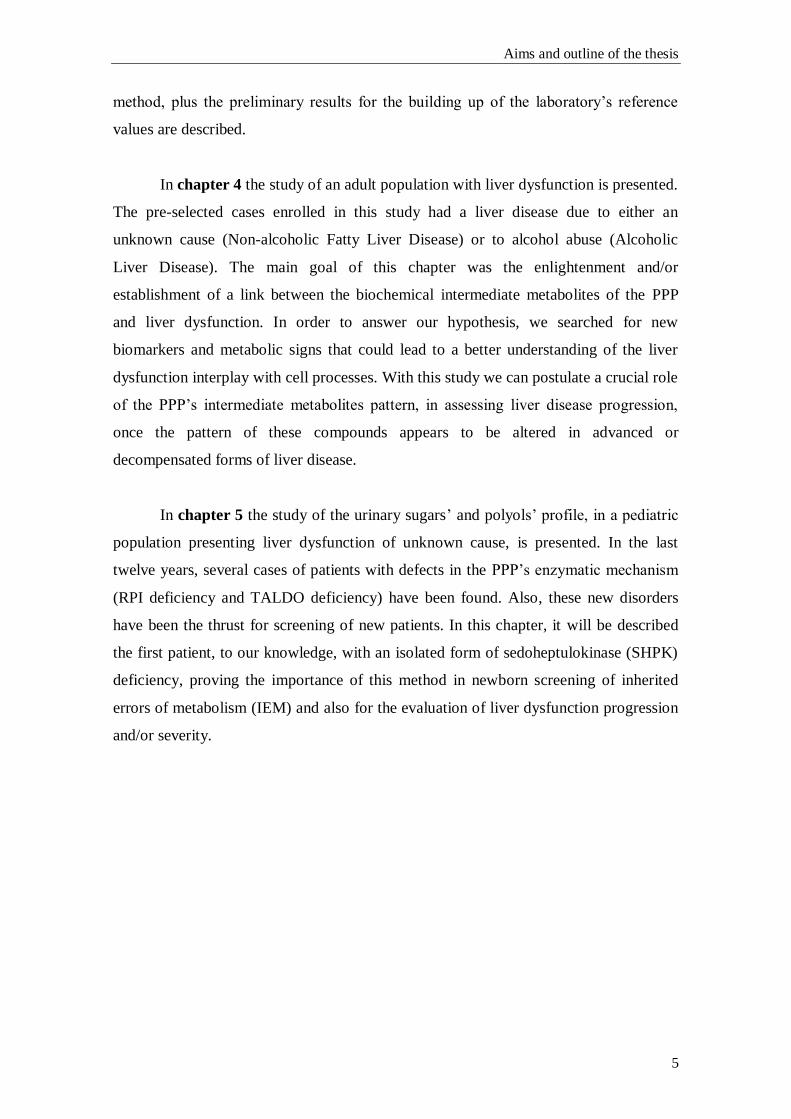
In chapter 4 the study of an adult population with liver dysfunction is presented.
The pre-selected cases enrolled in this study had a liver disease due to either an
unknown cause (Non-alcoholic Fatty Liver Disease) or to alcohol abuse (Alcoholic
Liver Disease). The main goal of this chapter was the enlightenment and/or
establishment of a link between the biochemical intermediate metabolites of the PPP
and liver dysfunction. In order to answer our hypothesis, we searched for new
biomarkers and metabolic signs that could lead to a better understanding of the liver
dysfunction interplay with cell processes. With this study we can postulate a crucial role
of the PPP’s intermediate metabolites pattern, in assessing liver disease progression,
once the pattern of these compounds appears to be altered in advanced or
decompensated forms of liver disease.
In chapter 5 the study of the urinary sugars’ and polyols’ profile, in a pediatric
population presenting liver dysfunction of unknown cause, is presented. In the last
twelve years, several cases of patients with defects in the PPP’s enzymatic mechanism
(RPI deficiency and TALDO deficiency) have been found. Also, these new disorders
have been the thrust for screening of new patients. In this chapter, it will be described
the first patient, to our knowledge, with an isolated form of sedoheptulokinase (SHPK)
deficiency, proving the importance of this method in newborn screening of inherited
errors of metabolism (IEM) and also for the evaluation of liver dysfunction progression
and/or severity.


CHAPTER 2
General introduction

General introduction
9
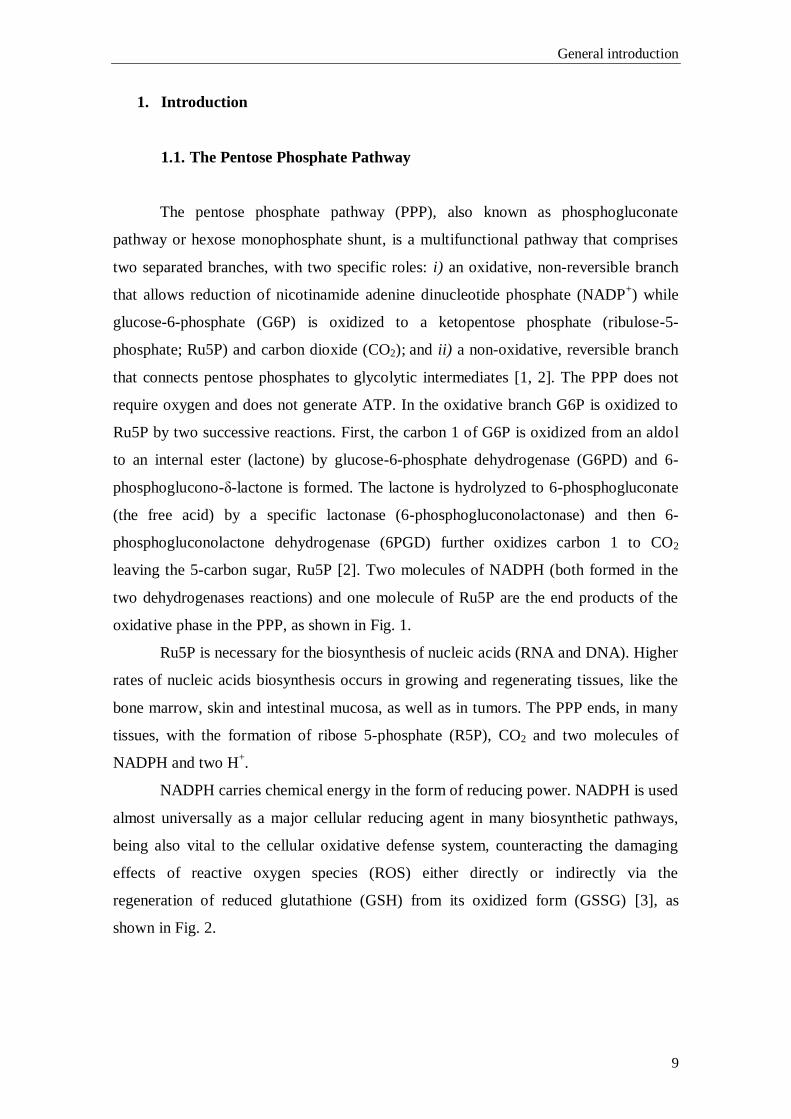
1. Introduction
1.1. The Pentose Phosphate Pathway
The pentose phosphate pathway (PPP), also known as phosphogluconate
pathway or hexose monophosphate shunt, is a multifunctional pathway that comprises
two separated branches, with two specific roles: i) an oxidative, non-reversible branch
that allows reduction of nicotinamide adenine dinucleotide phosphate (NADP+) while
glucose-6-phosphate (G6P) is oxidized to a ketopentose phosphate (ribulose-5-
phosphate; Ru5P) and carbon dioxide (CO2); and ii) a non-oxidative, reversible branch
that connects pentose phosphates to glycolytic intermediates [1, 2]. The PPP does not
require oxygen and does not generate ATP. In the oxidative branch G6P is oxidized to
Ru5P by two successive reactions. First, the carbon 1 of G6P is oxidized from an aldol
to an internal ester (lactone) by glucose-6-phosphate dehydrogenase (G6PD) and 6-
phosphoglucono-δ-lactone is formed. The lactone is hydrolyzed to 6-phosphogluconate
(the free acid) by a specific lactonase (6-phosphogluconolactonase) and then 6-
phosphogluconolactone dehydrogenase (6PGD) further oxidizes carbon 1 to CO2
leaving the 5-carbon sugar, Ru5P [2]. Two molecules of NADPH (both formed in the
two dehydrogenases reactions) and one molecule of Ru5P are the end products of the
oxidative phase in the PPP, as shown in Fig. 1.
Ru5P is necessary for the biosynthesis of nucleic acids (RNA and DNA). Higher
rates of nucleic acids biosynthesis occurs in growing and regenerating tissues, like the
bone marrow, skin and intestinal mucosa, as well as in tumors. The PPP ends, in many
tissues, with the formation of ribose 5-phosphate (R5P), CO2 and two molecules of
NADPH and two H+.
NADPH carries chemical energy in the form of reducing power. NADPH is used
almost universally as a major cellular reducing agent in many biosynthetic pathways,
being also vital to the cellular oxidative defense system, counteracting the damaging
effects of reactive oxygen species (ROS) either directly or indirectly via the
regeneration of reduced glutathione (GSH) from its oxidized form (GSSG) [3], as
shown in Fig. 2.
Chapter 2
10
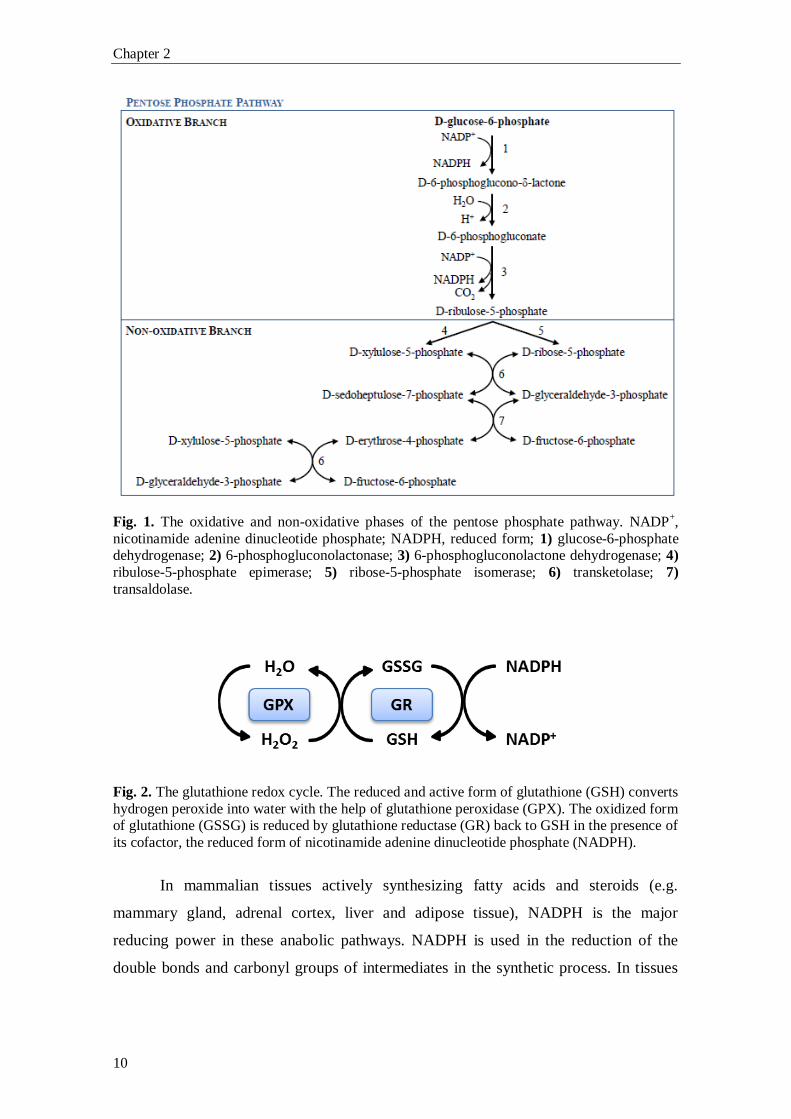
Fig. 1. The oxidative and non-oxidative phases of the pentose phosphate pathway. NADP+,
nicotinamide adenine dinucleotide phosphate; NADPH, reduced form; 1) glucose-6-phosphate dehydrogenase; 2) 6-phosphogluconolactonase; 3) 6-phosphogluconolactone dehydrogenase; 4)
ribulose-5-phosphate epimerase; 5) ribose-5-phosphate isomerase; 6) transketolase; 7)
transaldolase.
Fig. 2. The glutathione redox cycle. The reduced and active form of glutathione (GSH) converts
hydrogen peroxide into water with the help of glutathione peroxidase (GPX). The oxidized form of glutathione (GSSG) is reduced by glutathione reductase (GR) back to GSH in the presence of
its cofactor, the reduced form of nicotinamide adenine dinucleotide phosphate (NADPH).
In mammalian tissues actively synthesizing fatty acids and steroids (e.g.
mammary gland, adrenal cortex, liver and adipose tissue), NADPH is the major
reducing power in these anabolic pathways. NADPH is used in the reduction of the
double bonds and carbonyl groups of intermediates in the synthetic process. In tissues
General introduction
11
less active in synthesizing fatty acids (e.g. skeletal muscle), the PPP is virtually absent
[2].
G6PD is the principal source of NADPH for the antioxidant system, but not the
only one. Three other enzymatic sources for NADPH reductions are known: i) 6-
phosphogluconolactone-dehydrogenase (6PGD); ii) malate dehydrogenase (MDH; also
known as malic enzyme); and iii) cytoplasmic isocitrate dehydrogenase (ICDH) [4].
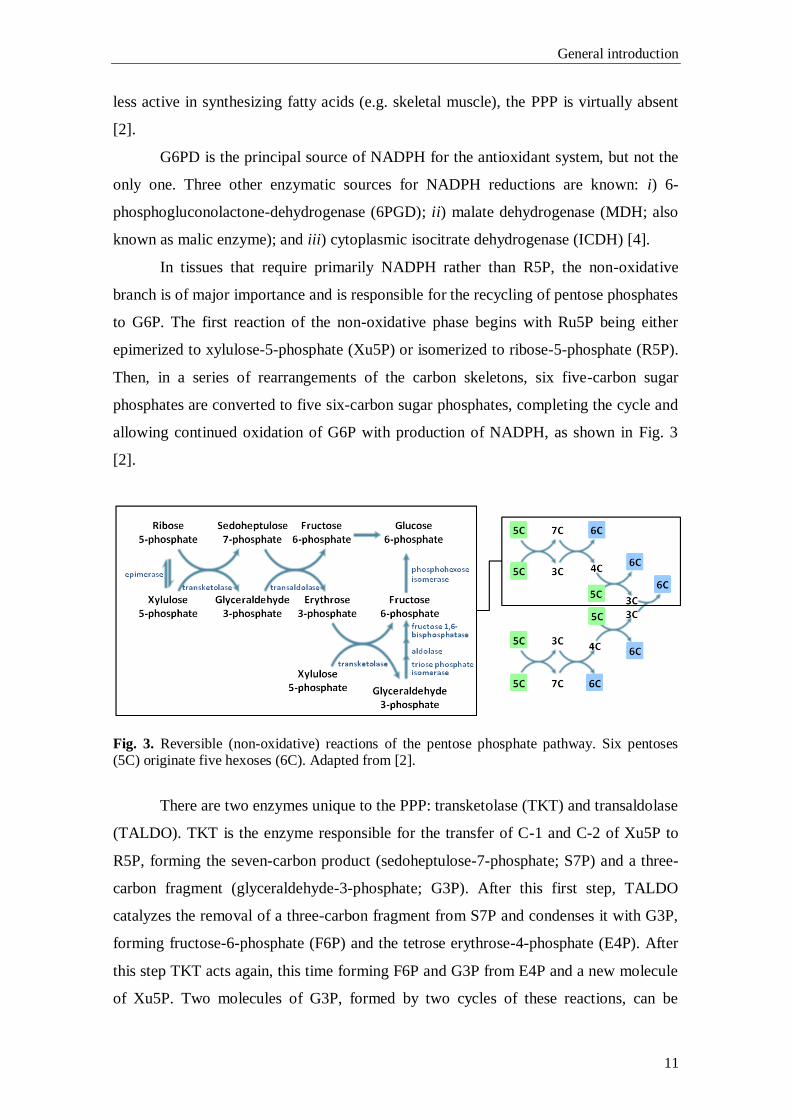
In tissues that require primarily NADPH rather than R5P, the non-oxidative
branch is of major importance and is responsible for the recycling of pentose phosphates
to G6P. The first reaction of the non-oxidative phase begins with Ru5P being either
epimerized to xylulose-5-phosphate (Xu5P) or isomerized to ribose-5-phosphate (R5P).
Then, in a series of rearrangements of the carbon skeletons, six five-carbon sugar
phosphates are converted to five six-carbon sugar phosphates, completing the cycle and
allowing continued oxidation of G6P with production of NADPH, as shown in Fig. 3
[2].
Fig. 3. Reversible (non-oxidative) reactions of the pentose phosphate pathway. Six pentoses (5C) originate five hexoses (6C). Adapted from [2].
There are two enzymes unique to the PPP: transketolase (TKT) and transaldolase
(TALDO). TKT is the enzyme responsible for the transfer of C-1 and C-2 of Xu5P to
R5P, forming the seven-carbon product (sedoheptulose-7-phosphate; S7P) and a three-
carbon fragment (glyceraldehyde-3-phosphate; G3P). After this first step, TALDO
catalyzes the removal of a three-carbon fragment from S7P and condenses it with G3P,
forming fructose-6-phosphate (F6P) and the tetrose erythrose-4-phosphate (E4P). After
this step TKT acts again, this time forming F6P and G3P from E4P and a new molecule
of Xu5P. Two molecules of G3P, formed by two cycles of these reactions, can be
Chapter 2
12
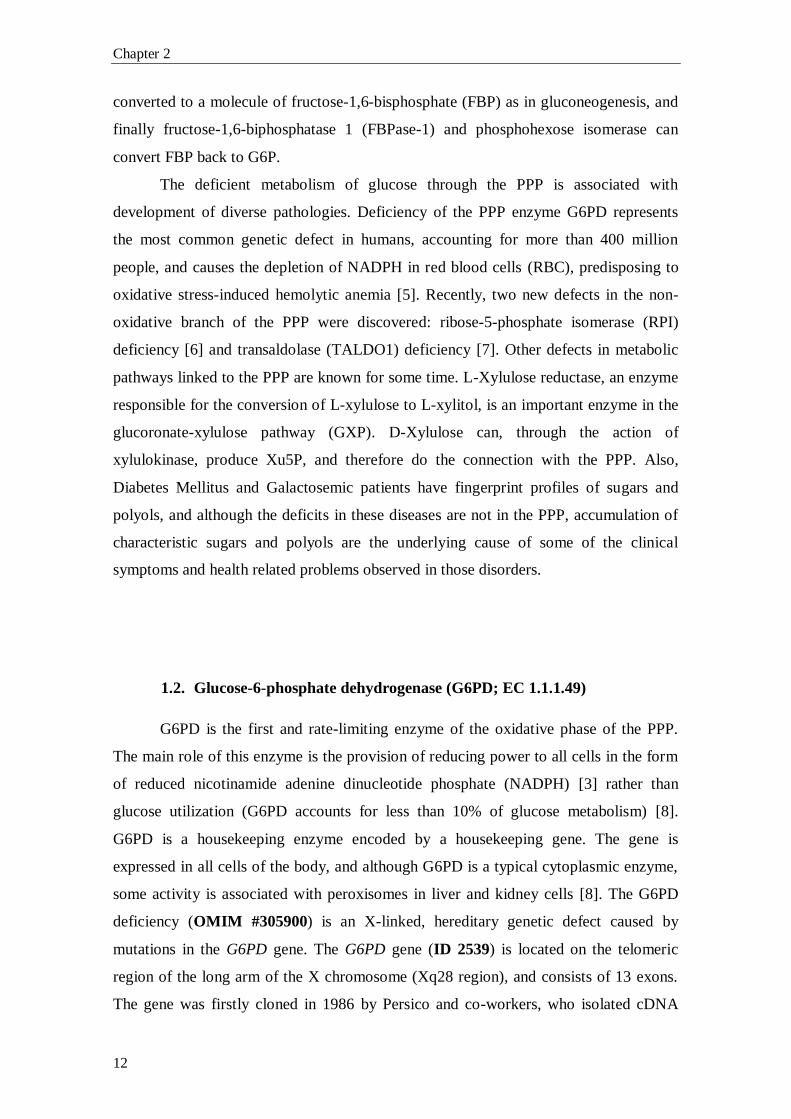
converted to a molecule of fructose-1,6-bisphosphate (FBP) as in gluconeogenesis, and
finally fructose-1,6-biphosphatase 1 (FBPase-1) and phosphohexose isomerase can
convert FBP back to G6P.
The deficient metabolism of glucose through the PPP is associated with
development of diverse pathologies. Deficiency of the PPP enzyme G6PD represents
the most common genetic defect in humans, accounting for more than 400 million
people, and causes the depletion of NADPH in red blood cells (RBC), predisposing to
oxidative stress-induced hemolytic anemia [5]. Recently, two new defects in the non-
oxidative branch of the PPP were discovered: ribose-5-phosphate isomerase (RPI)
deficiency [6] and transaldolase (TALDO1) deficiency [7]. Other defects in metabolic
pathways linked to the PPP are known for some time. L-Xylulose reductase, an enzyme
responsible for the conversion of L-xylulose to L-xylitol, is an important enzyme in the
glucoronate-xylulose pathway (GXP). D-Xylulose can, through the action of
xylulokinase, produce Xu5P, and therefore do the connection with the PPP. Also,
Diabetes Mellitus and Galactosemic patients have fingerprint profiles of sugars and
polyols, and although the deficits in these diseases are not in the PPP, accumulation of
characteristic sugars and polyols are the underlying cause of some of the clinical
symptoms and health related problems observed in those disorders.
1.2. Glucose-6-phosphate dehydrogenase (G6PD; EC 1.1.1.49)
G6PD is the first and rate-limiting enzyme of the oxidative phase of the PPP.
The main role of this enzyme is the provision of reducing power to all cells in the form
of reduced nicotinamide adenine dinucleotide phosphate (NADPH) [3] rather than
glucose utilization (G6PD accounts for less than 10% of glucose metabolism) [8].
G6PD is a housekeeping enzyme encoded by a housekeeping gene. The gene is
expressed in all cells of the body, and although G6PD is a typical cytoplasmic enzyme,
some activity is associated with peroxisomes in liver and kidney cells [8]. The G6PD
deficiency (OMIM #305900) is an X-linked, hereditary genetic defect caused by
mutations in the G6PD gene. The G6PD gene (ID 2539) is located on the telomeric
region of the long arm of the X chromosome (Xq28 region), and consists of 13 exons.
The gene was firstly cloned in 1986 by Persico and co-workers, who isolated cDNA
General introduction
13
clones from HeLa cells, SV40-transformed human fibroblasts, human placenta and
human teratocarcinoma cell lines, although without mapping the exact localization of
the functional sites for G6P and NADP+ binding sites [9].
The G6PD protein, in its active state, consists of homodimers and
homotetramers, the proportion of both being pH dependent. The primary structure of the
single subunit has been determined from cDNA sequence and consists of 515 amino
acids [10].
G6PD deficiency was discovered as the result of a series of investigations
performed to understand the reasons behind the development of hemolytic anemia in
some individuals treated for malaria with 6-methoxy-8-aminoquinoline drug
(primaquine) [7, 8]. Primaquine is just one of many drugs that shorten the RBC lifespan
in G6PD deficient patients [10].
More than 400 biochemical variants of G6PD have been described according to
measurements of residual enzyme activity, electrophoretic mobility, physicochemical
properties (thermostability and chromatographic behavior) and kinetic variables
(concentration of substrate needed for an enzymatic reaction at half the maximum speed
(Km) for G6P; Km for NADP+ and pH dependence).
About 140 mutations in the G6PD gene have been reported, most of which are
single-base substitutions leading to amino acid replacements [3]. In 1967, the World
Health Organization (WHO) made the first recommendations to classify the G6PD
deficient variants, using only the measurements of residual enzyme activity and
electrophoretic mobility for biochemical characterization of the enzyme. In 1989 the
same organism expanded the biochemical characteristics of the enzyme [13]. The
variants were classified in five classes: i) class I variants are severely deficient and
patients are associated with a chronic non-spherocytic haemolytic anaemia (CNSHA);
ii) class II variants have less than 10% of residual enzyme activity but without CNSHA
(include the common Mediterranean and common severe oriental variants); iii) Class III
variants are moderately deficient with 10-60% residual enzyme activity (include the
common African form); iv) Class IV variants have normal enzyme activity; v) and in
Class V the enzyme activity is increased [13].
G6PD deficient individuals may be asymptomatic throughout life. The illness
generally manifests as: (1) chronic non-spherocytic hemolytic disease; (2) acute
haemolytic anaemia or (3) neonatal jaundice triggered by infection, administration of
oxidative drugs or ingestion of fava beans [3].
Chapter 2
14
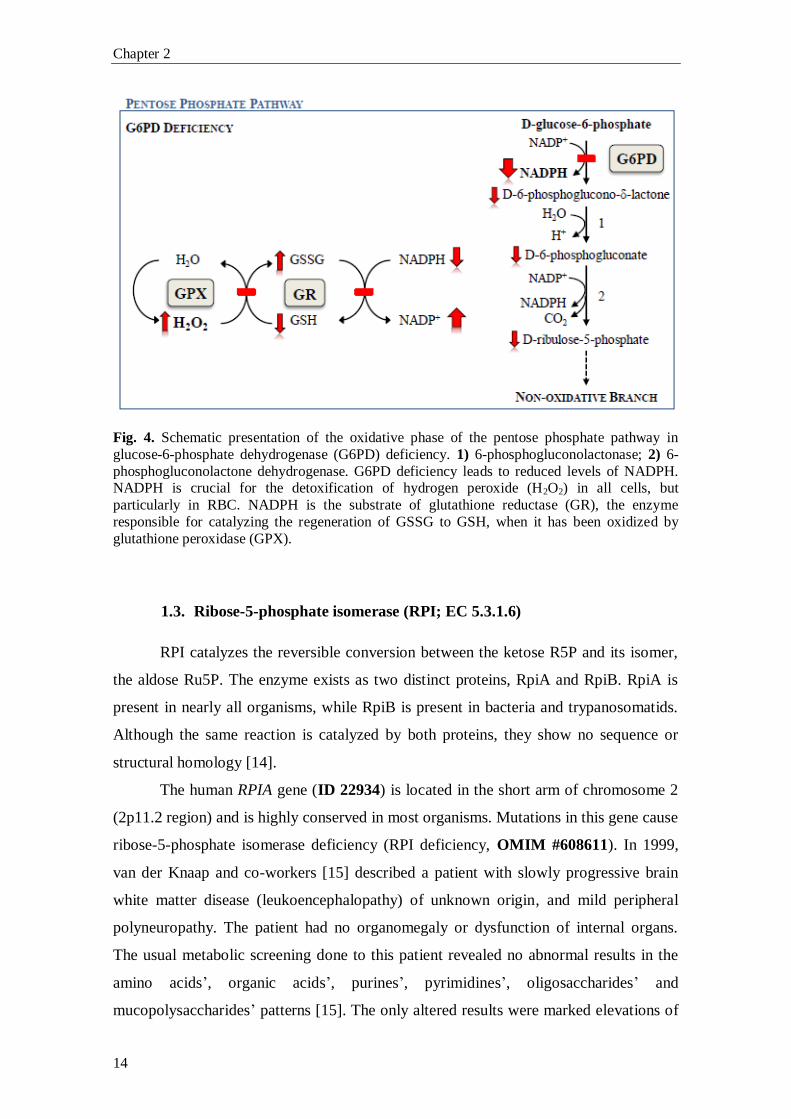
Fig. 4. Schematic presentation of the oxidative phase of the pentose phosphate pathway in
glucose-6-phosphate dehydrogenase (G6PD) deficiency. 1) 6-phosphogluconolactonase; 2) 6-
phosphogluconolactone dehydrogenase. G6PD deficiency leads to reduced levels of NADPH. NADPH is crucial for the detoxification of hydrogen peroxide (H2O2) in all cells, but
particularly in RBC. NADPH is the substrate of glutathione reductase (GR), the enzyme
responsible for catalyzing the regeneration of GSSG to GSH, when it has been oxidized by
glutathione peroxidase (GPX).
1.3. Ribose-5-phosphate isomerase (RPI; EC 5.3.1.6)
RPI catalyzes the reversible conversion between the ketose R5P and its isomer,
the aldose Ru5P. The enzyme exists as two distinct proteins, RpiA and RpiB. RpiA is
present in nearly all organisms, while RpiB is present in bacteria and trypanosomatids.
Although the same reaction is catalyzed by both proteins, they show no sequence or
structural homology [14].
The human RPIA gene (ID 22934) is located in the short arm of chromosome 2
(2p11.2 region) and is highly conserved in most organisms. Mutations in this gene cause
ribose-5-phosphate isomerase deficiency (RPI deficiency, OMIM #608611). In 1999,
van der Knaap and co-workers [15] described a patient with slowly progressive brain
white matter disease (leukoencephalopathy) of unknown origin, and mild peripheral
polyneuropathy. The patient had no organomegaly or dysfunction of internal organs.
The usual metabolic screening done to this patient revealed no abnormal results in the
amino acids’, organic acids’, purines’, pyrimidines’, oligosaccharides’ and
mucopolysaccharides’ patterns [15]. The only altered results were marked elevations of
General introduction
15
arabitol and ribitol in urine, plasma and cerebrospinal fluid (CSF). A defect in the PPP
was hypothesized and in 2004 Huck and co-workers characterized the defect as RPI
deficiency (see Fig. 5) [6]. Until now, only one single diagnosed case of RPI deficiency
has been described, making it one of the rarest diseases [16]. Because of these
biochemical findings, the full-length RPIA cDNA was sequenced, and the authors found
two different mutations, a single base-pair deletion (c.540delG) and a nucleotide
substitution (c.182C>T), inherited from the mother and the father, respectively. The
deletion causes a frameshift change with asparagine 181, leading to a premature
termination of RPI protein translation, with a stop codon 17 amino acids downstream
(p.N181fsX17). The missense mutation, c.182C>T, leads to the substitution of an
alanine by a valine at codon 61 (p.A61V) [6].
These mutations were not found in 220 control chromosomes of individuals of
Northern Europe descent, indicating that those mutations are not likely to represent
polymorphisms, but instead are pathogenic mutations. The truncated RPI protein
encoded by the frameshift allele was not detected by Western blot, indicating that this
protein is not expressed or is rapidly degraded. RPI concentrations in both lymphoblasts
and fibroblasts of the patient showed a marked decline. These results were confirmed by
quantitative mass spectrometry and a decline of around 30% in RPI levels was
measured in the lymphoblasts of the patient, when compared to controls. Reinforcing
these data, qPCR demonstrated that RPIA mRNA levels were strongly reduced in
patient’s cells, around 40% in lymphoblasts and about 1% in fibroblasts, when
compared to controls. A cell type-dependency was demonstrated, having been reported
an enzyme activity of 30% in lymphoblasts and an activity bellow the assay’s detection
limit in fibroblasts [16].
Chapter 2
16
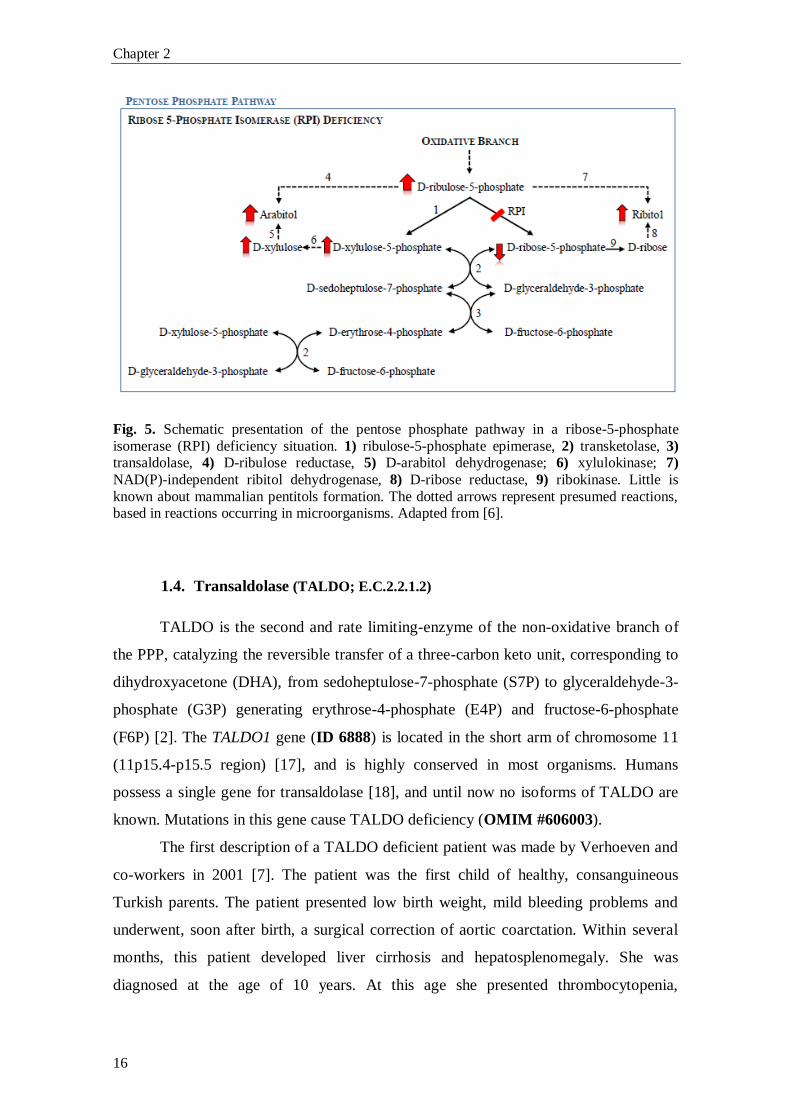
Fig. 5. Schematic presentation of the pentose phosphate pathway in a ribose-5-phosphate
isomerase (RPI) deficiency situation. 1) ribulose-5-phosphate epimerase, 2) transketolase, 3) transaldolase, 4) D-ribulose reductase, 5) D-arabitol dehydrogenase; 6) xylulokinase; 7)
NAD(P)-independent ribitol dehydrogenase, 8) D-ribose reductase, 9) ribokinase. Little is
known about mammalian pentitols formation. The dotted arrows represent presumed reactions, based in reactions occurring in microorganisms. Adapted from [6].
1.4. Transaldolase (TALDO; E.C.2.2.1.2)
TALDO is the second and rate limiting-enzyme of the non-oxidative branch of
the PPP, catalyzing the reversible transfer of a three-carbon keto unit, corresponding to
dihydroxyacetone (DHA), from sedoheptulose-7-phosphate (S7P) to glyceraldehyde-3-
phosphate (G3P) generating erythrose-4-phosphate (E4P) and fructose-6-phosphate
(F6P) [2]. The TALDO1 gene (ID 6888) is located in the short arm of chromosome 11
(11p15.4-p15.5 region) [17], and is highly conserved in most organisms. Humans
possess a single gene for transaldolase [18], and until now no isoforms of TALDO are
known. Mutations in this gene cause TALDO deficiency (OMIM #606003).
The first description of a TALDO deficient patient was made by Verhoeven and
co-workers in 2001 [7]. The patient was the first child of healthy, consanguineous
Turkish parents. The patient presented low birth weight, mild bleeding problems and
underwent, soon after birth, a surgical correction of aortic coarctation. Within several
months, this patient developed liver cirrhosis and hepatosplenomegaly. She was
diagnosed at the age of 10 years. At this age she presented thrombocytopenia,
General introduction
17
hepatosplenomegaly, enlarged clitoris, and mildly increased coagulation times. Her
neurological examinations showed normal results [7].
In 2005, Verhoeven and co-workers [19] described the second patient with
TALDO deficiency. The patient was the first of dizygotic female twins delivered by
emergency at 36 weeks’ gestation. The parents were of Turkish origin (as the first case
reported), and also consanguineous. Clinical symptoms in the neonatal period were
related to severe liver failure (severe coagulopathy, low serum protein, elevated blood
ammonia and hypoglycemia), generalized oedema, and this patient also featured
moderate muscular hypotonia and dysmorphic signs (down-slanting palpebral fissures,
low-set ears and increased intermamillary distance). Karyotype analysis demonstrated
XX/XO mosaicism. The patient died at day 18 due to bradycardic heart failure.
Remarkably, both patients showed transaminases and γ-glutmayltransferase levels
within the reference range [19].
In 2006, Valayannopoulos and co-workers [20] described four patients from the
same family. The parents were first cousins from Turkish origin. The couple had no
healthy children. The four patients shared the same biochemical and molecular defect.
They had hydrops fetalis and congenital multiorgan involvement. The major clinical
signs described were: dysmorphic features, liver dysfunction with elevated
aminotransferase levels and low albumin, hepatosplenomegaly, thrombocytopenia,
hemolytic anemia (with schistocytes), renal involvement and heart problems [20].
Neurological examination showed normal results for all surviving patients [7, 19, 20].
In 2007, Fung and co-workers [21] described a boy of a consanguineous
Pakistan couple, with intrauterine growth retardation (IUGR) in the antenatal period;
and hypoglycemia, thrombocytopenia, hepatosplenomegaly and deranged liver function
and coagulation in the post-natal period. The patient developed failure to thrive,
transient hypoglycemia and persistently mild thrombocytopenia [21].
In 2008, Wamelink and co-workers [22] described a new TALDO deficient
patient. The patient was the fourth child of consanguineous parents of Arabic ethnicity.
The patient was born with hepatosplenomegaly and developed jaundice and
thrombocytopenia. He had to be ventilated at day 9 because of poor respiratory effort.
The patient developed cirrhosis but had no inflammatory infiltrate. Until now, this is the
only TALDO deficient patient that has been described with rickets and deafness [22].
In 2009, Tylki-Szymanska and co-workers [23] described two cases of TALDO
deficient patients of Polish origin. The patients were siblings of a healthy
Chapter 2
18
consanguineous couple. Both patients presented hemolytic anemia and
hypoproteinemia, hepatosplenomegaly (with mildly elevated serum transaminases in the
first child and normal levels in the younger brother), thrombocytopenia and
haemorrhagic diathesis with skin bleeding [23].
In 2011, Balasubramaniam and co-workers [24] described the first TALDO
deficient patient born from a nonconsanguineous couple of Chinese ethnicity. He
presented at birth with hydrops fetalis and hypoalbuminemia. At the age of 2.5 months a
splenomegaly (with normal liver and kidney function and blood parameters) with febrile
illness was noted. Shortly after this febrile episode he was readmitted with seizures,
jaundice, discrete dysmorphic features (cutis laxa), hepatosplenomegaly (with mildly
elevated transaminases, bilirrubinemia and raised alkaline phosphatase),
thrombocytopenia and Coombs negative hemolytic anemia. The patient died at the age
of 4.5 months with flavobacterium sepsis and multiorgan failure [24].
In 2013, Eyaid and co-workers [25] described twelve new cases of TALDO
deficient patients from six Saudi consanguineous families. All patients shared clinical
signs, being the principal findings IUGR, dysmorphic features, cardiac defects,
hepatosplenomegaly, anemia and thrombocytopenia. As the authors followed part of the
patients along childhood, it permitted to track the natural history of the disease over a
larger number of years. The authors described that dysmorphic features (e.g. anti-
mongoloid slant, low set ears, cutis laxa) tend to disappear after the infancy, being more
recognizable in the neonatal period. The bleeding tendency and liver involvement
follows a more irregular course. The liver involvement was not always progressive and
its severity was variable even within different members of the same family. None of
these twelve patients presented hemolytic anemia, in contrast to the previously
described patients, and all presented cardiac problems [25].
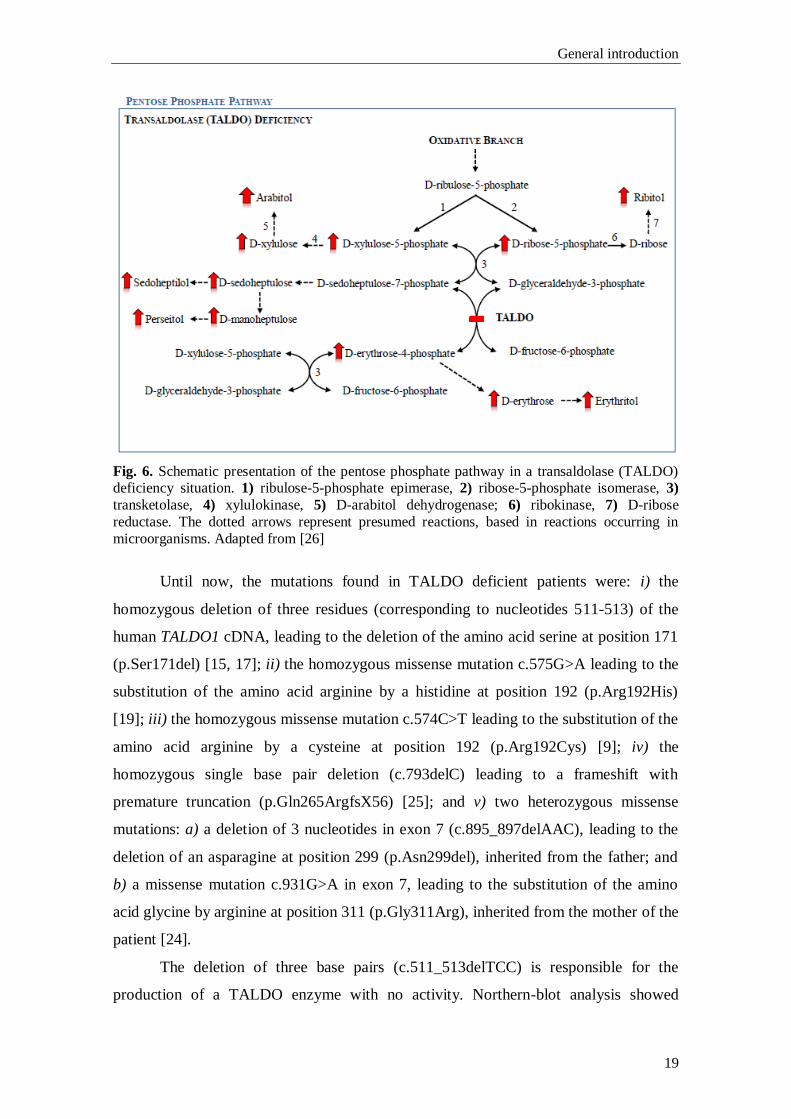
All twenty-three patients described so far [7, 19–25] have the same sugars’ and
polyols’ profile: elevated urinary concentrations of arabitol, ribitol, erythritol and
sedoheptulose (see Fig. 6), and normal CSF profile. All patients, but the patients
described by Tylki-Szymanska and co-workers and Fung and co-workers, presented
elevated levels of D-arabitol, ribitol and erythritol in plasma. One can deduce that these
patients would show the same plasmatic pattern of these compounds (i.e. elevated levels
of D-arabitol, ribitol and erythritol) if plasma samples would have been analyzed.
General introduction
19
Fig. 6. Schematic presentation of the pentose phosphate pathway in a transaldolase (TALDO) deficiency situation. 1) ribulose-5-phosphate epimerase, 2) ribose-5-phosphate isomerase, 3)
transketolase, 4) xylulokinase, 5) D-arabitol dehydrogenase; 6) ribokinase, 7) D-ribose
reductase. The dotted arrows represent presumed reactions, based in reactions occurring in
microorganisms. Adapted from [26]
Until now, the mutations found in TALDO deficient patients were: i) the
homozygous deletion of three residues (corresponding to nucleotides 511-513) of the
human TALDO1 cDNA, leading to the deletion of the amino acid serine at position 171
(p.Ser171del) [15, 17]; ii) the homozygous missense mutation c.575G>A leading to the
substitution of the amino acid arginine by a histidine at position 192 (p.Arg192His)
[19]; iii) the homozygous missense mutation c.574C>T leading to the substitution of the
amino acid arginine by a cysteine at position 192 (p.Arg192Cys) [9]; iv) the
homozygous single base pair deletion (c.793delC) leading to a frameshift with
premature truncation (p.Gln265ArgfsX56) [25]; and v) two heterozygous missense
mutations: a) a deletion of 3 nucleotides in exon 7 (c.895_897delAAC), leading to the
deletion of an asparagine at position 299 (p.Asn299del), inherited from the father; and
b) a missense mutation c.931G>A in exon 7, leading to the substitution of the amino
acid glycine by arginine at position 311 (p.Gly311Arg), inherited from the mother of the
patient [24].
The deletion of three base pairs (c.511_513delTCC) is responsible for the
production of a TALDO enzyme with no activity. Northern-blot analysis showed
Chapter 2
20
normal TALDOΔ511-513 mRNA levels but Western-blot analysis showed no
TALDOΔS171 protein in fibroblasts and lymphoblasts of the patient. The gene is
transcribed and translated in vitro, but TALDOΔS171 has no detectable activity. The
deletion of Ser171 resulted in conformational changes affecting the correct protein
folding, leading to: 1) aggregation of misfolded protein, 2) dominance of the mutant
protein leading to loss of wild-type activity, and 3) loss of function due to degradation
of the mutant protein [27].
Arginine 192 has been proposed to be part of the catalytic site of the enzyme.
This region is highly conserved, as are the amino acids asparagine at position 299 and
glycine at position 311 [28]. This, and the fact that in 210 control alleles none had a
mutation in this region, indicates that those missense mutations p.Arg192His,
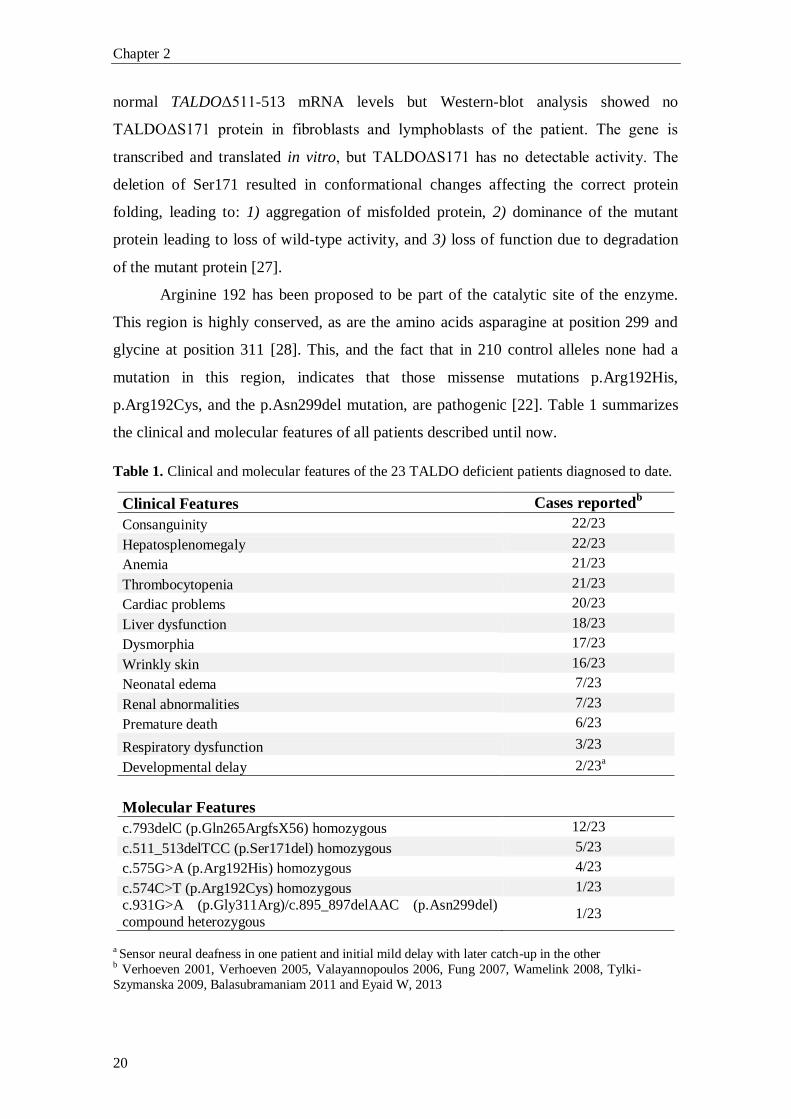
p.Arg192Cys, and the p.Asn299del mutation, are pathogenic [22]. Table 1 summarizes
the clinical and molecular features of all patients described until now.
Table 1. Clinical and molecular features of the 23 TALDO deficient patients diagnosed to date.
Clinical Features Cases reportedb
Consanguinity 22/23
Hepatosplenomegaly 22/23
Anemia 21/23
Thrombocytopenia 21/23
Cardiac problems 20/23
Liver dysfunction 18/23
Dysmorphia 17/23
Wrinkly skin 16/23
Neonatal edema 7/23
Renal abnormalities 7/23
Premature death 6/23
Respiratory dysfunction 3/23
Developmental delay 2/23a
Molecular Features
c.793delC (p.Gln265ArgfsX56) homozygous 12/23
c.511_513delTCC (p.Ser171del) homozygous 5/23
c.575G>A (p.Arg192His) homozygous 4/23
c.574C>T (p.Arg192Cys) homozygous 1/23
c.931G>A (p.Gly311Arg)/c.895_897delAAC (p.Asn299del)
compound heterozygous 1/23
a Sensor neural deafness in one patient and initial mild delay with later catch-up in the other b Verhoeven 2001, Verhoeven 2005, Valayannopoulos 2006, Fung 2007, Wamelink 2008, Tylki-
Szymanska 2009, Balasubramaniam 2011 and Eyaid W, 2013
General introduction
21
1.5. Xylulose reductase (XR; E.C.1.1.1.10)
L-xylulosuria or Essential Pentosuria (OMIM #608347) was firstly appointed as
an inborn error of metabolism, with no apparent clinical consequences, in 1908 by Sir
Archibald Garrod in his fourth Croonian Lecture [29]. The disease is characterized by
high excretion of L-xylulose in the urine (1 to 4 g of the pentose per day) [30]. The
disorder had been first described in 1892 by Salkowski and Jastrowitz [31], but it was
only with the work of Levene and La Forge [32], in 1914, that the sugar excreted in
such high concentrations was established as being xylulose [32]. In 1930, Greenwald
characterized it as the enantiomorph D-xylulose [33]. However, in the same year, he
wrote a correction letter to the same review stating that the sugar was indeed L(+)-
xylulose and not the previous D-xylulose [34]. The metabolic defect in essential
pentosuria is at the level of xylulose reductase, an important enzyme of the glucoronic
acid oxidation pathway, responsible for the conversion of L-xylulose to L-xylitol [30].
The condition was described in 1936, by Lasker and co-workers, as an inherited
autosomal recessive characteristic [35] almost limited to persons of the Ashkenazi
Jewish ancestry. The first reported case of a non-Hebrew patient with pentosuria was
done by Barnes and Bloomberg in 1953, where they described the condition in two
Lebanese sisters with no known Jewish ancestry [36]. After this case report, Politzer
and Fleishmann in 1962 studied 127 members of a Lebanese family and found 10 cases
of pentosuria. Nevertheless, due to the fact that not all samples of the ten affected
members gave positive results at all times (the study lasted for four years), the authors
postulated that the inheritance could be considered as dominant with poor penetrance
[37]. It was also in 1962 that Khachadurian described twelve cases of pentosuria in
three highly inbred Lebanese families, establishing, once and for all, the inheritance of
pentosuria as having a Mendelian recessive pattern [38].
By ion-exchange chromatography of red cells’ L-xylulose reductase, Lane and
co-workers [39] showed in 1984 that the enzyme existed in two isoforms, a minor and a
major. The authors also showed that the pentosuric patients lacked the major isozyme,
the isoform responsible for the conversion of the bulk of L-xylulose to xylitol in the
glucoronic acid pathway, thus leading to the accumulation and excretion of high
amounts of L-xylulose in urine (Fig. 7). The major and minor isoforms were postulated
to be encoded by two separate genes, since normal individuals and pentosuric patients
had similar amounts of the minor isozyme [39].
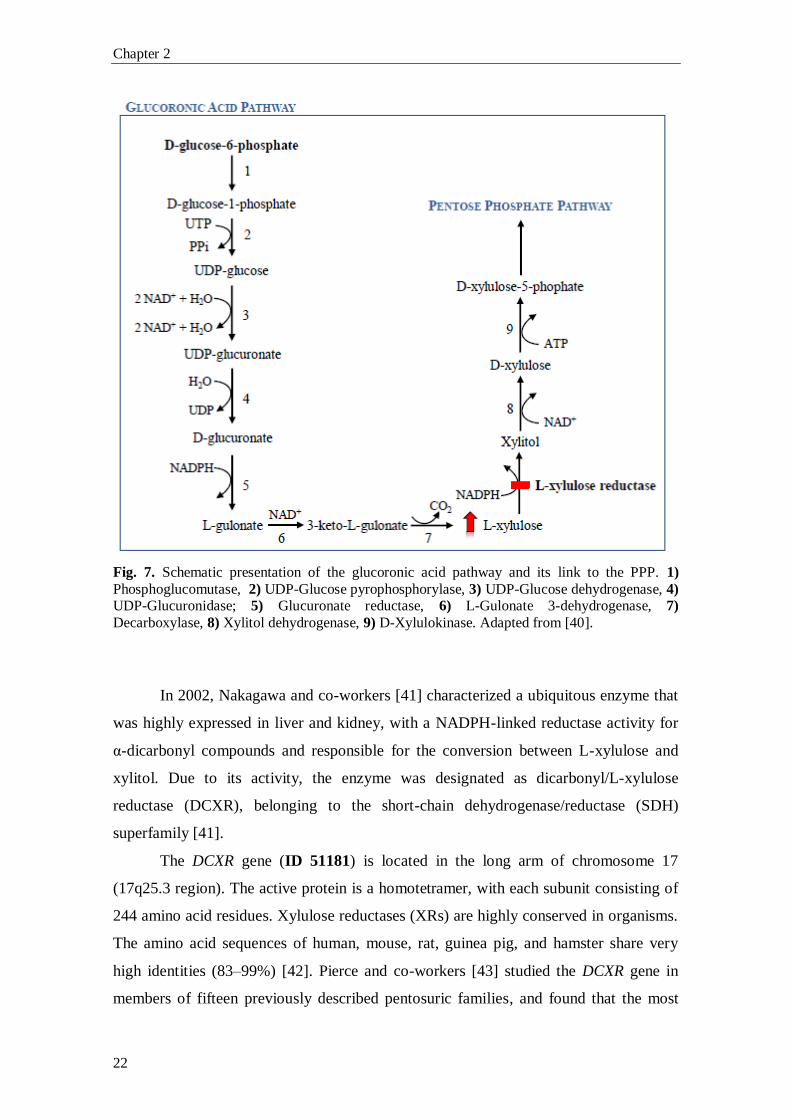
Chapter 2
22
Fig. 7. Schematic presentation of the glucoronic acid pathway and its link to the PPP. 1)
Phosphoglucomutase, 2) UDP-Glucose pyrophosphorylase, 3) UDP-Glucose dehydrogenase, 4) UDP-Glucuronidase; 5) Glucuronate reductase, 6) L-Gulonate 3-dehydrogenase, 7)
Decarboxylase, 8) Xylitol dehydrogenase, 9) D-Xylulokinase. Adapted from [40].
In 2002, Nakagawa and co-workers [41] characterized a ubiquitous enzyme that
was highly expressed in liver and kidney, with a NADPH-linked reductase activity for
α-dicarbonyl compounds and responsible for the conversion between L-xylulose and
xylitol. Due to its activity, the enzyme was designated as dicarbonyl/L-xylulose
reductase (DCXR), belonging to the short-chain dehydrogenase/reductase (SDH)
superfamily [41].
The DCXR gene (ID 51181) is located in the long arm of chromosome 17
(17q25.3 region). The active protein is a homotetramer, with each subunit consisting of
244 amino acid residues. Xylulose reductases (XRs) are highly conserved in organisms.
The amino acid sequences of human, mouse, rat, guinea pig, and hamster share very
high identities (83–99%) [42]. Pierce and co-workers [43] studied the DCXR gene in
members of fifteen previously described pentosuric families, and found that the most
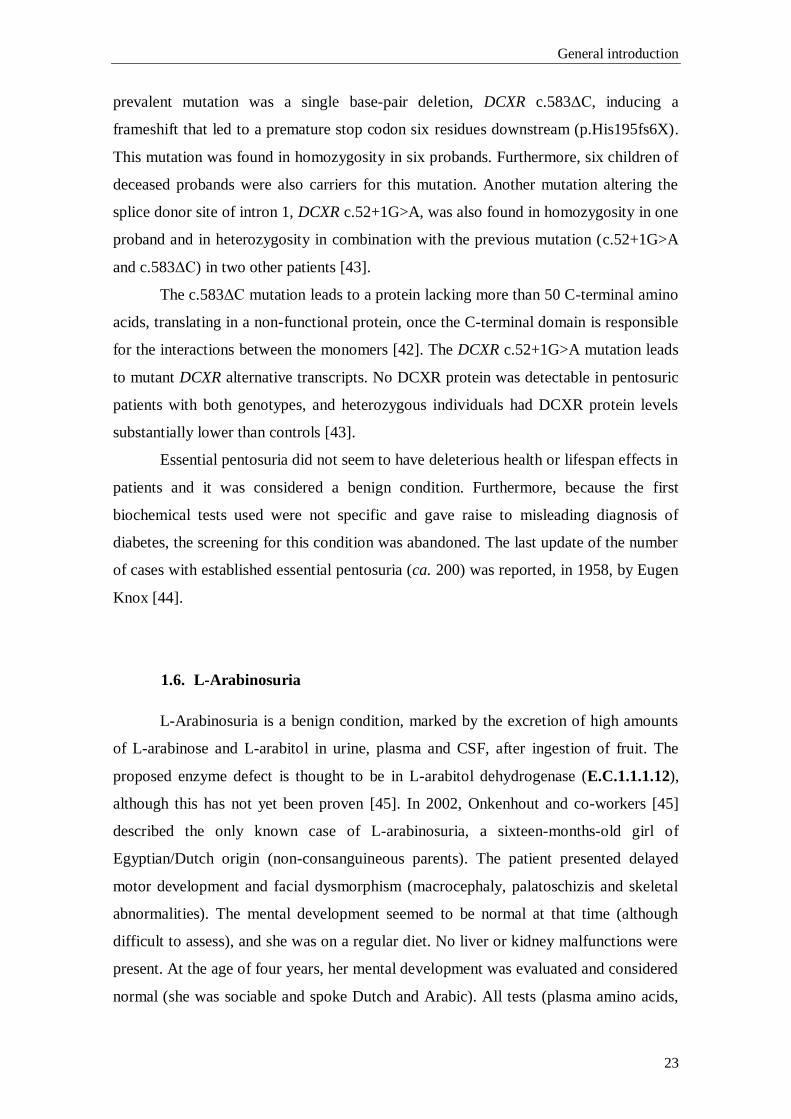
General introduction
23
prevalent mutation was a single base-pair deletion, DCXR c.583ΔC, inducing a
frameshift that led to a premature stop codon six residues downstream (p.His195fs6X).
This mutation was found in homozygosity in six probands. Furthermore, six children of
deceased probands were also carriers for this mutation. Another mutation altering the
splice donor site of intron 1, DCXR c.52+1G>A, was also found in homozygosity in one
proband and in heterozygosity in combination with the previous mutation (c.52+1G>A
and c.583ΔC) in two other patients [43].
The c.583ΔC mutation leads to a protein lacking more than 50 C-terminal amino
acids, translating in a non-functional protein, once the C-terminal domain is responsible
for the interactions between the monomers [42]. The DCXR c.52+1G>A mutation leads
to mutant DCXR alternative transcripts. No DCXR protein was detectable in pentosuric
patients with both genotypes, and heterozygous individuals had DCXR protein levels
substantially lower than controls [43].
Essential pentosuria did not seem to have deleterious health or lifespan effects in
patients and it was considered a benign condition. Furthermore, because the first
biochemical tests used were not specific and gave raise to misleading diagnosis of
diabetes, the screening for this condition was abandoned. The last update of the number
of cases with established essential pentosuria (ca. 200) was reported, in 1958, by Eugen
Knox [44].
1.6. L-Arabinosuria
L-Arabinosuria is a benign condition, marked by the excretion of high amounts
of L-arabinose and L-arabitol in urine, plasma and CSF, after ingestion of fruit. The
proposed enzyme defect is thought to be in L-arabitol dehydrogenase (E.C.1.1.1.12),
although this has not yet been proven [45]. In 2002, Onkenhout and co-workers [45]
described the only known case of L-arabinosuria, a sixteen-months-old girl of
Egyptian/Dutch origin (non-consanguineous parents). The patient presented delayed
motor development and facial dysmorphism (macrocephaly, palatoschizis and skeletal
abnormalities). The mental development seemed to be normal at that time (although
difficult to assess), and she was on a regular diet. No liver or kidney malfunctions were
present. At the age of four years, her mental development was evaluated and considered
normal (she was sociable and spoke Dutch and Arabic). All tests (plasma amino acids,
Chapter 2
24
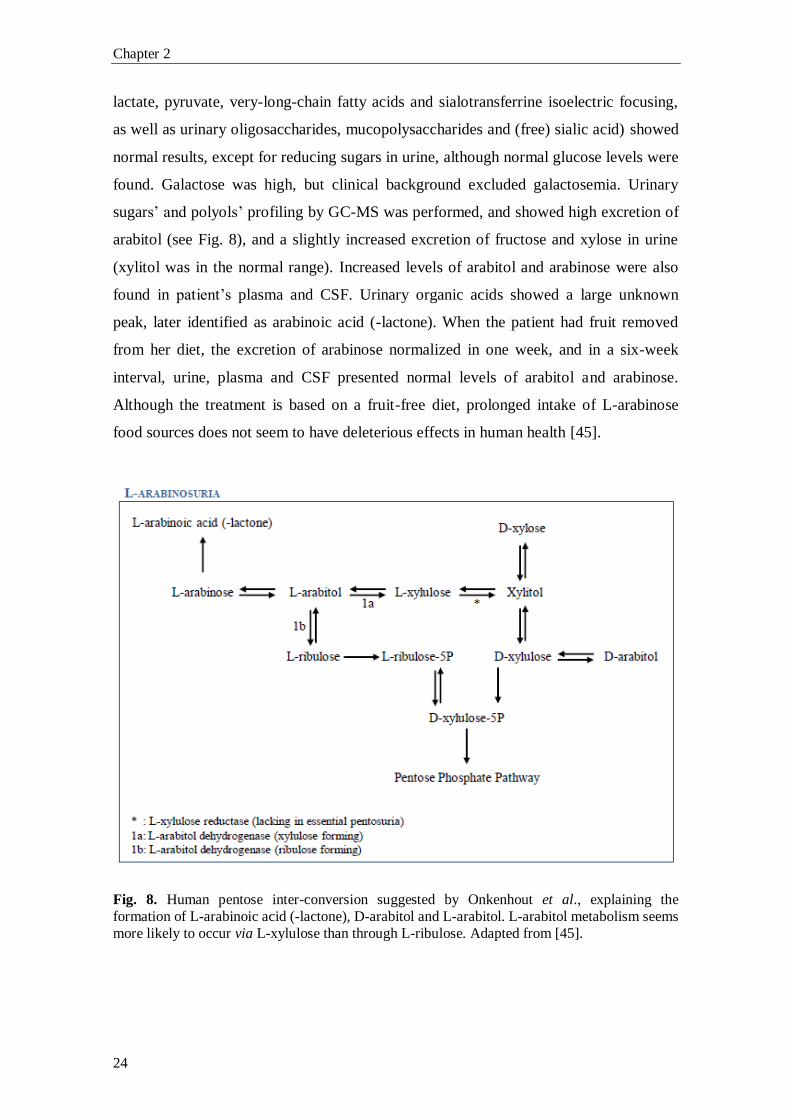
lactate, pyruvate, very-long-chain fatty acids and sialotransferrine isoelectric focusing,
as well as urinary oligosaccharides, mucopolysaccharides and (free) sialic acid) showed
normal results, except for reducing sugars in urine, although normal glucose levels were
found. Galactose was high, but clinical background excluded galactosemia. Urinary
sugars’ and polyols’ profiling by GC-MS was performed, and showed high excretion of
arabitol (see Fig. 8), and a slightly increased excretion of fructose and xylose in urine
(xylitol was in the normal range). Increased levels of arabitol and arabinose were also
found in patient’s plasma and CSF. Urinary organic acids showed a large unknown
peak, later identified as arabinoic acid (-lactone). When the patient had fruit removed
from her diet, the excretion of arabinose normalized in one week, and in a six-week
interval, urine, plasma and CSF presented normal levels of arabitol and arabinose.
Although the treatment is based on a fruit-free diet, prolonged intake of L-arabinose
food sources does not seem to have deleterious effects in human health [45].
Fig. 8. Human pentose inter-conversion suggested by Onkenhout et al., explaining the
formation of L-arabinoic acid (-lactone), D-arabitol and L-arabitol. L-arabitol metabolism seems
more likely to occur via L-xylulose than through L-ribulose. Adapted from [45].
General introduction
25
1.7. The PPP and tumor cells’ metabolism
Since the 1920s it is known that tumor cells display increased rates of glucose
metabolism compared with normal tissues. Normal cells mainly produce energy from
mitochondrial oxidative phosphorylation, whereas tumor cells mainly rely on
fermentation to produce the energy needed, even in the presence of oxygen [46]. This
phenomenon is denominated as the Warburg effect or aerobic glycolysis. In 1926,
Warburg and co-workers demonstrated that about 66% of the glucose consumption, in
tumor slices, was through fermentation, and the remainder through respiration despite
the availability of oxygen [46]. The same authors also showed that in the time needed
for a cancer tissue to metabolize 1 molecule of glucose by oxidative phosphorylation
(yielding 36 ATP molecules), 12 more glucose molecules were converted to 24 lactic
acid molecules, in normoxic conditions, by the so called aerobic glycolysis (yielding a
total of 60 ATP molecules) [47]. The oxidative phosphorylation persists at the same
time as aerobic glycolysis in the vast majority of tumors, if not all, continuing to supply
energy necessary for housekeeping functions and biosynthetic reactions [41, 42]. For
most mammalian cells metabolism, the major catabolic molecules are glucose and
glutamine, being responsible for supplying carbon, nitrogen, free energy, and reducing
equivalents required to cell growth and division [50]. So, if all glucose molecules were
to be catabolized to CO2 by the oxidative phosphorylation to produce ATP, all the other
needs of a growing cell (e.g. acetyl-CoA to produce fatty acids, glycolytic intermediates
for nonessential amino acids to produce proteins, and ribose for nucleotides) would not
be supplied. In 2007, using 13
C Nuclear Magnetic Resonance (NMR) spectroscopy,
DeBerardinis and co-workers [51] showed that more than 90% of total glucose
metabolism was spent in the production of lactate and alanine, and 60% of total
glutamine utilization was also used in the production of these compounds. Very
importantly, a by-product of glutaminolysis, i.e. glutamine conversion to lactate by the
action of malate dehydrogenase (malic enzyme; ME), is NADPH [51]. Also lactate
production involving the enzyme lactate dehydrogenase (LDH) produces NADPH [50].
These NADPH molecules can supply other anabolic processes such as fatty acid
synthesis and, together with ribose-5-phosphate (derived from the PPP), nucleotide
synthesis [52]. The majority of acetyl-CoA is derived from glucose, and the majority of
oxaloacetate (OOA) is derived from glutamine (accounting for a very important
anaplerotic role in the TCA cycle) [51]. So, an inefficient usage of cellular resources, as

Chapter 2
26
it appeared to be the Warburg effect, in which glucose produces lactate, ergo not
exploiting the full capacity of oxidative metabolism to produce the so needed ATP,
proved in fact to be an important pathway for faster incorporation of carbon into
biomass, facilitating the huge requirements of rapid cell divisions [48, 49].
Many metabolic routes regarding (de)regulation of cell metabolism in cancer
cells, like fatty acids synthesis and mitochondrial respiration, are known and have been
strongly studied, but in the purpose of this thesis, only aspects linked with the PPP have
been highlighted and will be further discussed. Increased understanding of these
complex networking pathways is needed to better characterize tumor cells metabolism,
allowing the future development of new therapeutic targets in inhibition of cancer cells
growth and proliferation.
1.7.1. The PPP and tumor cells’ metabolism: p53 and G6PD
The PPP is an important pathway for glucose catabolism and biosynthesis,
playing a major role in providing key biosynthetic intermediates as NADPH and R5P.
These intermediate metabolites are pivotal to cell proliferation, turning the PPP in an
attractive metabolic route of target in tumor cells [53]. Recent studies have
demonstrated that G6PD is overexpressed in certain tumor types (gastric, colorectal [54]
and kidney tumors [55]). Furthermore, G6PD has been shown to be negatively regulated
by wild-type but not mutant p53 [56]. p53 is a known tumor suppressor responsible for
cell cycle arrest, DNA repair and apoptosis [57], and now an important role in
modulating cancer cell metabolism is being “awarded” to p53.
p53 is the most frequently mutated tumor suppressor gene in human cancers, and
since its product binds to G6PD (inhibiting its activity), a mutated p53 will lead to a
strong enhancement of PPP flux (~ 50%) by lack of G6PD activity regulation [56].
Studies performed by Jiang and co-workers [56] in p53-/-
human colon cancer HCT116
cell line showed a strong increase in NADPH levels (~ 2 folds). The authors also
studied the NADPH levels in heart, liver, kidney and lung tissues from p53-/-
mice,
finding elevated levels compared to the corresponding tissues from p53+/+
mice.
Furthermore, p53 does not change the levels of G6PD transcript. It acts by disrupting
the formation of the dimeric G6PD holoenzyme. G6PD needs NADP+ for the formation
of the holoenzyme, and the diminished interaction between G6PD and NADP+ when
General introduction
27
p53 binds, leads to disruption of the active dimeric G6PD formation (Fig. 9). These
results are highlighted by the impaired interaction of G6PD and p53 in the presence of
NADPH, in a dose-dependent manner [56].
1.7.2. The PPP and tumor cells’ metabolism: p53 and TIGAR
TIGAR (TP53-induced glycolysis and apoptosis regulator) gene is located in the
short arm of chromosome 12 (12p13-3 region) and contains six potential coding exons
and two possible p53 binding sites (BS1, upstream of the first exon, and BS2 within the
first intron). By microarray analysis, TIGAR gene was identified as inducible by p53
[58]. Bensaad and co-workers [58] demonstrated that TIGAR protein shares similarities
with proteins from the phosphoglycerate family (PGM), mainly with the biphosphatase
domain of the different isoform products of the four genes (pfkfb 1-4) encoding the
enzyme 6-phosphofructokinase 2/fructose-2,6-biphosphatase (PFK-2/FBPase-2). This is
a bifunctional enzyme, with both kinase (NH2-terminal region of the enzyme) and
phosphatase (COOH-terminal region) activities. TIGAR only shows similarities with
the biphosphatase domain of PFK-2/FBPase-2, therefore only having the capability to
dephosphorilate substrates [58].
PFK-2/FBPase-2 regulates the synthesis (PFK-2; E.C.2.7.1.105) and
degradation (FBPase-2; E.C.3.1.3.46) of intracellular fructose-2,6-biphosphate (Fru-
2,6-P2). This compound is a potent allosteric effector of 6-phosphofructokinase 1
(PFK-1), stimulating glycolysis and inhibiting gluconeogenesis. TIGAR, through the
dephosphorylation of Fru-2,6-P2, inhibits PFK-1 leading to accumulation of fructose-6-
phosphate (F6P). F6P is isomerized to glucose-6-phosphate (G6P) by phosphoglucose
isomerase and G6P is diverted to the PPP (Fig. 9). The shift of G6P to the PPP leads to
increased production of NADPH and R5P, important precursors of DNA biosynthesis
and repair, also lowering apoptosis due to increased generation of reduced glutathione
(GSH) and removal of reactive oxygen species (ROS) [58].
Chapter 2
28
1.7.3. The PPP and tumor cells’ metabolism: The transketolase family
Transketolase (TKT; E.C.2.2.1.1) is the first enzyme of the non-oxidative
branch of the PPP and, together with transaldolase, links the oxidative branch of the
PPP with glycolysis. TKT is an ubiquitous homodimeric enzyme [59], responsible for
the reversible transfer of two-carbon units (1,2-dihydroxyethyl) in two major reactions:
(i) conversion of Xu5P and R5P to S7P and G3P, and (ii) conversion of Xu5P and E4P
to F6P and G3P [2]. The TKT gene (ID 7086) is located in the short arm of chromosome
3 (3p14.3 region) [60].
TKT is a thiamine diphosphate (ThDP, the active derivative of vitamin B1) and
Ca2+
ion dependent enzyme [33, 34], presenting high degree of sequence similarities in
different species [59].
The human genome encodes two related TKT proteins, TKTL1 and TKTL2
(transketolase-like 1 and 2 protein) [63]. TKTL1 and TKTL2 share a sequence identity
at the amino acid level of 61% and 66% compared to TKT, respectively. Not much is
known about the biochemical properties of TKTL1 and TKTL2, and until now there are
no reports on enzymatic or cellular functions of TKTL2 enzyme, and little is known
about TKTL1 [59]. TKTL1 mRNA and protein levels, but not TKTL2 and TKT, are
overexpressed in a wide variety of solid cancers and have been associated with
transformation to a more malignant phenotype in different carcinoma entities [55]. This
overexpression is connected to poor patient survival [64]. The enhancement of both
oxidative and non-oxidative branch of the PPP in proliferating cells, due to huge needs
in energy, amino acids, fatty acids, nucleotides and NADPH, explains the
overexpression of TKTL1 (Fig. 9). Zhang and co-workers [65] showed that TKTL1
accounts for approximately 50% of total transketolase content (TKT, TKTL1 and
TKTL2), and that the use of TKTL1 RNA interference (RNAi-mediated suppression)
leads to inhibition of more than 50% of total transketolase activity [65]. TKT plays an
important role in recruiting glucose and synthesizing ribose, accounting for more than
85% of newly synthesized ribose in cancer cells [66]. Boros and co-workers [66] also
described that the usage of oxythiamine, an inhibitor of TKT, leads to decrease in the
synthesis of nucleic acids and a huge reduction in cell volume and proliferation [66].
Taking all these data together, inhibiting TKTL1 or TKT activity can become a
promising therapeutic target in future cancer therapy.
General introduction
29
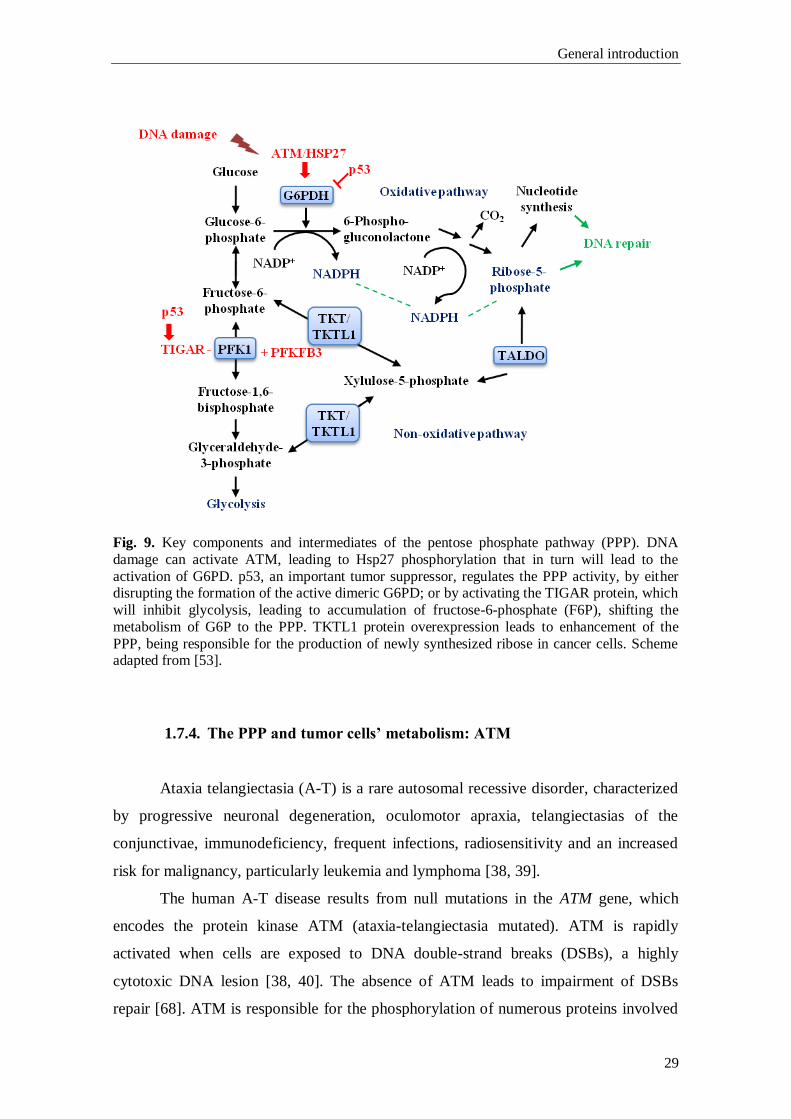
Fig. 9. Key components and intermediates of the pentose phosphate pathway (PPP). DNA
damage can activate ATM, leading to Hsp27 phosphorylation that in turn will lead to the
activation of G6PD. p53, an important tumor suppressor, regulates the PPP activity, by either disrupting the formation of the active dimeric G6PD; or by activating the TIGAR protein, which
will inhibit glycolysis, leading to accumulation of fructose-6-phosphate (F6P), shifting the
metabolism of G6P to the PPP. TKTL1 protein overexpression leads to enhancement of the
PPP, being responsible for the production of newly synthesized ribose in cancer cells. Scheme adapted from [53].
1.7.4. The PPP and tumor cells’ metabolism: ATM
Ataxia telangiectasia (A-T) is a rare autosomal recessive disorder, characterized
by progressive neuronal degeneration, oculomotor apraxia, telangiectasias of the
conjunctivae, immunodeficiency, frequent infections, radiosensitivity and an increased
risk for malignancy, particularly leukemia and lymphoma [38, 39].
The human A-T disease results from null mutations in the ATM gene, which
encodes the protein kinase ATM (ataxia-telangiectasia mutated). ATM is rapidly
activated when cells are exposed to DNA double-strand breaks (DSBs), a highly
cytotoxic DNA lesion [38, 40]. The absence of ATM leads to impairment of DSBs
repair [68]. ATM is responsible for the phosphorylation of numerous proteins involved
Chapter 2
30
in cell cycle checkpoint control, apoptotic responses and DNA repair [69]. Moreover, an
important role in the PPP metabolism has been ascribed to ATM. It has been described
that ATM activates the p38-MK2 pathway, which is responsible for phosphorylation of
the small heat shock protein Hsp27 upon DNA damage [70]. In 2011, Consentino and
co-workers [68] described the relation between ATM, Hsp27 and G6PD. Although the
mechanisms explaining the affinity of Hsp27 for G6PD through ATM induction are not
well established, Hsp27 was described as regulator of G6PD activity in a non-
transcriptional manner. ATM induces G6PD activity by increasing the affinity of Hsp27
for G6PD (Fig. 9). This regulation leads to an activation of the PPP, being of utmost
importance in the increasing need of the dNTPs pool which allows DNA repair and
NADPH production, pivotal for control of the redox metabolism [68].
General introduction
31
2. Bibliography
[1] M.M. Wamelink, E.A. Struys, C. Jakobs, The biochemistry, metabolism and
inherited defects of the pentose phosphate pathway: a review, J. Inherit. Metab. Dis. 31
(2008) 703–17.
[2] D.L. Nelson, M.M. Cox, Lenhinger Principles of Biochemistry, Worth
Publishers, 3rd edition (2000) chapter 15.
[3] M.D. Cappellini, G. Fiorelli, Glucose-6-phosphate dehydrogenase deficiency,
Lancet 371 (2008) 64–74.
[4] Y. Xu, Z. Zhang, J. Hu, I.E. Stillman, J.A. Leopold, D.E. Handy, J. Loscalzo,
R.C. Stanton, Glucose-6-phosphate dehydrogenase-deficient mice have increased renal
oxidative stress and increased albuminuria, FASEB J. 24 (2010) 609–16.
[5] M.R. Noori-Daloii, M. Daneshpajooh, Molecular basis of G6P deficiency:
current status and its perspective, Acta Medica Iranica, 46 (2008) 167–182.
[6] J.H. Huck, N.M. Verhoeven, E.A. Struys, G.S. Salomons, C. Jakobs, M.S. van
der Knaap, Ribose-5-phosphate isomerase deficiency: new inborn error in the pentose
phosphate pathway associated with a slowly progressive leukoencephalopathy, Am. J.
Hum. Genet. 74(2004) 745-51.
[7] N.M. Verhoeven, J.H. Huck, B. Roos, E.A. Struys, G.S. Salomons, A.C.
Douwes, M.S. van der Knaap, C. Jakobs, Transaldolase deficiency: liver cirrhosis
associated with a new inborn error in the pentose phosphate pathway, Am. J. Hum.
Genet. 68 (2001) 1086–92.
[8] L. Luzzatto, A. Mehta, T. Vulliamy, Glucose-6-Phosphate dehydrogenase
deficiency, In C. Scriver, A. Beaudet, W. Sly, D. Valle, The Metabolic & Molcecular
Bases of Inherited Diseases, 8th ed. New York, McGraw-Hill (2001) 4517–4553.
[9] M.G. Persico, G. Viglietto, G. Martini, D. Toniolo, G. Paonessa, C. Moscatelli,
R. Dono, T. Vulliamy, L. Luzzatto, M. D’Urso, Isolation of human glucose-6-phosphate
dehydrogenase (G6PD) cDNA clones: primary structure of the protein and unusual 5’
non-coding region, Nucleic Acids Res. 14 (1986) 2511–2522.
[10] E. Beutler, G6PD deficiency, Blood 84 (1994) 3613–36.
[11] E. Beutler, Glucose-6-phosphate dehydrogenase deficiency: a historical
perspective, Blood 111 (2008) 16–24.
[12] E. Beutler, The hemolytic effect of primaquine and related compounds: a
review, Blood 14 (1959) 103–139.
[13] W.W. Group, Glucose-6-phosphate dehydrogenase deficiency, Bull. World
Health Organ. 67 (1989) 601–611.
Chapter 2
32
[14] M.A. Holmes, F.S. Buckner, W.C. Van Voorhis, C.L. Verlinde, C. Mehlin, E.
Boni, G. DeTitta, J. Luft, A. Lauricella, L. Anderson, O. Kalyuzhniy, F. Zucker, L.W.
Schoenfeld, T.N. Earnest, W.G. Hol, E.A. Merritt, Structure of ribose 5-phosphate
isomerase from Plasmodium falciparum, Acta Crystallogr. Sect. F Struct. Biol. Cryst.
Commun. 62 (2006) 427–31.
[15] M.S. van der Knaap, R.A. Wevers, E.A. Struys, N.M. Verhoeven, P.J. Pouwels,
U.F. Engelke, W. Feikema, J. Valk, and C. Jakobs. Leukoencephalopathy Associated
with a Disturbance in the Metabolism of Polyols, Ann. Neurol. 46 (1999) 925–928.
[16] M.M. Wamelink, N.M. Grüning, E.E. Jansen, K. Bluemlein, H. Lehrach, C.
Jakobs, M. Ralser, The difference between rare and exceptionally rare: molecular
characterization of ribose 5-phosphate isomerase deficiency, J. Mol. Med. (Berl) 88
(2010) 931–9.
[17] K. Banki, R.L. Eddy, T.B. Shows, D.L. Halladay, F. Bullrich, C.M. Croce, V.
Jurecic, A. Baldini, A. Perl, The human transaldolase gene (TALDO1) is located on
chromosome 11 at p15.4-p15.5, Genomics 45 (1997) 233–8.
[18] A.K. Samland, G.A. Sprenger, Transaldolase: from biochemistry to human
disease, Int. J. Biochem. Cell. Biol. 41 (2009) 1482–94.
[19] N.M. Verhoeven, M. Wallot, J.H. Huck, O. Dirsch, A. Ballauf, U. Neudorf, G.S.
Salomons, M.S. van der Knaap, T. Voit, C. Jakobs, A newborn with severe liver failure,
cardiomyopathy and transaldolase deficiency, J. Inherit. Metab. Dis. 28 (2005) 169–79.
[20] V. Valayannopoulos, N.M. Verhoeven, M. Karine, G.S. Salomons, S. Daniéle,
M. Gonzales, G. Touati, P. Lonlay, C. Jakobs, J.M. Saudubray, Transaldolase
deficiency: a new case of hydrops fetalis and neonatal multi-organ disease, J. Pediatr.
149 (2006) 713–717.
[21] C.W. Fung, S. Siu, C. Mak, G. Poon, K.Y. Wong, P.T. Cheung, L. Low, S. Tam,
V. Wong, A rare cause of hepatosplenomegaly - Transaldolase deficiency, J. Inherit.
Metab. Dis. 30 (Suppl 1) (2007) 62.
[22] M.M. Wamelink, E.A. Struys, G.S. Salomons, D. Fowler, C. Jakobs, P.T.
Clayton, Transaldolase deficiency in a two-year-old boy with cirrhosis, Mol. Genet.
Metab. 94 (2008) 255–8.
[23] A. Tylki-Szymańska, T.J. Stradomska, M.M. Wamelink, G.S. Salomons, J.
Taybert, J. Pawłowska, C. Jakobs, Transaldolase deficiency in two new patients with a
relative mild phenotype, Mol. Genet. Metab. 97 (2009) 15–7.
[24] S. Balasubramaniam, M.M. Wamelink, L.H. Ngu, A. Talib, G.S. Salomons, C.
Jakobs, W.T. Keng, “Novel heterozygous mutations in TALDO1 gene causing
transaldolase deficiency and early infantile liver failure, J. Pediatr. Gastroenterol. Nutr.
52 (2011) 113–6.
[25] W. Eyaid, T. Al Harbi, S. Anazi, M.M. Wamelink, C. Jakobs, M. Al Salammah,
M. Al Balwi, M. Alfadhel, F.S. Alkuraya, Transaldolase deficiency: report of 12 new
cases and further delineation of the phenotype, J. Inherit. Metab. Dis. [Epub ahead of
print] (2013).
General introduction
33
[26] M.M. Wamelink, D.E. Smith, E.E. Jansen, N.M. Verhoeven, E.A. Struys, C.
Jakobs, Detection of transaldolase deficiency by quantification of novel seven-carbon
chain carbohydrate biomarkers in urine, J. Inherit. Metab. Dis. 30 (2007) 735–42
[27] C.E. Grossman, B. Niland, C. Stancato, N.M. Verhoeven, M.S. van Der Knaap,
C. Jakobs, L.M. Brown, S. Vajda, K. Banki, A. Perl, Deletion of Ser-171 causes
inactivation, proteasome-mediated degradation and complete deficiency of human
transaldolase, Biochem. J. 382 (2004) 725–31.
[28] S. Thorell, P. Gergely, K. Banki, A. Perl, G. Schneider, The three-dimensional
structure of human transaldolase, FEBS let. 475 (2000) 205–8.
[29] A.E. Garrod, The Croonian Lectures on Inborn Errors of Metabolism, The
Lancet II (1908) 1-7.
[30] Y.M. Wang, J. van Eys, The enzymatic defect in essential pentosuria, N. Engl. J.
Med. 282 (1970) 892–896.
[31] E. Salkowski, M. Jastrowitz, Uber eine bisher nicht Beobachtete Zuckerart im
Harn, Zbl. Med. Wissensch. 30 (1892) 22–24.
[32] P.A. Levene, F.B. La Forge, Note on a case of pentosuria, J. Biol. Chem. 18
(1914) 319–327.
[33] I. Greenwald, The nature of the sugar in four cases of pentosuria, J. Biol. Chem.
88 (1930) 1–7.
[34] I. Greenwald, The nature of the sugar in four cases of pentosuria, a Correction, J.
Biol. Chem. 88 (1930) 501.
[35] M. Lasker, M. Enklewitz, G.W. Lasker, The inheritance of L-xyloketosuria
(essential pentosuria), Hum. Biol. 8 (1936) 243–255.
[36] Barnes, Bloomberg, Essential Pentosuria, Br. Med. J. 1 (1963) 1628–1629.
[37] W.M. Politzer, H. Fleischmann, L-xylulosuria in a Lebanese family, Am. J.
Hum. Genet. 14 (1962) 256–60.
[38] A.K. Khachadurian, Essential pentosuria, Am. J. Hum. Genet. 14 (1962) 249–
55.
[39] A.B. Lane, On the nature of L-xylulose reductase deficiency in essential
pentosuria, Biochem. Genet. 23 (1985) 61–72.
[40] C.L. Linster, E. Van Schaftingen, Vitamin C. Biosynthesis, recycling and
degradation in mammals, FEBS J. 274 (2007) 1–22.
[41] J. Nakagawa, S. Ishikura, J. Asami, T. Isaji, N. Usami, A. Hara, T. Sakurai, K.
Tsuritani, K. Oda, M. Takahashi, M. Yoshimoto, N. Otsuka, K. Kitamura, Molecular
characterization of mammalian dicarbonyl/L-xylulose reductase and its localization in
kidney, J. Biol. Chem. 277 (2002) 17883–91.
Chapter 2
34
[42] O. El-Kabbani, S. Ishikura, C. Darmanin, V. Carbone, R.P. Chung, N. Usami, A.
Hara, Crystal structure of human L-xylulose reductase holoenzyme: probing the role of
Asn107 with site-directed mutagenesis, Proteins 55 (2004) 724–32.
[43] S.B. Pierce, C.H. Spurrell, J.B. Mandell, M.K. Lee, S. Zeligson, M.S. Bereman,
S.M. Stray, S. Fokstuen, M.J. MacCoss, E. Levy-Lahad, M.C. King, A.G. Motulsky,
Garrod’s fourth inborn error of metabolism solved by the identification of mutations
causing pentosuria, Proc. Natl. Acad. Sci. U. S. A. 108 (2011) 18313–7.
[44] W.E. Knox, Sir Archibald Garrod’s Inborn Errors of Metabolism. IV.
Pentosuria, The Am. J. Hum. Genet. 10 (1958) 385–397.
[45] W. Onkenhout, J.E. Groener, N.M. Verhoeven, C. Yin, L.A. Laan, L-
Arabinosuria: a new defect in human pentose metabolism, Mol. Genet. Metab. 77
(2002) 80–85.
[46] O. Warburg, F. Wind, E. Negelein, The Metabolism of Tumors in the Body, J.
Gen. Physiol. 8 (1926) 519–530.
[47] O. Warburg, K. Posener, E. Negelein, Uber den Stoffwechsel der Carcinomzelle,
Biochem. Zeitschr. 152 (1924) 309–344.
[48] W.H. Koppenol, P.L. Bounds, The Warburg effect and metabolic efficiency: re-
crunching the number, Science. [Online]. Available: http://www.sciencemag.org/
content/324/5930/1029/reply#sci=398be983-ebcd-4502-817d-e3f931b9bc37.
[49] M.G. Vander Heiden, L.C. Cantley, C.B. Thompson, Response to W.H.
Koppenol and P. L. Bounds, Science. [Online]. Available: http://www.sciencemag.org/
content/324/5930/1029/reply#sci=398be983-ebcd-4502-817d-e3f931b9bc37.
[50] M.G. Vander Heiden, L.C. Cantley, C.B. Thompson, Understanding the
Warburg Effect: The Metabolic Requirements of Cell Proliferation, Science, 324 (2010)
1029–1033.
[51] R.J. DeBerardinis, A. Mancuso, E. Daikhin, I. Nissim, M. Yudkoff, S. Wehrli,
and C.B. Thompson, Beyond aerobic glycolysis: transformed cells can engage in
glutamine metabolism that exceeds the requirement for protein and nucleotide synthesis,
Proc. Natl. Acad. Sci. U. S. A. 104 (2007) 19345–50.
[52] O. Feron, Pyruvate into lactate and back: from the Warburg effect to symbiotic
energy fuel exchange in cancer cells, Radiother. Oncol. 92 (2009) 329–33.
[53] N.P. Jones, A. Schulze, Targeting cancer metabolism--aiming at a tumour’s
sweet-spot, Drug Discov. Today 17 (2012) 232–41.
[54] Y. Kekec, S. Paydas, A. Tuli, S. Zorludemir, G. Sakman, G. Seydaoglu,
Antioxidant enzyme levels in cases with gastrointesinal cancer, Eur. J. Intern. Med. 20
(2009) 403–6.
[55] S. Langbein, W.M. Frederiks, A. zur Hausen, J. Popa, J. Lehmann, C. Weiss, P.
Alken, J.F. Coy, Metastasis is promoted by a bioenergetic switch: new targets for
progressive renal cell cancer, Int. J. Cancer 122 (2008) 2422–8.
General introduction
35
[56] P. Jiang, W. Du, X. Wang, A. Mancuso, X. Gao, M. Wu, and X. Yang, p53
regulates biosynthesis through direct inactivation of glucose-6-phosphate
dehydrogenase, Nat. Cell. Biol. 13 (2011) 310–316.
[57] L. Shen, X. Sun, Z. Fu, G. Yang, J. Li, L. Yao, The fundamental role of the p53
pathway in tumor metabolism and its implication in tumor therapy, Clin. Cancer Res. 18
(2012) 1561–7.
[58] K. Bensaad, A. Tsuruta, M.A. Selak, M.N. C. Vidal, K. Nakano, R. Bartrons, E.
Gottlieb, K.H. Vousden, TIGAR, a p53-inducible regulator of glycolysis and apoptosis,
Cell, 126 (2006) 107–20.
[59] L. Mitschke, C. Parthier, K. Schröder-Tittmann, J. Coy, S. Lüdtke, K. Tittmann,
The crystal structure of human transketolase and new insights into its mode of action, J.
Biol. Chem. 285 (2010) 31559–70.
[60] N.M. Lapsys, E. Baker, D.F. Callen, G.R. Sutherland, M. Abedinia, P.F. Nixon,
J.S. Mattick, Chromosomal location of the human transketolase gene, Cytogenet. Cell.
Genet. 61 (1992) 274–275.
[61] G. Schneider, Y. Lindqvist, Crystallography and mutagenesis of transketolase:
mechanistic implications for enzymatic thiamin catalysis, Biochim. Biophys. Acta 1385
(1998) 387–98.
[62] L. Pácal, J. Tomandl, J. Svojanovsky, D. Krusová, S. Stepánková, J. Rehorová,
J. Olsovsky, J. Belobrádková, V. Tanhäuserová, M. Tomandlová, J. Muzík, K.
Kanková, Role of thiamine status and genetic variability in transketolase and other
pentose phosphate cycle enzymes in the progression of diabetic nephropathy, Nephrol.
Dial. Transplant. 26 (2011) 1229–36.
[63] J.F. Coy, S. Dübel, P. Kioschis, K. Thomas, G. Micklem, H. Delius, A. Poustka,
Molecular cloning of tissue-specific transcripts of a transketolase-related gene:
implications for the evolution of new vertebrate genes, Genomics 32 (1996) 309–16.
[64] A. Ramos-Montoya, W.N. Lee, S. Bassilian, S. Lim, R.V. Trebukhina, M.V
Kazhyna, C.J. Ciudad, V. Noé, J.J. Centelles, and M. Cascante, Pentose phosphate cycle
oxidative and nonoxidative balance: A new vulnerable target for overcoming drug
resistance in cancer, Int. J. Cancer 119 (2006) 2733–41.
[65] S. Zhang, J.H. Yang, C.K. Guo, P.C. Cai, Gene silencing of TKTL1 by RNAi
inhibits cell proliferation in human hepatoma cells, Cancer Lett. 253 (2007) 108–14.
[66] L.G. Boros, J. Puigjaner, M. Cascante, W.N. Lee, J.L. Brandes, S. Bassilian, F.
I. Yusuf, R.D. Williams, P. Muscarella, W.S. Melvin, W.J. Schirmer, Oxythiamine and
Dehydroepiandrosterone Inhibit the Nonoxidative Synthesis of Ribose and Tumor Cell
Proliferation, Cancer Res. 57 (1997) 4242–4248.
[67] S. Biton, I. Dar, L. Mittelman, Y. Pereg, A. Barzilai, Y. Shiloh, Nuclear ataxia-
telangiectasia mutated (ATM) mediates the cellular response to DNA double strand
breaks in human neuron-like cells, J. Biol. Chem. 281 (2006) 17482–91.
Chapter 2
36
[68] C. Cosentino, D. Grieco, V. Costanzo, ATM activates the pentose phosphate
pathway promoting anti-oxidant defence and DNA repair, EMBO J. 30 (2011) 546–55.
[69] J.H. Lee, T.T. Paull, Activation and regulation of ATM kinase activity in
response to DNA double-strand breaks, Oncogene 26 (2007) 7741–8.
[70] M. Raman, S. Earnest, K. Zhang, Y. Zhao, M.H. Cobb, TAO kinases mediate
activation of p38 in response to DNA damage, EMBO J. 26 (2007) 2005–14.
CHAPTER 3
Gas-Chromatography (GC) analysis of sugars and polyols:
optimization of a GC-FID and a GC-MS method

GC analysis of sugars and polyols: optimization of a GC-FID and a GC-MS method
39
1. Introduction
Sugars’ and polyols’ profiling in biological samples, such as urine, plasma and
CSF, has become an invaluable tool in the assessment of the recently described
diseases, RPI and TALDO deficiency, which affect the PPP. Intermediate sugars’ and
polyols’ pattern found in patients carrying these diseases seem to be pathognomonic or,
at least, highly predictive of the type of blockage in the PPP. Furthermore, the role of
the PPP in several pathologies, such as liver and cancer diseases, has become very
recently, subject of intensive study and the intermediate sugars and polyols of the PPP
started to be regarded as possible predictive biomarkers of the referred pathologies or,
even, of their progress. Assessment to those metabolites is not part of the general
metabolic screening.
The analysis of those metabolites has been addressed by specific analytical
chromatographic methods such as: HPLC, GC-FID, GC-MS and more recently by
LC/MS or LC-MS/MS. The qualitative and quantitative analysis of those metabolites
can be quite complicated due the similarity of compounds structure, weight and charge
and also due to the huge difference, often seen, among metabolites’ concentration in the
same sample [1]. The optimization of the pre-analytical and analytical conditions is
crucial for the precision of the qualitative and quantitative analysis.
We were interested in setting-up a method able to analyze simultaneously sugars
and polyols allowing, in a single run, an informative profile of the PPP intermediate
metabolites. Therefore, a GC-FID method was developed based on the previous method
published by Jansen and co-workers [1]. Minor modifications were introduced and all
the analytical process was validated after the optimization of the analytical conditions.
Moreover, the analysis by GC-MS was also accomplished having in mind the possibility
of its input on the qualitative analysis. Furthermore, laboratory reference values for
adult urinary sugars and polyols were established.
Chapter 3
40
2. Material
2.1. Standards
The monosaccharides – Arabinose, Ribose, Xylose, Glucose, Galactose,
Fructose and Fucose –, the disaccharides – Lactose, Maltose, Sucrose, Cellobiose and
Melibiose –, the polyols – Threitol, Erythritol, Xylitol, Ribitol, Myo-inositol and
Mannitol – as well as the internal standards (IS) – Mannoheptulose (IS-1) and Trehalose
(IS-3) – were obtained from Sigma-Aldrich Co (St. Louis, MO USA). Perseitol (IS-2)
was kindly supplied by Dr. Mirjam Wamelink from VU University Medical Center,
Amsterdam, The Netherlands. Sugars’ and polyols’ main features are summarized in
Table 1.
2.2. Reagents
The derivatization reagent Trimethylsilyl N-trimethylsilylacetamidate in
chlorotrimethylsilane (BSA + TMCS + TMSI, 3:2:3), also known as Tri-Sil-TBT, and
n-hexane CHROMASOLV® for HPLC were purchased from Sigma-Aldrich Co (St.
Louis, MO USA). Hydrochloric acid fuming 37%, methanol p.a. and butanol p.a. were
obtained from Merck Darmstadt, FRG.
2.3 - Biological Samples
2.3.1. Controls
2.3.1.1. Urine samples
For the assessment of control sugars’ and polyols’ chromatographic profiles and
reference values, a random urine sample from 16 volunteers (9 female, 7 male; ages 23-
50 yrs), healthy adults, all members of laboratory`s staff, was collected in the same day.
All the samples were well homogenized and a pool was built by the mixture of equal
volume of each urine sample. The created pool was divided in 1.5 mL aliquots,
immediately frozen and kept at -20 ºC until analysis.
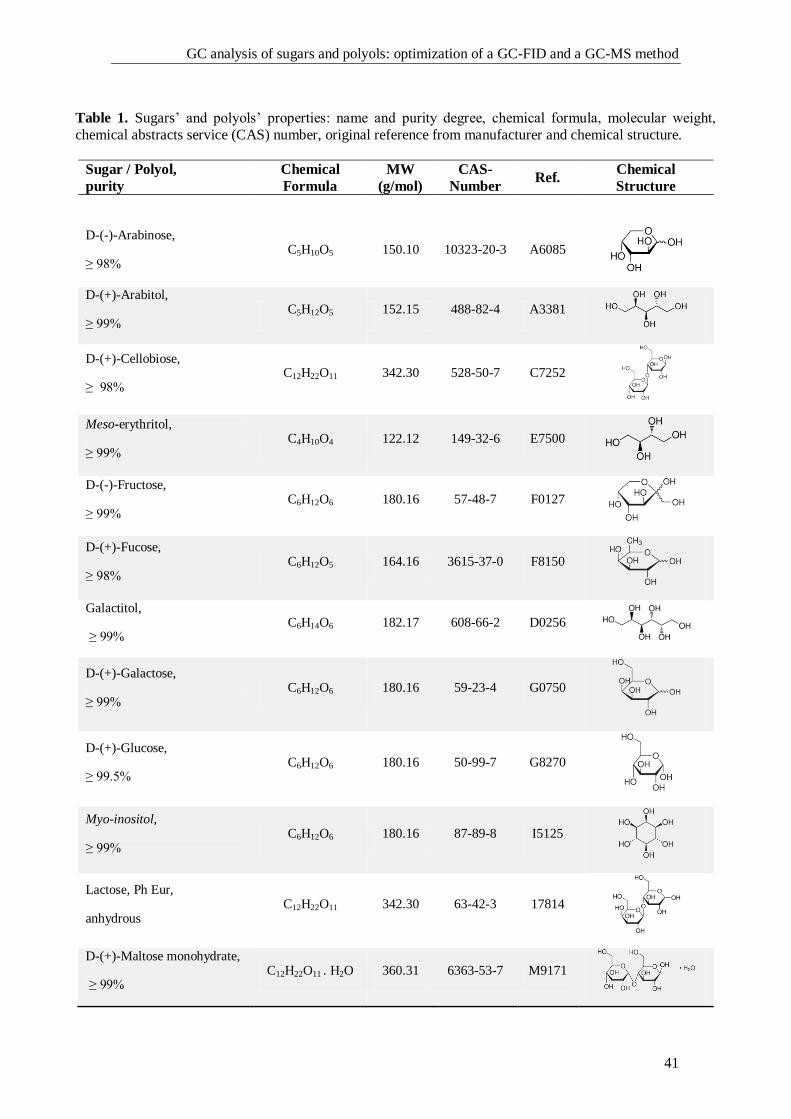
GC analysis of sugars and polyols: optimization of a GC-FID and a GC-MS method
41
Table 1. Sugars’ and polyols’ properties: name and purity degree, chemical formula, molecular weight,
chemical abstracts service (CAS) number, original reference from manufacturer and chemical structure.
Sugar / Polyol,
purity
Chemical
Formula
MW
(g/mol)
CAS-
Number Ref.
Chemical
Structure
D-(-)-Arabinose,
≥ 98% C5H10O5 150.10 10323-20-3 A6085
D-(+)-Arabitol,
≥ 99% C5H12O5 152.15 488-82-4 A3381
D-(+)-Cellobiose,
≥ 98% C12H22O11 342.30 528-50-7 C7252
Meso-erythritol,
≥ 99% C4H10O4 122.12 149-32-6 E7500
D-(-)-Fructose,
≥ 99% C6H12O6 180.16 57-48-7 F0127
D-(+)-Fucose,
≥ 98% C6H12O5 164.16 3615-37-0 F8150
Galactitol,
≥ 99% C6H14O6 182.17 608-66-2 D0256
D-(+)-Galactose,
≥ 99% C6H12O6 180.16 59-23-4 G0750
D-(+)-Glucose,
≥ 99.5% C6H12O6 180.16 50-99-7 G8270
Myo-inositol,
≥ 99% C6H12O6 180.16 87-89-8 I5125
Lactose, Ph Eur,
anhydrous C12H22O11 342.30 63-42-3 17814
D-(+)-Maltose monohydrate,
≥ 99% C12H22O11 . H2O 360.31 6363-53-7 M9171
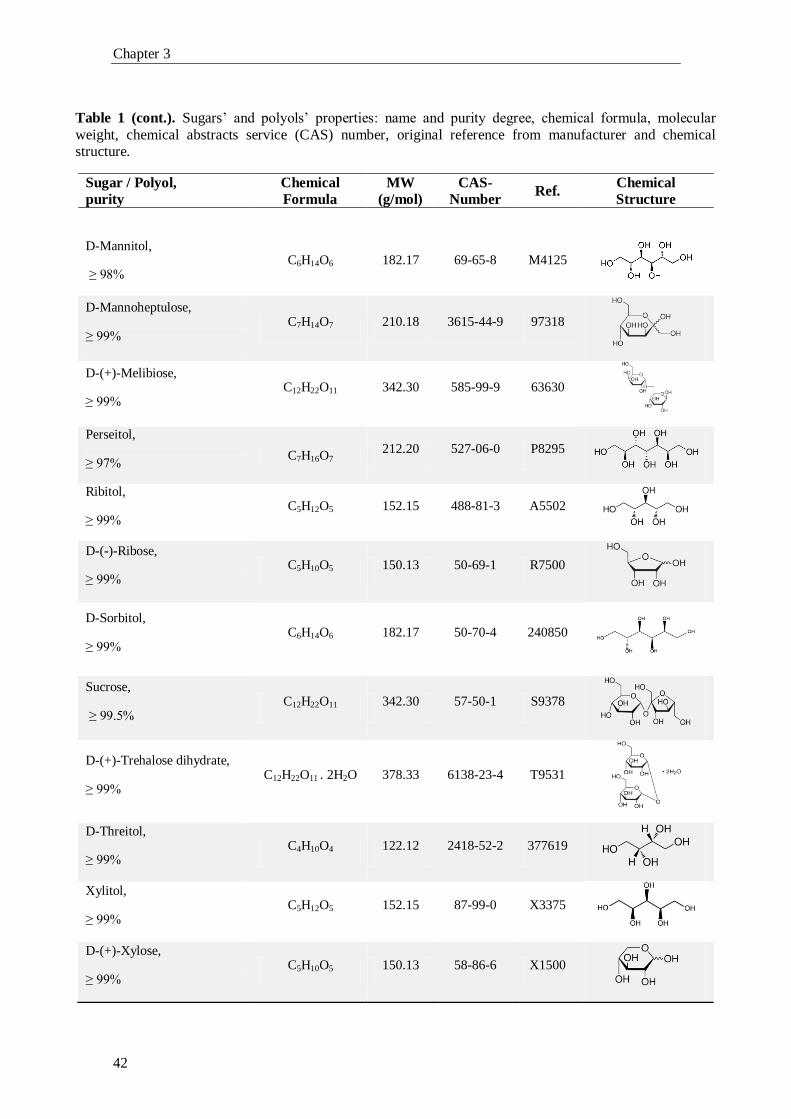
Chapter 3
42
Table 1 (cont.). Sugars’ and polyols’ properties: name and purity degree, chemical formula, molecular
weight, chemical abstracts service (CAS) number, original reference from manufacturer and chemical structure.
Sugar / Polyol,
purity
Chemical
Formula
MW
(g/mol)
CAS-
Number Ref.
Chemical
Structure
D-Mannitol,
≥ 98% C6H14O6 182.17 69-65-8 M4125
D-Mannoheptulose,
≥ 99% C7H14O7 210.18 3615-44-9 97318
D-(+)-Melibiose,
≥ 99% C12H22O11 342.30 585-99-9 63630
Perseitol,
≥ 97% C7H16O7
212.20 527-06-0 P8295
Ribitol,
≥ 99% C5H12O5 152.15 488-81-3 A5502
D-(-)-Ribose,
≥ 99% C5H10O5 150.13 50-69-1 R7500
D-Sorbitol,
≥ 99% C6H14O6 182.17 50-70-4 240850
Sucrose,
≥ 99.5% C12H22O11 342.30 57-50-1 S9378
D-(+)-Trehalose dihydrate,
≥ 99% C12H22O11 . 2H2O 378.33 6138-23-4 T9531
D-Threitol,
≥ 99% C4H10O4 122.12 2418-52-2 377619
Xylitol,
≥ 99% C5H12O5 152.15 87-99-0 X3375
D-(+)-Xylose,
≥ 99% C5H10O5 150.13 58-86-6 X1500
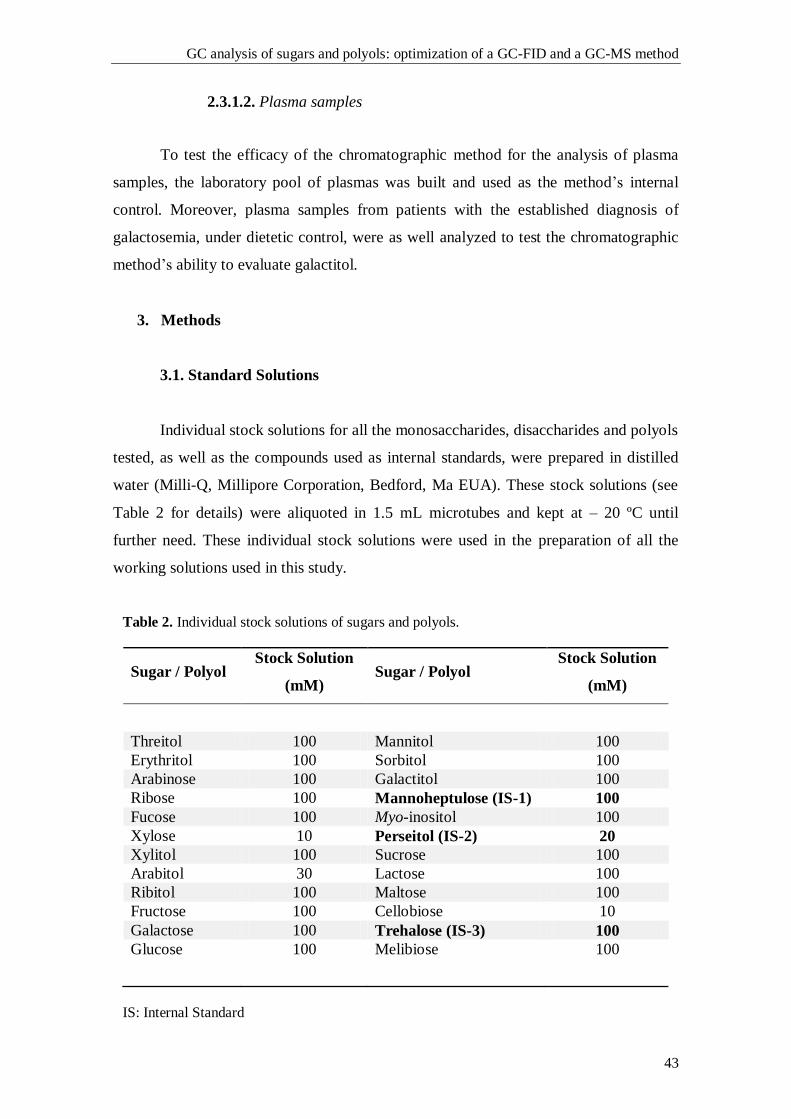
GC analysis of sugars and polyols: optimization of a GC-FID and a GC-MS method
43
2.3.1.2. Plasma samples
To test the efficacy of the chromatographic method for the analysis of plasma
samples, the laboratory pool of plasmas was built and used as the method’s internal
control. Moreover, plasma samples from patients with the established diagnosis of
galactosemia, under dietetic control, were as well analyzed to test the chromatographic
method’s ability to evaluate galactitol.
3. Methods
3.1. Standard Solutions
Individual stock solutions for all the monosaccharides, disaccharides and polyols
tested, as well as the compounds used as internal standards, were prepared in distilled
water (Milli-Q, Millipore Corporation, Bedford, Ma EUA). These stock solutions (see
Table 2 for details) were aliquoted in 1.5 mL microtubes and kept at – 20 ºC until
further need. These individual stock solutions were used in the preparation of all the
working solutions used in this study.
Table 2. Individual stock solutions of sugars and polyols.
Sugar / Polyol Stock Solution
(mM) Sugar / Polyol
Stock Solution
(mM)
Threitol 100 Mannitol 100
Erythritol 100 Sorbitol 100
Arabinose 100 Galactitol 100
Ribose 100 Mannoheptulose (IS-1) 100
Fucose 100 Myo-inositol 100
Xylose 10 Perseitol (IS-2) 20
Xylitol 100 Sucrose 100
Arabitol 30 Lactose 100
Ribitol 100 Maltose 100
Fructose 100 Cellobiose 10
Galactose 100 Trehalose (IS-3) 100
Glucose 100 Melibiose 100
IS: Internal Standard
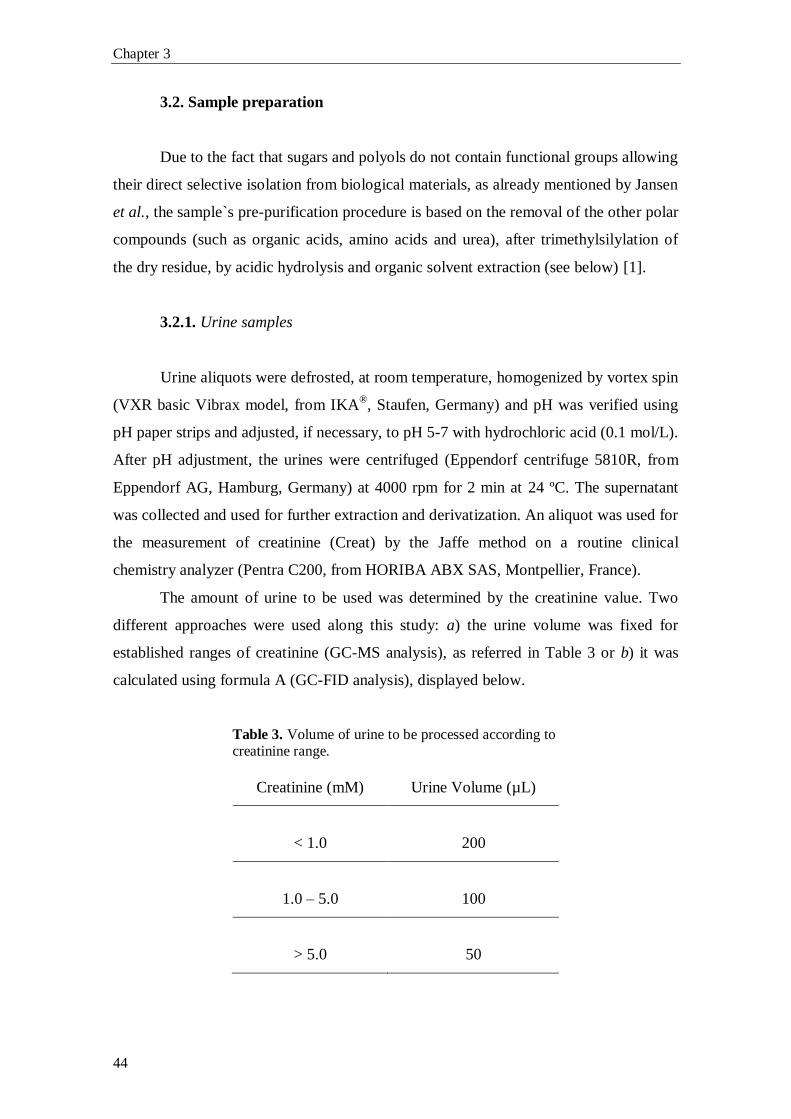
Chapter 3
44
3.2. Sample preparation
Due to the fact that sugars and polyols do not contain functional groups allowing
their direct selective isolation from biological materials, as already mentioned by Jansen
et al., the sample`s pre-purification procedure is based on the removal of the other polar
compounds (such as organic acids, amino acids and urea), after trimethylsilylation of
the dry residue, by acidic hydrolysis and organic solvent extraction (see below) [1].
3.2.1. Urine samples
Urine aliquots were defrosted, at room temperature, homogenized by vortex spin
(VXR basic Vibrax model, from IKA®, Staufen, Germany) and pH was verified using
pH paper strips and adjusted, if necessary, to pH 5-7 with hydrochloric acid (0.1 mol/L).
After pH adjustment, the urines were centrifuged (Eppendorf centrifuge 5810R, from
Eppendorf AG, Hamburg, Germany) at 4000 rpm for 2 min at 24 ºC. The supernatant
was collected and used for further extraction and derivatization. An aliquot was used for
the measurement of creatinine (Creat) by the Jaffe method on a routine clinical
chemistry analyzer (Pentra C200, from HORIBA ABX SAS, Montpellier, France).
The amount of urine to be used was determined by the creatinine value. Two
different approaches were used along this study: a) the urine volume was fixed for
established ranges of creatinine (GC-MS analysis), as referred in Table 3 or b) it was
calculated using formula A (GC-FID analysis), displayed below.
Table 3. Volume of urine to be processed according to creatinine range.
Creatinine (mM) Urine Volume (µL)
< 1.0
200
1.0 – 5.0 100
> 5.0
50
GC analysis of sugars and polyols: optimization of a GC-FID and a GC-MS method
45
Formula A:
V = 1 / (X*Creat)
V = volume of urine; X = 2, when Creat is lower than 1 mmol/L; the age of the
individual is between 0-3 months and/or the individual displays a severe presence of
oligosaccharides through the strip test; X = 1, in the absence of all the previous
conditions. The maximum volume of urine that can be used is 500 µL.
The urine sample, which volume was calculated as described, was then
supplemented with 100 µL of a mixture of the internal standards (IS-1, IS-2 and IS-3, at
200 µM, 200 µM and 100 µM, respectively). The sample was then evaporated, at 60 ºC,
under a gentle stream of nitrogen, to dryness. For further information see protocol in
Annex 1.
3.2.2. Blood samples
Blood samples, were collected in the presence of an anticoagulant agent (EDTA
or Heparin). The plasma was separated by centrifugation for 10 min at 2000 rpm at
room temperature. Plasma (500 µL) was supplemented with 100 µL of the IS mixture
solution and it was deproteinized through the addition of 2 mL of methanol, left for
30 min at -20 ºC. After centrifugation (3000 rpm for 10 min, at 24 ºC) the supernatant
was transferred to a glass vial and extracted with 4 mL of hexane. After centrifugation
(3000 rpm for 2 min, at 24 ºC) the methanol layer was evaporated to dryness as
previously described. See Annex 2 for protocol.
3.2.3. Calibrators
The calibrators were included in each batch of samples. They were prepared at a
final concentration of 125 µM and 250 µM, from the individual stock solutions
previously prepared (see Table 2 for details), aliquoted and kept at -20 ºC. For analysis,
the aliquots were defrosted and to 100 µL of each working solution 100 µL of the IS
mixture solution was added. The dry residue was obtained as described above.
Chapter 3
46
3.2.4. Derivatization: sugars and polyols trimethylsilylether derivatives
The selective isolation of sugars and polyols from a biological matrix is quite
difficult and time consuming. The biological samples pre-purification was achieved
taking into consideration the stability of the sugars and polyols trimethylsilylether
derivatives towards hydrolysis. The trimethylsilylation of the dried residues followed by
reaction with aqueous hydrochloric acid solution leads to the hydrolysis of the formed
trimethylesters and trimethylsilylated amines which are no further extractable by the
organic solvent. Therefore, we follow the derivatization method described by Jansen et
al.. To the obtained dry residue (urine, plasma or aqueous working solutions) the
derivatization reagent, Tri-sil-TBT (300 µL), was added, vigorously shaken and
incubated at 100 ºC for 30 min. After cooling to room temperature, 1 mL of water
(milli-Q) was added, vigorously shaken, followed by 1 mL of hexane, shaken for 2 min
in the vortex, and then centrifuged for 2 min at 4000 rpm. The hexane layer was
collected and washed with 1 mL of 0.1 mol/L hydrochloric acid aqueous solution. After
centrifugation, at 4000 rpm for 2 min, the hexane layer was collected, transferred to a
glass vial and a drop of bis(trimethylsilyl)trifluoroacetamide (BSTFA) was added to
assure that the anomeric hydroxyl group of our compounds is trimethylsilylated. The
hexane layer was then dried, at room temperature, under a gentle stream of nitrogen.
The dry residue was re-dissolved with 100 µL of hexane. The vials were capped and
stored at 4 ºC, until further analysis. See Annex 3 for protocol.
3.3. High Performance Gas Chromatography (GC)
3.3.1. Gas chromatography-flame ionization detector (GC-FID) system
Gas chromatography was performed using an Agilent Technologies’ 7890A
model, equipped with an autosampler G4513A model (also from Agilent Technologies)
and interfaced with an Agilent ChemStation data system.
The column used was a CP SIL 5 CB, 25 m x 0.25 mm (I.D.) x 0.39 mm (UD),
df = 0.12 µm, (Agilent Technologies), which is a fused-silica capillary column,
containing 100 % dimethylpolysiloxane phase. Gas flow rate (helium) was 0.5 mL/min
and detector and injector temperatures were 300 ºC and 275 ºC, respectively. The oven
program was as follow: start point temperature 110 ºC, increased by 1.5 ºC/min to
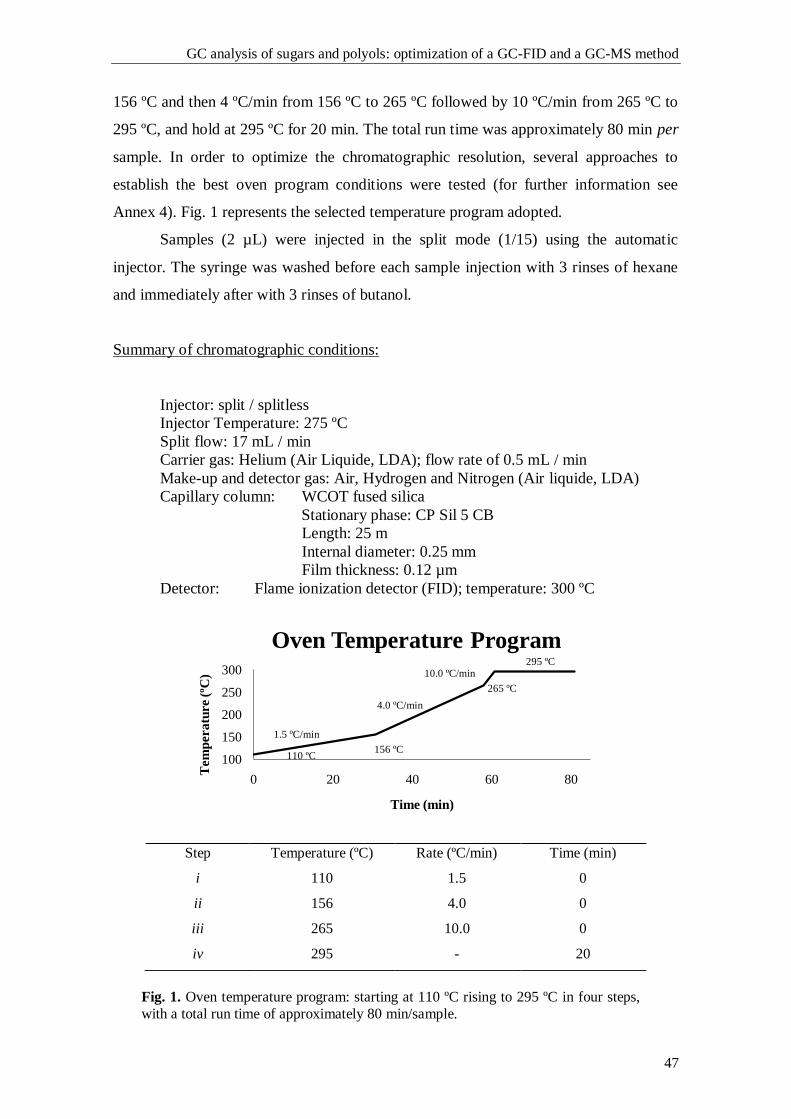
GC analysis of sugars and polyols: optimization of a GC-FID and a GC-MS method
47
156 ºC and then 4 ºC/min from 156 ºC to 265 ºC followed by 10 ºC/min from 265 ºC to
295 ºC, and hold at 295 ºC for 20 min. The total run time was approximately 80 min per
sample. In order to optimize the chromatographic resolution, several approaches to
establish the best oven program conditions were tested (for further information see
Annex 4). Fig. 1 represents the selected temperature program adopted.
Samples (2 µL) were injected in the split mode (1/15) using the automatic
injector. The syringe was washed before each sample injection with 3 rinses of hexane
and immediately after with 3 rinses of butanol.
Summary of chromatographic conditions:
Injector: split / splitless
Injector Temperature: 275 ºC
Split flow: 17 mL / min
Carrier gas: Helium (Air Liquide, LDA); flow rate of 0.5 mL / min
Make-up and detector gas: Air, Hydrogen and Nitrogen (Air liquide, LDA)
Capillary column: WCOT fused silica
Stationary phase: CP Sil 5 CB
Length: 25 m
Internal diameter: 0.25 mm
Film thickness: 0.12 µm
Detector: Flame ionization detector (FID); temperature: 300 ºC
Fig. 1. Oven temperature program: starting at 110 ºC rising to 295 ºC in four steps,
with a total run time of approximately 80 min/sample.
100
150
200
250
300
0 20 40 60 80
Tem
pera
ture (
ºC)
Time (min)
Oven Temperature Program
Step Temperature (ºC) Rate (ºC/min) Time (min)
i 110 1.5 0
ii 156 4.0 0
iii 265 10.0 0
iv 295 - 20
4.0 ºC/min
10.0 ºC/min
1.5 ºC/min
156 ºC 110 ºC
265 ºC
295 ºC
Chapter 3
48
3.3.2. Gas chromatography-mass spectrometry (GC-MS) system
Gas chromatography with mass spectrometry detection was performed using a
GC-2010 model, equipped with an autosampler AOC-20i model (both from Shimadzu
Co, Japan) and interfaced with a GC-MS solution 2.53 data system, from Lab.
Solutions, Shimadzu Co, Japan.
The column used was a CP SIL 19 CB, 25 m x 0.25 mm (I.D.), df = 0.2 µm
(Agilent Technologies), which is a fused-silica capillary column bonded with 14%
cyanopropyl-phenyl / 86% dimethylpolysiloxane. Gas flow rate (helium) was kept at
0.6 mL/min and the split ratio was 1:15. The mass spectrometer parameters were as
follows: source temperature, 250 ºC; collision energy, 70 eV and injector temperature,
275 ºC. The oven program used was the one previously established for the GC-FID
system (see Fig. 1).
The sample volume injected was 0.5 µL and the syringe cleaning program was
the same as described above for the GC-FID system (see 3.3.1).
Summary of chromatographic conditions:
Injector: split / splitless
Injector Temperature: 275ºC
Purge flow: 3.0 mL / min
Split ratio: 1:15
Carrier gas: Helium (flow rate: 0.6 mL / min) (Air liquide, LDA)
Capillary column: WCOT fused silica
Stationary phase: CP Sil 19 CB
Length: 25 m
Internal diameter: 0.25 mm
Film thickness: 0.2 µm
Mass spectrometer parameters:
Ion Source Temperature: 250 ºC
Interface Temperature: 230 ºC
Ionization energy: 70 eV
Acquisition mode: Scan
Event time: 0.5 sec
Start m/z: 40.00
End m/z: 700.00
GC analysis of sugars and polyols: optimization of a GC-FID and a GC-MS method
49
4. Results
4.1. Qualitative analysis
4.1.1. GC-FID Profiles
A representative GC-FID profile of the 21 sugars and polyols, as
trimethylsilylether derivatives, of an aqueous standard solution, obtained under the
adopted chromatographic conditions is shown in Fig. 2. All tested compounds are well
separated, displaying a base line resolution, except xylose (peak 1) and fucose (peak 2)
which co-elute. Different oven temperature programs as well as mobile phase flow rates
were tested (see Annex 4). In spite of all the modifications, the resolution between
xylose (peak 1) and fucose (peak 2) was not improved. Therefore the previous
chromatographic conditions based on the work of Jansen et al., with some modifications
(see Fig. 1), were the ones adopted along this work.
4.1.2. Retention Time (RT) and Relative Retention Time (RRT)
Taking into consideration that the majority of the trimethylsilyl-sugars give rise
to a second derivative peak (peak 2), it is of the upmost importance that each laboratory,
under the adopted working conditions, establish their proper list of retention time (RT)
for the tested compounds. RT and relative retention time (RRT) of pure compounds are
crucial chromatographic parameters for the subsequent qualitative analysis of unknown
samples. RT is a characteristic of each compound, under given chromatographic
conditions, therefore being the fingerprint of the compound.
Due to the complexity of the chromatographic profile, a total of 33 peaks (peak 1
plus peak 2 in most sugars) corresponding to 24 distinct sugars and polyols were
analyzed. Different standard working solutions were prepared containing all selected
sugars and/or polyols, at a final concentration of 125 µM. The carbohydrates in each
working solution were selected in order to avoid chromatographic co-elution. This
precaution allowed the correct identification of the analytes and their corresponding RT.
The composition of each standard solution is displayed in Table 4.
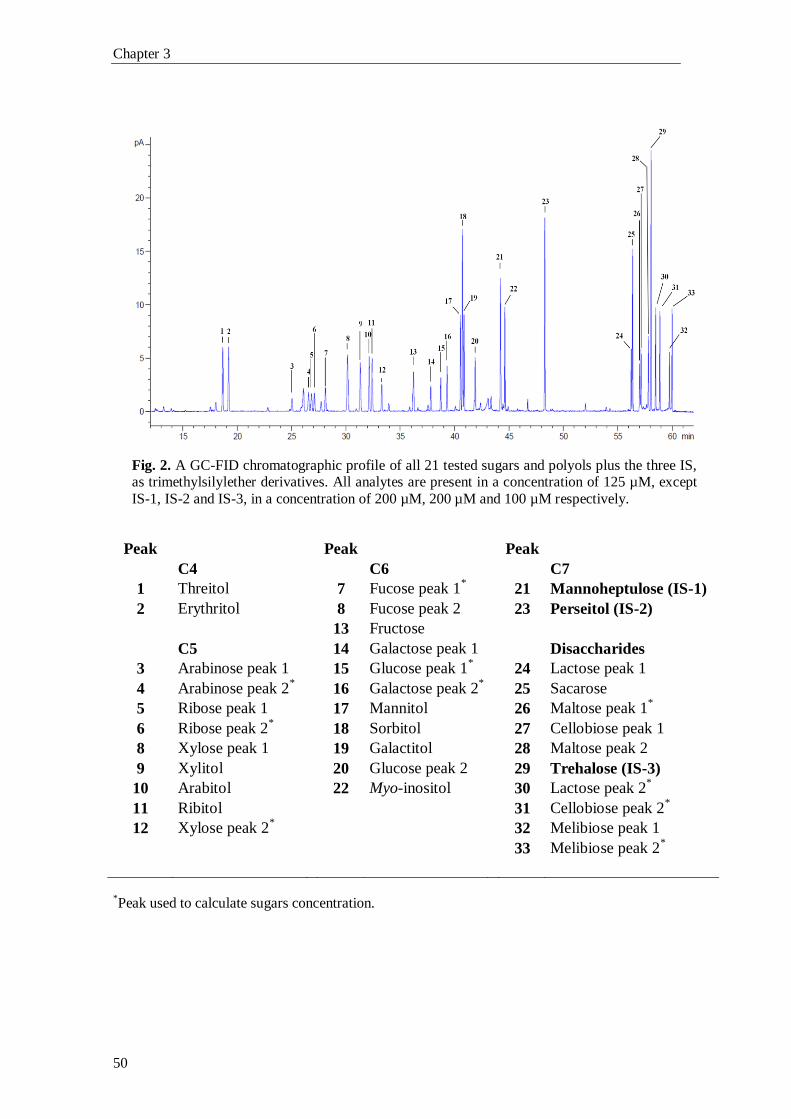
Chapter 3
50
Fig. 2. A GC-FID chromatographic profile of all 21 tested sugars and polyols plus the three IS, as trimethylsilylether derivatives. All analytes are present in a concentration of 125 µM, except
IS-1, IS-2 and IS-3, in a concentration of 200 µM, 200 µM and 100 µM respectively.
Peak Peak Peak
C4 C6 C7
1 Threitol 7 Fucose peak 1* 21 Mannoheptulose (IS-1)
2 Erythritol 8 Fucose peak 2 23 Perseitol (IS-2)
13 Fructose
C5 14 Galactose peak 1 Disaccharides
3 Arabinose peak 1 15 Glucose peak 1* 24 Lactose peak 1
4 Arabinose peak 2* 16 Galactose peak 2
* 25 Sacarose
5 Ribose peak 1 17 Mannitol 26 Maltose peak 1*
6 Ribose peak 2* 18 Sorbitol 27 Cellobiose peak 1
8 Xylose peak 1 19 Galactitol 28 Maltose peak 2
9 Xylitol 20 Glucose peak 2 29 Trehalose (IS-3)
10 Arabitol 22 Myo-inositol 30 Lactose peak 2*
11 Ribitol 31 Cellobiose peak 2*
12 Xylose peak 2* 32 Melibiose peak 1
33 Melibiose peak 2*
*Peak used to calculate sugars concentration.
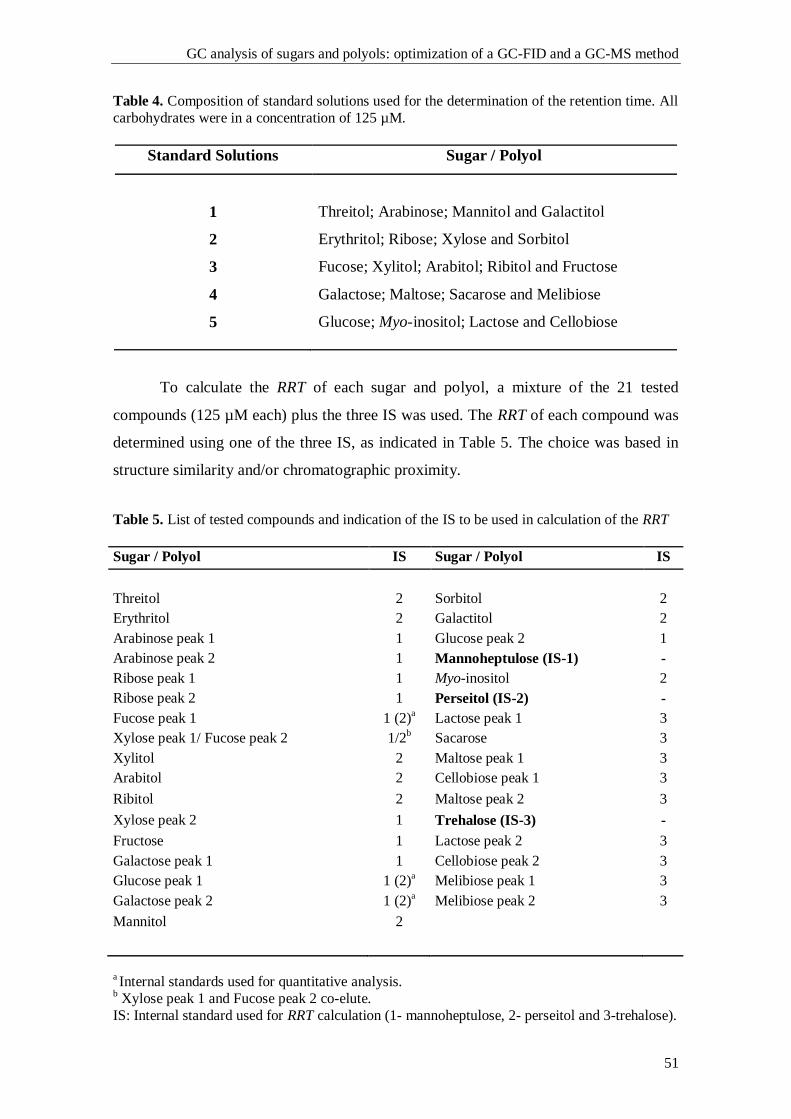
GC analysis of sugars and polyols: optimization of a GC-FID and a GC-MS method
51
Table 4. Composition of standard solutions used for the determination of the retention time. All
carbohydrates were in a concentration of 125 µM.
Standard Solutions Sugar / Polyol
1 Threitol; Arabinose; Mannitol and Galactitol
2 Erythritol; Ribose; Xylose and Sorbitol
3 Fucose; Xylitol; Arabitol; Ribitol and Fructose
4 Galactose; Maltose; Sacarose and Melibiose
5
Glucose; Myo-inositol; Lactose and Cellobiose
To calculate the RRT of each sugar and polyol, a mixture of the 21 tested
compounds (125 µM each) plus the three IS was used. The RRT of each compound was
determined using one of the three IS, as indicated in Table 5. The choice was based in
structure similarity and/or chromatographic proximity.
Table 5. List of tested compounds and indication of the IS to be used in calculation of the RRT
Sugar / Polyol IS Sugar / Polyol IS
Threitol 2 Sorbitol 2
Erythritol 2 Galactitol 2
Arabinose peak 1 1 Glucose peak 2 1
Arabinose peak 2 1 Mannoheptulose (IS-1) -
Ribose peak 1 1 Myo-inositol 2
Ribose peak 2 1 Perseitol (IS-2) -
Fucose peak 1 1 (2)a Lactose peak 1 3
Xylose peak 1/ Fucose peak 2 1/2b Sacarose 3
Xylitol 2 Maltose peak 1 3
Arabitol 2 Cellobiose peak 1 3
Ribitol 2 Maltose peak 2 3
Xylose peak 2 1 Trehalose (IS-3) -
Fructose 1 Lactose peak 2 3
Galactose peak 1 1 Cellobiose peak 2 3
Glucose peak 1 1 (2)a
Melibiose peak 1 3
Galactose peak 2 1 (2)a
Melibiose peak 2 3
Mannitol 2
a Internal standards used for quantitative analysis.
b Xylose peak 1 and Fucose peak 2 co-elute.
IS: Internal standard used for RRT calculation (1- mannoheptulose, 2- perseitol and 3-trehalose).
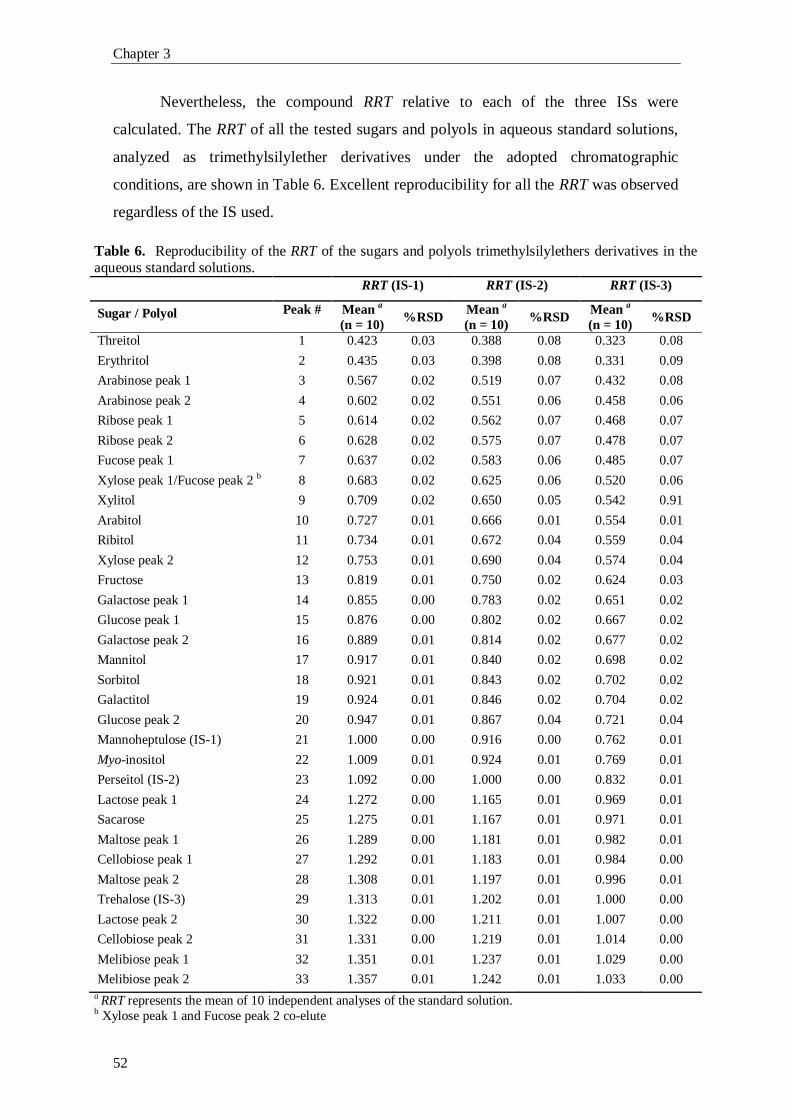
Chapter 3
52
Nevertheless, the compound RRT relative to each of the three ISs were
calculated. The RRT of all the tested sugars and polyols in aqueous standard solutions,
analyzed as trimethylsilylether derivatives under the adopted chromatographic
conditions, are shown in Table 6. Excellent reproducibility for all the RRT was observed
regardless of the IS used.
Table 6. Reproducibility of the RRT of the sugars and polyols trimethylsilylethers derivatives in the aqueous standard solutions.
RRT (IS-1) RRT (IS-2) RRT (IS-3)
Sugar / Polyol Peak # Mean a
(n = 10) %RSD
Mean a
(n = 10) %RSD
Mean a
(n = 10) %RSD
Threitol 1 0.423 0.03 0.388 0.08 0.323 0.08
Erythritol 2 0.435 0.03 0.398 0.08 0.331 0.09
Arabinose peak 1 3 0.567 0.02 0.519 0.07 0.432 0.08
Arabinose peak 2 4 0.602 0.02 0.551 0.06 0.458 0.06
Ribose peak 1 5 0.614 0.02 0.562 0.07 0.468 0.07
Ribose peak 2 6 0.628 0.02 0.575 0.07 0.478 0.07
Fucose peak 1 7 0.637 0.02 0.583 0.06 0.485 0.07
Xylose peak 1/Fucose peak 2 b 8 0.683 0.02 0.625 0.06 0.520 0.06
Xylitol 9 0.709 0.02 0.650 0.05 0.542 0.91
Arabitol 10 0.727 0.01 0.666 0.01 0.554 0.01
Ribitol 11 0.734 0.01 0.672 0.04 0.559 0.04
Xylose peak 2 12 0.753 0.01 0.690 0.04 0.574 0.04
Fructose 13 0.819 0.01 0.750 0.02 0.624 0.03
Galactose peak 1 14 0.855 0.00 0.783 0.02 0.651 0.02
Glucose peak 1 15 0.876 0.00 0.802 0.02 0.667 0.02
Galactose peak 2 16 0.889 0.01 0.814 0.02 0.677 0.02
Mannitol 17 0.917 0.01 0.840 0.02 0.698 0.02
Sorbitol 18 0.921 0.01 0.843 0.02 0.702 0.02
Galactitol 19 0.924 0.01 0.846 0.02 0.704 0.02
Glucose peak 2 20 0.947 0.01 0.867 0.04 0.721 0.04
Mannoheptulose (IS-1) 21 1.000 0.00 0.916 0.00 0.762 0.01
Myo-inositol 22 1.009 0.01 0.924 0.01 0.769 0.01
Perseitol (IS-2) 23 1.092 0.00 1.000 0.00 0.832 0.01
Lactose peak 1 24 1.272 0.00 1.165 0.01 0.969 0.01
Sacarose 25 1.275 0.01 1.167 0.01 0.971 0.01
Maltose peak 1 26 1.289 0.00 1.181 0.01 0.982 0.01
Cellobiose peak 1 27 1.292 0.01 1.183 0.01 0.984 0.00
Maltose peak 2 28 1.308 0.01 1.197 0.01 0.996 0.01
Trehalose (IS-3) 29 1.313 0.01 1.202 0.01 1.000 0.00
Lactose peak 2 30 1.322 0.00 1.211 0.01 1.007 0.00
Cellobiose peak 2 31 1.331 0.00 1.219 0.01 1.014 0.00
Melibiose peak 1 32 1.351 0.01 1.237 0.01 1.029 0.00
Melibiose peak 2 33 1.357 0.01 1.242 0.01 1.033 0.00
a RRT represents the mean of 10 independent analyses of the standard solution. b Xylose peak 1 and Fucose peak 2 co-elute
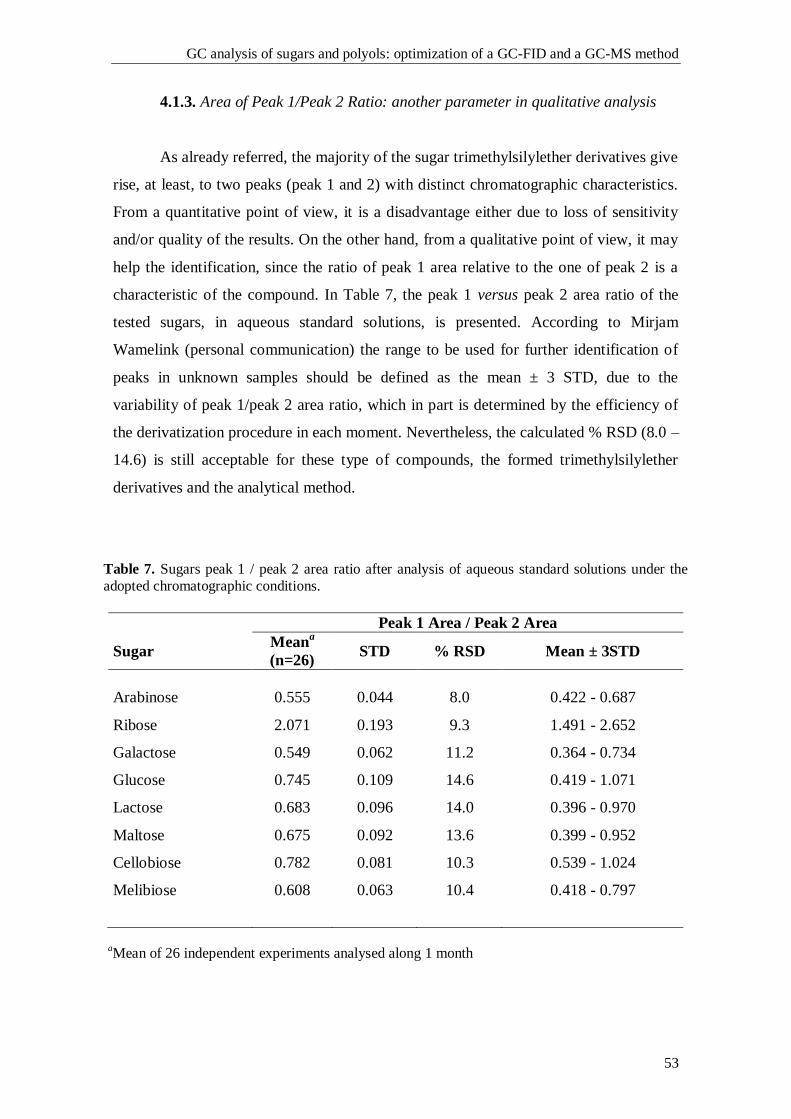
GC analysis of sugars and polyols: optimization of a GC-FID and a GC-MS method
53
4.1.3. Area of Peak 1/Peak 2 Ratio: another parameter in qualitative analysis
As already referred, the majority of the sugar trimethylsilylether derivatives give
rise, at least, to two peaks (peak 1 and 2) with distinct chromatographic characteristics.
From a quantitative point of view, it is a disadvantage either due to loss of sensitivity
and/or quality of the results. On the other hand, from a qualitative point of view, it may
help the identification, since the ratio of peak 1 area relative to the one of peak 2 is a
characteristic of the compound. In Table 7, the peak 1 versus peak 2 area ratio of the
tested sugars, in aqueous standard solutions, is presented. According to Mirjam
Wamelink (personal communication) the range to be used for further identification of
peaks in unknown samples should be defined as the mean ± 3 STD, due to the
variability of peak 1/peak 2 area ratio, which in part is determined by the efficiency of
the derivatization procedure in each moment. Nevertheless, the calculated % RSD (8.0 –
14.6) is still acceptable for these type of compounds, the formed trimethylsilylether
derivatives and the analytical method.
Table 7. Sugars peak 1 / peak 2 area ratio after analysis of aqueous standard solutions under the
adopted chromatographic conditions.
Peak 1 Area / Peak 2 Area
Sugar Mean
a
(n=26) STD % RSD Mean ± 3STD
Arabinose 0.555 0.044 8.0 0.422 - 0.687
Ribose 2.071 0.193 9.3 1.491 - 2.652
Galactose 0.549 0.062 11.2 0.364 - 0.734
Glucose 0.745 0.109 14.6 0.419 - 1.071
Lactose 0.683 0.096 14.0 0.396 - 0.970
Maltose 0.675 0.092 13.6 0.399 - 0.952
Cellobiose 0.782 0.081 10.3 0.539 - 1.024
Melibiose 0.608 0.063 10.4 0.418 - 0.797
aMean of 26 independent experiments analysed along 1 month
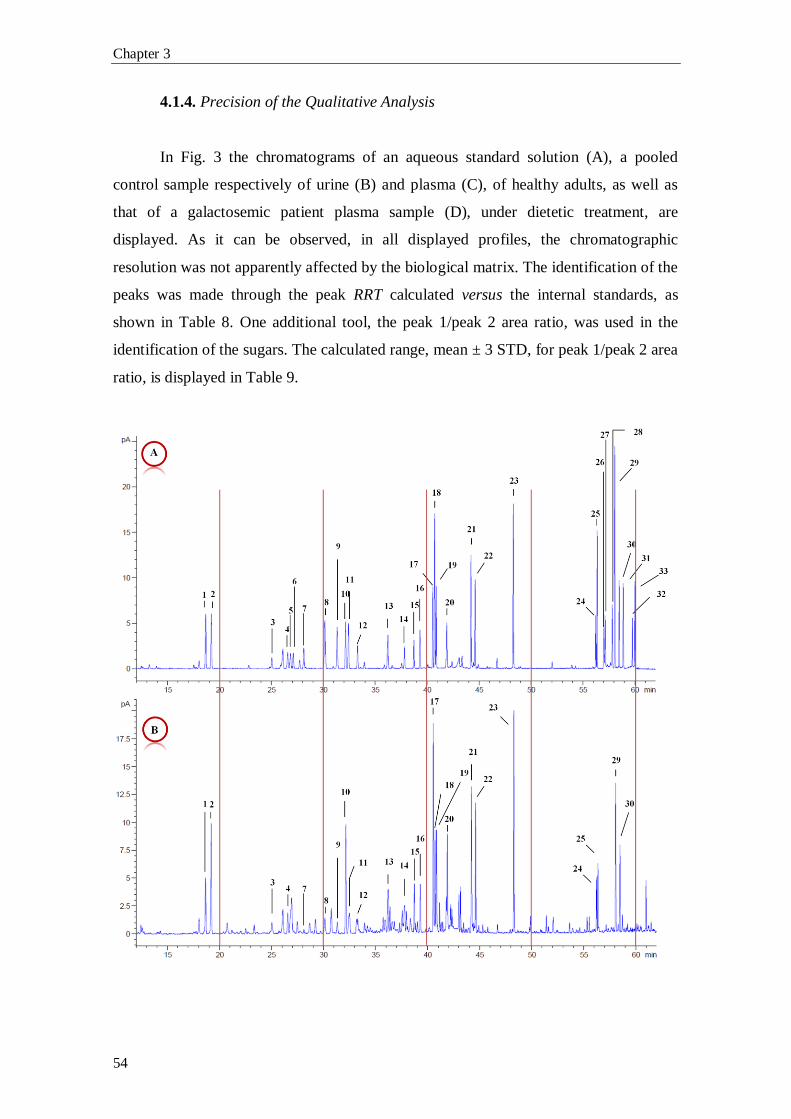
Chapter 3
54
4.1.4. Precision of the Qualitative Analysis
In Fig. 3 the chromatograms of an aqueous standard solution (A), a pooled
control sample respectively of urine (B) and plasma (C), of healthy adults, as well as
that of a galactosemic patient plasma sample (D), under dietetic treatment, are
displayed. As it can be observed, in all displayed profiles, the chromatographic
resolution was not apparently affected by the biological matrix. The identification of the
peaks was made through the peak RRT calculated versus the internal standards, as
shown in Table 8. One additional tool, the peak 1/peak 2 area ratio, was used in the
identification of the sugars. The calculated range, mean ± 3 STD, for peak 1/peak 2 area
ratio, is displayed in Table 9.

GC analysis of sugars and polyols: optimization of a GC-FID and a GC-MS method
55
Fig. 3. Chromatograms of: (A) aqueous standard solution; (B) pooled urine sample of healthy
adults under free diet; (C) pooled plasma sample, used in the lab for the preparation of internal controls and (D) plasma sample of a Galactosemic patient, under diet restriction. The analysis
conditions are the same as shown in Fig. 1. The peak numbers correspond to the ones displayed
in Fig. 2.
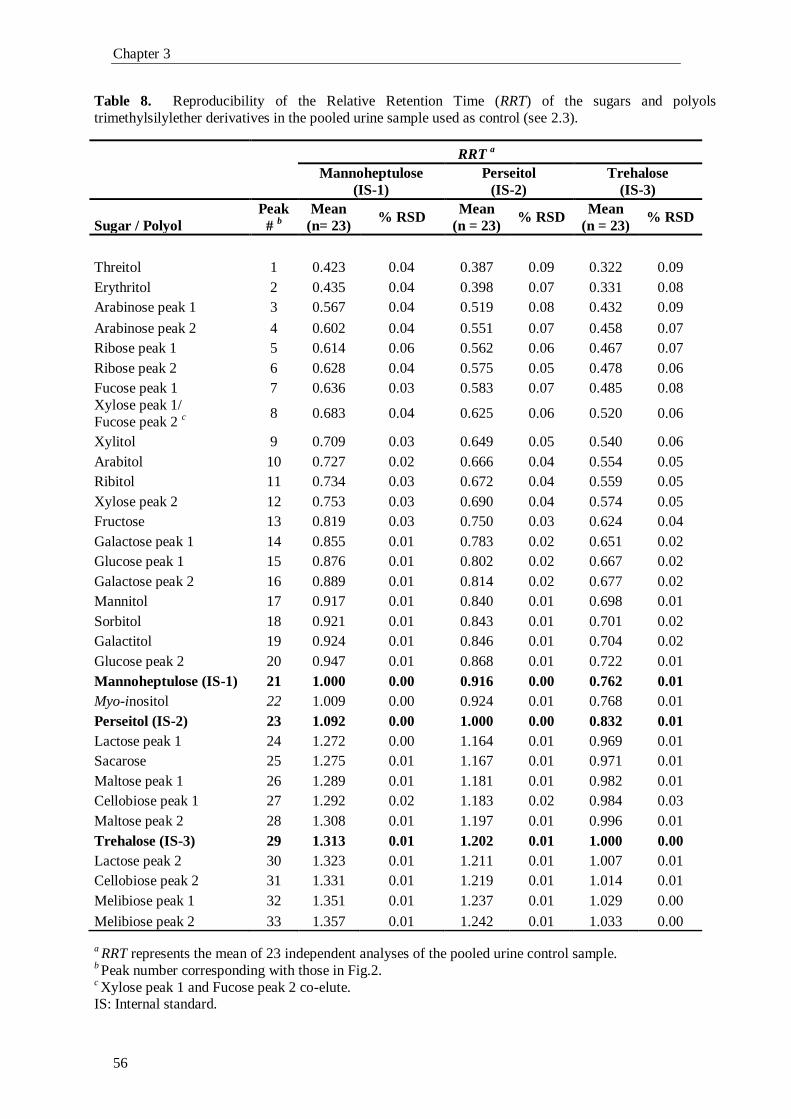
Chapter 3
56
Table 8. Reproducibility of the Relative Retention Time (RRT) of the sugars and polyols
trimethylsilylether derivatives in the pooled urine sample used as control (see 2.3).
RRT a
Mannoheptulose
(IS-1)
Perseitol
(IS-2)
Trehalose
(IS-3)
Sugar / Polyol
Peak
# b
Mean
(n= 23) % RSD
Mean
(n = 23) % RSD
Mean
(n = 23) % RSD
Threitol 1 0.423 0.04 0.387 0.09 0.322 0.09
Erythritol 2 0.435 0.04 0.398 0.07 0.331 0.08
Arabinose peak 1 3 0.567 0.04 0.519 0.08 0.432 0.09
Arabinose peak 2 4 0.602 0.04 0.551 0.07 0.458 0.07
Ribose peak 1 5 0.614 0.06 0.562 0.06 0.467 0.07
Ribose peak 2 6 0.628 0.04 0.575 0.05 0.478 0.06
Fucose peak 1 7 0.636 0.03 0.583 0.07 0.485 0.08
Xylose peak 1/
Fucose peak 2 c
8 0.683 0.04 0.625 0.06 0.520 0.06
Xylitol 9 0.709 0.03 0.649 0.05 0.540 0.06
Arabitol 10 0.727 0.02 0.666 0.04 0.554 0.05
Ribitol 11 0.734 0.03 0.672 0.04 0.559 0.05
Xylose peak 2 12 0.753 0.03 0.690 0.04 0.574 0.05
Fructose 13 0.819 0.03 0.750 0.03 0.624 0.04
Galactose peak 1 14 0.855 0.01 0.783 0.02 0.651 0.02
Glucose peak 1 15 0.876 0.01 0.802 0.02 0.667 0.02
Galactose peak 2 16 0.889 0.01 0.814 0.02 0.677 0.02
Mannitol 17 0.917 0.01 0.840 0.01 0.698 0.01
Sorbitol 18 0.921 0.01 0.843 0.01 0.701 0.02
Galactitol 19 0.924 0.01 0.846 0.01 0.704 0.02
Glucose peak 2 20 0.947 0.01 0.868 0.01 0.722 0.01
Mannoheptulose (IS-1) 21 1.000 0.00 0.916 0.00 0.762 0.01
Myo-inositol 22 1.009 0.00 0.924 0.01 0.768 0.01
Perseitol (IS-2) 23 1.092 0.00 1.000 0.00 0.832 0.01
Lactose peak 1 24 1.272 0.00 1.164 0.01 0.969 0.01
Sacarose 25 1.275 0.01 1.167 0.01 0.971 0.01
Maltose peak 1 26 1.289 0.01 1.181 0.01 0.982 0.01
Cellobiose peak 1 27 1.292 0.02 1.183 0.02 0.984 0.03
Maltose peak 2 28 1.308 0.01 1.197 0.01 0.996 0.01
Trehalose (IS-3) 29 1.313 0.01 1.202 0.01 1.000 0.00
Lactose peak 2 30 1.323 0.01 1.211 0.01 1.007 0.01
Cellobiose peak 2 31 1.331 0.01 1.219 0.01 1.014 0.01
Melibiose peak 1 32 1.351 0.01 1.237 0.01 1.029 0.00
Melibiose peak 2 33 1.357 0.01 1.242 0.01 1.033 0.00
a RRT represents the mean of 23 independent analyses of the pooled urine control sample.
b Peak number corresponding with those in Fig.2.
c Xylose peak 1 and Fucose peak 2 co-elute.
IS: Internal standard.
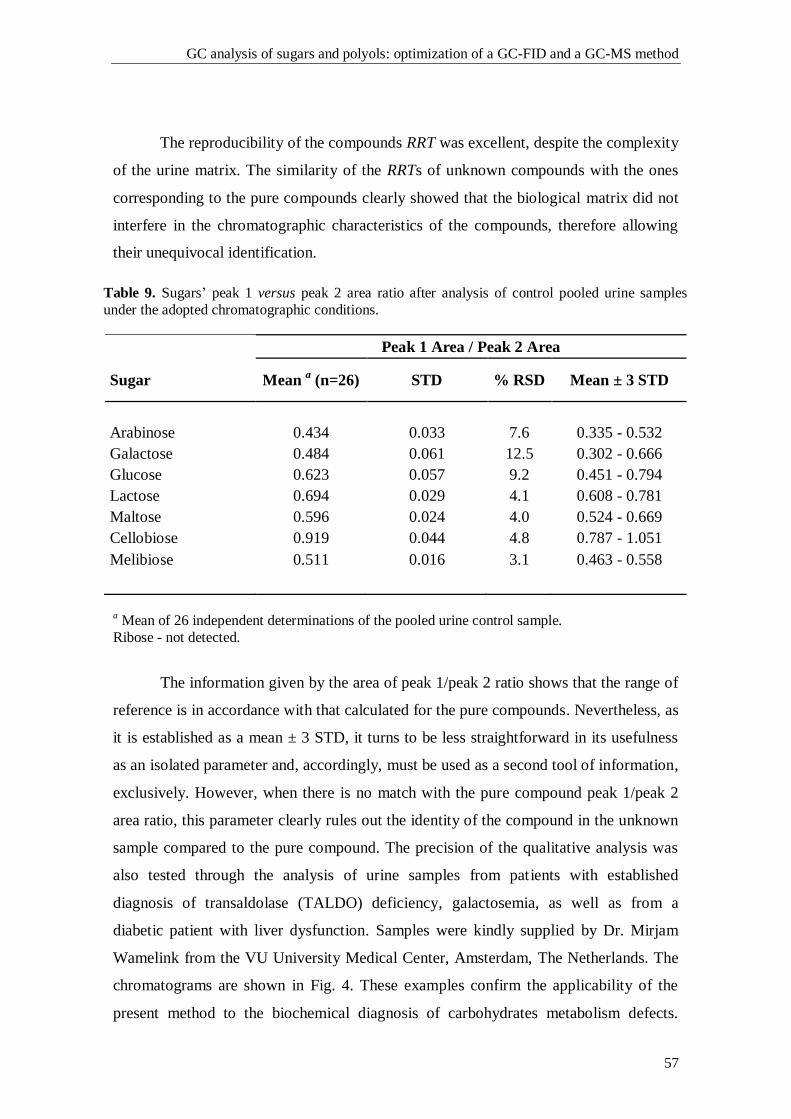
GC analysis of sugars and polyols: optimization of a GC-FID and a GC-MS method
57
The reproducibility of the compounds RRT was excellent, despite the complexity
of the urine matrix. The similarity of the RRTs of unknown compounds with the ones
corresponding to the pure compounds clearly showed that the biological matrix did not
interfere in the chromatographic characteristics of the compounds, therefore allowing
their unequivocal identification.
Table 9. Sugars’ peak 1 versus peak 2 area ratio after analysis of control pooled urine samples
under the adopted chromatographic conditions.
Peak 1 Area / Peak 2 Area
Sugar Mean a (n=26) STD % RSD Mean ± 3 STD
Arabinose 0.434 0.033 7.6 0.335 - 0.532
Galactose 0.484 0.061 12.5 0.302 - 0.666
Glucose 0.623 0.057 9.2 0.451 - 0.794
Lactose 0.694 0.029 4.1 0.608 - 0.781
Maltose 0.596 0.024 4.0 0.524 - 0.669
Cellobiose 0.919 0.044 4.8 0.787 - 1.051
Melibiose 0.511 0.016 3.1 0.463 - 0.558
a Mean of 26 independent determinations of the pooled urine control sample.
Ribose - not detected.
The information given by the area of peak 1/peak 2 ratio shows that the range of
reference is in accordance with that calculated for the pure compounds. Nevertheless, as
it is established as a mean ± 3 STD, it turns to be less straightforward in its usefulness
as an isolated parameter and, accordingly, must be used as a second tool of information,
exclusively. However, when there is no match with the pure compound peak 1/peak 2
area ratio, this parameter clearly rules out the identity of the compound in the unknown
sample compared to the pure compound. The precision of the qualitative analysis was
also tested through the analysis of urine samples from patients with established
diagnosis of transaldolase (TALDO) deficiency, galactosemia, as well as from a
diabetic patient with liver dysfunction. Samples were kindly supplied by Dr. Mirjam
Wamelink from the VU University Medical Center, Amsterdam, The Netherlands. The
chromatograms are shown in Fig. 4. These examples confirm the applicability of the
present method to the biochemical diagnosis of carbohydrates metabolism defects.
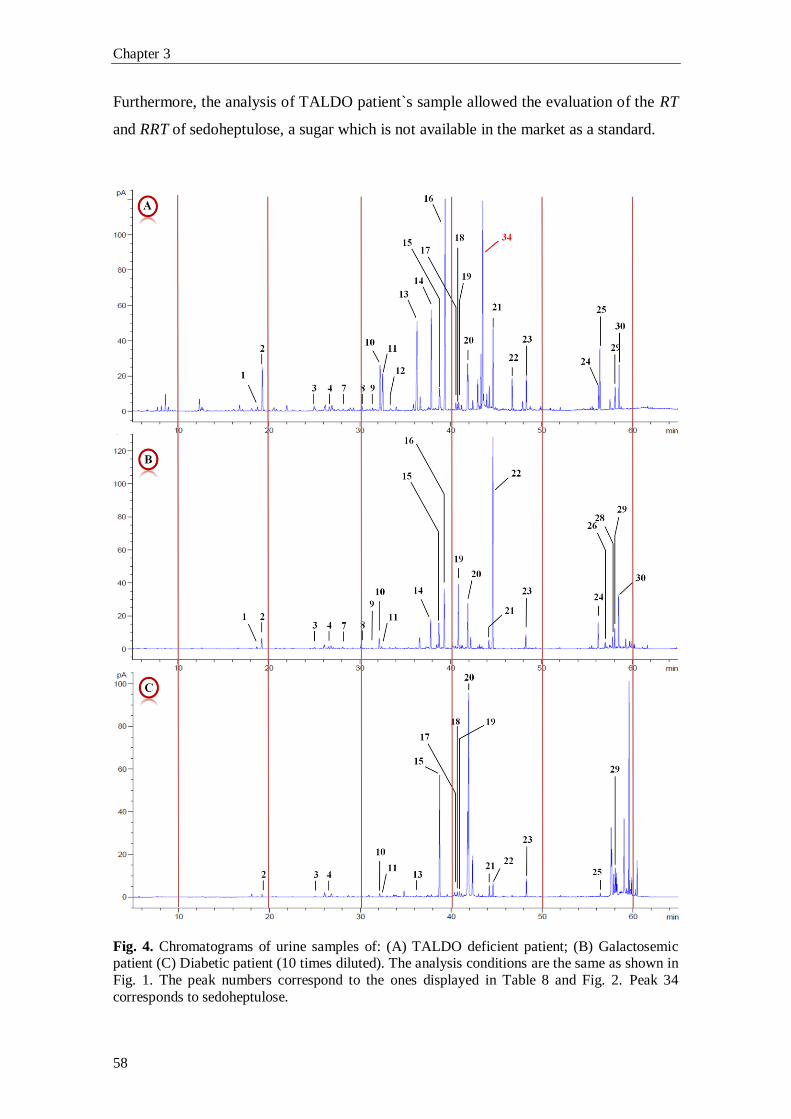
Chapter 3
58
Furthermore, the analysis of TALDO patient`s sample allowed the evaluation of the RT
and RRT of sedoheptulose, a sugar which is not available in the market as a standard.
Fig. 4. Chromatograms of urine samples of: (A) TALDO deficient patient; (B) Galactosemic patient (C) Diabetic patient (10 times diluted). The analysis conditions are the same as shown in
Fig. 1. The peak numbers correspond to the ones displayed in Table 8 and Fig. 2. Peak 34
corresponds to sedoheptulose.
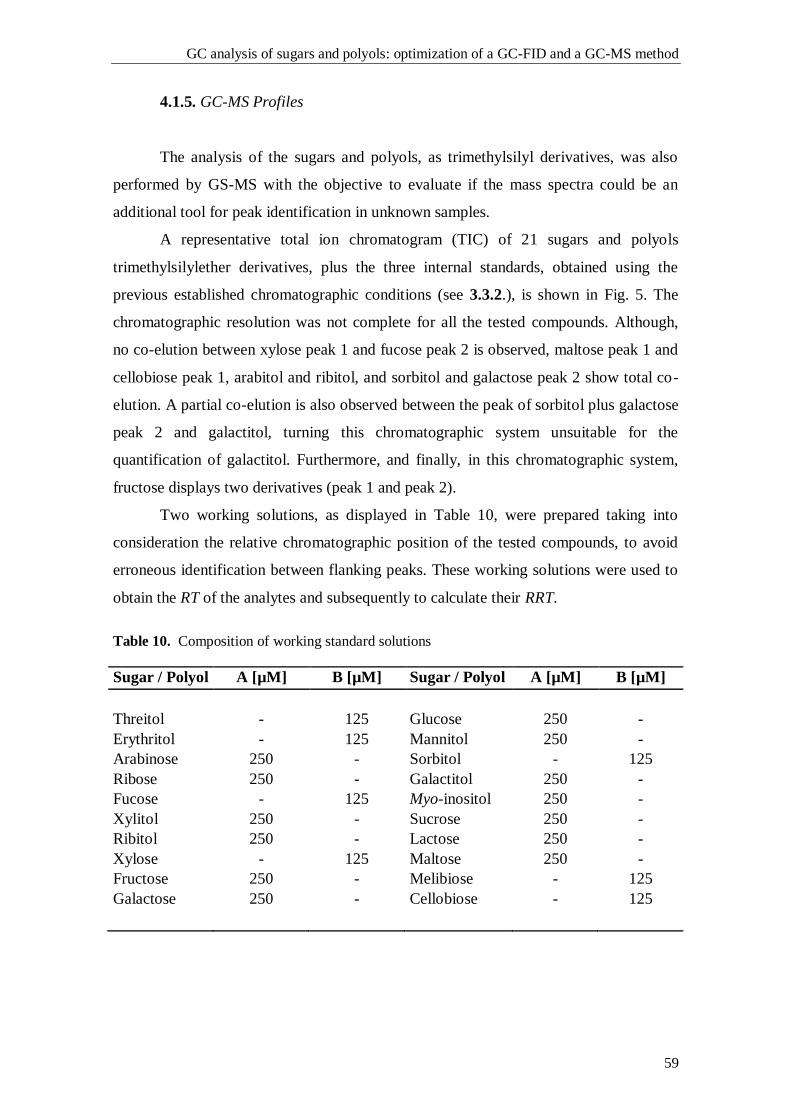
GC analysis of sugars and polyols: optimization of a GC-FID and a GC-MS method
59
4.1.5. GC-MS Profiles
The analysis of the sugars and polyols, as trimethylsilyl derivatives, was also
performed by GS-MS with the objective to evaluate if the mass spectra could be an
additional tool for peak identification in unknown samples.
A representative total ion chromatogram (TIC) of 21 sugars and polyols
trimethylsilylether derivatives, plus the three internal standards, obtained using the
previous established chromatographic conditions (see 3.3.2.), is shown in Fig. 5. The
chromatographic resolution was not complete for all the tested compounds. Although,
no co-elution between xylose peak 1 and fucose peak 2 is observed, maltose peak 1 and
cellobiose peak 1, arabitol and ribitol, and sorbitol and galactose peak 2 show total co-
elution. A partial co-elution is also observed between the peak of sorbitol plus galactose
peak 2 and galactitol, turning this chromatographic system unsuitable for the
quantification of galactitol. Furthermore, and finally, in this chromatographic system,
fructose displays two derivatives (peak 1 and peak 2).
Two working solutions, as displayed in Table 10, were prepared taking into
consideration the relative chromatographic position of the tested compounds, to avoid
erroneous identification between flanking peaks. These working solutions were used to
obtain the RT of the analytes and subsequently to calculate their RRT.
Table 10. Composition of working standard solutions
Sugar / Polyol A [µM] B [µM] Sugar / Polyol A [µM] B [µM]
Threitol - 125 Glucose 250 -
Erythritol - 125 Mannitol 250 -
Arabinose 250 - Sorbitol - 125
Ribose 250 - Galactitol 250 -
Fucose - 125 Myo-inositol 250 -
Xylitol 250 - Sucrose 250 -
Ribitol 250 - Lactose 250 -
Xylose - 125 Maltose 250 -
Fructose 250 - Melibiose - 125
Galactose 250 - Cellobiose - 125
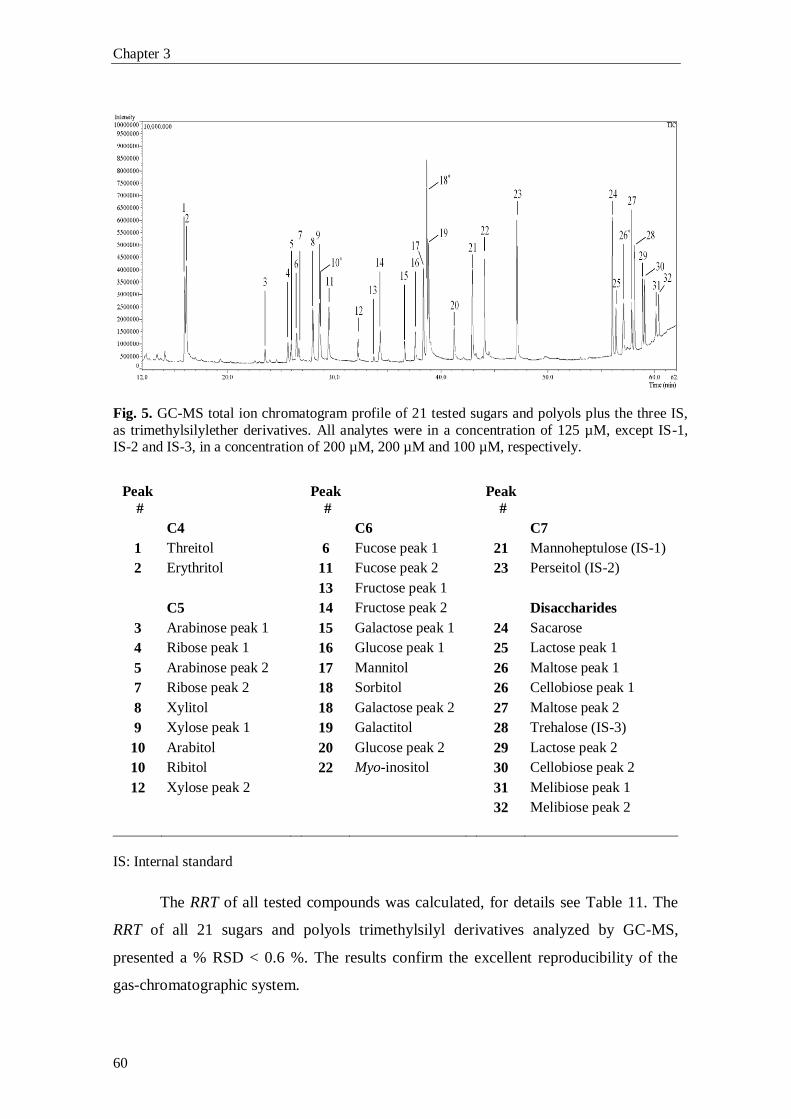
Chapter 3
60
Fig. 5. GC-MS total ion chromatogram profile of 21 tested sugars and polyols plus the three IS,
as trimethylsilylether derivatives. All analytes were in a concentration of 125 µM, except IS-1, IS-2 and IS-3, in a concentration of 200 µM, 200 µM and 100 µM, respectively.
Peak
#
Peak
#
Peak
#
C4 C6 C7
1 Threitol 6 Fucose peak 1 21 Mannoheptulose (IS-1)
2 Erythritol 11 Fucose peak 2 23 Perseitol (IS-2)
13 Fructose peak 1
C5 14 Fructose peak 2 Disaccharides
3 Arabinose peak 1 15 Galactose peak 1 24 Sacarose
4 Ribose peak 1 16 Glucose peak 1 25 Lactose peak 1
5 Arabinose peak 2 17 Mannitol
26 Maltose peak 1
7 Ribose peak 2 18 Sorbitol
26
Cellobiose peak 1
8 Xylitol 18 Galactose peak 2 27 Maltose peak 2
9 Xylose peak 1 19 Galactitol 28 Trehalose (IS-3)
10 Arabitol 20 Glucose peak 2 29 Lactose peak 2
10 Ribitol 22 Myo-inositol 30 Cellobiose peak 2
12 Xylose peak 2 31 Melibiose peak 1
32 Melibiose peak 2
IS: Internal standard
The RRT of all tested compounds was calculated, for details see Table 11. The
RRT of all 21 sugars and polyols trimethylsilyl derivatives analyzed by GC-MS,
presented a % RSD < 0.6 %. The results confirm the excellent reproducibility of the
gas-chromatographic system.
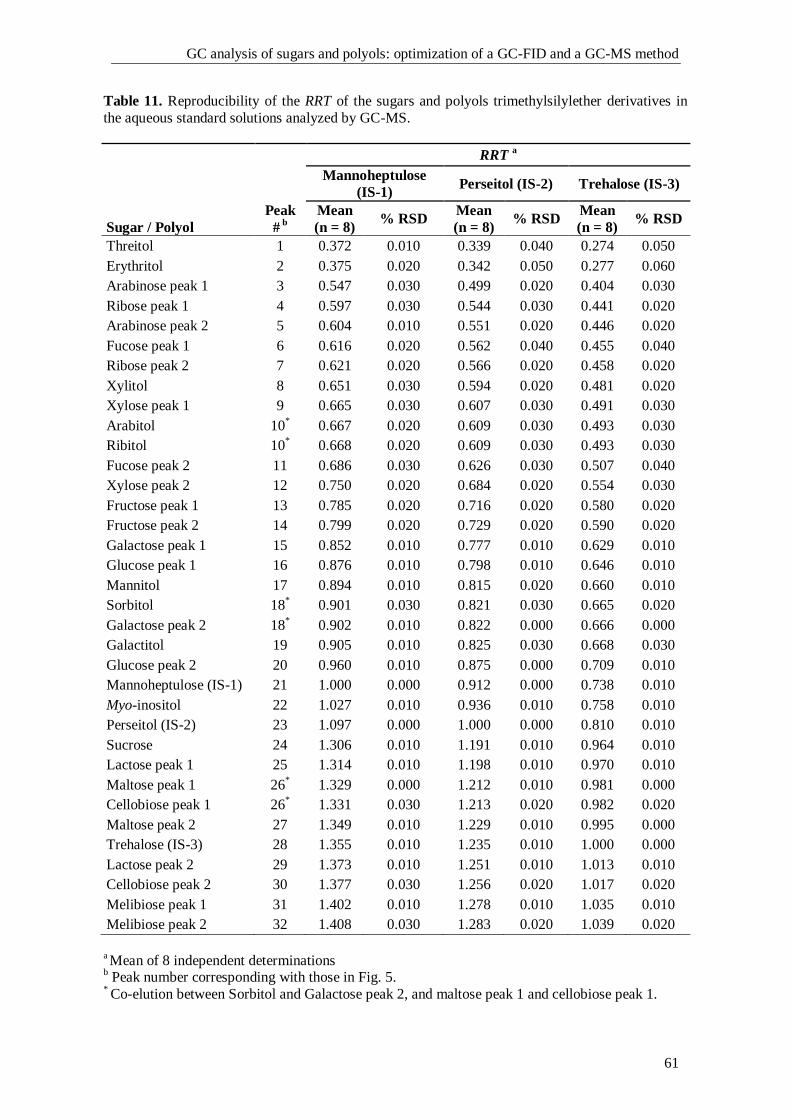
GC analysis of sugars and polyols: optimization of a GC-FID and a GC-MS method
61
Table 11. Reproducibility of the RRT of the sugars and polyols trimethylsilylether derivatives in
the aqueous standard solutions analyzed by GC-MS.
Sugar / Polyol
RRT
a
Peak
# b
Mannoheptulose
(IS-1) Perseitol (IS-2) Trehalose (IS-3)
Mean
(n = 8) % RSD
Mean
(n = 8) % RSD
Mean
(n = 8) % RSD
Threitol 1 0.372 0.010 0.339 0.040 0.274 0.050
Erythritol 2 0.375 0.020 0.342 0.050 0.277 0.060
Arabinose peak 1 3 0.547 0.030 0.499 0.020 0.404 0.030
Ribose peak 1 4 0.597 0.030 0.544 0.030 0.441 0.020
Arabinose peak 2 5 0.604 0.010 0.551 0.020 0.446 0.020
Fucose peak 1 6 0.616 0.020 0.562 0.040 0.455 0.040
Ribose peak 2 7 0.621 0.020 0.566 0.020 0.458 0.020
Xylitol 8 0.651 0.030 0.594 0.020 0.481 0.020
Xylose peak 1 9 0.665 0.030 0.607 0.030 0.491 0.030
Arabitol 10* 0.667 0.020 0.609 0.030 0.493 0.030
Ribitol 10* 0.668 0.020 0.609 0.030 0.493 0.030
Fucose peak 2 11 0.686 0.030 0.626 0.030 0.507 0.040
Xylose peak 2 12 0.750 0.020 0.684 0.020 0.554 0.030
Fructose peak 1 13 0.785 0.020 0.716 0.020 0.580 0.020
Fructose peak 2 14 0.799 0.020 0.729 0.020 0.590 0.020
Galactose peak 1 15 0.852 0.010 0.777 0.010 0.629 0.010
Glucose peak 1 16 0.876 0.010 0.798 0.010 0.646 0.010
Mannitol 17 0.894 0.010 0.815 0.020 0.660 0.010
Sorbitol 18*
0.901 0.030 0.821 0.030 0.665 0.020
Galactose peak 2 18*
0.902 0.010 0.822 0.000 0.666 0.000
Galactitol 19 0.905 0.010 0.825 0.030 0.668 0.030
Glucose peak 2 20 0.960 0.010 0.875 0.000 0.709 0.010
Mannoheptulose (IS-1) 21 1.000 0.000 0.912 0.000 0.738 0.010
Myo-inositol 22 1.027 0.010 0.936 0.010 0.758 0.010
Perseitol (IS-2) 23 1.097 0.000 1.000 0.000 0.810 0.010
Sucrose 24 1.306 0.010 1.191 0.010 0.964 0.010
Lactose peak 1 25 1.314 0.010 1.198 0.010 0.970 0.010
Maltose peak 1 26*
1.329 0.000 1.212 0.010 0.981 0.000
Cellobiose peak 1 26*
1.331 0.030 1.213 0.020 0.982 0.020
Maltose peak 2 27 1.349 0.010 1.229 0.010 0.995 0.000
Trehalose (IS-3) 28 1.355 0.010 1.235 0.010 1.000 0.000
Lactose peak 2 29 1.373 0.010 1.251 0.010 1.013 0.010
Cellobiose peak 2 30 1.377 0.030 1.256 0.020 1.017 0.020
Melibiose peak 1 31 1.402 0.010 1.278 0.010 1.035 0.010
Melibiose peak 2 32 1.408 0.030 1.283 0.020 1.039 0.020
a Mean of 8 independent determinations
b Peak number corresponding with those in Fig. 5.
* Co-elution between Sorbitol and Galactose peak 2, and maltose peak 1 and cellobiose peak 1.
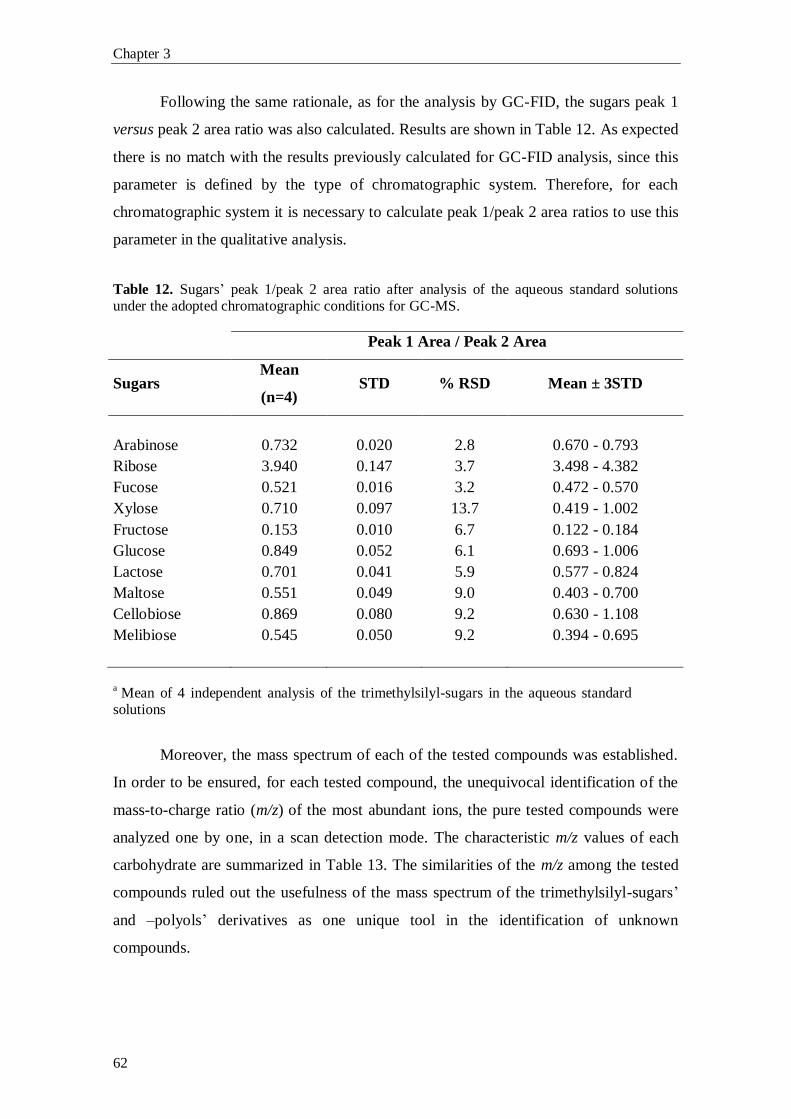
Chapter 3
62
Following the same rationale, as for the analysis by GC-FID, the sugars peak 1
versus peak 2 area ratio was also calculated. Results are shown in Table 12. As expected
there is no match with the results previously calculated for GC-FID analysis, since this
parameter is defined by the type of chromatographic system. Therefore, for each
chromatographic system it is necessary to calculate peak 1/peak 2 area ratios to use this
parameter in the qualitative analysis.
Table 12. Sugars’ peak 1/peak 2 area ratio after analysis of the aqueous standard solutions under the adopted chromatographic conditions for GC-MS.
Peak 1 Area / Peak 2 Area
Sugars Mean
(n=4) STD % RSD Mean ± 3STD
Arabinose 0.732 0.020 2.8 0.670 - 0.793
Ribose 3.940 0.147 3.7 3.498 - 4.382
Fucose 0.521 0.016 3.2 0.472 - 0.570
Xylose 0.710 0.097 13.7 0.419 - 1.002
Fructose 0.153 0.010 6.7 0.122 - 0.184
Glucose 0.849 0.052 6.1 0.693 - 1.006
Lactose 0.701 0.041 5.9 0.577 - 0.824
Maltose 0.551 0.049 9.0 0.403 - 0.700
Cellobiose 0.869 0.080 9.2 0.630 - 1.108
Melibiose 0.545 0.050 9.2 0.394 - 0.695
a Mean of 4 independent analysis of the trimethylsilyl-sugars in the aqueous standard
solutions
Moreover, the mass spectrum of each of the tested compounds was established.
In order to be ensured, for each tested compound, the unequivocal identification of the
mass-to-charge ratio (m/z) of the most abundant ions, the pure tested compounds were
analyzed one by one, in a scan detection mode. The characteristic m/z values of each
carbohydrate are summarized in Table 13. The similarities of the m/z among the tested
compounds ruled out the usefulness of the mass spectrum of the trimethylsilyl-sugars’
and –polyols’ derivatives as one unique tool in the identification of unknown
compounds.
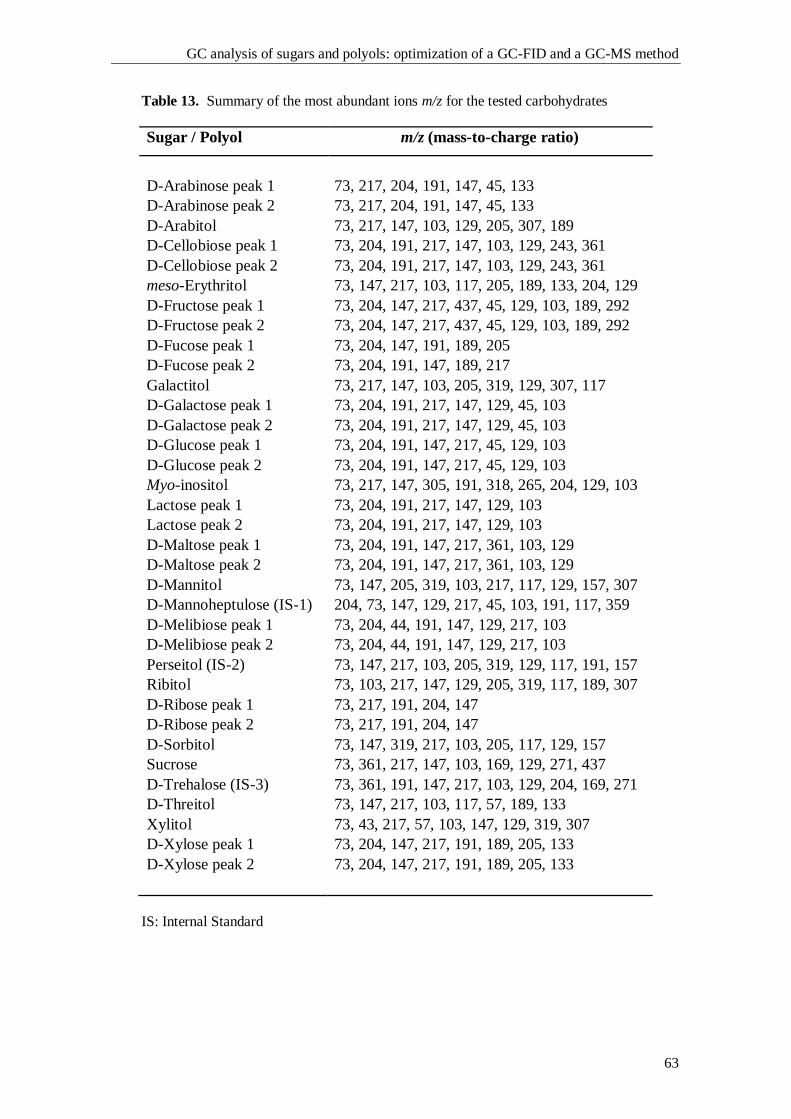
GC analysis of sugars and polyols: optimization of a GC-FID and a GC-MS method
63
Table 13. Summary of the most abundant ions m/z for the tested carbohydrates
Sugar / Polyol m/z (mass-to-charge ratio)
D-Arabinose peak 1 73, 217, 204, 191, 147, 45, 133
D-Arabinose peak 2 73, 217, 204, 191, 147, 45, 133
D-Arabitol 73, 217, 147, 103, 129, 205, 307, 189
D-Cellobiose peak 1 73, 204, 191, 217, 147, 103, 129, 243, 361
D-Cellobiose peak 2 73, 204, 191, 217, 147, 103, 129, 243, 361
meso-Erythritol 73, 147, 217, 103, 117, 205, 189, 133, 204, 129
D-Fructose peak 1 73, 204, 147, 217, 437, 45, 129, 103, 189, 292
D-Fructose peak 2 73, 204, 147, 217, 437, 45, 129, 103, 189, 292
D-Fucose peak 1 73, 204, 147, 191, 189, 205
D-Fucose peak 2 73, 204, 191, 147, 189, 217
Galactitol 73, 217, 147, 103, 205, 319, 129, 307, 117
D-Galactose peak 1 73, 204, 191, 217, 147, 129, 45, 103
D-Galactose peak 2 73, 204, 191, 217, 147, 129, 45, 103
D-Glucose peak 1 73, 204, 191, 147, 217, 45, 129, 103
D-Glucose peak 2 73, 204, 191, 147, 217, 45, 129, 103
Myo-inositol 73, 217, 147, 305, 191, 318, 265, 204, 129, 103
Lactose peak 1 73, 204, 191, 217, 147, 129, 103
Lactose peak 2 73, 204, 191, 217, 147, 129, 103
D-Maltose peak 1 73, 204, 191, 147, 217, 361, 103, 129
D-Maltose peak 2 73, 204, 191, 147, 217, 361, 103, 129
D-Mannitol 73, 147, 205, 319, 103, 217, 117, 129, 157, 307
D-Mannoheptulose (IS-1) 204, 73, 147, 129, 217, 45, 103, 191, 117, 359
D-Melibiose peak 1 73, 204, 44, 191, 147, 129, 217, 103
D-Melibiose peak 2 73, 204, 44, 191, 147, 129, 217, 103
Perseitol (IS-2) 73, 147, 217, 103, 205, 319, 129, 117, 191, 157
Ribitol 73, 103, 217, 147, 129, 205, 319, 117, 189, 307
D-Ribose peak 1 73, 217, 191, 204, 147
D-Ribose peak 2 73, 217, 191, 204, 147
D-Sorbitol 73, 147, 319, 217, 103, 205, 117, 129, 157
Sucrose 73, 361, 217, 147, 103, 169, 129, 271, 437
D-Trehalose (IS-3) 73, 361, 191, 147, 217, 103, 129, 204, 169, 271
D-Threitol 73, 147, 217, 103, 117, 57, 189, 133
Xylitol 73, 43, 217, 57, 103, 147, 129, 319, 307
D-Xylose peak 1 73, 204, 147, 217, 191, 189, 205, 133
D-Xylose peak 2 73, 204, 147, 217, 191, 189, 205, 133
IS: Internal Standard
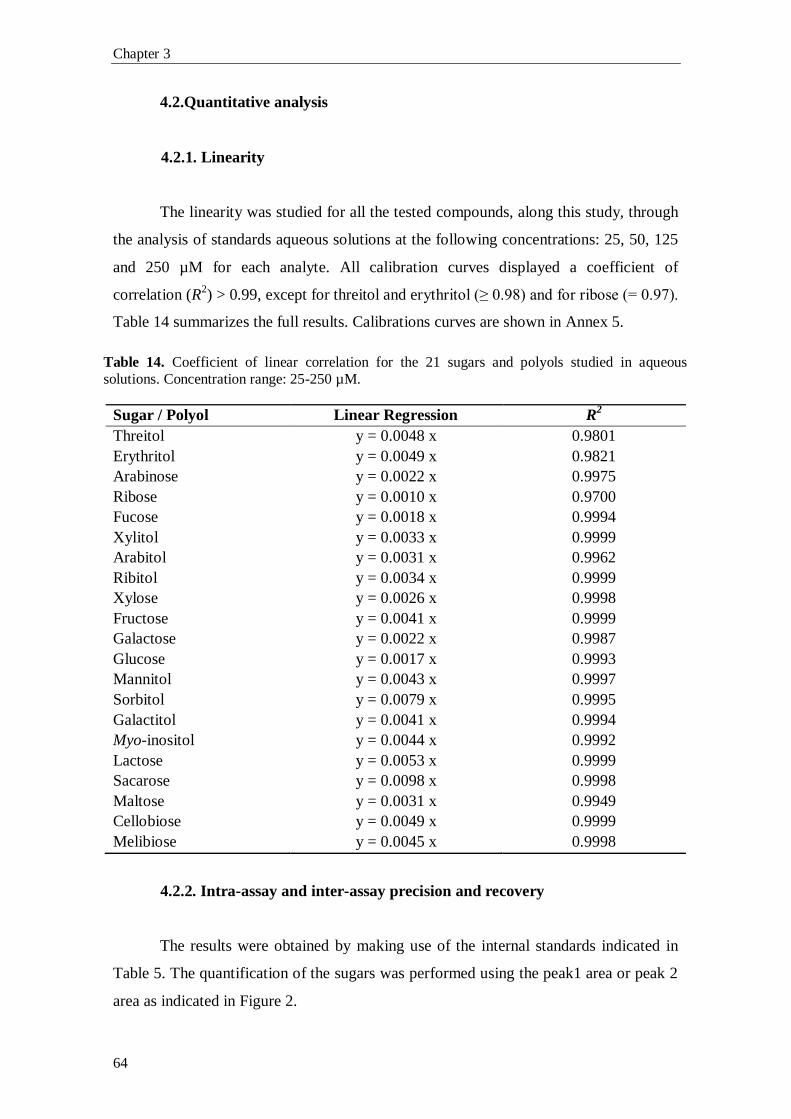
Chapter 3
64
4.2.Quantitative analysis
4.2.1. Linearity
The linearity was studied for all the tested compounds, along this study, through
the analysis of standards aqueous solutions at the following concentrations: 25, 50, 125
and 250 µM for each analyte. All calibration curves displayed a coefficient of
correlation (R2) > 0.99, except for threitol and erythritol (≥ 0.98) and for ribose (= 0.97).
Table 14 summarizes the full results. Calibrations curves are shown in Annex 5.
Table 14. Coefficient of linear correlation for the 21 sugars and polyols studied in aqueous
solutions. Concentration range: 25-250 µM.
Sugar / Polyol Linear Regression R2
Threitol y = 0.0048 x 0.9801
Erythritol y = 0.0049 x 0.9821
Arabinose y = 0.0022 x 0.9975
Ribose y = 0.0010 x 0.9700
Fucose y = 0.0018 x 0.9994
Xylitol y = 0.0033 x 0.9999
Arabitol y = 0.0031 x 0.9962
Ribitol y = 0.0034 x 0.9999
Xylose y = 0.0026 x 0.9998
Fructose y = 0.0041 x 0.9999
Galactose y = 0.0022 x 0.9987
Glucose y = 0.0017 x 0.9993
Mannitol y = 0.0043 x 0.9997
Sorbitol y = 0.0079 x 0.9995
Galactitol y = 0.0041 x 0.9994
Myo-inositol y = 0.0044 x 0.9992
Lactose y = 0.0053 x 0.9999
Sacarose y = 0.0098 x 0.9998
Maltose y = 0.0031 x 0.9949
Cellobiose y = 0.0049 x 0.9999
Melibiose y = 0.0045 x 0.9998
4.2.2. Intra-assay and inter-assay precision and recovery
The results were obtained by making use of the internal standards indicated in
Table 5. The quantification of the sugars was performed using the peak1 area or peak 2
area as indicated in Figure 2.
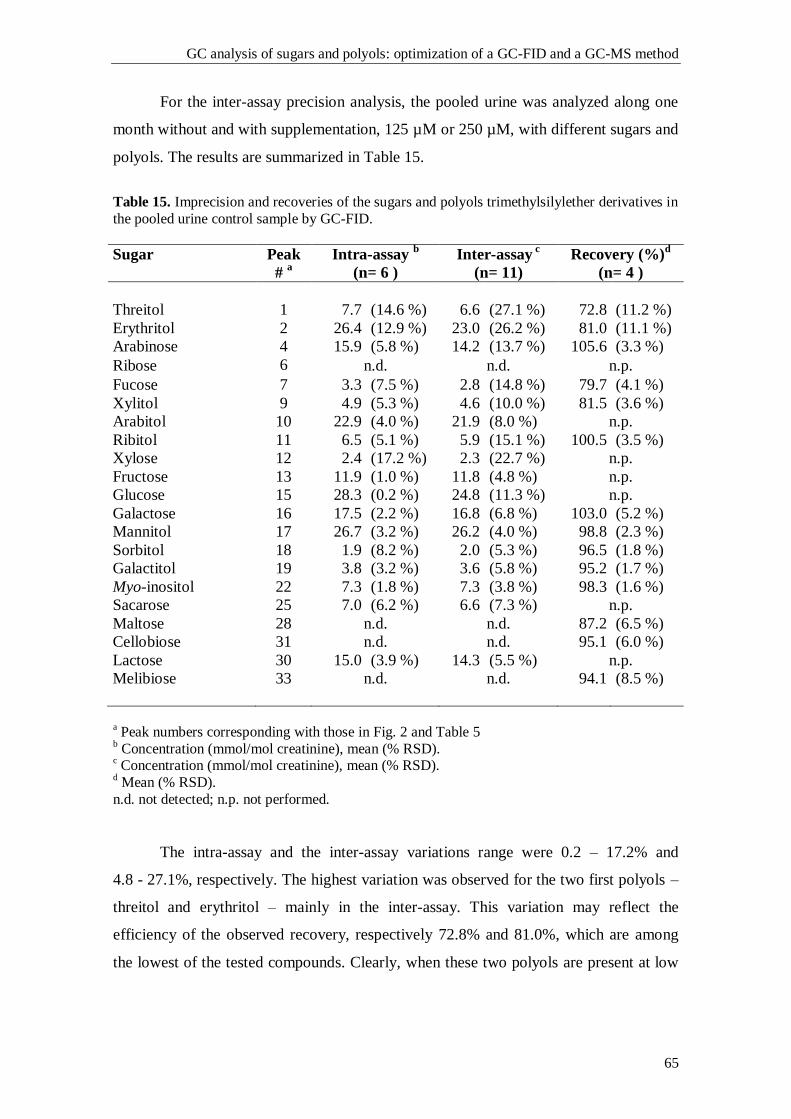
GC analysis of sugars and polyols: optimization of a GC-FID and a GC-MS method
65
For the inter-assay precision analysis, the pooled urine was analyzed along one
month without and with supplementation, 125 µM or 250 µM, with different sugars and
polyols. The results are summarized in Table 15.
Table 15. Imprecision and recoveries of the sugars and polyols trimethylsilylether derivatives in
the pooled urine control sample by GC-FID.
Sugar
Peak
# a
Intra-assay b
(n= 6 )
Inter-assay c
(n= 11)
Recovery (%)d
(n= 4 )
Threitol 1 7.7 (14.6 %) 6.6 (27.1 %) 72.8 (11.2 %)
Erythritol 2 26.4 (12.9 %) 23.0 (26.2 %) 81.0 (11.1 %)
Arabinose 4 15.9 (5.8 %) 14.2 (13.7 %) 105.6 (3.3 %)
Ribose 6 n.d. n.d. n.p.
Fucose 7 3.3 (7.5 %) 2.8 (14.8 %) 79.7 (4.1 %)
Xylitol 9 4.9 (5.3 %) 4.6 (10.0 %) 81.5 (3.6 %)
Arabitol 10 22.9 (4.0 %) 21.9 (8.0 %) n.p.
Ribitol 11 6.5 (5.1 %) 5.9 (15.1 %) 100.5 (3.5 %)
Xylose 12 2.4 (17.2 %) 2.3 (22.7 %) n.p.
Fructose 13 11.9 (1.0 %) 11.8 (4.8 %) n.p.
Glucose 15 28.3 (0.2 %) 24.8 (11.3 %) n.p.
Galactose 16 17.5 (2.2 %) 16.8 (6.8 %) 103.0 (5.2 %)
Mannitol 17 26.7 (3.2 %) 26.2 (4.0 %) 98.8 (2.3 %)
Sorbitol 18 1.9 (8.2 %) 2.0 (5.3 %) 96.5 (1.8 %)
Galactitol 19 3.8 (3.2 %) 3.6 (5.8 %) 95.2 (1.7 %)
Myo-inositol 22 7.3 (1.8 %) 7.3 (3.8 %) 98.3 (1.6 %)
Sacarose 25 7.0 (6.2 %) 6.6 (7.3 %) n.p.
Maltose 28 n.d. n.d. 87.2 (6.5 %)
Cellobiose 31 n.d. n.d. 95.1 (6.0 %)
Lactose 30 15.0 (3.9 %) 14.3 (5.5 %) n.p.
Melibiose 33 n.d. n.d. 94.1 (8.5 %)
a Peak numbers corresponding with those in Fig. 2 and Table 5
b Concentration (mmol/mol creatinine), mean (% RSD).
c Concentration (mmol/mol creatinine), mean (% RSD).
d Mean (% RSD).
n.d. not detected; n.p. not performed.
The intra-assay and the inter-assay variations range were 0.2 – 17.2% and
4.8 - 27.1%, respectively. The highest variation was observed for the two first polyols –
threitol and erythritol – mainly in the inter-assay. This variation may reflect the
efficiency of the observed recovery, respectively 72.8% and 81.0%, which are among
the lowest of the tested compounds. Clearly, when these two polyols are present at low
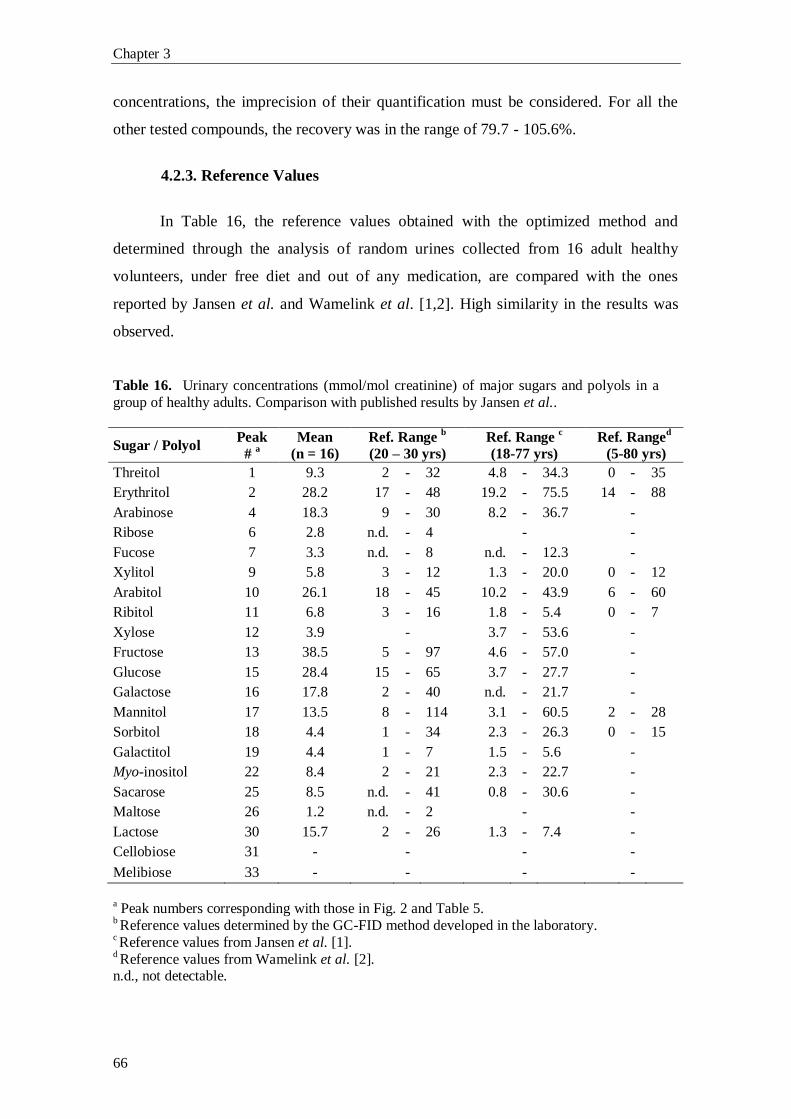
Chapter 3
66
concentrations, the imprecision of their quantification must be considered. For all the
other tested compounds, the recovery was in the range of 79.7 - 105.6%.
4.2.3. Reference Values
In Table 16, the reference values obtained with the optimized method and
determined through the analysis of random urines collected from 16 adult healthy
volunteers, under free diet and out of any medication, are compared with the ones
reported by Jansen et al. and Wamelink et al. [1,2]. High similarity in the results was
observed.
Table 16. Urinary concentrations (mmol/mol creatinine) of major sugars and polyols in a
group of healthy adults. Comparison with published results by Jansen et al..
Sugar / Polyol Peak
# a
Mean
(n = 16)
Ref. Range b
(20 – 30 yrs)
Ref. Range c
(18-77 yrs)
Ref. Ranged
(5-80 yrs)
Threitol 1 9.3 2 - 32 4.8 - 34.3 0 - 35
Erythritol 2 28.2 17 - 48 19.2 - 75.5 14 - 88
Arabinose 4 18.3 9 - 30 8.2 - 36.7
-
Ribose 6 2.8 n.d. - 4
-
-
Fucose 7 3.3 n.d. - 8 n.d. - 12.3
-
Xylitol 9 5.8 3 - 12 1.3 - 20.0 0 - 12
Arabitol 10 26.1 18 - 45 10.2 - 43.9 6 - 60
Ribitol 11 6.8 3 - 16 1.8 - 5.4 0 - 7
Xylose 12 3.9
-
3.7 - 53.6
-
Fructose 13 38.5 5 - 97 4.6 - 57.0
-
Glucose 15 28.4 15 - 65 3.7 - 27.7
-
Galactose 16 17.8 2 - 40 n.d. - 21.7
-
Mannitol 17 13.5 8 - 114 3.1 - 60.5 2 - 28
Sorbitol 18 4.4 1 - 34 2.3 - 26.3 0 - 15
Galactitol 19 4.4 1 - 7 1.5 - 5.6
-
Myo-inositol 22 8.4 2 - 21 2.3 - 22.7
-
Sacarose 25 8.5 n.d. - 41 0.8 - 30.6
-
Maltose 26 1.2 n.d. - 2
-
-
Lactose 30 15.7 2 - 26 1.3 - 7.4
-
Cellobiose 31 -
-
-
-
Melibiose 33 -
-
-
-
a Peak numbers corresponding with those in Fig. 2 and Table 5.
b Reference values determined by the GC-FID method developed in the laboratory.
c Reference values from Jansen et al. [1].
d Reference values from Wamelink et al. [2].
n.d., not detectable.
GC analysis of sugars and polyols: optimization of a GC-FID and a GC-MS method
67
5. Discussion
The profiling of sugars and polyols in body fluids regained an increased
relevance with the recently discovery of new enzymatic defects in the non-oxidative
branch of the PPP. Specific profiles of PPP intermediate metabolites were associated
with distinct blockages and therefore started to be a useful tool in the screening of this
group of pathologies.
The analysis of sugars and polyols has been accomplished essentially by
chromatographic methodologies, namely Liquid (LC) or Gas Chromatography (GC).
HPLC analysis has been useful for the analysis of phosphate forms of intermediate
sugars but it is quite time consuming for routine laboratory work. Recently, LC-MS/MS
methods for the analysis of different sugar-phosphates [3, 4] and polyols in urine were
developed [2]. GC with flame ionization detection or coupled to mass detection offers
high chromatographic resolution as well as good sensitivity. A simple pre-purification
sample procedure was proposed by Jansen and co-workers [1], therefore being suitable
for screening purposes.
Based on the work of Jansen and co-workers, a GC- FID and GC-MS methods
were optimized for the simultaneous analysis of sugars and polyols in body fluids. The
selected chromatographic conditions allowed a resolution to the base line for the
majority of the peaks of interest. Two parameters were used in the qualitative analysis,
namely relative retention time (RRT) and the ratio of the areas of the two peaks (peak 1
and 2) assigned to the corresponding sugar trimethylsilylether derivatives. The
combination of these two parameters allowed a correct qualitative analysis of unknown
samples in comparison with pure standards. As already highlighted the mass spectrum
analysis did not add additional data in terms of unequivocal qualitative analysis but it
allows to distinguish matrix interference from a true sugar or polyol.
The reproducibility of the used parameters in the qualitative as well as the
quantitative analysis was excellent as the agreement of our reference values for
urinary`s sugars and polyols proves. In conclusion, the optimized method seems to be
an useful tool for the study of the PPP, allowing not only to expand the screening
program capability of the laboratory but to contribute to the exploration of the
biochemistry determinants of the PPP which is far from being fully understood as well.
Chapter 3
68
6. Bibliography
[1] G. Jansen, F.A. Muskiet, H. Schierbeek, R. Berger, W. van der Slik, Capillary
gas chromatographic profiling of urinary, plasma and erythrocyte sugars and polyols as
theirtrimethylsilyl derivatives, preceded by a simple and rapid prepurification method,
Clin. Chim. Acta. 157 (1986) 277-93.
[2] M.M. Wamelink, D.E. Smith, C. Jakobs, N.M. Verhoeven, Analysis of polyols
in urine by liquid chromatography-tandem mass spectrometry: a useful tool for
recognition of inborn errors affecting polyol metabolism, J. Inherit. Metab. Dis.
28(2005) 951-63.
[3] M.M. Wamelink, E.A. Struys, J.H. Huck, B. Roos, M.S. van der Knaap, C.
Jakobs, N.M. Verhoeven, Quantification of sugar phosphate intermediates of the
pentose phosphate pathway by LC-MS/MS: application to two new inherited defects of
metabolism, J. Chromatogr. B. Analyt. Technol. Biomed. Life Sci. 823 (2005) 18-25.
[4] J.H. Huck, E.A. Struys, N.M. Verhoeven, C. Jakobs, M.S. van der Knaap,
Profiling of pentose phosphate pathway intermediates in blood spots by tandem mass
spectrometry: application to transaldolase deficiency, Clin. Chem. 49 (2003) 1375-80.
CHAPTER 4
Pentose phosphate pathway intermediates:
a study in adult patients with liver dysfunction

PPP intermediates: a study in adult patients with liver dysfunction
71
1. Introduction
Non-alcoholic fatty liver disease (NAFLD) is the most common liver disease
recognized in Europe and North America. The prevalence of NAFLD is estimated in
20 – 30% in general population of Western countries [1, 2]. However, these estimations
need to be confirmed by testing the significance of the risk factors identified by clinical
series in the general population [3]. NAFLD was thought to be a benign condition, but
is nowadays recognized as a major cause of liver-related morbidity and mortality [4]. In
many cases, NAFLD is associated with obesity, hyper- or dyslipidemia, hyperglycemia,
type II diabetes and insulin resistance [5-7]. NAFLD is currently defined as fat
accumulation in the liver exceeding 5% to 10% of the weight of the liver [2]. NAFLD is
an asymptomatic condition and the diagnosis is mostly made when liver alanine
aminotransferase (ALT) and/or aspartate aminotransferase (AST) enzymes are elevated
[5], or alternatively when hepatomegaly is detected in ultrasonography performed for
another purpose, and without abnormal liver tests [6]. Non-alcoholic steatohepatitis
(NASH) is the progressive form of NAFLD that carries a risk for development of
fibrosis, cirrhosis, and hepatocellular carcinoma (HCC) [3]. NAFLD is differentiated
from alcoholic fatty liver disease (AFLD) by the alcohol intake. The distinction is based
on the intake of ethanol under two standard drinks a day (140 g ethanol/week) for men,
and one standard drink a day (70 g ethanol/week) for women. Liver biopsy is the only
way to confirm the presence or absence of NASH in a NAFLD patient [6].
Transketolase (TKT; E.C.2.2.1.1) and transaldolase (TALDO; E.C.2.2.1.2) are
the key enzymes of the non-oxidative branch of the pentose phosphate pathway (PPP).
TKT is the first enzyme, a thiamine diphosphate (ThDP, active vitamin B1) and Ca2+
ion dependent enzyme [7], and TALDO is the second enzyme, a cofactor-less enzyme
[8]. Together, these two enzymes create a reversible link between the oxidative branch
of the PPP and glycolytic intermediates. The PPP activity is regulated according to the
needs of the organism and the metabolic situation. If the PPP products are not needed,
they are readily transformed into glycolytic intermediates and oxidized [7].
Since the description in 2001, by Verhoeven and co-workers [9], of the first
patient with transaldolase deficiency, associated with liver cirrhosis and
hepatosplenomegaly, in the first child of healthy, consanguineous Turkish parents [9],
the non-oxidative branch of the PPP has regained notoriety, although the contribution to
metabolism and cell survival remains poorly understood [8]. Since this first case,
Chapter 4
72
twenty-two other patients have been described in the literature [10-16] and almost all
patients presented with hepatosplenomegaly (22/23) and liver dysfunction of similar
magnitude (18/23).
In 2009 Hanczko and co-workers demonstrated that homozygote (Taldo1-/-
) and
heterozygote (Taldo1+/-
) Taldo1 deficient mice presented increased rates of cirrhosis
and that HCC was the leading cause of death, 17% and 46% respectively, when
compared to Taldo1+/+
littermates. The authors also observed the formation of
microvesicular and macrovesicular lipid droplets indicative of steatosis or non-alcoholic
fatty liver disease, hepatocyte ballooning and inflammatory changes like non-alcoholic
steatohepatitis [17].
Taken together, the liver dysfunction, the recent cases of enzymatic defects in
the PPP, namely transaldolase deficiency, and the findings described by Hanczko et al.,
this study was started with the main goal of understanding a putative link between the
biochemical intermediate metabolites of the PPP and the hepatic dysfunction in patients
with liver disease of unknown cause (NAFLD) or patients with hepatic dysfunction due
to alcohol abuse (AFLD), in the presence or absence of inflammation, cirrhosis and
HCC.
In patients with liver dysfunction due to alcohol abuse, the evaluation of these
PPP intermediate metabolites may allow the definition of new predictive biomarkers
either of disease progression or of the effectiveness of the established treatment.
2. Material
To characterize the pattern of metabolites involved in the PPP of adult patients
with NAFLD and AFLD, a protocol was established between the Metabolism and
Genetics group of iMed.UL, at Faculty of Pharmacy and the Hepatology Section of
Internal Medicine Department at Santa Maria`s University Hospital, both from the
University of Lisbon. The protocol was submitted and approved by the hospital ethical
council and informed consents were obtained from all the participants in the study.
Since the approval of the study (May 2012) until the present date, 14 patients
with hepatic dysfunction (AFLD or NAFLD) were enrolled in the study. A random
urine sample was collected when the patient visited the clinician for regular control.
Eleven patients had AFLD, and all presented a cirrhotic liver (11/11). Among these,
PPP intermediates: a study in adult patients with liver dysfunction
73
patient 9 was diagnosed as having HCC, and along the course of this study, patient 12
progressed also to HCC. The remaining three patients had non-alcoholic steatohepatitis
(NASH), and none presented a cirrhotic liver. Table 1 summarizes the main features of
all fourteen patients enrolled in the study.
3. Results and Discussion
Patients (Table 1) were divided, as already mentioned, into two main groups
according to the type of liver dysfunction: (i) NASH (Table 2) and (ii) AFLD (Table 3).
NASH patients’ group is a more homogenous group than AFLD patients’ group. None
of NASH patients developed cirrhosis and/or HCC. In contrast, the AFLD patients’
group is a more heterogeneous one, spanning from compensated to decompensated
cirrhosis and progressing to HCC in two cases.
The results of sugars and polyols for the NASH and AFLD groups are presented
in Table 2 and Table 3, respectively. Table 3 summarizes all patients of the AFLD
population, and as shown, patients 2, 4, 9 and 12 presented the highest levels of polyols.
These data led us to subdivide the AFLD group into two subgroups: AFLDa (Table 4)
and AFLDb (Table 5), with respectively minor and major alterations in polyols’ profile.
Patients belonging to the NASH population showed no major abnormalities in
their polyols’ profile. However, all the patients revealed increased (until 3 fold) ribitol
levels, when compared with the reference values. Slight increased excretion of arabitol
was detected in patients 3 and 5, and erythritol was slightly elevated in patient 5. In
none of these patients sedoheptulose was observed.
The mild alterations observed in glucose, galactose and galactitol excretion
levels have no specific significance since these alterations are often observed in
situations of liver disease and point out to some deregulation of the PPP non-oxidative
branch. However, we must highlight that the number of patients studied so far is too
small to allow any conclusion.
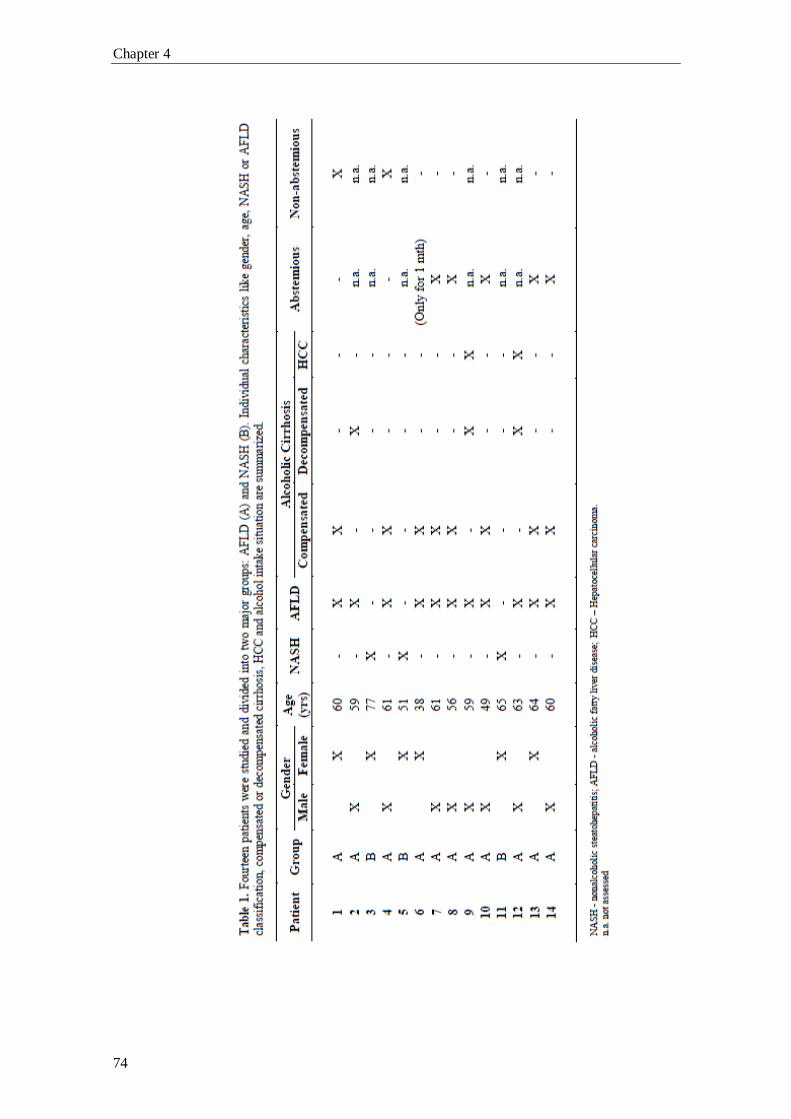
Chapter 4
74
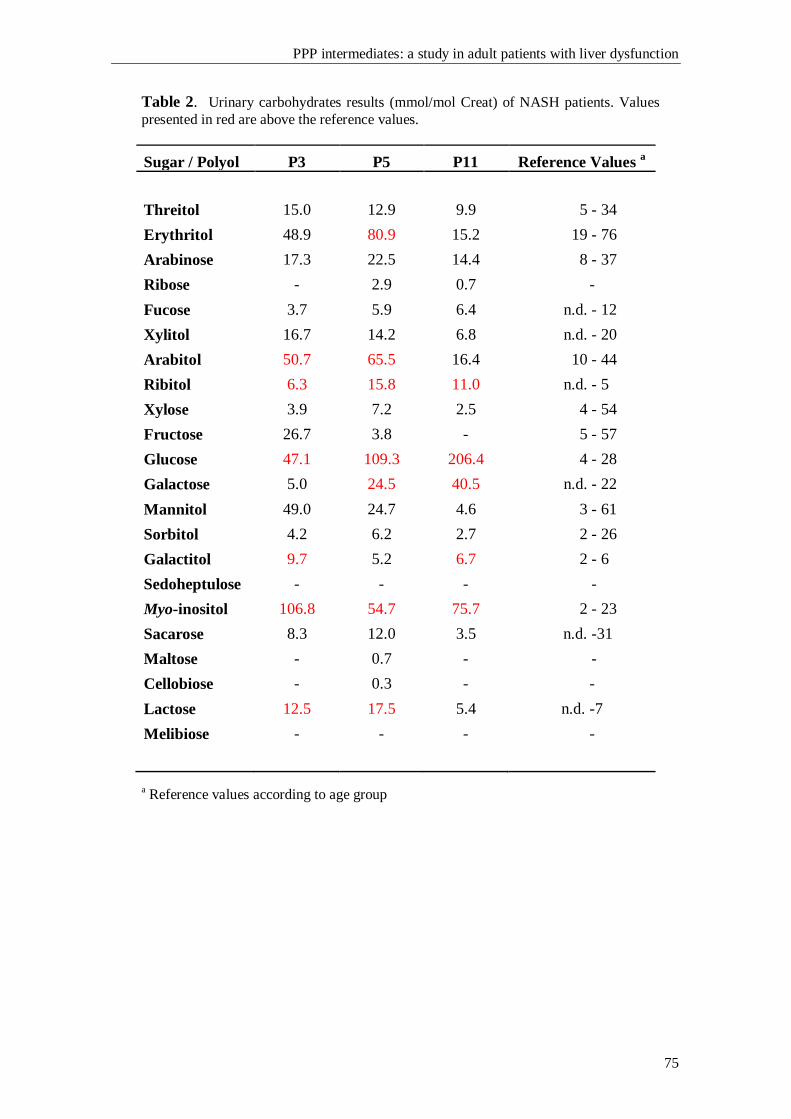
PPP intermediates: a study in adult patients with liver dysfunction
75
Table 2. Urinary carbohydrates results (mmol/mol Creat) of NASH patients. Values
presented in red are above the reference values.
Sugar / Polyol P3 P5 P11 Reference Values a
Threitol 15.0 12.9 9.9 5 - 34
Erythritol 48.9 80.9 15.2 19 - 76
Arabinose 17.3 22.5 14.4 8 - 37
Ribose - 2.9 0.7 -
Fucose 3.7 5.9 6.4 n.d. - 12
Xylitol 16.7 14.2 6.8 n.d. - 20
Arabitol 50.7 65.5 16.4 10 - 44
Ribitol 6.3 15.8 11.0 n.d. - 5
Xylose 3.9 7.2 2.5 4 - 54
Fructose 26.7 3.8 - 5 - 57
Glucose 47.1 109.3 206.4 4 - 28
Galactose 5.0 24.5 40.5 n.d. - 22
Mannitol 49.0 24.7 4.6 3 - 61
Sorbitol 4.2 6.2 2.7 2 - 26
Galactitol 9.7 5.2 6.7 2 - 6
Sedoheptulose - - - -
Myo-inositol 106.8 54.7 75.7 2 - 23
Sacarose 8.3 12.0 3.5 n.d. -31
Maltose - 0.7 - -
Cellobiose - 0.3 - -
Lactose 12.5 17.5 5.4 n.d. -7
Melibiose - - - -
a Reference values according to age group
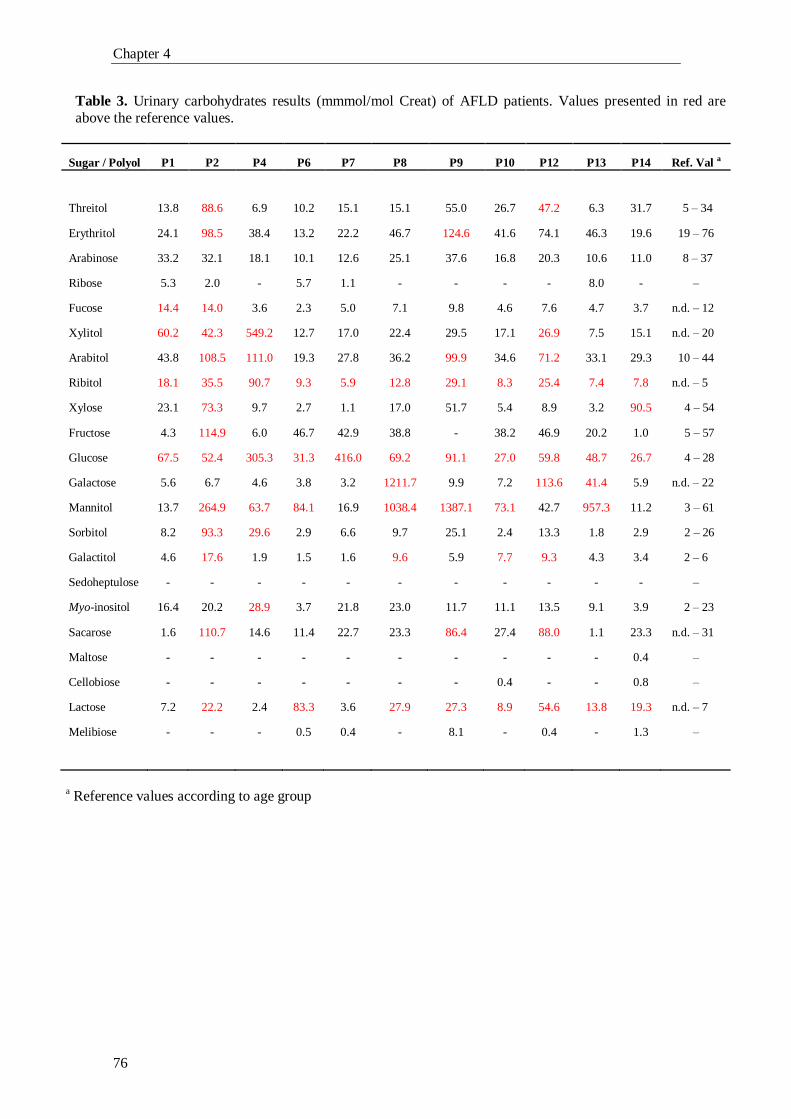
Chapter 4
76
Table 3. Urinary carbohydrates results (mmmol/mol Creat) of AFLD patients. Values presented in red are
above the reference values.
Sugar / Polyol P1 P2 P4 P6 P7 P8 P9 P10 P12 P13 P14 Ref. Val a
Threitol 13.8 88.6 6.9 10.2 15.1 15.1 55.0 26.7 47.2 6.3 31.7 5 – 34
Erythritol 24.1 98.5 38.4 13.2 22.2 46.7 124.6 41.6 74.1 46.3 19.6 19 – 76
Arabinose 33.2 32.1 18.1 10.1 12.6 25.1 37.6 16.8 20.3 10.6 11.0 8 – 37
Ribose 5.3 2.0 - 5.7 1.1 - - - - 8.0 - –
Fucose 14.4 14.0 3.6 2.3 5.0 7.1 9.8 4.6 7.6 4.7 3.7 n.d. – 12
Xylitol 60.2 42.3 549.2 12.7 17.0 22.4 29.5 17.1 26.9 7.5 15.1 n.d. – 20
Arabitol 43.8 108.5 111.0 19.3 27.8 36.2 99.9 34.6 71.2 33.1 29.3 10 – 44
Ribitol 18.1 35.5 90.7 9.3 5.9 12.8 29.1 8.3 25.4 7.4 7.8 n.d. – 5
Xylose 23.1 73.3 9.7 2.7 1.1 17.0 51.7 5.4 8.9 3.2 90.5 4 – 54
Fructose 4.3 114.9 6.0 46.7 42.9 38.8 - 38.2 46.9 20.2 1.0 5 – 57
Glucose 67.5 52.4 305.3 31.3 416.0 69.2 91.1 27.0 59.8 48.7 26.7 4 – 28
Galactose 5.6 6.7 4.6 3.8 3.2 1211.7 9.9 7.2 113.6 41.4 5.9 n.d. – 22
Mannitol 13.7 264.9 63.7 84.1 16.9 1038.4 1387.1 73.1 42.7 957.3 11.2 3 – 61
Sorbitol 8.2 93.3 29.6 2.9 6.6 9.7 25.1 2.4 13.3 1.8 2.9 2 – 26
Galactitol 4.6 17.6 1.9 1.5 1.6 9.6 5.9 7.7 9.3 4.3 3.4 2 – 6
Sedoheptulose - - - - - - - - - - - –
Myo-inositol 16.4 20.2 28.9 3.7 21.8 23.0 11.7 11.1 13.5 9.1 3.9 2 – 23
Sacarose 1.6 110.7 14.6 11.4 22.7 23.3 86.4 27.4 88.0 1.1 23.3 n.d. – 31
Maltose - - - - - - - - - - 0.4 –
Cellobiose - - - - - - - 0.4 - - 0.8 –
Lactose 7.2 22.2 2.4 83.3 3.6 27.9 27.3 8.9 54.6 13.8 19.3 n.d. – 7
Melibiose - - - 0.5 0.4 - 8.1 - 0.4 - 1.3 –
a Reference values according to age group
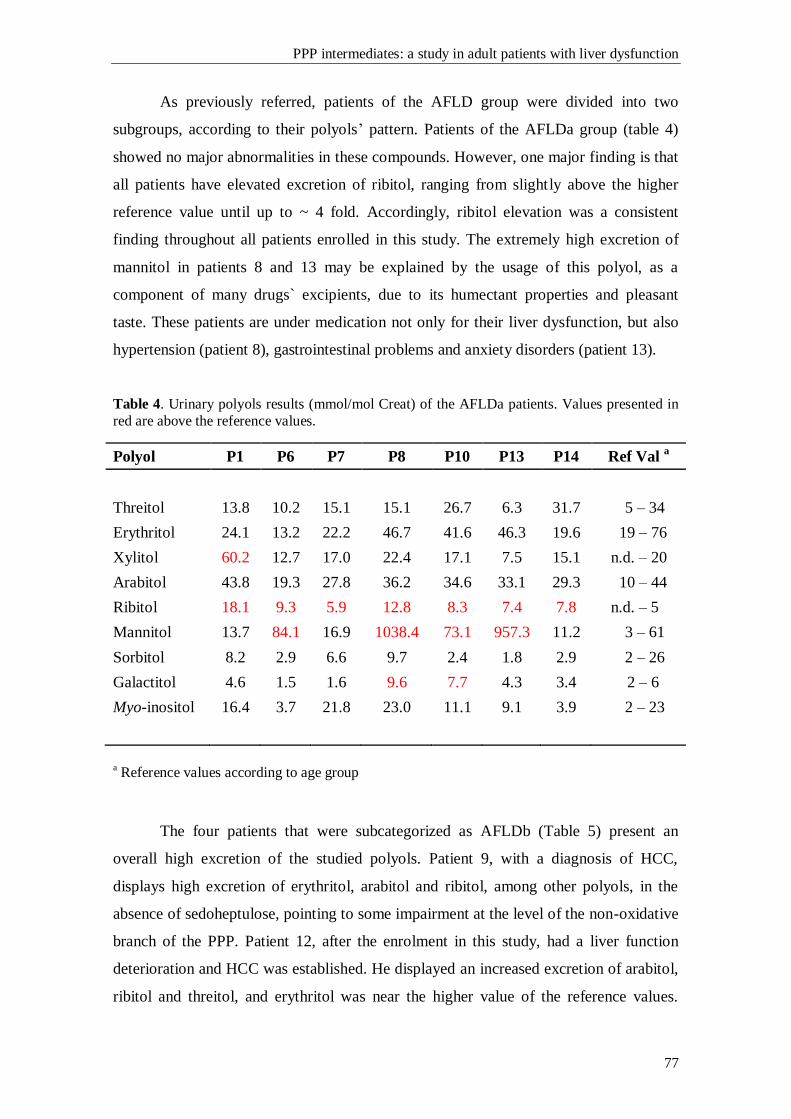
PPP intermediates: a study in adult patients with liver dysfunction
77
As previously referred, patients of the AFLD group were divided into two
subgroups, according to their polyols’ pattern. Patients of the AFLDa group (table 4)
showed no major abnormalities in these compounds. However, one major finding is that
all patients have elevated excretion of ribitol, ranging from slightly above the higher
reference value until up to ~ 4 fold. Accordingly, ribitol elevation was a consistent
finding throughout all patients enrolled in this study. The extremely high excretion of
mannitol in patients 8 and 13 may be explained by the usage of this polyol, as a
component of many drugs` excipients, due to its humectant properties and pleasant
taste. These patients are under medication not only for their liver dysfunction, but also
hypertension (patient 8), gastrointestinal problems and anxiety disorders (patient 13).
Table 4. Urinary polyols results (mmol/mol Creat) of the AFLDa patients. Values presented in
red are above the reference values.
Polyol P1 P6 P7 P8 P10 P13 P14 Ref Val a
Threitol 13.8 10.2 15.1 15.1 26.7 6.3 31.7 5 – 34
Erythritol 24.1 13.2 22.2 46.7 41.6 46.3 19.6 19 – 76
Xylitol 60.2 12.7 17.0 22.4 17.1 7.5 15.1 n.d. – 20
Arabitol 43.8 19.3 27.8 36.2 34.6 33.1 29.3 10 – 44
Ribitol 18.1 9.3 5.9 12.8 8.3 7.4 7.8 n.d. – 5
Mannitol 13.7 84.1 16.9 1038.4 73.1 957.3 11.2 3 – 61
Sorbitol 8.2 2.9 6.6 9.7 2.4 1.8 2.9 2 – 26
Galactitol 4.6 1.5 1.6 9.6 7.7 4.3 3.4 2 – 6
Myo-inositol 16.4 3.7 21.8 23.0 11.1 9.1 3.9 2 – 23
a Reference values according to age group
The four patients that were subcategorized as AFLDb (Table 5) present an
overall high excretion of the studied polyols. Patient 9, with a diagnosis of HCC,
displays high excretion of erythritol, arabitol and ribitol, among other polyols, in the
absence of sedoheptulose, pointing to some impairment at the level of the non-oxidative
branch of the PPP. Patient 12, after the enrolment in this study, had a liver function
deterioration and HCC was established. He displayed an increased excretion of arabitol,
ribitol and threitol, and erythritol was near the higher value of the reference values.
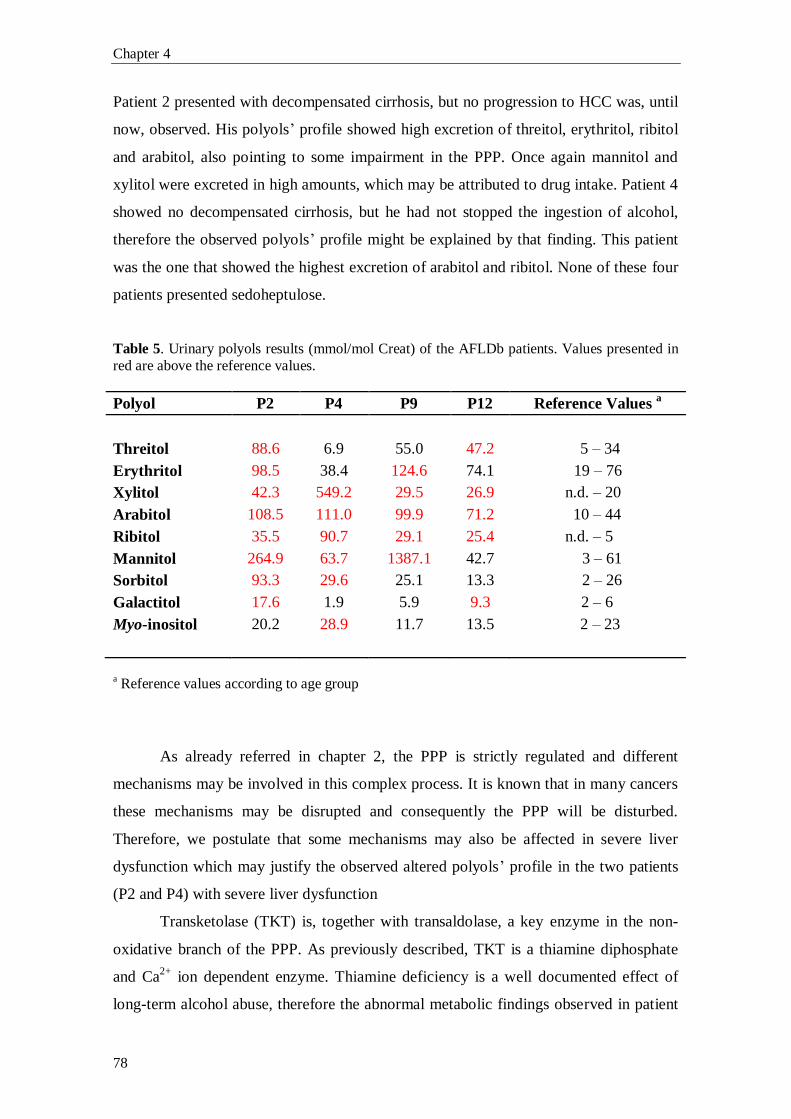
Chapter 4
78
Patient 2 presented with decompensated cirrhosis, but no progression to HCC was, until
now, observed. His polyols’ profile showed high excretion of threitol, erythritol, ribitol
and arabitol, also pointing to some impairment in the PPP. Once again mannitol and
xylitol were excreted in high amounts, which may be attributed to drug intake. Patient 4
showed no decompensated cirrhosis, but he had not stopped the ingestion of alcohol,
therefore the observed polyols’ profile might be explained by that finding. This patient
was the one that showed the highest excretion of arabitol and ribitol. None of these four
patients presented sedoheptulose.
Table 5. Urinary polyols results (mmol/mol Creat) of the AFLDb patients. Values presented in
red are above the reference values.
Polyol P2 P4 P9 P12 Reference Values a
Threitol 88.6 6.9 55.0 47.2 5 – 34
Erythritol 98.5 38.4 124.6 74.1 19 – 76
Xylitol 42.3 549.2 29.5 26.9 n.d. – 20
Arabitol 108.5 111.0 99.9 71.2 10 – 44
Ribitol 35.5 90.7 29.1 25.4 n.d. – 5
Mannitol 264.9 63.7 1387.1 42.7 3 – 61
Sorbitol 93.3 29.6 25.1 13.3 2 – 26
Galactitol 17.6 1.9 5.9 9.3 2 – 6
Myo-inositol 20.2 28.9 11.7 13.5 2 – 23
a Reference values according to age group
As already referred in chapter 2, the PPP is strictly regulated and different
mechanisms may be involved in this complex process. It is known that in many cancers
these mechanisms may be disrupted and consequently the PPP will be disturbed.
Therefore, we postulate that some mechanisms may also be affected in severe liver
dysfunction which may justify the observed altered polyols’ profile in the two patients
(P2 and P4) with severe liver dysfunction
Transketolase (TKT) is, together with transaldolase, a key enzyme in the non-
oxidative branch of the PPP. As previously described, TKT is a thiamine diphosphate
and Ca2+
ion dependent enzyme. Thiamine deficiency is a well documented effect of
long-term alcohol abuse, therefore the abnormal metabolic findings observed in patient
PPP intermediates: a study in adult patients with liver dysfunction
79
4 may be ascribed to vitamin B1 deficiency. If thiamine levels are low, TKT may be
unable of transferring C-1 and C-2 of Xu5P to R5P to form S7P and G3P, or vice versa;
or to transfer the C-1 and C-2 of Xu5P to E4P to form G3P and F6P, or vice versa,
leading to an impaired activity in the PPP and an overall accumulation of the
intermediate metabolites.
In patient 2, cirrhosis was present but in a decompensated form which can
contribute for a more severe impairment of the PPP, leading to the observed
accumulation of several polyols (Table 5).
An overall high excretion of urinary polyols was detected in two of the patients
(P9 and P12) with HCC. Transaldolase deficiency specific biomarkers, sedoheptulose
and/or sedoheptitol, were not presented. Therefore, the hypothesis of a primary defect in
the non-oxidative branch of the PPP was excluded. We may postulate that the
accumulation of the polyols, in these two cases, is a secondary phenomenon resulting
from the disruption of the regulatory mechanisms underlying the PPP. To clarify the
possibility of polyol patterns having a diagnostic value in the characterization of liver
dysfunction, further studies involving a larger cohort of patients are needed. Moreover,
and concerning this clinical phenotype, it will be very interesting to evaluate the effect
on specific enzymes of the PPP, such as G6PD, TKT and probably TKTL1, namely not
only the respective enzymatic activities but also the protein levels. Due to the direct
effect that the PPP deregulation may have in the level of NADPH and its implication on
the maintenance of the ratio of reduced (GSH) / oxidated (GSSG) glutathione, cellular
redox studies will be relevant to the better understanding of the underlying biochemical
processes.
All the studied 14 patients were under personalized therapeutic regimens
according to their clinical situation. Therefore, some of the mild alterations, as well as
some of the major ones, such as high excretion of xylitol and mannitol, components of
drug`s excipients, may be explained by the use of drugs.
In summary, in the light of these preliminary results, and although we have a
small number of patients studied so far, we may postulate that an overall altered
polyols’ profile may be related to liver disease progression and/or severity.
Chapter 4
80
4. Bibliography
[1] G. Bedogni, S. Bellentani, Fatty liver: how frequent is it and why?, Ann.
Hepatol. 3 (2004) 63–5.
[2] G. Bedogni, L. Miglioli, F. Masutti, C. Tiribelli, G. Marchesini, S. Bellentani,
Prevalence of and Risk Factors for Nonalcoholic Fatty Liver Disease: The Dionysios
Nutrition and Liver Study, Hepatology 42 (2005) 44-52.
[3] P. Paschos, K. Paletas, Non alcoholic fatty liver disease and metabolic
syndrome, Hippokratia 13 (2009) 9–19.
[4] E.M. Brunt, Nonalcoholic Steatohepatitis, Semin. Liver Dis. 24 (2004) 3–20.
[5] K. Bogdanova, H. Poczatkova, L. Uherkova, D. Riegrova, M. Rypka, J. Feher,
G. Marchesini, J. Vesely, Non-alcoholic fatty liver disease (NAFLD)--a novel common
aspect of the metabolic syndrome, Biomed. Pap. Med. Fac. Univ. Palacky Olomouc
Czech Repub. 150 (2006) 101–4.
[6] G.C. Farrell, C.Z. Larter, Nonalcoholic fatty liver disease: from steatosis to
cirrhosis, Hepatology 43 (2006) S99–S112.
[7] L. Pácal, J. Tomandl, J. Svojanovsky, D. Krusová, S. Stepánková, J. Rehorová,
J. Olsovsky, J. Belobrádková, V. Tanhäuserová, M. Tomandlová, J. Muzík, K.
Kanková, Role of thiamine status and genetic variability in transketolase and other
pentose phosphate cycle enzymes in the progression of diabetic nephropathy, Nephrol.
Dial. Transplant. 26 (2011) 1229–36
[8] A.K. Samland, G.A. Sprenger, Transaldolase: from biochemistry to human
disease, Int. J. Biochem. Cell. Biol. 41 (2009) 1482–94.
[9] N.M. Verhoeven, J.H. Huck, B. Roos, E.A. Struys, G.S. Salomons, A.C.
Douwes, M.S. van der Knaap, C. Jakobs, Transaldolase deficiency: liver cirrhosis
associated with a new inborn error in the pentose phosphate pathway, Am. J. Hum.
Genet. 68 (2001) 1086–92.
[10] N.M. Verhoeven, M. Wallot, J.H. Huck, O. Dirsch, A. Ballauf, U. Neudorf, G.S.
Salomons, M.S. van der Knaap, T. Voit, C. Jakobs, A newborn with severe liver failure,
cardiomyopathy and transaldolase deficiency, J. Inherit. Metab. Dis. 28 (2005) 169–79.
[11] V. Valayannopoulos, N.M. Verhoeven, M. Karine, G.S. Salomons, S. Daniéle,
M. Gonzales, G. Touati, P. Lonlay, C. Jakobs, J.M. Saudubray, Transaldolase
deficiency: a new case of hydrops fetalis and neonatal multi-organ disease, J. Pediatr.
149 (2006) 713–717.
[12] C.W. Fung, S. Siu, C. Mak, G. Poon, K.Y. Wong, P.T. Cheung, L. Low, S. Tam,
V. Wong, A rare cause of hepatosplenomegaly - Transaldolase deficiency, J. Inherit.
Metab. Dis. 30 (Suppl 1) (2007) 62.
PPP intermediates: a study in adult patients with liver dysfunction
81
[13] M.M. Wamelink, E.A. Struys, G.S. Salomons, D. Fowler, C. Jakobs, P.T.
Clayton, Transaldolase deficiency in a two-year-old boy with cirrhosis, Mol. Genet.
Metab. 94 (2008) 255–8.
[14] A. Tylki-Szymańska, T.J. Stradomska, M.M. Wamelink, G.S. Salomons, J.
Taybert, J. Pawłowska, C. Jakobs, Transaldolase deficiency in two new patients with a
relative mild phenotype, Mol. Genet. Metab. 97 (2009) 15–7.
[15] S. Balasubramaniam, M.M. Wamelink, L.H. Ngu, A. Talib, G.S. Salomons, C.
Jakobs, W.T. Keng, “Novel heterozygous mutations in TALDO1 gene causing
transaldolase deficiency and early infantile liver failure, J. Pediatr. Gastroenterol. Nutr.
52 (2011) 113–6.
[16] W. Eyaid, T. Al Harbi, S. Anazi, M.M. Wamelink, C. Jakobs, M. Al Salammah,
M. Al Balwi, M. Alfadhel, F.S. Alkuraya, Transaldolase deficiency: report of 12 new
cases and further delineation of the phenotype, J. Inherit. Metab. Dis. [Epub ahead of
print] (2013).
[17] R. Hanczko, D.R. Fernandez, E. Doherty, Y. Qian, G. Vas, B. Niland, T.
Telarico, A. Garba, S. Banerjee, F.A. Middleton, D. Barrett, M. Barcza, K. Banki, S.K.
Landas, A. Perl, Prevention of hepatocarcinogenesis and increased susceptibility to
acetaminophen-induced liver failure in transaldolase-deficient mice by N-
acetylcysteine, J. Clin. Invest. 119 (2009) 1546–1557.

CHAPTER 5
Pentose phosphate pathway intermediates in liver
dysfunction: study in a pediatric group

PPP intermediates in liver dysfunction: study in a pediatric group
85
1. Introduction
The pentose phosphate pathway (PPP) regained the attention of the scientific
community after the description by Verhoeven and co-workers [1], in 2001, of the first
patient with an inborn error of metabolism (IEM) in the non-oxidative branch of the
PPP, a transaldolase (TALDO) deficiency.
After the first reported case of TALDO deficiency, 22 other cases have been
reported, until the present date [2-8]. The TALDO deficient patients described in the
literature displayed a quite homogenous clinical picture: liver dysfunction (18/23),
hepatosplenomegaly (22/23), anemia and thrombocytopenia (21/23), dysmorphic
features (17/23) and cardiac problems (20/23). All patients (23/23) had direct or indirect
hepatic alterations of unknown cause.
Although the ribose-5-phosphate isomerase (RPI) deficient patient had no liver
dysfunction or organomegalies, but rather presented a clinical picture of slowly
progressive leukoencephalopathy of unknown origin, accompanied by mild peripheral
polyneuropathy [9], it was the study of the PPP, and more specifically sugars’ and
polyols’ pattern, that made the diagnosis possible. Also a benign condition, L-
arabinosuria, has been described in 2002, in a patient with dysmorphic features and no
liver malfunction [10]. Although this is a benign condition, it was once again the study
of the PPP metabolites that led to the diagnosis.
Taking into account the clinical presentation of those new disorders, namely
TALDO deficiency, the evaluation of urinary profiles of sugars and polyols in patients
presenting liver dysfunction of unknown cause, became a valuable biochemical tool to
unveil diagnosis and new defects associated with the PPP. In order to better understand
the involvement of this metabolic pathway in liver dysfunction and to shed some light
on pathologic significance of altered polyols’ profile, we studied a pediatric group with
liver dysfunction of unknown cause. For that purpose, a joint protocol was established
between our laboratory, Metabolism and Genetics, iMed.UL, at the Faculty of
Pharmacy University of Lisbon and the Department of Metabolic Diseases at Pediatrics
Hospital, at Coimbra.
As far as we know, this is the first study in a Portuguese group of patients with
liver dysfunction regarding the PPP metabolites.
Chapter 5
86
2. Patients
Since the beginning of this collaborative study (June 2012), 11 patients with
hepatic dysfunction of unknown cause were enrolled. The first urine of the morning was
collected during patients’ hospitalization or when they visited the clinician. Samples
were immediately frozen, kept at – 20 ºC and sent in dry ice to the laboratory. Samples
were kept frozen until time of analysis. Polyols and sugars were analyzed by GC-FID
and/or GC-MS as previously described in chapter 3.
Patient 1: a four-month-old girl. She presented clinically with extrahepatic
biliary atresia. She was submitted to Kasai’s procedure, but the surgery was not able to
restore the biliary atresia and her liver disease was rapidly progressing to hepatic
failure.
Patient 2: a seven-month-old girl. She was admitted in the Hospital due to a
biliary atresia with portal hypertension leading to a cirrhotic liver development. At the
date of sample collection, she was awaiting liver transplantation (LT). She also
presented a cytomegalovirus (CMV) infection.
Patient 3: a two-year-old girl. She presented with a congenital CMV infection
with minor alterations of the transaminases levels (normal AST levels; slight elevation
of ALT levels: 45-50; Ref. Val.: 10-25). She presented slight facial dysmorphic features.
Hepatic biopsy revealed the presence of a slight fibrosis – sequelae of CMV infection.
Abdominal echography revealed no morphological alterations of the liver and biliary
tract.
Patient 4: a five-year-old boy. He presented with hepatic dysfunction of
unknown cause, dysmorphic features (low set ears, short neck, enlarged anterior-
posterior thorax), failure to thrive and psychomotor retardation, strabismus and ketotic
hypoglycemia.
Patient 5: a two-year-old boy. He was admitted with hepatic cirrhosis of
unknown cause. He is currently awaiting LT. A brain nuclear magnetic resonance
(NMR) showed calcification of several vertebral arteries. He had a hepatic biopsy
analysis and the results were indicative of an autoimmune hepatitis.
Patient 6: a twelve-year-old boy. He presented with hepatitis of unknown cause
with high levels of copper, but with no criteria for Wilson’s disease. He had normal
transaminases levels and a maintained discrete elevation of urea levels. He has
complains of dizziness, even when lying down.
Patient 7: a ten-year-old girl. She presented a chronic hepatitis of unknown
cause. Her liver biopsy revealed a non-alcoholic steatohepatitis (NASH) with mild
fibrosis.
Patient 8: an eleven-year-old girl. She presented with short stature (136.5 cm;
5-10 percentile) and weight (26.8 Kg; 5 percentile). She presented with elevated
transaminases levels, however no organomegalies (liver and spleen within normal
reference values) or signs of chronic liver dysfunction were observed. She has no intra-
or extra-hepatic biliary atresia. Biochemically she presented normal levels of vitamin
B12 and D, with a slight elevation of vitamin E.
PPP intermediates in liver dysfunction: study in a pediatric group
87
Patient 9: a seventeen-year-old girl. She was admitted with an autoimmune
hepatitis. She has short stature and psychomotor delay with peripheral polyneuropathy
and optical neuropathy.
Patient 10: a twelve-year-old girl. She presented with hepatomegaly, but with no
hepatitis. She has no developmental delay.
Patient 11: a twenty-one-month-old boy born after 35 weeks. He was admitted to
the Hospital with a neonatal colestasis. He had frequent hypoglycemic episodes and
growth retardation, including short stature as well as psychomotor retardation, failure
to thrive, genital dysmorphism, large anterior fontanelle and macrocephaly (relative to
stature). He also presented with anaemia, secondary hypocortisolism and diarrhea. He
has had several childhood infections, but he does not seem to be immunodepressed.
3. Results
Patients were categorized into four groups according to their ages. Because the
excretion of sugars and polyols vary throughout life, the urinary polyols concentrations
displayed in Table 1 are correlated with age-matched reference values.
Among the ten of the patients presented in Table 1 nine did not reveal major
abnormalities in the polyols’ pattern. An interesting finding is that ribitol is elevated in
6 of those patients (60%), being in half of them the only abnormal result.
In patient 4, a slightly elevated excretion of arabitol was also noted. The
presence of ribitol plus arabitol may suggest a mild impairment of the non-oxidative
branch of the PPP. The urinary organic acids analysis revealed no alterations, but peaks
of medication (acetaminophen and phenobarbital) were observed which may affect the
normal PPP metabolism. New samples with the patient out of medication intake must be
collected and analyzed for clarification of the obtained results.
In patient 5, in addition to the elevated excretion of ribitol, a modest increase in
sorbitol and galactitol levels was observed. The presence of these metabolites in
moderated levels has been referred as a consequence and not as a primary cause of liver
malfunction. Very interestingly, it was found in the urinary organic acids profile of this
patient an elevated excretion of ethylmalonic acid, glutaric acid, 3-methyl-glutaric acid,
3-methyl-glutataconic (I and II) acid and 3-hydroxi-3-methyl-glutaric acid, the
hypothesis of a mild form of 3-hydroxy-3-methylglutaryl-CoA lyase deficiency was
raised. The most common signs and symptoms of this condition are: vomiting; diarrhea;
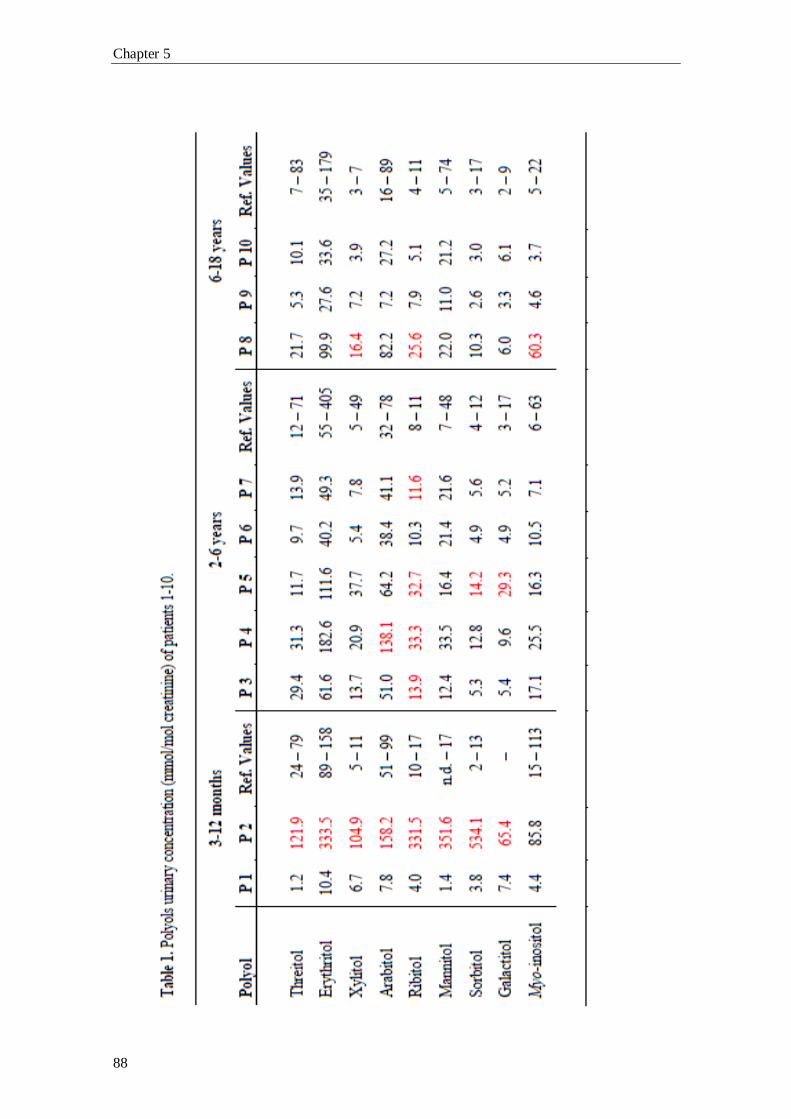
Chapter 5
88
PPP intermediates in liver dysfunction: study in a pediatric group
89
dehydration; lethargy and hypotonia, yet none of these features were present in our
patient. A new urine sample is needed to clarify the organic acids’ profile and also the
carbohydrates’ profile.
Patient 8 displays, in addition to the elevated excretion of ribitol, a slight
elevation in xylitol and myo-inositol excretion. These alterations are only moderate and
are not suggestive of a PPP impairment. No alterations were found in the organic acids’
profile.
Although patient 9 presented no major alterations in the urinary polyols’ profile,
we can observe a tendency to low values. The organic acids’ profile was assessed and it
displayed a mild elevation in methylmalonic acid excretion (24 mmol/mol creatinine;
Ref. Value: <5) and also a mild elevation in 3-methylcrotonylglycine. Taken together,
these results do not point to an impairment of the PPP, or a specific organic aciduria,
but rather a dietary deficiency in vitamins uptake. Further tests are needed to elucidate
the organic acids’ profile.
The patient with the most severe abnormalities in the polyols’ profile was patient
2. She presented an elevation of all, except for myo-inositol, the studied polyols as well
as in the group of sugars analyzed (data not shown). However, no sedoheptulose was
found. Her urinary organic acids profile presented no major abnormalities, although
many unidentified peaks were found (maybe due to patients’ therapeutic regimen). This
polyols’ profile is quite similar to the ones of the four patients reported in chapter 4 with
the most severe liver dysfunction. As previously referred (chapter 2, section 1.7) the
PPP might be enhanced by one, several or a different mechanism, leading to the
exacerbation of the PPP activity which may justify the observed pattern. Since the
analysis of this sample, the patient was submitted to a LT. It would be of the utmost
importance the evaluation of a new urine sample of the patient, in order to evaluate the
sugars’ and polyols’ profile evolution. The collection of new samples has already been
discussed with the patient’s clinician and in a near future it will be re-evaluated.
The most interesting case was patient 11. Patient’s plasmatic acylcarnitines’
profile and urinary organic acids’ and purine and pyrimidines’ profile were assessed,
and no alterations were found. The polyols’ results are presented in Table 2, and they
reveal a strongly elevated excretion of the polyols: erythritol, arabitol and ribitol, plus
galactitol and myo-inositol.
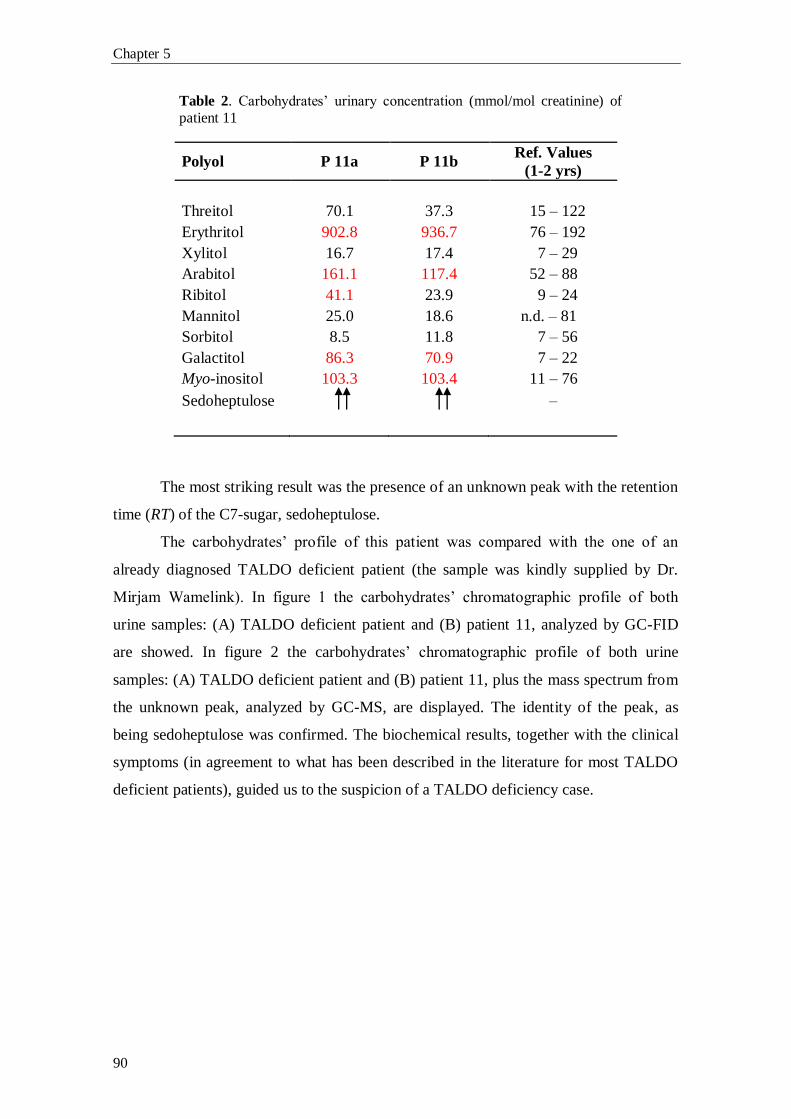
Chapter 5
90
Table 2. Carbohydrates’ urinary concentration (mmol/mol creatinine) of
patient 11
Polyol P 11a P 11b Ref. Values
(1-2 yrs)
Threitol 70.1 37.3 15 – 122
Erythritol 902.8 936.7 76 – 192
Xylitol 16.7 17.4 7 – 29
Arabitol 161.1 117.4 52 – 88
Ribitol 41.1 23.9 9 – 24
Mannitol 25.0 18.6 n.d. – 81
Sorbitol 8.5 11.8 7 – 56
Galactitol 86.3 70.9 7 – 22
Myo-inositol 103.3 103.4 11 – 76
Sedoheptulose –
The most striking result was the presence of an unknown peak with the retention
time (RT) of the C7-sugar, sedoheptulose.
The carbohydrates’ profile of this patient was compared with the one of an
already diagnosed TALDO deficient patient (the sample was kindly supplied by Dr.
Mirjam Wamelink). In figure 1 the carbohydrates’ chromatographic profile of both
urine samples: (A) TALDO deficient patient and (B) patient 11, analyzed by GC-FID
are showed. In figure 2 the carbohydrates’ chromatographic profile of both urine
samples: (A) TALDO deficient patient and (B) patient 11, plus the mass spectrum from
the unknown peak, analyzed by GC-MS, are displayed. The identity of the peak, as
being sedoheptulose was confirmed. The biochemical results, together with the clinical
symptoms (in agreement to what has been described in the literature for most TALDO
deficient patients), guided us to the suspicion of a TALDO deficiency case.
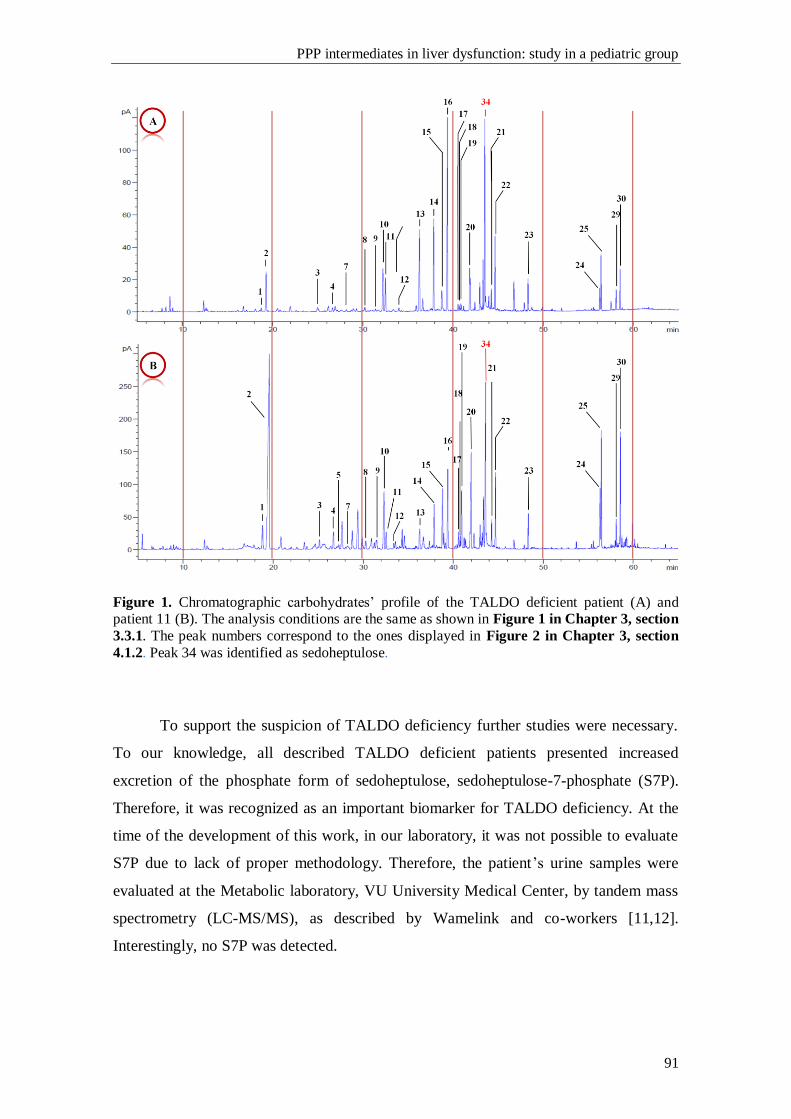
PPP intermediates in liver dysfunction: study in a pediatric group
91
Figure 1. Chromatographic carbohydrates’ profile of the TALDO deficient patient (A) and patient 11 (B). The analysis conditions are the same as shown in Figure 1 in Chapter 3, section
3.3.1. The peak numbers correspond to the ones displayed in Figure 2 in Chapter 3, section
4.1.2. Peak 34 was identified as sedoheptulose.
To support the suspicion of TALDO deficiency further studies were necessary.
To our knowledge, all described TALDO deficient patients presented increased
excretion of the phosphate form of sedoheptulose, sedoheptulose-7-phosphate (S7P).
Therefore, it was recognized as an important biomarker for TALDO deficiency. At the
time of the development of this work, in our laboratory, it was not possible to evaluate
S7P due to lack of proper methodology. Therefore, the patient’s urine samples were
evaluated at the Metabolic laboratory, VU University Medical Center, by tandem mass
spectrometry (LC-MS/MS), as described by Wamelink and co-workers [11,12].
Interestingly, no S7P was detected.
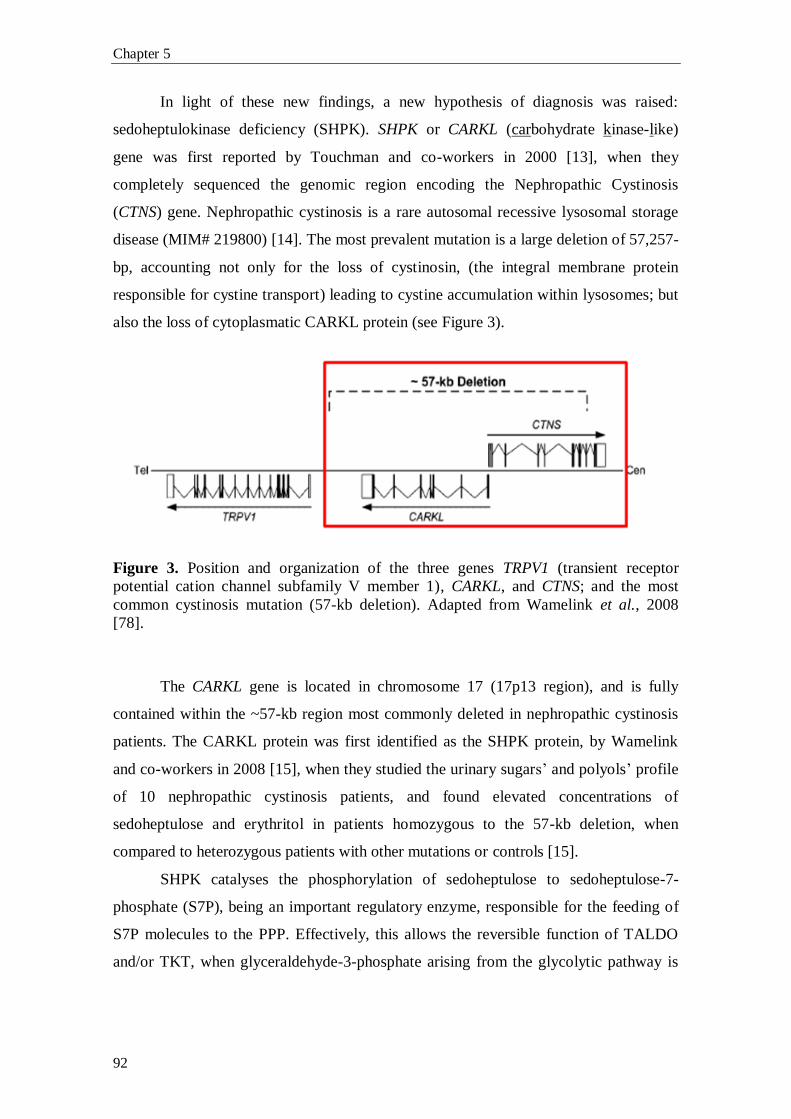
Chapter 5
92
In light of these new findings, a new hypothesis of diagnosis was raised:
sedoheptulokinase deficiency (SHPK). SHPK or CARKL (carbohydrate kinase-like)
gene was first reported by Touchman and co-workers in 2000 [13], when they
completely sequenced the genomic region encoding the Nephropathic Cystinosis
(CTNS) gene. Nephropathic cystinosis is a rare autosomal recessive lysosomal storage
disease (MIM# 219800) [14]. The most prevalent mutation is a large deletion of 57,257-
bp, accounting not only for the loss of cystinosin, (the integral membrane protein
responsible for cystine transport) leading to cystine accumulation within lysosomes; but
also the loss of cytoplasmatic CARKL protein (see Figure 3).
Figure 3. Position and organization of the three genes TRPV1 (transient receptor
potential cation channel subfamily V member 1), CARKL, and CTNS; and the most
common cystinosis mutation (57-kb deletion). Adapted from Wamelink et al., 2008
[78].
The CARKL gene is located in chromosome 17 (17p13 region), and is fully
contained within the ~57-kb region most commonly deleted in nephropathic cystinosis
patients. The CARKL protein was first identified as the SHPK protein, by Wamelink
and co-workers in 2008 [15], when they studied the urinary sugars’ and polyols’ profile
of 10 nephropathic cystinosis patients, and found elevated concentrations of
sedoheptulose and erythritol in patients homozygous to the 57-kb deletion, when
compared to heterozygous patients with other mutations or controls [15].
SHPK catalyses the phosphorylation of sedoheptulose to sedoheptulose-7-
phosphate (S7P), being an important regulatory enzyme, responsible for the feeding of
S7P molecules to the PPP. Effectively, this allows the reversible function of TALDO
and/or TKT, when glyceraldehyde-3-phosphate arising from the glycolytic pathway is
PPP intermediates in liver dysfunction: study in a pediatric group
93
used by the PPP, when increased amounts of NADPH and/or ribose moieties are needed
for nucleotides production.
The CARKL/SHPK gene was studied in collaboration with the VU University
Medical Center. Total RNA was extracted from whole blood samples of the patient and
his mother, reverse transcribed into cDNA and then PCR amplified. The open reading
frame (ORF) of the SHPK gene and the splice sites have also been analyzed by
sequence analysis of genomic DNA, and a nonsense mutation, c.355C>T (p.R119X),
leading to a truncated non-functional protein, was found in homozygosity. The mother
was found to be a carrier for the same mutation. DNA sample from the father was not
available for mutational analysis. TALDO1 gene was also sequenced for differential
diagnosis purpose, but no pathogenic mutations were detected. The activity of SHPK
was measured in fibroblast homogenates and a strongly reduced formation of S7P was
detected (2.9 nmol/hour/mg protein; controls 20-54), indicating SHPK deficiency. To
the present date, only two patients, the patient described above and a Dutch baby girl
(Wamelink, personal communication), were found. Further tests are needed to fully
characterize this patient, once the high frequency of this c.355C>T variant, 8/4292
European control individuals (http://evs.gs.washington.edu/EVS/), does not suggest it
might be responsible for an inborn error of PPP metabolism showing a severe
phenotype.
4. Final remarks
The study of the urinary profile of sugars and polyols, as Verhoeven and co-
workers clearly shown, in 2001, is of the upmost importance not only for diagnostic
purposes, but also for a better understanding of the cellular mechanisms. However, at
present, the study of sugars’ and polyols’ profile is not yet done as a routine diagnostic
workup in patients with liver disease of unknown cause.
The evaluation of sugars and polyols among the group of selected patients
revealed two interesting situations: patient 11 seems to possess a new inborn error of
metabolism at the SHPK enzyme level. Until now, as much as we know, an isolated
defect in the SHPK enzyme has never been described. Further studies are still in course
to fully establish the defect and its link with the patient`s clinical phenotype.
Furthermore, patient 2 revealed a very interesting profile associated with a severe form
Chapter 5
94
of liver disease, which is in accordance with our previous observations concerning the
adult patients (chapter 4). Further studies are necessary for the clarification of these
cases.
PPP intermediates in liver dysfunction: study in a pediatric group
95
5. Bibliography
[1] N.M. Verhoeven, J.H. Huck, B. Roos, E.A. Struys, G.S. Salomons, A.C.
Douwes, M.S. van der Knaap, C. Jakobs, Transaldolase deficiency: liver cirrhosis
associated with a new inborn error in the pentose phosphate pathway, Am. J. Hum.
Genet. 68 (2001) 1086–92.
[2] N.M. Verhoeven, M. Wallot, J.H. Huck, O. Dirsch, A. Ballauf, U. Neudorf, G.S.
Salomons, M.S. van der Knaap, T. Voit, C. Jakobs, A newborn with severe liver failure,
cardiomyopathy and transaldolase deficiency, J. Inherit. Metab. Dis. 28 (2005) 169–79.
[3] V. Valayannopoulos, N.M. Verhoeven, M. Karine, G.S. Salomons, S. Daniéle,
M. Gonzales, G. Touati, P. Lonlay, C. Jakobs, J.M. Saudubray, Transaldolase
deficiency: a new case of hydrops fetalis and neonatal multi-organ disease, J. Pediatr.
149 (2006) 713–717.
[4] C.W. Fung, S. Siu, C. Mak, G. Poon, K.Y. Wong, P.T. Cheung, L. Low, S. Tam,
V. Wong, A rare cause of hepatosplenomegaly - Transaldolase deficiency, J. Inherit.
Metab. Dis. 30 (Suppl 1) (2007) 62.
[5] M.M. Wamelink, E.A. Struys, G.S. Salomons, D. Fowler, C. Jakobs, P.T.
Clayton, Transaldolase deficiency in a two-year-old boy with cirrhosis, Mol. Genet.
Metab. 94 (2008) 255–8.
[6] A. Tylki-Szymańska, T.J. Stradomska, M.M. Wamelink, G.S. Salomons, J.
Taybert, J. Pawłowska, C. Jakobs, Transaldolase deficiency in two new patients with a
relative mild phenotype, Mol. Genet. Metab. 97 (2009) 15–7.
[7] S. Balasubramaniam, M.M. Wamelink, L.H. Ngu, A. Talib, G.S. Salomons, C.
Jakobs, W.T. Keng, “Novel heterozygous mutations in TALDO1 gene causing
transaldolase deficiency and early infantile liver failure, J. Pediatr. Gastroenterol. Nutr.
52 (2011) 113–6.
[8] W. Eyaid, T. Al Harbi, S. Anazi, M.M. Wamelink, C. Jakobs, M. Al Salammah,
M. Al Balwi, M. Alfadhel, F.S. Alkuraya, Transaldolase deficiency: report of 12 new
cases and further delineation of the phenotype, J. Inherit. Metab. Dis. [Epub ahead of
print] (2013).
Chapter 5
96
[9] M.S. van der Knaap, R.A. Wevers, E.A. Struys, N.M. Verhoeven, P.J. Pouwels,
U.F. Engelke, W. Feikema, J. Valk, and C. Jakobs. Leukoencephalopathy Associated
with a Disturbance in the Metabolism of Polyols, Ann. Neurol. 46 (1999) 925–928.
[10] W. Onkenhout, J.E. Groener, N.M. Verhoeven, C. Yin, L.A. Laan, L-
Arabinosuria: a new defect in human pentose metabolism, Mol. Genet. Metab. 77
(2002) 80–85.
[11] M.M Wamelink, D.E. Smith, C. Jakobs, N.M. Verhoeven, Analysis of polyols in
urine by liquid chromatography-tandem mass spectrometry: a useful tool for recognition
of inborn errors affecting polyol metabolism, J. Inherit. Metab. Dis. 28 (2005) 951-63.
[12] M.M Wamelink, D.E. Smith, E.E. Jansen, N.M. Verhoeven, E.A. Struys, C.
Jakobs, Detection of transaldolase deficiency by quantification of novel seven-carbon
chain carbohydrate biomarkers in urine, J. Inherit. Metab. Dis. 30 (2007) 735-42.
[13] J.W. Touchman, Y. Anikster, N.L. Dietrich, V.V. Maduro, G. McDowell, V.
Shotelersuk, G.G. Bouffard, S.M. Beckstrom-Sternberg, W.A. Gahl, E.D. Green ED,
The genomic region encompassing the nephropathic cystinosis gene (CTNS): complete
sequencing of a 200-kb segment and discovery of a novel gene within the common
cystinosis-causing deletion, Genome Res. 10(2000)165-73.
[14] M. Town, G. Jean, S. Cherqui, M. Attard, L. Forestier, S.A. Whitmore, D.F.
Callen, O. Gribouval, M. Broyer, G.P. Bates, W. van't Hoff, C. Antignac, A novel gene
encoding an integral membrane protein is mutated in nephropathic cystinosis, Nat.
Genet. 18 (1998) 319-24.
[15] M.M. Wamelink, E.A. Struys, E.E. Jansen, E.N. Levtchenko, F.S. Zijlstra, U.
Engelke, H.J. Blom, C. Jakobs, R.A. Wevers, Sedoheptulokinase deficiency due to a 57-
kb deletion in cystinosis patients causes urinary accumulation of sedoheptulose:
elucidation of the CARKL gene, Hum. Mutat. 29 (2008) 532-6.

CHAPTER 6
Final remarks and perspectives

Final remarks and perspectives
99
Final remarks
In the last 15 years the understanding of the biochemical alterations associated
with disruption of the pentose phosphate pathway (PPP), due to primary or secondary
causes, regained the attention of the scientific community with the description of two
new inborn errors of metabolism in the non-oxidative branch of the PPP: ribose-5-
phosphate isomerase deficiency and transaldolase deficiency. Further attention has been
paid to sugars’ and polyols’ profiles. Biomarkers, as well as chromatographic profiles
for other specific defects in the PPP, such as L-arabinosuria and essential pentosuria,
were established. The evaluation of sugars and polyols also became relevant for the
diagnosis and follow up of therapeutic effectiveness of other carbohydrates related
diseases (Diabetes Mellitus and Galactosemia), and also for the study of liver and
kidney diseases of unknown cause.
The development and validation of the GC-FID method described in chapter 3,
was achieved with full success since the objectives were accomplished, i.e. excellent
resolution and reproducibility of the chromatographic parameters and overall precision.
Therefore, the optimized method fulfills the requirements to be used in the screening of
PPP defects and to the study of metabolic disturbances in sugars and polyols pathways.
The evaluation of the metabolic profiles, within the pediatric group of patients,
unraveled a new disorder in the PPP: sedoheptulokinase (SHPK) deficiency. Further
studies seem to confirm the genetic defect and, to our knowledge, this is the first
reported case of isolated SHPK deficiency. Interestingly, a second patient has now been
found (Wamelink, personal communication). Nevertheless, the patients` clinical signs
and symptoms are not fully coincident. So, the association of the genotype with the
observed clinical phenotype needs to be clarified and additional studies are required.
Moreover, the cross analysis of the results of the two studied groups, adults
(chapter 4) and children (chapter 5) with liver dysfunction, pointed to an important
role of sugars and polyols metabolites on the assessment of liver dysfunction
progression and/or its severity.
Final remarks and perspectives
100
Perspectives
Taking together the work developed along chapters 3, 4 and 5 aiming to explore
the role of the PPP biomarkers in metabolic dysfunction, several questions were raised
that need to be answered, either from a strict analytical point of view or in the scope of
the cellular mechanisms. This knowlegde will surely lead to a better understanding of
the relationship between the altered PPP patterns and liver disease.
The two groups of patients - adults and children - with liver dysfunction revealed
interesting findings. The significance of the altered sugar and polyol pattern, observed
in association with liver dysfunction progression and severity, needs to be evaluated in a
largest cohort of patients. Only then, it will be possible to confirm or refute our
preliminary results which allowed us to raise the hypothesis that polyols may be
regarded as predictive biomarkers of progression of liver disease to hepatocellular
carcinoma.
The discovery of a new defect in the PPP, the isolated form of SHPK deficiency,
clearly pointed to the relevance of the evaluation, as a first screening, of the urinary
sugar and polyol metabolites in patients with liver dysfunction. Therefore, the analysis
of those intermediates will be integrated into the screening panel of metabolic tests in
course in the laboratory of Metabolism and Genetics at FFUL, contributing to the
expansion of inborn errors of metabolism screening tests offered in Portugal. However,
efforts need to be put on the development of analytical methods (HPLC or LC-MS/MS)
that will allow the evaluation of sugar phosphate forms, since these compounds are
crucial for the differential diagnosis among the PPP defects. Furthermore, the evaluation
of some of the carbohydrates metabolites, such as galactitol and sorbitol, gained
relevance in the control of galactosemia and diabetes mellitus therapeutic regimens,
respectively.
The importance of the PPP towards the redox status of the cell, as the leader
pathway in the production of NADPH, clearly suggests that the study of redox status
markers will be an area to be explored, aiming the better understanding of the cellular
effects caused by PPP disruption. Furthermore, the processes involved in the PPP
regulation are far from being fully understood. The PPP turns out to be a target of great
interest in liver disease, including cancer, and the possibility of proceeding with this
preliminary work is crucial and promising.
Acknowledgments/Agradecimentos
101
Acknowledgements/Agradecimentos
Este mestrado foi uma longa viagem e finalmente o fruto de tanto trabalho,
tristezas e alegrias está materializado sobre a forma deste manuscrito que de muito me
orgulho. Durante todas as viagens conhecemos locais, pessoas e experienciamos as mais
variadas situações e emoções. Nesta “pequena” viagem que foi o meu trabalho e
consequente tese de mestrado, e apesar de não terem sido muitos os locais visitados,
muitas foram as pessoas que nela entraram e que a tornaram única e importante. A elas
dedico esta tese e a elas espero fazer justiça na altura de agradecer.
Antes de mais, o meu primeiro e profundo agradecimento à minha orientadora, a
Prof. Doutora Isabel Tavares de Almeida. Muito obrigado por acreditar em mim e no
meu trabalho, pelo apoio, conselhos, amizade, orientação crítica e por me ter
disponibilizado o espaço e as ferramentas necessárias ao desenvolvimento de todo o
trabalho experimental e criativo que levou tanto ao meu crescimento científico como
pessoal.
Um agradecimento muito especial à Prof. Doutora Isabel Rivera. Um enorme
obrigado por todos os conselhos, ensinamentos, críticas, incansável disponibilidade e
acima de tudo pela grande amizade que tem tido ao longo destes anos para comigo.
I would like to express my deep gratitude to Prof. Dr. Cornelis Jakobs, Prof. Dr.
Gajja Salomons and Prof. Dr. Henk Blom for all your advices, and for giving me the
opportunity to work in your lab and learn the analytical methods that allowed the
development of this work. A special thanks to Dr. Mirjam Wamelink, for all the advices
and invaluable teachings in the pentose phosphate pathway area.
Gostaria de deixar um agradecimento muito especial à Drª Luisa Diogo e Drª
Helena Cortez-Pinto pelo apoio, ensinamentos e constantes trocas de informação sobre
os “nossos” doentes. Muito obrigado pela vossa imprescindível ajuda, sem vós esta tese
não seria possível.
Acknowledgments/Agradecimentos
102
Gostaria de agradecer aos meus amigos e colegas do grupo Met&Gen com quem
passo tantas horas do meu dia de trabalho, e com quem adoro passar tantas outras fora
do mesmo. A todos vocês um enorme obrigado.
À Ana Serrão (um enorme obrigado por seres assim: um poço de bondade e
amizade. São tantos os dias e horas que passamos juntos que sinto que somos família.
Obrigado pelas nossas conversas sérias e malucas (haverá sempre carnitinas!), jantares e
almoços, pelos inúmeros conselhos e enorme amizade); Cristina (um enorme obrigado
por toda a tua ajuda e conselhos, pela tua sempre boa disposição e alguma maluquice
que contagia todos os que estão ao pé de ti e acima de tudo pela tua amizade); Marco
(obrigado pelo partilhar do fardo das rotinas em tantas ocasiões, permitindo-me
concentrar nos “meus” açucares. É assustador quando do nada começamos a cantarolar
(inevitavelmente uma má canção) ao mesmo tempo. Muito obrigado pela tua amizade),
Israel (um enorme obrigado pelos conselhos e pela boa disposição que sempre
apresentas, nem sempre sendo esse o teu estado de espírito. Obrigado pelos almoços,
lanches e jantares e acima de tudo pela tua grande amizade), Joana, Liliana e Luciana
muito obrigado pelo vosso apoio e amizade.
Gostaria ainda de agradecer às colegas e amigas do grupo do DNA: Madalena
(tu foste a minha primeira colega de bancada e como tal jamais esquecerei as tuas
gargalhadas e enorme alegria com que contagias quem te rodeia); Hana Pereira e Sandra
Brasil (muito obrigado pela enorme amizade e pelas nossas conversas divertidas ao
longo destes anos).
Aos colegas e amigos do grupo das proteínas: Marisa, Henrique, Paulo, João
Leandro, Mariana, João Vicente e Ana Isabel pelos bons tempos passados em almoços e
jantares, congressos e viagens, e pelas inúmeras conversas divertidas que tivemos um
enorme obrigado.
Às professoras do grupo Met&Gen: Prof. Doutora Maria João Silva, Paula
Leandro, Margarida Leite, Margarida Silva e Rita Castro o meu profundo
agradecimento por todos os ensinamentos que me transmitiram ao longo deste percurso,
pelas críticas sempre construtivas e pela amizade.
Às minhas colegas de laboratório: D. Amélia Pereira (muito obrigado por toda a
amizade e pelos bons conselhos que me deu e que me permitiram crescer como pessoa),
D. Conceição (obrigado pela constante preocupação pelo meu bem estar, pelas
conversas bem dispostas e pela amizade) Drª Elisa e D. Lucinda muito obrigado pelo
vosso apoio e amizade.
Acknowledgments/Agradecimentos
103
Quero ainda agradecer à Andreia Luz (muito obrigado pelo teu enorme apoio ao
longo deste tempo, pelas nossas corridinhas, pelos jantares e conselhos e acima de tudo
pela tua amizade); Andreia Carvalho (a menina do “outro” grupo, mas que sempre vinha
dar um olá e 3 dedinhos de conversa. Muito obrigado pela sempre boa disposição e
enorme amizade) e Ana Pinheiro (muito obrigado pelo teu grande apoio e pelos
conselhos).
Um agradecimento muito especial à Sara pelas inúmeras conversas que tivemos,
as conversas completamente non-sense e exageradas e as de discussão de trabalho; as
piadas tão secas e as gargalhadas de ficar com dores nos maxilares. Muito obrigado pela
tua amizade. À Paula um enorme obrigado pelas conversas e conselhos, brincadeiras e
piadas non-sense. Muito obrigado ainda pelos almoços e jantares maravilhosos e pela
sempre boa companhia. As nossas sessões de cinema e os períodos musicais criativos
serão sempre uma alegria. Muito obrigado pela tua grande amizade. Ao Ruben Esse um
grande obrigado pelos teus conselhos (que tenho sempre em conta), pelas viagens, pelos
almoços, petiscos e jantares, pelas sessões de cinema, pelas sessões de corrida e acima
de tudo pela tua amizade. Ao Nicolau um especial agradecimento pelas conversas até
altas horas sobre tudo e nada, mas sempre interessantes. Obrigado pelas escolhas
cinematográficas que me introduziram no mundo dos clássicos e pelas viagens
musicais. Acima de tudo obrigado pela tua amizade.
Por último um agradecimento muito especial à minha família. Ao meu irmão
Emilio e Diana um grande obrigado por todo o apoio e conselhos. Obrigado mano por
sempre teres uma palavra inteligente e amiga a dar. Aos meus pais, o meu mais especial
e profundo agradecimento. Esta tese é tanto minha quanto vossa. Foi graças aos vossos
conselhos, incentivos e à confiança que me transmitiram que cheguei aqui. A vocês o
meu maior obrigado.


Annexes

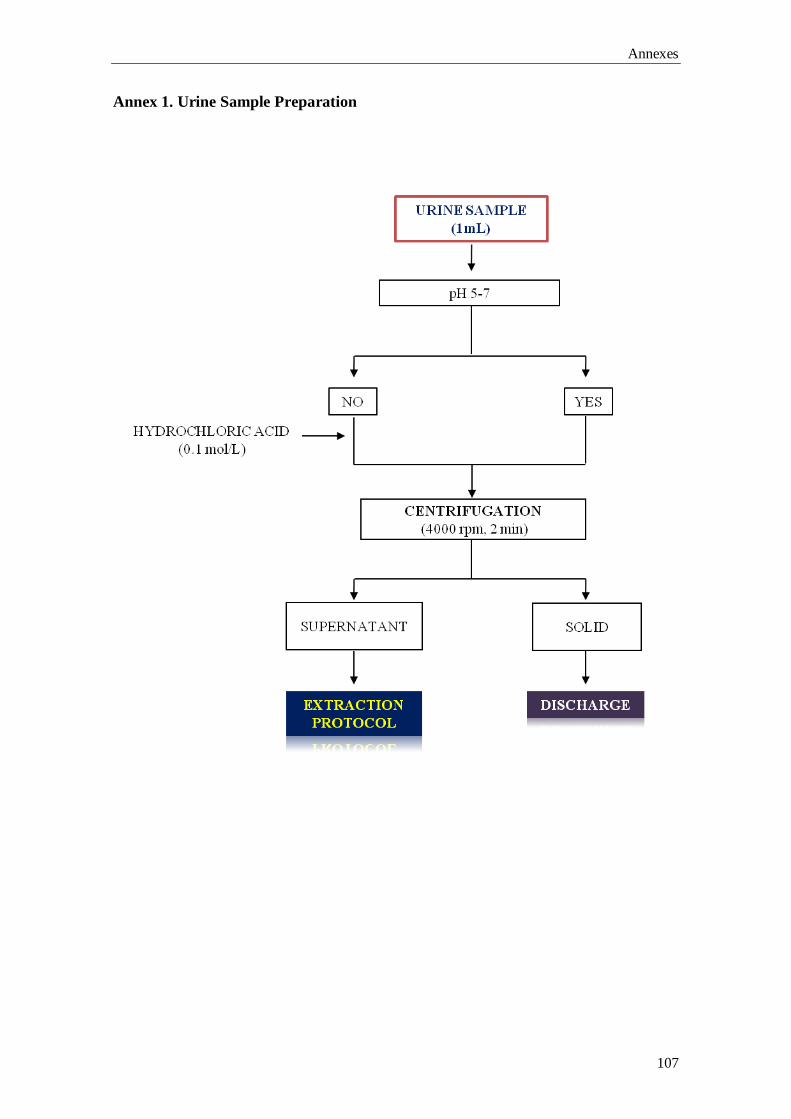
Annexes
107
Annex 1. Urine Sample Preparation
DISCHARGE
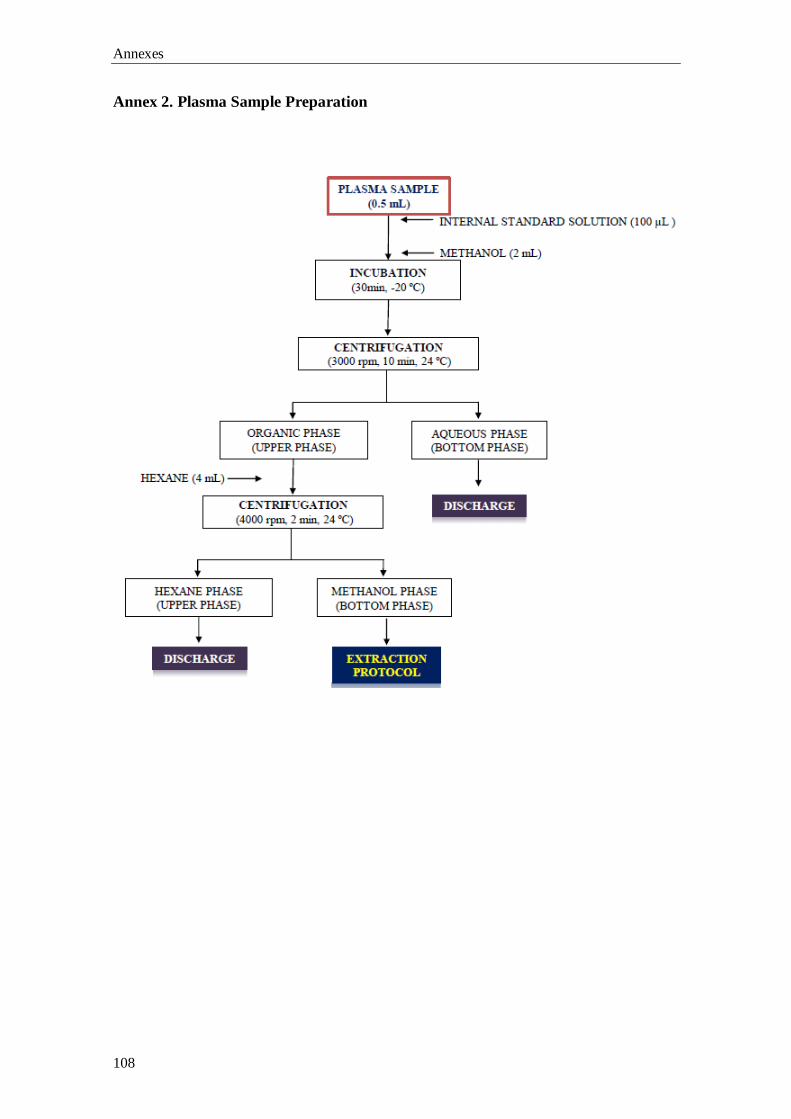
Annexes
108
Annex 2. Plasma Sample Preparation
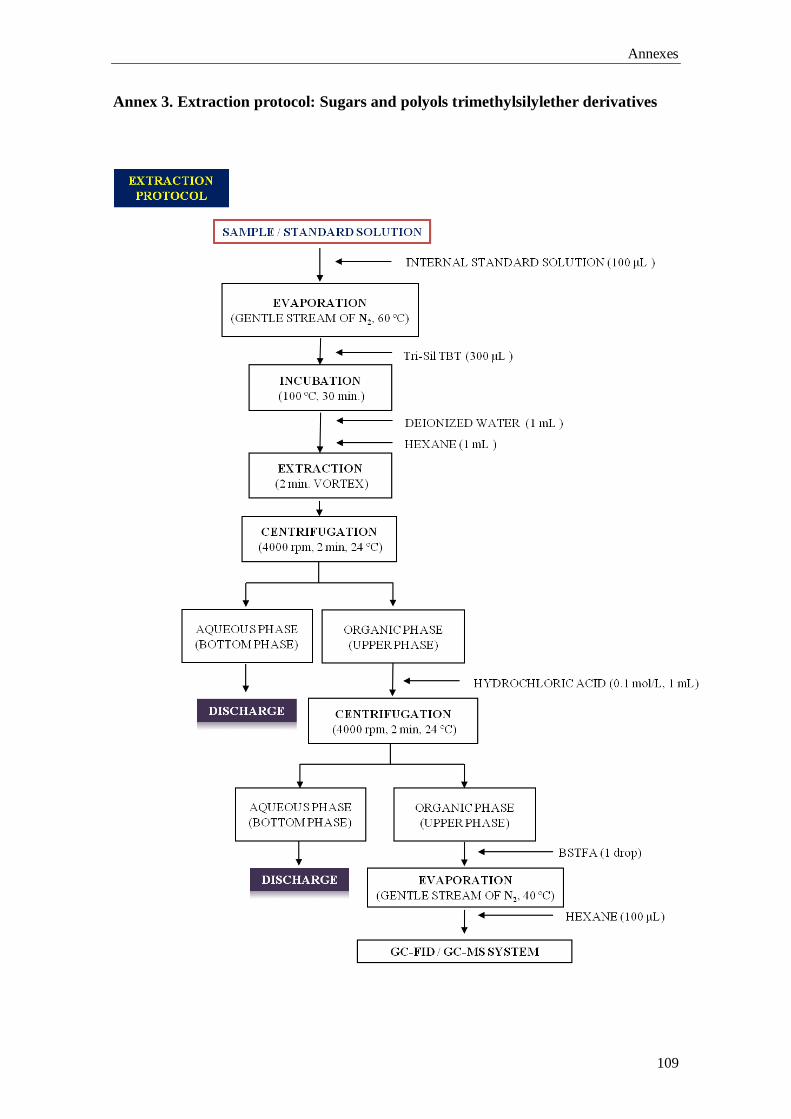
Annexes
109
Annex 3. Extraction protocol: Sugars and polyols trimethylsilylether derivatives
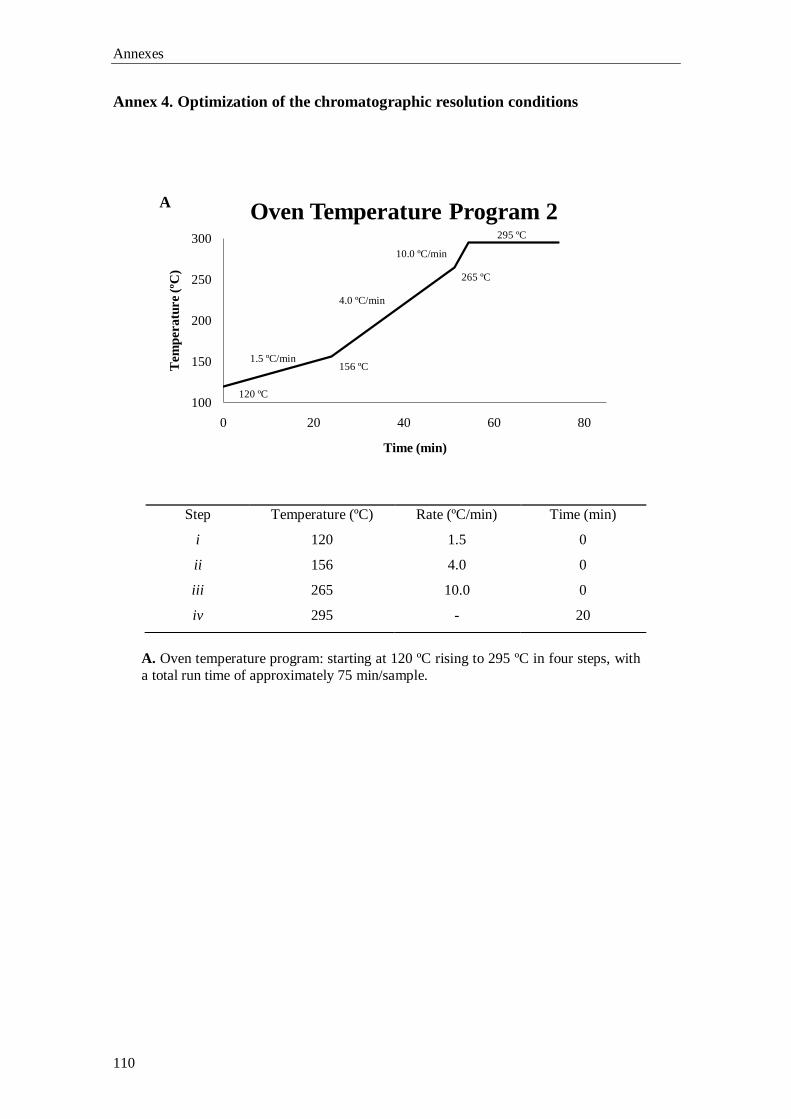
Annexes
110
100
150
200
250
300
0 20 40 60 80
Tem
peratu
re (
ºC)
Time (min)
Oven Temperature Program 2
Annex 4. Optimization of the chromatographic resolution conditions
A. Oven temperature program: starting at 120 ºC rising to 295 ºC in four steps, with
a total run time of approximately 75 min/sample.
Step Temperature (ºC) Rate (ºC/min) Time (min)
i 120 1.5 0
ii 156 4.0 0
iii 265 10.0 0
iv 295 - 20
A
120 ºC
156 ºC
265 ºC
295 ºC
1.5 ºC/min
4.0 ºC/min
10.0 ºC/min
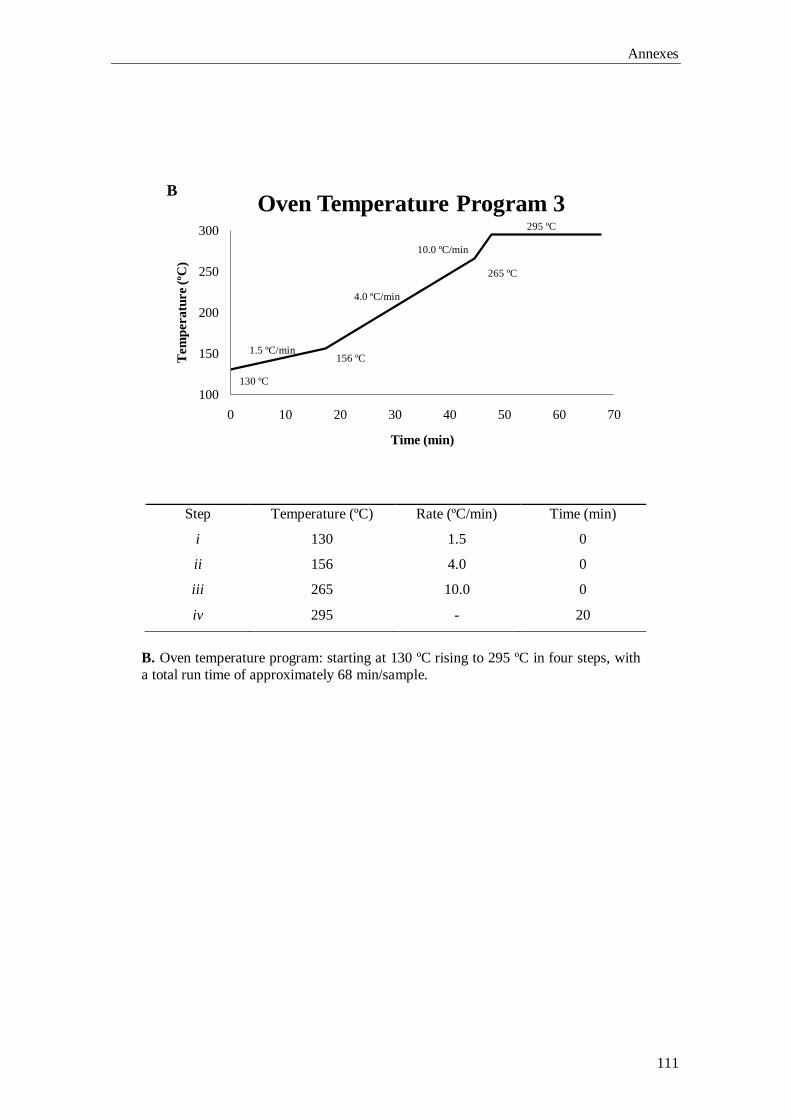
Annexes
111
100
150
200
250
300
0 10 20 30 40 50 60 70
Tem
peratu
re (
ºC)
Time (min)
Oven Temperature Program 3
B. Oven temperature program: starting at 130 ºC rising to 295 ºC in four steps, with
a total run time of approximately 68 min/sample.
Step Temperature (ºC) Rate (ºC/min) Time (min)
i 130 1.5 0
ii 156 4.0 0
iii 265 10.0 0
iv 295 - 20
B
130 ºC
156 ºC
265 ºC
295 ºC
1.5 ºC/min
4.0 ºC/min
10.0 ºC/min
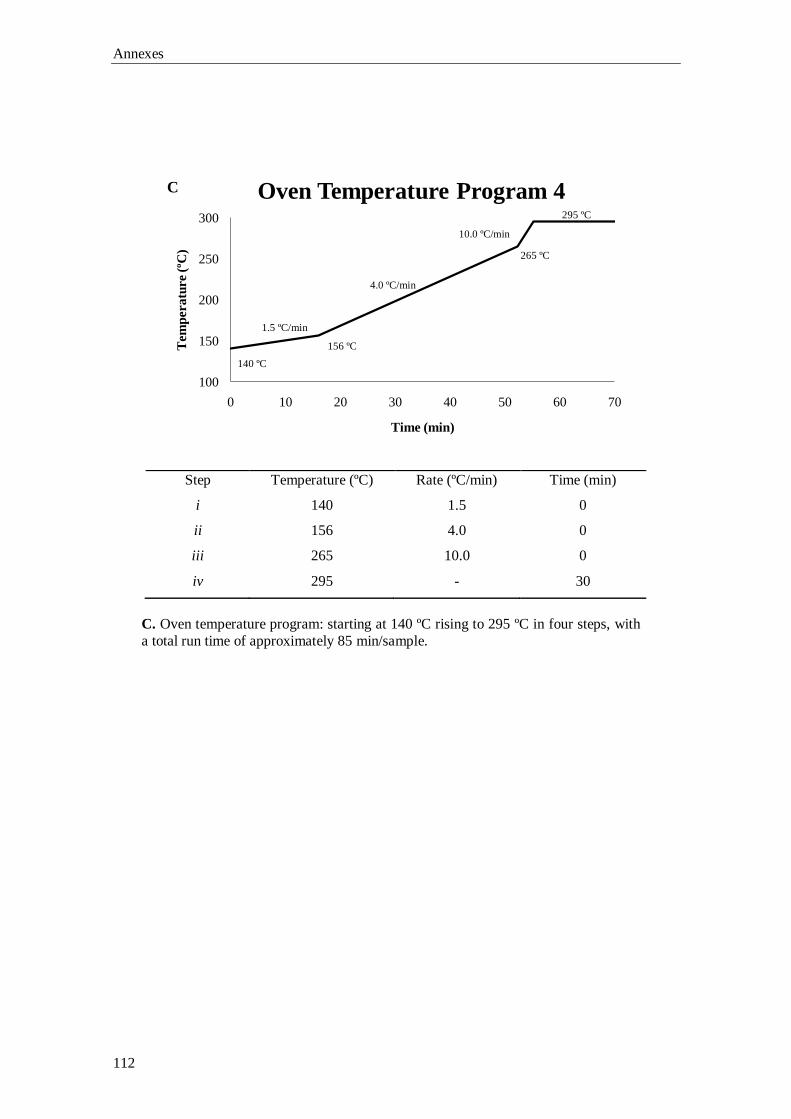
Annexes
112
100
150
200
250
300
0 10 20 30 40 50 60 70
Tem
peratu
re (
ºC)
Time (min)
Oven Temperature Program 4
C. Oven temperature program: starting at 140 ºC rising to 295 ºC in four steps, with
a total run time of approximately 85 min/sample.
Step Temperature (ºC) Rate (ºC/min) Time (min)
i 140 1.5 0
ii 156 4.0 0
iii 265 10.0 0
iv 295 - 30
C
140 ºC
156 ºC
265 ºC
295 ºC
1.5 ºC/min
4.0 ºC/min
10.0 ºC/min
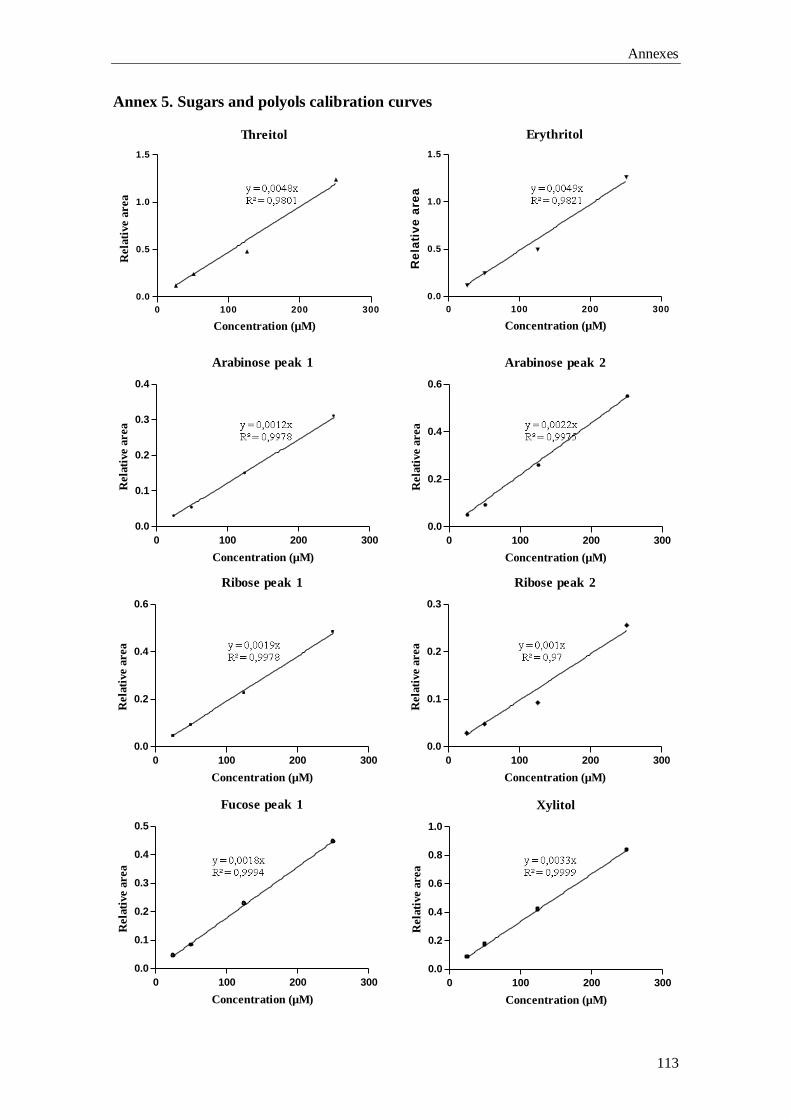
Annexes
113
Annex 5. Sugars and polyols calibration curves
Erythritol
0 100 200 300
0.0
0.5
1.0
1.5
Concentration (µM)
Re
lati
ve
are
a
Threitol
0 100 200 300
0.0
0.5
1.0
1.5
Concentration (µM)
Rela
tive a
rea
Arabinose peak 1
0 100 200 300
0.0
0.1
0.2
0.3
0.4
Concentration (µM)
Rela
tive a
rea
Arabinose peak 2
0 100 200 300
0.0
0.2
0.4
0.6
Concentration (µM)
Rela
tive a
rea
Ribose peak 1
0 100 200 300
0.0
0.2
0.4
0.6
Concentration (µM)
Rela
tive a
rea
Ribose peak 2
0 100 200 300
0.0
0.1
0.2
0.3
Concentration (µM)
Rela
tive a
rea
Fucose peak 1
0 100 200 300
0.0
0.1
0.2
0.3
0.4
0.5
Concentration (µM)
Rela
tive a
rea
Xylitol
0 100 200 300
0.0
0.2
0.4
0.6
0.8
1.0
Concentration (µM)
Rela
tive a
rea
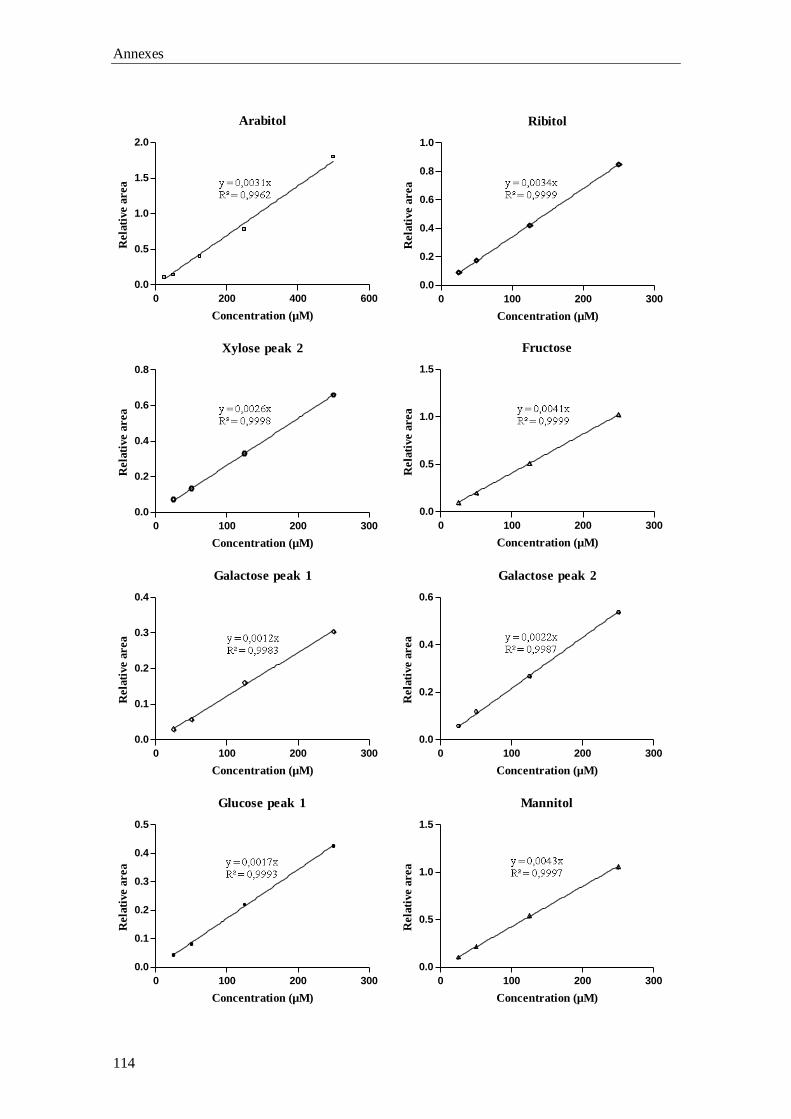
Annexes
114
Ribitol
0 100 200 300
0.0
0.2
0.4
0.6
0.8
1.0
Concentration (µM)
Rela
tive a
rea
Xylose peak 2
0 100 200 300
0.0
0.2
0.4
0.6
0.8
Concentration (µM)
Rela
tive a
rea
Fructose
0 100 200 300
0.0
0.5
1.0
1.5
Concentration (µM)
Rela
tive a
rea
Galactose peak 1
0 100 200 300
0.0
0.1
0.2
0.3
0.4
Concentration (µM)
Rela
tive a
rea
Glucose peak 1
0 100 200 300
0.0
0.1
0.2
0.3
0.4
0.5
Concentration (µM)
Rela
tive a
rea
Galactose peak 2
0 100 200 300
0.0
0.2
0.4
0.6
Concentration (µM)
Rela
tive a
rea
Arabitol
0 200 400 600
0.0
0.5
1.0
1.5
2.0
Concentration (µM)
Rela
tive a
rea
Mannitol
0 100 200 300
0.0
0.5
1.0
1.5
Concentration (µM)
Rela
tive a
rea
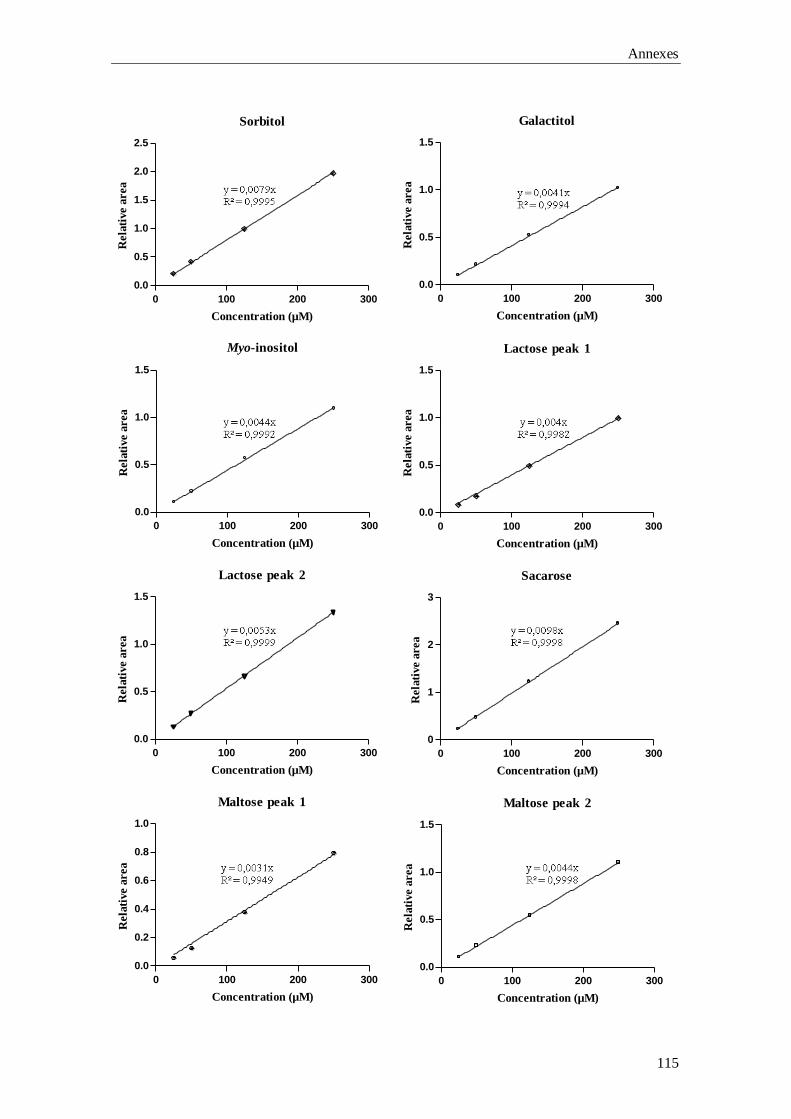
Annexes
115
Myo-inositol
0 100 200 300
0.0
0.5
1.0
1.5
Concentration (µM)
Rela
tive a
rea
Lactose peak 1
0 100 200 300
0.0
0.5
1.0
1.5
Concentration (µM)
Rela
tive a
rea
Sacarose
0 100 200 300
0
1
2
3
Concentration (µM)
Rela
tive a
rea
Maltose peak 1
0 100 200 300
0.0
0.2
0.4
0.6
0.8
1.0
Concentration (µM)
Rela
tive a
rea
Maltose peak 2
0 100 200 300
0.0
0.5
1.0
1.5
Concentration (µM)
Rela
tive a
rea
Sorbitol
0 100 200 300
0.0
0.5
1.0
1.5
2.0
2.5
Concentration (µM)
Rela
tive a
rea
Galactitol
0 100 200 300
0.0
0.5
1.0
1.5
Concentration (µM)
Rela
tive a
rea
Lactose peak 2
0 100 200 300
0.0
0.5
1.0
1.5
Concentration (µM)
Rela
tive a
rea
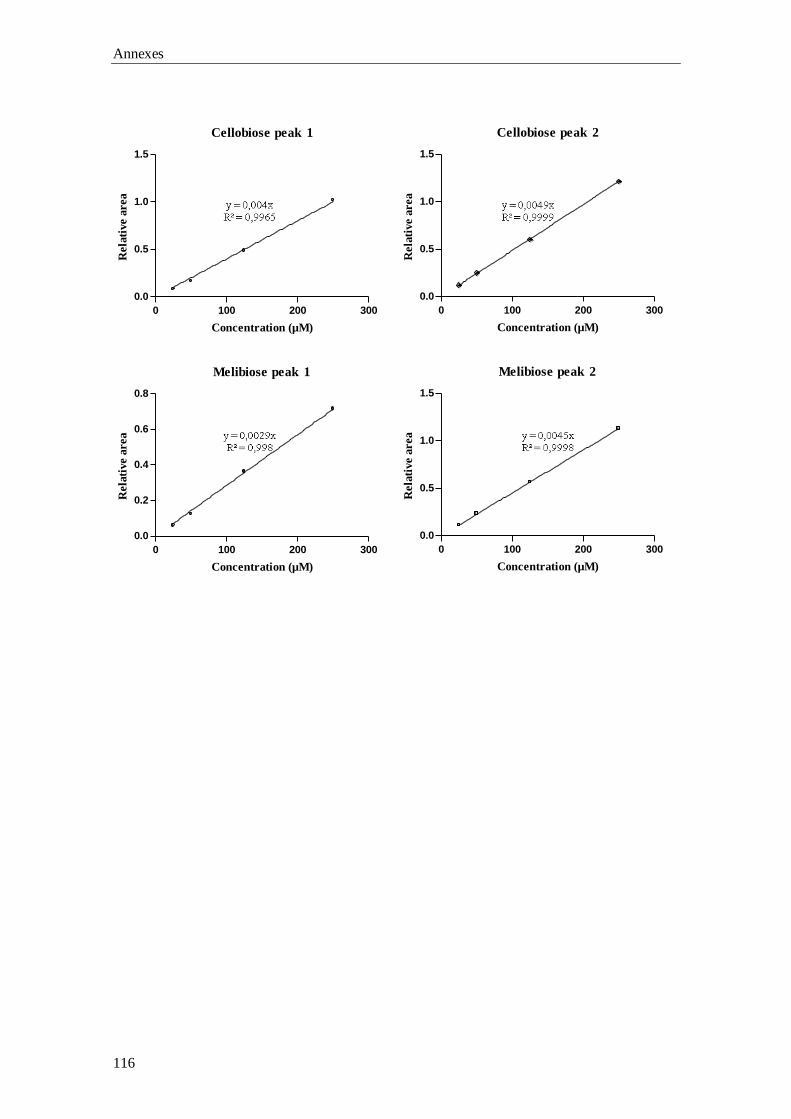
Annexes
116
Cellobiose peak 1
0 100 200 300
0.0
0.5
1.0
1.5
Concentration (µM)
Rela
tive a
rea
Cellobiose peak 2
0 100 200 300
0.0
0.5
1.0
1.5
Concentration (µM)
Rela
tive a
rea
Melibiose peak 1
0 100 200 300
0.0
0.2
0.4
0.6
0.8
Concentration (µM)
Rela
tive a
rea
Melibiose peak 2
0 100 200 300
0.0
0.5
1.0
1.5
Concentration (µM)
Rela
tive a
rea