Embed Size (px)
Citation preview


August 2017
Peoples Natural Gas
2017 Universal Service Program Evaluation
Final Report

www.appriseinc.org Table of Contents
APPRISE Incorporated Page i
Table of Contents
Executive Summary ................................................................................................................... i
Evaluation ...................................................................................................................... i
Evaluation Questions .................................................................................................... ii
Peoples Universal Service Programs .............................................................................x
Needs Assessment ...................................................................................................... xvi
Participant Feedback ................................................................................................. xvii
Transactions Analysis .............................................................................................. xviii
Findings and Recommendations ................................................................................ xxi
I. Introduction ............................................................................................................................1
A. Evaluation Activities ................................................................................................1
B. Organization of the Report.......................................................................................2
II. Peoples Universal Service Programs.....................................................................................3
A. Overview ..................................................................................................................3
B. Customer Assistance Program .................................................................................4
C. Hardship Fund ........................................................................................................18
D. CARES ...................................................................................................................23
E. LIURP ....................................................................................................................27
III. Needs Assessment ..............................................................................................................38
A. Peoples’ Service Territory .....................................................................................38
B. Income Eligibility ..................................................................................................39
C. Demographics ........................................................................................................40
D. Energy Bills and Burden ........................................................................................41
E. Summary ................................................................................................................42
IV. CAP Participant Feedback .................................................................................................44
A. Methodology ..........................................................................................................44
B. Findings..................................................................................................................44
C. Summary and Recommendations ..........................................................................57
V. Transactions Analysis .........................................................................................................59
A. Methodology ..........................................................................................................59

www.appriseinc.org Table of Contents
APPRISE Incorporated Page ii
B. CAP Participation and Discounts...........................................................................65
C. Affordability Impacts .............................................................................................71
D. Payment Impacts ....................................................................................................76
E. Arrearage Forgiveness ...........................................................................................79
F. Collections Impacts ................................................................................................82
G. Summary ................................................................................................................86
VI. Summary of Findings and Recommendations ...................................................................89
A. Evaluation Questions .............................................................................................89
B. Customer Assistance Program ...............................................................................97
C. Hardship Fund ......................................................................................................101
D. CARES .................................................................................................................101
E. LIURP ..................................................................................................................101
www.appriseinc.org Executive Summary
APPRISE Incorporated Page i
Executive Summary
Peoples Natural Gas offers Universal Service Programs to improve affordability and health and
safety for low-income customers. The Universal Service Programs include a Customer
Assistance Program (CAP) that provides a discount on the gas bill, a Low-Income Usage
Reduction Program (LIURP) that provides energy efficiency services and furnace replacement, a
hardship fund program that provides grants to customers in danger of service termination, and a
Customer Assistance and Referral Evaluation Services Program (CARES) that provides
additional case management assistance to customers with special needs. This report presents the
findings from the 2017 evaluation of Peoples Natural Gas’ Universal Service Programs.
Evaluation
The following research activities were undertaken.
1. Background Research: We reviewed materials that documented Peoples Natural Gas’
Universal Service Programs.
2. Needs Assessment: We analyzed American Community Survey (ACS) data to provide
information on the number, characteristics, and needs of households in People’s service
territory that are eligible for the Universal Service Programs.
3. Program Data Analysis: We analyzed information from program databases for the CAP,
LIURP, CARES, and Hardship Fund programs.
4. Peoples Natural Gas In-Depth Interviews: We conducted telephone interviews with
Peoples managers and staff who run the Universal Service Programs.
5. Program Administrator Interviews: We conducted telephone interviews with managers
and staff at the Dollar Energy Fund and Conservation Consultants who run the Universal
Service telephone center, provide CAP enrollment and administrative services, run the
hardship fund, and run the LIURP and furnace replacement programs.
6. CAP Participant Survey: We conducted telephone interviews with current CAP
participants to assess their experiences in CAP.
7. Transactions Data Analysis: We analyzed the impact of CAP on affordability, bill
payment behavior, arrearages, service termination, and collection costs. We also
analyzed the CAP Plus mechanism to assess the impact of that charge on CAP bills and
energy burden.

www.appriseinc.org Executive Summary
APPRISE Incorporated Page ii
Evaluation Questions
The Evaluation of Peoples Natural Gas’ Universal Service Programs answered the following
research questions.
1. Is the appropriate population being served? Does the enrollment level meet the needs in
the service territory? Are the participants eligible for the programs as defined in the
Universal Service Plan? Is re-certification completed according to the Universal Service
Plan?
The evaluation analyzed the number of households with gas heating service who were
income-eligible for CAP and calculated the number who participated in Peoples CAP at
any point in 2015. The table below shows that 44 percent of eligible households
participated in CAP in 2015 and that participation rates were about 60 percent for
households with income below the poverty level.
Poverty Group
2015 Data
Eligible
(American
Community
Survey)
CAP
Participants
Participation
Rate
≤ 50% 16,565 9,471 57%
51% – 100% 26,668 17,120 64%
101% – 150% 39,193 9,835 25%
Total 82,426 36,426 44%
In addition to serving income-eligible households, the program serves a high percentage
of households with vulnerable members. The analysis showed that 27 percent of the
2015 participants had a senior in the home and 46 percent had a child.
Re-certification is conducted according to the program plan. CAP recertification is
generally completed on an annual basis. Customers who have received LIHEAP in the
past 24 months or who have certain fixed income types (pension, social security, or
disability) are recertified once every two years. DEF sends customers a letter 60 days
prior to their recertification date, requesting that the customer submit proof of income to
remain active in the CAP program. A second letter is mailed 30 days later. If the
customer does not provide the required income documentation within the 60-day period,
the customer is dismissed from CAP.
2. What is the customer distribution by CAP payment plan? Do participants’ energy
burdens comply with the CAP Policy Statement? How many and what percent of
customers have a minimum payment?
The table below shows that 26 percent of the 2015 CAP participants had income at or
below 50 percent of the poverty level, 47 percent had income between 51 and 100

www.appriseinc.org Executive Summary
APPRISE Incorporated Page iii
percent, and 27 percent had income between 101 and 150 percent of the poverty level.
The associated payment levels of eight, nine, and ten percent of income payments are in
accordance with the CAP Policy Statement. Forty-four percent of all 2015 participants
had the minimum payment of $25 per month.
Poverty Level
Percent of
All 2015
Participants
Percent of
Income
Payment
PUC Energy
Burden
Target
All 2015 Participants Treatment Group
Mean
Payment
% with
Minimum
Payment
Mean
Payment
% with
Minimum
Payment
≤50% 26% 8% 5%-8% $32 71% $34 68%
51%-100% 47% 9% 7%-10% $43 47% $47 46%
101%-150% 27% 10% 9%-10% $77 14% $77 16%
All 100% $50 44% $56 39%
While the CAP payment is designed to provide an energy burden that falls within the
PUC targeted affordability level, there are several reasons why a CAP participant’s
energy burden would be higher than this calculated target.
Minimum payment: As shown above, a large percentage of CAP participants have
the minimum payment level assigned. By definition, these customers will have an
energy burden that exceeds the percentage of income payment level.
Full year: Customers who are not on CAP for the full year will not receive all CAP
credits.
Did not receive all credits: Historically, customers who did not make timely payments
did not receive all CAP credits. The credit application policy has changed so that
currently customers do receive a credit each month they are on CAP.
Arrearage forgiveness co-payment: Customers with arrearages pay $5 per month to
reduce the arrearage while they are receiving arrearage forgiveness. This increases
the monthly payment above the targeted percentage of income payment level.
CAP Plus co-payment: All CAP participants have a CAP Plus co-payment which
increases the monthly payment above the targeted percentage of income payment
level.
The table below shows the energy burden for the treatment group before and after
participating in CAP. The table shows a large reduction in average burden from 59
percent before participation to 35 percent while participating for customers with income
below 50 percent of the poverty level. However, given the reasons noted above, a large
percentage of these customers still have an energy burden that exceeds the PUC target.

www.appriseinc.org Executive Summary
APPRISE Incorporated Page iv
Poverty
Level
Treatment Group
Mean Unadjusted
Gas Energy Burden
PUC
Energy
Burden
Target
Poverty
Level
Treatment Group
Percent with
Burden Above
PUC Target
Pre Post Pre Post
≤ 50% 59% 35% 5%-8% ≤ 50% 96% 85%
51 – 100% 41% 25% 7%-10% 51 – 100% 86% 71%
101 – 150% 24% 15% 9%-10% 101 – 150% 71% 48%
The table below shows the impact that some of these factors have on energy burden.
This table excludes customers with the minimum payment, excludes customers who did
not participate in CAP for the full year, and excludes the arrearage forgiveness co-pay
and the CAP Plus amount. When all of these adjustments are made, only ten percent of
those with income below 50 percent of the poverty level have an energy burden above the
target level.
Poverty
Level
Treatment Group
Mean Adjusted Gas
Energy Burden
PUC
Energy
Burden
Target
Poverty
Level
Treatment Group
Percent with
Burden Above
PUC Target
Pre Post Pre Post
≤ 50% 20% 3% 5%-8% ≤ 50% 88% 10%
51 – 100% 18% 7% 7%-10% 51 – 100% 73% 21%
101 – 150% 16% 7% 9%-10% 101 – 150% 64% 21%
3. What are the CAP retention rates? Why do customers leave CAP?
The table below shows that 61 percent of the 2015 participants had enrolled on or before
January 1, 2015 and had not been deactivated prior to January 1, 2016. Twenty percent
did not participate for all of 2015 because they enrolled after January 2015, nine percent
enrolled in January 2015 but were removed before December 2015, and ten percent
enrolled after January 2015 and were removed before December 2015.
All 2015 CAP Participants
# %
Final Analysis Group 28,265 100%
Full Year in CAP 17,130 61%
Not Full Year in CAP 11,135 39%
Enrolled after January 5,693 20%
Removed before
December 2,656 9%
Enrolled after Jan and
removed before Dec 2,786 10%

www.appriseinc.org Executive Summary
APPRISE Incorporated Page v
The table below displays the CAP removal reason for customers in each group who were
deactivated. The table shows that the most common removal reason was that the
customer did not provide documentation.
All 2015 CAP Participants
# %
Did Not Provide Documentation 3,820 70%
Income Too High 727 13%
Customer Request 294 5%
Final Bill or Disconnected 223 4%
System Error Correction 177 3%
Set up in Error 167 3%
Annual Credit Exceeds $1,000 34 1%
Usage Exceeds 125% 0 0%
Total 5,442 100%
4. Is there an effective link between CAP and energy assistance programs (LIHEAP,
hardship, and other grants)?
There is an effective link between CAP and energy assistance programs. Peoples
encourages customers to apply for LIHEAP with bill inserts, posters, outreach,
community events, and application assistance. If requested, Peoples will hand write the
LIHEAP application for the customer and mail it to the customer to be signed and
submitted. Dollar Energy asks customers if they applied for LIHEAP/Crisis if they are
eligible. Customers must apply for LIHEAP/Crisis prior to receiving the Dollar Energy
grant.
The table below shows that 38 percent of the CAP treatment group received LIHEAP in
the year before CAP enrollment and 42 percent received LIHEAP in the year following
CAP enrollment.
Treatment Group
Pre Post Change
Number of Customers 3,516
Percent Received LIHEAP 38% 42% 4%**
Mean LIHEAP Grant – All Customers $82 $102 $19**
Mean LIHEAP Grant –Received LIHEAP $219 $242 $23**
Percent Received LIHEAP Crisis 16% 11% -5%**
Mean LIHEAP Crisis Grant – All Customers $68 $38 -$30**
Mean LIHEAP Crisis Grant – Received Crisis $425 $357 -$68**

www.appriseinc.org Executive Summary
APPRISE Incorporated Page vi
5. How effective are the CAP control features at limiting program costs? What are the
number and percent of customers with minimum payments? What are the number and
percent of customers who exceed the maximum CAP credits?
The table below shows that approximately 40 percent of the CAP participants had the
minimum payment.
Poverty Level
All 2015 Participants Treatment Group
Mean
Payment
% with
Minimum
Payment
Mean
Payment
% with
Minimum
Payment
≤50% $32 71% $34 68%
51%-100% $43 47% $47 46%
101%-150% $77 14% $77 16%
All $50 44% $56 39%
Peoples generates a report to monitor customers who exceed $1,000 in CAP credits.
Customers are notified of their current use of CAP credits and offered information about
the LIURP weatherization program when they reach $500 in CAP credits and $750 in
CAP credits annually. The notification includes a description of the customer’s
responsibility to monitor gas usage and advises the customer that he/she may be
responsible for CAP credits over $1,000.
When an account exceeds the $1,000 CAP credit amount, the account is reviewed and the
customer is contacted to determine if excess CAP credits are justified. DEF completes a
questionnaire with the customer. Justification may include an increase in household size,
serious illness of a family member, usage was beyond the household’s ability to control,
or a very low CAP payment. Special needs customers identified through this process are
referred to the CARES program. High usage customers are referred for weatherization.
Unjustified CAP credits in excess of $1,000 may be reversed and the resulting bill will be
the responsibility of the CAP participant.
The table below shows that only ten percent of the 2015 participants and one percent of
the treatment group had $1,000 or more in CAP credits.

www.appriseinc.org Executive Summary
APPRISE Incorporated Page vii
Obs.
Mean
# CAP
Credits
Mean
Credits
Median
Credits
Received
$1,000 or
More CAP
Credits
Credits Received in 2015
All 2015 Participants (0-150%)
All 28,265 4.6 $467 $378 10%
Full Year CAP 17,130 5.3 $541 $452 12%
Credits Received in Year after Enrollment
Treatment Group
All 3,519 3.9 $194 $125 1%
Full Year CAP 2,893 4.2 $205 $131 1%
6. How effective is the CAP and LIURP link? Is the company’s procedure for dealing with
excessively high usage effective? If not, how can it be improved?
At the time of CAP enrollment, participants receive information on conservation tips and
weatherization programs. Customers with a history of high energy usage are referred to
LIURP and any other appropriate programs. All participants are advised that their usage
will be reviewed on an ongoing basis and unjustified excess CAP usage may be billed to
the CAP customer or the CAP customer may be removed from CAP.
Peoples generates a daily report that allows the Company to identify CAP customers
whose weather-normalized annual usage has increased by more than 25 percent. When a
CAP customer’s account appears in the report, the Company representative reviews the
account and the customer is contacted to determine if the increase in gas usage is justified
due to an increase in household size, serious illness of a family member, or usage was
beyond the household’s ability to control. Peoples has a questionnaire they provided to
DEF to use when discussing usage with the customer. The majority of the cases
reviewed meet one of these justified reasons for an increase in usage.
Number of people living in the home increased
Medical condition in the home
New gas appliances installed
Furnace condition
Window condition
Attic insulation condition
Home drafts
Whether home has been weatherized
Other reasons

www.appriseinc.org Executive Summary
APPRISE Incorporated Page viii
If DEF does not get in touch with the customer on the phone, they mail the questionnaire,
the customer fills it in and mails it back, and they use the information that the customer
provided.
7. Has collection on missed CAP payments been timely? Has the company followed its own
default procedures in its Universal Service Plan for CAP customers?
Peoples follows normal collections procedures for CAP participants who do not make
their payments in a timely manner. Customers who do not make their monthly payments
may be placed in collections and have their service terminated. To avoid termination, the
customer must pay the amount set forth in the termination notice prior to the scheduled
termination date.
8. Does participation in Universal Service Programs reduce service terminations?
There was a small, statistically significant reduction in the number of collection calls for
the treatment group as compared to the comparison groups, but no significant change in
terminations.
Treatment Group
Later Participant
Comparison Group
Nonparticipant
Comparison Group
Average
Comparison
Group
Change
Net
Change Pre Post Change Pre Post Change Pre Post Change
Number of Customers 3,517 2,287 7,007 9,294
Letters 0.05 0.09 0.04**
0.05 0.14 0.09**
0.05 0.04 -0.02**
0.04 <0.01
Calls 0.07 0.12 0.05**
0.09 0.16 0.07**
0.04 0.02 -0.1**
0.03 0.03*
Termination Processing
step – No Cost 0.12 0.19 0.07
** 0.16 0.29 0.13
** 0.04 0.04 -0.01 0.06 0.01
Termination Processing
Step – With Cost 0.01 0.01 0.01 0.01 0.01 0.01 0.01 0.01 -0.01
** >-0.01 <0.01
Terminations 0.08 0.10 0.02*
0.11 0.18 0.07**
0.03 0.03 -0.01#
0.03 -0.01
9. Does participation in Universal Service Programs decrease collections costs?
There was not a statistically significant change in the cost of collections for the treatment
group as compared to the comparison groups.

www.appriseinc.org Executive Summary
APPRISE Incorporated Page ix
Table VI-2A
Cost of Collections Actions
Treatment Group
Later Participant
Comparison Group
Nonparticipant
Comparison Group
Average
Comparison
Group
Change
Net
Change Pre Post Change Pre Post Change Pre Post Change
Number of
Customers 3,517 2,287 7,007 9,294
Letters $0.05 $0.09 $0.04**
$0.05 $0.14 $0.09**
$0.05 $0.04 -$0.02**
$0.04 $0.01
Calls $0.01 $0.01 $0.01**
$0.01 $0.02 0.01**
$0.01 $0.01 -$0.01**
$0.01 $0.01*
Termination
Processing Step $0.27 $0.42 $0.15 $0.54 $0.62 $0.08 $0.32 $0.16 -$0.17
** -$0.04 $0.19
Terminations $5.46 $6.71 $1.25*
$6.99 $11.61 $4.62**
$1.95 $1.62 -$0.33#
$2.15 -$0.90
Total Cost $5.79 $7.23 $1.44**
$7.59 $12.39 $4.80**
$2.33 $1.82 -$0.51**
$2.14 -$0.71
10. Is the CAP program cost-effective?
The CAP provides large subsidies to participants, averaging several hundred dollars each
year, to improve the affordability of their energy bills. Given the size of these subsidies,
it is not possible for the program to be cost-effective, defined as a subsidy cost that is less
than the amount saved on collections costs and termination costs. However, there is
evidence that the program provides important benefits to participants to improve their
health and well-being, many of which cannot be quantified.
11. How can Universal Service Programs be more cost-effective and efficient?
Based on the evaluation research, we have the following recommendations to improve
the effectiveness and efficiency of the Universal Service Programs.
CAP
Enrollment: Peoples should consider whether there are cases where agency
enrollment (rather than telephone enrollment) may provide important benefits to the
customer such as quicker enrollment or more education and referrals, and should be
recommended to the customer.
Re-certification: It may be beneficial for Peoples to suggest that certain customers
visit an agency to recertify to obtain a better understanding of the program, the
importance of making the monthly CAP payment, and additional resources that may
be available.
CAP Bill: Peoples could add information on the amount of arrearage forgiveness that
will be received when they pay their bill to make this even more apparent.

www.appriseinc.org Executive Summary
APPRISE Incorporated Page x
CAP Plus: The CAP Plus adder impacts energy burden and affordability. Peoples
should continue to monitor this adder and assess how increases impact affordability,
especially for the lowest-income customers.
LIURP
Targeting: Peoples should consider whether they want to make additional efforts to
serve the highest of the high users or the customers who are most payment-troubled.
They could target a subset of their high-usage list for additional outreach to
encourage participation.
Measures: Peoples should assess whether there are opportunities to reduce the
number of heating system replacements and increase the emphasis on air sealing and
insulation.
Coordination: Peoples should continue to work with the electric companies, as
planned, to try to increase LIURP coordination, thus providing improved energy
efficiency through a holistic approach.
12. Is the program sufficiently funded?
The CAP budget as planned in Peoples’ three-year Universal Services Plan was lower
than the actual program costs. Over 230 percent of the planned budget was spent. The
planned budget was based on natural gas rates at the time and approximate enrollment.
In addition to changes in rates and enrollment, there are changes in vendor administration
costs and payment behavior that impact the amount of arrearage forgiveness benefits.
The transition from CAP credit application upon payment to CAP credit application upon
billing resulted in a significant one-time increase in CAP costs.
2015 CAP
Company Budget Expenditures Percent of
Budget Spent
Peoples $5,583,793 $12,607,004 226%
Equitable $3,606,966 $8,614,710 239%
Total $9,190,759 $21,221,714 231%
Peoples Universal Service Programs
Peoples’ Universal Service Programs provide assistance to low-income customers to improve
affordability, as well as health and safety.
Customer Assistance Program (CAP)
The Customer Assistance Program (CAP) is a special payment plan for low-income,
payment-troubled customers. In this program, low-income customers pay a percentage of

www.appriseinc.org Executive Summary
APPRISE Incorporated Page xi
their income for natural gas service. The reduced payment amount is designed to improve
payment compliance and reduce collection activities.
The CAP budget was close to $9.2 million in 2015 and increased to $9.8 million for 2018.
Total CAP expenditures were about $21.2 million in 2014 and 2015. These projections, as
provided in the Universal Service and Energy Conservation Report, were prepared in early
2014 and could not predict future changes to CAP which included an expansion of services
offered by the CAP administrator to include referrals and assistance to all Universal Service
programs or the change to the application of CAP credits at the time of billing rather than
upon receipt of payment. Enrollment was projected to be 22,500 for Peoples and 17,000 for
Equitable in 2018. Approximately 33,000 customers participated in CAP as of December
2015 and 2016.
Peoples’ CAP is managed by Peoples’ staff and administered by the Dollar Energy Fund (the
Dollar Energy Fund administration began in May 2011). The Dollar Energy Fund (DEF)
provides call center services for all of Peoples Universal Service Programs. DEF’s CAP
responsibilities include verification of eligibility, recertification, and day-to-day account
monitoring. The agency has a network of community based organizations that are available
to complete CAP applications for eligible customers.
Customers can enroll by phone without income verification if they received LIHEAP. If this
is the case, DEF takes the customer’s verbal income report to enter in the system and to place
the customer in a CAP tier. If the budget payment is lower, the system will automatically
select the budget amount as the CAP payment.
If the customer has not received LIHEAP, the customer is asked to send in proof of income.
When the income information is sent in and approved, the customer is enrolled in CAP. At
the time of CAP enrollment, customers are given a handout with energy conservation tips
and a copy of the CAP customer agreement so they know how to be successful in CAP.
Customers with income at or below 150 percent of the Federal Poverty Level are income-
eligible for CAP. The customer must also have active residential heating service and be
classified as payment-troubled. Peoples defines a customer as payment-troubled if any of the
following situations exist.
An arrearage, broken payment arrangement, or termination notice.
Housing and utility costs that exceed 45 percent of the household’s total income. Housing
and utility costs are defined as rent or mortgage, property taxes, gas, electric, water,
telephone and sewage.
Disposable income of $100 or less after subtracting all household expenses from
household income.
However, Peoples is flexible on the payment-troubled requirement. If CAP appears to be the
most beneficial option for the customer, then they will enroll a customer who is seeking
assistance.

www.appriseinc.org Executive Summary
APPRISE Incorporated Page xii
The benefits of CAP participation include the following.
An affordable monthly payment based on ability to pay.
Monthly CAP credits.
Monthly arrearage forgiveness when timely CAP payments are received.
Exemption from late payment charges and waived security deposits.
Referrals to other Universal Service Programs and assistance programs
Eligible customers agree to pay eight, nine, or ten percent of their verified before-tax
monthly income for natural gas service, depending on household poverty level. The
minimum monthly payment is $25. In addition to the percentage of income amount, CAP
customers pay five dollars per month toward their pre-CAP balance, and a CAP Plus amount
to account for potential LIHEAP benefits.
CAP customers with pre-program arrearages are eligible for Arrearage Forgiveness credits
equal to 1/36th of their pre-program balance when the customer pays the required CAP
payment. CAP participants can completely remove their pre-program balance over a three-
year period. Arrearage Forgiveness credits are provided when the customer makes a full CAP
payment.
CAP recertification is generally completed on an annual basis. Customers who have received
LIHEAP in the past 24 months or who have certain fixed income types (pension, social
security, or disability) are recertified once every two years.
Peoples follows normal collections procedures for CAP participants who do not make their
payments in a timely manner. Customers who do not make their monthly payments may be
placed in collections and have their service terminated. To avoid termination, the customer
must pay the amount set forth in the termination notice prior to the scheduled termination
date.
E-CAP Pilot
Peoples E-CAP is a three-year pilot payment plan for low-income, payment-troubled
customers with household incomes between 151 and 200 percent of the Federal Poverty
Level. Eligible customers agree to pay 11 percent of their verified before tax monthly
income or the premise-specific budget payment for natural gas service. In addition to the
percentage of income payment, E-CAP customers pay $5 per month toward pre-program
arrearages and the CAP Plus monthly payment amount.
Customers are eligible for Pilot E-CAP if they meet the following criteria.
Income between 151 and 200 percent of the Federal Poverty Level.
Active heating customer.
Significant account balance.
Prior broken payment arrangement, an active termination notice, or lack of utility service.
Applied for a Dollar Energy Grant to reduce the delinquent balance prior to entering E-
CAP if funds are available.

www.appriseinc.org Executive Summary
APPRISE Incorporated Page xiii
Enrollment is focused on customers with balances of $800 or more, but customers with lower
balances may be enrolled if circumstances warrant.
The program benefits are as follows.
Affordable monthly payments based on ability to pay.
Monthly CAP credits.
Monthly arrearage forgiveness when timely CAP payments are received.
Exemption from late payment charges and waived security deposits.
Referrals to other Universal Service Programs and assistance programs.
CAP Challenges and Successes
The DEF call center noted that the greatest challenge with CAP is receiving documentation
to verify income for customers who have not received LIHEAP. DEF asks customers to send
their last two pay stubs and proof of employment, but customers do not always follow
through. There are times when DEF only receives partial income documentation even
though they have sent letters and made several attempts to contact the customer. This is
especially a challenge in termination season when they need the information within a
specified time period.
The ongoing challenge is to encourage customers to consistently make their payments. CAP
is designed to be the most affordable payment and customers receive the benefit of arrearage
forgiveness. However, getting customers to follow through and make those regular payments
is a challenge. This makes it difficult for customers to keep service and reduce their
balances.
Dollar Energy Hardship Fund
Peoples Hardship Fund works in partnership with the Dollar Energy Fund to provide grants
of up to $500 to customers who are behind on their natural gas bills. The Hardship Funded is
provided through Peoples donations and customer donations. Peoples contributes up to
$550,000 annually to match customer donations and contributes up to $110,000 for
administrative costs.
During the 2015-2016 program year, Peoples distributed a total of $1.1 million in grants to
over 3,000 customers. The average grant amount was $364.
Dollar Energy partners with community-based organizations to accept hardship fund
applications. If customers call DEF to apply for CAP, DEF can take the hardship fund
application as well. Customers must meet the following criteria to be eligible for the
Hardship Fund.
Apply for LIHEAP and Crisis benefits if eligible.
Household income at or below 200 percent of the poverty level.
Paid at least $150 toward their utility bill over a ninety-day time period, or at least one
$100 payment in the last six months if over 62.
Have a balance of at least $100 if under 62. There is no balance requirement for
applicants over 62.

www.appriseinc.org Executive Summary
APPRISE Incorporated Page xiv
Have a residential heating account.
CARES
The CARES program provides comprehensive services for customers who may have an
inability to pay their gas bills and/or have special needs. In 2018, the total CARES budget
will be just under $400,000.
CARES provides assistance to approximately 500 customers each year for the Peoples
Division and 600 customers each year for the Equitable Division. CARES also provides
outreach to low-income customers to increase participation in energy assistance programs
and the Earned Income Tax Credit (EITC). LIHEAP is an important component of CARES.
Peoples identifies income-eligible customers and promotes the program through bill inserts,
radio and television ads, press releases, press conferences, and customer letters.
The CARES Program is administered by Peoples’ staff who work with agencies throughout
Peoples’ service territory to stay informed of available programs and to better serve low-
income customers. Peoples employs two certified social workers on its Customer Relations’
staff to support the needs of customers with special circumstances.
Any special needs customer in danger of losing heat due to non-payment or heating
equipment failure may be referred to the CARES program for assistance. Special needs
include a serious medical condition, a mental health condition, limited learning ability, recent
unemployment, and single parent issues, as well as other special needs.
The CARES program also includes the Gatekeeper program which is designed to aid older
adults and special needs customers who need help, but may not be able to access it
themselves. Customer contact personnel are trained as “gatekeepers” to recognize danger
signals such as changes in behavior, signs of confusion, or disability. Gatekeepers report the
situation, and referrals are made to third party agencies or family members are alerted.
LIURP
Peoples’ LIURP is designed to help low-income customers who have high gas bills.
The goals of LIURP are as follows.
Maintain health, safety and comfort in the home.
Comply with the PUC mandates.
Continue utilization of third party administrator.
Reduce consumption of CAP participants.
Assist special needs customers.
Partner with community based organizations.
Spend the program budget wisely while maximizing quality of work.
Continue providing random inspections as means of quality control.
In the Joint Settlement Agreement in the Merger Transaction proceeding, Peoples agreed to
increase the spending for its combined LIURP program to a total of $2,050,000 (including

www.appriseinc.org Executive Summary
APPRISE Incorporated Page xv
$250,000 in Shareholder funding). These expenditure increases will remain in effect for 4
years (2014 through 2017).
Projected LIURP enrollment is based upon average spending per home for the past three
years. A total of 410 customers are expected to be served each year. The average LIURP
costs per home were $4,727 in 2016.
Peoples’ LIURP is managed in-house and administered through Conservation Consultants
Inc., a nonprofit agency. Conservation Consultants is responsible for outreach and
enrollment. They review customer referrals sent from Peoples, ensure that the customer has
not participated in LIURP in the past seven years, and check to make sure they meet the
LIURP requirements.
CAP participants are screened for LIURP, but must meet the following criteria for eligibility.
1. Total family income does not exceed 150 percent of the Federal Poverty Guidelines. (Up
to 20 percent of the annual program budget may be allocated to customers with incomes
from 151 to 200 percent of the federal poverty level on a case-by-case basis.) Customers
with lowest income and highest arrearages are prioritized.
2. Residential, gas-heating customer.
3. Customer has not moved and has not had gas service terminated within the last year.
4. Customer has annual consumption greater than 140 MCF.
5. Renters must have the gas account in their name and receive landlord permission to
participate. Rental units must be metered separately and have individual heating systems.
An energy auditor assesses the customer’s home to determine what LIURP measures should
be installed. The auditor assesses air leakage, previously installed weatherization measures,
and the effectiveness of these measures. The auditor discusses the home performance with
the customer.
Measures are installed based on established payback criteria and may include the following.
Heating system improvements and replacements
Attic, sidewall, and other types of insulation
Caulking and weather-stripping
Air sealing
Hot water treatments including tank improvements, wrapping, and replacements
Minor repairs that relate to weatherization
In addition to weatherization services, LIURP provides customer education to explain the
weatherization and to encourage ongoing conservation.

www.appriseinc.org Executive Summary
APPRISE Incorporated Page xvi
LIURP Pilot: Emergency Furnace/Service Line Repair Assistance
The Peoples Emergency Furnace program provides financial assistance for furnace/boiler and
service and house line gas leak repairs or replacements to help customers maintain gas
service.
Customers must be at or below 200 percent of the federal poverty level, own their home, and
have a need for emergency repairs to their heating system or house/service lines to be eligible
for the pilot.
The budget for Peoples Division is $400,000 per year from 2015 through 2018. By Order
issued 12/8/16, the Equitable Division will now have an annual funding mechanism of
$275,000 through its Universal Service Rider and will operate in the same manner as Peoples
Division’s programs.
An average of 140 Peoples customers per year have received either furnace or line repair
services through this program. An average of 30 to 40 Equitable customers per year received
either furnace or line repair services through this program prior to the 2016 Order that
increased Equitable’s funding for this pilot.
Peoples LIURP Pilot: Community Weatherization Partnership Program
The Community Weatherization Partnership Program partners with nonprofit organizations
to provide energy education programs for customers with limited incomes.
The Community Weatherization Partnership Program was approved as part of the Settlement
in Peoples Base Rate Case in June 2011. While Peoples Equitable Division does not
currently offer a Community Partnership Program, it may be implemented at some point in
the future.
The budget for the pilot is $50,000 per year for 2015 through 2018 and it is expected that 50
to 100 customers per year will receive education through this program.
The pilot is designed to impact low-income customers in vulnerable neighborhoods. In 2015,
Peoples partnered with five organizations, completed seven education sessions, and provided
information to 101 customers. Each participant also received an energy conservation tool kit
with caulking materials, pipe insulation, a showerhead and aerator, window and door kits,
and foam insulation. Peoples also provided funding to nonprofit organizations whose
programs served 142 customers with energy education and conservation kits.
Needs Assessment
The Needs Assessment provided a profile of low-income households in Peoples’ service
territory using data from the 2011-2015 American Community Survey (ACS). These data
provided information on the number of eligible households, the poverty level of those
households, demographic characteristics, and energy burden. The data represent Peoples’
service territory in 2015.

www.appriseinc.org Executive Summary
APPRISE Incorporated Page xvii
Income Eligibility: Of households with gas service, 17 percent have income below 150
percent of the poverty level and 25 percent have income below 200 percent of the poverty
level.
Demographics: Of those below 150 percent of the poverty level with gas service, ten
percent are married with children, 22 percent are single with children, 36 percent are a
senior head of household, and the remaining are in other categories. Ninety-three percent
speak English at home.
Gas Costs and Burden: Gas heating households with income below 150 percent of
poverty have a mean natural gas burden of 13.8 percent. However, this average burden is
not reflective of the energy burden for CAP participants who receive the CAP credits
and, as a result, have a lower energy burden.
Participant Feedback
We conducted telephone interviews with 103 current CAP participants to assess CAP
understanding, impact, and satisfaction. Key findings from the survey are summarized
below.
Participation: Customers were most likely to find out about CAP from a Peoples
customer service representative, an agency, or a friend or relative. While 61 percent said
they enrolled to reduce their bills, 28 percent said it was because they had low or limited
income, and 24 percent said they enrolled to reduce their arrearages.
Most respondents reported that the enrollment and the recertification process were very
or somewhat easy. While 93 percent said that enrollment was very or somewhat easy, 97
percent said that re-certification was very or somewhat easy.
CAP Benefits: 89 percent reported that they felt they had a good understanding of the
services provided by CAP. While 90 percent said that their responsibility was to keep up
with payments, 12 percent said it was to report income and information, four percent said
it was to conserve energy, and three percent said it was to apply for LIHEAP.
Respondents were most likely to report that the benefits of CAP were lower energy bills
and even monthly payments. When asked about specific benefits, 98 percent agreed that
lower energy bills were a benefit, 94 percent agreed that maintaining gas service was a
benefit, and 80 percent agreed that reduced arrearages were a benefit.
While 97 percent said that the CAP bills shows the CAP payment in a way that is clear
and easy to locate and understand, 91 percent said it showed the CAP credit benefit and
84 percent said that it showed the arrearage forgiveness amount in a way that is clear and
easy to locate and understand.

www.appriseinc.org Executive Summary
APPRISE Incorporated Page xviii
Bill Payment Problems: Respondents were much less likely to state that their CAP bills
were difficult to pay after enrollment in CAP. While 58 percent said it was very difficult
to pay the monthly gas bill prior to CAP enrollment, only five percent said it was very
difficult to pay the bill following enrollment. Sixty-six percent said their gas bill was
lower when they were in CAP and 25 percent said their gas usage was lower after
enrolling in CAP.
Respondents were less likely to report that they had to delay expenditures or skip paying
bills following enrollment in CAP. While 60 percent said they had to skip paying for
food prior to CAP enrollment, 24 percent said they did so following CAP enrollment.
Large declines in difficulty paying bills were also reported for the telephone, medical or
dental, mortgage or rent, and credit card or loans.
When asked how important CAP has been in helping them meet their needs, 92 percent
said it was very important and five percent said it was somewhat important.
Continued CAP Participation: When asked how likely they were to continue to
participate in CAP, 92 percent said they were very likely to continue to participate. Most
participants stated that they would continue to participate in the program as long as the
assistance was needed.
CAP Satisfaction and Recommendations: While 93 percent said they were very satisfied with
CAP, six percent said they were somewhat satisfied. Most respondents did not have
recommendations for the program. Those who did have recommendations were most likely
to suggest improved availability or accessibility, a higher level of assistance, or
weatherization services.
Transactions Analysis
This evaluation included an analysis of Peoples’ CAP impacts on affordability, bill payment
compliance, and collections actions. Key findings from the analysis are summarized below.
CAP Participation: 82 percent of the treatment group who enrolled in 2015 and did not
participate in CAP in the year prior to enrollment remained on CAP for at least a full
year. While 92 percent of the Peoples treatment group participated in CAP for the full
year, 74 percent of the Equitable treatment group participated in CAP for the full year.
CAP Credits: All 2015 participants received an average of 4.6 credits and $467, and full
year participants received an average of 5.3 credits and $541. While ten percent of all
2015 participants received $1,000 or more in CAP credits, 12 percent of the full year
participants received $1,000 or more in CAP credits.
The treatment group analysis focuses on credits received in the year after the 2015
enrollment. Therefore, most of these customers received credits for winter 2016, the 2nd
warmest year on record in Pittsburgh according to the National Oceanic and Atmospheric
www.appriseinc.org Executive Summary
APPRISE Incorporated Page xix
Administration (NOAA)1. As a result, the 2015 treatment group had average CAP credits
that were significant lower than all 2015 participants whose data included winter 2015
when the weather was much colder than average. The treatment group received an
average of 3.9 credits and $194, and full year participants received an average of 4.2
credits and $205. Only one percent of the treatment group received $1,000 or more in
CAP credits.
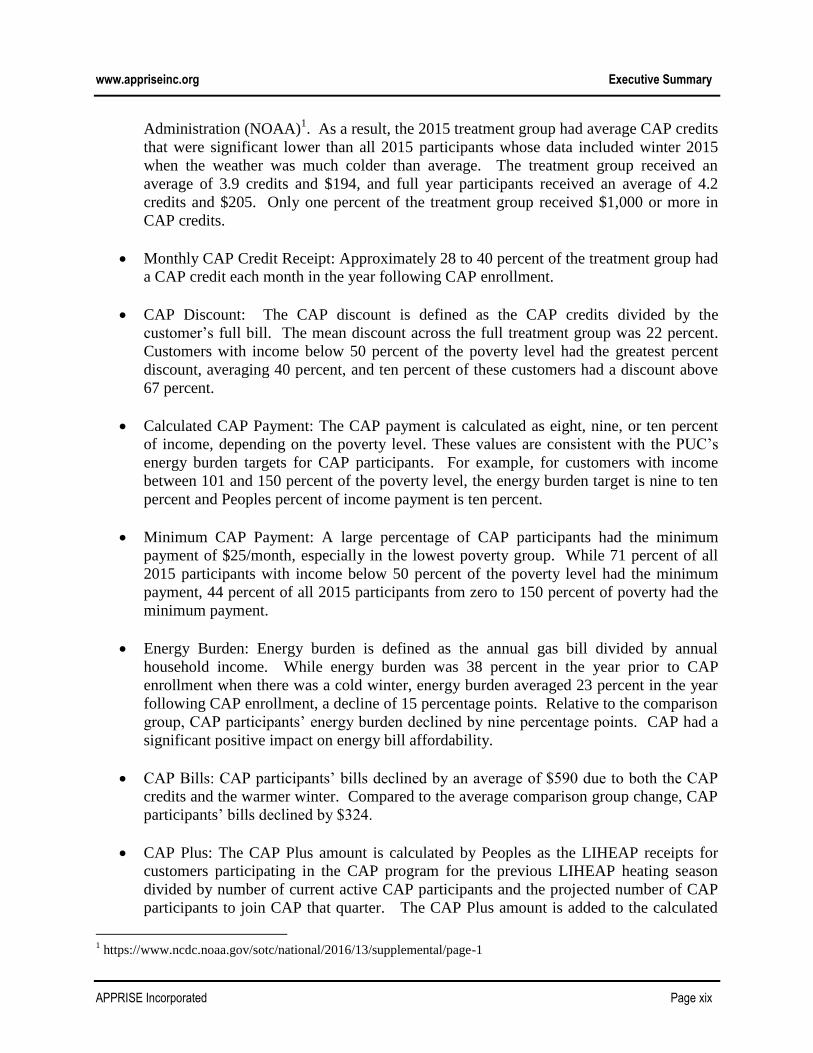
Monthly CAP Credit Receipt: Approximately 28 to 40 percent of the treatment group had
a CAP credit each month in the year following CAP enrollment.
CAP Discount: The CAP discount is defined as the CAP credits divided by the
customer’s full bill. The mean discount across the full treatment group was 22 percent.
Customers with income below 50 percent of the poverty level had the greatest percent
discount, averaging 40 percent, and ten percent of these customers had a discount above
67 percent.
Calculated CAP Payment: The CAP payment is calculated as eight, nine, or ten percent
of income, depending on the poverty level. These values are consistent with the PUC’s
energy burden targets for CAP participants. For example, for customers with income
between 101 and 150 percent of the poverty level, the energy burden target is nine to ten
percent and Peoples percent of income payment is ten percent.
Minimum CAP Payment: A large percentage of CAP participants had the minimum
payment of $25/month, especially in the lowest poverty group. While 71 percent of all
2015 participants with income below 50 percent of the poverty level had the minimum
payment, 44 percent of all 2015 participants from zero to 150 percent of poverty had the
minimum payment.
Energy Burden: Energy burden is defined as the annual gas bill divided by annual
household income. While energy burden was 38 percent in the year prior to CAP
enrollment when there was a cold winter, energy burden averaged 23 percent in the year
following CAP enrollment, a decline of 15 percentage points. Relative to the comparison
group, CAP participants’ energy burden declined by nine percentage points. CAP had a
significant positive impact on energy bill affordability.
CAP Bills: CAP participants’ bills declined by an average of $590 due to both the CAP
credits and the warmer winter. Compared to the average comparison group change, CAP
participants’ bills declined by $324.
CAP Plus: The CAP Plus amount is calculated by Peoples as the LIHEAP receipts for
customers participating in the CAP program for the previous LIHEAP heating season
divided by number of current active CAP participants and the projected number of CAP
participants to join CAP that quarter. The CAP Plus amount is added to the calculated
1 https://www.ncdc.noaa.gov/sotc/national/2016/13/supplemental/page-1

www.appriseinc.org Executive Summary
APPRISE Incorporated Page xx
monthly CAP payment amount for all participating CAP customers. The 2015
participants received a mean of 6.3 CAP Plus charges totaling $38 and the treatment
group received a mean of 7.3 CAP Plus charges totaling $46. The CAP Plus charges
made up 5.8 percent of the discounted bill for all 2015 participants and 7.8 percent of the
discounted bill for the treatment group.
LIHEAP and Crisis: While there was no significant net change in the amount of LIHEAP
received, there was a decline in the amount of LIHEAP Crisis assistance received, likely
due to a more affordable bill.
CAP Payments Made: CAP participants increased the number of cash payments made as
compared to the decline experienced by the comparison groups. As a result of the
reduced charges, customers reduced the amount of cash payments made. However, the
net change, compared to the comparison groups, was a slight increase in cash payments.
Total Coverage Rate: The total coverage rate is the percent of charges covered by the
customer’s cash payments and all other credits, including assistance payments. The
treatment group increased their total coverage rate from 85 percent in the pre-CAP
enrollment period to 123 percent in the post-CAP enrollment period, indicating that these
customers were paying off some of their balances. The net change was an increase of 36
percentage points compared to the comparison groups.
While only 33 percent of the treatment group paid their full bill or more prior to
enrollment in CAP, 71 percent paid their full bill or more following enrollment. The
comparison groups did not see the same improvement in bill coverage rates.
Arrearage Forgiveness: CAP participants received an average of $118 in arrearage
forgiveness in the post-treatment period.
All customers with arrearages received at least one arrearage forgiveness payment. The
full year 2015 CAP participants with arrearages received an average of 5.1 arrearage
forgiveness payments and $203 in arrearage forgiveness. The full year treatment group
with arrearages received an average of 5.2 arrearage forgiveness payments and $176 in
arrearage forgiveness.
Collections Actions: There was a small, statistically significant reduction in the number
of collection calls for the treatment group as compared to the comparison groups. There
was a significant decline in the number of letters, calls, and terminations for the Peoples
treatment group as compared to the comparison groups. There was a significant increase
in the number of letters, calls, and terminations for the Equitable treatment group as
compared to the comparison groups.
Collections Costs: There was a significant decline in the cost of collections of $6.52 for
the Peoples treatment group as compared to the comparison groups. There was an
www.appriseinc.org Executive Summary
APPRISE Incorporated Page xxi
increase in the cost of collections for the Equitable treatment group of $3.15 as compared
to the comparison groups.
Findings and Recommendations
This section provides key findings and recommendations for each program.
Customer Assistance Program
Peoples has worked to make CAP as easy as possible for the customer to participate and
remain enrolled. We have the following key findings and recommendations with respect to
the CAP.
1. Phone and Agency Enrollment
Most customers enroll in CAP over the telephone by calling DEF. Customers appear to
appreciate the convenience of the telephone enrollment and very few customers visit an
agency to enroll in CAP. However, there may be additional cases where agency
enrollment may provide important benefits to the customer such as quicker enrollment or
more education and referrals, and should be recommended.
2. Income Verification
Peoples has reported that they are working to make it even easier for customers to
provide income documentation, by creating additional mechanisms for customers to
submit the information.
3. Recertification
As with enrollment, customers appear to appreciate the ability to recertify by mailing in
their documentation rather than visiting an agency. However, it may be beneficial for
Peoples to suggest that certain customers visit an agency to recertify to obtain a better
understanding of the program, the importance of making the monthly CAP payment, and
additional resources that may be available to assist them in meeting their needs.
4. CAP Bill
Peoples has designed a CAP bill that provides a clear presentation of the monthly CAP
payment, the five dollar contribution for arrearages, and the CAP credit as the difference
between actual usage and the CAP payment. Peoples could add information on the
amount of arrearage forgiveness that will be received when they pay their bill to make
this even more apparent.
5. CAP Plus
The CAP Plus adder impacts energy burden and affordability. Peoples should continue to
monitor this adder and assess how increases impact affordability, especially for the
lowest-income customers.
www.appriseinc.org Executive Summary
APPRISE Incorporated Page xxii
6. Affordability
The CAP survey and the transactions data analysis clearly showed that the program has
improved affordability for participants.
7. Bill Payment
CAP also had a positive impact on bill payment.
8. CAP Satisfaction
Customers reported that CAP was very important in helping them to meet their needs and
their satisfaction was high.
Hardship Fund
The following key findings and recommendations were made with respect to the Hardship
Fund.
1. DEF Partnership
Peoples has developed a good partnership with DEF to deliver Hardship Fund grants.
2. Customer Communication
DEF continues to work to improve the process for the customer. They are working to
enhance their phone system to enable customers to use text messaging in place of
speaking with a representative. This would help lower income customers whose cell
phone plan includes only a certain amount of calling, but has unlimited texting.
CARES
The following key findings and recommendations were made with respect to CARES.
1. Benefits
CARES provides important benefits to special needs customers, including education
about the Earned Income Tax Credit and LIHEAP, thermostats for visually-impaired
customers, and short-term assistance to ensure that customers able to access the resources
that they are referred to.
2. Employee Education
Peoples has leveraged CARES to educate employees about special needs customers,
increase the sensitivity of their employees, and increase customer referrals.
LIURP
The following key findings and recommendations were made with respect to LIURP.
1. Energy Education
Peoples has developed an extensive education program for their LIURP participants.
They implemented a Pledge Form to involve the customers with the contractor and an
Action Plan form that lists the actions that the customer committed to take to further
reduce gas usage. Peoples contracts with energy consultants who perform random

www.appriseinc.org Executive Summary
APPRISE Incorporated Page xxiii
inspections and provide additional energy education to the customers about the work
completed and additional actions the customers can take to save energy.
2. Energy Savings
Peoples has achieved high savings from LIURP, averaging about 20 percent of the
customers’ pre-treatment natural gas usage. However, given the high level of pre-
treatment usage, and the investment level, Peoples should consider whether it may be
possible to achieve even higher savings through targeting and the services that are
provided.
3. Targeting
Peoples should consider whether they want to make additional efforts to serve the highest
of the high users or the customers who are most payment-troubled. They could target a
subset of their high-usage list for additional outreach to encourage participation.
4. Energy Efficiency Measures
Peoples should assess whether there are opportunities to reduce the number of heating
system replacements and increase the emphasis on air sealing and insulation.
5. Coordination
Peoples Gas works to complete jobs that are combined with the PA Department of
Community and Economic Development Weatherization Program and with electric
companies. When jobs are coordinated with State Weatherization or electric companies,
Peoples is typically responsible for replacing the heating appliance if replacement is
necessary. They completed 17 combined jobs in 2014, 23 combined jobs in 2013, and 33
combined jobs in 2012. Peoples should continue to work with the electric companies, as
planned, to try to increase coordination, thus providing improved energy efficiency
through a holistic approach.
.

www.appriseinc.org Introduction
APPRISE Incorporated Page 1
I. Introduction
Peoples Natural Gas’ Universal Service Programs include a Customer Assistance Program
(CAP) that provides a reduced payment plan, a Low-Income Usage Reduction Program (LIURP)
that provides energy efficiency services and furnace replacement, a hardship fund that provides
grants to customers in danger of service termination, and a Customer Assistance and Referral
Evaluation Services Program (CARES) that provides additional case management assistance to
customers with special needs. This report presents the findings from the 2017 evaluation of
Peoples Natural Gas’ Universal Service Programs.
A. Evaluation Activities The following research activities were undertaken.
1. Background Research: We reviewed materials that document Peoples Natural Gas’
Universal Service Programs. These included the three-year plans, previous evaluations,
Peoples Best Practices review, reports to the Public Utilities Commission, brochures,
applications, customer letters, training materials, contracting documents, budgets, and
program expenditures.
2. Needs Assessment: We analyzed American Community Survey data to provide
information on the number, characteristics, and energy burden of households in People’s
service territory that are eligible for the Universal Service Programs.
3. Program Data Analysis: We analyzed information from program databases for the CAP,
LIURP, CARES, and Hardship Fund programs and developed statistics on program
participation, participant demographics, and services delivered. We selected a sample of
CAP participants for the customer survey.
4. Peoples Natural Gas In-Depth Interviews: We conducted telephone interviews with
managers and staff who run Peoples’ Universal Service Programs to develop a better
understanding of how the Universal Service Programs currently work, barriers to clients’
participation or success in the programs, and potential improvement to the programs’
policies and procedures.
5. Program Administrator Interviews: We conducted telephone interviews with program
administrators to develop a better understanding of how the CAP, LIURP, and Hardship
Fund programs are designed and implemented, and how they are coordinated with other
programs. The Dollar Energy Fund’s managers and staff were interviewed about the
responsibilities, successes, and challenges in managing CAP, the Universal Service Call
center, and the Hardship Fund. Conservation Consultants’ managers and staff were
interviewed with respect to LIURP and the Emergency Furnace and Service Line Repair
Assistance Program.
6. CAP Participant Survey: We conducted telephone interviews with a sample of 100
current CAP participants to assess their experiences in all aspects of the program from

www.appriseinc.org Introduction
APPRISE Incorporated Page 2
enrollment forward. These interviews assessed program operations and the impact of the
program on affordability.
7. Transactions Data Analysis: We analyzed data for customers who participated in CAP, as
well as for a sample of low-income customers who had not participated in Universal
Service Programs. We analyzed the impact of CAP on affordability, bill payment
behavior, arrearages, service termination, and collection costs. We also analyzed the
CAP Plus mechanism to assess the impact of that charge on CAP bills and energy
burden.
B. Organization of the Report Five sections follow this introduction.
Section II – Peoples Universal Service Programs: This section describes the design and
implementation of Peoples’ Universal Service Programs. Information is based upon
program documents, program data analysis, interviews with Peoples’ program managers
and staff, and interviews with program administrators.
Section III – Needs Assessment: This section summarizes the findings from the analysis
of American Community Service data to characterize the population of households who
are eligible for Peoples’ Universal Service Programs.
Section IV – Participant Feedback: This section summarizes the research methodology
and feedback provided by Peoples’ CAP participants.
Section V – Transactions Analysis: This section provides a description of the analyses
that were conducted and findings with respect to how CAP impacted affordability, bill
payment, service terminations, and collections costs.
Section VII – Summary of Findings and Recommendations: This section provides a
summary of the key findings and furnishes recommendations for Peoples’ Universal
Service Programs based on the analyses in this report.
APPRISE prepared this report under contract to Peoples Natural Gas. Peoples facilitated this
research by furnishing data to APPRISE. Any errors or omissions in this report are the
responsibility of APPRISE. Further, the statements, findings, conclusions, and
recommendations are solely those of analysts from APPRISE and do not necessarily reflect
the views of Peoples.

www.appriseinc.org Peoples Universal Service Programs
APPRISE Incorporated Page 3
II. Peoples Universal Service Programs
Peoples’ Universal Service Programs provide assistance to low-income customers to improve
affordability, as well as health and safety. This section provides a detailed description of each
Universal Service Program.
A. Overview Equitable Gas Company, LLC merged into Peoples on December 18, 2013. (Peoples and
Equitable are each referred to as a “Division” and collectively are referred to as Peoples.) As
part of the merger settlement, Peoples agreed to establish a Universal Service Advisory
Group comprised of community-based organizations, low income advocates, the Office of
Consumer Advocate, and other interested stakeholders. The group meets quarterly and
rotates the focus across the Universal Service Programs. They discuss program outreach,
customer engagement, connecting with community groups, and the members help Peoples to
post information and publicize the programs.
Peoples began a best practices comparison review of Peoples Division’s and the Equitable
Division’s Universal Service and Energy Conservation Plans (“USP”) after the merger was
completed. The best practices review included input from Peoples’ new Universal Service
Advisory Group, review of Universal Service Programs and practices in both Divisions, and
review of programs at other regulated utility companies. The goals of the best practices
review were to identify opportunities to improve existing Universal Service Programs and to
improve the efficiency of program administration. They worked to unify the programs so
that customers of both divisions would receive the same benefits.
The 2015-2018 Amended Plan was developed to guide the Universal Service Programs for
the combined organization. The following Universal Service Programs are provided.
Customer Assistance Program (“CAP”)
Low Income Usage Reduction Program (“LIURP”)
Emergency Furnace and Houseline Repair Program
Customer Assistance Referral and Evaluation Services (“CARES”)
Hardship Fund
Community Partnership Weatherization Program (Peoples Division only)
Pilot E-CAP (151% - 200% of poverty CAP program)
Universal Service Programs are managed and directed by Peoples’ Regulatory Section; the
Manager of Universal Services and the Customer Relations Specialists have the primary
responsibility for the administration of these programs. The Customer Relations Staff
supports the Universal Service Programs.
Incoming calls from low-income customers were previously answered by the internal
Customer Service Center. Beginning on October 1, 2015, all calls for Universal Service
Programs coming through the Program Line began to be answered by a specially trained
Universal Service Call Group at the Dollar Energy Fund (DEF). Customers are referred for

www.appriseinc.org Peoples Universal Service Programs
APPRISE Incorporated Page 4
LIHEAP, LIHEAP-Crisis, Dollar Energy Hardship Fund, LIURP, and other available
programs during their initial call.
During the program year, customers can complete the DEF grant application over the phone
if they are in CAP. This is easier for the customers and saves them travel time and costs. In
addition, known low-income accounts that call the Company’s Customer Service Line and
indicate that the call is related to credit, termination, or restoration of service are transferred
to DEF’s call group for assistance available through CAP. The DEF representatives are
responsible for quoting restoration amounts to customers and amounts needed to avoid
service termination, and for making referrals to other programs, including other utility CAPs
which are also administered by DEF. They are also responsible for completing Cold
Weather Surveys by phone during the fall. During the less busy winter months, the
representatives make outbound calls to potentially eligible LIHEAP and CAP customers.
Peoples Division’s last Universal Service Evaluation was conducted in 2010 and the last
evaluation for the Equitable Division was performed in 2011.
B. Customer Assistance Program The Customer Assistance Program (CAP) is a special payment plan for low-income,
payment-troubled customers. In this program, low-income customers pay a percentage of
their income for natural gas service. The reduced payment amount is designed to improve
energy affordability and payment compliance, and reduce collections activities.
Goals and Resources
Table II-1 displays the budget for each Division’s CAP and Peoples as a whole. The budget
was close to $9.2 million in 2015 and increased to $9.8 million for 2018.
Table II-1
Customer Assistance Program Budget
Year Peoples Division Equitable Division Total
2015 $5,583,793 $3,606,966 $9,190,759
2016 $5,686,285 $3,704,236 $9,390,521
2017 $5,790,850 $3,804,424 $9,595,274
2018 $5,897,531 $3,907,618 $9,805,149
Table II-2 displays projected enrollment for the CAP from 2015 through 2018. Enrollment
was projected to be 22,500 for Peoples and 17,000 for Equitable in 2018.

www.appriseinc.org Peoples Universal Service Programs
APPRISE Incorporated Page 5
Table II-2
Customer Assistance Program Projected Enrollment
Year Peoples Division Equitable Division Total
2015 21,000 14,000 35,000
2016 21,500 15,000 36,500
2017 22,000 16,000 38,000
2018 22,500 17,000 39,500
Table II-3 displays actual CAP expenditures from 2013 through 2016. Total CAP
expenditures were about $21.2 million in 2014 and 2015 and $10.4 million in 2016. At least
part of the decline was due to the warmer winter that year.
Table II-3
CAP Expenditures
Year Peoples Division Equitable Division Total
2013 $8,227,588 $7,090,722 $15,318,310
2014 $11,270,401 $9,988,104 $21,258,505
2015 $12,607,004 $8,614,710 $21,221,714
2016 $6,606,963 $3,826,459 $10,433,422
Table II-4 breaks down CAP costs into the CAP credit, arrearage forgiveness, and
administration. The costs provided are the recoverable costs that flow through the Universal
Service rider which is paid by non-CAP residential ratepayers. It does not include internal
labor or typical office administrative type costs that are borne internally.
Table II-4
CAP Expenditures
Year
Peoples Equitable
CAP Credit Arrearage
Forgiveness Administration CAP Credit
Arrearage
Forgiveness Administration
2014 $8,196,248 $2,089,439 $569,868 $9,013,043 $492,069 $482,992
2015 $9,426,768 $2,022,846 $624,304 $7,624,163 $622,642 $367,905
20162 $2,805,837 $2,742,765 $1,058,361 $2,331,863 $669,529 $825,067
Table II-5 displays the number of CAP participants each December from 2013 through 2016.
Approximately 33,000 customers participated in CAP as of December 2015 and 2016.
2 Administrative costs for the program that are external to Peoples increased in 2016 because DEF undertook the
responsibility for the Universal Service call center in addition to CAP administration. Previously, Peoples staff were
responsible for these services.

www.appriseinc.org Peoples Universal Service Programs
APPRISE Incorporated Page 6
Table II-5
December CAP Participants
Year Peoples Division Equitable Division Total
2013 19,887 11,263 31,150
2014 20,404 14,063 34,467
2015 19,591 13,799 33,390
2016 19,333 13,289 32,622
Program Management and Administration
Peoples’ CAP is managed by Peoples’ staff and administered by DEF (DEF administration
began in May 2011). DEF provides call center services for all of Peoples Universal Service
Programs. Customers are provided with a number that goes directly to DEF and customers
who select the CAP option on Peoples recording are sent directly to DEF. Additionally,
customers who are identified as needing the assistance of DEF for Universal Service
Programs are transferred from Peoples to DEF.
Peoples has found that most customers prefer CAP telephone enrollment as opposed to
visiting a local agency. However, community-based organizations provide referrals to CAP
and appropriate follow up, information on education, budget counseling and referrals.
Peoples also refers eligible customers to programs and services. These services include
third-party funding, budget counseling, and consumer education. Peoples also coordinates
with the Southwestern PA 2-1-1 referral system to expand program outreach and to accept
CAP referrals.
DEF’s CAP responsibilities include verification of eligibility, recertification, and day-to-day
account monitoring. The agency has a network of community based organizations that are
available to complete CAP applications for eligible customers.
DEF’s responsibilities are as follows.
Serve as the primary contact for all Universal Service Program communications.
Provide bi-lingual Spanish speaking customer service representatives.
Record customer calls and make call recordings available as requested.
Provide a Customer Relationship Management (CRM) system, document all customer
interactions, and provide reports on those interactions.
Screen each low-income customer for CAP, service restoration needs, and available
energy assistance.
Complete CAP and Dollar Energy Fund Hardship Grant applications. Complete phone
applications for customers who are unable to apply at an agency.
Process grants.
Make direct referrals for Crisis and provide LIHEAP outreach as needed during the
winter season.

www.appriseinc.org Peoples Universal Service Programs
APPRISE Incorporated Page 7
Provide custom software (OSCAR and iPartner©) for program administration and
reporting.
Provide audit services for each program.
Monitor CAP accounts for high usage and high CAP credits according to processes
developed and maintained in Peoples billing system, including contacting customers on a
timely basis and accurately recording justification of high usage or high CAP credit.
Provide document imaging and electronic storage of all customer documentation
including income documentation records.
Recruit, manage, and train all partner agencies/subcontractors.
Utilize Agency Partners for application intake services. Train intake workers to complete
applications for CAP and Hardship programs. Provide all agency workers with access to
OSCAR and iPartner.
Refer eligible customers to other utility CAPs administered by DEF.
When DEF’s role was expanded, Peoples provided training on poverty and poverty issues,
aiming to ensure sensitivity for limited-income customers. They incorporated active
listening to provide the representatives with tools to work with customers who had difficulty
paying their bill or were having their service terminated. Their goal was to have the DEF
representatives become experts in the program and thoroughly screen the customer for any
available services.
Peoples’ training sessions explained that the representatives have the ability to resolve
situations for these customers. If a customer calls with a termination notice, the
representative can refer to the customer to Crisis, LIHEAP, the DEF hardship fund, or CAP.
If a customer has never been on CAP, this can resolve the termination issue and provide all
the benefits of the program.
Community-based organizations (CBOs) have the following requirements and
responsibilities.
High-quality customer service.
Access to a computer with high speed internet.
Register as an OSCAR and/or iPartner© user.
Schedule CAP and Hardship application appointments.
Complete CAP application intake for eligible customers.
Transmit and securely store customer documents as required.
DEF provides their proprietary Online System for Customer Assistance Records (OSCAR) to
manage the CAP workflow. The system provides real-time access to program statistical
reports.
Very few customers visit an agency to enroll in CAP. Agencies have been trained to screen
customers for CAP if they come to the agency to apply for the DEF hardship fund. When the
agency screens for DEF, they can also screen for CAP and provide the CAP enrollment.

www.appriseinc.org Peoples Universal Service Programs
APPRISE Incorporated Page 8
Agency enrollment was developed mainly for those customers who were unable to enroll by
phone. Customers can enroll by phone without income verification if they received
LIHEAP. If this is the case, DEF takes the customer’s verbal income report to enter in the
system and to place the customer in a CAP tier. If the budget payment is lower, the system
will automatically select the budget amount as the CAP payment.
If the customer has not received LIHEAP, the customer is asked to send in proof of income.
When the income information is sent in and approved, the customer is enrolled in CAP. At
the time of CAP enrollment, customers are given a handout with energy conservation tips
and a copy of the CAP customer agreement so they know how to be successful in CAP.
Eligibility and Benefits
Customers with income at or below 150 percent of the Federal Poverty Level are income-
eligible for CAP. The customer must also have active residential heating service and be
classified as payment-troubled. Peoples defines a customer as payment-troubled if any of the
following situations exist.
An arrearage, broken payment arrangement, or termination notice.
Housing and utility costs that exceed 45 percent of the household’s total income. Housing
and utility costs are defined as rent or mortgage, property taxes, gas, electric, water,
telephone and sewage.
Disposable income of $100 or less after subtracting all household expenses from
household income.
Peoples is flexible on the payment-troubled status requirement for CAP enrollment. If CAP
appears to be the most beneficial payment plan for the customer, then Peoples will enroll a
customer who is seeking assistance. In some cases where customers are fairly current on
their bill because they received LIHEAP, the budget payment may be more beneficial than
CAP if they have no pre-CAP arrearages.
Customers may enroll in CAP without providing income documentation if they have received
a LIHEAP payment within the past two years. Peoples will also accept participation in an
electric CAP program as verification of income if the customer provides written
authorization for the CAP administrator to utilize income documentation submitted by the
customer to enroll in the electric CAP. Customers who would like the CAP administrator to
use income information on file for another utility’s CAP program are mailed a form that can
be signed and returned to complete CAP enrollment.
The benefits of CAP participation include the following.
An affordable monthly payment based on ability to pay.
Monthly CAP credits.
Monthly arrearage forgiveness when timely CAP payments are received.
Exemption from late payment charges and waived security deposits.
Referrals to other Universal Service Programs and assistance programs

www.appriseinc.org Peoples Universal Service Programs
APPRISE Incorporated Page 9
Eligible customers agree to pay eight, nine, or ten percent of their verified before-tax
monthly income for natural gas service, depending on household poverty level, as shown in
Table II-6. The minimum monthly payment is $25. In addition to the percentage of income
amount, CAP customers pay five dollars per month toward their pre-CAP balance, and a
CAP plus amount to account for potential LIHEAP benefits.
Table II-6
Customer Assistance Program Payment
Federal Poverty Status Percent of Income
0-50% 8%
51-100% 9%
101-150% 10%
If the participant’s monthly CAP payment exceeds the budget payment amount, the monthly
budget payment amount is accepted as the CAP payment. Peoples Natural Gas reviews the
customer’s payment amount during recertification to determine if the customer’s budget or
calculated payment plan continues to be the lowest payment available.
Starting in January 2016, Peoples began a monthly manual CAP payment review process to
provide a more timely review of CAP payment amounts. Peoples completed the modification
of its billing system in August 2016 to automate this process, reducing the need for the
manual reviews and implementing changes to the customer’s payment amount without
manual review. The review is done during the billing process.
The review is based upon annual usage to ensure customers maintain an affordable and stable
payment amount over a 12-month period. If a change to the budget and/or calculated
payment amount would result in a more beneficial payment amount for the customer, the
payment amount is changed and the customer is notified by mail. In order to maintain a
stable payment, absent any special circumstances such as billing adjustments, the payment is
changed no more often than once every three months.
Customers who report that they do not have income can be enrolled or continue to participate
in CAP by providing proof of support. Proof of support can be submitted as a letter or other
documentation from a friend, family member or social agency that provides support to the
customer for essential living expenses. Zero income customers are billed the CAP minimum
payment.
CAP credits are applied on a monthly basis when the CAP bill is issued to the customer,
rather than when payments are received. This was a change that was made after Peoples
acquired Equitable to bring the programs in line with one another. The change was made on
June 1, 2015. The CAP credit is defined as the difference between the CAP customer’s actual
usage bill and the CAP monthly bill.

www.appriseinc.org Peoples Universal Service Programs
APPRISE Incorporated Page 10
CAP payments received by customers that exceed the CAP amount due are used to reduce
the following month’s CAP payment amount (began in January, 2016).
CAP Plus
The CAP Plus amount is calculated as the LIHEAP receipts for customers participating in the
CAP program for the previous LIHEAP heating season divided by number of current active
CAP participants and the projected number of CAP participants to join CAP that quarter.
The CAP Plus amount is added to the calculated monthly CAP payment amount for all
participating CAP customers.
The CAP Plus amount is not broken out in the customer’s bill. CAP Plus is embedded in the
CAP payment, but it is broken out in the billing system. The representatives know the CAP
Plus amount and advise the customer of the CAP payment including the CAP Plus amount.
CAP Plus has varied over time as shown in Table II-7. It was introduced in November 2014
for Peoples and in March 2016 for Equitable.
Table II-7
CAP Plus Monthly Charge
Division November 2014 February 2016 March 2016 July 2016
Equitable -- -- $7 $7
Peoples $6 $6 $5 $8
T.W. Phillips $3 $9 $8 $8
Arrearage Forgiveness
CAP customers with pre-program arrearages are eligible for Arrearage forgiveness credits
equal to 1/36th of their pre-program balance when the customer pays the required CAP
payment. CAP participants can completely remove their pre-program balance over a three-
year period. Arrearage forgiveness credits are provided when the customer provides full
payment of their CAP payment amount due. Effective June 1, 2016, Arrearage forgiveness
benefits are provided for each on-time and in-full monthly CAP payment, regardless of
whether the customer owes past due CAP payment amounts.
Arrearage forgiveness is applied retroactively to any months missed once the CAP customer
catches up on any missed payments. This was a change made on June 1, 2016. In the past,
the customer had to be current on the bill to receive forgiveness. With this change, if the
customer is three CAP payments behind and they make two CAP payments, they receive the
arrearage forgiveness for those two payments.
Monthly bills paid by a LIHEAP cash grant, in full or in conjunction with a customer
payment, receive arrearage forgiveness.

www.appriseinc.org Peoples Universal Service Programs
APPRISE Incorporated Page 11
Outreach
Peoples provides outreach for CAP and other Universal Service Programs through the
Customer Service Center, the Company website, and other media.
Fliers are included with termination notices to inform customers of available programs.
Bill inserts, press releases and other information are provided to the public to encourage
referrals.
Community-based agencies receive information on these programs and are encouraged to
make referrals.
Program information is distributed to social service agencies, community leaders and
Company personnel.
Meetings are held with social service agencies, elected officials, and other community
groups to provide current information on available programs.
Peoples utilizes the Southwestern PA 2-1-1 for referrals and provides updated
information to the Company’s Universal Service Advisory Group.
Peoples continues to consider ways to streamline the application and recertification process
for all programs so that customers may complete one application to participate in multiple
programs and existing proof of income may be used for multiple programs.
Potentially eligible customers are identified through their income data that is documented in
the Company’s billing system. Customer Service Center Representatives receive training on
identification of potential referrals to all Universal Service Programs. Field Metering Service
Personnel also make referrals to Universal Service Programs.
Peoples encourages customers to apply for LIHEAP with bill inserts, posters, outreach,
community events, and application assistance. If requested, Peoples will hand write the
LIHEAP application for the customer and mail it to the customer to be signed and submitted.
DEF asks customers if they applied for LIHEAP/Crisis if they are eligible. Customers must
apply for LIHEAP/Crisis prior to receiving the DEF hardship grant.
Enrollments and Referrals
CAP applications are available through DEF. All customers who are referred to the
Universal Service 800 number are screened to determine eligibility for all available internal
and external assistance programs including CAP, LIURP, LIHEAP, CARES, and Hardship
Funds.
Prior CAP customers who apply for service within sixty days of service termination or
discontinuance are considered active participants provided that they pay their CAP bill
arrearage. An applicant with an outstanding balance may enroll in CAP upon initiation of
service once restoration requirements are met.
DEF is responsible for documenting program enrollment in Peoples’ Customer Information
System and for mailing the enrollment notification package to enrollees. The package
includes an enrollment notification letter, the program agreement, and education materials.

www.appriseinc.org Peoples Universal Service Programs
APPRISE Incorporated Page 12
DEF mails customers who are not successfully enrolled a letter that states the reasons they
were ineligible and directs them to contact DEF with any questions.
DEF ensures that eligible CAP applicants apply for LIHEAP and/or Crisis. The CAP
enrollment is completed after LIHEAP grants are posted to customers’ accounts so that these
benefits are posted to their pre-program arrearages rather than replacing their monthly CAP
payments.
DEF does not fill out LIHEAP applications in their office. Instead, they refer customers to
the county assistance office or to a website where they can do it online. They will also send
the customer a LIHEAP application, but near the end of the LIHEAP season, they will
encourage customers to go in-person or apply online because of the time to receive the
application in the mail. If a customer has a medical issue and cannot submit the application,
DEF will send an email to the CARES program and the CARES representative will start a
grant application, fill it out, and mail it to the customer to sign and mail back in.
Recertification
CAP recertification is generally completed on an annual basis. Customers who have received
LIHEAP in the past 24 months or who have certain fixed income types (pension, social
security, or disability) are recertified once every two years. DEF sends a letter 60 days prior
to the recertification date, requesting that the customer submit proof of income to remain
active in the CAP program. A second letter is mailed 30 days later. If the customer does not
provide the required income documentation within the 60-day period, the customer will be
dismissed from CAP.
Removal
The Company monitors accounts for changes in family size or income, timely payments,
appropriate usage, and timely meter readings. A CAP participant’s failure to comply with
one or more of the following rules may result in CAP removal.
Allow access to or provide customer meter readings (cannot miss four consecutive
months).
Report changes in income or family size.
Recertify as requested and/or to meet eligibility requirements.
Do not use natural gas for recreational purposes.
In the past Peoples sent a reminder letter to customers who did not make their CAP payment,
but they have discontinued this process. Peoples does not remove customers from CAP for
failure to pay, but they begin the termination process.
Peoples follows normal collections procedures for CAP participants who do not make their
payments in a timely manner. Customers who do not make their monthly payments may be
placed in collections and have their service terminated. To avoid termination, the customer
must pay the amount set forth in the termination notice prior to the scheduled termination
date.

www.appriseinc.org Peoples Universal Service Programs
APPRISE Incorporated Page 13
If a customer has service restored within 60 days of termination, the customer only needs to
pay the CAP arrearage to be reconnected and continue in CAP. The pre-program arrears do
not need to be paid.
If it has been more than 60 days since the customer was terminated, the customer returns to
regular collections and Peoples follows the PUC rules for quoting restoration amounts. If the
customer had a previous payment arrangement, the customer would be responsible for the
full balance including the pre-CAP arrearage. If the customer had not had a payment
arrangement other than CAP, the customer can pay 1/24 of the balance including pre-
program arrearages. Once the customer has service restored, the customer can reapply for
CAP.
Control Features
Peoples monitors CAP accounts to ensure that customers comply with the terms of the
program and receive the proper benefits from CAP and other Universal Service Programs.
They enforce the following control mechanisms.
Minimum Payment: The minimum payment for a heating account is $25 per month plus
$5 for the arrearage for a total minimum monthly payment of $30.
LIURP Prioritization: While CAP customers could be required to participate in LIURP
based on CAP requirements, Peoples has not removed CAP participants for refusing
LIURP services because it may be beyond the customers’ control, specifically if the
landlord does not provide permission.
LIHEAP Application: CAP customers who meet the LIHEAP eligibility criteria are
encouraged to complete an application. CAP participants are asked to direct payment of
any LIHEAP cash benefit grant that they receive to Peoples.
Energy Conservation: At the time of CAP enrollment, participants receive information on
conservation tips and weatherization programs. Customers with a history of high energy
usage are referred to LIURP and any other appropriate programs. All participants are
advised that their usage will be reviewed on an ongoing basis and unjustified excess CAP
usage may be billed to the CAP customer or the CAP customer may be removed from
CAP.
Review of Energy Usage: Peoples generates a daily report that allows the Company to
identify CAP customers whose weather-normalized annual usage has increased by more
than 25 percent. When a CAP customer’s account appears in the report, the Company
representative takes the following steps.
o The account is reviewed and the customer is contacted to determine if the increase in
gas usage is justified due to an increase in household size, serious illness of a family
member, or usage was beyond the household’s ability to control. Peoples has a
questionnaire they provided to DEF to use when discussing usage with the customer.

www.appriseinc.org Peoples Universal Service Programs
APPRISE Incorporated Page 14
The majority of the cases reviewed meet one of these justified reasons for an increase
in usage.
Number of people living in the home increased
Medical condition in the home
New gas appliances installed
Furnace condition
Window condition
Attic insulation condition
Home drafts
Whether home has been weatherized
Other reasons
If DEF does not get in touch with the customer on the phone, they mail the
questionnaire, the customer fills it in and mails it back, and they use that information.
Very few customers have an unjustified increase in usage.
o Special needs customers identified through this process are referred to CARES.
o Any customer with unjustified excess usage is contacted and provided with
conservation information, tips for decreasing usage, and referred to weatherization
programs. Unjustified excess usage may be billed to the CAP customer or the CAP
customer may be removed from CAP.
High CAP Credits: Peoples generates a report to monitor customers who exceed $1,000
in annual CAP credits. Customers are notified of their current use of CAP credits and
offered information about the LIURP weatherization program when they reach $500 in
CAP credits and $750 in CAP credits annually. The notification includes a description of
the customer’s responsibility to monitor gas usage and advises the customer that he/she
may be responsible for CAP credits over $1,000.
o When an account exceeds the $1,000 CAP credit, the account is reviewed and the
customer is contacted to determine if excess CAP credits are justified. DEF completes
a questionnaire with the customer. Justification may include an increase in household
size, serious illness of a family member, usage beyond the household’s ability to
control, or a very low CAP payment. Special needs customers identified through this
process are referred to the CARES program. High usage customers are referred for
weatherization.
o Unjustified CAP credits in excess of $1,000 may be reversed and the resulting bill
will be the responsibility of the CAP participant.

www.appriseinc.org Peoples Universal Service Programs
APPRISE Incorporated Page 15
Extended CAP Pilot (E-CAP)
Peoples E-CAP is a three-year pilot payment plan for low-income, payment-troubled
customers with household incomes between 151 and 200 percent of the Federal Poverty
Level.
Customers are eligible for Pilot E-CAP if they meet the following criteria.
Income between 151 and 200 percent of the Federal Poverty Level.
Active heating customer.
Significant account balance.
Prior broken payment arrangement, an active termination notice, or lack of utility service.
Applied for a Dollar Energy Grant to reduce the delinquent balance prior to entering E-
CAP if funds are available.
Enrollment is focused on customers with balances of $800 or more, but customers with lower
balances may be enrolled if circumstances warrant.
The program benefits are as follows.
Affordable monthly payments based on ability to pay.
Monthly CAP credits.
Monthly arrearage forgiveness when timely CAP payments are received.
Exemption from late payment charges and waived security deposits.
Referrals to other Universal Service Programs and assistance programs.
The affordable E-CAP payment is the lower of 11 percent of verified before tax monthly
income or the account specific budget payment. E-CAP participants are subject to CAP Plus.
In addition to the calculated E-CAP payment, participants pay $5 per month towards their
pre-program arrears.
Peoples provided the following budget for E-CAP shown in Table II-6.
Table II-6
E-CAP Budget
Year Peoples Division Equitable Division Total
2015 $321,950 $391,050 $713,000
2016 $386,000 $469,000 $855,000
2017 $450,700 $547,400 $998,100
Peoples identified the number of potentially eligible customers based on account-specific
income and balance information. Table II-7 shows that they estimated approximately 2,800
participants in 2017.
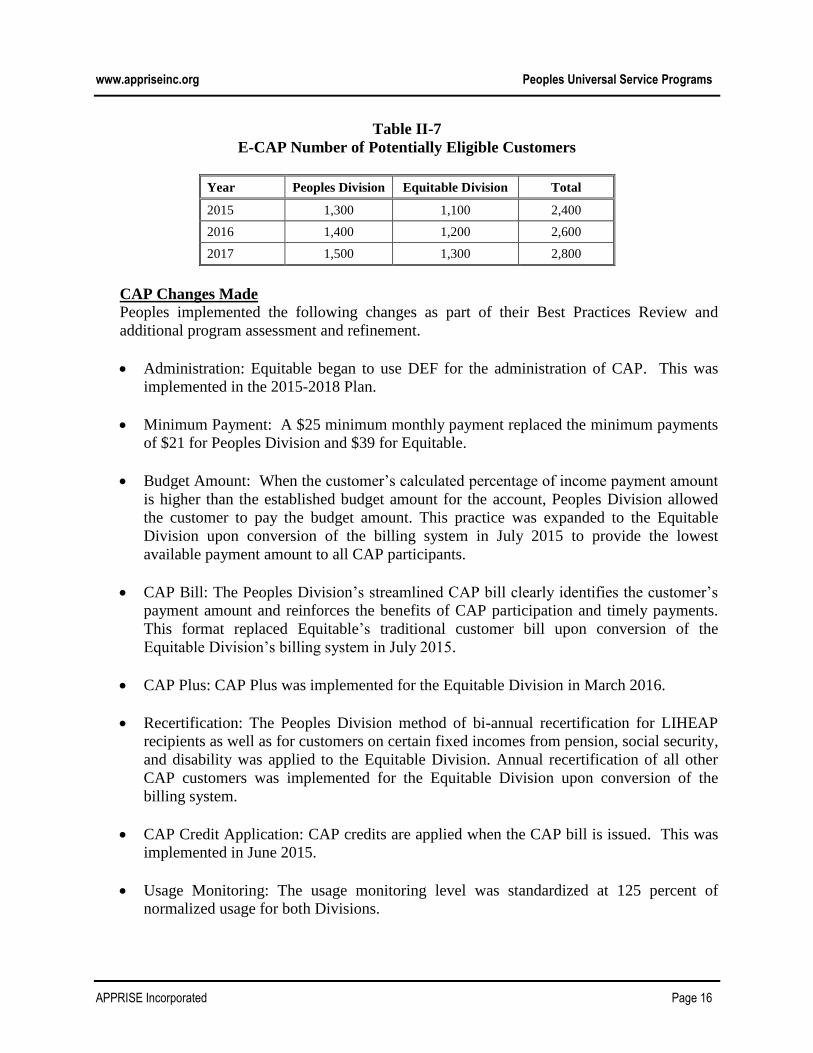
www.appriseinc.org Peoples Universal Service Programs
APPRISE Incorporated Page 16
Table II-7
E-CAP Number of Potentially Eligible Customers
Year Peoples Division Equitable Division Total
2015 1,300 1,100 2,400
2016 1,400 1,200 2,600
2017 1,500 1,300 2,800
CAP Changes Made
Peoples implemented the following changes as part of their Best Practices Review and
additional program assessment and refinement.
Administration: Equitable began to use DEF for the administration of CAP. This was
implemented in the 2015-2018 Plan.
Minimum Payment: A $25 minimum monthly payment replaced the minimum payments
of $21 for Peoples Division and $39 for Equitable.
Budget Amount: When the customer’s calculated percentage of income payment amount
is higher than the established budget amount for the account, Peoples Division allowed
the customer to pay the budget amount. This practice was expanded to the Equitable
Division upon conversion of the billing system in July 2015 to provide the lowest
available payment amount to all CAP participants.
CAP Bill: The Peoples Division’s streamlined CAP bill clearly identifies the customer’s
payment amount and reinforces the benefits of CAP participation and timely payments.
This format replaced Equitable’s traditional customer bill upon conversion of the
Equitable Division’s billing system in July 2015.
CAP Plus: CAP Plus was implemented for the Equitable Division in March 2016.
Recertification: The Peoples Division method of bi-annual recertification for LIHEAP
recipients as well as for customers on certain fixed incomes from pension, social security,
and disability was applied to the Equitable Division. Annual recertification of all other
CAP customers was implemented for the Equitable Division upon conversion of the
billing system.
CAP Credit Application: CAP credits are applied when the CAP bill is issued. This was
implemented in June 2015.
Usage Monitoring: The usage monitoring level was standardized at 125 percent of
normalized usage for both Divisions.

www.appriseinc.org Peoples Universal Service Programs
APPRISE Incorporated Page 17
Pilot Extended Customer Assistance Program (E-CAP): A three-year pilot program was
introduced in the 2015-2018 Plan to serve customers with significant balances and annual
incomes between 151 and 200 percent of poverty. The program is focused on enrolling
customers below 175 percent of the Federal Poverty Level, but is available for customers
in need up to 200 percent.
CAP Challenges and Successes
The DEF call center noted that the greatest challenge with CAP is obtaining information
from customers to prove their income level if they have not received LIHEAP. They ask
customers to send their last two pay stubs and proof of employment, but customers do not
always follow through. There are times when DEF only receives partial income
documentation even though they have sent letters and made several attempts to contact the
customer. This is especially a challenge in termination season when the customer has a
termination notice and there is a time limit.
The ongoing challenge is to encourage customers to consistently make their payments. CAP
is designed to be the most affordable payment and customers receive the benefit of arrearage
forgiveness. Getting customers to follow through and make those regular payments is a
challenge. This makes it difficult for customers to keep service and reduce their balances.
Peoples plans to focus on this topic at a future Advisory Group meeting this year. Peoples
hears from the agencies that the problem relates to financial literacy. The participants live
from one crisis to the next and have a difficult time with monthly budgeting.
Programming the billing system for CAP is also a challenge. If CAP customers enrolled,
remained on the program for 36 months, and made their payments, it would be
straightforward and work very well. However, this is rare because customers move, they
have their service disconnected and reconnected, and they come on and off CAP, and that
complicates the billing.
CAP provides an affordable payment, waives late payment charges, and helps the customer
to maintain utility service. This is especially needed for customers on a limited income who
don’t have the funds to pay the full utility bill. By providing the affordable payment, the
customer can begin to become a regular ratepayer again. The customer will receive the
benefit of the CAP credit and the arrearage forgiveness. It is the best program for customers
on a limited income.
Peoples was the first utility in PA to offer CAP benefits to customers between 150 and 200
percent of the poverty level. This program was approved as a three-year pilot in December
2015 and started in early 2016. Customers in this income range with significant balances can
participate in CAP and receive arrearage forgiveness. The traditional payment arrangement
can make customers’ payments be fairly high and not manageable, so Peoples wanted to
provide a payment option that these customers can afford, so they can clear their balance. If
DEF grants are available, these customers are required to apply for that grant first, and any
balance that is left can go into the CAP pre-program arrears for arrearage forgiveness.

www.appriseinc.org Peoples Universal Service Programs
APPRISE Incorporated Page 18
Additional Changes under Consideration
Peoples is considering the following additional program refinements.
Review all customer letters to assess opportunities for improvement.
Assess how to make the recertification process more informative for customers. The
customers may not understand what it means when they are asked to update their CAP
information.
Make it easier for customers to provide income documentation, and to participate and
remain in the program. Peoples would like to provide additional mechanisms for
customers to submit their income documentation. Currently, customers can only mail or
fax in the documentation, which requires a trip to the post office or library. DEF is
working with a vendor to provide a method to allow customers to upload documents from
a smart phone.
Help customers recognize the benefits of CAP so they have motivation to make their
payments and remain in the program. The CAP bill was designed to focus on the CAP
credits. Information on the arrearage forgiveness is there, but could be emphasized more
so that participants are more motivated to prioritize their CAP payment each month.
Provide more education on the front end and ensure that they are doing a good job of
explaining the benefits. The welcome packet has information, but they want to make sure
that it emphasizes the benefit of making the monthly payment and of being on CAP.
There is room to make it more customer-friendly, and to help participants see the
benefits.
C. Hardship Fund The Peoples Hardship Fund works in partnership with DEF to provide grants to customers
who are behind on their natural gas bills.
Goals and Resources
The Hardship Fund is provided through Peoples’ donations and customers’ donations.
Peoples contributes up to $550,000 annually to match customers’ donations and contributes
up to $110,000 for administrative costs. Within that total, $330,000 was allocated for
Peoples customers and $220,000 for Peoples/Equitable Division customers (however, going
forward the funds will not be separated by division.) While $66,000 is allocated for Peoples
administrative costs, $44,000 is allocated for Equitable Division’s administrative costs.
Peoples continues to explore ways to increase customer donations to assist in meeting the
matching funds as well as to encourage the Dollar Energy Fund to increase its fundraising
programs.
Table II-8 displays the Hardship Fund Budget. The budget has been $660,000 each year.

www.appriseinc.org Peoples Universal Service Programs
APPRISE Incorporated Page 19
Table II-8
Hardship Fund Budget
Year Peoples Division Equitable Division Total
2015 $396,000 $264,000 $660,000
2016 $396,000 $264,000 $660,000
2017 $396,000 $264,000 $660,000
2018 $396,000 $264,000 $660,000
Participation in the Hardship Fund is impacted by customers’ donations. Peoples estimates
that 1,500 customers from the Peoples Division and 900 customers from the Equitable
Division will receive grants from the Hardship Fund annually for the next four years.
During the 2014-2015 program year, Peoples customers received a total of $1.1 million in
grants. This includes the matching grant from DEF. Beginning in 2016, the Peoples and
Equitable programs were managed through one fund, so separate financials are not available.
Table II-9
Hardship Ratepayer Contributions and Benefits
Year
Ratepayer Contributions Utility & Shareholder
Contributions Benefits Distributed
Peoples
Division
Equitable
Division Total
Peoples
Division
Equitable
Division Total
Peoples
Division
Equitable
Division Total
2012-2013 $172,223 $86,128 $258,351 $358,954 $200,000 $558,954 $600,000 $400,000 $1,000,000
2013-2014 $169,048 $85,286 $254,334 $659,105 $20,000 $679,105 $599,186 $400,000 $999,186
2014-2015 $170,653 $86,942 $257,595 $726,895 $480,000 $1,206,895 $660,814 $440,000 $1,100,814
2015-2016 $318,641 $1,210,000 $1,100,000
Table II-10 shows that over 3,000 customers received hardship fund grants in 2016.
Table II-10
Hardship Participants
Year Peoples Division Equitable Division Total
2012-2013 1,493 1,028 2,521
2013-2014 1,559 994 2,553
2014-2015 1,759 1,258 3,017
2015-2016 3,019
Table II-11 shows that the average grant was $364 in 2016.

www.appriseinc.org Peoples Universal Service Programs
APPRISE Incorporated Page 20
Table II-11
Hardship Average Grant
Year Peoples Division Equitable Division Total
2012-2013 $402 $389 $397
2013-2014 $384 $402 $391
2014-2015 $376 $350 $365
2016 $364
Program Management and Administration
DEF is an independent, nonprofit organization that provides utility bill financial assistance to
low-income customers. DEF partners with community-based organizations (CBOs) to accept
applications. Peoples’ customers may be referred to any DEF community-based screening
agency to complete an application. There are over 150 organizations that participate and
some organizations may have multiple locations, so there are several hundred physical
locations where customers can apply.
DEF developed an on-line application process which enables Peoples to review grant
applications more quickly. The agencies that process the grant applications refer eligible
customers to CAP, LIURP and CARES as well.
If customers call DEF to apply for CAP, DEF can take the hardship fund application as well.
However, if the customer is not applying for CAP, then the customer must go to a CBO. The
CBOs can often connect the client with other agencies that offer other services, including
food, clothing, or childcare assistance.
If a customer applies for DEF through an agency, they must go in-person and cannot call
because they need to sign that the information is complete, that they understand that the grant
is not guaranteed, and that the agency needs proof of income. However, there is the ability to
apply by phone if a customer says it is impossible for them to get to the CBO.
DEF will sometimes aim to save the DEF grant funds for other customers who are not on
CAP. However, they will allow CAP customers who have received a termination notice to
apply for the hardship fund grant. If a customer’s service is shut off, the customer would
need the hardship grant to get their services restored and then have CAP to move them
forward in paying their bill. A DEF grant can reduce a customer’s balance before they are put
on CAP and then they would have a reduced payment through CAP, so this would be best for
the customer and for the program.
Eligibility and Benefits
The DEF Program is open from October 1st to September 30th, and grants are provided until
available funds are exhausted. Customers must meet the following criteria to be eligible for
the Hardship Fund.

www.appriseinc.org Peoples Universal Service Programs
APPRISE Incorporated Page 21
Apply for LIHEAP and Crisis benefits if eligible.
Household income at or below 200 percent of the poverty level.
Paid at least $150 toward their utility bill over a ninety-day time period, or at least one
$100 payment in the last six months if over 62.
Have a balance of at least $100 if under 62. There is no balance requirement for
applicants over 62.
Have a residential heating account.
When the Hardship Fund opens on October 1, the customer must either be terminated or be
in threat of termination to receive a grant. Then, from December to January 31, the
customer’s service must be terminated to receive a grant. In February, DEF can again help
customers in threat of termination, and on March 1, customers can receive help regardless of
their service status.
If the customer is in threat of termination and needs less than $500 to stop the termination or
restore service then Peoples will stop the termination or restore service immediately. If not in
this situation, then Peoples receives a notification in the weekly report that DEF send to
Peoples. This weekly report includes a list of all customers who received assistance so that
the payment can be posted to their account.
The customer may receive up to $500, but the grant will the amount that the customer needs,
and they will never create a credit on the account.
At the time of DEF application, customers are referred to the following programs.
FirstEnergy or Duquesne Light for CAP assistance with electric bills
Pennsylvania American Water for assistance with water bills
Other Peoples’ Universal Service Programs
LIHEAP
Crisis
If some other need becomes apparent during the call, DEF will make other referrals, such as
to a food pantry.
Outreach
Peoples promotes the DEF and encourages customer donations through the following
outreach.
Donation requests are made with program information in bill inserts, new customer
welcome packets, press releases, and bill messaging. Customers are asked to add a dollar
or more to their utility payment.
A DEF Pledge form is provided on the back of the bill to allow customers to designate a
particular donation amount to be added to their bills on a monthly basis.
DEF is promoted on the Company’s website and is available for customers who elect to
receive their bills electronically.
Peoples provides sponsorship of the DEF fundraising activities.

www.appriseinc.org Peoples Universal Service Programs
APPRISE Incorporated Page 22
Peoples participates in promotional activities with Lernerville Speedway, the Pittsburgh
Pirates, and sponsors promotional events at the Altoona Curve, Minor League Baseball
Team.
Peoples developed a signature event in partnership with Hearth and Home entitled the
Warm Your Hearth...Touch a Heart Campaign featuring television advertisements, an
annual reception, silent auction, and matching donations from Hearth and Home.
Peoples employee support is encouraged through donations that are made on “Casual
Fridays.”
Customers referred to the Universal Service Programs are screened for DEF eligibility and
referred to the program. Training is conducted for Customer Service Supervisors and
representatives so that they can make referrals to eligible customers.
Hardship Fund Changes
The available funds for the two Divisions were combined in October 2015 to provide one
Hardship Fund for all Peoples customers. This change was made to provide equal
opportunities to customers in the combined service territory and to improve the efficiency of
administration.
Peoples has broadened its outreach to increase the visibility of DEF and to encourage
donations to the Fund. Examples include partnerships with the Altoona Curve, Hearth and
Home Furnishings, Pittsburgh Pirates, Lernerville Speedway and KDKA Television. Peoples
has also investigated partnering with United Way’s Southwestern PA 2-1-1 Information and
Referral Program to streamline application processes and provide assistance to as many
eligible customers as possible.
As part of the Merger agreement, Peoples increased their contributions to DEF by ten percent
(donations and administration) annually for the next five years.
Challenges and Successes
One challenge faced in DEF is that applications are sometimes rejected for minor
discrepancies. Peoples feels that DEF could improve by working with the customers and
providing better communication rather than rejecting the customer.
The DEF is very important for customers who are facing payment challenges. This was
particularly the case in 2016 when LIHEAP shut down on March 31 and termination season
was beginning on April 1. As a result, DEF was the only assistance available, and they did a
very good job of quickly processing the applications.

www.appriseinc.org Peoples Universal Service Programs
APPRISE Incorporated Page 23
D. CARES The CARES program provides comprehensive services for customers who may have an
inability to pay their gas bills and/or have special needs.
Goals and Resources
The table below provides the budget for CARES. In 2018, the total budget will be just under
$400,000.
Table II-12
CARES Budget
Year Peoples Division Equitable Division Total
2015 $212,729 $159,257 $371,986
2016 $216,819 $163,348 $380,167
2017 $221,032 $167,560 $388,592
2018 $223,983 $171,983 $395,966
CARES provides assistance to approximately 500 customers each year for the Peoples
Division and 600 customers each year for the Equitable Division. CARES also provides
outreach to low-income customers to increase participation in energy assistance programs
and the Earned Income Tax Credit (EITC).
Table II-13 provides the actual CARES expenditures for 2013 through 2016. Expenditures
were just over $200,000 in 2016.
Table II-13
CARES Expenditures
Year Peoples Division Equitable Division Total
2013 $157,244 $226,294 $383,538
2014 $140,900 $164,228 $305,128
2015 $101,173 $104,307 $205,480
2016 $120,010 $85,398 $205,408
Table II-14 provides the actual CARES participants for 2013 through 2016. There was a
total of 365 participants in 2016.

www.appriseinc.org Peoples Universal Service Programs
APPRISE Incorporated Page 24
Table II-14
December CARES Participants
Year Peoples Division Equitable Division Total
2013 472 665 1,137
2014 526 6 532
2015 326 618 944
2016 295 70 365
Program Management and Administration
The CARES Program is administered by Peoples’ staff who work with agencies throughout
Peoples’ service territory to stay informed of available programs and to better serve low-
income customers. The community and social service organizations include the following.
Health and Welfare Council
Department of Aging
Allegheny County Community Services Advisory Council
Health Department
Pennsylvania Department of Human Services
Tri-Valley Energy Partners
Social Service Agency Providers Council
Cambria County Energy Crisis Council
Peoples receives CARES referrals from a variety of sources, including customer service
representatives, field customer service personnel, social service staff, community-based
organizations, and the Commission. Peoples employs two certified social workers on its
Customer Relations’ staff to support the needs of customers with special circumstances.
Peoples promotes the Universal Service Programs by maintaining contact with community
service organizations throughout the Company’s service territory. The Company also
promotes the programs through focused articles in bill inserts, its website, informational
sessions, and distributing the “Customer Referral Guide” for use by the social service
agencies, and customer contact employee training.
Eligibility and Benefits
Any special needs customer in danger of losing heat due to non-payment or heating
equipment failure may be referred to the CARES program for assistance. Special needs
include a serious medical condition, a mental health condition, limited learning ability, recent
unemployment, and single parent issues, as well as other special needs. Customers identified
through the Gatekeeper program, regardless of financial need, may be referred to CARES.
CARES provides short-term assistance to ensure that customers are able to access the
resources that they are referred to. The program referrals include Peoples’ Universal Service
Programs, available energy assistance sources, and public assistance such as Supplemental

www.appriseinc.org Peoples Universal Service Programs
APPRISE Incorporated Page 25
Nutrition Assistance Program (“SNAP”), and Medicaid. CARES customers receive
substantial financial assistance from social service agencies including Catholic Charities, the
Salvation Army, and St. Vincent de Paul Society, in addition to traditional energy assistance
programs.
The CARES program also includes the Gatekeeper program which is designed to aid older
adults and special needs customers who need help, but may not be able to access it
themselves. Customer contact personnel are trained as “gatekeepers” to recognize danger
signals such as changes in behavior, signs of confusion, or disability. Gatekeepers report the
situation, and referrals are made to third party agencies or family members are alerted.
Thermostats for vision-impaired customers are available for those who have been medically
identified as having severe vision impairment. Peoples provides and installs these devices
free of charge. Customers can also request large print bills or Braille bills.
Peoples promotes the Earned Income Tax Credit Program (“EITC”) to educate eligible
customers on the availability of the EITC and how to obtain the credit through the filing of
their income taxes.
LIHEAP is an important component of CARES. Peoples identifies income-eligible customers
and promotes the program through bill inserts, radio and television ads, press releases, press
conferences, and customer letters. Peoples also partners with Columbia Gas to provide
outreach to encourage eligible customers to apply for the program. Peoples’ customers may
call the Universal Service 800 number to request a LIHEAP application. The Universal
Service number is available throughout the year, and referrals are made for programs that are
open at any given time including, but not limited to, CAP, LIHEAP, LIHEAP-CRISIS,
LIURP, CARES and Dollar Energy Fund.
Changes
The CARES program for the Peoples Division required customers to have income at or
below 200 percent of the Federal Poverty Level and be payment-troubled in addition to
demonstrating special needs. The Equitable Division did not have an income requirement and
provided CARES services to any special needs customer in danger of losing heating service
due to non-payment or heating equipment failure. As part of its Best Practices review,
Peoples expanded the eligibility for CARES in its Peoples Division to coincide with the
practice of its Equitable Division.
Other changes include the following.
Peoples increased EITC outreach with expanded use of bill inserts and website
information.
Peoples implemented a web portal to enable remote access for the PA Department of
Human Services and social service agencies to determine program eligibility. Peoples
provided training and conducted outreach to increase visibility and encourage usage of
the portal.

www.appriseinc.org Peoples Universal Service Programs
APPRISE Incorporated Page 26
Peoples increased participation in events to facilitate referrals and enhance program
awareness such as Be Utility Wise, Department of Aging Fairs, Legislative/Senior Fairs,
and other events.
Peoples investigated partnering with United Way’s Southwestern PA 2-1-1 Information
and Referral Program to streamline application processes and provide assistance to as
many eligible customers as possible.
CARES Challenges and Successes
Challenges faced in CARES include reminding Peoples personnel and training new staff
about the program, keeping up to date with which social service agencies in the territory have
funding to help customers or to provide other services, and maintaining contact with the
agencies.
Peoples has conducted training with field employees so they will more easily recognize
situations they need to refer to CARES. They also conduct regular trainings with their call
center and the DEF call center. As a result of this training, Peoples receives many CARES
referrals, which can be challenging.
Peoples feels that they did a very good job of increasing the sensitivity of their employees
and more customers are referred for the extra helping hand. Through partnerships that have
been formed with the Department of Aging, and with local groups such as those in the
Universal Service Advisory Group, Peoples has been able to provide help beyond the gas
bill.
Additionally, CARES has become very visible in the Company. They have increased the
sensitivity of Peoples employees across the board, even more generally in dealing with credit
and collections calls. They listen to the customer’s situation and help them to find a solution.
Additional CARES Changes under Consideration
Peoples would like to continue to develop CARES by taking the following steps.
Increasing their familiarity with personnel in the field to increase referrals and program
awareness.
Spending more time partnering with local agencies and communities. This will increase
awareness of Peoples programs and familiarize Peoples with what the agencies offer.
Continuing professional development to increase their effectiveness and ability to
improve the program.

www.appriseinc.org Peoples Universal Service Programs
APPRISE Incorporated Page 27
E. LIURP Peoples’ LIURP is designed to help low-income customers who have high gas bills. LIURP’s
goals are to reduce energy usage and bills.
Goals and Resources
The goals of LIURP are as follows.
Maintain health, safety and comfort in the home.
Comply with the PUC mandates.
Continue utilization of the third party administrator.
Reduce energy consumption of CAP participants.
Assist special needs customers.
Partner with community based organizations.
Spend the program budget wisely while maximizing the quality of work.
Continue providing random inspections as a means of quality control.
The LIURP budget in the table below includes programs measures, contracted labor,
administrative expenses, agency meetings, equipment, outreach, and educational materials.
In the Joint Settlement Agreement in the Merger Transaction proceeding, Peoples agreed to
increase the spending for its combined LIURP program to a total of $2,050,000 (including
$250,000 in Shareholder funding), which provides $1,250,000 per year for the Peoples
Division and $800,000 for the Equitable Division. These expenditure increases will remain in
effect for 4 years (2014 through 2017).
Table II-15
LIURP Budget
Year Peoples Division Equitable Division Total
2015 $1,250,000 $800,000 $2,050,000
2016 $1,250,000 $800,000 $2,050,000
2017 $1,250,000 $800,000 $2,050,000
2018 $1,250,000 $800,000 $2,050,000
Projected LIURP enrollment is based upon average spending per home for the past three
years. A total of 410 customers are expected to be served each year.

www.appriseinc.org Peoples Universal Service Programs
APPRISE Incorporated Page 28
Table II-16
LIURP Projected Enrollment
Year Peoples Division Equitable Division Total
2015 245 165 410
2016 245 165 410
2017 245 165 410
2018 245 165 410
Table II-17A shows that actual LIURP expenditures were $2,049,565 in 2016.
Table II-17A
LIURP Expenditures
Year Peoples Division Equitable Division Total
2013 $1,100,000 $926,319 $2,026,319
2014 $1,250,000 $711,788 $1,961,788
2015 $1,251,395 $890,300 $2,141,695
2016 $1,249,763 $799,802 $2,049,565
Table II-17B provides a breakdown of LIURP expenditures. The Emergency Furnace
program for the Equitable division was not part of the rider until January 2017.
Table II-17B
Itemized LIURP Expenditures
Year
Peoples Equitable
LIURP Weatherization
Community
Partnership for
Weatherization
Emergency
Line
Repair
LIURP Weatherization
Emergency
Line
Repair
2014 $1,067,550 $30,887 $50,000 $399,637 $599,162 $14,171 $37,893
2015 $1,076,907 $24,402 $49,975 $295,834 $781,049 $9,702 $51,618
2016 $1,069,344 $30,419 $39,733 $291,050 $693,429 $6,374 $73,270
Table II-18 shows that there was a total of 355 LIURP jobs completed in 2016.

www.appriseinc.org Peoples Universal Service Programs
APPRISE Incorporated Page 29
Table II-18
LIURP Actual Heating Jobs
Year Peoples Division Equitable Division Total
2013 230 152 382
2014 280 160 440
2015 246 160 406
2016 215 140 355
Table II-19 shows that the average job costs were $4,727 in 2016.
Table II-19
LIURP Average Job Costs
Year Peoples Division Equitable Division Total
2013 $3,828 $5,012 $4,299
2014 $3,522 $3,744 $3,603
2015 $4,122 $4,540 $4,287
2016 $4723 $4,733 $4,727
Program Management and Administration
Peoples’ LIURP is managed in-house and administered through Conservation Consultants
Inc., a nonprofit agency.
Conservation Consultants is responsible for outreach and enrollment. They review customer
referrals sent from Peoples, ensure that the customer has not participated in LIURP in the
past seven years, and ensures that the customer meets the other LIURP requirements.
Once each year Peoples puts together a referral list of income-eligible customers who have
not received weatherization in the last seven years. CCI sends mailings to customers on
Peoples’ contact list with an instruction letter and application form. That is the first part in
the application process.
Generally the response rate to the mailing is about 15 to 20 percent. In December 2016 CCI
mailed 2,000 letters with the goal of serving about 400 customers in 2017.
CCI previously conducted some audits, but they are currently conducted exclusively by the
subcontractors. CCI contracts with 17 nonprofit community action agencies and private
contractors to perform the audits and to install weatherization measures. Peoples asks CCI to
email the subcontractors every month to reinforce the program goals and to stress customer
satisfaction.

www.appriseinc.org Peoples Universal Service Programs
APPRISE Incorporated Page 30
CCI also works with their energy consultants to conduct inspections on up to 25 percent of
the completed jobs. The consultants evaluate the contractors’ performance and develop
coaching issues based on their findings.
Outreach
Eligible customers can be identified through CAP and other Universal Service Programs.
Customers who participate in CAP and meet LIURP eligibility criteria are referred to LIURP
during the CAP intake process. Referrals are also made by community-based organizations,
and by CARES, Customer Service Center and field customer service personnel. In addition,
Peoples coordinates LIURP with programs including Rebuilding Together Pittsburgh,
Habitat for Humanity, Re-Energize Pittsburgh, PA weatherization, electric LIURP programs,
and others. Annually, the Company generates a list of high users that have known limited
income that is used for LIURP outreach efforts.
Eligibility
CAP participants are screened for LIURP, but must meet the following criteria for eligibility.
1. Total family income does not exceed 150 percent of the Federal Poverty Guidelines. (Up
to 20 percent of the annual program budget may be allocated to customers with incomes
from 151 to 200 percent of the federal poverty level on a case-by-case basis.) Customers
with the lowest incomes and highest arrearages are prioritized.
2. Residential, gas-heating customer.
3. Customer has not moved and has not had gas service terminated within the last year.
4. Customer has annual consumption greater than 140 MCF.
5. Renters must have the gas account in their name and receive landlord permission to
participate. Rental units must be metered separately and have individual heating systems.
Contractor Training
Peoples hosts an annual meeting for all LIURP contractors. This is an appreciation event that
includes technical aspects and professional development education with an emphasis on
customer service. In 2016, Peoples hosted the program with Columbia Gas, as many
contractors provide services for both utilities’ programs.
Service Delivery
An energy auditor assesses the customer’s home to determine what LIURP measures should
be installed. The auditor assesses air leakage, previously installed weatherization measures,
and the effectiveness of these measures. The auditor discusses the home performance with
the customer.
Measures are installed based on established payback criteria and may include the following.
Heating system improvements and replacements

www.appriseinc.org Peoples Universal Service Programs
APPRISE Incorporated Page 31
Attic, sidewall, and other types of insulation
Caulking and weather-stripping
Air sealing
Hot water treatments including tank improvements, wrapping, and replacements
Minor repairs that relate to weatherization
Table II-20 displays the penetration of measures from 2014 through 2016. The table shows
that 93 percent of Peoples’ and 81 percent of Equitable’s participants received HVAC
testing, repair, or replacement. A high percentage of participants also received air sealing,
window or door repairs or replacement, general repairs, insulation, venting work, and duct
work.
Table II-20
Percent of LIURP Participants with Each Measure Category
2014-2016
Measure Peoples Division Equitable Division
HVAC Test/Repair/Replace 93% 81%
Air sealing 77% 87%
Window/Door repair/replace 60% 72%
Repairs 55% 75%
Insulation 54% 59%
Venting 51% 59%
Duct Repair/Seal/Insulate 45% 52%
Lock repair/replace 24% 35%
Attic Insulation 23% 20%
Floor Insulation 16% 20%
Health and Safety 16% 8%
Wall Insulation 14% 27%
Water heater & pipe insulation 12% 19%
Water heater replace 12% 0%
Tank temp setback 11% 10%
Water heater or leak repair 4% 3%
Garage Insulation 1% 0%
CCI has a budget that they aim for on each job. While they have the opportunity to go above
or below the budget depending on what is needed, they cannot go significantly above the
budget. They are sometimes limited if a house needs more work than the program can offer,
and sometimes have to adjust what they can do in the home.
www.appriseinc.org Peoples Universal Service Programs
APPRISE Incorporated Page 32
The targeted amount per job is now $5,000. This budget was increased from $4,100 in mid-
2016. There is usually an additional $425 fee that includes an audit fee, a fee for the
customer education, and an administrative fee that is for the contractor’s office time when
coordinating the job.
The job can exceed or fall short of the $5,000 target depending on what work is needed. If
some jobs cost less than $5,000, then they can accommodate certain situations where the
housing stock is in rough shape. The more important guiding principle is that they are
coming close to their completion goals and utilizing the funding for the year.
Usually the contractors send an estimate of all of the work to be done, and then CCI will
address any need to increase the funding. CCI reviews the contractor’s audit, the size of the
house, and the condition of the home when considering requests for additional spending.
There are no set program guidelines in terms of spending limits or exceptions, but a heating
replacement that might be in the range of $6,000 to $7,000 is approximately the highest cost.
For jobs where the work is mostly weatherization, they have an informal limit of $6,000 for
measures.
A general guideline of $500 per job for health and safety is provided. Health and safety
measures exceeding this figure are considered on a case-by-case basis.
Education
In addition to weatherization services, LIURP provides customer education to explain the
weatherization and to encourage ongoing conservation. The educator may provide “hands
on” demonstrations of conservation measures such as lowering the thermostat and,
replacement of furnace filters. The educator also provides written reference materials for the
customers.
CCI expects the contractor to provide general energy conservation education on the front end
and education on the tail end that reviews the work completed and what the customer can do
differently in the home related to the work that was done.
Peoples implemented a Pledge Form to involve the customers with the contractor. The
Pledge Form helps the LIURP participants understand that the purpose of the program is
energy conservation and to understand the measures that were installed in their home. There
is also an Action Plan form that lists the actions that the customer committed to take to
further reduce gas usage. The Pledge and Action Plans Forms were recently implemented.
If the customer has had an unusually large increase in consumption, a follow-up telephone
call or visit may be scheduled one year after the program measures have been completed.
Referrals
CCI stated that they always look for opportunities to refer customers to electric utility
programs. In some cases they refer customers to local organizations that perform home

www.appriseinc.org Peoples Universal Service Programs
APPRISE Incorporated Page 33
repairs if some work is needed beyond the program scope. This work may include major roof
leaks, structural issues, or electrical issues, such as if the electrical wiring in the home is not
up to code.
If a customer interested in learning about LIHEAP, CCI will refer the customer back to
Peoples or give them the number for the LIHEAP office in different counties.
Quality Control
After the job is completed, Peoples mails a satisfaction survey (with a return envelope) to the
customer. Approximately 22 percent of the participants send these forms back. CCI calls
those who don’t respond and asks the satisfaction questions over the phone. The goal is to
get as close as possible to a 100% response rate. The satisfaction survey helps Peoples
monitor the subcontractors who are rewarded based on customers’ satisfaction.
Peoples contracts with energy consultants who perform random inspections. In 2014, they
inspected 71 homes, which was 25 percent of the homes weatherized. These consultants are
former employees who have retired from Peoples Gas. When they conduct the inspections,
they have copies of the work orders and will note if anything was not done or was
incomplete. They check for any health and safety issues including gas leaks and proper
ventilation, and they use an infra-red camera to assess insulation work quality. The
inspectors complete a contractor measures form for the purposes of Peoples award program.
The inspectors also provide additional customer education, which includes talking with
customers about the work that was done and any additional questions they have. The energy
consultants also talk to the customers about the settings for the heating system and collect
information on customer satisfaction.
Peoples sends CCI the outcome of the inspection and CCI will contact the subcontractors to
follow up.
Coordination
Peoples Gas works to complete jobs that are combined with the PA Department of
Community and Economic Development Weatherization Program and with electric
companies. They completed 17 combined jobs in 2014, 23 combined jobs in 2013, and 33
combined jobs in 2012.
CCI, Peoples’ LIURP administrator, also administers LIURP for Duquesne Light. Peoples is
working on using this connect to improve coordination with Duquesne Light. If the customer
qualifies for Peoples’ LIURP and does not qualify for the electric company LIURP, the
customer should receive electric services through Act 129.
Peoples met with FirstEnergy several years ago and edited the initial customer invite form for
the customer to provide permission for the companies to share the customer’s information.
However, because the majority of those who First Energy serves are not eligible for Peoples’
program, Peoples has not been able to coordinate to the extent that they would like.

www.appriseinc.org Peoples Universal Service Programs
APPRISE Incorporated Page 34
Peoples is planning to meet with FirstEnergy again to connect customers up front and
perform one combined audit. Challenges with coordination include differences in
paperwork. Additionally, coordination with WAP is dependent upon which county the
customer resides in.
LIURP Energy Savings
According to Peoples LIURP evaluations, Table II-21 provides a summary of the savings
achieved by each division.
Table II-21
LIURP Energy Savings – Peoples Division
Year Peoples Equitable
Homes MCF % Saved Homes MCF % Saved
2012 210 48.3 19.6% 110 72.6 29.3%
2013 230 46.9 18.5% 152 51.9 20.5%
2014 280 35.5 18.6% 160 29.6 13.5%
2015 246 30.4 15.7% 160 33.9 14.5%
LIURP Pilot: Emergency Furnace/Service Line Repair Assistance
The Emergency Furnace program provides financial assistance for furnace/boiler and service
and house line gas leak repairs or replacements to help customers maintain gas service.
The Peoples Division Emergency Furnace/House and Service Line Repair Program was
introduced in June 2011, and has provided assistance to 239 customers since the introduction
of the program. The budget for Peoples Division is $400,000 per year from 2015 through
2018.
The Equitable Division previously had a limited fund to support customers with heating
appliance or line emergencies. The budget for the Equitable Division was $35,000 in 2015
and in 2016 and $33,000 in 2017. Eligible Equitable customers previously received
assistance of up to $750 for a line repair or $1,250 towards a furnace repair or replacement.
Following the merger, Peoples wanted to extend the policies, practices, and funding model of
the Peoples Division pilot program to the Equitable Division program. With the alignment,
in the event of a sudden furnace or gas line failure, Equitable Division’s customers with
incomes below 200% of the Federal Poverty Level (FPL) would receive full coverage for the
heating system and line repairs/replacements instead of supplemental payments. While the
LIHEAP Crisis program provides assistance for emergency needs such as these, LIHEAP is
not available all year round, nor is it available to customers with incomes between 151 and
200 percent of the poverty level.

www.appriseinc.org Peoples Universal Service Programs
APPRISE Incorporated Page 35
By Order issued 12/8/16, the Equitable Division now has an annual funding mechanism of
$275,000 through its Universal Service Rider and operates in the same manner as Peoples
Division’s programs.
Peoples’ pilot is administered by Conservation Consultants, Inc., working with the same
subcontractors who implement Peoples’ LIURP. Equitable’s pilot is administered internally,
working with the same subcontractors who implement LIURP.
Customers must be at or below 200 percent of the federal poverty level, own their home, and
have a need for emergency repairs to their heating system or house/service lines to be eligible
for the pilot.
An average of 140 Peoples customers per year have received either furnace or line repair
services through this program. Peoples assumes the number of participants in this program
will continue at this level.
In 2015, the following services were provided.
Furnace replacements: 42
Furnace/boiler repairs: 48
House line repairs: 10
Service line repairs: 21
An average of 30 to 40 Equitable customers per year received either furnace or line repair
services through this program, prior to the 2016 Order.
Customers who apply for assistance under this pilot are evaluated for LIURP. If the
customer is not eligible for LIURP due to minimum usage standards, minor weatherization
measures are provided.
Peoples LIURP Pilot: Community Weatherization Partnership Program
The Community Weatherization Partnership Program partners with nonprofit organizations
to provide energy education programs for customers with limited incomes.
The Community Weatherization Partnership Program was approved as part of the Settlement
in Peoples Base Rate Case in June 2011. While Peoples Equitable Division does not
currently offer a Community Partnership Program, it may be implemented at some point in
the future.
The budget for the pilot is $50,000 per year for 2015 through 2018 and it is expected that 50
to 100 customers per year will receive education through this program.
The pilot is designed to impact low-income customers in vulnerable neighborhoods.
Agencies or organizations who would like to participate must submit a proposal that includes
the number of expected participants, outreach plans, proposed venue, an overview of the
topics covered, and any weatherization materials that may be shared. The organization must

www.appriseinc.org Peoples Universal Service Programs
APPRISE Incorporated Page 36
conduct outreach to low-income customers to identify participants. Participants are not
required to provide income information to participate in an event.
Peoples works with organizations that fill the gaps for customers whose needs cannot be
served by other programs currently available. Such organizations are publicly and privately
funded and include Re-Energize Pittsburgh, Habitat for Humanity, Rebuilding Together
Pittsburgh, Allegheny County’s Office of Sustainability, and area utility companies including
Duquesne Light and First Energy. These partnerships leverage Company resources to provide
energy conservation and efficiency to low-income customers.
In 2015, Peoples partnered with five organizations, completed seven education sessions, and
provide information to 101 customers. Each participant also received an energy conservation
tool kit with caulking materials, pipe insulation, a showerhead and aerator, window and door
kits, and foam insulation. Peoples also provided funding to nonprofit organizations whose
programs served 142 customers with energy education and conservation kits.
When the Community Weatherization Partnership Program was first implemented, the
intention was to partner with local groups that were already conducting projects related to
conservation and education to help make the connection with customers who could be good
targets for LIURP. Peoples has been seeing a decline in groups that provide projects and
programs in the community and Peoples does not have as many different programs to
support. If Peoples decides to end this pilot, the funding would roll into LIURP. Peoples
needs to determine whether they should maintain the program.
Changes
The LIURP programs offered by the Peoples Division and the Equitable Division were very
similar. The key difference between the two programs was the annual minimum usage and
the minimum arrearage required to participate. The Equitable Division required customers to
have an annual usage exceeding 160 MCF and $750 in arrears and the Peoples Division
required 140 MCF in annual usage and an arrearage of $200. Peoples established a minimum
annual usage requirement of 140 MCF for all participants with no minimum arrearage
requirements. However, customers with higher balances and/or with the lowest household
income are prioritized to receive services in the program.
Peoples has contracted with Conservation Consultants, Inc. to administer the Equitable
Division LIURP program, consistent with program administration for Peoples’ existing
LIURP.
Challenges and Successes
The greatest challenge that Peoples faces with LIURP is obtaining customer response and
agreement for services. Every year they create a list of customers who are eligible based on
high usage and the income data that Peoples has. CCI makes the attempts to contact the
customers with letters and phone calls. However, customers may not want to participate
because they are suspicious of free services or they are protective of their privacy.

www.appriseinc.org Peoples Universal Service Programs
APPRISE Incorporated Page 37
Additional challenges are as follows.
Making sure that all of the contractors are all implementing the program in the same
manner and that they fully understand the program.
Non-savers are a challenge. Some have a reason that their usage has increased, and for
some it may be due to behavioral issues.
Coordination with electric utilities and WAP.
Customer engagement.
The low-income housing stock.
For the customers they do serve, Peoples LIURP provides health and safety improvements
and makes the home more comfortable. They feel that the LIURP accomplishments are
engaging the customers and using more customer-friendly forms, having the customer
involved in the process, having Peoples’ three divisions implement the program in the same
manner, and engaging subcontractors to serve the whole service territory.
Additional Changes
Peoples and the Universal Service Advisory Group are examining ways to encourage
partnerships, improve outreach, and simplify customer communications to encourage
participation.
Peoples is also researching LIURP participants who do not save energy. While customers
who gained use of their main natural gas heating through LIURP are expected to increase
usage, there are other non-savers where Peoples feels additional education can lead to
improvements.

www.appriseinc.org Needs Assessment
APPRISE Incorporated Page 38
III. Needs Assessment
This section provides a profile of low-income households in Peoples’ service territory using data
from the 2011-2015 American Community Survey (ACS). These data provide information on the
number of eligible households, the poverty level of those households, demographic
characteristics, and energy burden. The data represent Peoples’ service territory in 2015.
A. Peoples’ Service Territory Table III-1 displays the counties in Peoples’ service territory, the ACS estimate of the
number of households in the county or group of counties, the number of those households
with natural gas service, and the percent of those households with natural gas service. These
households exclude those in group quarters and vacant housing units.
Households are categorized as having Gas Service if they provided a numeric value for their
most recent month’s gas bill. Households are not included if their gas bill is included in their
rent or condo fee, their gas bill is included in their electric bill payment, there was no charge
for gas, or if gas was not used.
The ACS data is organized in “PUMAs”, which sometimes include more than one county.
Counties were combined in the table below when they were contained together in one ACS
PUMA and could not be separately analyzed.
The table also shows the number of Peoples’ customers in each PUMA and the percent of the
gas customers in the PUMA who are Peoples’ customers. In several of the PUMAs, fewer
than 40 percent of the natural gas customers have Peoples’ as their utility company. These
counties mostly represent other gas utility service territories and are not included in the rest
of the tables in this section. The counties that are included in the rest of the needs assessment
are shaded in grey.
Table III-1
Counties in Peoples’ Service Territory
Counties Served by Peoples
ACS
Household
Estimate
Gas Service Peoples’ Customers
Number Percent Number
Percent of
Those with
Gas Service
Allegheny County 423,514 346,728 82% 357,971 100%
Armstrong & Indiana Counties 62,584 36,657 59% 25,073 68%
Beaver & Lawrence Counties 106,516 70,153 66% 21,450 31%
Blair & Huntingdon Counties 64,795 33,152 51% 29,865 90%
Butler County 74,475 51,559 69% 15,647 30%
Cambria, Somerset, Bedford & Fulton
Counties 107,523 42,400 39% 27,016 64%

www.appriseinc.org Needs Assessment
APPRISE Incorporated Page 39
Counties Served by Peoples
ACS
Household
Estimate
Gas Service Peoples’ Customers
Number Percent Number
Percent of
Those with
Gas Service
Clarion, Jefferson, Venango, Forest, &
Clearfield Counties 121,527 78,727 65% 394 1%
Fayette County 54,001 25,252 47% 3,006 12%
Mercer County 45,547 28,066 62% 4,372 16%
Washington & Greene Counties 98,132 64,682 66% 24,556 38%
Westmoreland County 151,131 100,304 66% 74,619 74%
Total 1,309,745 877,680 67% 583,969 67%
The following tables only include the counties highlighted above, in which Peoples Gas is a
prominent provider.
Across all of the counties served by Peoples, 69 percent of households had gas service. Most
of these households had gas heating service.
Table III-2
Distribution of Service Status for Households in Selected Area
Service Status Number Percent
Gas Service 559,241 69%
No Gas Service 250,306 31%
Heating Service 507,816 63%
Non-Heating Service 51,425 6%
All Households 809,547 100%
B. Income Eligibility While eligibility for CAP is 150 percent of the poverty level, eligibility for LIURP is 200
percent of poverty. Table III-3 displays the number and percent of households with gas
service, heating service, and non-heating service who have income at or below 150 percent
and 200 percent of the poverty level. The table shows that approximately 20 percent have
income below 150 percent and 30 percent have income below 200 percent. However, of
those with gas service, 17 percent have income below 150 percent of the poverty level and 25
percent have income below 200 percent of the poverty level.

www.appriseinc.org Needs Assessment
APPRISE Incorporated Page 40
Table III-3
Income Eligibility Rate by Service Status
Service Status All
Households
150% Poverty Level 200% Poverty Level
Number Percent Number Percent
Gas Service 559,241 93,436 17% 140,570 25%
No Gas Service 250,306 74,886 30% 104,242 42%
Heating Service 507,816 82,426 16% 124,481 25%
Non-Heating Service 51,425 11,010 21% 16,089 31%
All Households 809,547 168,322 21% 244,812 30%
Table III-4 provides a breakdown of households who are income-eligible by poverty level.
Approximately one third have income below the poverty level, between 101 and 150 percent
of the poverty level and between 151 and 200 percent of the poverty level.
Table III-4
Distribution of Income-Eligible Households
By Service Type and Poverty Group
Poverty Group Gas Service Heating Service Non-heating Service
Number Percent Number Percent Number Percent
0% -50% 18,800 13% 16,565 13% 2,235 14%
51% -100% 30,453 22% 26,668 21% 3,785 24%
101% -150% 44,183 31% 39,193 31% 4,990 31%
151%-200% 47,134 34% 42,055 34% 5,079 32%
Total 140,570 100% 124,481 100% 16,089 100%
C. Demographics Table III-5 displays the number and percent of households in various demographic groups.
Of those below 150 percent of the poverty level with gas service, ten percent are married
with children, defined as a married-couple family household with at least one child under the
age of 18. Twenty-two percent are single with children, defined as a male householder with
no wife present or female household with no husband present and at least one child under the
age of 18. Thirty six percent are a senior head of household, defined as a head of household
63 years or older and not in one of the above categories.
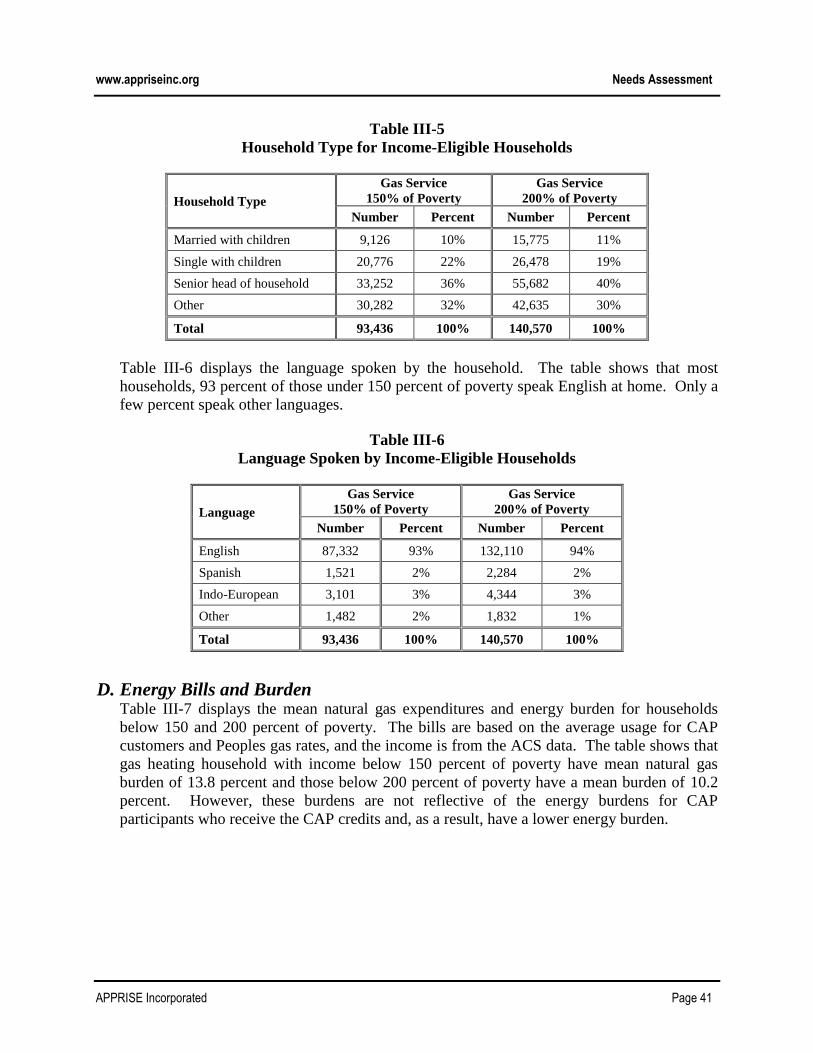
www.appriseinc.org Needs Assessment
APPRISE Incorporated Page 41
Table III-5
Household Type for Income-Eligible Households
Household Type
Gas Service
150% of Poverty
Gas Service
200% of Poverty
Number Percent Number Percent
Married with children 9,126 10% 15,775 11%
Single with children 20,776 22% 26,478 19%
Senior head of household 33,252 36% 55,682 40%
Other 30,282 32% 42,635 30%
Total 93,436 100% 140,570 100%
Table III-6 displays the language spoken by the household. The table shows that most
households, 93 percent of those under 150 percent of poverty speak English at home. Only a
few percent speak other languages.
Table III-6
Language Spoken by Income-Eligible Households
Language
Gas Service
150% of Poverty
Gas Service
200% of Poverty
Number Percent Number Percent
English 87,332 93% 132,110 94%
Spanish 1,521 2% 2,284 2%
Indo-European 3,101 3% 4,344 3%
Other 1,482 2% 1,832 1%
Total 93,436 100% 140,570 100%
D. Energy Bills and Burden Table III-7 displays the mean natural gas expenditures and energy burden for households
below 150 and 200 percent of poverty. The bills are based on the average usage for CAP
customers and Peoples gas rates, and the income is from the ACS data. The table shows that
gas heating household with income below 150 percent of poverty have mean natural gas
burden of 13.8 percent and those below 200 percent of poverty have a mean burden of 10.2
percent. However, these burdens are not reflective of the energy burdens for CAP
participants who receive the CAP credits and, as a result, have a lower energy burden.

www.appriseinc.org Needs Assessment
APPRISE Incorporated Page 42
Table III-7
Mean Natural Gas Bills and Burden for Income-Eligible Households
Service Status
150% of Poverty 200% of Poverty
Number Natural Gas
Expenditures
Natural Gas
Burden Number
Natural Gas
Expenditures
Natural Gas
Burden
Non-heating 11,010 $305 8.3% 16,089 $305 6.0%
Heating 82,426 $856 13.8% 124,481 $856 10.2%
Total 93,436 $791 13.2% 140,570 $793 9.8%
Table III-8 displays the mean natural gas expenditures and energy burden by poverty level.
The table shows that gas heating household with income below 50 percent of poverty have a
mean natural gas burden of 45 percent and those with income between 151 and 200 percent
of poverty have a mean natural gas burden of three percent.
Table III-8
Mean Natural Gas Bills and Burden for Income-Eligible Gas Heating Households
By Poverty Level
Poverty Level Gas Heating Customers
Number Natural Gas Expenditures Natural Gas Energy Burden
0% -50% 16,565 $856 45.4%
51% -100% 26,668 $856 7.6%
101% -150% 39,193 $856 4.7%
151%-200% 42,055 $856 3.2%
Total 124,481 $856 10.2%
E. Summary This section provides a summary of findings from the needs assessment analysis.
Income Eligibility: Of households with gas service, 17 percent have income below 150
percent of the poverty level and 25 percent have income below 200 percent of the poverty
level.
Demographics: Of those below 150 percent of the poverty level with gas service, ten
percent are married with children, 22 percent are single with children, 36 percent are a
senior head of household, and the remaining are in other categories. Ninety-three percent
speak English at home.
Gas Costs and Burden: Gas heating household with income below 150 percent of
poverty have a mean natural gas burden of 13.8 percent. However, this average burden is

www.appriseinc.org Needs Assessment
APPRISE Incorporated Page 43
not reflective of the energy burden for CAP participants who receive the CAP credits
and, as a result, have a lower energy burden.

www.appriseinc.org CAP Participant Feedback
APPRISE Incorporated Page 44
IV. CAP Participant Feedback
APPRISE conducted a survey with Peoples Customer Assistance Program (CAP) participants as
part of Peoples’ Universal Service Program Evaluation. This section provides a summary of the
survey methodology and the findings from the survey.
A. Methodology An advance letter was sent to 300 customers to inform them of the survey and request their
participation. A phone number was also provided for customers to call in and complete the
survey at their convenience. Telephone surveys were conducted by APPRISE staff
beginning on February 21, 2017 and ending on March 15, 2017. Customers were called
during the day, the evening, and on the weekend.
Table IV-1 displays the final sample disposition, the cooperation rate, and the response rate.
Surveys were completed with 34 percent of the sample, the response rate was 52 percent and
the cooperation rate was 84 percent.
Table IV-1
CAP Participant Survey
Final Sample Disposition
Final Disposition # %
Complete 103 34%
No Answer 56 19%
Non-Working Number 47 16%
Voicemail 34 11%
Wrong Number or Phone Problem 31 10%
Refusal 20 7%
Not Eligible 5 2%
Deceased/Ill/Language Barrier 4 1%
Total 300 100%
Cooperation Rate 84%
Response Rate 52%
B. Findings This section summarizes the findings from the survey. Findings are summarized in the
following areas.
Participation
CAP Benefits
Bill Payment Problems
CAP Continued Participation
CAP Satisfaction and Recommendations

www.appriseinc.org CAP Participant Feedback
APPRISE Incorporated Page 45
Participation
This section assesses reasons for participation in CAP and ease of enrollment and re-
certification. Table IV-2 shows that customers were most likely to find out about CAP from
a Peoples customer service representative, an agency, or a friend or relative.
Table IV-2
CAP Information Source
How did you find out about CAP?
Respondents 103
Peoples Customer Service Representative 32%
Agency 25%
Friend or Relative 19%
Gas Bill Insert 4%
Previous Knowledge 3%
Mail/Online 2%
Other 3%
Don’t Know 17%
Customers could provide more than one response, so total may not sum to
100%.
When asked why they decided to enroll in CAP, customers were most likely to state that they
needed to reduce their energy bills, because they had a low or limited income or to reduce
their arrearages.
Table IV-3
Participation Reason
Why did you decide to enroll in the CAP Program?
Respondents 103
Reduce Energy Bills 61%
Low/Limited Income 28%
Reduce Arrearages 24%
Maintain Gas Service 4%
Disability 3%
Other 2%
Don’t Know 0%
Refused 0%
Customers could provide more than one response, so total may not sum
to 100%.
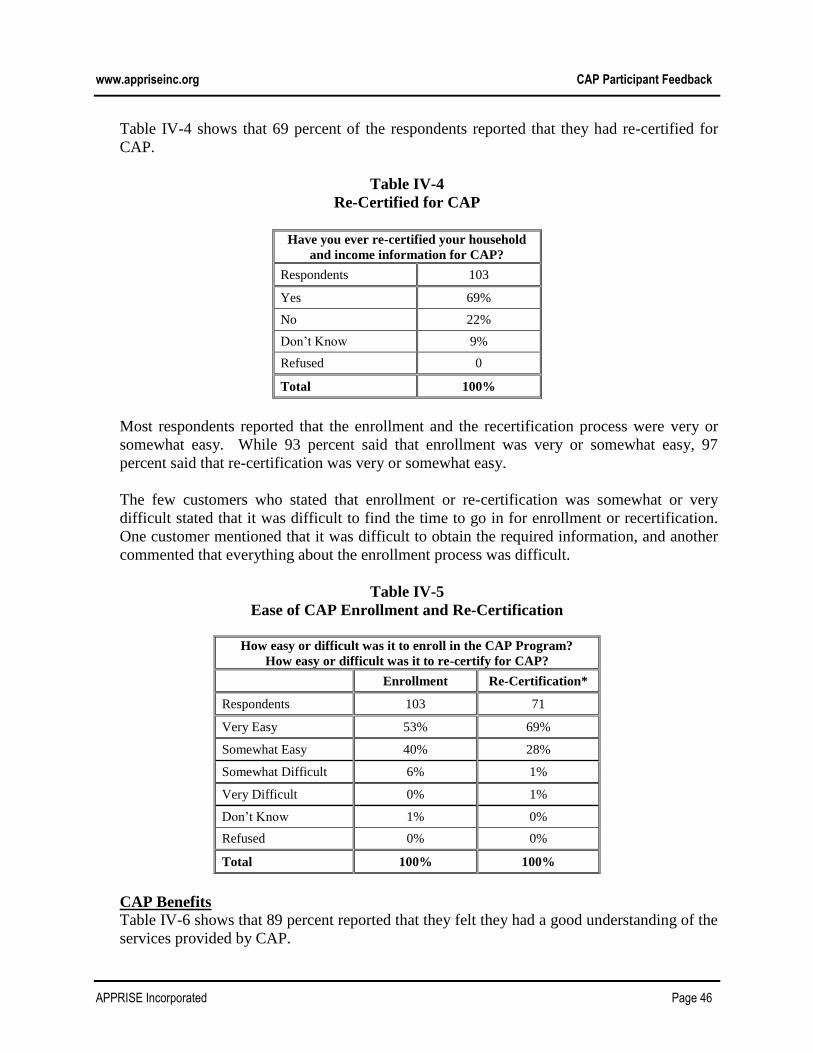
www.appriseinc.org CAP Participant Feedback
APPRISE Incorporated Page 46
Table IV-4 shows that 69 percent of the respondents reported that they had re-certified for
CAP.
Table IV-4
Re-Certified for CAP
Have you ever re-certified your household
and income information for CAP?
Respondents 103
Yes 69%
No 22%
Don’t Know 9%
Refused 0
Total 100%
Most respondents reported that the enrollment and the recertification process were very or
somewhat easy. While 93 percent said that enrollment was very or somewhat easy, 97
percent said that re-certification was very or somewhat easy.
The few customers who stated that enrollment or re-certification was somewhat or very
difficult stated that it was difficult to find the time to go in for enrollment or recertification.
One customer mentioned that it was difficult to obtain the required information, and another
commented that everything about the enrollment process was difficult.
Table IV-5
Ease of CAP Enrollment and Re-Certification
How easy or difficult was it to enroll in the CAP Program?
How easy or difficult was it to re-certify for CAP?
Enrollment Re-Certification*
Respondents 103 71
Very Easy 53% 69%
Somewhat Easy 40% 28%
Somewhat Difficult 6% 1%
Very Difficult 0% 1%
Don’t Know 1% 0%
Refused 0% 0%
Total 100% 100%
CAP Benefits
Table IV-6 shows that 89 percent reported that they felt they had a good understanding of the
services provided by CAP.

www.appriseinc.org CAP Participant Feedback
APPRISE Incorporated Page 47
Table IV-6
Understanding of CAP
Do you feel that you have a good understanding of the
services provided by the CAP Program?
Respondents 103
Yes 89%
No 8%
Don’t Know 3%
Refused 0
Total 100%
Table IV-7 shows that customers were most likely to report that their responsibility in CAP
was to keep up with their payments. While 90 percent said that their responsibility was to
keep up with payments, 12 percent said it was to report income and information, four percent
said it was to conserve energy, and three percent said it was to apply for LIHEAP.
Table IV-7
Customer Responsibility in CAP
What is your understanding of your responsibility in this program?
Respondents 103
Keep Up With Payments 90%
Report Income and Information 12%
Conserve Energy/Reduce Use 4%
Apply for LIHEAP 3%
Accept Weatherization Services 1%
Other 2%
Don’t Know 4%
Refused 0%
Respondents could provide more than one response, so percentages may not sum
to 100%.
Respondents were most likely to report that the benefits of CAP were lower energy bills and
even monthly payments. When asked about specific benefits, 98 percent agreed that lower
energy bills were a benefit, 94 percent agreed that maintaining gas service was a benefit, and
80 percent agreed that reduced arrearages were a benefit. When respondents were asked
about the most important benefit of CAP, the most common responses were lower energy
bills, maintaining gas service, and financial assistance.

www.appriseinc.org CAP Participant Feedback
APPRISE Incorporated Page 48
Table IV-8
CAP Benefits
Respondents could provide more than one response, so percentages may not sum to 100%.
Respondents were asked questions about the clarity of their CAP bill. While 97 percent said
that the CAP bills shows the CAP payment in a way that is clear and easy to locate and
understand, 91 percent said it showed the CAP credit benefit in a way that is clear and easy
to locate and understand, and 84 percent said that it showed the arrearage forgiveness amount
in a way that is clear and easy to locate and understand.
Table IV-9
CAP Bills
Do you feel your CAP bill shows ___________ in a way that is clear and easy to locate and understand?
the CAP payment, the amount that you must pay that month,...
the CAP credit benefit, the amount that was reduced from your total bill…
the amount you owed Peoples at the time of CAP enrollment and the monthly arrearage forgiveness
amount. The arrearage forgiveness amount is the amount that is forgiven from the back bills you
owed when you joined CAP.
CAP Payment CAP Credit Arrearage Forgiveness
Respondents 103 103 103
Yes 97% 91% 84%
No 3% 6% 7%
Don’t Know 0% 3% 9%
Refused 0% 0% 0%
Total 100% 100% 100%
What do you feel are the benefits of the program? Do you feel _______ are a benefit of
the program? What do you feel is the most important benefit of the program?
Unprompted Prompted Most Important
Respondents 103
Lower Energy Bills 71% 98% 30%
Even Monthly Payments 46% - 15%
Maintaining Gas Service 11% 94% 26%
Reduced Arrearages 7% 80% 8%
Financial Assistance - - 19%
Other 4% - 2%
No Benefits 0% - 0%
Don’t Know 2% - 0%
Refused 0% - 0%

www.appriseinc.org CAP Participant Feedback
APPRISE Incorporated Page 49
Respondents were asked to estimate the amount of money CAP saved them on a typical
monthly gas bill. Table IV-10 shows that 77 percent provided an estimate of the amount.
While 22% said it saved them less than $50 on a typical monthly bill, 25 percent said it saved
$51 to $100, and 29 percent said it saved them $101 or more.
Table IV-10
Estimate of Monthly CAP Savings
How much money does the CAP Program
save you on a typical monthly natural gas bill?
Respondents 103
$0 1%
$1-$25 4%
$26-$50 17%
$51-$100 25%
$101 or more 29%
Don’t Know 23%
Refused 0%
Total 100%
Bill Payment Problems
Respondents were asked several questions about the difficulty they faced in making their
energy bill payments and in paying other bills. Table IV-11 shows that respondents were
much less likely to state that their CAP bills were difficult to pay after enrollment in CAP.
While 58 percent said it was very difficult to pay the monthly gas bill prior to CAP
enrollment, only five percent said it was very difficult to pay the bill following enrollment.
Table IV-11
Difficulty Paying Peoples Monthly Bill
How difficult was it to make your monthly payments before
participating in CAP? While participating in the program, how
difficult is it to make your monthly natural gas bill payments?
Respondents 103
Before CAP In CAP
Very Difficult 58% 5%
Somewhat Difficult 30% 25%
Not too Difficult 5% 35%
Not at all Difficult 4% 33%
Don’t Know 1% 1%
Refused 2% 1%
Total 100% 100%

www.appriseinc.org CAP Participant Feedback
APPRISE Incorporated Page 50
Table IV-12 shows that 66 percent said their gas bill was lower when they were in CAP and
25 percent said their gas usage was lower after enrolling in CAP.
Table IV-12
Change in Gas Bill and Usage While Participating in CAP
While participating in the program, would you say that your gas
bill/usage is higher, lower, or has not changed in comparison to what it
was before participating in the program? By gas usage, we mean the
amount of gas that you use, not the dollar amount of your bill.
Gas Bill Gas Usage
Respondents 103
Higher 5% 9%
Lower 66% 25%
No Change 17% 54%
Don’t Know 12% 11%
Refused 1% 1%
Total 100% 100%
Only a few customers reported that their usage increased after enrollment in CAP. Table IV-
13 shows that these customers said it was a colder winter or they needed more weatherization
services.
Table IV-13
Reason for Usage Increase
Why do you feel your usage has increased?
Respondents 103
Cold Winter 4%
Household in Need of Weatherization Services 2%
Can Use More Gas Because of CAP 1%
Additional Household Residents 1%
Usage Did Not Increase 91%
Don’t Know 1%
Refused 0%
Respondents could provide more than one response, so percentages may not
sum to 100%.
Those customers who reported that they reduced their usage were most likely to state that
they were trying to conserve, that it was the weather, or that they received energy efficiency
services.

www.appriseinc.org CAP Participant Feedback
APPRISE Incorporated Page 51
Table IV-14
Reason for Usage Decrease
Why do you feel your usage has decreased?
Respondents 103
Trying to Reduce/Conserve 16%
Weather 5%
Received Weatherization/WAP/LIURP 2%
Other Services Received 1%
Usage Did Not Decrease 75%
Don’t Know 3%
Refused 0%
Respondents could provide more than one response, so percentages may not
sum to 100%.
Respondents were asked about difficulties paying for food, medicine, medical or dental
expenses, mortgage or rent, the telephone bill, credit card or loan payments, and car
payments. Table IV-15 shows that respondents were less likely to report that they had to
delay the expenditure or skip paying the bill following enrollment in CAP. While 60 percent
said they had to skip paying for food prior to CAP enrollment, 24 percent said they did so
following CAP enrollment. Large declines in difficulty paying bills were also reported for
the telephone, medical or dental, mortgage or rent, and credit card or loans.
Table IV-15
Problems Meeting Financial Obligations
In the year before/while participating in CAP,
did you ever have to delay or skip paying the
following bills or making the following
purchases in order to make ends meet?
Always or frequently had to
delay or skip paying?
Before CAP In CAP Before CAP In CAP
Respondents 103
Food 60% 24% 25% 7%
Telephone 53% 24% 19% 2%
Medical or Dental 35% 24% 18% 8%
Mortgage or Rent 35% 19% 10% 2%
Credit Card or Loan 31% 17% 14% 9%
Medicine 27% 17% 10% 4%
Car Payment 13% 8% 4% 1%
Table IV-16 displays customers’ reports about the use of their stove or oven for heat. While
25 percent said they used their stove or oven for heat sometimes or more frequently prior to

www.appriseinc.org CAP Participant Feedback
APPRISE Incorporated Page 52
participating in CAP, 11 percent said they used their stove or oven for heat while
participating in CAP.
Table IV-16
Used Kitchen Stove or Oven for Heat
In the year before /while participating in CAP, did you use your kitchen stove or oven to provide
heat? Did you always, frequently, or sometimes use your kitchen stove or oven for heat?
Respondents 103
Before CAP In CAP
Always 5% 1%
Frequently 3% 2%
Sometimes 17% 8%
Seldom 0% 0%
Did Not Use Stove or Oven for Heat 74% 89%
Refused 1% 0%
Total 100% 100%
When asked whether there was a time that they were unable to use their heat because it was
broken and they could not pay for the repair or replacement, 20 percent said they experienced
this problem prior to CAP enrollment and 13 percent said they experienced this problem
while participating in CAP.
Table IV-17
Unable to Use Main Source of Heat
In the year before enrolling /while enrolled in CAP, was there
ever a time when you wanted to use your main source of heat,
but could not because your heating system was broken and
you were unable to pay for its repair or replacement?
Before CAP In CAP
Respondents 103
Yes 20% 13%
No 79% 86%
Don’t Know 0% 0%
Refused 1% 1%
Total 100% 100%
Respondents were asked about LIHEAP application, receipt, and designation of the grant to
Peoples. Table IV-18 shows that 72 percent said they applied for LIHEAP in the past 12
months, 54 percent said they received LIHEAP, and 49 percent said they assigned the
LIHEAP grant to Peoples.

www.appriseinc.org CAP Participant Feedback
APPRISE Incorporated Page 53
Table IV-18
LIHEAP Application and Receipt
In the past 12 months, did you or any member of your household apply for LIHEAP?...receive
home energy assistance benefits from LIHEAP? Did you assign the LIHEAP grant to Peoples?
Applied to LIHEAP Received LIHEAP Assigned to Peoples
Respondents 103
Yes 72% 54% 49%
No 24% 13% 2%
Did Not Apply - 24% 24%
Did Not Receive Grant - - 13%
Don’t Know 4% 9% 13%
Refused 0% 0% 0%
Total 100% 100% 100%
Respondents who said that they did not apply for LIHEAP were asked why they did not
apply. Table IV-19 shows that seven percent said they did not need LIHEAP, five percent
said they planned to apply, five percent said they did not know how to apply and four percent
said they did not know about LIHEAP.
Table IV-19
Reason for Not Applying for LIHEAP
Why did you not apply for LIHEAP?
Respondents 103
Not Needed 7%
Will Apply Soon 5%
Did Not Know How to Apply 5%
Did Not Know About LIHEAP 4%
Not Eligible 1%
Did Not Have Documentation 1%
Applied for LIHEAP 72%
Other 2%
Don’t Know 5%
Refused 0%
When asked how important CAP has been in helping them meet their needs, 92 percent said
it was very important and five percent said it was somewhat important.

www.appriseinc.org CAP Participant Feedback
APPRISE Incorporated Page 54
Table IV-20
Importance of CAP
How important has the CAP Program been in
helping you to meet your needs?
Respondents 103
Very Important 92%
Somewhat Important 5%
Of Little Importance 3%
Not At All Important 0%
Don’t Know 0%
Refused 0%
Total 100%
When asked whether they felt they needed additional assistance to pay their gas bill, 43
percent of respondents said they did feel they needed additional assistance.
Table IV-21
Need Additional Assistance to Pay Gas Bill
Do you feel that you need additional
help to pay your natural gas bill?
Respondents 103
Yes 43%
No 54%
Don’t Know 3%
Refused 0%
Total 100%
Respondents who said that they needed additional assistance were asked what type of
assistance they needed. Table IV-22 shows that most said they needed more bill payment
assistance or a lower bill.

www.appriseinc.org CAP Participant Feedback
APPRISE Incorporated Page 55
Table IV-22
Additional Assistance Needed to Pay Natural Gas Bill
What additional help do you need to pay your bill?
Respondents 103
More Bill Payment Assistance 19%
Lower Bill 16%
Weatherization 2%
More Time to Pay the Bill 2%
Assistance Not Needed 54%
Other 2%
Don’t Know 8%
Refused 0%
Customers could provide more than one response, so total may not sum to
100%.
Continued CAP Participation
When asked how likely they were to continue to participate in CAP, 92 percent said they
were very likely to continue to participate.
Table IV-23
Likeliness of Continued CAP Participation
How likely are you to continue to participate in CAP?
Respondents 103
Very Likely 92%
Somewhat Likely 6%
Not At All Likely 0%
Don’t Know 1%
Refused 1%
Total 100%
Most participants stated that they would continue to participate in the program as long as the
assistance was needed.

www.appriseinc.org CAP Participant Feedback
APPRISE Incorporated Page 56
Table IV-24
Length of Continued CAP Participation
How long do you think you will continue to participate in the program?
Respondents 103
<6 Months 1%
6-12 Months 3%
More than 12 Months 4%
As Long as Needed 84%
Until the Program Ends 2%
Don’t Know 6%
Refused 0%
Total 100%
Satisfaction and Recommendations
When asked about satisfaction with CAP, 93 percent said they were very satisfied and six
percent said they were somewhat satisfied.
Table IV-25
CAP Satisfaction
Overall, how satisfied are you with CAP?
Respondents 103
Very Satisfied 93%
Somewhat Satisfied 6%
Somewhat Dissatisfied 1%
Very Dissatisfied 0%
Don’t Know 0%
Refused 0%
Total 100%
Respondents provided some recommendations when they were asked how they thought the
program could be improved. They were most likely to suggest improved availability or
accessibility, a higher level of assistance, or weatherization services. However, most did not
have any recommendations.

www.appriseinc.org CAP Participant Feedback
APPRISE Incorporated Page 57
Table IV-26
Recommendations for Improving CAP
Do you have any recommendations for improvements to CAP?
Respondents 103
Improve Availability/Accessibility 6%
Higher Level of Assistance 5%
Provide Weatherization Services 4%
Clearer Bills 3%
More Explanation of Program upon Enrollment 1%
Improve Customer Services 1%
No Recommendations 81%
C. Summary and Recommendations We conducted telephone interviews with 103 current CAP participants to assess CAP
understanding, impact, and satisfaction. This section provides a summary of the key findings
from the survey.
Participation: Customers were most likely to find out about CAP from a Peoples
customer service representative, an agency, or a friend or relative. While 61 percent said
they enrolled to reduce their bills, 28 percent said it was because they had low or limited
income, and 24 percent said they enrolled to reduce their arrearages.
Most respondents reported that the enrollment and the recertification process were very
or somewhat easy. While 93 percent said that enrollment was very or somewhat easy, 97
percent said that re-certification was very or somewhat easy.
CAP Benefits: 89 percent reported that they felt they had a good understanding of the
services provided by CAP. While 90 percent said that their responsibility was to keep up
with payments, 12 percent said it was to report income and information, four percent said
it was to conserve energy, and three percent said it was to apply for LIHEAP.
Respondents were most likely to report that the benefits of CAP were lower energy bills
and even monthly payments. When asked about specific benefits, 98 percent agreed that
lower energy bills were a benefit, 94 percent agreed that maintaining gas service was a
benefit, and 80 percent agreed that reduced arrearages were a benefit.
While 97 percent said that the CAP bills shows the CAP payment in a way that is clear
and easy to locate and understand, 91 percent said it showed the CAP credit benefit and
84 percent said that it showed the arrearage forgiveness amount in a way that is clear and
easy to locate and understand.

www.appriseinc.org CAP Participant Feedback
APPRISE Incorporated Page 58
Bill Payment Problems: Respondents were much less likely to state that their CAP bills
were difficult to pay after enrollment in CAP. While 58 percent said it was very difficult
to pay the monthly gas bill prior to CAP enrollment, only five percent said it was very
difficult to pay the bill following enrollment. Sixty-six percent said their gas bill was
lower when they were in CAP and 25 percent said their gas usage was lower after
enrolling in CAP.
Respondents were less likely to report that they had to delay expenditures or skip paying
bills following enrollment in CAP. While 60 percent said they had to skip paying for
food prior to CAP enrollment, 24 percent said they did so following CAP enrollment.
Large declines in difficulty paying bills were also reported for the telephone, medical or
dental, mortgage or rent, and credit card or loans.
When asked how important CAP has been in helping them meet their needs, 92 percent
said it was very important and five percent said it was somewhat important.
Continued CAP Participation: When asked how likely they were to continue to
participate in CAP, 92 percent said they were very likely to continue to participate. Most
participants stated that they would continue to participate in the program as long as the
assistance was needed.
CAP Satisfaction and Recommendations: While 93 percent said they were very satisfied
with CAP, six percent said they were somewhat satisfied. Most respondents did not have
recommendations for the program. Those who did have recommendations were most
likely to suggest improved availability or accessibility, a higher level of assistance, or
weatherization services.

www.appriseinc.org Transactions Analysis
APPRISE Incorporated Page 59
V. Transactions Analysis
This section provides an analysis of Peoples’ CAP impacts on affordability, bill payment
compliance, and collections actions. This section first describes the methodology for the
analyses that were conducted and then the findings from the analyses.
A. Methodology This section describes the evaluation data and the selection of participants for the impact
analysis.
Evaluation Data
Peoples provided APPRISE with customer data, CAP program participation data, billing and
payment data, and collections data for 2014, 2015, and 2016. Peoples also provided data for
a comparison group of LIHEAP participants who did not participate in Peoples’ Universal
Service Programs during this time period.
Analysis Group
Customers who enrolled or participated in Universal Service Programs between January 1,
2015 and December 31, 2015 were included as potential members of the study group. This
group was chosen for the analysis, as one full year of post-program data is required for an
analysis of program impacts. Additionally, results are presented for customers who received
CAP credits at any time during 2015 to look at the broader population of CAP participants.
Because E-CAP, for customers with income between 151 and 200 percent of the poverty
level, was not introduced until 2016, we examine E-CAP statistics for 2016 participants.
Comparison Groups
The comparison groups were constructed to control for exogenous factors. The comparison
groups were designed to be as similar as possible to the treatment group, those who received
services and who we are evaluating, so that the exogenous changes for the comparison
groups are as similar as possible to those of the treatment group.
When measuring the impact of an intervention, it is necessary to recognize other exogenous
factors that can impact changes in outcomes. Changes in a customer’s payment behavior and
bill coverage rate, between the year preceding program enrollment and the year following
enrollment, may be affected by many factors other than program services received. Some of
these factors include changes in household composition or health of family members,
changes in utility prices, changes in weather, and changes in the economy.
The ideal way to control for other factors that may influence payment behavior would be to
randomly assign low-income customers to a treatment or control group. The treatment group
would be given the opportunity to participate in the program first. The control group would
not be given an opportunity to participate in the program until one full year later. This would
allow evaluators to determine the impact of the program by subtracting the change in
behavior for the control group from the change in behavior for the treatment group. Such
random assignment is rarely done in practice because of a desire to include all eligible
customers in the benefits of the program or to target a program to those who are most in
need.

www.appriseinc.org Transactions Analysis
APPRISE Incorporated Page 60
In the CAP evaluation, we were able to obtain two good comparison groups.
Low-Income Nonparticipant Comparison Group: We obtained a sample of 2015 LIHEAP
recipients who had not participated in Peoples Universal Service Programs from 2014
through 2016 to utilize as a comparison group. For the analysis, the group of customers
was replicated to represent customers who enrolled in the program in each quarter of
2015. A quasi intervention date of the middle of the quarter was chosen for each group to
compare to the participating customers.
2016 CAP Enrollee Comparison Group: We analyzed customers who last enrolled in
CAP in 2016 and who did not receive CAP credits in the two years preceding enrollment.
We required that they had no CAP credits and no arrearage forgiveness in the two years
preceding enrollment to ensure that they were nonparticipants in both periods. These
participants serve as a good comparison because they are lower income households who
were eligible for the program and chose to participate. We use data for these participants
for the two years preceding CAP enrollment, to compare their change in payment
behavior in the years prior to enrolling to the treatment group’s change in payment
behavior after enrolling. Because these customers did not participate in CAP in either of
the two analysis years, changes in bills and behavior should be related to factors that are
exogenous to the program.
For the program impact analysis, we examined pre- and post-treatment statistics. The
difference between the pre- and post-treatment statistics for the treatment group is considered
the gross change. This is the actual change in behaviors and outcomes for those participants
who were served by the program. Some of these changes may be due to the program, and
some of these changes are due to other exogenous factors, but this is the customer’s actual
experience. The net change is the difference between the change for the treatment group and
the change for the comparison group, and represents the actual impact of the program,
controlling for other exogenous factors.
Customers who participated in CAP in the year prior to enrollment were excluded from the
analysis, to allow for a comparison of data while not participating and while participating in
CAP. Customers who did not have close to a full year of data prior to joining the program or
following the program start date were not included in the impact analysis. The subject of data
attrition is addressed more fully below.
The data that were used for the study and comparison group were as follows.
2015 Treatment Group data extended from one year before the customer joined CAP to
one year after the customer enrolled.
Low-Income Nonparticipant Comparison Group data included one year of data before the
mid-point of the first quarter of 2015 to one year of data after the mid-point of the last
quarter of 2015.
2016 Comparison Group data extended from two years before the customer joined CAP
to the date of enrollment.
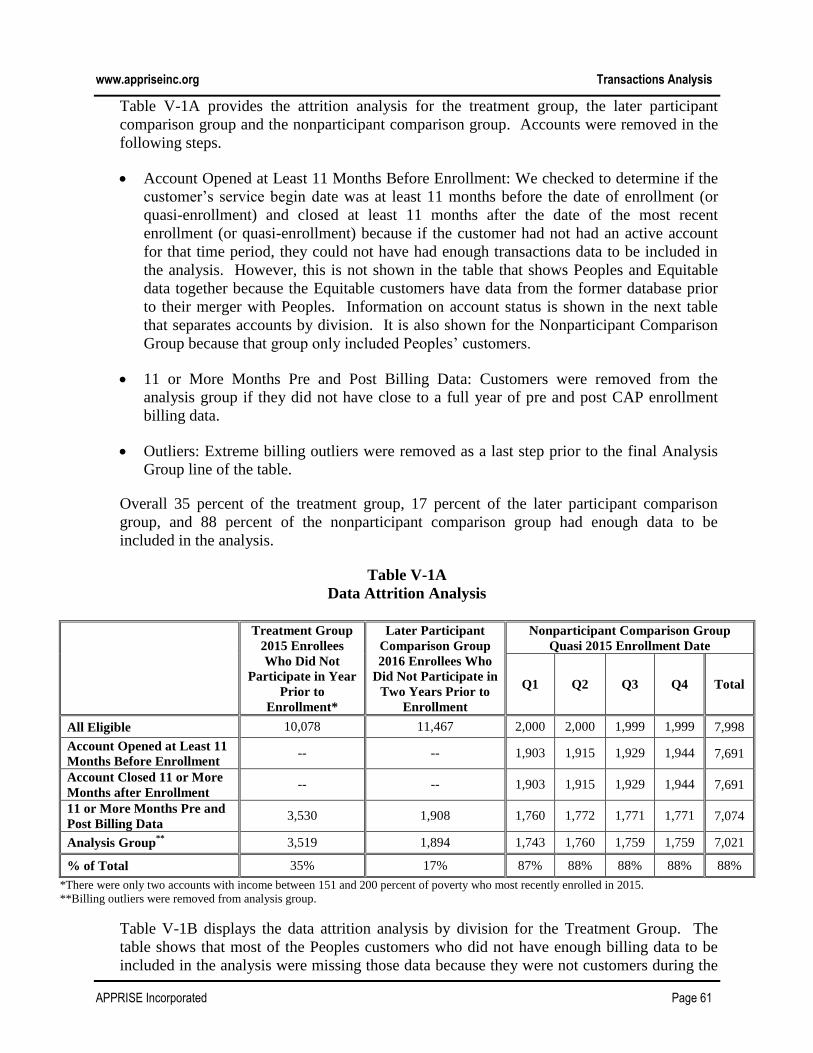
www.appriseinc.org Transactions Analysis
APPRISE Incorporated Page 61
Table V-1A provides the attrition analysis for the treatment group, the later participant
comparison group and the nonparticipant comparison group. Accounts were removed in the
following steps.
Account Opened at Least 11 Months Before Enrollment: We checked to determine if the
customer’s service begin date was at least 11 months before the date of enrollment (or
quasi-enrollment) and closed at least 11 months after the date of the most recent
enrollment (or quasi-enrollment) because if the customer had not had an active account
for that time period, they could not have had enough transactions data to be included in
the analysis. However, this is not shown in the table that shows Peoples and Equitable
data together because the Equitable customers have data from the former database prior
to their merger with Peoples. Information on account status is shown in the next table
that separates accounts by division. It is also shown for the Nonparticipant Comparison
Group because that group only included Peoples’ customers.
11 or More Months Pre and Post Billing Data: Customers were removed from the
analysis group if they did not have close to a full year of pre and post CAP enrollment
billing data.
Outliers: Extreme billing outliers were removed as a last step prior to the final Analysis
Group line of the table.
Overall 35 percent of the treatment group, 17 percent of the later participant comparison
group, and 88 percent of the nonparticipant comparison group had enough data to be
included in the analysis.
Table V-1A
Data Attrition Analysis
Treatment Group
2015 Enrollees
Who Did Not
Participate in Year
Prior to
Enrollment*
Later Participant
Comparison Group
2016 Enrollees Who
Did Not Participate in
Two Years Prior to
Enrollment
Nonparticipant Comparison Group
Quasi 2015 Enrollment Date
Q1 Q2 Q3 Q4 Total
All Eligible 10,078 11,467 2,000 2,000 1,999 1,999 7,998
Account Opened at Least 11
Months Before Enrollment -- -- 1,903 1,915 1,929 1,944 7,691
Account Closed 11 or More
Months after Enrollment -- -- 1,903 1,915 1,929 1,944 7,691
11 or More Months Pre and
Post Billing Data 3,530 1,908 1,760 1,772 1,771 1,771 7,074
Analysis Group**
3,519 1,894 1,743 1,760 1,759 1,759 7,021
% of Total 35% 17% 87% 88% 88% 88% 88%
*There were only two accounts with income between 151 and 200 percent of poverty who most recently enrolled in 2015.
**Billing outliers were removed from analysis group.
Table V-1B displays the data attrition analysis by division for the Treatment Group. The
table shows that most of the Peoples customers who did not have enough billing data to be
included in the analysis were missing those data because they were not customers during the

www.appriseinc.org Transactions Analysis
APPRISE Incorporated Page 62
full analysis period. While 44 percent of the Equitable treatment group had enough data to
be included, 28 percent of the Peoples Group had enough data.
Table V-1B
Treatment Group
Data Attrition Analysis by Division
Treatment Group
2015 Enrollees Who Did Not Participate in Year Prior to Enrollment*
≤150%
Division All People’s Equitable
# % # % # %
All Eligible 10,078 100% 5,718 100% 4,360 100%
Account Opened at Least 11
Months Before Enrollment -- -- 1,978 35% -- --
Account Closed 11 or More
Months after Enrollment -- -- 1,772 31% -- --
11 or More Months Pre and
Post Billing Data 3,530 35% 1,602 28% 1,928 44%
Analysis Group**
3,519 35% 1,593 28% 1,926 44%
% of Total 35% 28% 44%
*There were only two accounts with income between 151 and 200 percent of poverty who most recently enrolled in 2015.
**Billing outliers were removed from analysis group.
Table V-1C displays the data attrition analysis by division for the Later Participant
Comparison Group. The table shows that most of the Peoples customers who did not have
enough billing data to be included in the analysis were missing those data because they were
not customers during the full analysis period. While 14 percent of the Equitable treatment
group had enough data to be included, 18 percent of the Peoples Group had enough data.
Table V-1C
Comparison Group
Data Attrition Analysis by Division
Later Participant Comparison Group
2016 Enrollees Who Did Not Participate in Two Years
Prior to Enrollment
≤150%
Division All People’s Equitable
# % # % # %
All Eligible 11,467 100% 6,344 100% 5,123 100%
Account Opened at Least 22 Months
Before Enrollment -- -- 1,293 20% -- --
22 or More Months Billing Data 1,908 17% 1,178 19% 730 14%
Analysis Group* 1,894 17% 1,165 18% 729 14%
% of Total 17% 18% 14%
*Billing outliers were removed from analysis group.

www.appriseinc.org Transactions Analysis
APPRISE Incorporated Page 63
Table V-1D displays the data attrition for the analysis of all 2015 CAP participants and all
2016 E-CAP participants. Customers were included in this analysis if they had a CAP credit
or arrearage forgiveness credit in 2015 (or 2016 for E-CAP). The table shows that 78 percent
of those at or below 150 percent of the poverty level had enough data to be included and 70
percent of those in the E-CAP group had enough data to be included.
Table V-1D
All 2015 Participants
Data Attrition Analysis
All 2015 CAP
Participants
≤150%
All 2016 CAP
Participants
151%-200%
# % % %
All Eligible 36,426 100% 1,233 100%
12 Months of Billing Data in 2015 or 2016 28,285 78% 869 70%
Analysis Group* 28,265 78% 869 70%
*Billing outliers were removed from analysis group.
Table V-2 compares the characteristics of all CAP participants to those included in the billing
analysis to assess whether there are potential biases caused by the data attrition.
Seniors: These households contain at least one member that is 62 years old or older. The
table shows that the Treatment and Later Participant analysis groups are more likely to
have senior household members than the full population.
Children: These households contain at least one member that is 18 years old or younger.
The table shows that the Treatment and Later Participant Analysis Groups are less likely
to have children than the full population.
Annual Income: The table shows that the 2016 E-CAP participants, the Treatment, and
the Later Participant Analysis Groups are less likely to have customers with income
below $10,000 and are more likely to have income between $10,000 and $20,000.
Poverty Group: The table shows that the Treatment and the Later Participant Analysis
Groups are more likely to have customers between 100 and 150 percent of the poverty
level and are less likely to have customers in the lower poverty level groups.
Division: The Treatment Analysis Group is more likely to have customers in the
Equitable Division and the Later Participant Analysis Groups is more likely to have
customers in the Peoples Division.

www.appriseinc.org Transactions Analysis
APPRISE Incorporated Page 64
Table V-2
Customer Characteristics Comparison
All 2015 CAP
Participants
All 2016 E-CAP
Participants
Treatment Group
2015 Enrollees
No Participation
Year Prior to
Enrollment
Later Participant
Comparison
2016 Enrollees
No Participation
in 2 Years Prior
to Enrollment
Nonparticipant
Comparison
Group
≤150% 151%-200% ≤150% 0%-150%
All Analysis
Group All
Analysis
Group All
Analysis
Group All
Analysis
Group All
Analysis
Group
Observations 36,426 28,265 1,233 869 10,078 3,519 11,467 1,894 7,998 7,021
Senior 27% 29% 21% 22% 17% 26% 14% 28% 34% 35%
Children 46% 44% 52% 53% 54% 47% 60% 50% 21% 21%
Annual Income
≤ $10,000 85% 85% 37% 27% 89% 80% 91% 69% 81% 82%
$10,001-$20,000 12% 12% 35% 39% 8% 15% 7% 21% 4% 4%
$20,001-$30,000 2% 2% 16% 19% 2% 3% 1% 7% 1% 1%
$30,001-$40,000 1% 1% 7% 9% <1% 1% <1% 2% <1% <1%
>$40,000 <1% <1% 6% 6% <1% <1% <1% 1% <1% <1%
Missing <1% 0% 0% 0% 0% 0% 0% 0% 14% 14%
Poverty Group
≤ 50% 26% 25% 0% 0% 25% 21% 25% 15%
67% 67% 51% – 100% 47% 48% 0% 0% 44% 40% 42% 36%
101% – 150% 27% 27% 0% 0% 31% 39% 33% 50%
151%-200% 0% 0% 100% 100% 0% 0% 0% 0% 10% 10%
201%-250% 0% 0% 0% 0% 0% 0% 0% 0%
251%+ 0% 0% 0% 0% 0% 0% 0% 0% 2% 3%
Unknown 1% <1% 0% 0% <1% <1% <1% 0% 21% 20%
Income Source
Employment 20% 19% 58% 58% 26% 23% 31% 32% 2% 2%
Disability 11% 11% 9% 10% 11% 10% 10% 10% 1% 1%
Retirement 22% 22% 16% 16% 18% 19% 14% 17% 3% 3%
Unemployment 2% 2% 4% 4% 3% 3% 3% 4% <1% <1%
Other Income 14% 14% 7% 7% 15% 14% 12% 11% 1% <1%
Missing 37% 39% 16% 15% 33% 39% 35% 33% 94% 94%
Division
Peoples 63% 60% 64% 63% 57% 45% 55% 62% 100% 100%
Equitable 37% 40% 36% 37% 43% 55% 45% 38% 0% 0%

www.appriseinc.org Transactions Analysis
APPRISE Incorporated Page 65
B. CAP Participation and Discounts This section examines the length of CAP participation for the analysis groups. Table V-3A
shows that 61 percent of the 2015 participants had enrolled on or before January 1, 2015 and
had not been deactivated prior to January 1, 2016. Only one percent of the 2016 E-CAP
participants with income between 151 and 200 percent of the poverty level participated for
all of 2016 because most enrolled after January 2016.
The table also shows that 82 percent of the treatment group who enrolled in 2015 and did not
participate in CAP in the year prior to enrollment remained on CAP for at least a full year.
Table V-3A
Full Year CAP Participation
All 2015 CAP
Participants
All 2016 E-CAP
Participants
Treatment Group
2015 Enrollees That Did Not
Participate in the Year Prior to
Enrollment
≤150% 151%-200% ≤150%
# % # % # %
Final Analysis Group 28,265 100% 869 100% 3,519 100%
Full Year in CAP 17,130 61% 6 1% 2,893 82%
Not Full Year in CAP 11,135 39% 863 99% 626 18%
Enrolled after January 5,693 20% 703 81%
Removed before December 2,656 9% 4 <1%
Enrolled after Jan and
removed before Dec 2,786 10% 156 18%
Table V-3B displays full year CAP participation by division. The table shows that full year
CAP participation was higher for the Peoples treatment group than for the Equitable
treatment group. While 92 percent of the Peoples treatment group participated in CAP for
the full year, 74 percent of the Equitable treatment group participated in CAP for the full
year.
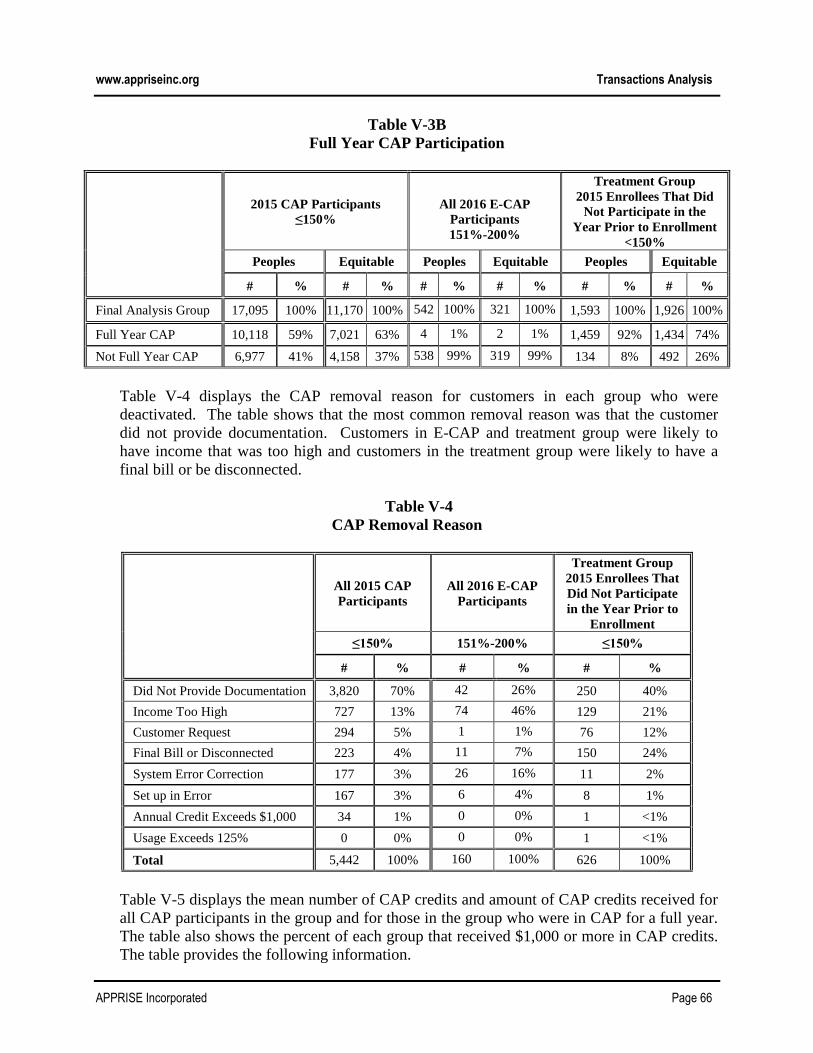
www.appriseinc.org Transactions Analysis
APPRISE Incorporated Page 66
Table V-3B
Full Year CAP Participation
2015 CAP Participants
≤150%
All 2016 E-CAP
Participants
151%-200%
Treatment Group
2015 Enrollees That Did
Not Participate in the
Year Prior to Enrollment
<150%
Peoples Equitable Peoples Equitable Peoples Equitable
# % # % # % # % # % # %
Final Analysis Group 17,095 100% 11,170 100% 542 100% 321 100% 1,593 100% 1,926 100%
Full Year CAP 10,118 59% 7,021 63% 4 1% 2 1% 1,459 92% 1,434 74%
Not Full Year CAP 6,977 41% 4,158 37% 538 99% 319 99% 134 8% 492 26%
Table V-4 displays the CAP removal reason for customers in each group who were
deactivated. The table shows that the most common removal reason was that the customer
did not provide documentation. Customers in E-CAP and treatment group were likely to
have income that was too high and customers in the treatment group were likely to have a
final bill or be disconnected.
Table V-4
CAP Removal Reason
All 2015 CAP
Participants
All 2016 E-CAP
Participants
Treatment Group
2015 Enrollees That
Did Not Participate
in the Year Prior to
Enrollment
≤150% 151%-200% ≤150%
# % # % # %
Did Not Provide Documentation 3,820 70% 42 26% 250 40%
Income Too High 727 13% 74 46% 129 21%
Customer Request 294 5% 1 1% 76 12%
Final Bill or Disconnected 223 4% 11 7% 150 24%
System Error Correction 177 3% 26 16% 11 2%
Set up in Error 167 3% 6 4% 8 1%
Annual Credit Exceeds $1,000 34 1% 0 0% 1 <1%
Usage Exceeds 125% 0 0% 0 0% 1 <1%
Total 5,442 100% 160 100% 626 100%
Table V-5 displays the mean number of CAP credits and amount of CAP credits received for
all CAP participants in the group and for those in the group who were in CAP for a full year.
The table also shows the percent of each group that received $1,000 or more in CAP credits.
The table provides the following information.

www.appriseinc.org Transactions Analysis
APPRISE Incorporated Page 67
All 2015 Participants: All 2015 participants received an average of 4.6 credits and $467,
and full year participants received an average of 5.3 credits and $541. While ten percent
of all 2015 participants received $1,000 or more in CAP credits, 12 percent of the full
year participants received $1,000 or more in CAP credits.
Peoples 2015 Participants: All 2015 Peoples participants received an average of 4.5
credits and $426, and full year participants received an average of 5.1 credits and $487.
While seven percent of all 2015 Peoples participants received $1,000 or more in CAP
credits, nine percent of the full year Peoples participants received $1,000 or more in CAP
credits.
Equitable 2015 Participants: All 2015 Equitable participants received an average of 4.8
credits and $529, and Equitable full year participants received an average of 5.6 credits
and $620. While 14 percent of all 2015 Equitable participants received $1,000 or more in
CAP credits, 17 percent of the Equitable full year participants received $1,000 or more in
CAP credits.
All 2016 E-CAP participants: These customers received an average of 1.6 credits and an
average of $81 in credits. Low credits were partly due to the fact that very few
participated for the full year.
The treatment group analysis focuses on credits received in the year after the 2015
enrollment. Therefore, most of these customers received credits for winter 2016, the 2nd
warmest year on record in Pittsburgh according to the National Oceanic and Atmospheric
Administration (NOAA)3. As a result, the 2015 treatment group had average CAP credits
that were significantly lower than all 2015 participants whose data included winter 2015
when the weather was much colder than average. While the January to March mean 2015
temperature in Pittsburgh was 27 degrees Fahrenheit, the January to March mean 2016
temperature in Pittsburgh was 36 degrees Fahrenheit.
Treatment Group: The treatment group received an average of 3.9 credits and $194, and
full year participants received an average of 4.2 credits and $205. Only one percent
received $1,000 or more in CAP credits.
Peoples Treatment Group: The Peoples treatment group received an average of 4.2
credits and $206, and full year participants received an average of 4.3 credits and $211.
Only one percent received $1,000 or more in CAP credits.
Equitable Treatment Group: The Equitable treatment group received an average of 3.7
credits and $185, and full year participants received an average of 4.0 credits and $200.
Only one percent received $1,000 or more in CAP credits.
3 https://www.ncdc.noaa.gov/sotc/national/2016/13/supplemental/page-1

www.appriseinc.org Transactions Analysis
APPRISE Incorporated Page 68
Table V-5
CAP Credits Received
Obs.
Mean
# CAP
Credits
Mean
Credits
Median
Credits
Received
$1,000 or
More CAP
Credits
Credits Received in 2015
All 2015 Participants (0-150%)
All 28,265 4.6 $467 $378 10%
Full Year CAP 17,130 5.3 $541 $452 12%
Peoples 2015 Participants (0-150%)
All 17,095 4.5 $426 $335 7%
Full Year CAP 10,118 5.1 $487 $392 9%
Equitable 2015 Participants (0-150%)
All 11,170 4.8 $529 $470 14%
Full Year CAP 7,012 5.6 $620 $561 17%
Credits Received in 2016
All 2016 E-CAP Participants (151-200%)
All 869 1.6 $81 $53 0%
Peoples 546 1.6 $76 $47 0%
Equitable 323 1.7 $89 $61 0%
All Full Year E-CAP 6 4.0 $195 $204 0%
Credits Received in Year after Enrollment
Treatment Group
All 3,519 3.9 $194 $125 1%
Full Year CAP 2,893 4.2 $205 $131 1%
Peoples Treatment Group
All 1,593 4.2 $206 $138 1%
Full Year CAP 1,459 4.3 $211 $139 1%
Equitable Treatment Group
All 1,926 3.7 $185 $110 1%
Full Year CAP 1,434 4.0 $200 $119 1%
Table V-6 displays the percent of treatment group participants who had a bill each month and
the percent that received a credit each month. While almost all had a bill each month as
required by the analysis, approximately 28 to 40 percent had a CAP credit each month.

www.appriseinc.org Transactions Analysis
APPRISE Incorporated Page 69
Table V-6
Percent who Received CAP Credit Each Month Following Enrollment
Treatment Group
Obs. Full Treatment Group - Months After Enrollment
1 2 3 4 5 6 7 8 9 10 11 12
Has Bill
3,519
99% >99% >99% >99% >99% >99% >99% >99% >99% >99% >99% 98%
CAP Credit-# 1,102 1,016 988 973 1,051 1,096 1,145 1,280 1,374 1,392 1,292 1,118
CAP Credit-% 31% 29% 28% 28% 30% 31% 33% 36% 39% 40% 37% 32%
Obs. Peoples Treatment Group – Months After Enrollment
1 2 3 4 5 6 7 8 9 10 11 12
Has Bill
1,593
99% 99% >99% >99% >99% 99% 99% >99% 99% >99% >99% 99%
CAP Credit-# 569 482 439 391 409 452 568 690 755 711 628 576
CAP Credit-% 36% 30% 28% 25% 26% 28% 36% 43% 47% 45% 39% 36%
Obs. Equitable Treatment Group – Months After Enrollment
1 2 3 4 5 6 7 8 9 10 11 12
Has Bill
1,926
99% >99% >99% >99% >99% >99% 99% >99% >99% >99% >99% 97%
CAP Credit-# 533 534 549 582 642 644 577 590 619 681 664 542
CAP Credit-% 28% 28% 29% 30% 33% 33% 30% 31% 32% 35% 34% 28%
Table V-7 displays the percent discount received by the treatment group. This is defined as
the CAP credits divided by the customer’s full bill. The table shows that the mean discount
across the full treatment group was 22 percent, and it was approximately the same for
Peoples and Equitable. Customers with income below 50 percent of the poverty level had the
greatest percent discount, averaging 40 percent, and ten percent of these customers had a
discount above 67 percent.
Table V-7
Percent Discount on Peoples Bill by Poverty Level
Treatment Group
Poverty
Level
Full Treatment Group Peoples
Treatment Group
Equitable
Treatment Group
Mean Percentile
Mean Percentile
Mean Percentile
10 25 50 75 90 25 50 75 25 50 75
≤50% 40% 13% 25% 41% 56% 67% 43% 27% 44% 58% 39% 23% 39% 54%
51%-100% 18% 2% 8% 15% 25% 39% 20% 11% 16% 26% 17% 6% 15% 25%
101%-150% 15% 2% 9% 14% 19% 26% 17% 11% 16% 21% 12% 6% 12% 16%
All 22% 4% 10% 17% 29% 48% 23% 12% 18% 29% 21% 36% 15% 29%

www.appriseinc.org Transactions Analysis
APPRISE Incorporated Page 70
Table V-8 provides additional information on the discount received. The table shows that
within the full treatment group, 69 percent had a discount of less than 25 percent, 22 percent
had a discount between 25 and 49 percent, eight percent had a discount between 50 and 74
percent, and one percent had a discount of 75 percent or more.
Discounts were greater for the lower poverty level groups. The table shows that of those
with income below 50 percent of the poverty level, 24 percent had a discount under 25
percent, 39 percent had a discount between 25 and 49 percent, 33 percent had a discount
between 50 and 74 percent, and three percent had a discount of 75 percent or more.
Table V-8
Distribution of Discount on Peoples Bill by Poverty Level
Treatment Group
Percent
Discount
Full Treatment Group Peoples Treatment Group Equitable Treatment Group
Poverty Level
All
Poverty Level
All
Poverty Level
All ≤50%
51%-
100%
101%-
150% ≤50%
51%-
100%
101%-
150% ≤50%
51%-
100%
101%-
150%
<25% 24% 73% 88% 69% 20% 72% 85% 68% 27% 74% 92% 70%
25%-49% 39% 23% 11% 22% 42% 25% 14% 24% 38% 22% 8% 21%
50%-74% 33% 3% <1% 8% 34% 3% <1% 8% 33% 4% <1% 9%
≥75% 3% <1% 0% 1% 4% 0% 0% 1% 2% <1% 0% 1%
Total 100% 100% 100% 100% 100% 100% 100% 100% 100% 100% 100% 100%
Table V-9 displays the mean percent discount by whether or not the customer was in CAP for
the full year. While the mean discount for those on CAP for the full year was 23 percent, the
mean discount for those not on CAP for the full year was 16 percent.
Table V-9
Mean Percent Discount on Peoples Bill by Full Year CAP Status and Poverty Level
Treatment Group
CAP Participation Poverty Level
All ≤50% 51%-100% 101%-150%
Full Year CAP 42% 19% 16% 23%
Not full year CAP 31% 15% 10% 16%
All 40% 18% 15% 22%

www.appriseinc.org Transactions Analysis
APPRISE Incorporated Page 71
C. Affordability Impacts This section examines the impacts of CAP on affordability. One commonly used measure of
energy affordability is energy burden, which is defined as the percent of income that is spent
on energy.
Table V-10 shows the calculated monthly CAP payment based on the customer’s annual
household income and poverty level. The payment is calculated as eight, nine, or ten percent
of income, depending on the poverty level. These values are consistent with the PUC’s
energy burden targets for CAP participants, also shown in the table. For example, for
customers with income between 101 and 150 percent of the poverty level, the energy burden
target is nine to ten percent and Peoples percent of income payment is ten percent.
Table V-10 also shows the mean calculated monthly CAP payment and the percent of
participants with a minimum payment because the designated percent of income payment
would be less than $25 per month. The table shows that a large percentage of CAP
participants have the minimum payment, especially in the lowest poverty group. While 71
percent of all 2015 participants with income below 50 percent of the poverty level have the
minimum payment, 44 percent of all 2015 participants have the minimum payment.
Table V-10
Calculated Monthly Payment
Poverty Level
Percent of
Income
Payment
PUC
Energy
Burden
Target
All 2015 Participants
(0-150% of Poverty) Treatment Group
Mean
Payment
% with Minimum
Payment
Mean
Payment
% with Minimum
Payment
≤50% 8% 5%-8% $32 71% $34 68%
51%-100% 9% 7%-10% $43 47% $47 46%
101%-150% 10% 9%-10% $77 14% $77 16%
All $50 44% $56 39%
While the CAP payment is designed to provide an energy burden that falls within the PUC
targeted affordability level, there are several reasons why a CAP participant’s energy burden
would be higher than this calculated target.
Minimum payment: As shown above, a large percentage of CAP participants have the
minimum payment level assigned. By definition, these customers will have an energy
burden that exceeds the percentage of income payment level.
Full year: Customers who are not on CAP for the full year will not receive all CAP
credits.

www.appriseinc.org Transactions Analysis
APPRISE Incorporated Page 72
Did not receive all credits: Historically, customers who did not make timely payments did
not receive all CAP credits. The credit application policy has changed so that currently
customers do receive a credit each month they are on CAP.
Arrearage forgiveness co-payment: Customers with arrearages pay $5 per month to
reduce the arrearage while they are receiving arrearage forgiveness. This increases the
monthly payment above the targeted percentage of income payment level.
CAP Plus co-payment: All CAP participants have a CAP Plus co-payment which
increases the monthly payment above the targeted percentage of income payment level.
Table V-11A shows the energy burden for the treatment group before and after participating
in CAP. The table shows a large reduction in average burden from 59 percent before
participation to 35 percent while participating for customers with income below 50 percent of
the poverty level. However, given the reasons noted above, a large percentage of these
customers still have an energy burden that exceeds the PUC target.
Table V-11A
Treatment Group Unadjusted Gas Burden
Poverty
Level
Treatment Group
Mean Unadjusted
Gas Energy Burden
PUC
Energy
Burden
Target
Poverty
Level
Treatment Group
Percent with
Burden Above
PUC Target
Pre Post Pre Post
≤ 50% 59% 35% 5%-8% ≤ 50% 96% 85%
51 – 100% 41% 25% 7%-10% 51 – 100% 86% 71%
101 – 150% 24% 15% 9%-10% 101 – 150% 71% 48%
Table V-11B shows the impact that some of these factors have on energy burden. This table
excludes customers with the minimum payment, excludes customers who did not participate
in CAP for the full year, and excludes the arrearage forgiveness co-pay and the CAP Plus
amount. When all of these adjustments are made, only ten percent of those with income
below 50 percent of the poverty level have an energy burden above the target level.
Table V-11B
Treatment Group Adjusted Gas Burden
Poverty
Level
Treatment Group
Mean Adjusted Gas
Energy Burden
PUC
Energy
Burden
Target
Poverty
Level
Treatment Group
Percent with
Burden Above
PUC Target
Pre Post Pre Post
≤ 50% 20% 3% 5%-8% ≤ 50% 88% 10%
51 – 100% 18% 7% 7%-10% 51 – 100% 73% 21%
101 – 150% 16% 7% 9%-10% 101 – 150% 64% 21%

www.appriseinc.org Transactions Analysis
APPRISE Incorporated Page 73
Table V-12A provides additional information on energy affordability and the impact of CAP
on affordability. The following information is displayed.
Full Bill: The full bill is the total amount billed in the identified time period. For CAP
customers, this is the bill prior to the application of the CAP credit. The table shows
that the bill declined significantly for all groups due to the warmer winter weather in the
post enrollment year. The bill declined by more for the treatment group than for the
comparison group, probably due to home conditions and higher pre-treatment winter
usage among the treatment group.
CAP Credits: The table shows that the treatment group received a mean of $194 in CAP
credits in the year following enrollment. The relatively low amount is due to the warm
winter in the post-enrollment year.
CAP Plus: The treatment group was charged an average of $46 in CAP Plus charges in
the post enrollment year.
Discounted Bill: The discounted bill is defined as the Full Bill minus the CAP Credits,
plus the CAP Plus Charge. CAP participants’ bills declined by an average of $590 due
to both the CAP credits and the warmer winter. Compared to the average comparison
group change, CAP participants’ bills declined by $324.
Energy Burden: Energy burden is defined as the customer’s bill divided by the
customer’s income. Energy burden declined for CAP participants due to the warmer
winter and the CAP credits received. While energy burden was 38 percent in the year
prior to CAP enrollment when there was a cold winter, energy burden averaged 23
percent in the year following CAP enrollment, a decline of 15 percentage points.
Relative to the comparison group, energy burden declined by nine percentage points.
The CAP has a significant positive impact on energy bill affordability.
Table V-12A
Affordability Impacts
Treatment Group
Later Participant
Comparison Group
Nonparticipant
Comparison Group
Average
Comparison
Group
Change
Net
Change Pre Post Change Pre Post Change Pre Post Change
Number of
Customers 3,519 2,290 7,021 9,311
Full Bill $1,234 $792 -$442**
$1,133 $803 -$330**
$817 $614 -$203**
-$267 -$175**
CAP Credits $0 $194 $194**
$0 $0 $0 $0 $0 $0 $0 $194**
CAP Plus $0 $46 $46**
$0 $0 $0 $0 $0 $0 $0 $46**
Discounted Bill $1,234 $643 -$590**
$1,133 $803 -$330**
$817 $614 -$203**
-$267 -$324**
Energy Burden 38% 23% -15%**
19% 14% -5%**
49% 41% -8%**
-6% -9%**
**Denotes significance at the 99 percent level. *Denotes significance at the 95 percent level. #Denotes significance at the 90 percent level. Note: 953 customers in the Nonparticipant Comparison group are excluded from the Energy Burden analysis due to missing information on annual income.
Note: “Discounted Bill” includes CAP Plus Charges (only applicable for the Treatment Group)

www.appriseinc.org Transactions Analysis
APPRISE Incorporated Page 74
Table V-12B displays the affordability impacts for Peoples division. The table shows results
that are similar to the full population. Peoples’ customers’ pre-enrollment bills were lower
than the overall average and did not decline as much. They had lower energy burdens in the
pre- and post-enrollment periods.
Table V-12B
Affordability Impacts - Peoples
Treatment Group
Later Participant
Comparison Group
Nonparticipant
Comparison Group
Average
Comparison
Group
Change
Net
Change Pre Post Change Pre Post Change Pre Post Change
Number of
Customers 1,593 1,521 7,021 8,542
Full Bill $1,093 $785 -$308**
$1,083 $806 -$277**
$817 $614 -$203**
-$240 -$68**
Discount $0 $206 $206**
$0 $0 $0 $0 $0 $0 $0 $206**
CAP Plus $0 $70 $70**
$0 $0 $0 $0 $0 $0 $0 $70**
Discounted Bill $1,093 $650 -$443**
$1,083 $806 -$277**
$817 $614 -$203**
-$240 -$203**
Energy Burden 21% 13% -8%**
14% 11% -3%**
49% 41% -8%**
-5% -3%**
**Denotes significance at the 99 percent level. *Denotes significance at the 95 percent level. #Denotes significance at the 90 percent level. Note: 953 customers in the Nonparticipant Comparison group are excluded from the Energy Burden analysis due to missing information on annual income.
Note: “Discounted Bill” includes CAP Plus Charges (only applicable for the Treatment Group)
Table V-12C displays the affordability impacts for the Equitable division. The table shows
results that are similar to the full population. Equitable’s customers’ pre-enrollment bills
were higher than the overall average and declined by more than the overall average. They
had higher energy burdens in the pre- and post-enrollment periods.
Table V-12C
Affordability Impacts – Equitable
Treatment Group
Later Participant
Comparison Group
Nonparticipant
Comparison Group1
Average
Comparison
Group
Change
Net
Change Pre Post Change Pre Post Change Pre Post Change
Number of
Customers 1,926 769 7,021 7,790
Full Bill $1,350 $797 -$553**
$1,232 $796 -$436**
$817 $614 -$203**
-$320 -$233**
Discount $0 $185 $185**
$0 $0 $0 $0 $0 $0 $0 $185**
CAP Plus $0 $26 $26**
$0 $0 $0 $0 $0 $0 $0 $26**
Discounted Bill $1,350 $638 -$712**
$1,232 $796 -$436**
$817 $614 -$203**
-$320 -$392**
Energy Burden 52% 31% -21%**
30% 20% -10%**
49% 41% -8%**
-9% -12%**
**Denotes significance at the 99 percent level. *Denotes significance at the 95 percent level. #Denotes significance at the 90 percent level.
Note: “Discounted Bill” includes CAP Plus Charges (only applicable for the Treatment Group) 1The nonparticipant comparison group is comprised of Peoples’ customers.

www.appriseinc.org Transactions Analysis
APPRISE Incorporated Page 75
The CAP Plus amount is calculated by Peoples as the LIHEAP receipts for customers
participating in the CAP program for the previous LIHEAP heating season divided by
number of current active CAP participants and the projected number of CAP participants to
join CAP that quarter. The CAP Plus amount is added to the calculated monthly CAP
payment amount for all participating CAP customers. The monthly CAP Plus charge has
varied over time as shown in the table below. It was introduced for the Equitable division in
March 2016.
Table V-13A
CAP Plus Monthly Charge
Division November 2014 February 2016 March 2016 July 2016
Equitable -- -- $7 $7
Peoples $6 $6 $5 $8
T.W. Phillips $3 $9 $8 $8
Table V-13B displays CAP Plus charges for all 2015 participants and the treatment group.
The table shows that the 2015 participants received a mean of 6.3 CAP Plus charges totaling
$38 and the treatment group received a mean of 7.3 CAP Plus charges totaling $46. The
CAP Plus charges made up 5.8 percent of the discounted bill for all 2015 participants and 7.8
percent of the discounted bill for the treatment group.
Table V-13B
CAP Plus
All 2015
Participants
All 2016 E-CAP
Participants Treatment Group
(Year Following
Enrollment) 0-150% 151-200%
Number of Customers 28,265 869 3,519
Number of CAP Plus Charges 6.3 6.8 7.3
Total Amount of CAP Plus Charges $38 $49 $46
Discounted Bill without CAP Plus Charges $717 $781 $597
Discounted Bill with CAP Plus Charges $755 $829 $643
% of Discounted Bill made up by CAP Plus Charges 5.8% 6.4% 7.8%
Table V-13C displays CAP Plus charges for all 2015 Peoples division participants and the
treatment group. The table shows that the 2015 participants received a mean of 10.5 CAP
Plus charges totaling $63 and the treatment group received a mean of 11.7 CAP Plus charges
totaling $70. The CAP Plus charges made up 9.6 percent of the discounted bill for all 2015
participants and 11.8 percent of the discounted bill for the treatment group.

www.appriseinc.org Transactions Analysis
APPRISE Incorporated Page 76
Table V-13C
CAP PLUS - Peoples
All 2015
Participants
All 2016 E-CAP
Participants Treatment Group
(Year Following
Enrollment) 0-150% 151-200%
Number of Customers 17,095 546 1,593
Number of CAP Plus Charges 10.5 6.9 11.7
Total Amount of CAP Plus Charges $63 $50 $70
Discounted Bill without CAP Plus Charges $681 $786 $579
Discounted Bill with CAP Plus Charges $744 $837 $650
% of Discounted Bill made up by CAP Plus Charges 9.6% 6.6% 11.8%
Table V-13D displays CAP Plus charges for all 2015 Equitable division participants and the
treatment group. The table shows that the 2015 participants did not receive CAP Plus
charges because they were introduced in March 2016 for Equitable customers. The treatment
group received a mean of 3.7 CAP Plus charges totaling $26. The CAP Plus charges made
up 4.6 percent of the discounted bill for the treatment group.
Table V-13D
CAP PLUS - Equitable
All 2015
Participants
All 2016 E-CAP
Participants Treatment Group
(Year Following
Enrollment) 0-150% 151-200%
Number of Customers 11,170 323 1,926
Number of CAP Plus Charges 0 6.5 3.7
Total Amount of CAP Plus Charges $0 $46 $26
Discounted Bill without CAP Plus Charges $771 $771 $612
Discounted Bill with CAP Plus Charges $771 $817 $638
% of Discounted Bill made up by CAP Plus Charges 0% 6.0% 4.6%
D. Payment Impacts This section examines the impact of CAP on participants’ bill payment. Table V-14 provides
the following information.
Total Charges: Customers’ charges declined significantly due to the CAP credits and the
warmer winter in the post-CAP enrollment period.
LIHEAP and Crisis: While there was no significant net change in the amount of LIHEAP
received, there was a decline in the amount of LIHEAP Crisis assistance received, likely
due to a more affordable bill.

www.appriseinc.org Transactions Analysis
APPRISE Incorporated Page 77
Cash Payments: As a result of the reduced charges, customers reduced the amount of
cash payments made. However, the net change was a slight increase in cash payments.
Number of Cash Payments: CAP participants increased the number of cash payments
made as compared to the decline experienced by the comparison groups.
Cash Coverage Rate: The cash coverage rate is the percent of charges covered by the
customer’s cash payments. The table shows that the treatment group increased their cash
coverage rate from 69 percent in the pre-CAP enrollment period to 95 percent in the post-
CAP enrollment period. This compares to a decline for the comparison group. The net
change was an increase of 34 percentage points.
Total Coverage Rate: The total coverage rate is the percent of charges covered by the
customer’s cash payments and all other credits, including assistance payments. The table
shows that the treatment group increased their total coverage rate from 85 percent in the
pre-CAP enrollment period to 123 percent in the post-CAP enrollment period, indicating
that these customers were paying off some of their arrearages. The net change was an
increase of 36 percentage points.
Shortfall: The shortfall is defined as the total charges minus the total payments.
Customers averaged $211 in shortfall in the pre-treatment period, but their payments
exceed the bills by $147 in the post period. The net change in shortfall was a decline of
$318.
Arrearage Forgiveness: CAP participants received an average of $118 in arrearage
forgiveness in the post treatment period.
Table V-14
Payment Impacts
Treatment Group
Later Participant
Comparison Group
Nonparticipant
Comparison Group
Average
Comparison
Group
Change
Net
Change Pre Post Change Pre Post Change Pre Post Change
Number of
Customers 3,516 2,288 7,021 9,309
Total Charges $1,234 $644 -$590**
$1,134 $803 -$331**
$817 $614 -$203**
-$267 -$323**
CAP Credits $0 $194 $194**
$0 $0 $0 $0 $0 $0 $0 $194**
LIHEAP $82 $102 $19**
$58 $69 $11**
$182 $202 $19**
$15 $4
LIHEAP Crisis $68 $38 -$30**
$44 $58 $14**
$13 $8 -$5**
$5 -$35**
Hardship Fund $20 $17 -$3 $20 $35 $15**
$0 $0 $0 $8 -$10**
Other Assistance <$1 $2 $2**
<$1 $2 $2**
<$1 <$1 <$1 $1 $1
Cash Payments $851 $632 -$220**
$919 $645 -$274**
$752 $515 -$237**
-$255 $36**
Total Payments $1,022 $790 -$232**
$1,040 $808 -$232**
$947 $726 -$222**
-$227 -$5
# Cash Payments 6.0 5.8 -0.2**
5.9 4.4 -1.5**
8.2 7.0 -1.2**
-1.3 1.2**

www.appriseinc.org Transactions Analysis
APPRISE Incorporated Page 78
Treatment Group
Later Participant
Comparison Group
Nonparticipant
Comparison Group
Average
Comparison
Group
Change
Net
Change Pre Post Change Pre Post Change Pre Post Change
Cash Coverage
Rate 69% 95% 26%
** 83% 78% -4%
** 91% 80% -12% -8% 34%
**
Total Coverage
Rate 85% 123% 39%
** 95% 101% 6%
** 119% 119% >-1% 2% 36%
**
Shortfall $211 -$147 -$358**
$93 -$6 -$99**
-$130 -$111 $19**
-$40 -$318**
Arrearage
Forgiveness $0 $118 $118
** $0 $0 $0 $0 $0 $0 $0 $118
**
**Denotes significance at the 99 percent level. *Denotes significance at the 95 percent level. #Denotes significance at the 90 percent level.
Note: 3 accounts in the treatment group and 2 accounts in the later participant comparison group were excluded from this table because they do not have detailed
payment information.
Table V-15 displays the total bill coverage rates distribution. The table shows that while
only 33 percent of the treatment group paid their full bill or more prior to enrollment in CAP,
71 percent paid their full bill or more following enrollment. The comparison groups did not
see the same improvement in bill coverage rates.
Table V-15
Total Bill Coverage Rates
Treatment Group
Later Participant
Comparison Group
Nonparticipant
Comparison Group
Average
Comparison
Group
Change
Net
Change Pre Post Change Pre Post Change Pre Post Change
Number of Customers 3,519 2,290 7,021 9,311
≥ 100% 33% 71% 37%**
44% 49% 5%**
69% 67% -3%**
1% 36%**
90%-99% 15% 9% -5%**
12% 9% -3%**
13% 14% 1% -1% -4%**
80%-89% 12% 6% -6%**
9% 7% -2%**
6% 7% 1%**
>-1% -6%**
< 80% 40% 14% -26%**
35% 35% <1% 11% 12% <1% <1% -26%**
**Denotes significance at the 99 percent level. *Denotes significance at the 95 percent level. #Denotes significance at the 90 percent level.
Table V-16 displays the percent of customers who received LIHEAP and the mean LIHEAP
grants. Approximately the same percent of customers received LIHEAP after enrolling in
CAP and the mean grant remained approximately the same.
Table V-16
Percent Received LIHEAP
Treatment Group
Later Participant
Comparison Group
Nonparticipant
Comparison Group
Average
Comparison
Group
Change
Net
Change Pre Post Change Pre Post Change Pre Post Change
Number of Customers 3,516 2,288 7,021 9,309
Percent Received LIHEAP 38% 42% 4%**
26% 33% 6%**
81% 81% <1% 4% 1%
Mean LIHEAP Grant –
All Customers $82 $102 $19
** $58 $69 $11
** $182 $202 $19
** $15 $4

www.appriseinc.org Transactions Analysis
APPRISE Incorporated Page 79
Treatment Group
Later Participant
Comparison Group
Nonparticipant
Comparison Group
Average
Comparison
Group
Change
Net
Change Pre Post Change Pre Post Change Pre Post Change
Mean LIHEAP Grant –
Received LIHEAP $219 $242 $23
** $220 $211 -$9 $226 $248 $22
** $7 $17
Percent Received LIHEAP
Crisis 16% 11% -5%
** 11% 14% 3%
** 3% 2% -1%
** 1% -6%
**
Mean LIHEAP Crisis
Grant – All Customers $68 $38 -$30
** $44 $58 $14
** $13 $8 -$5
** $5 -$35
**
Mean LIHEAP Crisis
Grant – Received LIHEAP
Crisis
$425 $357 -$68**
$398 $422 $23#
$393 $443 $50**
$37 -$105**
**Denotes significance at the 99 percent level. *Denotes significance at the 95 percent level. #Denotes significance at the 90 percent level.
Note: 3 accounts in the treatment group and 2 accounts in the later participant comparison group were excluded from this table because they do not have detailed payment information.
E. Arrearage Forgiveness This section provides an analysis of the arrearage forgiveness received by CAP participants.
Table V-17A shows that all customers with arrearages received at least one arrearage
forgiveness payment. The full year 2015 CAP participants with arrearages received an
average of 5.1 arrearage forgiveness payments and $203 in arrearage forgiveness. The full
year treatment group with arrearages received an average of 5.2 arrearage forgiveness
payments and $176 in arrearage forgiveness.
Table V-17A
Arrearage Forgiveness Received
Obs.
% Received
Arrearage
Forgiveness
Mean # of
Arrearage
Forgiveness
Payments
Mean
Forgiven
Median
Forgiven
Forgiveness Received in 2015
All 2015 Participants (0-150%) 28,265 40% 1.7 $69 $0
2015 Participants with Arrearages 11,168 100% 4.2 $175 $81
2015 Full Year CAP 17,130 31% 1.6 $64 $0
2015 Full Year CAP with Arrearages 5,351 100% 5.1 $203 $107
Forgiveness Received in 2016
All 2016 Participants (151-200%) 869 89% 3.0 $192 $102
2016 Participants with Arrearages 771 100% 3.3 $216 $117
2016 Full Year CAP 6 100% 4.8 $267 $225
2016 Full Year CAP with Arrearages 6 100% 4.8 $267 $225
Forgiveness Received in Year after Enrollment
Treatment Group 3,519 71% 3.5 $118 $40
Treatment Group with Arrearages 2,483 100% 5.0 $167 $80
Treatment Group – Full Year CAP 2,893 73% 3.8 $128 $49
Treatment Group – Full Year CAP with Arrearages 2,107 100% 5.2 $176 $87

www.appriseinc.org Transactions Analysis
APPRISE Incorporated Page 80
Table V-17B shows the same information for Peoples division. The table shows that all
customers with arrearages received at least one arrearage forgiveness payment. The full year
2015 CAP participants received an average of 5.7 arrearage forgiveness payments and $230
in arrearage forgiveness. The full year treatment group with arrearages received an average
of 5.9 arrearage forgiveness payments and $239 in arrearage forgiveness.
Table V-17B
Arrearage Forgiveness Received - Peoples
Obs.
% Received
Arrearage
Forgiveness
Mean # of
Arrearage
Forgiveness
Payments
Mean
Forgiven
Median
Forgiven
Forgiveness Received in 2015
All 2015 Participants (0-150%) 17,095 44% 2.1 $92 $0
2015 Participants with Arrearages 7,465 100% 4.8 $210 $83
2015 Full Year CAP 10,118 31% 2.1 $86 $0
2015 Full Year CAP with Arrearages 3,790 100% 5.7 $230 $96
Forgiveness Received in 2016
All 2016 Participants (151-200%) 546 89% 3.0 $238 $113
2016 Participants with Arrearages 485 100% 3.4 $268 $143
2016 Full Year CAP 4 100% 6.3 $321 $284
2016 Full Year CAP with Arrearages 4 100% 6.3 $321 $284
Forgiveness Received in Year after Enrollment
Treatment Group 1,593 75% 4.4 $179 $71
Treatment Group with Arrearages 1,196 100% 5.8 $239 $126
Treatment Group – Full Year CAP 1,459 76% 4.5 $183 $74
Treatment Group – Full Year CAP with Arrearages 1,112 100% 5.9 $239 $128
Table V-17C shows the same information for the Equitable division. The table shows that all
customers with arrearages received at least one arrearage forgiveness payment. The full year
2015 CAP participants received an average of 3.6 arrearage forgiveness payments and $139
in forgiveness. The full year treatment group with arrearages received an average of 4.5
arrearage forgiveness payments and $106 in arrearage forgiveness.

www.appriseinc.org Transactions Analysis
APPRISE Incorporated Page 81
Table V-17C
Arrearage Forgiveness Received - Equitable
Obs.
% Received
Arrearage
Forgiveness
Mean # of
Arrearage
Forgiveness
Payments
Mean
Forgiven
Median
Forgiven
Forgiveness Received in 2015
All 2015 Participants (0-150%) 11,170 33% 1.0 $35 $0
2015 Participants with Arrearages 3,703 100% 3.1 $104 $80
2015 Full Year CAP 7,012 31% 0.8 $31 $0
2015 Full Year CAP with Arrearages 1,561 100% 3.6 $139 $120
Forgiveness Received in 2016
All 2016 Participants (151-200%) 323 89% 2.8 $113 $89
2016 Participants with Arrearages 286 100% 3.2 $127 $101
2016 Full Year CAP 2 100% 2.0 $158 $158
2016 Full Year CAP with Arrearages 2 100% 2.0 $158 $158
Forgiveness Received in Year after Enrollment
Treatment Group 1,926 67% 2.8 $67 $34
Treatment Group with Arrearages 1,287 100% 4.2 $100 $60
Treatment Group – Full Year CAP 1,434 69% 3.1 $73 $40
Treatment Group – Full Year CAP with Arrearages 995 100% 4.5 $106 $65
Table V-18A displays the percent of treatment group customers who received arrearage
forgiveness in each month following CAP enrollment. Of the full year CAP participants with
arrearages, between 33 and 59 percent received the forgiveness payment each month.
Table V-18A
Percent Received Arrearage Forgiveness Each Month Following Enrollment
Treatment Group
Obs. Months After Enrollment
1 2 3 4 5 6 7 8 9 10 11 12
All Treatment Group 3,519 23% 42% 35% 30% 28% 25% 26% 27% 28% 29% 29% 29%
Treatment Group with
Arrearages 2,483 33% 59% 49% 43% 40% 36% 38% 39% 40% 41% 41% 41%
Treatment Group – Full
Year CAP 2,893 24% 43% 37% 32% 30% 27% 29% 30% 31% 32% 32% 34%
Treatment Group – Full
Year CAP with Arrearages 2,107 33% 59% 50% 44% 41% 38% 40% 41% 43% 44% 44% 47%
Table V-18B displays the percent of Peoples division treatment group customers who
received arrearage forgiveness in each month following CAP enrollment. Of the full year

www.appriseinc.org Transactions Analysis
APPRISE Incorporated Page 82
CAP participants with arrearages, between 30 and 61 percent received the forgiveness
payment each month.
Table V-18B
Percent Received Arrearage Forgiveness Each Month Following Enrollment
Peoples Treatment Group
Obs. Months After Enrollment
1 2 3 4 5 6 7 8 9 10 11 12
All Treatment Group 1,593 23% 46% 42% 37% 37% 34% 36% 37% 37% 36% 36% 37%
Treatment Group with
Arrearages 1,196 30% 61% 56% 50% 49% 46% 48% 49% 50% 49% 47% 49%
Treatment Group – Full Year
CAP 1,459 23% 46% 43% 38% 38% 35% 37% 38% 39% 38% 37% 39%
Treatment Group – Full Year
CAP with Arrearages 1,112 30% 61% 56% 50% 50% 46% 49% 50% 51% 50% 49% 51%
Table V-18C displays the percent of Equitable division treatment group customers who
received arrearage forgiveness in each month following CAP enrollment. Of the full year
CAP participants with arrearages, between 28 and 57 percent received the forgiveness
payment each month.
Table V-18C
Percent Received Arrearage Forgiveness Each Month Following Enrollment
Equitable Treatment Group
Obs. Months After Enrollment
1 2 3 4 5 6 7 8 9 10 11 12
All Treatment Group 1,926 24% 38% 29% 24% 20% 18% 19% 19% 21% 22% 23% 23%
Treatment Group with
Arrearages 1,287 36% 58% 43% 37% 31% 26% 28% 29% 31% 33% 35% 34%
Treatment Group – Full Year
CAP 1,434 25% 39% 30% 26% 22% 19% 21% 22% 23% 25% 27% 29%
Treatment Group – Full Year
CAP with Arrearages 995 36% 57% 44% 38% 32% 28% 30% 32% 34% 36% 39% 41%
F. Collections Impacts This section examines the impacts of CAP on collections actions and costs. Table V-19A
shows that there was a small, statistically significant reduction in the number of collection
calls for the treatment group as compared to the comparison groups.

www.appriseinc.org Transactions Analysis
APPRISE Incorporated Page 83
Table V-19A
Number of Collections Actions
Treatment Group
Later Participant
Comparison Group
Nonparticipant
Comparison Group
Average
Comparison
Group
Change
Net
Change Pre Post Change Pre Post Change Pre Post Change
Number of Customers 3,517 2,287 7,007 9,294
Letters 0.05 0.09 0.04**
0.05 0.14 0.09**
0.05 0.04 -0.02**
0.04 <0.01
Calls 0.07 0.12 0.05**
0.09 0.16 0.07**
0.04 0.02 -0.1**
0.03 0.03*
Termination Processing
step – No Cost 0.12 0.19 0.07
** 0.16 0.29 0.13
** 0.04 0.04 -0.01 0.06 0.01
Termination Processing
Step – With Cost 0.01 0.01 0.01 0.01 0.01 0.01 0.01 0.01 -0.01
** >-0.01 <0.01
Terminations 0.08 0.10 0.02*
0.11 0.18 0.07**
0.03 0.03 -0.01#
0.03 -0.01 **Denotes significance at the 99 percent level. *Denotes significance at the 95 percent level. #Denotes significance at the 90 percent level.
Note: 2 accounts in the Treatment Group, 3 accounts in the Later Participant Comparison Group, and 14 accounts in the Nonparticipant Comparison Group are excluded
from this tables due to missing Collections Actions information.
Table V-19B shows the results for the Peoples division customers. This table shows that
there was a significant decline in the number of letters, calls, and terminations for the
treatment group as compared to the comparison groups.
Table V-19B
Number of Collections Actions - Peoples
Treatment Group Later Participant
Comparison Group
Nonparticipant
Comparison Group Average
Comparison
Group
Change
Net
Change Pre Post Change Pre Post Change Pre Post
Chang
e
Number of Customers 1,591 1,518 7,007 8,525
Letters 0.10 0.06 -0.04**
0.07 0.13 0.06**
0.05 0.04 -0.02**
0.02 -0.06**
Calls 0.13 0.08 -0.06**
0.14 0.19 0.05**
0.04 0.02 -0.1**
0.02 -0.07**
Termination Processing
step – No Cost 0.24 0.14 -0.10
** 0.24 0.33 0.09
** 0.04 0.04 -0.01 0.04 -0.14
**
Termination Processing
Step – With Cost 0.01 0.01 -0.01 0.01 0.01 >-0.01 0.01 0.01 -0.01
** -0.01 -0.01
Terminations 0.17 0.10 -0.08**
0.21 0.16 0.05**
0.03 0.03 -0.01#
0.02 -0.10**
**Denotes significance at the 99 percent level. *Denotes significance at the 95 percent level. #Denotes significance at the 90 percent level. Note: 2 accounts in the Treatment Group, 3 accounts in the Later Participant Comparison Group, and 14 accounts in the Nonparticipant Comparison Group are
excluded from this tables due to missing Collections Actions information.
Table V-19C shows the results for the Equitable division customers. This table shows that
there was a significant increase in the number of letters, calls, and terminations for the
treatment group as compared to the comparison groups.

www.appriseinc.org Transactions Analysis
APPRISE Incorporated Page 84
Table V-19C
Number of Collections Actions – Equitable
Treatment Group
Later Participant
Comparison Group
Nonparticipant
Comparison Group
Average
Comparison
Group
Change
Net
Change Pre Post Change Pre Post Change Pre Post Change
Number of Customers 1,926 769 7,007
Letters 0.01 0.12 0.11**
0.01 0.15 0.15**
0.05 0.04 -0.02**
0.07 0.04**
Calls 0.02 0.16 0.14**
0.01 0.11 0.10**
0.04 0.02 -0.01**
0.05 0.10**
Termination Processing
step – No Cost 0.02 0.23 0.21
** 0.01 0.21 0.20
** 0.04 0.04 -0.01 0.10 0.11
**
Termination Processing
Step – With Cost 0.01 0.01 0.01
** 0.01 0.01 0.01 0.01 0.01 -0.01
** 0.01 0.01
*
Terminations 0.01 0.11 0.10**
0.01 0.12 0.12**
0.03 0.03 -0.01#
0.06 0.04**
**Denotes significance at the 99 percent level. *Denotes significance at the 95 percent level. #Denotes significance at the 90 percent level.
The nonparticipant comparison group is comprised of Peoples customers.
Table V-20A shows that there was not a statistically significant change in the cost of
collections for the treatment group as compared to the comparison groups.
Table VI-20A
Cost of Collections Actions
Treatment Group
Later Participant
Comparison Group
Nonparticipant
Comparison Group
Average
Comparison
Group
Change
Net
Change Pre Post Change Pre Post Change Pre Post Change
Number of
Customers 3,517 2,287 7,007 9,294
Letters $0.05 $0.09 $0.04**
$0.05 $0.14 $0.09**
$0.05 $0.04 -$0.02**
$0.04 $0.01
Calls $0.01 $0.01 $0.01**
$0.01 $0.02 0.01**
$0.01 $0.01 -$0.01**
$0.01 $0.01*
Termination
Processing Step $0.27 $0.42 $0.15 $0.54 $0.62 $0.08 $0.32 $0.16 -$0.17
** -$0.04 $0.19
Terminations $5.46 $6.71 $1.25*
$6.99 $11.61 $4.62**
$1.95 $1.62 -$0.33#
$2.15 -$0.90
Total Cost $5.79 $7.23 $1.44**
$7.59 $12.39 $4.80**
$2.33 $1.82 -$0.51**
$2.14 -$0.71 **Denotes significance at the 99 percent level. *Denotes significance at the 95 percent level. #Denotes significance at the 90 percent level.
Note: 2 accounts in the Treatment Group, 3 accounts in the Later Participant Comparison Group, and 14 accounts in the Nonparticipant Comparison Group are
excluded from this tables due to missing Collections Actions information.
Table V-20B shows the results for the Peoples division customers. This table shows that
there was a significant decline in the cost of collections of $6.52 for the treatment group as
compared to the comparison groups.

www.appriseinc.org Transactions Analysis
APPRISE Incorporated Page 85
Table V-20B
Cost of Collections Actions - Peoples
Treatment Group
Later Participant
Comparison Group
Nonparticipant
Comparison Group
Average
Comparison
Group
Change
Net
Change Pre Post Change Pre Post Change Pre Post Change
Number of
Customers 1,591 1,518 7,007 8,525
Letters $0.10 $0.06 -$0.04**
$0.08 $0.13 $0.06**
$0.05 $0.04 -$0.02**
$0.02 -$0.06**
Calls $0.01 $0.01 -$0.01**
$0.01 $0.02 <$0.01**
<$0.01 <$0.01 >-$0.01**
<$0.01 -$0.01**
Termination
Processing–
With Cost
$0.57 $0.32 -$0.24 $0.76 $0.72 -$0.04 $0.32 $0.16 -$0.17**
-$0.10 -$0.14
Terminations $11.06 $6.16 -$4.90**
$10.40 $13.55 $3.14**
$1.95 $1.62 -$0.33#
$1.41 -$6.31**
Total Cost $11.74 $6.55 -$5.19**
$11.26 $14.42 $3.16**
$2.33 $1.82 -$0.51**
$1.32 -$6.52**
**Denotes significance at the 99 percent level. *Denotes significance at the 95 percent level. #Denotes significance at the 90 percent level. Note: 2 accounts in the Treatment Group, 3 accounts in the Later Participant Comparison Group, and 14 accounts in the Nonparticipant Comparison Group are
excluded from this tables due to missing Collections Actions information.
Table V-20C shows that there was a statistically significant increase in the cost of collections
for the Equitable treatment group of $3.15 as compared to the comparison groups.
Table V-20C
Cost of Collections Actions – Equitable
Treatment Group
Later Participant
Comparison Group
Nonparticipant
Comparison Group
Average
Comparison
Group
Change
Net
Change Pre Post Change Pre Post Change Pre Post Change
Number of
Customers 1,926 769 7,007 7,776
Letters $0.01 $0.12 $0.11**
$0.01 $0.15 $0.15**
$0.05 $0.04 -$0.02**
$0.07 $0.04**
Calls <$0.01 $0.02 $0.01**
<$0.01 $0.01 $0.01**
<$0.01 <$0.01 >-$0.01**
<$0.01 $0.01**
Termination
Processing Step
– With Cost
$0.03 $0.50 $0.47**
$0.08 $0.42 $0.34 $0.32 $0.16 -$0.17**
$0.08 $0.38*
Terminations $0.84 $7.16 $6.33**
$0.25 $7.80 $7.54**
$1.95 $1.62 -$0.33#
$3.61 $2.72**
Total Cost $0.88 $7.80 $6.91**
$0.34 $8.38 $8.04**
$2.33 $1.82 -$0.51**
$3.76 $3.15**
**Denotes significance at the 99 percent level. *Denotes significance at the 95 percent level. #Denotes significance at the 90 percent level.

www.appriseinc.org Transactions Analysis
APPRISE Incorporated Page 86
G. Summary This section provided an analysis of Peoples’ CAP impacts on affordability, bill payment
compliance, and collections actions. Key findings from the analysis are summarized below.
CAP Participation: 82 percent of the treatment group who enrolled in 2015 and did not
participate in CAP in the year prior to enrollment remained on CAP for at least a full
year. While 92 percent of the Peoples treatment group participated in CAP for the full
year, 74 percent of the Equitable treatment group participated in CAP for the full year.
CAP Credits: All 2015 participants received an average of 4.6 credits and $467, and full
year participants received an average of 5.3 credits and $541. While ten percent of all
2015 participants received $1,000 or more in CAP credits, 12 percent of the full year
participants received $1,000 or more in CAP credits.
The treatment group analysis focuses on credits received in the year after the 2015
enrollment. Therefore, most of these customers are receiving credits for winter 2016, the
2nd warmest year on record in Pittsburgh according to the National Oceanic and
Atmospheric Administration (NOAA)4. As a result, the 2015 treatment group has
average CAP credits that are significant lower than all 2015 participants whose data
includes winter 2015 when the weather was much colder than average. The treatment
group received an average of 3.9 credits and $194, and full year participants received an
average of 4.2 credits and $205. Only one percent received $1,000 or more in CAP
credits.
Monthly CAP Credit Receipt: Approximately 28 to 40 percent of the treatment group had
a CAP credit each month in the year following CAP enrollment.
CAP Discount: The CAP discount is defined as the CAP credits divided by the
customer’s full bill. The mean discount across the full treatment group was 22 percent.
Customers with income below 50 percent of the poverty level had the greatest percent
discount, averaging 40 percent, and ten percent of these customers had a discount above
67 percent.
Calculated CAP Payment: The CAP payment is calculated as eight, nine, or ten percent
of income, depending on the poverty level. These values are consistent with the PUC’s
energy burden targets for CAP participants. For example, for customers with income
between 101 and 150 percent of the poverty level, the energy burden target is nine to ten
percent and Peoples percent of income payment is ten percent.
Minimum CAP Payment: A large percentage of CAP participants have the minimum
payment of $25/month, especially in the lowest poverty group. While 71 percent of all
2015 participants with income below 50 percent of the poverty level have the minimum
payment, 44 percent of all 2015 participants from zero to 150 percent of poverty have the
minimum payment.
4 https://www.ncdc.noaa.gov/sotc/national/2016/13/supplemental/page-1
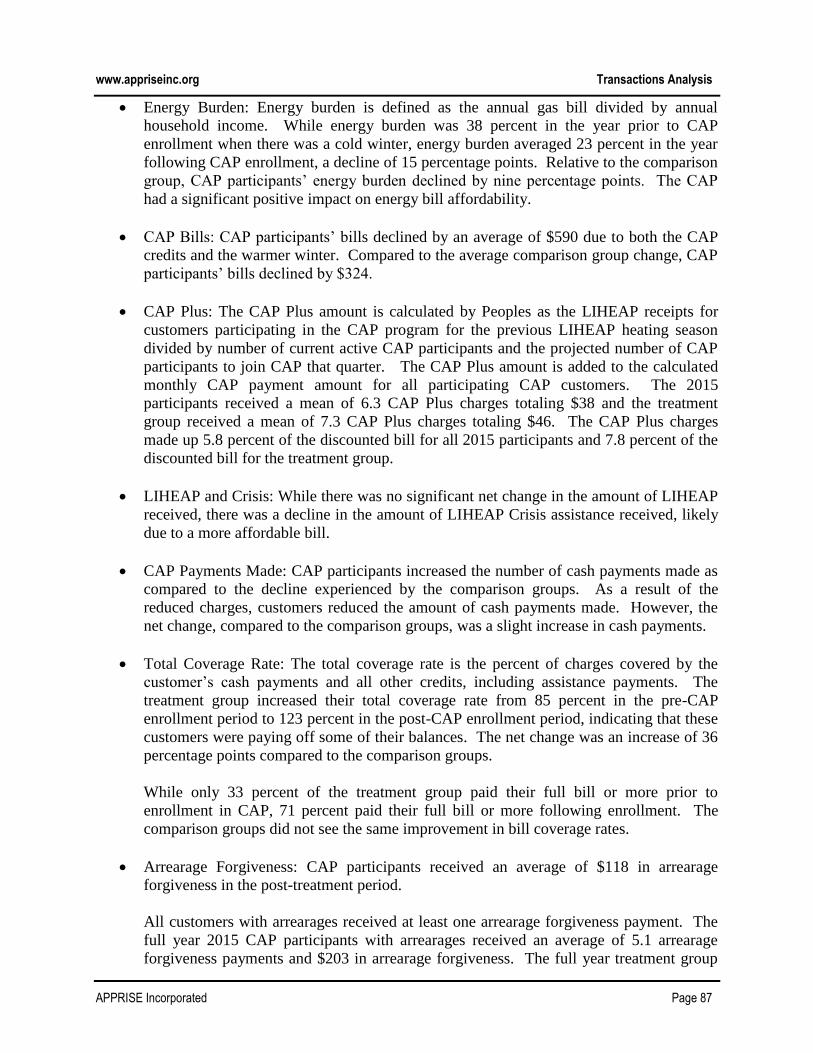
www.appriseinc.org Transactions Analysis
APPRISE Incorporated Page 87
Energy Burden: Energy burden is defined as the annual gas bill divided by annual
household income. While energy burden was 38 percent in the year prior to CAP
enrollment when there was a cold winter, energy burden averaged 23 percent in the year
following CAP enrollment, a decline of 15 percentage points. Relative to the comparison
group, CAP participants’ energy burden declined by nine percentage points. The CAP
had a significant positive impact on energy bill affordability.
CAP Bills: CAP participants’ bills declined by an average of $590 due to both the CAP
credits and the warmer winter. Compared to the average comparison group change, CAP
participants’ bills declined by $324.
CAP Plus: The CAP Plus amount is calculated by Peoples as the LIHEAP receipts for
customers participating in the CAP program for the previous LIHEAP heating season
divided by number of current active CAP participants and the projected number of CAP
participants to join CAP that quarter. The CAP Plus amount is added to the calculated
monthly CAP payment amount for all participating CAP customers. The 2015
participants received a mean of 6.3 CAP Plus charges totaling $38 and the treatment
group received a mean of 7.3 CAP Plus charges totaling $46. The CAP Plus charges
made up 5.8 percent of the discounted bill for all 2015 participants and 7.8 percent of the
discounted bill for the treatment group.
LIHEAP and Crisis: While there was no significant net change in the amount of LIHEAP
received, there was a decline in the amount of LIHEAP Crisis assistance received, likely
due to a more affordable bill.
CAP Payments Made: CAP participants increased the number of cash payments made as
compared to the decline experienced by the comparison groups. As a result of the
reduced charges, customers reduced the amount of cash payments made. However, the
net change, compared to the comparison groups, was a slight increase in cash payments.
Total Coverage Rate: The total coverage rate is the percent of charges covered by the
customer’s cash payments and all other credits, including assistance payments. The
treatment group increased their total coverage rate from 85 percent in the pre-CAP
enrollment period to 123 percent in the post-CAP enrollment period, indicating that these
customers were paying off some of their balances. The net change was an increase of 36
percentage points compared to the comparison groups.
While only 33 percent of the treatment group paid their full bill or more prior to
enrollment in CAP, 71 percent paid their full bill or more following enrollment. The
comparison groups did not see the same improvement in bill coverage rates.
Arrearage Forgiveness: CAP participants received an average of $118 in arrearage
forgiveness in the post-treatment period.
All customers with arrearages received at least one arrearage forgiveness payment. The
full year 2015 CAP participants with arrearages received an average of 5.1 arrearage
forgiveness payments and $203 in arrearage forgiveness. The full year treatment group

www.appriseinc.org Transactions Analysis
APPRISE Incorporated Page 88
with arrearages received an average of 5.2 arrearage forgiveness payments and $176 in
arrearage forgiveness.
Collections Actions: There was a small, statistically significant reduction in the number
of collection calls for the treatment group as compared to the comparison groups. There
was a significant decline in the number of letters, calls, and terminations for the Peoples
treatment group as compared to the comparison groups. There was a significant increase
in the number of letters, calls, and terminations for the Equitable treatment group as
compared to the comparison groups.
Collections Costs: There was a significant decline in the cost of collections of $6.52 for
the Peoples treatment group as compared to the comparison groups. There was an
increase in the cost of collections for the Equitable treatment group of $3.15 as compared
to the comparison groups.

www.appriseinc.org Summary of Findings and Recommendations
APPRISE Incorporated Page 89
VI. Summary of Findings and Recommendations
This section provides responses to the evaluation questions and key findings and
recommendations for each program.
A. Evaluation Questions The Evaluation of Peoples Natural Gas’ Universal Service Programs answered the following
research questions.
1. Is the appropriate population being served? Does the enrollment level meet the needs in
the service territory? Are the participants eligible for the programs as defined in the
Universal Service Plan? Is re-certification completed according to the Universal Service
Plan?
The evaluation analyzed the number of households with gas heating service who were
income-eligible for CAP and calculated the number who participated in Peoples CAP at
any point in 2015. The table below shows that 44 percent of eligible households
participated in CAP in 2015 and that participation rates were about 60 percent for
households with income below the poverty level.
Poverty Group
2015 Data
Eligible
(American
Community
Survey)
CAP
Participants
Participation
Rate
≤ 50% 16,565 9,471 57%
51% – 100% 26,668 17,120 64%
101% – 150% 39,193 9,835 25%
Total 82,426 36,426 44%
In addition to serving income-eligible households, the program serves a high percentage
of households with vulnerable members. The analysis showed that 27 percent of the
2015 participants had a senior in the home and 46 percent had a child.
Re-certification is conducted according to the program plan. CAP recertification is
generally completed on an annual basis. Customers who have received LIHEAP in the
past 24 months or who have certain fixed income types (pension, social security, or
disability) are recertified once every two years. DEF sends customers a letter 60 days
prior to their recertification date requesting that the customer submit proof of income to
remain active in the CAP program. A second letter is mailed 30 days later. If the
customer does not provide the required income documentation within the 60-day period,
the customer is dismissed from CAP.

www.appriseinc.org Summary of Findings and Recommendations
APPRISE Incorporated Page 90
2. What is the customer distribution by CAP payment plan? Do participants’ energy
burdens comply with the CAP Policy Statement? How many and what percent of
customers have a minimum payment?
The table below shows that 26 percent of the 2015 CAP participants had income at or
below 50 percent of the poverty level, 47 percent had income between 51 and 100
percent, and 27 percent had income between 101 and 150 percent of the poverty level.
The associated payment levels of eight, nine, and ten percent of income payments are in
accordance with the CAP Policy Statement. Forty-four percent of all 2015 participants
had the minimum payment of $25 per month.
Poverty Level
Percent of
All 2015
Participants
Percent of
Income
Payment
PUC Energy
Burden
Target
All 2015 Participants Treatment Group
Mean
Payment
% with
Minimum
Payment
Mean
Payment
% with
Minimum
Payment
≤50% 26% 8% 5%-8% $32 71% $34 68%
51%-100% 47% 9% 7%-10% $43 47% $47 46%
101%-150% 27% 10% 9%-10% $77 14% $77 16%
All 100% $50 44% $56 39%
While the CAP payment is designed to provide an energy burden that falls within the
PUC targeted affordability level, there are several reasons why an individual CAP
participant’s energy burden would be higher than this calculated target.
Minimum payment: As shown above, a large percentage of CAP participants have
the minimum payment level assigned. By definition, these customers will have an
energy burden that exceeds the percentage of income payment level.
Full year: Customers who are not on CAP for the full year will not receive all CAP
credits.
Did not receive all credits: Historically, customers who did not make timely payments
did not receive all CAP credits. The credit application policy has changed so that
currently customers do receive a credit each month they are on CAP.
Arrearage forgiveness co-payment: Customers with arrearages pay $5 per month to
reduce the arrearage while they are receiving arrearage forgiveness. This increases
the monthly payment above the targeted percentage of income payment level.
CAP Plus co-payment: All CAP participants have a CAP Plus co-payment which
increases the monthly payment above the targeted percentage of income payment
level.

www.appriseinc.org Summary of Findings and Recommendations
APPRISE Incorporated Page 91
The table below shows the energy burden for the treatment group before and after
participating in CAP. The table shows a large reduction in average burden from 59
percent before participation to 35 percent while participating for customers with income
below 50 percent of the poverty level. However, given the reasons noted above, a large
percentage of these customers still have an energy burden that exceeds the PUC target.
Poverty
Level
Treatment Group
Mean Unadjusted
Gas Energy Burden
PUC
Energy
Burden
Target
Poverty
Level
Treatment Group
Percent with
Burden Above
PUC Target
Pre Post Pre Post
≤ 50% 59% 35% 5%-8% ≤ 50% 96% 85%
51 – 100% 41% 25% 7%-10% 51 – 100% 86% 71%
101 – 150% 24% 15% 9%-10% 101 – 150% 71% 48%
The table below shows the impact that some of these factors have on energy burden.
This table excludes customers with the minimum payment, excludes customers who did
not participate in CAP for the full year, and excludes the arrearage forgiveness co-pay
and the CAP Plus amount. When all of these adjustments are made, only ten percent of
those with income below 50 percent of the poverty level have an energy burden above the
target level.
Poverty
Level
Treatment Group
Mean Adjusted Gas
Energy Burden
PUC
Energy
Burden
Target
Poverty
Level
Treatment Group
Percent with
Burden Above
PUC Target
Pre Post Pre Post
≤ 50% 20% 3% 5%-8% ≤ 50% 88% 10%
51 – 100% 18% 7% 7%-10% 51 – 100% 73% 21%
101 – 150% 16% 7% 9%-10% 101 – 150% 64% 21%
3. What are the CAP retention rates? Why do customers leave CAP?
The table below shows that 61 percent of the 2015 participants had enrolled on or before
January 1, 2015 and had not been deactivated prior to January 1, 2016. Twenty percent
did not participate for all of 2015 because they enrolled after January 2015, nine percent
enrolled in January 2015 but were removed before December 2015, and ten percent
enrolled after January 2015 and were removed before December 2015.
All 2015 CAP Participants
# %
Final Analysis Group 28,265 100%
Full Year in CAP 17,130 61%

www.appriseinc.org Summary of Findings and Recommendations
APPRISE Incorporated Page 92
All 2015 CAP Participants
# %
Not Full Year in CAP 11,135 39%
Enrolled after January 5,693 20%
Removed before
December 2,656 9%
Enrolled after Jan and
removed before Dec 2,786 10%
The table below displays the CAP removal reason for customers in each group who were
deactivated. The table shows that the most common removal reason was that the
customer did not provide documentation.
All 2015 CAP Participants
# %
Did Not Provide Documentation 3,820 70%
Income Too High 727 13%
Customer Request 294 5%
Final Bill or Disconnected 223 4%
System Error Correction 177 3%
Set up in Error 167 3%
Annual Credit Exceeds $1,000 34 1%
Usage Exceeds 125% 0 0%
Total 5,442 100%
4. Is there an effective link between CAP and energy assistance programs (LIHEAP,
hardship, and other grants)?
There is an effective link between CAP and energy assistance programs. Peoples
encourages customers to apply for LIHEAP with bill inserts, posters, outreach,
community events, and application assistance. If requested, Peoples will hand write the
LIHEAP application for the customer and mail it to the customer to be signed and
submitted. Dollar Energy asks customers if they applied for LIHEAP/Crisis if they are
eligible. Customers must apply for LIHEAP/Crisis prior to receiving the Dollar Energy
grant.
The table below shows that 38 percent of the CAP treatment group received LIHEAP in
the year before CAP enrollment and 42 percent received LIHEAP in the year following
CAP enrollment.
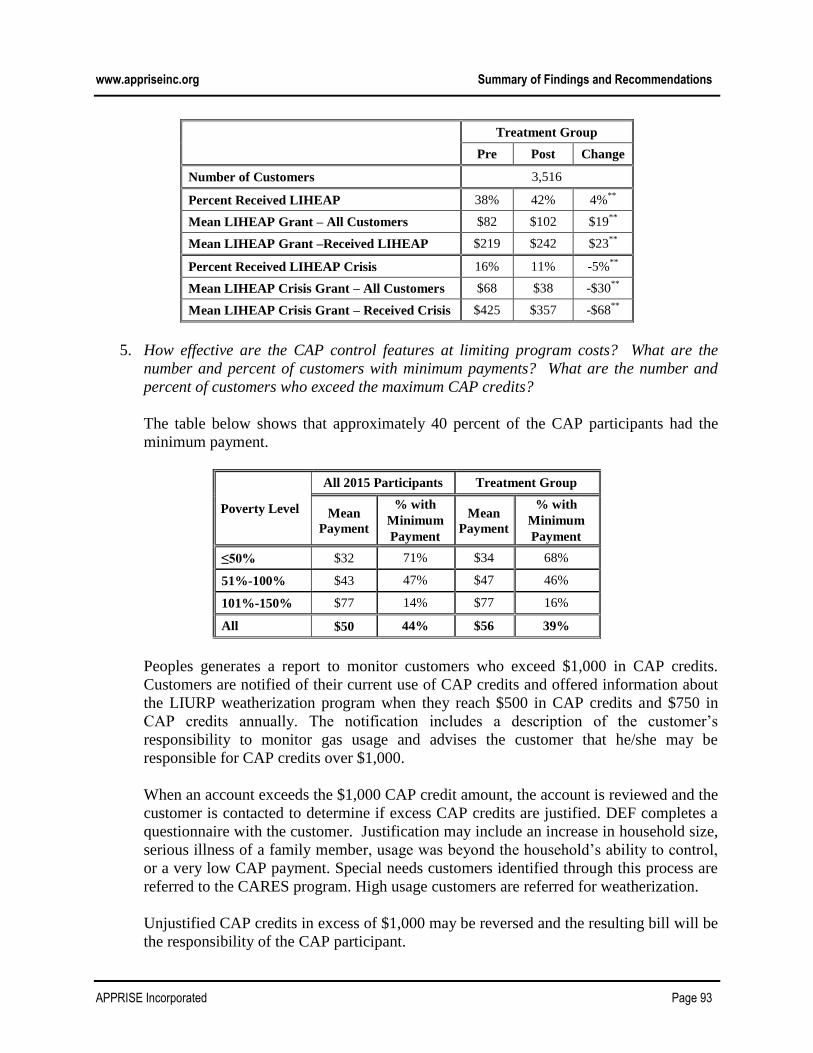
www.appriseinc.org Summary of Findings and Recommendations
APPRISE Incorporated Page 93
Treatment Group
Pre Post Change
Number of Customers 3,516
Percent Received LIHEAP 38% 42% 4%**
Mean LIHEAP Grant – All Customers $82 $102 $19**
Mean LIHEAP Grant –Received LIHEAP $219 $242 $23**
Percent Received LIHEAP Crisis 16% 11% -5%**
Mean LIHEAP Crisis Grant – All Customers $68 $38 -$30**
Mean LIHEAP Crisis Grant – Received Crisis $425 $357 -$68**
5. How effective are the CAP control features at limiting program costs? What are the
number and percent of customers with minimum payments? What are the number and
percent of customers who exceed the maximum CAP credits?
The table below shows that approximately 40 percent of the CAP participants had the
minimum payment.
Poverty Level
All 2015 Participants Treatment Group
Mean
Payment
% with
Minimum
Payment
Mean
Payment
% with
Minimum
Payment
≤50% $32 71% $34 68%
51%-100% $43 47% $47 46%
101%-150% $77 14% $77 16%
All $50 44% $56 39%
Peoples generates a report to monitor customers who exceed $1,000 in CAP credits.
Customers are notified of their current use of CAP credits and offered information about
the LIURP weatherization program when they reach $500 in CAP credits and $750 in
CAP credits annually. The notification includes a description of the customer’s
responsibility to monitor gas usage and advises the customer that he/she may be
responsible for CAP credits over $1,000.
When an account exceeds the $1,000 CAP credit amount, the account is reviewed and the
customer is contacted to determine if excess CAP credits are justified. DEF completes a
questionnaire with the customer. Justification may include an increase in household size,
serious illness of a family member, usage was beyond the household’s ability to control,
or a very low CAP payment. Special needs customers identified through this process are
referred to the CARES program. High usage customers are referred for weatherization.
Unjustified CAP credits in excess of $1,000 may be reversed and the resulting bill will be
the responsibility of the CAP participant.

www.appriseinc.org Summary of Findings and Recommendations
APPRISE Incorporated Page 94
The table below shows that only ten percent of the 2015 participants and one percent of
the treatment group had $1,000 or more in CAP credits.
Obs.
Mean
# CAP
Credits
Mean
Credits
Median
Credits
Received
$1,000 or
More CAP
Credits
Credits Received in 2015
All 2015 Participants (0-150%)
All 28,265 4.6 $467 $378 10%
Full Year CAP 17,130 5.3 $541 $452 12%
Credits Received in Year after Enrollment
Treatment Group
All 3,519 3.9 $194 $125 1%
Full Year CAP 2,893 4.2 $205 $131 1%
6. How effective is the CAP and LIURP link? Is the company’s procedure for dealing with
excessively high usage effective? If not, how can it be improved?
At the time of CAP enrollment, participants receive information on conservation tips and
weatherization programs. Customers with a history of high energy usage are referred to
LIURP and any other appropriate programs. All participants are advised that their usage
will be reviewed on an ongoing basis and unjustified excess CAP usage may be billed to
the CAP customer or the CAP customer may be removed from CAP.
Peoples generates a daily report that allows the Company to identify CAP customers
whose weather-normalized annual usage has increased by more than 25 percent. When a
CAP customer’s account appears in the report, the Company representative reviews the
account and the customer is contacted to determine if the increase in gas usage is justified
due to an increase in household size, serious illness of a family member, or usage was
beyond the household’s ability to control. Peoples has a questionnaire they provided to
DEF to use when discussing usage with the customer. The majority of the cases
reviewed meet one of these justified reasons for an increase in usage.
Number of people living in the home increased
Medical condition in the home
New gas appliances installed
Furnace condition
Window condition
Attic insulation condition
Home drafts
Whether home has been weatherized
Other reasons
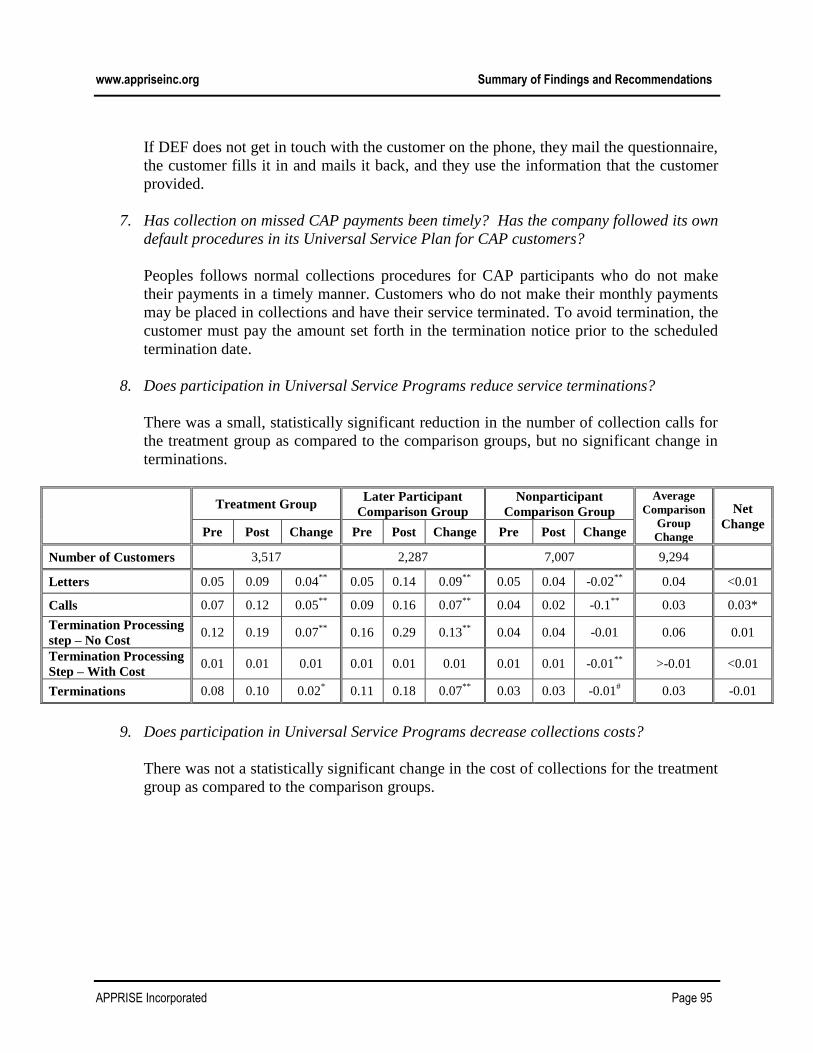
www.appriseinc.org Summary of Findings and Recommendations
APPRISE Incorporated Page 95
If DEF does not get in touch with the customer on the phone, they mail the questionnaire,
the customer fills it in and mails it back, and they use the information that the customer
provided.
7. Has collection on missed CAP payments been timely? Has the company followed its own
default procedures in its Universal Service Plan for CAP customers?
Peoples follows normal collections procedures for CAP participants who do not make
their payments in a timely manner. Customers who do not make their monthly payments
may be placed in collections and have their service terminated. To avoid termination, the
customer must pay the amount set forth in the termination notice prior to the scheduled
termination date.
8. Does participation in Universal Service Programs reduce service terminations?
There was a small, statistically significant reduction in the number of collection calls for
the treatment group as compared to the comparison groups, but no significant change in
terminations.
Treatment Group
Later Participant
Comparison Group
Nonparticipant
Comparison Group
Average
Comparison
Group
Change
Net
Change Pre Post Change Pre Post Change Pre Post Change
Number of Customers 3,517 2,287 7,007 9,294
Letters 0.05 0.09 0.04**
0.05 0.14 0.09**
0.05 0.04 -0.02**
0.04 <0.01
Calls 0.07 0.12 0.05**
0.09 0.16 0.07**
0.04 0.02 -0.1**
0.03 0.03*
Termination Processing
step – No Cost 0.12 0.19 0.07
** 0.16 0.29 0.13
** 0.04 0.04 -0.01 0.06 0.01
Termination Processing
Step – With Cost 0.01 0.01 0.01 0.01 0.01 0.01 0.01 0.01 -0.01
** >-0.01 <0.01
Terminations 0.08 0.10 0.02*
0.11 0.18 0.07**
0.03 0.03 -0.01#
0.03 -0.01
9. Does participation in Universal Service Programs decrease collections costs?
There was not a statistically significant change in the cost of collections for the treatment
group as compared to the comparison groups.

www.appriseinc.org Summary of Findings and Recommendations
APPRISE Incorporated Page 96
Table VI-2A
Cost of Collections Actions
Treatment Group
Later Participant
Comparison Group
Nonparticipant
Comparison Group
Average
Comparison
Group
Change
Net
Change Pre Post Change Pre Post Change Pre Post Change
Number of
Customers 3,517 2,287 7,007 9,294
Letters $0.05 $0.09 $0.04**
$0.05 $0.14 $0.09**
$0.05 $0.04 -$0.02**
$0.04 $0.01
Calls $0.01 $0.01 $0.01**
$0.01 $0.02 0.01**
$0.01 $0.01 -$0.01**
$0.01 $0.01*
Termination
Processing Step $0.27 $0.42 $0.15 $0.54 $0.62 $0.08 $0.32 $0.16 -$0.17
** -$0.04 $0.19
Terminations $5.46 $6.71 $1.25*
$6.99 $11.61 $4.62**
$1.95 $1.62 -$0.33#
$2.15 -$0.90
Total Cost $5.79 $7.23 $1.44**
$7.59 $12.39 $4.80**
$2.33 $1.82 -$0.51**
$2.14 -$0.71
10. Is the CAP program cost-effective?
The CAP provides large subsidies to participants, averaging several hundred dollars each
year, to improve the affordability of their energy bills. Given the size of these subsidies,
it is not possible for the program to be cost-effective, defined as a subsidy cost that is less
than the amount saved on collections costs and termination costs. However, there is
evidence that the program provides important benefits to participants to improve their
health and well-being, many of which cannot be quantified.
11. How can Universal Service Programs be more cost-effective and efficient?
Based on the evaluation research, we have the following recommendations to improve
the effectiveness and efficiency of the Universal Service Programs.
CAP
Enrollment: Peoples should consider whether there are cases where agency
enrollment (rather than telephone enrollment) may provide important benefits to the
customer such as quicker enrollment or more education and referrals, and should be
recommended.
Re-certification: It may be beneficial for Peoples to suggest that certain customers
visit an agency to recertify to obtain a better understanding of the program, the
importance of making the monthly CAP payment, and additional resources that may
be available to assist them in meeting their needs.
CAP Bill: Peoples could add information on the amount of arrearage forgiveness that
will be received when they pay their bill to make this even more apparent.

www.appriseinc.org Summary of Findings and Recommendations
APPRISE Incorporated Page 97
CAP Plus: The CAP Plus adder impacts energy burden and affordability. Peoples
should continue to monitor this adder and assess how increases impact affordability,
especially for the lowest-income customers.
LIURP
Targeting: Peoples should consider whether they want to make additional efforts to
serve the highest of the high users or the customers who are most payment-troubled.
They could target a subset of their high-usage list for additional LIURP outreach to
encourage participation.
Measures: Peoples should assess whether there are opportunities to reduce the
number of heating system replacements and increase the emphasis on air sealing and
insulation.
Coordination: Peoples should continue to work with the electric companies, as
planned, to try to increase coordination, thus providing improved energy efficiency
through a holistic approach.
12. Is the program sufficiently funded?
The CAP budget as planned in Peoples’ three-year Universal Services Plan was lower
than the actual program costs. Over 230 percent of the planned budget was spent. The
planned budget was based on natural gas rates at the time and approximate enrollment.
In addition to changes in rates and enrollment, there are changes in vendor administration
costs and payment behavior that impact the amount of arrearage forgiveness benefits.
The transition from CAP credit application upon payment to CAP credit application upon
billing resulted in a significant one-time increase in CAP costs.
2015
Company Budget Expenditures Percent of
Budget Spent
Peoples $5,583,793 $12,607,004 226%
Equitable $3,606,966 $8,614,710 239%
Total $9,190,759 $21,221,714 231%
B. Customer Assistance Program Peoples has worked to make CAP as easy as possible for the customer to participate and
remain enrolled. We have the following key findings and recommendations with respect to
CAP.
1. Phone and Agency Enrollment

www.appriseinc.org Summary of Findings and Recommendations
APPRISE Incorporated Page 98
Most customers enroll in CAP over the telephone by calling DEF. Customers who have
received LIHEAP in the past two years or are participating in an electric CAP and
provide permission for that income verification to be used are not required to document
their income. Customers who have not recently verified their income in one of these
ways are required to mail or fax proof of income and are enrolled in CAP following
receipt and approval of that documentation.
Customers appear to appreciate the convenience of CAP telephone enrollment. Most
respondents to the CAP survey reported that the enrollment and the recertification
process were very or somewhat easy. The few customers who stated that enrollment was
somewhat or very difficult stated that it was difficult to find the time to visit the agency.
Very few customers visit an agency to enroll in CAP. Agency enrollment was developed
mainly for those customers who were unable to enroll by phone. However, there may
be additional cases where agency enrollment may provide important benefits to the
customer and should be recommended.
Danger of Termination: The DEF call center noted that the greatest challenge with
CAP is obtaining information from customers to prove their income level. They ask
customers to send their last two pay stubs and proof of employment, but customers do
not always follow through. There are times when DEF only receives partial income
even though they have sent letters and made several attempts to contact the customer.
This is especially a challenge in termination season when the customer has a
termination notice and receiving the information in time is a challenge. In these cases,
Peoples should consider instructing DEF to recommend that the customer visit an
agency to apply for CAP.
Challenged Customers: Agencies have been trained to screen customers for CAP if
customers visit the agency to apply for the DEF hardship fund. When the agency
screens for DEF, they can also screen for CAP and provide the CAP enrollment. This
is a beneficial service for such customers who have had serious problems making
their gas bill payments.
At the time of CAP enrollment, customers are given a handout with energy
conservation tips and a copy of the CAP customer agreement so they know how to be
successful in CAP. Peoples has noted that they would like to provide more education
at enrollment and ensure that they are doing a good job of explaining the CAP
benefits. They want to emphasize the benefit of making the monthly payment,
remaining on CAP, and receiving arrearage forgiveness. These benefits may be
clarified if the customer meets with an agency caseworker in person. Such
enrollment may be especially beneficial for customers who continue to struggle with
their CAP payments, are re-enrolling in CAP following a termination, or express a
need for additional assistance and referrals.
2. Income Verification

www.appriseinc.org Summary of Findings and Recommendations
APPRISE Incorporated Page 99
Peoples has reported that they are working to make it even easier for customers to
provide income documentation, by creating additional mechanisms for customers to
submit the information. Currently, customers can only mail or fax in the documentation,
which requires a trip to the post office or library. DEF is working with a vendor to
provide a method to allow customers to upload documents from a smart phone. This
should provide benefits to customers who use this technology and an additional avenue to
quickly enroll if they are facing a termination.
3. Recertification
As with enrollment, customers appear to appreciate the ability to recertify by mailing in
their documentation rather than visiting an agency. Most respondents reported that the
recertification process was very or somewhat easy. Peoples is working to understand
how to make the recertification process more informative for customers. It may be
beneficial for Peoples to suggest that certain customers visit an agency to recertify to
obtain a better understanding of the program, the importance of making the monthly CAP
payment, and additional resources that may be available to assist them in meeting their
needs.
4. CAP Bill
Peoples has designed a CAP bill that provides a clear presentation of the monthly CAP
payment, the five dollar contribution for arrearages, and the CAP credit as the difference
between actual usage and the CAP payment. The bill also shows the pre-CAP balance
and customers who pay their bill will continue to see this amount decline as they receive
arrearage forgiveness. The CAP survey shows that the bill does a good job of providing
this information. While 97 percent said that the CAP bills shows the CAP payment in a
way that is clear and easy to locate and understand, 91 percent said it showed the CAP
credit benefit in a way that is clear and easy to locate and understand, and 84 percent said
that it showed the arrearage forgiveness amount in a way that is clear and easy to locate
and understand. Peoples could add information on the amount of arrearage forgiveness
that will be received when they pay their bill to make this even more apparent.
5. CAP Plus
The CAP Plus adder impacts energy burden and affordability. Peoples should continue to
monitor this adder and assess how increases impact affordability, especially for the
lowest-income customers.
6. Affordability
The CAP survey and the transactions data analysis clearly showed that the program has
improved affordability for participants.
CAP survey respondents were much less likely to state that their CAP bills were
difficult to pay after enrollment in CAP. While 58 percent said it was very difficult to
pay the monthly gas bill prior to CAP enrollment, only five percent said it was very
difficult to pay the bill following enrollment.

www.appriseinc.org Summary of Findings and Recommendations
APPRISE Incorporated Page 100
CAP survey respondents were less likely to report that they had to delay the
expenditure or skip paying the bill following enrollment in CAP. While 60 percent
said they had to skip paying for food prior to CAP enrollment, 24 percent said they
did so following CAP enrollment. Large declines in difficulty paying bills were also
reported for the telephone, medical or dental, mortgage or rent, and credit card or
loans.
Relative to the comparison group, CAP participants’ energy burden declined by nine
percentage points.
CAP participants’ bills declined by an average of $590 due to both the CAP credits
and the warmer winter. Compared to the average comparison group change, CAP
participants’ bills declined by $324.
There was a decline in the amount of LIHEAP Crisis assistance received, likely due
to a more affordable bill.
7. Bill Payment
CAP also had a positive impact on bill payment.
CAP participants increased the number of cash payments made as compared to the
decline experienced by the comparison groups.
The total coverage rate is the percent of charges covered by the customer’s cash
payments and all other credits, including assistance payments. The treatment group
increased their total coverage rate from 85 percent in the pre-CAP enrollment period
to 123 percent in the post-CAP enrollment period, indicating that these customers
were paying off some of their balances. The net change was an increase of 36
percentage points compared to the comparison groups.
While only 33 percent of the treatment group paid their full bill or more prior to
enrollment in CAP, 71 percent paid their full bill or more following enrollment. The
comparison groups did not see the same improvement in bill coverage rates.
8. CAP Satisfaction
Customers reported that CAP was very important in helping them to meet their needs and
their satisfaction was high.
When asked how important CAP had been in helping them meet their needs, 92
percent said it was very important and five percent said it was somewhat important.
When asked about satisfaction with CAP, 93 percent said they were very satisfied and
six percent said they were somewhat satisfied.

www.appriseinc.org Summary of Findings and Recommendations
APPRISE Incorporated Page 101
C. Hardship Fund The following key findings and recommendations were made with respect to the Hardship
Fund.
1. DEF Partnership
Peoples has developed a good partnership with DEF to deliver Hardship Fund grants.
There are over 150 local organizations that participate and some organizations may have
multiple locations, so there are several hundred physical locations where customers can
apply. The agencies that process the grant applications refer eligible customers to CAP,
LIURP and CARES.
2. Customer Communication
DEF continues to work to improve the process for the customer. They are working to
enhance their phone system to enable customers to use text messaging in place of
speaking with a representative. This would help lower income customers whose cell
phone plan includes only a certain amount of calling, but has unlimited texting.
D. CARES The following key findings and recommendations were made with respect to CARES.
1. Benefits
CARES provides important benefits to special needs customers, including education
about the Earned Income Tax Credit and LIHEAP, thermostats for visually-impaired
customers, and short-term assistance to ensure that customers are able to access the
resources that they are referred to. The program referrals include Peoples’ Universal
Service Programs, available energy assistance sources, and public assistance such as
Supplemental Nutrition Assistance Program (“SNAP”), and Medicaid. CARES
customers receive substantial financial assistance from social service agencies including
Catholic Charities, the Salvation Army, and St. Vincent de Paul Society, in addition to
traditional energy assistance programs.
2. Employee Education
Peoples has leveraged CARES to educate employees about special needs customers,
increase the sensitivity of their employees, and increase customer referrals.
E. LIURP The following key findings and recommendations were made with respect to LIURP.
1. Energy Education
Peoples has developed an extensive education program for their LIURP participants.
They implemented a Pledge Form to involve the customers with the contractor. The
Pledge Form helps the LIURP participants understand that the purpose of the program is
energy conservation and to understand the measures that were installed in their home.
There is also an Action Plan form that lists the actions that the customer committed to
take to further reduce gas usage.

www.appriseinc.org Summary of Findings and Recommendations
APPRISE Incorporated Page 102
Peoples contracts with energy consultants who perform random inspections on about 25
percent of the completed jobs. The consultants provide additional energy education to
the customers about the work completed and additional actions the customers can take to
save energy.
2. Energy Savings
Peoples has achieved high savings from LIURP, averaging about 20 percent of the
customers’ pre-treatment natural gas usage. However, given the high level of pre-
treatment usage, and the investment level, Peoples should consider whether it may be
possible to achieve even higher savings through targeting and the efficiency services that
are provided.
3. Targeting
Once each year Peoples puts together a referral list of income-eligible customers who
have not received weatherization in the last seven years. CCI sends mailings to customers
on Peoples contact list with an instruction letter and application form. Generally the
response rate to the mailing is about 15 to 20 percent. In December 2016 CCI mailed
2,000 letters with the goal of serving about 400 customers in 2017.
Peoples should consider whether they want to make additional efforts to serve the highest
of the high users or the customers who are most payment-troubled. They could target a
subset of the list for additional outreach to encourage participation.
4. Energy Efficiency Measures
Peoples should assess whether there are opportunities to reduce the number of heating
system replacements and increase the emphasis on air sealing and insulation.
5. Coordination
Peoples Gas works to complete jobs that are combined with the PA Department of
Community and Economic Development Weatherization Program and with electric
companies. They completed 17 combined jobs in 2014, 23 combined jobs in 2013, and
33 combined jobs in 2012. Peoples should continue to work with the electric companies,
as planned, to try to increase coordination, thus providing improved energy efficiency
through a holistic approach.