Embed Size (px)
Citation preview

PERCEPTION OF CARD USERS TOWARDS
PLASTIC MONEY
This chapter analyses the perception of card holders towards plastic money in
India. The emphasis has been laid on the adoption, usage, value attributes, bottlenecks
and factors influencing plastic money adoption. The previous chapter surveyed the
current scenario on legal and regulatory frame work in India and it was found that
though more reforms have to be initiated. The current system is able to support the
smooth adoption and monitoring payments through plastic money. Also, it has been
indicated by the recent research that plastic money adoption is on the rise as there is an
increasing number of merchant establishments in India accepting majority of cards. The
current analysis has been divided into seven sections which include perceptional
analysis age-wise, occupation-wise, gender-wise, education wise, income-wise, analysis
of antecedents and spending pattern, and lastly analysis of perceived risk and utility.
5.1 Usage of Plastic Money
The objective of this question was to observe the type of plastic money used by
various respondents, so that the importance of a particular type of plastic money could
be judged. Whether the plastic money used has any relation with age, gender, income,
occupation, and educational level or not , the following analysis was done:
5.1.1 Usage of Plastic Money (Age –wise)
Age-wise, the card users have been considered vital in evaluating perception of
people at their different ages in relation to adoption of plastic money. Many researches
show that age is significantly related to the adoption of plastic money. This research has
sought to find out whether age-wise analysis brings out different perspectives from
other dimensions like gender wise, income wise, occupation-wise and education-wise.
Card users were asked to indicate the type of card they have used. Since the
other types of cards were not so popular during pilot study, only credit and debit cards
represent plastic money. Table 5.1.1 indicates the result of plastic money usage (Age-
wise) in India.

Perception of Card Holders towards Plastic Money
98
Table 5.1.1: Usage of Plastic Money (Age – wise)
Variable 18-30 years 31-45 years 46 years and above Total
Debit card 37
(50)
72
(33)
4
(5.4)
74
(25.34)
Credit card 72
(33)
108
(49.5)
38
(17.4)
218
(74.65)
Total 109
(37.3)
141
(48.3)
42
(14.4)
292
(100)
χχχχ2=10.09, df= 2 , t- value at 5% = 5.99
Note: Number in parenthesis show percentages
The table above shows that majority of users have credit cards (218 respondents)
while 74 respondents reported that they possess debit cards. The age-wise analysis
indicates that out of the total respondents with credit cards majority (49.5%) were
young middle aged (31-45 years) followed by younger users with less than 30 years.
The aged respondents (17.4%) indicated that they are using credit cards. This may be
perhaps due to lack of proper awareness or customer ignorance about change in
technology or may be they are cash conservatives. Further, the result shows that
majority (50%) of debit cards holders were less than 30 years of age, followed by the
young middle aged (44.6%), only 5% of aged people adopted debit card.
The chi-square value of responses from the age perspective on the usage of
plastic money is significant at 5 % level of significance. Hence, there is a strong
association between the age and utility derived from plastic money usage. Thus, age is
the important variable to enhance the usage of plastic money.
5.1.2 Usage of Plastic Money (Gender-wise)
Gender wise opinions reveal what exactly is existing between male and female
card users and what they perceive about plastic money. This section will try to analyse
the card users’ perception gender wise.
The result indicated that the majority of respondents (77.4%) were male and
female respondents comprised only 22.6 %.

Perception of Card Holders towards Plastic Money
99
Table 5.1.2 Usage of Plastic Money (Gender -wise)
Variable Male Female Total
Debit card 51
(68.9)
14
(31.1) 74
(25.34)
Credit card 175
(80.3)
43
(19.7) 218
(74.65)
Total 226
(77.4)
66
(22.6)
292
(100)
χχχχ2=4.07, df= 2, t-value at 5% = 5.99
Note: Number in parenthesis show percentages
Table 5.1.2 indicates that out of the respondents who indicated to have adopted
credit cards, 80.3% were male and only 19.7% were female. Also, 68.9% of debit card
adopters were male and 31.1% of the debit card adopters were females. This indicates
that male respondents use and adopt more plastic cards than their counterparts.
Chi-square value of responses from the gender perspective on the usage of
plastic money is insignificant at 5% level of significance. Hence, given the weak
association between gender and utility derived from plastic money usage, this variable
is independent in nature.
5.1.3 Usage of Plastic Money (Income wise)
From the income perspective, interesting result was also noticed. Table 5.1.3
revealed that out of all users surveyed, majority (54.5%) belong to the class of people
who earn a monthly income of Rs. 20,001-60,000, followed by the income class of upto
Rs. 20,000. Those who belong to a higher income class were only 2.7%. This can be
interpreted that the higher income class do not use plastic cards or did not reveal their
true range of monthly income. Further, the result shows that out of those who use debit
card, 44.6% belong to income of Rs. 20,001-60,000 while the minority were high class
earners above Rs. 100,000 per month. Also, 43.2% of the respondents who use debit
cards earns upto Rs. 20,000.
Table 5.1.3 Usage of plastic money (Income wise)
Variable Up to
Rs.20000
20001-60000 60001-
100000
Above
Rs.100000
Total
Debit card 32
(43.2)
33
(44.6)
8
(10.8)
1
(1.40) 74
(25.34)
Credit card 43
(19.7)
126
(57.8)
42
(19.3)
7
(3.2) 218
(74.65)
Total 75
(25.70)
159
(54.50)
50
(17.10)
8
(2.70)
292
(100)
χχχχ2=16.67, df= 3, t-value at 5% = 7.81
Note: Number in parenthesis show percentages
Perception of Card Holders towards Plastic Money
100
The respondents who indicated that they are using credit cards, majority of them
earn between Rs. 20,001-60,000 per month, followed by those who earn upto Rs.
20,000 and from Rs. 60,000 to Rs. 100,000 per month. Minority were the higher class
earners (above Rs. 100,000). This might be because norms for providing credit cards are
tough for small income earners. In many institutions, they prefer offering credit cards to
heavy pocketed clients than light pocketed clients. This tradition has hindered many
clients especially those who belong to small and medium income class. The result
indicates that higher class of income gainers prefer credit card to debit card. With the
increase in income level, the ratio of credit card to debit card is increasing. The chi-
square value of responses income-wise for the usage of plastic money is significant at
5% level of significance. Hence, plastic money is affected by the income level of
respondents.
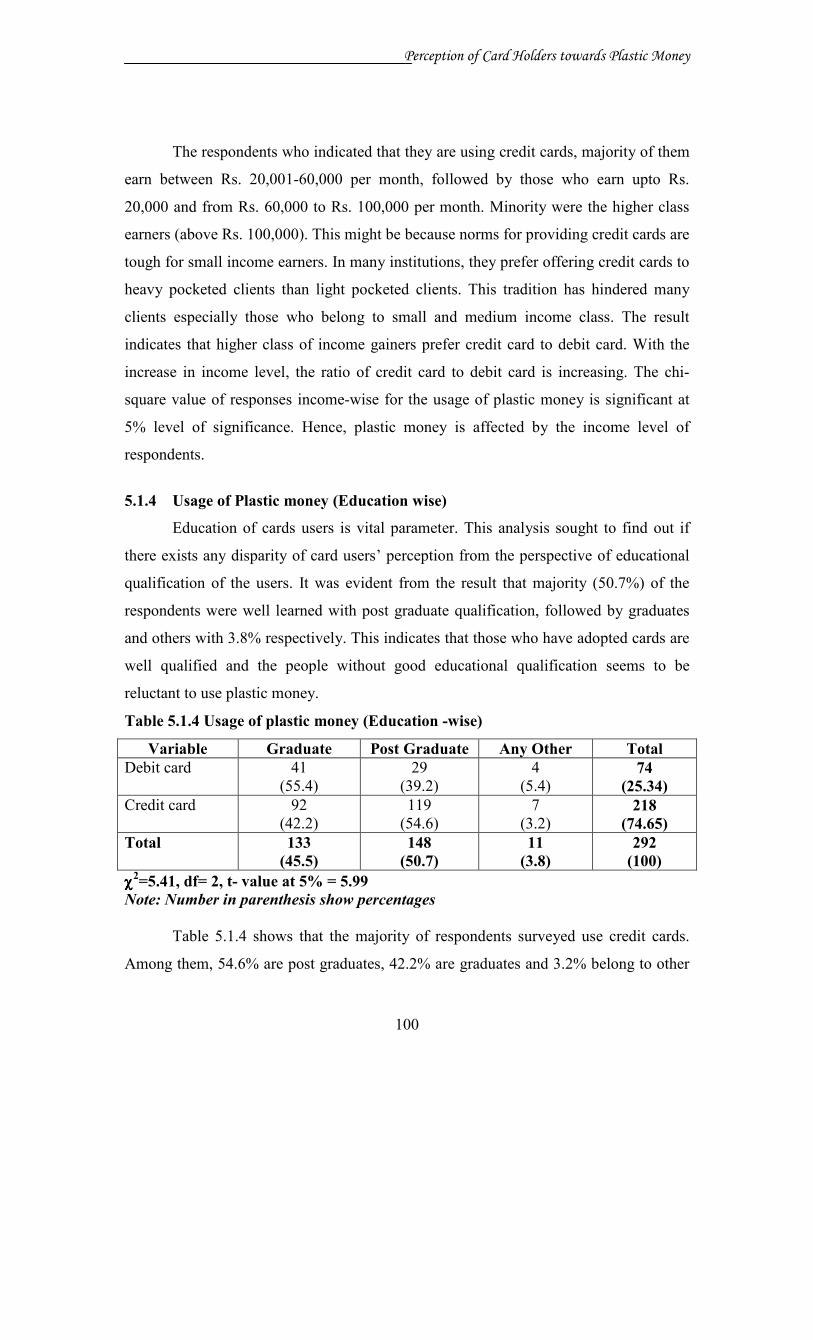
5.1.4 Usage of Plastic money (Education wise)
Education of cards users is vital parameter. This analysis sought to find out if
there exists any disparity of card users’ perception from the perspective of educational
qualification of the users. It was evident from the result that majority (50.7%) of the
respondents were well learned with post graduate qualification, followed by graduates
and others with 3.8% respectively. This indicates that those who have adopted cards are
well qualified and the people without good educational qualification seems to be
reluctant to use plastic money.
Table 5.1.4 Usage of plastic money (Education -wise)
Variable Graduate Post Graduate Any Other Total
Debit card 41
(55.4)
29
(39.2)
4
(5.4) 74
(25.34)
Credit card 92
(42.2)
119
(54.6)
7
(3.2) 218
(74.65)
Total 133
(45.5)
148
(50.7)
11
(3.8)
292
(100)
χχχχ2=5.41, df= 2, t- value at 5% = 5.99
Note: Number in parenthesis show percentages
Table 5.1.4 shows that the majority of respondents surveyed use credit cards.
Among them, 54.6% are post graduates, 42.2% are graduates and 3.2% belong to other

Perception of Card Holders towards Plastic Money
101
class. Also, among those who reported that they have adopted debit cards, 55.4% were
just graduates and 39.2% were post graduates. These results show that only those
people with good educational background sought to adopt more credit cards as
compared to debit cards. This may be easy for the highly qualified people to manage
their funds more wisely as compared to other groups. The chi-square value of
responses from the education perspective is insignificant at 5% level of significance. It
can be concluded that usage of plastic money is not affected by the educational
qualification of the respondents rather it is dependent upon some other variable.
5.1.5 Usage of Plastic money (Occupation- wise)
This section analyses the perceptions of plastic card users on the basis of their
occupation. This perspective reveals that majority of respondents, (61.3%) were
services class people, 23.6% were professionals and 15% were business people. This
indicates that mostly the service class people prefer using cards than business class
people.
Table 5.1.5 Usage of plastic money (occupation -wise)
Variable Business Service class Professional Total
Debit card 3
(4.1)
52
(70.3)
19
(25.7) 74
(25.34)
Credit card 41
(18.8)
127
(58.3)
50
(22.9) 218
(74.65)
Total 44
(15.1)
179
(61.3)
69
(23.6)
292
(100)
χχχχ2=9.46, df= 2, t- value at 5% =5.99
Note: Number in parenthesis show percentages
Table 5.1.5 indicates that majority (74.65%) of the respondents have credit
cards. Out of them, 58.3% were service people, 22.9% were professional and 18.8%
were business people. Among those who were debit card holders, 70.3% were
servicemen, 25.7% professional and 4.1% business people. This shows that service
class people are in majority of card users, followed by professionals. Businessmen don’t
prefer using cards in payments. Chi-square value of responses for the usage of plastic
money from the occupation perspective is significant at 5% level of significance. This

Perception of Card Holders towards Plastic Money
102
shows that the occupation affects the usage pattern of respondent as different
occupational groups use the plastic money in their own way.
From the above analysis, it can be concluded that plastic money usage is
affected by age, occupation and income level which indicates that these variables are
not independent but dependent whereas gender and educational qualification has no
relation with the usage of plastic money as these variables are independent.
5.2 Number of Cards Held by Users
Plastic card users have the tendency of using more than one card. This behaviour
comes about due to the demand for service satisfaction from card providers, and the
dissimilar services provided. The card users were asked to indicate the number of cards
held by them. This section will analyses the number of cards held with customers on
different parameters.
5.2.1 Numbers of cards held by users ( Age - wise)
The opinion from age wise may reveal what actually utility perceived by
different age group from the number of cards they hold
Table 5.2.1 Number of Card held (Age- Wise)
Variable 18-30 years 31-45 years 46 years and above Total
1 Card 32
(60.40)
17
(32.1)
4
(7.5) 53
(18.15)
2-3 Cards 61
(36.10
85
(50.3)
23
(13.6) 169
(57.87)
4-5 Card 14
(25)
23
(13.6)
10
(17.9) 56
(19.17)
>5 Card 2
(14.30)
169
(57.87)
5
(35.7) 14
(4.79)
Total 109
(37.30)
141
(48.3)
42
(14.4)
292
(100)
χχχχ2=22.52, df= 6, t-value at 5% = 12.6
Note: Number in parenthesis show percentages
Table 5.2.1 shows that majority of the respondents (57.87%) have 2-3 cards,
followed by the second lot (19.17%) with 4-5 cards. It was indicated that only 4.79%
possess more than five cards which belong to different institutions. For those who
reported to have 2-3 cards, majority (50.3%) were of the age between 31-45, followed
by younger (less than 30 years) lot with 36.10%. The respondents who reported that

Perception of Card Holders towards Plastic Money
103
they had only one card, majority of them belonged to young category (less than 30 years
of age). Also, minority was the older people with the age of over 45 years. The table
further shows that the respondents who indicated that they possess 4-5 cards and above
5 cards majority were of the age 31-45 years (57.1% and 50% respectively). 25% of the
respondents from the age of less than 30 years and 17.9% more than 46 years said that
they possess 4-5 cards whereas 14.30% and 35.7% of the respondents said that they
possess more than five cards out the total 14 respondents from this category. The chi-
square value of responses from age-wise for the holding of number of card is significant
at 5% level of significance. It can be concluded from the above analysis that there is a
strong association between age and number of cards held by respondents. The co-
relation value is positively correlated with the given attributes shows, with the age the
possession of cards has been increased as majority of the respondents are the young
middle aged people.
5.2.2 Numbers of cards held by users (Gender- wise)
This section will try to analyse the number of cards held by users gender wise.
The opinion from gender wise reveals from what number of cards they receive the
utility.
Table 5.2.2 Numbers of Cards held (Gender- Wise)
Variable Male Female Total
1 card 34
(64.2)
19
(35.8) 53
(18.15)
2-3 cards 127
(75.1)
42
(24.9) 169
(57.87)
4-5 cards 51
(91.1)
5
(8.9) 56
(19.17)
75 cards 14
(100)
-
- 14
(4.79)
Total 226
(77.4)
66
(22.6)
292
(100)
χχχχ2=15.88, df= 3, t-value at 5% = 7.81
Note: Number in parenthesis show percentages
Table 5.2.2 shows the result regarding the number of cards held by users on
gender basis. It was clear that out of the majority of males and females respondents
(57.87%) who reported that have 2-3 cards, 75.1% were male respondents and 24.9%
were female. Among those who said that they prefer using only one card, 64.2% were

Perception of Card Holders towards Plastic Money
104
male and only 35.8% were female. It was interesting that only male respondents were
having more than 5 cards in possession. However, it was not clear whether they use all
of them or not.
19.17% of the male and female respondents reported to have 4-5 cards. Among
those who possess 4-5 cards, 91.1% were males and 8.9% were females. This can be
interpreted that female rarely possess or use plastic money as the possession of plastic
cards is dominated by males. The chi-square value of responses from gender-wise for
the holding of cards is significant at 5% level of significance. Hence, there is an
association between gender and number of cards held with users. Therefore, it is
concluded from the analysis that the possession of plastic money is dominated by males
as compared to females.
5.2.3 Numbers of cards held by users (Income-Wise)
The opinion from income-wise may reveal what actually utility perceived by
different income group from the number of cards they hold. Table 5.2.3 indicates that
out of the total respondents who reported to be possess 2-3 cards, majority (59.2%)
belonged to the class of users who receive a monthly income between Rs. 20,001-
60,000, 23.1% belonged to upto Rs. 20,000 per month. Also, 2.4% of those who possess
2-3 cards were high income gainers (above Rs. 100,000). Among the respondents who
posses only one card, the income of majority of them was less than Rs. 20,000 followed
by income between Rs. 20,001-60,000. This indicates that the users of cards are mostly
low income class.
Table 5.2.3 Number of cards held (Income- Wise)
Variable Up to
Rs.20000
20001-60000 60001-
100000
Above
Rs.100000
Total
1 Card 28
(52.8)
21
(39.6)
1
(1.9)
3
(5.70) 53
(18.15)
2-3 Cards 39
(23.1)
100
(59.2)
26
(15.4)
4
(2.4) 169
(57.87)
4-5 Cards 7
(12.5)
32
(57.10)
16
(28.6)
1
(1.8) 56
(19.17)
More than 5
Cards
1
(7.1)
6
(42.9)
7
(50)
- 14
(4.79)
Total 75
(25.70)
159
(54.50)
50
(17.10)
8
(2.70)
292
(100)
χχχχ2=47.48, df= 9, t-value at 5% = 16.9
Note: Number in parenthesis show percentages

Perception of Card Holders towards Plastic Money
105
The table further shows that the users who possess more than 5 cards belonged
to high income (Rs. 60,001-100,000). This indicates that the plastic card is a symbol
status to the higher class people. The result also shows that among those who indicated
that they possess 4-5 cards, majority of them (85.7%) earn Rs. 20,001-60,000. The chi-
square value of responses from the income-perspective of users for the number of cards
they hold is positively and significantly associated with it. This shows that with the
increase in income of respondents, there is a tendency to hold more number of cards.
5.2.4 Number of cards held by users (Education- Wise)
This section analyses the perception of cardholders from education perspective
for the number of cards they hold. In this section users were asked to report the number
of cards held by them. Table 5.2.4 shows that majority (57.87%) of the respondents said
that they possess 2-3 plastic cards and among them 49.7% were post graduates, 45.6%
were graduates and only 4.7% did not specify their qualification. Among those who
reported that they possess only one card, 58.5% were graduates and 41.5% were post
graduates. 19.17% of those who said they possess 4-5 cards 55.4% were post graduates
and 39.3% were graduates.
Table 5.2.4 Number of cards held (Education-Wise)
Variable Graduate Post Graduate Any Other Total
1 card 31
(58.5)
2
(41.5)
- 53
(18.15)
2-3 cards 77
(45.6)
84
(49.7)
8
(4.7) 169
(57.87)
4-5 cards 22
(39.3)
31
(55.4)
3
(5.4) 56
(19.17)
>5 cards 3
(21.4)
11
(78.6)
- 14
(4.79)
Total 133
(45.5)
148
(50.7)
11
(3.8)
292
(100)
χχχχ2=10.84, df= 6, t- value at 5% = 12.6
Note: Number in parenthesis show percentages
The table further shows that there were respondents who said that they have
more than 5 cards and among them 78.6% were post graduates and 21.4% were
graduates.. The value of chi-square of responses from the education perspective for the
holding of cards is insignificant at 5% level of significance. This shows that holding of

Perception of Card Holders towards Plastic Money
106
more number of cards is not dependent upon the education of the users. Hence, we can
say good qualification does not leads to holding of more cards.
5.2.5 Number of Cards Held by users (occupation- wise)
The occupation wise category of card holders indicated that that some possess
more than one card.
Table 5.2.5 Number of cards held (occupation- Wise)
Variable Business Service class Professional Total
1 Card 5
(9.4)
32
(60.4)
16
(30.2) 53
(18.15)
2-3 Cards 25
(14.8)
107
(63.3)
37
(21.9) 169
(57.87)
4-5 Cards 13
(23.2)
31
(55.4)
12
(21.4) 56
(19.17)
More than 5
Cards
1
(7.1)
9
(64.3)
4
(28.6) 14
(4.79)
Total 44
(15.1)
179
(61.3)
69
(23.6)
292
(100)
χχχχ2=6.07, df= 6,t-value at 5% = 12.6
Note: Number in parenthesis show percentages
Table 5.2.5 indicates that out of total number of respondents, majority possess 2-
3 cards and from them 63.3% were service class and 21.9% were professionals. Further,
the table shows that out of those who reported to possess only one card, majority were
service class, followed by (30.2%) professionals and (9.4%) business people. Some
respondents also said that they possess more than 5 cards of which majority were from
service class. The chi-square value is insignificant at 5% level of significance which
means there is no association between occupation and the possession of cards by
respondents as these variables are independent.
The above analysis shows that age, gender and income level affect the number
of cards held by users whereas occupational level and educational level does not seem
to affect the number of cards in the possession of users.
5.3 Utility of Plastic Money
The demand for plastic money is accelerated by the utility perceived by the
users. This study attempted to get the perceived utility of plastic money which leads to

Perception of Card Holders towards Plastic Money
107
the need of cards adoption. The aim of this section was to observe to what extent, users
perceived the utility from plastic money. The analysis was done keeping in mind
different parameters, which are as follow:
5.3.1 Utility of Plastic Money (Age – wise)
This section will analyse the perceived utility of plastic money from different
categories. From the age perspective, out of the total sample surveyed, 51.7 % of the
respondents indicated that plastic money is essential, 30.13% reportedly indicated that
plastic money is vital as shown in Table 5.3.1. Also 1.36% and 68% respectively said
that it is a waste of resources or they cannot say exactly.
Table 5.3.1 Utility of Plastic Money (Age –wise)
Variable 18-30 years 31-45 years 46 years and above Total
Vital 29
(33)
47
(13.6)
12
(13.6) 88
(30.13)
Essential 60
(39.7)
68
(45)
23
(15.2) 151
(51.7)
Desirable 16
(34)
24
(51.1)
7
(14.9) 47
(16.09)
A Waste of
resource
2
(50)
2
(50)
- 4
(1.36)
Can’t say
exactly
2
(100) - - 2
(.68)
Total 109
(37.3)
141
(48.3)
42.
(14.4)
292
(100)
χχχχ2=5.93, df= 8, t-value at 5% = 15.5
Note: Number in parenthesis show percentages
Out of the 151 respondents (51.7%) who said plastic money is essential,
majority of them (45%) were between 31-45 years of age, 39.7% were less than 30
years of age and 15.2% were over 46 years. Further, it was indicated that among those
who said plastic money is vital, majority 53.4% were of the age between 31-45 years,
followed by 33% at the age of less than 30 years. For the respondents who said that
plastic money is desirable, majority (51.1%) were between the age of 31-45, followed
by those who were at the age of less than 30 years and lastly, 14.9% indicated that they
were at the age of above 46 years. 2 respondents were unable to say exactly about the
utility of plastic money. Inferential statistics shows that age has insignificant
relationship with the perception of users at 5% level of significance. It can be concluded

Perception of Card Holders towards Plastic Money
108
from above analysis that young users derived more utility from plastic money as
compared to aged people.
5.3.2 Utility of Plastic Money (Gender – wise)
From gender perspective, the respondents were asked to indicate as to what
extent they perceived the utility from plastic money. The result is presented in table no
5.3.2.the result indicates that among the majority (51.7%) of respondents who reported
that plastic money is essential, 78.1% were males and 21.9% were females. 30.13%
who reported that plastic money is vital, 73.9% were males and 26.1% were females.
Table 5.3.2 Utility of plastic money (Gender – wise)
Variable Male Female Total
Vital 65
(73.9)
23
(26.1) 88
(30.13)
Essential 118
(78.1)
33
(21.9) 151
(51.7)
Desirable 39
(83)
8
(17) 47
(16.09)
A waste of resources 3
(75)
1
(25) 4
(1.36)
Can’t say exactly 1
(50)
1
(50) 2
(.68)
Total (226)
(77.4)
(66)
(22.6)
292
(100)
χχχχ2=2.39, df= 4, t-value at 5% = 9.49
Note: Number in parenthesis show percentages
This shows also that male respondents consider plastic money to be vital. This
may be because of the reason that they are involved in many situations where payments
are needed.
Further, it clear that 16.09% who said that plastic money is desirable, 83% were
males and 17% females. Among those who reportedly said that it is a waste of money,
75.0% were male and 25% were female. However, 2 respondents were unable to
express their value attitude towards plastic money. The chi-square value of responses on
the utility of plastic money for the gender wise is insignificant at 5% level of
significance. It shows both males and females do not differentiate between the utility
derived from plastic money although the possession is dominated by the males as
compared to females.

Perception of Card Holders towards Plastic Money
109
5.3.3 Utility of Plastic Money (Income-wise)
Respondents were asked to indicate whether plastic money is vital, essential,
and desirable or a waste of resources. From income perspective, table 5.3.3 shows the
result.
Table 5.3.3 Utility of plastic money (Income-wise)
Variable Upto
Rs.20000
20001-
60000
60001-
100000
Above
Rs.100000
Total
Vital 15
(17)
53
(60.2)
20
(22.7)
- 88
(30.13)
Essential 41
(27.2)
84
(55.6)
21
(13.9)
5
(3.3) 151
(51.7)
Desirable 15
(31.9)
20
(42.6)
9
(19.1)
3
(6.4) 47
(16.09)
A Waste of
resources
3
(75)
1
(25)
- - 4
(1.36)
Can’t say
exactly
1
(50)
1
(50)
- - 2
(.68)
Total 75
(25.70)
159
(54.50)
50
(17.10)
8
(2.70)
292
(100)
χχχχ2=18.78, df= 12, t-value at 5% = 21.0
Note: Number in parenthesis show percentages
Those respondents who reported that plastic money is essential, 55.6% earns
between Rs. 20,001-60,000, 27.2% earn less than Rs. 20,000 and 13.9% earn Rs.
60,001-100,000. Further, the result indicated that among those who said that plastic
money is vital, 60% earn Rs. 20,001-60,000, 22.7% earn Rs. 60,001-1,00,000 and 17%
earn less then Rs. 20,000. 16.09% of those who said that it is desirable, 42.6% belonged
to the class of people who earn Rs. 20,001-60,000, 19.1% earn Rs. 60,001-100,000 and
31.9% earn less than Rs. 20,000. Only four respondents said that it is a waste of
resources and majority were those who earn less than Rs. 20,000. The chi-square value
of responses on the utility derived from plastic money is insignificant at 5% level of
significance from the income perspective. It can be concluded that higher income group
does not receive more utility as compared to other lower income group, rather income
was observed and does not seem to affect the utility value of plastic money.

Perception of Card Holders towards Plastic Money
110
5.3.4 Utility of Plastic Money (Education-wise)
The responses from the users on the basis of their educational level reported
whether plastic money adoption is vital, essential, desirable, or a waste of resources.
Table 5.3.4 Utility of plastic money (Education-wise)
Variable Graduate Post Graduate Any Other Total
Vital 39
(44.3)
46
(52.3)
3
(3.40)
88
(30.13)
Essential 66
(43.7)
79
(52.3)
6
(4)
151
(51.7)
Desirable 24
(51.1)
21
(44.7)
2
(4.3)
47
(16.09)
A waste of
resources
3
(75)
1
(25)
- 4
(1.36)
Can’t say
exactly
1
(50)
1
(50)
- 2
(.68)
Total 133
(45.5)
148
(50.7)
11
(3.8)
292
(100)
χχχχ2=2.51, df= 8, t- value at 5% = 15.5
Note: Number in parenthesis show percentages
Table 5.3.4 shows that majority of the respondents reported that plastic money
adoption was essential. Among those who said so, 52.3% were post graduates and
43.7% were graduates. Out of those who said that plastic money adoption is vital,
44.3% were graduates and 52.3% were post graduates. Only 3.40% belong to other
class which did not specify their educational qualification. For those who said that
plastic money is desirable, 51.1% were graduates, 44.7% were post graduates and only
4.3% did not specify their qualification. Some respondents also said that it is a waste of
resources, of which 3 respondents were graduates and 1 respondent was post graduate.
This result shows that plastic money is perceived to be essential and should be adopted
as it provides useful services which replaces the conventional way of making purchases
and payment. Inferential statistics shows there is no association between educational
qualification and customers perceptions at 5 percent level of significance. It shows that

Perception of Card Holders towards Plastic Money
111
utility derived from plastic money is not dependent upon the educational qualification
rather it is influenced by some other variable.
5.3.5 Utility of Plastic Money (Occupation-wise)
Utility of plastic money is different for various occupational group. In this
section, the extent of utility is derived from plastic money is analyzed from different
occupational groups. The result are shown on table no.5.3.5
Table 5.3.5 Utility of plastic money (Occupation-wise)
Variable Business Service class Professional Total
Vital 19
(21.6)
47
(53.4)
22
(25) 88
(30.13)
Essential 19
(12.6)
92
(60.9)
40
(26.5) 151
(51.7)
Desirable 6
(12.8)
35
(74.5)
6
(12.8) 47
(16.09)
A Waste of
resources
- 3
(75)
1
(25) 4
(1.36)
Can’t say
exactly
- 2
(100)
- 2
(.68)
Total 44
(15.1)
179
(61.3)
69
(23.6)
292
(100)
χχχχ2=10.43, df= 8, t-value at 5% = 15.5
Note: Number in parenthesis show percentages
Table 5.3.5 shows that majority (51.7%) of the respondents said that plastic
money is essential. Among those who supported this intensity, 60.9% were service
people, 26.5% were professionals and 12.6% were business people. Among those who
said that plastic money is vital, 53.4% were service people, 21.6% of each were
businessmen and 25% professional. Only six respondents said they either can’t say or it
is a waste of resources.
The chi-square value of responses for the utility of plastic money on
occupational basis is insignificant at 5% level of significance. It can be concluded from
the above analysis that occupation does not seem to affect the utility derived from the
usage of plastic money
From the study, it is revealed that none of variables (age, gender, occupation,
income and educational) has utility perceived from plastic money as all the variables are
independent in mature.

Perception of Card Holders towards Plastic Money
112
5.4 Frequency of Card Usage
Even though card users possess multiple cards, the way they use them is also
vital to the cards industry. Some respondents possess more than 2 cards but they don’t
use them frequently. Users were asked to indicate their frequency in using their cards to
know whether they are active cardholders or inactive one. This will help the card
providing firm to know if the increase in the number of cards actually do the work they
are adopted for. In the study since the number of inactive cardholders as per data
collection is 9 out of 292, which is very negligible, it is not found worth while to
differentiate between active and in active users for the present study. So, all the
respondents under study are active cardholders. Perhaps persons who rarely use the
card, may be only for withdrawals from ATM, comes in the category of inactive card
user. Secondly, because ATM withdrawals have become compulsion for salaried
peoples, who only use the card to withdraw their salaries. The active cardholders are
those who use card for purchasing of goods or services but not only withdrawal of
money through ATM.
5.4.1 Frequency of Card Usage (Age-wise)
Different age-group may have the different frequency for using their cards.
From the age perspective, the frequency of card usage is shown on table No. 5.4.1
Table 5.4.1 Frequency of Card usage (Age-wise)
Variable 18-30 years 31-45 years 46 years and above Total
Almost daily 15
(57.7)
9
(34.6)
2
(7.7) 26
(8.90)
6-10 times in month 30
(39.5)
36
(47.4)
10
(13.2) 76
(26.02)
3-5 times in month 36
(28.3)
69
(54.3)
22
(17.3) 127
(43.49)
1-2 time in month 21
(45.7)
21
(45.7)
4
(8.7) 46
(15.75)
Not more than once a
month
2
(25)
3
(37.5)
3
(37.5) 8
(2.74)
Rarely used 5
(55.6)
3
(33.3)
1
(11.1) 9
(3.08`)
Total 109
(37.3)
141
(48.3)
42
(14.4)
292
(100)
χχχχ2=16.19, df= 10 , t-value at 5% = 18.3
Note: Number in parenthesis show percentages

Perception of Card Holders towards Plastic Money
113
From table 5.4.1, it was indicated that majority (43.49%) of respondents use
their cards 3-5 times in a month, 26.02% use their cards at point of sale terminals 6-10
times in a month and 15.75% of respondents reported that they use their cards 1-2 times
a month. The high frequency of use will indicate that card user have placed their faith
and confidence in using plastic money. From age wise perspective, majority of the users
who said that they use their cards 3-5 times a month were 54.3% with the age of 31-45
years. Also 28.3% with the age of less than 30 years said that they use their cards 3-5
times a month. Further, from the table, it is indicated that among those who report that
they use their cards 6-10 times in a month, again majority were in age between 31-45
years, followed by 39.5% who were less than 30 years. The overall outlook suggests,
that more than 75% respondents reportedly indicated that they use their cards at least
five times a month. This shows that the trend is picking up. However, there is a need for
more to be done, for instance, taking the customers to confidence. The chi-square value
of responses for the frequency of card usage from the age perspective is insignificant at
5% level of significance. This shows that frequency of card usage is not affected by the
age factor but it is dependent upon some other policy variable which is needed to be
explored for the policy variable. .
5.4.2 Frequency of Card Usage (Gender-wise)
Gender wise analysis for the frequency of card usage depicts whether there
exists any disparity among the males and females for using the plastic money. The
result are presented in table no.5.4.2
Table 5.4.2 Frequency of card usage (Gender-wise)
Variable Male Female Total
Almost Daily 22
(84.6)
4
(15.4) 26
(8.9)
6-10 times in a month 61
(80.3)
15
(19.7) 76
(26.02)
3-5 times in a month 101
(79.5)
26
(20.5) 127
(43.49)
1-2 times in a month 33
(71.7)
13
(28.3) 46
(15.75)
Not more than once a month 7
(87.5)
1
(12.5) 8
(2.74)
Rarely used 2
(22.2)
7
(77.8) 9
(3.08)
Total 226
(77.4)
66
(22.6)
292
(100)
χχχχ2=18.43, df= 5, t- value at 5% = 11.1
Note: Number in parenthesis show percentages

Perception of Card Holders towards Plastic Money
114
From table 5.4.2, it was indicated that 8.9% respondents who reportedly said
that they use their cards daily, majority (84.6%) were male and 15.4% were females.
80.3% of the respondents who were male indicated that they use 6-10 times in a month
and the rest were female who said that they use their cards 6-10 times in a month.
15.75% of respondents who use 1-2 times a month, 71.7% were males and 28.3%
females. 43.49% of male and female both use plastic money 3-5 times in a month, but
again it is dominated by male as compared to their counter parts. Among those who said
that they rarely use their cards, 77.8% were females and 22.2% were males. From this
result, it is clearly indicated that female respondents don’t use their cards in spending
which may be because either they are not involved in spending procedures or they don’t
like spending by using plastic money. The chi-square value of responses for the
frequency of card usage on the gender basis is significant at 5% level of significance.
Hence, gender has the association with the frequency usage of plastic money. It is clear
from the analysis that male respondents are more involved in spending with card as
compared to their counterparts.
5.4.3 Frequency of Card Usage (Income-wise)
The researcher sought to know from different income groups their frequency for
using the plastic money. From income perspective, the result for frequency of card
usage is shown on table 5.4.3
Table 5.4.3 Frequency of card usage (Income-wise)
Variable Up to
Rs.20000
20001-60000 60001-100000 Above
Rs.100000
Total
Almost Daily 10
(38.5)
12
(46.2)
3
(11.5)
1
(3.8) 26
(8.9)
6-10 times a
month
16
(21.1)
41
(53.9)
17
(22.4)
2
(2.6) 76
(26.02)
3-5 times month 27
(21.3)
75
(59.1)
23
(18.1)
2
(1.6) 127
(43.49)
1-2 times a
month
16
(34.8)
26
(56.5)
2
(4.3)
2
(4.3) 46
(15.75)
Not more that a
month
2
(25)
1
(12.5)
5
(62.5)
- 8
(2.74)
Rarely used 4
(44.4)
4
(44.4)
- 1
(11.1) 9
(3.08)
Total 75
(25.70)
159
(54.50)
50
(17.10)
8
(2.70)
292
(100)
χχχχ2=30.60, df= 15, t- value at 5% = 25.0
Note: Number in parenthesis show percentages

Perception of Card Holders towards Plastic Money
115
The table shows that majority of the respondents using plastic money 3-5 times
in a month earn between Rs. 20,001-60,000. Also 18.1% of them earn Rs. 60,001-
100,000 and 21.3% earn less than Rs. 20,000. Further, 15.75% who use their cards one
to twice, among 56.5% earn between Rs. 20,001 to 60,000, 34.8% earn less than Rs.
20,000 and 4.3% earns above Rs. 100,000. 8.9% respondents reported that they use
their card almost daily. Among them, 38.5% earn less then Rs. 20,000, 46.2% earn
between Rs. 20,001-60,000 and 3.8% earn above Rs. 100,000. Those who said that they
use their cards once a month were only 8 respondents and among them majority earn
between Rs. 60,001-100,000.
The chi-square value of responses for the frequency of card usage on the income
basis is significant at 5% level of significance. So, there is a strong association between
income and frequency of card usage but they are negatively co-related to each other.
Hence, with the increase in income level does not mean usage frequency will also
increase. Rather it will decrease.
5.4.4 Frequency of card usage (Education-wise)
Education being the vital parameter. From this perspective, researcher sought to
know whether there is any disparity among the more educated then the less qualified
user. The result is shown in table 5.4.4
Table 5.4.4 Frequency of card usage (Education-wise)
Variable Graduate Post Graduate Any Other Total
Almost daily 12
(46.2)
13
(50)
1
(3.8)
26
(8.9)
6-10 times in a
month
30
(39.5)
41
(53.9)
5
(6.6)
76
(26.02)
3-5 times in a
month
52
(40.9)
71
(55.9)
4
(3.1)
127
(43.49)
1-2 times in a
month
28
(60.9)
18
(39.1)
- 46
(15.75)
Not more than
once a month
6
(75)
2
(25)
- 8
(2.74)
Rarely used 5
(55.6)
3
(33.3)
1
(11.1)
9
(3.08)
Total 133
(45.5)
148
(50.7)
11
(3.8)
292
(100)
χχχχ2=13.98, df= 10 , t- value at 5% = 18.3
Note: Number in parenthesis show percentages

Perception of Card Holders towards Plastic Money
116
Table 5.4.4 shows that majority of card users use them 3-5 times a month,
followed by those who use 6-10 times a month and then those who use their cards 1-2
times a month. Among 43.49% of who use 3-5 times a month, 55.9% were post
graduates and 40.9% of were graduates. Also, 26.02% of those who use their cards 6-10
times in a month, 53.9% were post graduates, 39.5% were graduates and 6.6% did not
specify their qualification. Further, the result revealed that 15.75% of those who said
that they use plastic money once to twice a month, 60.9% were graduates and 39.1%
were post graduates. Only 8 respondents said that they use it once a month and 9
respondents reported that they rarely use their cards. This indicates that still all card
users have not full trusted the use of plastic money. The chi-square value of responses
for the usage frequency on the educational basis is insignificant at 5% level of
significance. Hence, higher education has no relation with the usage frequency of cards
but it is dependent upon some other variable.
5.4.5 Frequency of Card usage (Occupation-wise)
Frequency of card usage is dependent upon the need of the user. Different
occupational group may have different frequency for using their card according to their
needs. Frequency for card usage on occupational wise is shown on table no.5.4.5. Study
reveals that the majority (43.49%) of the respondents use their cards 3-5 times a month.
Out of them, 62.2% were service people, 23.6% professionals and 14.2% were business
people. Among those who said that they use their cards almost daily, 65.4% were from
service class, 15.4% were professionals and 19.2% were business people.
Table 5.4.5 Frequency of card usage (Occupation-wise)
Variable Business Service class Professional Total
Almost Daily 5
(19.2)
17
(65.4)
7
(15.4) 26
(8.90)
6-10 time in a
month
8
(10.5)
47
(61.8)
21
(27.6) 76
(26.02)
3-5 time in a
month
18
(14.2)
79
(62.2)
30
(23.6) 127
(43.49)
1-2 time in a
month
13
(28.3)
27
(58.7)
6
(13) 46
(15.75)
Not more than
once month
- 7
(87.5)
1
(12.5) 8
(2.74)
Rarely used - 2
(22.2)
7
(77.8) 9
(3.08)
Total 44
(15.1)
179
(61.3)
69
(23.6)
292
(100)
χχχχ2=27.59, df= 10, t-value at 5% = 18.3
Note: Number in parenthesis show percentages
Perception of Card Holders towards Plastic Money
117
Further, the table reveals that 26.02% of the respondents who said that they use
their cards 6-10 times in a month, 61.8% were service people, 27.6% were professionals
and 10.5% were business class people. The result also shows that some respondents
(17) use once or rarely use their cards, among them were only servicemen and
professionals. Business class people who possess plastic money reported use of their
cards atleast once to twice a month. This is evident that service people are regular users
of plastic money, followed by professionals and then businessmen who prefer using
mostly other means of payment apart from plastic money. The chi-square value of
responses on the occupational basis for the frequency of card usage is significant at 5%
level of significance. Hence, it is also clear from the analysis usage frequency of service
class is more as compared to professional or business class people.
It is inferred from above analysis that frequency of card usage is being affected
by gender, income and occupational level. As the males counterparts are having more
cards than the female ones and they spend more by cards than the females whereas the
persons having fixed and regular income are likely to spend more on purchasing the
goods. The age and educational qualification does not seem to affect the frequency for
using the cards.
5.5 Monthly Spending on Cards
From this perspective, the actual amount spent will be important apart from the
frequency. The users may use the cards in purchasing small quantity of goods which
may become significant in spending. Customer trust on the card providers and brand
will determine the amount spent on the cards. This section will try to analyse the
monthly spending on cards from different perspective.
5.5.1 Monthly Spending on Cards (Age-wise)
This section analyses the monthly spending on card from the age perspective,
the result for monthly spending on card is shown Table No. 5.5.1

Perception of Card Holders towards Plastic Money
118
Table 5.5.1 Monthly spending on cards (Age-wise)
Variable 18-30 years 31-45 years 46 years and above Total
<5000 40
(52.6)
27
(35.5)
9
(11.8) 76
(26.02)
Rs. 5001 to
Rs. 15000
53
(35.3)
77
(51.3)
20
(13.3) 150
(51.36)
Rs. 15001 to
Rs. 30000
14
(23.7)
33
(55.9)
12
(20.3) 59
(20.20)
More than Rs.30000 2
(28.6)
4
(57.1)
1
(14.3) 7
(2.39)
Total 109
(37.3)
141
(48.3)
42
(14.4)
292
(100)
χχχχ2=13.59 df= 6, t-value at 5% = 12.6
Note: Number in parenthesis show percentages
Table 5.5.1 shows that the majority of the card users (51.36%) belong to the
group who spend Rs. 5001-Rs. 15,000, followed by the second group which spend less
than Rs. 5000. This shows that more than 75% of the respondents spend less than Rs.
15,000 in a month by cards. This spending is considerably low when comparing it with
the developed countries. Further, the table shows that only 20.20% reported that they
spend between Rs. 15,001 to Rs. 30,000. From the age-wise perspective, among the
majority of the respondents who reported that they spend between 5001 to 15,000,
51.3% were between the age of 31-45 years, 35.3% were less 30 years and 13.3% were
more than 46 years of age. Among those who reported that they spend less than Rs.
5000 a month, 52.6% were less than 30 years, 35.5% were between the age of 31-45
and 11.8% were at the age of 46 and above.
The table also indicates that 2.39% of respondents in the category of spending
more than Rs. 30,000, 85% of respondents were less than 45 years of age. The result
indicates that card users do not spend much through the cards in a month. This may be
interpreted that still cash is king even in the presence of plastic money. Also, it may be
due to the less number of merchant establishments who accept the cards at different
shopping malls and terminals. Inferential statistics for the monthly spending on card for
the age-wise category is significant at 5% level of significance. It was found that there
Perception of Card Holders towards Plastic Money
119
was an association between the age and monthly spending on card. Hence, majority of
young middle aged people spend more as compared to other groups.
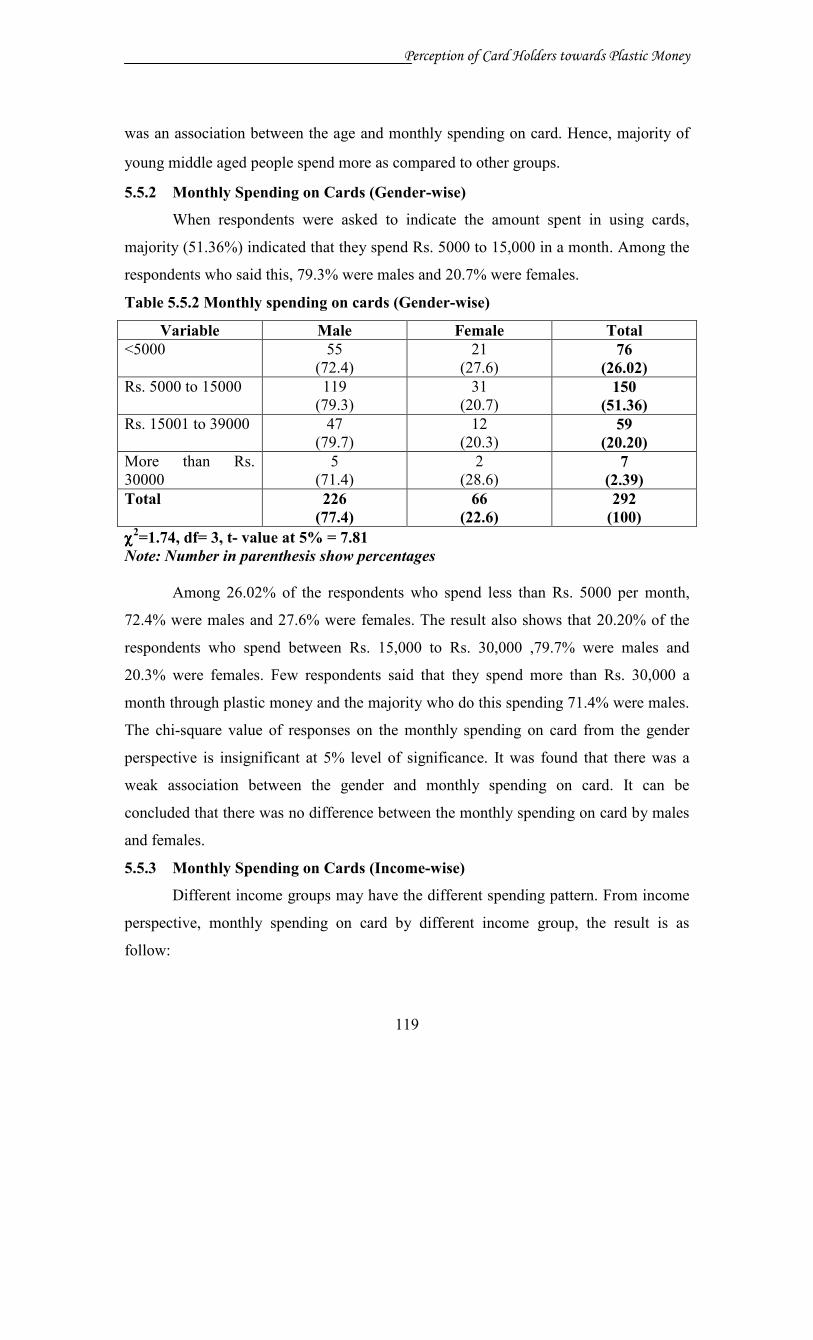
5.5.2 Monthly Spending on Cards (Gender-wise)
When respondents were asked to indicate the amount spent in using cards,
majority (51.36%) indicated that they spend Rs. 5000 to 15,000 in a month. Among the
respondents who said this, 79.3% were males and 20.7% were females.
Table 5.5.2 Monthly spending on cards (Gender-wise)
Variable Male Female Total
<5000 55
(72.4)
21
(27.6) 76
(26.02)
Rs. 5000 to 15000 119
(79.3)
31
(20.7) 150
(51.36)
Rs. 15001 to 39000 47
(79.7)
12
(20.3) 59
(20.20)
More than Rs.
30000
5
(71.4)
2
(28.6) 7
(2.39)
Total 226
(77.4)
66
(22.6)
292
(100)
χχχχ2=1.74, df= 3, t- value at 5% = 7.81
Note: Number in parenthesis show percentages
Among 26.02% of the respondents who spend less than Rs. 5000 per month,
72.4% were males and 27.6% were females. The result also shows that 20.20% of the
respondents who spend between Rs. 15,000 to Rs. 30,000 ,79.7% were males and
20.3% were females. Few respondents said that they spend more than Rs. 30,000 a
month through plastic money and the majority who do this spending 71.4% were males.
The chi-square value of responses on the monthly spending on card from the gender
perspective is insignificant at 5% level of significance. It was found that there was a
weak association between the gender and monthly spending on card. It can be
concluded that there was no difference between the monthly spending on card by males
and females.
5.5.3 Monthly Spending on Cards (Income-wise)
Different income groups may have the different spending pattern. From income
perspective, monthly spending on card by different income group, the result is as
follow:

Perception of Card Holders towards Plastic Money
120
Table 5.5.3 Monthly spending on cards (Income-wise)
Variable Up to
Rs.20000
20001-60000 60001-
100000
Above
Rs.100000
Total
Rs. <5000 36
(47.4)
30
(39.5)
9
(11.8)
1
(1.3)
76
(26.02)
Rs. 5001-15000 34
(22.7)
96
(64)
15
(10)
5
(3.3)
150
(51.36)
15001-30000 5
(8.5)
29
(49.2)
24
(40.7)
1
(1.7)
59
(20.20)
> Rs. 30000 - 4
(57.1)
2
(28.6)
1
(14.3)
7
(2.39)
Total 75
(25.70)
159
(54.50)
50
(17.10)
8
(2.70)
292
(100)
χχχχ2=58.73, df= 9, t-value at 5% = 16.9
Note: Number in parenthesis show percentages
Table 5.5.3 shows how respondents spend using their cards. It was clear that out
of the total respondents, 51.36% spend between Rs. 5001-15,000, followed by those
who spend less than Rs. 5000 and then those who spend between Rs. 15001 to 30,000.
26.02% of those who spend less than Rs. 5000, majority of them earn less than Rs.
20,000, followed by those who earn between Rs. 20,001-60,000, Rs. 60,001 to 100,000
and lastly those who earn Rs. 100,000 and above. Also among those who spend
between Rs. 5000-15,000 majority (64.0%) were users who earn between Rs. 20,001-
60,000, followed by those who earn upto Rs. 20,000. 20.20% of those who spend
between Rs. 15,000 to Rs. 30,000, majority belong to the class of users who earn Rs.
20,001-60,000, followed by 40.7% who earn between Rs. 60,000-100,000 and 8.5%
were those who earn less then Rs. 20,000. Among the class of people who spend above
Rs. 30,000, majority were those who earn between Rs. 20,001 to less than Rs. 100,000.
The result shows that medium income earners spend between Rs. 5000-30,000 as low
income class don’t spend much using cards. The chi-square value of responses on the
monthly spending on card from income perspective is positively co-related and
significant at 5% level of significance which shows that with the increase in the income
level of users there is tendency to spend more from the card because of the strong
association between the given attributes.

Perception of Card Holders towards Plastic Money
121
5.5.4 Monthly Spending on Cards (Education- wise)
From education perspective, monthly spending on card usage is shown in table 5.5.4
Table 5.5.4 Monthly spending on cards (Education– wise)
Variable Graduate Post Graduate Any Other Total
Rs. <5000 50
(65.8)
24
(31.6)
2
(2.6) 76
(26.02)
Rs.5000 to
Rs. 15000
59
(39.3)
87
(58)
4
(2.7) 150
(51.36)
Rs. 15000 to
Rs. 30000
20
(33.9)
35
(59.3)
4
(6.8) 59
(20.20)
More than
Rs. 30000
4
(57.1)
2
(28.6)
1
(14.3) 7
(2.39)
Total 133
(45.5)
148
(50.7)
11
(3.8)
292
(100)
χχχχ2=22.89, df= 6, t- value at 5% =12.6
Note: Number in parenthesis show percentages
Table 5.5.4 indicates the spending pattern of different classes of card users who
possess different qualifications. The table reveals that majority (51.36%) of the
respondents spend between Rs. 5000 to Rs. 15000 and among them, 58% were post
graduates and 39.3% were graduates. Also, out of those who spend less than Rs. 5000,
65.8% were graduates, 31.6% were post graduates and 2.6% did not specify their
qualifications. Further, it is revealed that 59.3% of those who said that they spend
between Rs. 15000 to 30,000 were post graduates, 33.9% were graduates and 6.8% did
not specify their qualifications. This result confirms that majority of card users spend
less than Rs. 15000 a month and many of do not have confidence of spending much on
the cards. This perhaps might be due to the less number of traders accepting cards or
technical problems related to cards and branch restrictions on card usage. The chi-
square value of responses on monthly spending on card from education-wise variable is
positively co-related and significant at 5% level of significance. Hence it is proved that
people with good educational background are sought to use more from the plastic
money. This may be easy for the highly qualified people to manage their funds more
wisely as compared to other groups.
Perception of Card Holders towards Plastic Money
122
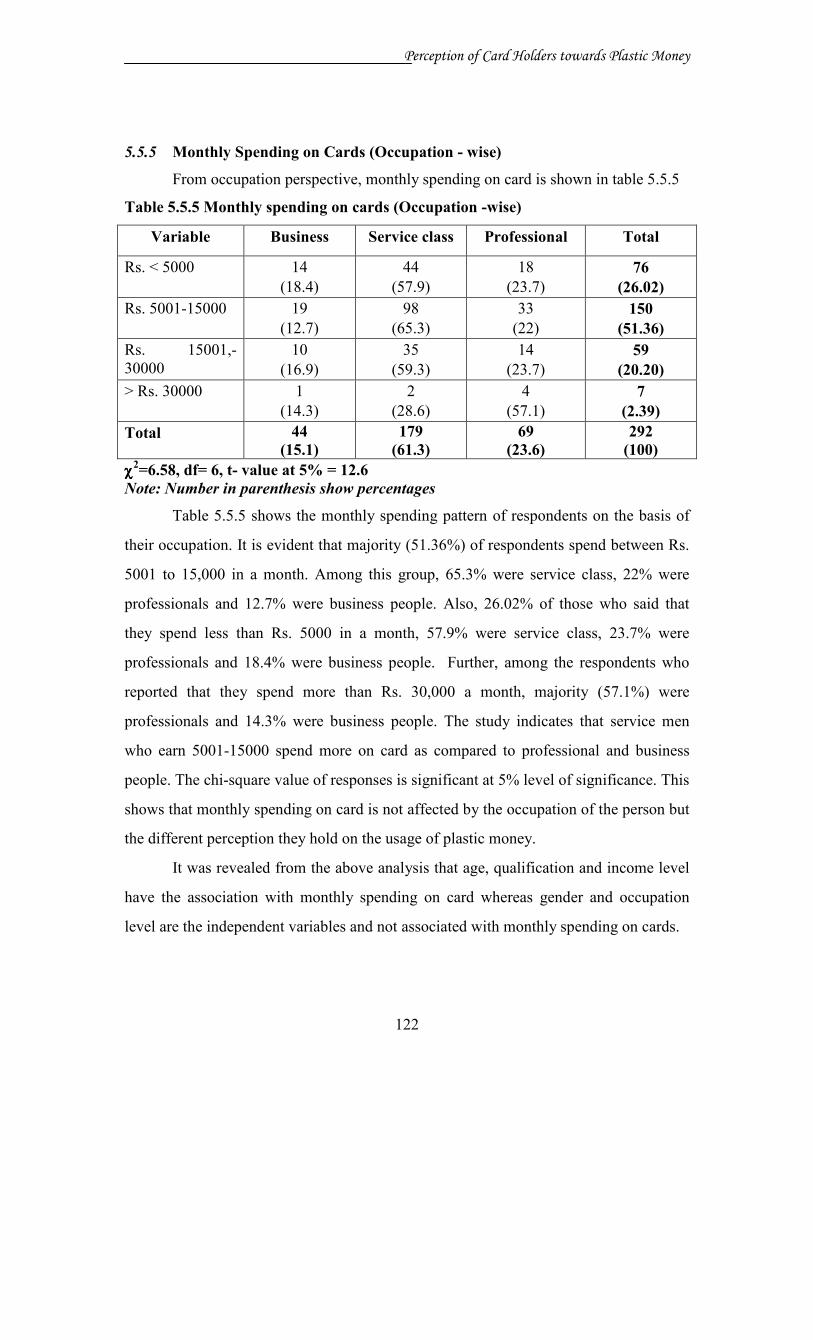
5.5.5 Monthly Spending on Cards (Occupation - wise)
From occupation perspective, monthly spending on card is shown in table 5.5.5
Table 5.5.5 Monthly spending on cards (Occupation -wise)
Variable Business Service class Professional Total
Rs. < 5000 14
(18.4)
44
(57.9)
18
(23.7)
76
(26.02)
Rs. 5001-15000 19
(12.7)
98
(65.3)
33
(22)
150
(51.36)
Rs. 15001,-
30000
10
(16.9)
35
(59.3)
14
(23.7)
59
(20.20)
> Rs. 30000 1
(14.3)
2
(28.6)
4
(57.1)
7
(2.39)
Total 44
(15.1)
179
(61.3)
69
(23.6)
292
(100)
χχχχ2=6.58, df= 6, t- value at 5% = 12.6
Note: Number in parenthesis show percentages
Table 5.5.5 shows the monthly spending pattern of respondents on the basis of
their occupation. It is evident that majority (51.36%) of respondents spend between Rs.
5001 to 15,000 in a month. Among this group, 65.3% were service class, 22% were
professionals and 12.7% were business people. Also, 26.02% of those who said that
they spend less than Rs. 5000 in a month, 57.9% were service class, 23.7% were
professionals and 18.4% were business people. Further, among the respondents who
reported that they spend more than Rs. 30,000 a month, majority (57.1%) were
professionals and 14.3% were business people. The study indicates that service men
who earn 5001-15000 spend more on card as compared to professional and business
people. The chi-square value of responses is significant at 5% level of significance. This
shows that monthly spending on card is not affected by the occupation of the person but
the different perception they hold on the usage of plastic money.
It was revealed from the above analysis that age, qualification and income level
have the association with monthly spending on card whereas gender and occupation
level are the independent variables and not associated with monthly spending on cards.

Perception of Card Holders towards Plastic Money
123
5.6 Making Payment of Credit Card Bills
Cards users decide to make payments in different patterns. Some make
payments up to the minimum required, some pay full payment within grace period and
some beyond grace period. This section try to analyses from different parameters the
behaviour of the respondents for making the payment. The results are presented here
below:
5.6.1 Making Payment of Credit Card Bills (Age–wise)
Different age group users make payment on credit card in diverse way. The
result from age perspective for the payment of credit card bill is shown in table 5.6.1.
Table 5.6.1 shows that 63.35% of the respondents prefer making full payment
within the grace period, 10.96% make payment on fixed amount each month, greater
than the minimum required. Only 13.01% and 4.79% indicated that they make payment
more than minimum required and full payment beyond grace period respectively.
Table 5.6.1 Payment of credit card bills (Age – wise)
Variable <30 years 31-45 years 746 years Total
Minimum balance required 14
(60.9)
8
(34.8)
1
(4.3) 23
(7.87)
More than minimum required 20
(52.6)
16
(42.1)
2
(5.3) 38
(13.01)
Fixed amount each month, greater
than minimum required
12
(37.5)
14
(43.8)
6
(18.8) 32
(10.96)
Full payment within grace period 58
(31.4)
95
(51.4)
32
(17.3) 185
(63.35)
Full payment beyond grace period 5
(35.7)
8
(57.1)
1
(7.1) 14
(4.79)
Total 109
(37.3)
141
(48.3)
42
(14.4)
292
(100)
χχχχ2=15.31, df= 8, t-value at 5% = 15.5
Note: Number in parenthesis show percentages
Similarly, out the total respondents who reported that they make full payment
within the grace period, majority (51.4%) were between the age of 31-45 years and
31.4% were less than 30 years. Also, those who indicated that they make fixed amount
each month, greater than minimum required, majority (52.6%) belong to the age group
less then 30 years and 42.1% aged between 31-45 years. Inferential statistics shows that

Perception of Card Holders towards Plastic Money
124
there is no association between age and payment of credit card bills at 5 percent level of
significance. It can be concluded that pattern of bill payment is not affected by age, but
with some other attribute.
5.6.2 Making Payments on Credit Card Bills (Gender – wise)
Different card users have various ways of making payment on credit card bills.
From the gender prospective, it was indicated in Table 5.6.2 that, among those who
make payment up to the minimum balance required, majority (60.9%) were male and
the rest female.
Table 5.6.2 Payments of credit card bills (Gender – wise)
Variable Male Female Total
Minimum balance required 14
(60.9)
9
(39.1)
23
(7.87)
More than minimum required 25
(65.8)
13
(34.2)
38
(13.01)
Fixed amount each month, Greater
than minimum required
25
(78.1)
7
(21.9)
32
(10.96)
Full payment within Grace period 150
(81.1)
35
(18.9)
185
(63.35)
Full Payment beyond grace period 12
(85.7)
2
(14.3)
14
(4.79)
Total 226
(77.4)
66
(22.6)
292
(100)
χχχχ2=8.52, df= 4, t- value at 5% =9.49
Note: Number in parenthesis show percentages
The overall result indicated that 63.35% people make full payment within the
grace period required and among them, only 81.1% where males and 18.9% were
female. Further, it was indicated that those who make payment more than minimum
required majority (65.8%) were males and 34.2% were females. The chi-square value of
responses for the payment of credit card bills is insignificant at 5% level of significance.
Hence, it is proved that both males and females pay their dues within time, there is no
difference in making the bill payment on gender basis.

Perception of Card Holders towards Plastic Money
125
5.6.3 Making Payment on Credit Card Bills (Income – wise)
Different card users make payments on credit card in diverse ways. Table 5.6.3
shows the result indicating how different income classes make payments on credit card.
Table 5.6.3 Payment on credit card bills (Income – wise)
Variable Upto
Rs.20000
20001-60000 60001-
100000
Above
Rs.10000
Total
Minimum Balance
required
10
(43.5)
13
(56.5)
- - 23
(7.87)
More than minimum
Balance
15
(39.5)
19
(50)
4
(10.5)
- 38
(13.01)
Fixed amount greater
than minimum required
9
(28.1)
19
(59.4)
4
(12.5)
- 32
(10.96)
Full payment within
grace period
38
(20.5)
100
(54.1)
39
(21.1)
8
(4.3) 185
(63.35)
Full payment beyond the
grace period
3
(21.4)
8
(57.1)
3
(21.4)
- 14
(4.79)
Total 75
(25.70)
159
(54.50)
50
(17.10)
8
(2.70)
292
(100)
χχχχ2=19.82, df= 12, t-value at 5% = 19.7
Note: Number in parenthesis show percentages
It is clear from the table that the majority of the respondents make full payment
within the grace period. Out of them 54.1% earn Rs. 20,001-60,000, 21.1% earn Rs.
60,001-100,000 and 4.3% earn above Rs. 100,000. Among those who reported that they
make payment upto the minimum required majority (65.5%) earn Rs. 20,000-60,000
and 43.5% earn less than Rs. 20,000.
Also, the result indicated that among those who make payment more than the
minimum balance required, majority (50%) earn between Rs. 20,001-60,000, followed
by those who earn upto Rs. 20,000. The result confirms that many users like making
payments within period required which means that the users always do not like to
increase liabilities on using their cards. The chi-square value of responses on the
income-wise variable for the payment of bills is insignificant at 5% level of
significance. This shows that person with the fixed and regular income has no hesitation
to pay their dues within time, because they does not like to increase their liabilities.

Perception of Card Holders towards Plastic Money
126
5.6.4 Making Payment on Credit Card Bills (Education – wise)
From education perspective, the results are shown in table no. 5.6.4.
Respondents were asked to indicate on how they make their payments on credit card
bills. Study shows that majority (63.35%) of the respondents make full amount of
payment within the grace period. Among them, 51.9% were post graduates, 45.9% were
graduates and 2.2% did not specify their qualifications.
Table 5.6.4 Payment on credit card bills (Education – wise)
Variable Graduate Post Graduate Any Other Total
Minimum balance
required
11
(47.8)
10
(43.5)
2
(8.7)
23
(7.87)
More than minimum
required
17
(44.7)
18
(47.4)
3
(7.9)
38
(13.01)
Fixed amount each
month, Greater than
minimum required
17
(53.1)
14
(43.8)
1
(3.1)
32
(10.96)
Full amount within
grace period.
85
(45.9)
96
(51.9)
4
(2.2)
185
(63.35)
Full payment beyond
grace period
3
(21.4)
10
(71.4)
1
(7.1)
14
(4.79)
Total 133
(45.5)
148
(50.7)
11
(3.8)
292
(100)
χχχχ2=9.02, df= 8, t- value at 5% = 15.5
Note: Number in parenthesis show percentages
Also 10.96% of those who said that they make fixed amount of payment each
month, more than the minimum required, 53.1% were graduates, 43.87% were post
graduates and 3.1% did not specify their qualification. Further, it is revealed that among
those who said that they make payment upto minimum payment required, 43.5% were
post graduates, 47.8% wee graduates and 8.7% did not specify. This result shows that
qualification also matters when it comes to matters related to payment pattern of card
users. The chi-square value of responses on education –wise for making the payment of
dues is insignificant at 5% level of significance. Hence, people with or without good
education do not make a difference in making the dues clear within time.

Perception of Card Holders towards Plastic Money
127
5.6.5 Making Payment of Credit Card Bills (Occupation – wise)
Different card users make payments in numerous ways. Table 5.6.5 indicates
that majority (63.35%) of the respondents make full payment within grace period. This
means that they do not like liabilities to stand as unnecessary tension.
Table 5.6.5 Payment on credit card bills (Occupation – wise)
Variable Business Service class Professional Total
Minimum balance
required
2
(8.7)
11
(47.8)
10
(43.5)
23
(7.87)
More than minimum
required
4
(10.5)
26
(68.4)
8
(21.1)
38
(13.01)
Fixed amount each
month greater the
minimum required
6
(18.8)
18
(56.3)
8
(25)
32
(10.96)
Full payment within
grace period
29
(15.7)
114
(61.6)
42
(22.7)
185
(63.35)
Full payment
beyond the grace
period
3
(21.4)
10
(71.4)
1
(7.10)
14
(4.79)
Total 44
(15.1)
179
(61.3)
69
(23.6)
292
(100)
χχχχ2=8.86, df= 8, t- value at 5% = 15.5
Note: Number in parenthesis show percentages
Among those who reported so, 61.6% were service class, 22.7% were
professionals and 15.7% were business class. Among those who make fixed amount
each month greater than minimum included 56.3% service people, 25% professionals
and 18.8% business people. Also 4.79% of those who make full payment beyond the
grace period, 71.4% were service class, 21.4% were business people and 7.10% were
professionals. This result shows that perhaps service class make payment with great
caution as they need not to be liable to balances later. The chi-square value of responses
for making the payment on occupational basis is insignificant at 5% level of
significance. This shows occupation does not affect the behaviour of the person to make
the bill payments.

Perception of Card Holders towards Plastic Money
128
It can be concluded that all the variables (age, gender, income, qualification and
occupation)do not affect the making payment of credit card bills. Perhaps, this was
affected by behavior of the person to make the payments.
5.7 Carrying of Revolving Balance
In this section, respondents were asked to indicate if they carry revolving
balance while using their credit cards. The card users carry revolving balance in
different patterns which is as follow.
5.7.1 Carrying of Revolving Balance (Age – wise)
The researcher sought to know from different age group whether they carry the
revolving balance or not. The result presented on table no. 5.7.1.From Table, it is
clearly indicated that majority (44.17%) of the respondents indicated that they never
carry revolving balance, 18.49% reported that they seldom carry revolving balance,
Further, 25.68% of the total respondents indicated that they frequently carry revolving
balance and only 11.64% of the total respondents indicated that they always carry such
balance.
Table 5.7.1 Carrying of Revolving Balance (Age – wise)
Variable 18-30 years 31-45 years 46 years and above Total
Never 41
(31.8)
61
(47.3)
27
(20.9) 129
(44.17)
Seldom 26
(48.1)
23
(42.6)
5
(9.30) 54
(18.49)
Frequently 30
(40)
40
(53.3)
5
(6.7) 75
(25.68)
Always 12
(35.3)
17
(50)
5
(14.7) 34
(11.64)
Total 109
(37.3)
141
(48.3)
42
(14.4)
292
(100)
χχχχ2=11.68, df= 6 , t- value at 5% = 12.6
Note: Number in parenthesis show percentages
From the age perspective, majority of those who reported that they never carry
such balance were between the age of 31-45 years (47.3%). Also, 31.2% were less than
30 years of age. Among those who seldom carry their balances majority (48.1%) were
less than 30 years of age and 42.6% were between 31-45 years. This indicates that

Perception of Card Holders towards Plastic Money
129
younger card users seldom carry the balances while middle aged never carry revolving
balances when using their plastic money. Among those respondents who said that they
carry their revolving balance always, majority (50%) were of the age between 31-45
years and 35.37% were less than 30 years. Inferential statistics shows that the age has
the insignificant relationship with carrying of revolving balance at 5% level of
significance. It is clear from the analysis all the age groups respondents do not like to
carry their revolving balance as it is likely to increase their liabilities in future.
5.7.2 Carrying of Revolving Balance (Gender – wise)
Respondents from gender wise may have the different perception for carrying of
revolving balance. To analyses from this perspective the results are presented in table
no.5.7.2
Table 5.7.2 Carrying of revolving balance (Gender – wise)
Variable Male Female Total
Never 106
(82.2)
23
(17.8)
129
(44.17)
Seldom 33
(61.1)
21
(38.9)
54
(18.49)
Frequently 55
(73.3)
20
(26.7)
75
(25.68)
Always 32
(94.1)
2
(5.9)
15
(7.5)
Total 226
(77.4)
66
(22.6)
292
(100)
χχχχ2=16.01, df= 3, t- value at 5% = 7.81
Note: Number in parenthesis show percentages
Table 5.7.2 shows that 44.17% of the respondents who said that they never carry
revolving balance, 82.2% were males and 17.8% were females. Also majority (61.1%)
of those who said that they seldom carry revolving balance were males and only 38.9%
were females. 25.68% of those who carry revolving balance frequently, 73.3% were
males and 26.7% were females. 94.1% male respondents said that they always carry
revolving balance. This means that female respondents seldom carry revolving balance.
The chi-square value of responses for carrying of revolving balance is significant but
Perception of Card Holders towards Plastic Money
130
negatively co-related at 5% level of significance. This shows both the males and
females never or seldom carry the revolving balance as both do not like liabilities.
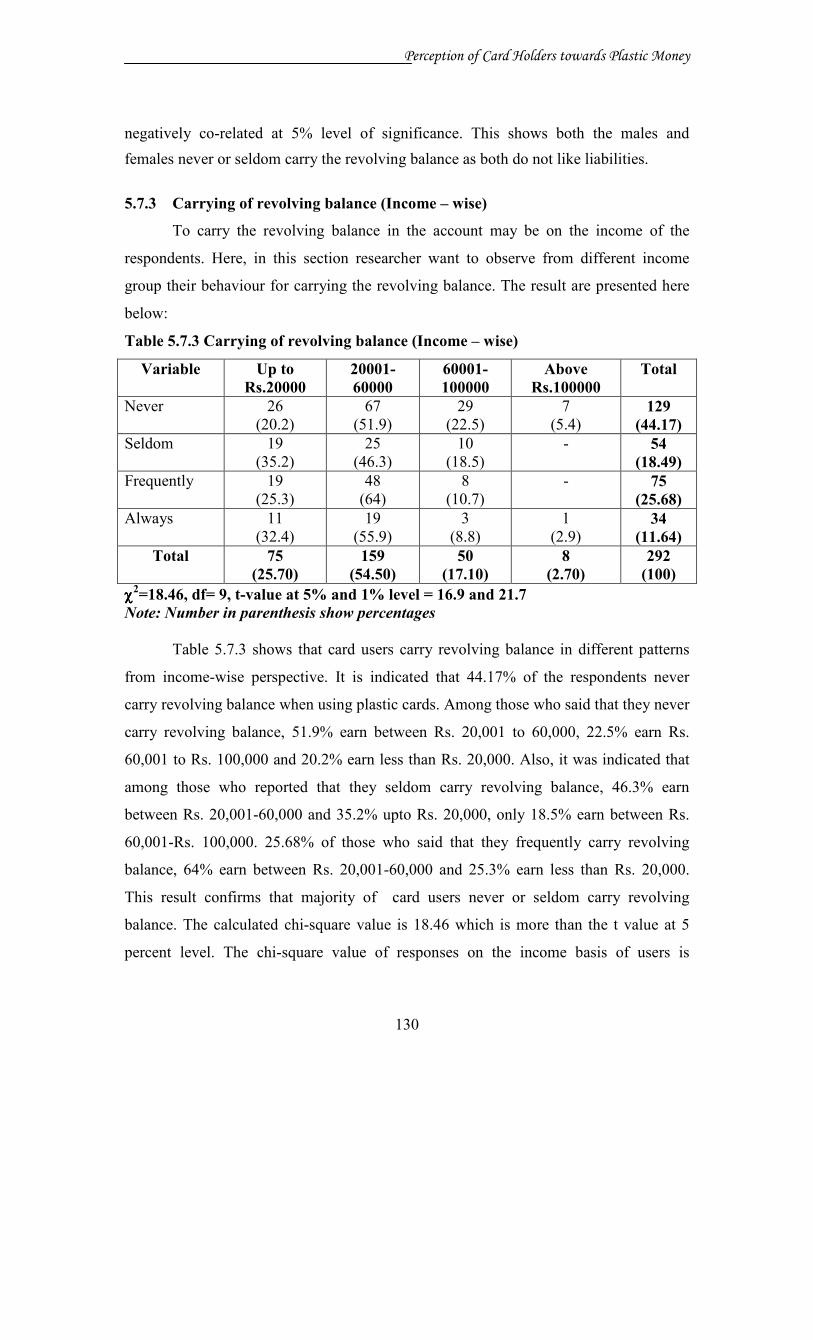
5.7.3 Carrying of revolving balance (Income – wise)
To carry the revolving balance in the account may be on the income of the
respondents. Here, in this section researcher want to observe from different income
group their behaviour for carrying the revolving balance. The result are presented here
below:
Table 5.7.3 Carrying of revolving balance (Income – wise)
Variable Up to
Rs.20000
20001-
60000
60001-
100000
Above
Rs.100000
Total
Never 26
(20.2)
67
(51.9)
29
(22.5)
7
(5.4) 129
(44.17)
Seldom 19
(35.2)
25
(46.3)
10
(18.5)
- 54
(18.49)
Frequently 19
(25.3)
48
(64)
8
(10.7)
- 75
(25.68)
Always 11
(32.4)
19
(55.9)
3
(8.8)
1
(2.9) 34
(11.64)
Total 75
(25.70)
159
(54.50)
50
(17.10)
8
(2.70)
292
(100)
χχχχ2=18.46, df= 9, t-value at 5% and 1% level = 16.9 and 21.7
Note: Number in parenthesis show percentages
Table 5.7.3 shows that card users carry revolving balance in different patterns
from income-wise perspective. It is indicated that 44.17% of the respondents never
carry revolving balance when using plastic cards. Among those who said that they never
carry revolving balance, 51.9% earn between Rs. 20,001 to 60,000, 22.5% earn Rs.
60,001 to Rs. 100,000 and 20.2% earn less than Rs. 20,000. Also, it was indicated that
among those who reported that they seldom carry revolving balance, 46.3% earn
between Rs. 20,001-60,000 and 35.2% upto Rs. 20,000, only 18.5% earn between Rs.
60,001-Rs. 100,000. 25.68% of those who said that they frequently carry revolving
balance, 64% earn between Rs. 20,001-60,000 and 25.3% earn less than Rs. 20,000.
This result confirms that majority of card users never or seldom carry revolving
balance. The calculated chi-square value is 18.46 which is more than the t value at 5
percent level. The chi-square value of responses on the income basis of users is

Perception of Card Holders towards Plastic Money
131
significant but negatively co-related at 5% level of significance. This shows that their
perception for carrying of revolving balance is strongly associated with the income and
increase in income level definitely decrease their liabilities.
5.7.4 Carrying of revolving balance (Education – wise)
From education perspective, result for carrying of revolving balance is presented
in Table 5.7.4
Table 5.7.4 Carrying of revolving balance (Education – wise)
Variable Graduate Post Graduate Any Other Total
Never 62
(48.1)
64
(49.6)
3
(2.3) 129
(44.17)
Seldom 30
(55.6)
22
(40.7)
2
(3.7) 54
(18.49)
Frequently 25
(33.3)
44
(58.7)
6
(8) 75
(25.68)
Always 16
(47.1)
18
(52.9)
-
- 34
(11.64)
Total 133
(45.5)
148
(50.7)
11
(3.8)
292
(100)
χχχχ2=11.46, df= 6, t- value at 5% = 12.6
Note: Number in parenthesis show percentages
Table 5.7.4 indicates that majority (44.17%) of the respondents never carry
revolving balance when using their plastic money. Among those who said that they
never carry revolving balance, 49.6% were post graduates, and 48.1% were graduates.
18.49% of those who said that they seldom carry revolving balance, 55.6% were
graduates and 40.7% were post graduates. Out of those who frequently carry revolving
balance majority (58.7%) were post graduates, 33.3% graduates and 8% did not specify
their qualification. Also, among those who said that they always carry revolving
balance, 52.9% were post graduates and 47.1% were graduates. The overall result
shows that majority of post graduates respondents never carry revolving balance. This
might be because of the rules given by their card providers or they do not like carrying
this balance. The calculated chi-square value is 11.46 which is less than table value. The
chi-square value of responses on the educational basis is insignificant at 5% level of
significance. This shows that the education of the person does not affect his perception
for carrying the revolving balance.

Perception of Card Holders towards Plastic Money
132
5.7.5 Carrying of Revolving Balance (Occupation – wise)
Different occupational group may have the different perception for carrying of
revolving balance. From this perspective, the result is presented on table no.5.7.5. When
the respondents were asked to indicate if they carry revolving balance while using their
credit cards, the majority (44.17%) reported that they never carry revolving balances
when using plastic money. This was evidenced by 55.8% of services class, 26.4% of
professional class and 17.8% of business class who said that they never carry revolving
balance. 18.4% of those who said that they seldom carry revolving balance, 59.3% of
them were service people, 25.9% were professionals and 14.8% were business class.
Table 5.7.5 Carrying of revolving balance (Occupation – wise)
Variable Business Service class Professional Total
Never 23
(17.8)
72
(55.8)
34
(26.4) 129
(44.17)
Seldom 8
(14.8)
32
(59.3)
14
(25.9) 54
(18.49)
Frequently 10
(13.3)
51
(68)
14
(18.7) 75
(25.68)
Always 3
(8.8)
24
(70.6)
7
(20.6) 34
(11.64)
Total 44
(15.1)
179
(61.3)
69
(23.6)
292
(100)
χχχχ2=4.82, df= 6, t-value at 5% = 12.6
Note: Number in parenthesis show percentages
The table further indicates that 68% of those who said that they frequently carry
revolving balance were service people, 18.7% were professionals and 13.3% were
business class.
11.64% of those who said that they always a carry a revolving balance, 20.6%
were professionals, 70.6% were service people and 8.8% were business class. This
result confirms that majority of card users in India never carry revolving balance. The
chi-square value of responses on the occupational basis is insignificant at 5% level of
significance. This shows that the occupation of the person has no relation with carrying
of revolving balance in his account because of the weak association between the given
attributes.

Perception of Card Holders towards Plastic Money
133
It can be concluded from the above analysis that age, qualification and
occupation have insignificant relationship with carrying of revolving balance whereas
gender and income are associated with carrying of revolving balance because the males
who are working and having good income do not like the liabilities
5.8 Misuse of Card
Plastic money usage is affected by unethical practices of the fraudsters or other
parties without the consent of users. The aim of this section was to observe whether the
card users were trapped by fraudster or not how safely they keep their cards. The plastic
money users were asked to indicate whether their cards were misused or not. The
analysis was done from different parameters which are as follow:
5.8.1 Misuse of Card (Age – wise)
The opinion from age wise may reveal, whether any particular age group is more
affected by the ethical practices of fraudsters or not. The result from age perspective, on
the misuse of card is indicated in table 5.8.1. From the table, it is clear that majority of
the respondents (93.49%) said that their cards have never been misused and only 6.51%
said that their cards have been misused. This indicates that the Indian card users are
keen in using their own plastic money and they always adhere to the rules issued by
their card providers and RBI respectively.
Table 5.8.1 Misuse of Card (Age – wise)
Variable 18-30 years 31-45 years 46 years and above Total
Yes 5
(26.3)
5
(26.3)
9
(47.4) 19
(6.51)
No 104
(38.1)
136
(49.8)
33
(12.1) 273
(93.49)
Total 109
(37.3)
141
(48.3)
42
(14.4)
273
(93.49)
χχχχ2=18.16, df= 2, t- value at 5% =
Note: Number in parenthesis show percentages
From perspective of age, among those who said that their cards have never been
misused 49.8% were at the age between 31-45 years, 38.1% were less than 30 years.
Also, among those who indicated that their cards have been misused, 47.4% belong to

Perception of Card Holders towards Plastic Money
134
the age more than 46 years. This means that the old card users are vulnerable to card
misuse as against young users who seem to be careful. The chi-square value of
responses for the misuse of card from age perspective is significant but negatively
associated at 5% level of significance. This shows that the aged people are more
vulnerable to card misuse as compared to younger and middle aged persons.
5.8.2 Misuse of Card (Gender – wise)
From gender perspective, the opinion about the misuse of card is presented in
table 5.8.2
Table 5.8.2 Misuse of card (Gender – wise)
Variable Male Female Total
Yes 16
(84.2)
3
(15.8) 19
(6.51)
No 210
(76.9)
63
(23.1) 273
(93.49)
Total 226
(77.4)
66
(22.6)
292
(100)
χχχχ2=.54, df= 1 t-value at 5% = 3.84
Note: Number in parenthesis show percentages
From the gender perspective, table 5.8.2 indicates that among the majority
(93.49%) who said that their cards have never been misused, 76.9% were males and
23.1% were females. 6.51% those who accepted that their cards have been misused,
majority were (84.2%) males and 15.8% were females. This indicates in both cases
majority of them are careful and take the instructions seriously from their card
providers. The chi-square value of responses for the misuse of cards from gender
perspective is insignificant at 5% level of significance. It can be concluded that
fraudsters do not make the difference between the gender when they are going to misuse
the card. Hence, card misuse is not affected on the basis of gender.
5.8.3 Misuse of card (Income – wise)
The misuse of card can lead to heavy losses to card users. The respondents from
income wise were asked to indicate if their card has been ever misused. The result is
presented in table 5.8.3

Perception of Card Holders towards Plastic Money
135
Table 5.8.3 Misuse of card (Income – wise)
Variable Up to
Rs.20,000
Rs. 20,001-
60,000
Rs. 60,001-
1,00,000
Above
Rs.1,00,000
Total
Yes 5
(26.3)
7
(36.8)
7
(36.8)
- 19
(6.51)
No 70
(25.6)
152
(55.7)
43
(15.8)
8
(2.9) 273
(93.49)
Total 75
(25.70)
159
(54.50)
50
(17.10)
8
(2.70)
292
(100)
χχχχ2=6.33, df= 3, t-value at 5% = 7.81
Note: Number in parenthesis show percentages
It is clear from the table that majority of the respondents indicated that their
cards have never been misused. Among them, majority (55.7%) earns between Rs.
20,001-60,000, 25.6% earn less than Rs. 20,000 and 15.8% earn between Rs. 60,001-
100,000. Among those who said that their cards have been misused in one way or the
other majority belong to the class that earn between Rs. 20,001 to 100,000. This result
confirms that the card users are careful and follow all the guidelines they are given or
provided by the card providers at the time when they adopt the cards. The chi-square
value of responses on income basis is insignificant at 5% level of significance. Hence, it
can be concluded that misuse of card is not affected due to the income level rather on
the person how safely he keeps the card.
5.8.4 Misuse of Card (Education–wise)
From educations-wise perspective (Table 5.8.4) it is also indicated that majority
of respondents reported that their cards have never been misused. Among those who
said so, 49.8% were post graduates, 46.9% were graduates and 3.3% did not specify
their qualifications.
Table 5.8.4 Misuse of card (Education – wise)
Variable Graduate Post Graduate Any Other Total
Yes 5
(26.3)
12
(63.2)
2
(10.5)
19
(6.5)
No 128
(46.9)
136
(49.8)
9
(3.3)
273
(93.49)
Total 133
(45.5)
148
(50.7)
11
(3.8)
292
(100)
χχχχ2=4.74, df= 2, t, value at 5% = 5.99
Note: Number in parenthesis show percentages

Perception of Card Holders towards Plastic Money
136
Among those who said that their cards have been misused, 63.2% were post
graduates and 26.3% graduates. This result shows that users in India are careful and
adhere to the instructions they are given and also it might be because they are well
qualified. This can reflect that those who are not well qualified may be vulnerable to
card misuse. The chi-square value of responses on the education of the person is
insignificant and negatively correlated at 5% level of significance. This shows that the
people with good education are less trapped by fraudsters as compared to other groups.
5.8.5 Card Misuse (Occupation – wise)
From occupation wise, the result for misuse of card is presented in table 5.8.5
Table 5.8.5 Card misuse (Occupation – wise)
Variable Business Service class Professional Total
Yes 5
(26.3)
12
(63.2)
2
(10.5) 19
(6.51)
No 39
(14.3)
167
(61.2)
67
(24.5) 273
(93.49)
Total 44
(15.1)
179
(61.3)
69
(23.6)
292
(100)
χχχχ2=3.19, df= 2, t-value at 5% = 5.99
Note: Number in parenthesis show percentages
Table 5.8.5 shows that majority of the` respondents said that their cards have
never been misused in any way. Out of those who reported so, 61.2% were service
class, 24.5% were professionals and 15.1% were business class. Also, among those who
said that their cards were misused in some way, 63.2% were service people, 10.5%
belong to professionals and 26.3% were business class. The overall interpretation shows
that Indian card holders are careful as they strictly follow instructions given at the time
of agreeing plastic money. The chi-square value of responses is insignificant at 5% level
of significance. Because of weak association between the given attributes, misuse of
card is not dependent on the occupation of the person.
It was revealed that only age is affected by misuse of card. It was cleared from
the analysis that older people were more vulnerable to misuse of card as compared to

Perception of Card Holders towards Plastic Money
137
young middle aged one. On the other hand, gender, income, education and occupation
do not affect the card misuse.
5.9 Satisfaction for Legal Protection to Card Holders
Satisfaction of customers on the legal protection is vital as it helps many users to
build trust blocks on the card providers and safety. The customers/card users were
enquired if they are satisfied with the legal protection provided. The aim of this section
was to observe from the respondents for their awareness about the legal protection
provided to them and how much they show their faith and confidence in the legal
system. The analysis from different perspective is as follow:
5.9.1 Satisfaction for Legal Protection to Card Holders (Age – wise)
The researcher sought to know from different age group that which age group is
more satisfied as compared to other group for the legal protection provided to them.
Table 5.9.1 shows the satisfaction for legal protection from age perspective.
Table 5.9.1 Satisfaction for legal Protection (Age – wise)
Variable 18-30 years 31-45 years 46 years and above Total
Yes 22
(44)
20
(40)
8
(16) 50
(17.12)
No 33
(31.9)
52
(49.5)
20
(19) 105
(35.96)
Can’t say exactly 54
(39.4)
69
(50.4)
14
(10.2) 137
(46.91)
Total 109
(37.3)
141
(48.3)
42
(14.4)
292
(100)
χχχχ2=5.93, df= 4, t- value at 5% = 9.49
Note: Number in parenthesis show percentages
35.96% of the respondents said that they are not satisfied with the legal
protection existing currently, majority belong to age group of 31-45 years. 17.12% said
that they are satisfied and among them 44% were less than 30 years, 40% were between
31 to 45 and 16.5% were above 46 years of age. This indicates that young middle aged
people are not satisfied or having some doubts about the legal protection the
government of India is providing towards card users in the country. The inferential
statistics on the satisfaction for legal protection from age perspective is insignificant and
negatively correlated at 5% level of significance. This shows that majority of the

Perception of Card Holders towards Plastic Money
138
respondents have in their minds the satisfaction about the legal protection available to
them.
5.9.2 Satisfaction for Legal Protection to Card Holders (Gender – wise)
The opinions from gender wise may reveal whether male respondents are
satisfied with the legal protection available to them as compared to their counterparts.
Table 5.9.2 shows the satisfaction for legal protection on gender wise.
Table 5.9.2 Satisfaction for legal protection (Gender – wise)
Variable Male Female Total
Yes 40
(80)
10
(20) 50
(17.12)
No 84
(80.0)
21
(20) 105
(35.96)
Can’t say exactly 102
(74.5)
35
(25.3) 137
(46.91)
Total 226
(77.4)
66
(22.6)
292
(100)
χχχχ2=1.28, df= 2, t- value at 5% = 5.99
Note: Number in parenthesis show percentages
Majority (46.91%) of female and male respondents were unable to say exactly
which is a sign of confusion among them, 74.5% were male and 25.5% were females.
Those who said that they are not satisfied with the Indian legal system the result
indicated that majority were males (80.0%) and females respondents comprised only
20%. 17.12% who said that they are satisfied were less in number 50/292 and amongst
them 80% were males and 20% were females. This shows that still card users demand
more reforms in terms of the Indian legal framework. The chi-square value of responses
is insignificant at 5% level of significance. This shows that both the males females are
having doubts about the legal protection available to them as they are not satisfied from
them.
5.9.3 Satisfaction for Legal Protection to Card Holders (Income–wise)
Card users from income wise were asked to report whether they are satisfied
with the legal protection provided to them. The aim of this section was to observe
whether higher income group is more satisfied as compared to lower income group. The
result is indicated in table 5.9.3.
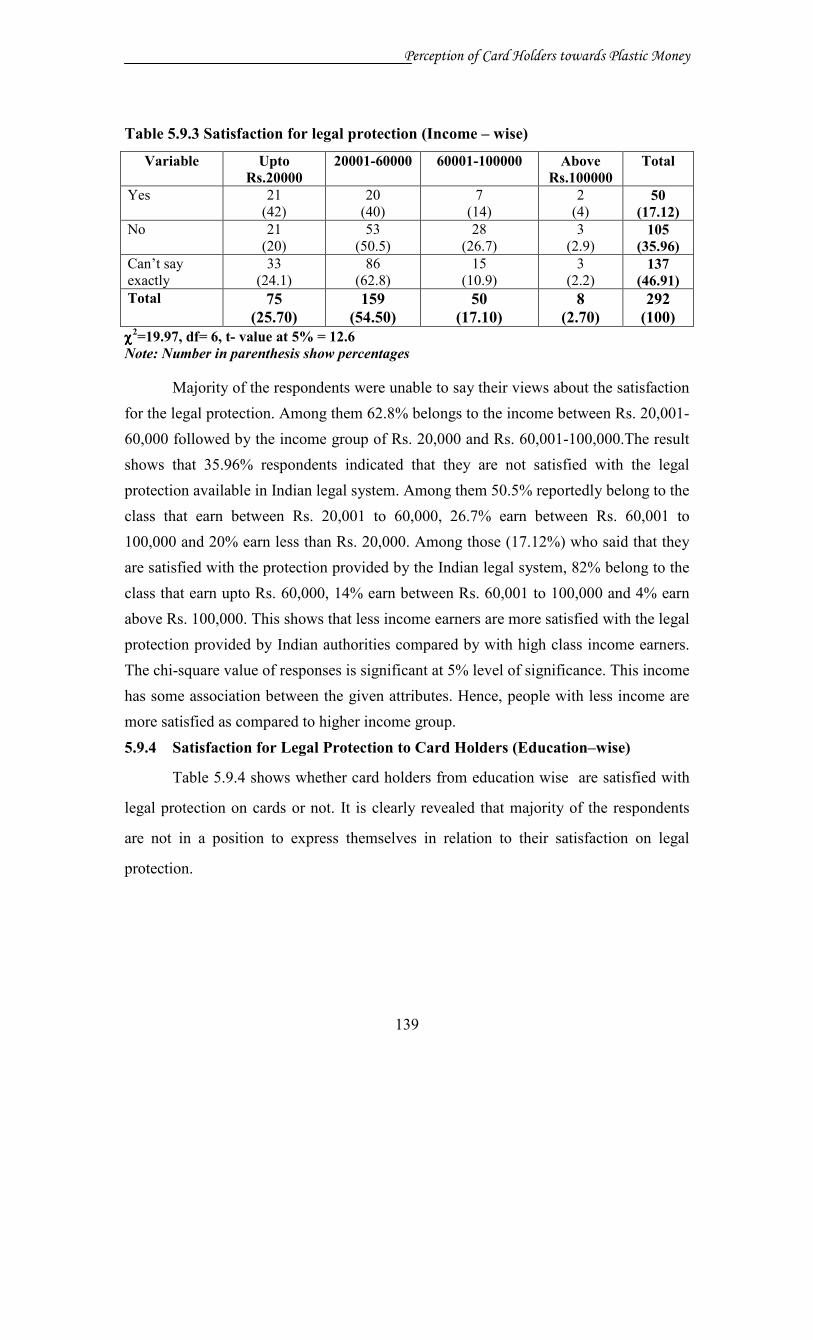
Perception of Card Holders towards Plastic Money
139
Table 5.9.3 Satisfaction for legal protection (Income – wise)
Variable Upto
Rs.20000
20001-60000 60001-100000 Above
Rs.100000
Total
Yes 21
(42)
20
(40)
7
(14)
2
(4) 50
(17.12)
No 21
(20)
53
(50.5)
28
(26.7)
3
(2.9) 105
(35.96)
Can’t say
exactly
33
(24.1)
86
(62.8)
15
(10.9)
3
(2.2) 137
(46.91)
Total 75
(25.70)
159
(54.50)
50
(17.10)
8
(2.70)
292
(100)
χχχχ2=19.97, df= 6, t- value at 5% = 12.6
Note: Number in parenthesis show percentages
Majority of the respondents were unable to say their views about the satisfaction
for the legal protection. Among them 62.8% belongs to the income between Rs. 20,001-
60,000 followed by the income group of Rs. 20,000 and Rs. 60,001-100,000.The result
shows that 35.96% respondents indicated that they are not satisfied with the legal
protection available in Indian legal system. Among them 50.5% reportedly belong to the
class that earn between Rs. 20,001 to 60,000, 26.7% earn between Rs. 60,001 to
100,000 and 20% earn less than Rs. 20,000. Among those (17.12%) who said that they
are satisfied with the protection provided by the Indian legal system, 82% belong to the
class that earn upto Rs. 60,000, 14% earn between Rs. 60,001 to 100,000 and 4% earn
above Rs. 100,000. This shows that less income earners are more satisfied with the legal
protection provided by Indian authorities compared by with high class income earners.
The chi-square value of responses is significant at 5% level of significance. This income
has some association between the given attributes. Hence, people with less income are
more satisfied as compared to higher income group.
5.9.4 Satisfaction for Legal Protection to Card Holders (Education–wise)
Table 5.9.4 shows whether card holders from education wise are satisfied with
legal protection on cards or not. It is clearly revealed that majority of the respondents
are not in a position to express themselves in relation to their satisfaction on legal
protection.

Perception of Card Holders towards Plastic Money
140
Table 5.9.4 Satisfaction for Legal Protection (Education–Wise)
Variable Graduate Post Graduate Any Other Total
Yes 26
(52)
22
(44)
2
(4)
50
(17.12)
No 39
(37.1)
61
(58.1)
5
(4.8)
105
(35.96)
Can’t say exactly 68
(49.6)
65
(47.4)
4
(2.9)
137
(46.91)
Total 133
(45.5)
148
(50.7)
11
(3.8)
292
(100)
χχχχ2=4.99, df= 4, t- value at 5% = 9.49
Note: Number in parenthesis show percentages
It is clear from the table that that substantial number of respondents are not
satisfied with the legal protection system provided by the Indian authorities. The table
reveals that out of those who said that they are not satisfied with the Indian legal
protection, 58.1% were post graduates, 37.1% were graduates and 4.8% of them did not
specify. Among those who were unable to say, 47.4% were post graduates and 49.6%
were graduates. This indicates that Indian card users have some unspeakable doubts on
the Indian legal system. This signals the reforms in the legal framework in relation to
plastic money. The chi-square value of responses on educational perspective is
insignificant at 5% level of significance. This shows that the education of the person has
no relation with the satisfaction level from legal system.
5.9.5 Satisfaction for Legal Protection to Card Holders (Occupation–wise)
This section analyses the satisfaction for legal protection available to
cardholders from occupation perspective is shown on table no.5.9.5
Table 5.9.5 Satisfaction for legal protection (Occupation – wise)
Variable Business Service class Professional Total
Yes 4
(80)
32
(64)
14
(28) 50
(17.12)
No 16
(15.2)
65
(61.9)
24
(22.9) 105
(35.96)
Can’t say 24
(17.5)
82
(59.9)
31
(22.6) 137
(46.91)
Total 44
(15.1)
179
(61.3)
69
(23.6)
292
(100)
χχχχ2=2.81, df= 4 , t- value at 5% = 9.49
Note: Number in parenthesis show percentages

Perception of Card Holders towards Plastic Money
141
Table 5.9.5 Indicates the responses regarding card holders satisfaction towards
the legal protection provided by Indian authorities. It was clear that majority (46.91%)
of the respondents were unable to say exactly what was in their mind. Among those
who said that they were not satisfied with the legal protection include 61.9% of service
class, 22.9% of professionals and 15.2% of business class people. Among those who
said that they are satisfied 64% were service class, 28% were professionals and 8%
were business class people. The overall result indicates that the card users in India are
not satisfied with the legal protection provided by the Indian authorities. This calls for
reforms in legal protection mechanism to boost the adoption of cards in the country.
The chi-square value of responses for the satisfaction from legal system on occupational
basis is insignificant. Hence, majority of the respondents are unable to say exactly what
they perceive about the satisfaction from legal system.
The result shows that age, gender, occupation and qualification has no relation
with the satisfaction from legal protection. It was indicated that still more reforms are
needed to boost the card adoption because majority of the respondents are not satisfied
as they have some unspeakable doubts in their minds.
5.10 Confusing and Cumbersome Indian Legal System
Different card users argue differently regarding the framework of Indian legal
system. Some say it is confusing and some indicate the different perception. The
customers were asked to agree or disagree with this statement of confusing and
cumbersome of the Indian legal framework. The variables were set to be from agree
disagree and can’t say. The analysis was done from different perspective to know their
actual perception about the Indian legal system.
5.10.1 Confusing and Cumbersome Indian Legal System (Age – wise)
Different age group may have the different opinions about the legal system.
Some respondents from particular age group are confused or some disagree to the
statement. The result from age perspective is presented on table 5.10.1

Perception of Card Holders towards Plastic Money
142
Table 5.10.1 Confusing and cumbersome Indian legal system (Age – wise) Variable 18-30 years 31-45 years 46 years and above Total
Agree 45
(38.8)
45
(38.8)
26
(22.4) 116
(39.73)
Disagree 17
(30.4)
34
(60.7)
5
(8.9) 56
(19.17)
Can’t say Exactly 47
(39.2)
62
(51.7)
11
(9.2) 120
(41.09)
Total 109
(37.3)
141
(48.3)
42
(14.4)
292
(100)
χχχχ2=13.77, df= 4, t- value at 5% = 9.49
Note: Number in parenthesis show percentages
It was clear from the table that 39.73% agreed that the Indian legal system is
confusing and cumbersome. Also, among those who agreed, 38.8% each were from less
than 30 years of age and 31-45 years category. 22.4% were above 46 years of age.
Further, it was revealed that majority (41.09%) of the respondents were unable to say
exactly their views regarding this statement, which means they are either confused
already or they are not aware of legal framework. This requires legal education to card
users as it will be important for them to understand their rights available in law. The
chi-square value of responses is significant at 5% level of significance. It indicates that
there is a strong association between the given attributes. Hence, majority of the
respondents are unable to report exactly their views , represents their confusion about
the Indian legal system.
5.10.2 Confusing and Cumbersome Indian Legal System (Gender–wise)
The respondents from gender wise were asked to indicates their level of
statement that Indian legal system is confusing and cumbersome. The results are shown
on table 5.10.2
Table 5.10.2 Confusing and cumbersome Indian legal system (Gender – wise) Variable Male Female Total
Agree 97
(83.6)
19
(16.4)
116
(39.73)
Disagree 41
(73.2)
15
(26.8)
56
(19.17)
Can’t say exactly 88
(73.3)
32
(26.7)
120
(41.09)
Total 226
(77.4)
6
(22.6)
292
(100)
χχχχ2=4.26, df= 2, t- value at 5% = 5.99
Note: Number in parenthesis show percentages

Perception of Card Holders towards Plastic Money
143
Table 5.10.2 shows that from the perspective of gender, majority of those who
said that they agree that India legal system is confusing, 83.6% were males and 16.4%
were females. Also 73.2% males and 26.8% females disagreed that the Indian legal
system is not confusing. 41.09% respondents were unable to say exactly what was in
their minds regarding the Indian legal system. This shows that still more needs to be
done to enable the plastic card users to access their rights in terms of knowing and not
being confused about the legal framework. The chi-square value of responses is
insignificant at 5% level of significance. It indicates that gender has no association
between with the confusion of the respondents about the legal system. Hence, majority
of the respondents are confused about the legal system.
5.10.3 Confusing and Cumbersome Indian Legal System (Income– wise)
From the perspective of income, majority of the Indian card users agreed that the
Indian legal system is cumbersome and confusing. Also a reasonable member of
respondents (41.09%) reported that they were unable to say what they feel about the
Indian legal system.
Table 5.10.3 Confusing and cumbersome Indian legal system (Income – wise)
Variable Up to
Rs.20000
20001-
60000
60001-
100000
Above
Rs.100000
Total
Agree 30
(25.9)
50
(43.1)
31
(26.7)
5
(4.3) 116
(39.73)
Disagree 20
(35.7)
30
(53.6)
6
(10.7)
- 56
(19.17)
Can’t say
exactly
25
(20.8)
79
(65.8)
13
(10.8)
3
(2.5) 120
(41.09)
Total 75
(25.70)
159
(54.50)
50
(17.10)
8
(2.70)
292
(100)
χχχχ2=21.87, df= 6, t- value at 5% = 12.6
Note: Number in parenthesis show percentages
The table shows that among those who agreed, majority (43.1%) earns between
Rs. 20,001 to 60,000, 25.9% and 26.7% earn less than Rs. 20,000 and between Rs.
60,001 to Rs. 100,000 respectively. Only 4.3% of them earn above Rs. 100,000. Also,
among those who said that Indian legal system is not confusing and cumbersome
majority of them earn less than Rs. 60,000. Among those who were unable to say,
majority (65.8%) belong to the class that earn between Rs. 20,001 to 60,000, 20.8%
earn less than Rs. 20,000 and only 2.5% earn above Rs. 100,000. This result indicates

Perception of Card Holders towards Plastic Money
144
that majority of Indian card users need more reforms in the legal system which will
boost their motivation in cards adoption. The calculated chi-square value of responses
from income perspective is significant but negatively correlated to each other. Hence,
income has some association with the confusion of the respondents but higher income
group seems to be less confused about the legal system.
5.10.4 Confusing and Cumbersome Indian Legal System (Education–wise)
Education of card user is being the vital parameter. This analysis sought to find
out if there exists any disparity among the educated people for their confusion about the
legal system than the less educated people. From education perspective, the result is
presented on table no.5.10.4
Table 5.10.4 Confusing and cumbersome Indian legal system (Education – wise)
Variable Graduate Post Graduate Any Other Total
Agree 51
(44)
61
(52.6)
4
(3.4)
116
(39.73)
Disagree 23
(41.1)
32
(57.1)
1
(1.8)
56
(19.17)
Can’t say exactly 59
(49.2)
55
(45.8)
6
(5)
120
(41.09)
Total 133
(45.5)
148
(50.7)
11
(3.8)
292
(100)
χχχχ2=2.86, df= 4, t- value at 5% = 9.49
Note: Number in parenthesis show percentages
Respondents indicated their agreement level based on the legal system which is
confusing and cumbersome. Majority of them reportedly said that they agree with the
statement that Indian legal system is confusing and cumbersome. Out of those, who
agreed 52.6% were post graduates and 44% were graduates.
Also, it was revealed that among those who were unable to say exactly, 45.8%
were post graduates and 49.2% were graduates. This confirms that respondents with
better education were able to recognize the impurities of the Indian legal system. The
chi-square value of responses from education perspective is insignificant at 5% level of
significance. Hence, confusion of the respondents is not affected by good educational

Perception of Card Holders towards Plastic Money
145
background. It is concluded here that majority of the respondents are in favors of
protection available to them.
5.10.5 Confusing and Cumbersome Indian Legal System. (Occupation– wise)
The respondents on occupation wise were asked to indicate their agreement
level on the statement that the Indian legal system is confusing and cumbersome.
Table 5.10.5 Confusing and cumbersome Indian legal system (Occupation – wise)
Variable Business Service class Professional Total
Agree 18
(15.5)
63
(54.3)
35
(30.2) 116
(39.73)
Disagree 4
(7.1)
41
(73.2)
11
(19.6) 56
(19.17)
Can’t say exactly 22
(18.3)
75
(62.5)
23
(19.2) 120
(41.09)
Total 44
(15.1)
179
(61.3)
69
(23.6)
292
(100)
χχχχ2=8.94, df= 4, t- value at 5% = 9.49
Note: Number in parenthesis show percentages
The result indicated that the majority (41.09%) of the respondents viewed that
they were unable to comment on the statement. This might be because they feel
complications about the legal system or they are confused about the way the system is
wholly set up and working. Out of those who said that they agree, 54.3% were service
class people, 30.2% were professionals and 15.5% were businessmen. For those who
disagreed, 73.2% were service people, 19.6% were professionals and 7.1% were of
business class. It is still revealed that more restructuring and reforms will return the
confidence of card users if they are initiated. The calculated chi-square value of
responses is insignificant at 5% level of significance. Hence, majority of the
respondents from all occupational groups are confused about the Indian legal system.
5.11 Factors Influencing Plastic Money Adoptions
The adoption of recent plastic money has shown spectacular performance and
many adopters of plastic money are expected in future. This adoption has some
antecedents which usually called for some strong point to boost the adopters decision of
adopting plastic money. The respondents were asked to indicate the most important

Perception of Card Holders towards Plastic Money
146
factors influencing them in adoption of cards and their brands. The respondents gave
their preference which is presented below.
5.11.1 Factors Influencing Card Choice
Statement indicates the various factors given which include convenience, status
symbol, brand, acceptability, interest rate and others. The customers were asked to give
the preferences against the most important factors influencing their card choices.
Table 5.11.1 Factors influencing card choice
Sr.
No.
Variable Rank W.A.M F value Sig.
1. Convenience 1 11.01 4.37 .014
2. Status Symbol 7 6.48 11.94 0
3. Credit Card Brand 5 7.17 3.08 .048
4. Acceptability 2 9.04 0.81 .0448
5. Interest rate 3 8.20 2.11 .0124
6. Distribution Network 4 7.76 3.51 .032
7. Bank Staff Recommendation 11 4.23 3.73 .026
8. Peer Feed Back 9 4.33 4.49 .012
9. Free Credit Period 6 6.59 0.68 .51
10. Credit Limit 8 4.77 4.96 .008
11. Annual fees 10 4.30 4.55 .012
12. Transaction fees 12 4.14 7.11 .001
Table 5.11.1 shows that convenience was ranked number one factor influencing
the card choice. This is depicted by the weighted average mean (WAM) of 11.01. This
was followed by acceptability of the card. If the card is accepted by many traders, it
becomes a strong point to consider while adapting plastic money. Also, the interest rate
factor was ranked third (WAM 8.20) as one of the important factor influencing the
choice to adopt a particular type of card. Distribution network was ranked fourth by
card users as the vital factor considered before adopting a card type. Brand was ranked
number fifth and free credit period is next important factors. Among those factors which
were considered less important include transaction fee (Twelfth rank), Bank staff
recommendation (Eleventh rank) and annual fee (Tenth rank). These factors seem to be
less considered when card users are making decisions of the type of card they adopt.

Perception of Card Holders towards Plastic Money
147
The ANOVA result indicates that status symbol and transaction fees were statistically
significant.
5.11.2 Factors Influencing Particular Brand of Cards
Table 5.11.2 Factors influencing particular brand of cards
Sr.
No.
Variable Rank W.A.M F-value Sig.
1. Joining Fees 7 8.475 .38 .682
2. Annual Fees 6 8.485 .18 .837
3. Transaction Fees 4 8.835 2.60 .077
4. Insurance Fees 9 6.795 0.16 .857
5. Interest Fees 3 9.090 7.11 .001
6. Free Credit Period 2 9.095 .97 .381
7. Add on card facility 8 6.880 .98 .377
8. Distribution Network 5 8.655 1.904 .152
9. Acceptability 1 9.44 .15 .863
10. Benefits offered by credit card Agency. 10 6.165 .78 .461
11. Convinced by direct selling associates 11 3.450 1.99 .14
12. Influenced by advertisement on TV. 12 2.860 3.11 .047
13. Influenced by advertisement in print
media.
13 2.775 .64 .527
The respondents were asked to indicate the factors influencing their brand
choices, it was revealed that acceptability was the most important factor influencing
them in making decision. Free credit period (WAM 9.095) was ranked 2nd and interest
fees (W.A.M. 9.090) was ranked third factor influencing card users in choosing their
brands. The factors which were regarded less important in brand selection include
advertisement on T.V. (W.A.M. 2.8), convinced by direct selling associates (3.5) and
benefits offered by card agency (6.165) were ranked 12th, 11
th and 10
th respectively. The
statistical significance was released on factor influence by advertisement on TV and
Interest fees which difference in variable. The overall result shows that there is no much
difference between factors for card and brand choice.

Perception of Card Holders towards Plastic Money
148
5.12 Spending Pattern on Purchases
Card users spend differently on different items. A list of items was provided to
respondents who indicated on how they spend on various listed items. The aim of this
section was to observe the respondents preference on various item for spending through
cards.
Table 5.12 Spending pattern on purchases
Sr.
No.
Variable Rank W.A.M F value Sig.
1. Groceries 1 5.45 3.46 .033
2. Restaurant bill payments 2 5.4 .51 .6
3. Consumer Durables 5 4.555 .56 .57
4. Electronic 6 4.315 .30 .738
5. Cash Withdrawn through ATM 3 4.965 3.68 .027
6. Hotel accommodation 8 2.94 0.48 .619
7. Airlines/railway tickets 7 3.595 1.07 .344
8. Clothing and Jewellery 4 4.78 .20 .816
Table 5.12 shows that groceries spending was ranked first, followed by
restaurant bills payment and cash withdrawals. This shows that majority of card users
use their cards in purchasing small items from shops and super markets and use it in
hotels and restaurants. Some other places where cards are used include clothing and
jewellery which was ranked number 4th and 5
th respectively it was further revealed that
respondents use their cards rarely to pay for hotel accommodation and airline/railway
tickets. This might be because cards users either do like using other means of payment
when purchasing their tickets and may be cash when paying for hotel accommodation.
Also, it might be that not many hotels and ticket agents accept payments through cards.
5.13 Perceived Value Risk of Plastic Money
The respondents were asked to reveal their perception towards the risk of using
plastic money and also the value or importance of using plastic money. The questions
was prepared on 5 point likert scale and respondents indicate their level of agreement
from strongly agree to strongly disagree. Weighted average mean was calculated and
ranks were given.

Perception of Card Holders towards Plastic Money
149
Table 5.13.1 Perceived functional risk
Sr.
No.
Variable SA A N D SD W.A.M Rank
1. ATM access, cash advance and
cash withdrawal facilities help
to meet financial requirements
conveniently.
165
(56.5)
70
(24)
53
(18.2)
3
(1)
1
(.03)
4.35 1
2. Buying airlines/railway tickets
by using credit card at special
counters saves times
91
(31.2)
150
(57.4)
46
(15.8)
4
(1.4)
1
(0.3)
4.11 2
3. Additional charges for extra
facilities are worth their value,
like reward points in the
purchase of petrol and railway
tickets.
77
(26.4)
86
(29.5)
111
(38)
16
(5.5)
2
(.7)
3.75 3
Note: Number in parenthesis show percentages
Table 5.13.1 shows that card users ranked statement one as 1st (ATM access,
cash clearance and cash withdrawal facilities help meet financial requirements
conveniently) perceived functional risk towards plastic money usage. Also, statement
two was perceived to be the second functional risk associated with plastic money usage.
This followed 82% of respondents who either strongly or agreed with this statement.
The 3rd rank was given to statement three where majority of respondents were neutral
to the statements.
Table 5.13.2 Perceived psychological risk
Sr.
No.
Variable SA A N D SD W.A.M Rank
1. Feel in safe hand due to
zero/limited lost card
liability.
57
(19.5)
102
(34.9)
112
(38.4)
19
(6.5)
2
(.7)
3.66 1
2. People give recognition and
attention, if purchases are
made through cards.
51
(17.5)
76
(26)
86
(29.5)
66
(2.6)
13
(4.5)
3.29 4
3. Protection against loss or
damage from fire for items
purchased through card
provides a sense of
security.
52
(17.8)
117
(40.1)
98
(33.6)
22
(7.5)
3
(1.0)
3.66 2
4. Add on card facility makes
the family members less
dependent on the card
users.
59
(20.2)
93
(31.8)
113
(38.7)
24
(8.2)
3
(1.0)
3.62 3
Note: Number in parenthesis show percentages
Table 5.13.2 shows the perceived psychological risk towards the use of plastic
money. Safety was indicated to be the most important value attributed to the use of

Perception of Card Holders towards Plastic Money
150
plastic money (WAM 3.66). This was supported by 34.9% of respondents who agreed
with the statement, 19.5% strongly agreed and 38.4% were neutral to the statement.
Add on card facility was also perceived to be essential as it was ranked 3rd. Further it
was indicated that out those who respondent to this, 31.8% agreed and 38.7% were
neutral when 20.2% of the respondents strongly agreed with their statement.
The table further revealed that recognition was ranked 4th where only 26% and
17.5% agreed and strongly agreed with the statement that people recognize and give
attention if purchases are made through cards. This indicates that this is not a very
strong point to credit card holders as it carries less value in association to reasons of
adopting the cards.
The major findings are as follows:
� Majority of users using plastic money have credit cards (218) and remaining (74)
respondents possess debit cards out of total of 292 respondents.
� The age-wise analysis indicates that out of the total respondents with credit cards,
majority (49.5%) were young middle aged (31-45). Results show that majority
(50%) of debit cards holders were less than 30 years of age.
� Study shows that the respondents who indicated that they possess 4-5 cards and
above 5 cards, the majority were of the age 31-45 years.
� 51.7% of respondents said that plastic money is essential and majority of them
(45%) were between 31-45 years. 53.4% of young middle aged (31-45) people and
advocated the of vitality of plastic money.
� Study shows that 75% of respondents reportedly indicated that they use their cards
five times in a month. This shows that the trend is picking up for the usage of plastic
money.
� More than 75% of respondents report of spending less than Rs.15,000 per month on
card.
� Plastic money usage is affected by unethical practices of the fraudsters or other
parties without the consent of users. 93.49% of the respondents said that their cards

Perception of Card Holders towards Plastic Money
151
have never been misused. This indicates that the Indian card users are keen in using
their plastic money and they always adhere to the rules issued by their card
providers and RBI respectively.
� When the card users were enquired about the satisfaction for the legal protection
available to cardholders, majority were unable to say exactly. Perhaps they are
confused or having some doubts about the Indian legal system.
� Gender wise analysis reveals that majority (77%) who adopted plastic money were
males having 4-5 cards. This shows that the females rarely use plastic money as the
possession of plastic cards is dominated by males.
� Both males and females are of the opinion that plastic money is essential for daily
life but frequency of card usage and monthly spending on card is dominated by
males as compared to females.
� Survey finding shows that all respondents pay the full bill payment within the grace
period.
� Majority (93.49%) who said that their cards have never been misused, 76.9% were
males and 23.1% were females. This indicates that in both cases, majority of them
are careful and take the instructions seriously from their card providers.
� From the income perspective, out of total users surveyed, majority (54.50%) belong
to the class of people who earn a monthly income of Rs.20,001-Rs.60,000, having
2-3 cards and admitted the essentiality of plastic money in their daily lives. Survey
shows that this slot of income group uses their card 3-5 times in a month with a total
spending of Rs.5001-Rs.15000 per month.
� Majority (57.1%) who earns Rs.20,001-Rs.60,000 per month pays the card bill full
payment beyond the grace period and who makes the full payment within grace
period were only 54.1%.
� The education being the vital parameter shows the perception of card user that
majority who adopted the plastic money are well qualified. Perhaps, this may be

Perception of Card Holders towards Plastic Money
152
easy for the highly qualified people to manage their funds more wisely as compared
to other groups.
� Plastic money is perceived to be essential for educated people as they use their cards
6-10 times in a month, by managing their resources efficiently and makes the full
payment within the grace period. It shows education also matters when it is related
to payment pattern of card users.
� Occupation perspective shows that majority of respondents who use plastic money
in their daily lives, are from service class. Business class people are least interested
in using plastic money.
� The study indicates that service class spend Rs.5001-Rs.15000 monthly on card as
compared to professional and business people. Further, the result shows that service
class make full payment within the grace period with great caution as they need not
to be liable to balances later.
� The study confirms that majority of card users in India never carry revolving
balance. The overall interpretation shows that Indian card holders are careful as they
strictly follow instructions given at the time of agreeing plastic money.
� Factors responsible for choosing the cards are distribution network, followed by free
credit period and interest rates. The factors which were regarded less important were
advertisement on T.V., convinced by direct selling associates and benefits offered
by credit card agency.
� Spending pattern of customers shows that the groceries was ranked first, followed
by restaurants bills payment and cash withdrawals.
� ATM access, cash advance and cash withdrawal facilities are regarded as the
functional risk on the other hand, safety and limited lost card liability is perceived to
be the psychological risk towards the plastic money.