Embed Size (px)
Citation preview
PERCEPTION OF QUESTIONS AND VARIABILITY OF ANSWERS
by Maria Nowalcowska
Institute of Praxiology, Polish Academy of Sciences, Warszawa
This paper presents the results of investigations aimed at determining whether certain evaluations of items have any value in predicting the variability of answers to these items.
The method of analysis was based on the concept of minimax discrimination function. This method may have wider applicability to situations where the correlation methods fail.
The following results were obtained: the stability of an item is related to negative emotional reaction to the content of the item and to negative previous experience, while the variability is connected with negative intellectual evaluation of both the question and its answer.
c+3
1. PROBLEM s SHOWN by empirical investigations A (Goldberg, 1963): the variability of
answers to questionnaire items ranges from 11 percent to 35 percent i.e., from 11 to 35 percent of subjects change their answers upon the repetition of the administration of the test. This state of affairs increased in- terest in problems of variability of answers. Basically, in the literature, two approaches to this problem may be distinguished. Firstly, attempts were made (Goldberg & Jones, 1967) to characterize relations be- tween variability and some psychometric parameters of items, such as their difficulty, ambiguity, balancedness, discrimination power, etc. These attempts led, among others, to the discovery (Goldberg & Jones, 1967) and explanation (Nowakou-ska, 1970a) of the phenomenon of the so-called psycho- metric paradox.
The second approach to problems of variability is connected with attempts at evaluating the influence of disturbing factors, such as the tendency toward ex- pected or socially desirable answers, the so- called response set, and the tendency toward a specific category of answers, the so-called response style.
The aim of the present paper was to analyse the relation between variability of answers on the one hand, and perception of items on the other hand.
Experiment The variability was investigated empir-
ically by asking the same question twice in 99
Behavioral Science, Volume 18, 1973
a certain time interval, the questions being chosen from the 16 Personality Factor Questionnaire of R. B. Cattell, mainly from scales measuring various aspects of anxiety (Table 1).
The perception of items was studied by means of a special tool, consisting of 17 scales comprising, among others, evalua- tions of the level of ambiguity, level of anxiety caused by the question, etc. The full list of these scales is presented in Table 2 .
Thus, each subject answered a question- naire item, and then evaluated it on 17 seven-point scales. Each subject evaluated in this manner 14 questions. The procedure was repeated after two weeks. The subjects (N = 56) were students from the Psychol- ogy Department, University of Warsaw.
The empirical data led to the formulation of 17 relations, each of them connecting the variability of answer with one of the 17 scales. The 17 relations were then generalized into the form of a single relation connecting variability and stability of answers with the emotional reaction to the item, previous ex- perience, and the intellectual evaluation of item and answer.
Obtaining this relation and the explana- tory hypothesis for it constitute the main empirical result of this paper.
The major part of this paper, however, is devoted to presentation of the method of obtaining relations between variability of answers and particular evaluation scales. This is due to the fact that the method used was not standard, and-as possibly appli-
100 MARIA NOWAKOWSKA
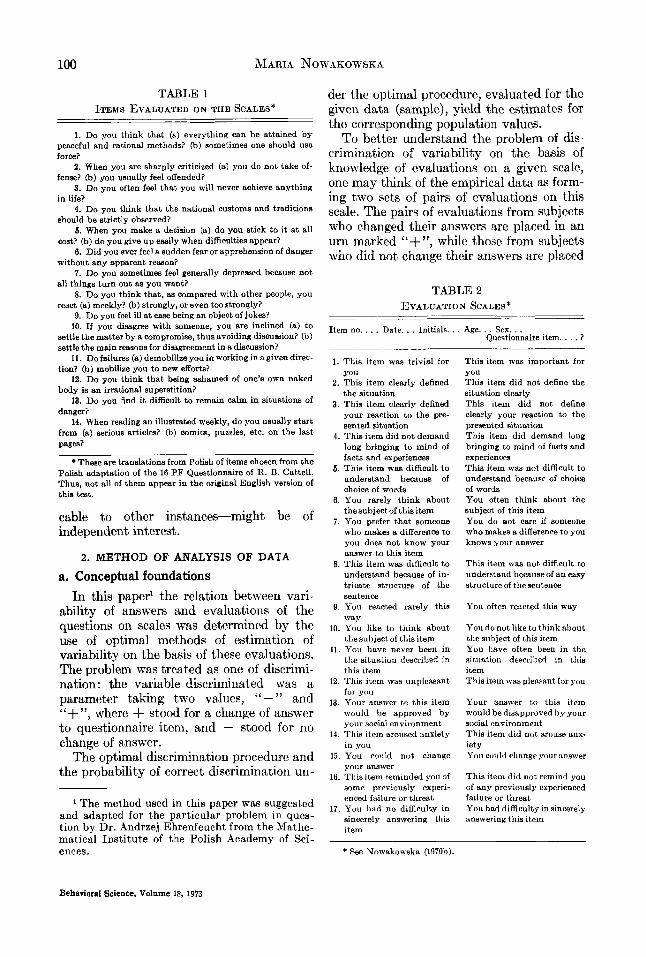
TABLE 1 ITEMS EVALUATED O N THE SCALES*
1. Do you think that (a) everything can be attained by peaceful and rational methods? (b) sometimes one should use force?
2. When you are sharply criticized (a) you do not take of- fense? (b) you usually feel offended?
3. Do you often feel that you will never achieve anything in life?
4. Do you think that the national customs and traditions should be strictly observed?
5. When you make a decision (a) do you stick to i t a t all cost? (b) do you give up easily when difficulties appear?
6. Did you evcr feel a sudden fear or apprehension of danger without any apparent reason?
7. Do you sometimes feel generally depressed because not all things turn out as you want?
8. Do you think that, as compared with other people, you react (a) meekly? (b) strongly, or even too strongly?
9. Do you feel ill at ease being an object of jokea? 10. If you disagree with someone, you are inclined (a) to
settle the matter by a compromise, thus avoiding discussion? (b) settle the main reasons for disagreement in a discussion?
11. Do failures (a) demobilize you in working in a given direc- tion? (b) mob&e you to new efforts?
12. Do you think that being ashamed of one's own naked body is an irrational superstition?
13. Do you find it difficult to remain calm in situations of danger?
14. When reading an illustrated weekly, do you usually start from (a) serious articles? (b) comics, purmles, etc. on the last pagee?
These are translations from Polish of items chosen from the Polish adaptation of the 16 PF Questionnaire of R. B. Cattell. Thus, not all of them appear in the original English version of this test,
cable to other instances-might be of independent interest .
2. METHOD OF ANALYSIS OF DATA
a. Conceptual foundations In this paper' the relation between vari-
ability of answers and evaluations of the questions on scales was determined by the use of optimal methods of estimation of variability on the basis of these evaluations. The problem was treated as one of discrimi- nation: the variable discriminated was a parameter taking two values, " - " and "+", where + stood for a change of answer to questionnaire item, and - stood for no change of answer.
The optimal discrimination procedure and the probability of correct discrimination un-
1 The met,hod used in this paper was suggested and adapted for the particular problem in ques- tion by Dr. Andrzej Ehrenfeucht from the Mathe- matical Institute of the Polish Academy of Sci- ences.
der the optimal procedure, evaluated for the given data (sample), yield the estimates for the corresponding population values.
To better understand the problem of dis- crimination of variability on the basis of knowledge of evaluations on a given scale, one may think of the empirical data as form- ing two sets of pairs of evaluations on this scale. The pairs of evaluations from subjects who changed their answers are placed in an urn marked "+)', while those from subjects who did not change their ansv.-ers are placed
TABLE 2 EVALUATION SCALES*
Item no. . . . Date. . . Initials. . . Age. . . Sex. . . Questionnaire item. . . . ?
1. This item was trivial for YOU
2. This item clearly defined the situation
3. This item clearly defined your reaction to the pre- sented situation
4. This item did not demand long bringing to mind of facts and experieneea
5. This item was difficult to understand because of choice of words
6. You rarely think about thesubject of thisitern
7. You prefer that someone who makes a difference to you does not know your answer to this item
8. This item was difficult to understand because of in- tricate structure of the sentence
9. You reacted rarely this way
10. You like to think about thesubject of this item
11. You have never been in the situtrtion described in this item
12. This item was unpleasant for you
13. Your answer to this item would be approved by your social environment
14. This item aroused anxiety in you
15. You could not change your answer
16. This item reminded you of some previously experi- enced failure or threat
17. You hnd no difficulty in sincerely answering this item
This item mas important for YOU This item did not define the situation clearly This item did not define clearly your reaction to the presented situation This item did demand long bringing to mind of facts and experiences This item was not difficult to understand because of choice of words You often think about the subject of this item You do not care if someone who makes a difference to you knows your answer
This item wea not difficult to understand because of an easy structure of thesentence
You often reacted this way
You do not like to think about the subject of this item You have often been in the situation described in this item This item wns pleasant for you
Your answer to this item would be disapproved by your social environment This item did not arouse anx- iety You could change youranswer
This item did not remind you of any previously experienced failure or threat You had difficulty in sincerely answering this item
* See Nowakowska (1970b).
Behavioral Science. Volume 18, 1973
PERCEPTION OF QUESTIONS AND VARIABILITY OF ANSWERS 10 1
in an urn marked “-” . A pair of evalua- tions is chosen at random from one of the urns, and the object is to guess from which urn the pair was chosen.
Before presenting the method and com- putational scheme, it is worth while to ex- plain :
(1) why the method of discrimination function was used instead of traditional methods of studying dependence based on correlation methods ;
(2) why, instead of building one dis- crimination function based on all 17 pairs of evaluations, the problem was split into 17 separate discrimination problems, one for each pair of evaluations.
The answer to the first question is the fol- lowing: the variable which served as the basis of discrimination, pair of evaluations on a scale, could not be linearly ordered in an adequate way2 which made it impossible to use even the rank correlation coefficient.
The answer to the second question is the following: the variable, defined as the set of pairs of evaluations on 17 scales could as- sume 4917 M 54.1027 different values3 which obviously made it impossible to use it as a basis for discrimination.
b. The problem of discrimination The problem of discrimination (in the
particular case of a dichotomous variable, assuming values, say - and +) can be pre- sented as follows. We observe a certain vari- able, say x, chosen at random according to one of the two probability distributions, say
2 Linear ordering of a set consists, roughly speaking, on defining the relation “ t o be earlier than”, which holds between pairs of elements of the given set and satisfies certain properties. I n the case under consideration, each of the scales was, of course, ordered linearly in a natural way, but already for pairs of evaluations (and more so, for sets of pairs), one cannot define linear order in any natural way, so as to preserve natural order on scales. This would require completely arbi- trary decisions, e.g. consider the problem of mutual ordering of pairs of evaluations such as (3,6) and (4 , l ) .
3 Each of the 17 scales had seven points, and the evaluations were repeated twice, so that for each scale the number of different combinations was 7.7 = 49. Consequently, for 17 scales the num- ber of combinations was 4917.
p-(z) and p+(x) , corresponding to values - and + of the dichotomous variable. Hnow- ing the value of x, we have to decide whether the value of the discriminated variable is - or +. The problem lies in constructing methods of assessing the value of the dichotomous variable which would lead to erroneous decisions in the least possible number of cases-the term “least possible” must be specified by appropriate criteria.
Such rules of assessment, not necessarily optimal, have the form of discrimination functions.
In general, a discrimination function as- signs to each observed value x the probabil- ity with which one should assert that the value of discriminated variable is +. Thus, if with probability q(z) one should, after observing x, assert that the value of dis- criminated variable is +, then with prob- ability 1 - q(z) one should assert that this value is -.
The problem arises of constructing a rule of discrimination such that errors occur as rarely as possible, both when the value of the discriminated variable is + and when this value is -. More precisely, in this paper we shall present a method of determining the optimal discrimination function in the minimax sense, under the assumption that both of the possible errors, i.e., asserting + when in fact it is - and vice versa, have equal weights.
The minimax optimality of discrimination function is defined as follows: with each dis- crimination function there are connected two probabilities of errors, one corresponding to the situation when the value of the dis- criminated variable is +, and the other when this value is -. Thus, to each dis- crimination function we may assign the larger of these two probabilities (maximum in a two-element set). The minimax dis- crimination function suggested in this paper will lead to minimal maximum of these two probabilities. In other words, any other dis- crimination function will lead to larger prob- abilities of error either for the value +, or for the value -, or for both of these values.
An alternative a.pproach might consist of finding the procedure which minimizes some weighted average of these two errors. This
Behavioral Science, Volume 18. 1973
102 MARIA NOWAKOWSKA
did not, however, seem appropriate, because there were many fewer cases of changes of answers than cases of no change, so that (unless a very large weight was assigned to one of the errors), the optimal procedure would be simply to decide “no change” (- ) regardless of the evaluations.
In the case considered in this paper, the minimax discrimination function
q(z) = probability with which one should assert that the value of discrim- inated variable is + when the value x was observed
will have the property that for the majority of values of z it will assume only extremal values for probability, i.e., values 0 or 1, and only for a few values of x will it satisfy the inequality 0 < p(z) < 1, i.e., only for a few values of x will one have to randomize the decision.
(no change of answer) and + (change of answer) on the basis of a pair of evaluations on a given scale, the role of the variable x is played by the pair x = (u,v) where u and u are integers such that 1 5 u,v 7; here u is the result of evaluation on the first oc- casion, and ZJ is the result of evaluation on the second occasion. (The scales had seven points each, which explains the inequality.) Thus, the domain for the discrimination function q(z) = p(u,v) has the form of a 7 X 7 table; in the cells of this table there are numbers, equal to probabilities p(x) with which one should assert that the value of the dis- criminated variable is + (change of answer). Thus, for cells with p(z) = 1 one should simply assert that the value of the dis- criminated variable is +; for cells with q ( x ) = 0 one should assert that the value is -, and for cells with p(x) satisfying the in- equality 0 < p(x) < 1 one should ran- domize the decision, asserting + with prob- ability p(z) and - with probability 1 - cp(x).
With the aid of the computational pro- cedure described below one obtains the values of p(x) for x being the cells of a 7 X 7 table, and probability P, of correct dis- crimination. The latter probability is the
In discrimination of the variable -
same for the value + and the value - of the variable discriminated; it ought to be compared with the value 0.50, as the method of discrimination which randomizes the decision by tossing a fair coin irrespective of the value of x gives probability 0.50 of cor- rect decision, and consequently, the optimal method cannot yield value smaller than that.
c. Scheme for calculating the minimax dis- crimination function
In this section we shall present the method of determining the minimax discrimination function for the case of discriminating the variability of answers to questionnaire items on the basis of evaluations of these items on scales. Resides that, we present the method of calculating the probability P, of correct discrimination.
This method, leading to rather tedious calculations, may be easily programmed for a computer.
The form of the raw data. For each subject and each questionnaire item, the raw data contain the information:
1. Answers to this item in 1st and 2nd ap- plica tion ;
2. Evaluations of this item on each of the 17 scales in 1st and 2nd application.
Three answers were possible for each item: “yes” ( Y ) , ‘‘no” ( N ) and “I don’t know (?). Thus, the first information had the form of nine possible pairs
Y Y Y ? ? ? N N N Y ? N Y ? N Y ? N
Next, each of the scales had the form negative o o o o 0 o 0 positive end-point end-point
Thus, the second information had the form of 17 pairs of numbers
where ih denotes the number of the circle on the lcth scale crossed on the first occasion, and j k denotes the number of the circle on the kth scale crossed on the second occa- sion.
Coding the raw data. Information (1) about answers to questionnaire items was coded in such a way as to leave only the in- formation on the possible changes of an- swers, and not on the answers themselves.
(il~jl), (&,jZ), ’ ’ ‘ , (&7,j17)
Behavioral Science, Volume 18. 1973
PERCEPTIOS OF QUESTIONS AND VARIABILITY OF AKSWEHS 103
The symbol "+" was assigned to the combinations of answers
Y Y ? ? N N ? N Y N Y ?
(change of anser), while the symbol "-" was assigned to the combinations
Y ? N Y ? N
(no change of answer). Thus, the symbol of the code gave only the change of answer or its absence, but not the answers them- selves, nor the direction of any change.
Next, 17 7 X 7 tables were constructed, one for each scale. These tables were then filled with symbols + and -, in each cell there were several symbols possible. The cell (u,v) of table for scale k contained a - for every subject-item combinat,ion where
(i) there was no change in the answer to t,he item,
(ii) the item was evaluated on the lcth scale as u in the first application and as u in the second application.
The other subject-item combinations where there was a change of the item answer, were scored +, so that the total number of symbols in all cells together was 56 X 14 = number of subjects X number of items.
In other words, the tables were filled ae- cording to the following instructions:
--take the results for each subject con- secutively ;
-for each subject (S) take consecutively his data for each of the items (I) ;
-for each combinat,ion ( S , I ) code with symbol + or - the change or no change of answer to item I by subject S;
-put this symbol in each of the tables for the 17 evaluation scales. In the kth table put this symbol into the cell (u , v ) if S is evalu- ated I on the kth scale by crossing circle u in the first application, and circle v in the second application.
Clearly, some cells may remain empty, when no subject evaluated any item by the particular combinat.iori of circles in t,wo ap- plications.
Since no direction of change of answer was taken into account, it was decided to neglect the order of evaluations too; thus the results for cells (u,v) and (v,u) were pooled t,ogether,
and the considerations were restricted to tri- angular tables (see the example for scale 15 below).
After coding the results, each cell of each of the tables contained a certain number of symbols + qnd a certain number of sym- bols - . TO avoid too many indices, we shall consider here the procedure for the table of a fixed scale, and we shall denote by muv and nu, the joint numbers of signs + and - in cells ( u , ~ ) and (v,u), that is, the numbers of signs + and - of the cell (u,u) in the tri- angular table obtained by symmetrization described above.
The value ~ ( z ) = cp(u,u) of discrimination function in cell (u,v), and also in cell (v,u), will depend, in a monotonic way, on the ratio muv/n,,, expressing the relative fre- quency of signs + to the relative frequency of signs - in cell (u,v) of the triangular table. More precisely, the function cp(z) will be equal to 1 for cells for which this ratio exceeds a certain critical value, and will be equal 0 for cells for which this ratio is less than this critical value. In the remaining cells we have the inequality 0 < cp(z) < 1.
The numerical procedure. The procedure consists of constructing two sequences, to be denoted by (C') and (D). First, we form an auxiliary sequence of ratios, by dividing for each cell the number of + signs in the cell by the number of - signs in the cell, that is, we form the ratios muv/nuv. If nu. = 0, i.e., the cell does not contain any - signs, we put the ratio equal to + co, if mu, > 0 ; the empty cells play no role, and are omitted.
The next step consists of ordering the ratios in an increasing sequence ; therefore, this sequence will contain as many terms as there are nonempty cells in the whole table. In the case of equal ratios for some cells, their ordering is irrelevant.
Under the ratios we write down the cor- responding symbols of the cells.
Next, we form the sequence (C) by writing under these ordered ratios, for each cell, the fraction
number of + signs in cell total number of + signs '
the sequence (D) is formed similarly for the - signs.
Behavioral Science. Volume 18, 1973
104 MARIA NOWAKOWSKA
Thus, the sequence (C) will consist of fractions, whose numerators are equal to numbers of symbols + in successive cells, i.e., numbers muo, and whose denominators are equal to total numbers of symbols + in the table, i.e., they are equal to the sum of all numbers muu. The sequence (0) is formed similarly, with muo replaced by nu”.
As a result, we obtain two sequences of fractions written one above another; their lengths are equal to the length of the se- quence of ratios.
The next step consists of forming suc- cessive pairs of numbers (Cl,Dl), (Cz,D2), * and comparing them. These numbers are formed as follows :
The number C, is the sum of the first r terms of the sequence ( C ) ; thus, for instance, CS equals the sum of the first five terms of sequence (C), etc.
The number D, equals to the sum of all but the first r terms of the sequence ( D ) ; thus, for instance, D3 is the sum of all but fist three terms of the sequence (D), etc.
We form the successive pairs (Cl,DI),
(Cz,Dz), . . . until we find the first index k
After finding lc we determine the values of the discrimination function q(x) as follows. For the cells (u,v) which correspond to the k smallest ratios we put cp(z) = (a(u,v) = 0. Next, if c k = Dk, we put q(x) = 1 for all remaining cells. If ck < Dk and Ck+l > &+I, we have 0 < p(z) < 1 for cell number k + 1, and cp(x) = 1 for all remaining cells.
Thus, it remains to describe the method of determining the value (a($) which satisfies the inequality 0 < (a(z) < 1 and the prob- ability P, of correct discrimination.
For the description of calculations, it will be convenient to call “domain 0” the set of all cells for which q(z) = 0, “domain 1” the set of all cells for which cp(x) = 1, and “do- main 2” the set of all cells for which 0 <
We compute the numbers PO, PI , Pz, Qo, Q1 and Qz defined as follows: PO, PI, P z are equal to the sums of corresponding terms of sequence (C) over domains 0, 1 and 2, while numbers Qo, Q1 and Q 2 are defined in an analogous way for the sequence (D).
The next step consists of determining the
such that c k (= Dk but Ck+l > &+I.
< 1.
number T = (Qo + Q Z - Pl ) / (P , + Qz). This number equals the value of the dis- crimination function cp(x) in the domain 2. Finally, the probability of correct dis- crimination is
P, = PI 4- TP2.
d. Proof of optimality4 Let (a denote the discrimination function
defined above. For an arbitrary discrimina- tion function f let acf) and pcf) be the proba- bilities of erroneous discrimination, for dis- tributions p-(x) and p+(z) respectively, that is
acf) = probability that the decision reached on the basis of discrimina- tion function f is + when the ob- served value of x was chosen ac- cording to the probability distribu- tion p-(z),
and similarly for p ( f ) . Theorem. T h e d i s c r i m i ~ u ~ i o n ~ u n c ~ ~ ~ cp
is optimal in the minimax sense (for loss f u n c - tion dejined as the probability of erroneous decision), that i s , for any discrimination funct ion f we have
I-Imx [4), Pcfll 2 max [.(cp>, P(P>l.
To prove the theorem let us observe first that (by construction of cp) we have &) =
We have to prove that for any discrimina- P((a>; let .((a> = P(P) = c.
tion function f we have
Max [.cf), Pull 2 c;
in other words, we have to prove the implica- tion
if acf) < G , then @#) 2 c.
Thus, let us consider an arbitrary dis- crimination function f and assume that
(1) acf) < c.
For the proof, let us treat the discrimination function f as a statistical test of the hypothe- sis H O = distribution is p-(x) against the alternative HI = distribution is p+(x).
‘The theorem and the proof are due to Dr. Andrzej Ehrenfeucht (see footnote 1).
Behavioral Science, Volume 18, 1973
PERCEPTION OF QUESTIONS AND VARIABILITY OF ANSWERS 105
Significance level of minimax test
1
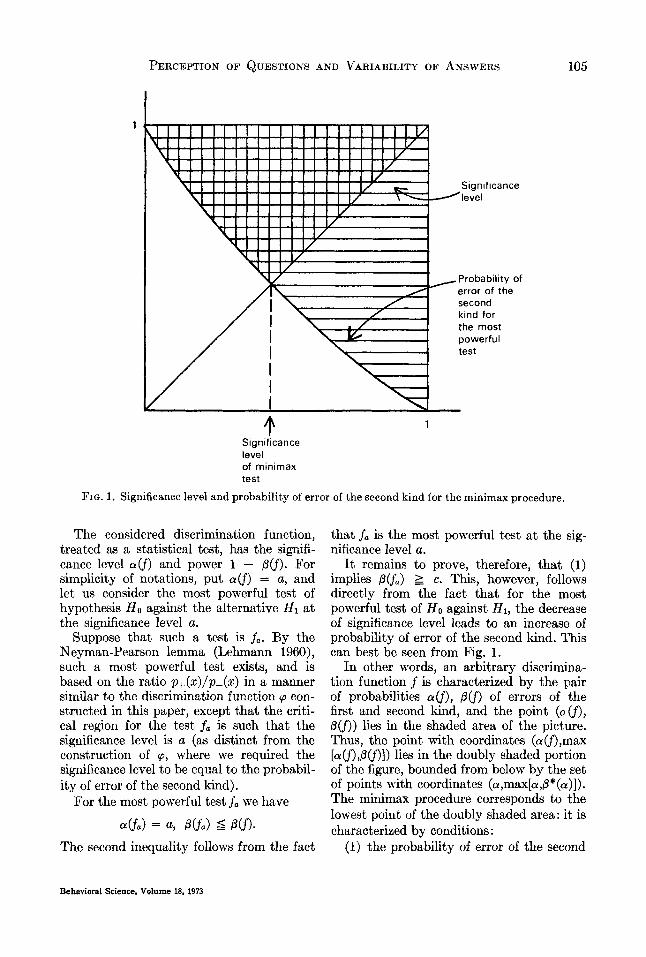
FIG. 1. Significance level and probability of error of the second kind for the minimax procedure.
The considered discrimination function, treated as a statistical test, has the signifi- cance level acf) and power 1 - flu). For simplicity of notations, put acf) = a, and let us consider the most powerful test of hypothesis H O against the alternative H I at the significance level a.
Suppose that such a test is fa. By the Neyman-Pearson lemma (Lehmann 1960), such a most powerful test exists, and is based on the ratio p+(z)/p-(z) in a manner similar to the discrimination function ‘p con- structed in this paper, except that the criti- cal region for the test fa is such that the significance level is a (as distinct from the construction of ‘p, where we required the significance level to be equal to the probabil- ity of error of the second kind).
For the most powerful test fa we have
acfa> = a, f l c f Q > 5 flu). The second inequality follows from the fact
that fa is the most powerful test a t the sig- nificance level a.
It remains to prove, therefore, that (1) implies fl(fa) 2 c. This, however, follows directly from the fact that for the most powerful test of HO against HI, the decrease of significance level leads to an increase of probability of error of the second kind. This can best be seen from Fig. 1.
In other words, an arbitrary discrimina- tion function f is characterized by the pair of probabilities crc f ) , flu) of errors of the first and second kind, and the point (o.cf), flu)) lies in the shaded area of the picture. Thus, the point with coordinates (a(j),max [acf),flcf)]) lies in the doubly shaded portion of the figure, bounded from below by the set of points with coordinates (a,max[a,fl*(a)]). The minimax procedure corresponds to the lowest point of the doubly shaded area: it is characterized by conditions:
(1) the probability of error of the second
Behavioral Science, Volume 18, 1973
106
O + 3 -
o + I + 6 - 1 2 -
o + 5 + o + 6 - 3 - 1 -
o + o + 2 + o + L - 6 - 5 - 2 -
I + l + 2 + 2 + 3 + 2 3 - 9 - 8 - 11 - 9 -
r
7 + 1 2 + 3 + 6 + L + 3 + 1 2 2 - 53 - 17 - 25 - 1 0 - 1 0 -
MARIA NOWAKOWSKA
7 16 + 13 -
3 + 9 -
6
G + GO -
I + 7 -
o + 2 -
1 +
1 0 -
5
L
3
2
L + 20 -
1
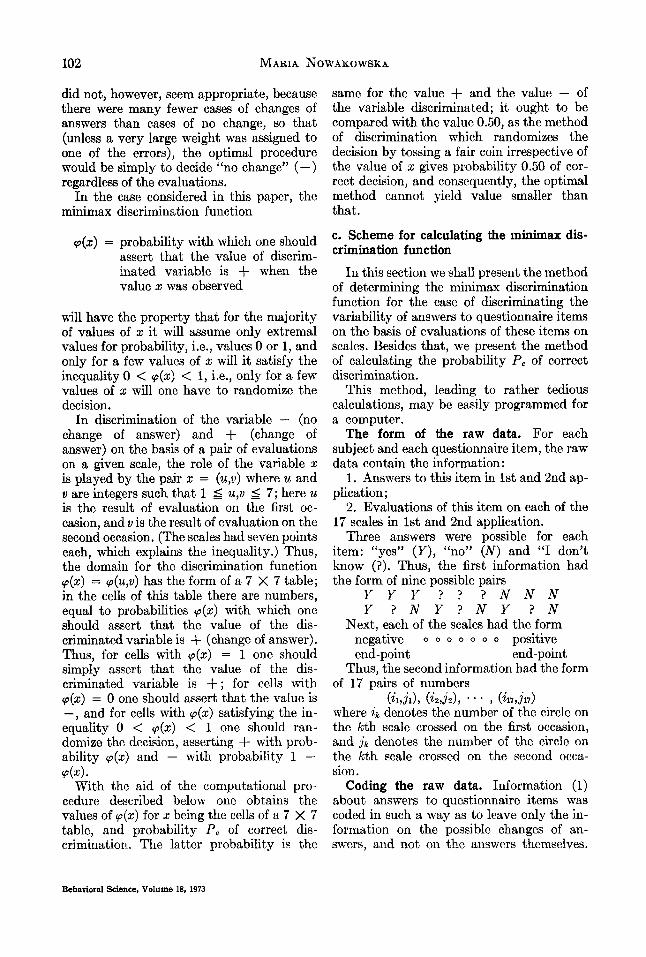
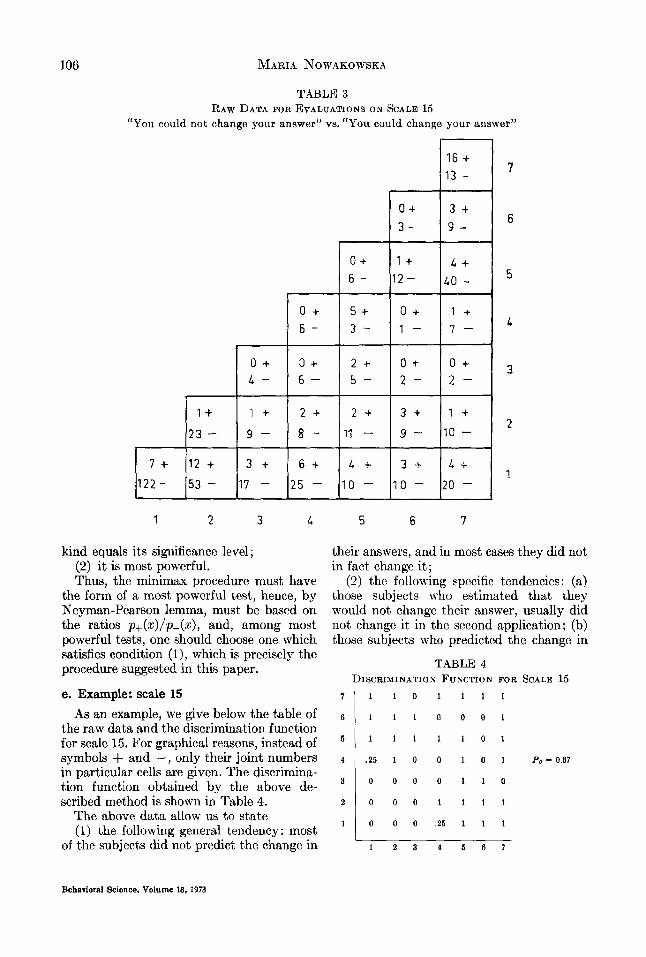
TABLE 3 RAW DATA FOR EVALUATIONS O N SCALE 15
“You could not change your answer” vs. lrYou could change your answer”
1 2 3 L 5 6 7
kind equals its significance level; (2) it is most powerful. Thus, the minimax procedure must have
the form of a most powerful test, hence, by Neyman-Pearson lemma, must be based on the ratios p+(z)/p-(z), and, among most powerful tests, one should choose one which satisfies condition (l), which is precisely the procedure suggested in this paper.
e. Example: scale 15
their answers, and in most cases they did not in fact change it;
( 2 ) the following specific tendencies: (a) those subjects who estimated that they would not change their answer, usua.lly did not change it in the second application; (b) those subjects who predicted the change in
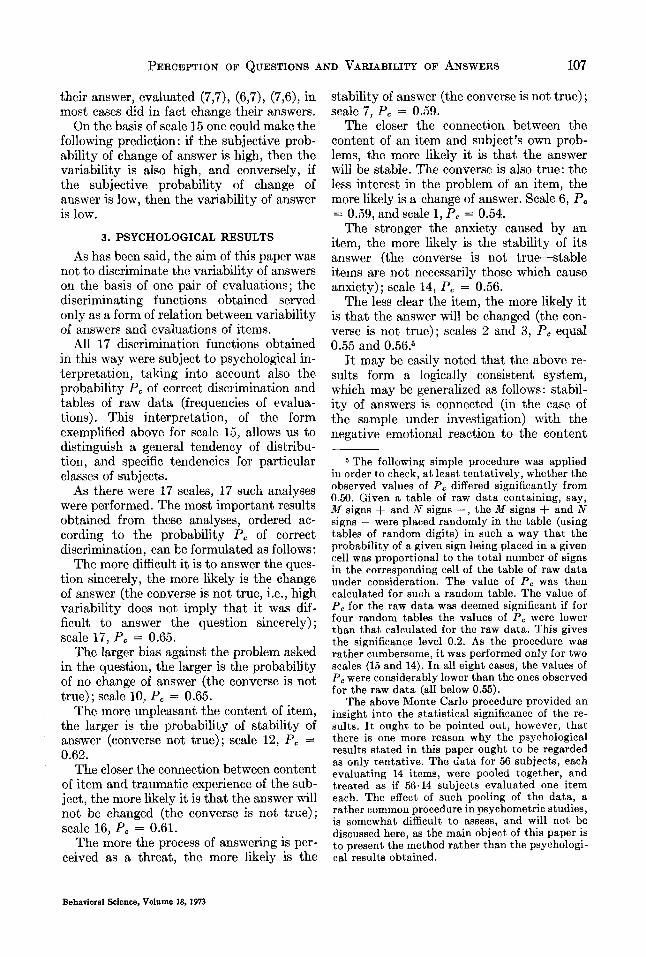
TABLE 4 DISCRIMINATION FUNCTION FOR SCALE 15
7 1 1 1 0 1 1 1 1
As an example, we give below the table of the raw data and the discrimination function for scale 15. For graphical reasons, instead of symbols + and -, only their joint numbers in particular cells are given. The discrimina- tion function obtained by the above de- scribed method is shown in Table 4.
The above data allow us to state (1) the following general tendency: most
of the subjects did not predict the change in
6
4
3
2
1
1 1 1 0 0 0 1
1 1 1 1 1 0 1
.25 1 0 0 1 0 1 P, = 0.67
0 0 0 0 1 1 0
0 0 0 1 1 1 1
0 0 0 . 2 5 1 1 1
1 2 3 4 5 6 7
Behavioral Science, Volume 18, 1973
PERCEPTION OF QUESTIONS AND VARIABILITY OF ANSWERS 107
their answer, evaluated (7,7), (6,7), (7,6), in most cases did in fact change their answers.
On the basis of scale 15 one could make the following prediction: if the subjective prob- ability of change of answer is high, then the variability is also high, and conversely, if the subjective probability of change of answer is low, then the variability of answer is low.
3. PSYCHOLOGICAL RESULTS As has been said, the aim of this paper was
not to discriminate the variability of answers on the basis of one pair of evaluations; the discriminating functions obtained served only as a form of relation between variability of answers and evaluations of items.
All 17 discrimination functions obtained in this way were subject to psychological in- terpretation, taking into account also the probability P, of correct discrimination and tables of raw data (frequencies of evalua- tions). This interpretation, of the form exemplified above for scale 15, allows us to distinguish a general tendency of distribu- tion, and specific tendencies for particular classes of subjects.
As there were 17 scales, 17 such analyses were performed. The most important results obtained from these analyses, ordered ac- cording to the probability P, of correct discrimination, can be formulated as follows:
The more difficult it is to answer the ques- tion sincerely, the more likely is the change of answer (the converse is not true, i.e., high variability does not imply that it was dif- ficult to answer the question sincerely) ; scale 17, P, = 0.65.
The larger bias against the problem asked in the question, the larger is the probability of no change of answer (the converse is not true) ; scale 10, P, = 0.65.
The more unpleasant the content of item, the larger is the probability of stability of answer (converse not true); scale 12, P, = 0.62.
The closer the connection between content of item and traumatic experience of the sub- ject, the more likely it is that the answer will not be changed (the converse is not true); scale 16, P, = 0.61.
The more the txocess of answering is Der-
stability of answer (the converse is not true) ; scale 7, P, = 0.59.
The closer the connection between the content of an item and subject’s own prob- lems, the more likely it is that the answer will be stable, The converse is also true: the less interest in the problem of an item, the more likely is a change of answer. Scale 6, P, = 0.59, and scale 1, P, = 0.54.
The stronger the anxiety caused by an item, the more likely is the stability of its answer (the converse is not true-stable items are not necessarily those which cause anxiety); scale 14, P, = 0.56.
The less clear the item, the more likely it is that the answer will be changed (the con- verse is not true); scales 2 and 3, P, equal 0.55 and 0.56.6
It may be easily noted that the above re- sults form a logically consistent system, which may be generalized as follows: stabil- ity of answers ie connected (in the ca.se of the sample under investigation) with the negative emotional reaction to the content
5 The following simple procedure was applied in order to check, a t least tentatively, whether the observed values of P, differed significantly from 0.50. Given a table of raw data containing, say, M signs + and N signs -, the M signs + and N signs - were placed randomly in the table (using tables of random digits) in such a way that the probability of a given sign being placed in a given cell was proportional to the total number of signs in the corresponding cell of the table of raw data under consideration. The value of P, was then calculated for such a random table. The value of P, for the raw data was deemed significant if for four random tables the values of P, were lower than that calculated for the raw data. This gives the significance level 0.2. As the procedure was rather cumbersome, i t was performed only for two scales (15 and 14). I n all eight cases, the values of I ) , were considerably lower than the ones observed for the raw data (all below 0.55).
The above Monte Carlo procedure provided an insight into the statistical significance of the re- sults. It ought to be pointed out, however, that there is one more reason why the psychological results stated in this paper ought to be regarded as only tentative. The data for 56 subjects, each evaluating 14 items, were pooled together, and treated as if 56.14 subjects evaluated one item each. The effect of such pooling of the data, a rather common procedure in psychometric studies, is somewhat difficult to assess, and will not be discussed here, as the main object of this paper is to Dresent the method rather than the psychologi-
ceived as a threat, the more likely is the cafresults obtained.
Behavioral Science, Volume 18, 1973
108 MARIA NOWAKOWSKA
of items, and with previous negative experi- ence of subjects, while variability of items is connected with negative intellectual evalua- tion of both the item and the answer to it.
The above data suggest the following hy- pothesis, which explains the analysed phenomenon in terms of psychoanalytic theory:
Hypothesis. Stability of items may be a function of defense mechanisms provided that the previous experience, understood here as the specific system of expectations determining the attitude toward the item, activates some characteristic for the given subject defense mechanisms. If the percep- tion of an item is not disturbed in the above sense, then the basic factor determining stability or variability of answer is the intellectual evaluation of both the item and the answer.
4. CONCLUDING REMARKS
The problem of this paper may be re- garded from a somewhat more general point of view. First, the mathematical method, which in this paper played the role of a tool for obtaining relations bet ween variability of items and evaluations of them, may have wider applicability to all such experimental situations when the problem lies in deter- mining a relation between two variables, but standard correlation methods fail.
Second, this paper is a continuation or re- cent investigations, whose aim is not only t o study psychometric parameters of items of questionnaires, but also their psychological properties. The relations presented in this paper comprise as particular cases the hy- pothesis of Goldberg (1963) on ambiguity as a factor leading to variability and Edwards (1957) on social desirability as a factor in- fluencing stability. Both of these hypotheses can be explained by reference to defense mechanisms of psychoanalytic theory.
It appears worthwhile to search for anal- ogous laws for specific classes of items con- cerning, for instance, attitudes, evaluations, etc. The knowledge of such laws may be of practical usefulness in the construction of
questionnaires and in their use, particularly in situations of clinical interview.
Summary This paper presents the results of investi-
gations aimed at determining whether cer- tain evaluations of items can have any value in predicting the variability of answers to these items.
The variability of answers was observed through asking the same question twice in a two week period. The tool which supplied the evaluations of items had the form of 17 seven-point scales, measuring such dimen- sions of items as their intellectual evalua- tions, emotional and motivational attitude toward them, etc.
The method of analysis of data was based on the concept of minimax discrimination function. This method may have wider ap- plicability to all situations where one wants to investigate the relations between a cri- terion and some other variable or variables and the correlation methods are not ap- plicable.
The following results were obtained: the stability of an item is related tjo negative emotional reaction, to the content of the item, and to negative previous experience, while the variability is connected with negative intellectual evaluation of both the question and its answer.
REFERENCES Edwards, A. Social desirability variable in per-
sonaiity measurement and research. New York: Dryden, 1957.
Goldberg, L. R. Model of item ambiguity in per- sonality assessment. Educ. psychol. Measmt. 1963, 23, 467-492.
Goldberg, L. R., &Jones, R. R. Interrelationships among personality scale parameters; item response stability and scale reliability. Educ. psychol. Measmt., 1967, 27, 323-333.
Lehmann, E. L. Testing statistical hypotheses. New York: Wiley, 1960.
Nowakowska, M. Psychometric paradox. Acta Psychologica, 1970, 32, 126-144. (a)
Nowakowska, M. A model of answering to a ques- tionnaire item. Acta Psychologica, 1970, 34, 420-439. (b)
(Manuscript received February 17, 1972)
Behavioral Science, Volume 18. 1973


![VARIABILITY OF THE PERCEPTION ABOUT SAFETY ... Tarigan and Susilo [17] found that negative experience and dissatisfaction affect users’ preferences. All these previous studies mentioned](https://img.pdfslide.net/doc/110x75/5afde68a7f8b9a434e8e517a/variability-of-the-perception-about-safety-tarigan-and-susilo-17-found-that.jpg)