Embed Size (px)
Citation preview
© 2018 IBRACON
Volume 11, Number 2 (April 2018) p. 279 – 295 • ISSN 1983-4195DOI: http://dx.doi.org/10.1590/S1983-4195201800020004
Stiffness plasticity degradation of masonry mortar under compression: preliminar results
Perda de rigidez da argamassa de assentamento da alvenaria comprimida: resultados preliminares
a Building and Structure Department, Federal University of Santa Maria, RS, Brazil.b Civil & Environmental Department, Brigham Young University, USA.
Received: 05 May 2017 • Accepted: 13 Dec 2017 • Available Online: 9 Apr 2018
This is an open-access article distributed under the terms of the Creative Commons Attribution License
G. MOHAMAD a
F. S. FONSECA b
A. T. VERMELTFOORT b
A. LUBECK a
Abstract
Resumo
The main goal of this research is to determine the mechanical properties of bedding mortar by assessing the mortar damage onset, the stiffness plasticity degradation and the apparent Poisson´s ratio under compression. Two mortar types, 1:0.5:4 and 1:1:6 (cement:lime:sand ratio), were used and tested at 28 days; specimens had diameter-to-height (d/h) ratios of 0.3 and 1.0. These diameter-to-height (d/h) ratios were chosen to evaluate the effect of confinement caused by the friction between the steel plates of the testing machine and the sample. Numerical models were developed, and their response compared with the experimental results. From the experimental results, it was concluded that there are meaningful differences in their responses with weak and strong mortar types and different d/h ratios. The d/h ratio influences the relationship between the stress and strength and the apparent Poisson´s ratio of the specimen, which is defined herein as the ratio of the horizontal to vertical strain, regardless of cracking of the specimen. The mortar damage onset and stiffness plasticity degradation for both mortar types and d/h ratio are different and depend on the stress/strength ratio level. All samples with a d/h ratio of 0.3 show a constant decrease in the volumetric strain until failure but with negligible expansion on the horizontal deformation. In contrast, samples with a d/h ratio of 1.0 present an increase of stiffness after development of the first crack, which causes the increase of the sample volume. Numerical simulation and experimental results for mortar 1:0.5:4 with a d/h ratio of 0.3 are similar until approximately 10 MPa, after which the numerical results diverge from the experimental results. For the d/h ratio of 1.0, the vertical strain results are also similar, but the horizontal strains results near failure are very different. The model can not represent the nonlinear increase of the horizontal strain near failure probably because the crack propagation and the stiffness plasticity degradation could not be controlled. For mortar 1:1:6, vertical strains from numerical and experimental results are similar, but again the model can not reproduce the nonlinear increase of horizontal strain near failure.
Keywords: bedding mortar, damage onset, vertical strain, horizontal strain, strain difference, confinement effect.
O objetivo principal desta pesquisa é determinar as propriedades mecânicas da argamassa de assentamento à compressão, avaliando o início do dano, perda de rigidez e variação do coeficiente de Poisson aparente. Foram testados dois tipos de argamassa, com traços em volume de 1:0,5:4 e 1:1:6 (ci-mento, cal e areia), testadas aos 28 dias, com corpos de prova de prova cilíndricos com duas relações diâmetro/altura (d/h), de 0,3 e 1,0. Estas relações diâmetro/altura foram escolhidas de forma a avaliar o efeito do confinamento causado pelo atrito entre os pratos de aplicação de carga da prensa e o corpo de prova. Foram desenvolvidos, também, modelos numéricos de maneira a confrontar os resultados com os experimentais. Dos resultados experimentais conclui-se que há diferenças significativas de comportamento mecânico entre os dois tipos de argamassa e as duas relações diâmetro/altura. A relação d/h influenciou a relação tensão-deformação e o coeficiente de Poisson aparente do material, definido aqui como a relação entre as deformações específicas lateral e axial, independentemente da formação das fissuras. O início da fissuração e a perda de rigidez para os dois tipos de argamassa e relações d/h são diferentes e dependem do nível de tensão aplicado. Todas as amostras com relação d/h igual a 0,3 apresentaram decréscimo de volume específico constante até a ruptura, mas com uma pequena expansão das deformações laterais. Por outro lado, as amostras com relação d/h igual a 1,0 apresentaram um crescimento da rigidez após o aparecimento da primeira fissura, resultando em aumento do volume específico. O comportamento tensão-deformação obtido nas análises numéricas e experimentais das amostras de argamassa 1:0,5:4 com relação d/h igual a 0,3 foram similares até, aproximadamente, 10 MPa, depois disso, houve divergência entre os resultados dos dois conjuntos. Para a relação d/h igual a 1,0, as deformações específicas verticais foram si-milares, mas as deformações específicas laterais foram muito diferentes próximo à ruptura. O modelo numérico não foi capaz de representar o crescimento não linear das deformações específicas laterais próximo à ruptura porque a propagação de fissuras e a perda de rigidez não puderam ser controladas. Para a argamassa 1:1:6, as deformações específicas verticais dos modelos numéricos e experimentais foram semelhantes, mas mais uma vez não foi possível repetir o crescimento não linear das deformações específicas laterais próximo à ruptura.
Palavras-chave: argamassa de assentamento, ruptura, deformação específica vertical, deformação específica horizontal, incremento de defor-mações específicas, confinamento.
280 IBRACON Structures and Materials Journal • 2018 • vol. 11 • nº 2
Stiffness plasticity degradation of masonry mortar under compression: preliminar results
1. Introduction
Several theoretical and experimental studies have been conducted to describe the behaviour of concrete under a complex state of stresses and most of these studies depicted the nonlinearity of concrete through plasticity models, damage models or a combi-nation thereof [1-6]. In contrast, structural masonry is considered anisotropic and has not received the same attention as its concrete counterpart. Only a few studies have been conducted on the fail-ure mechanism of masonry under a complex state of stresses and these studies have focused on the testing of the components [7-26]. For concrete block masonry mortar is usually the soft compo-nent due to its high water-cement ratio and may actually control the deformation of the masonry [27-28]. Therefore, the primary goal of this research is to evaluate the mechanical properties of bedding mortar by assessing its damage onset, stiffness plasticity degrada-tion and apparent Poisson´s ratio under compression for different diameter/height (d/h) ratios, focusing on the material strain behav-iour under loading until failure. The results of the pilot testing pre-sented herein are preliminary and require further validation.
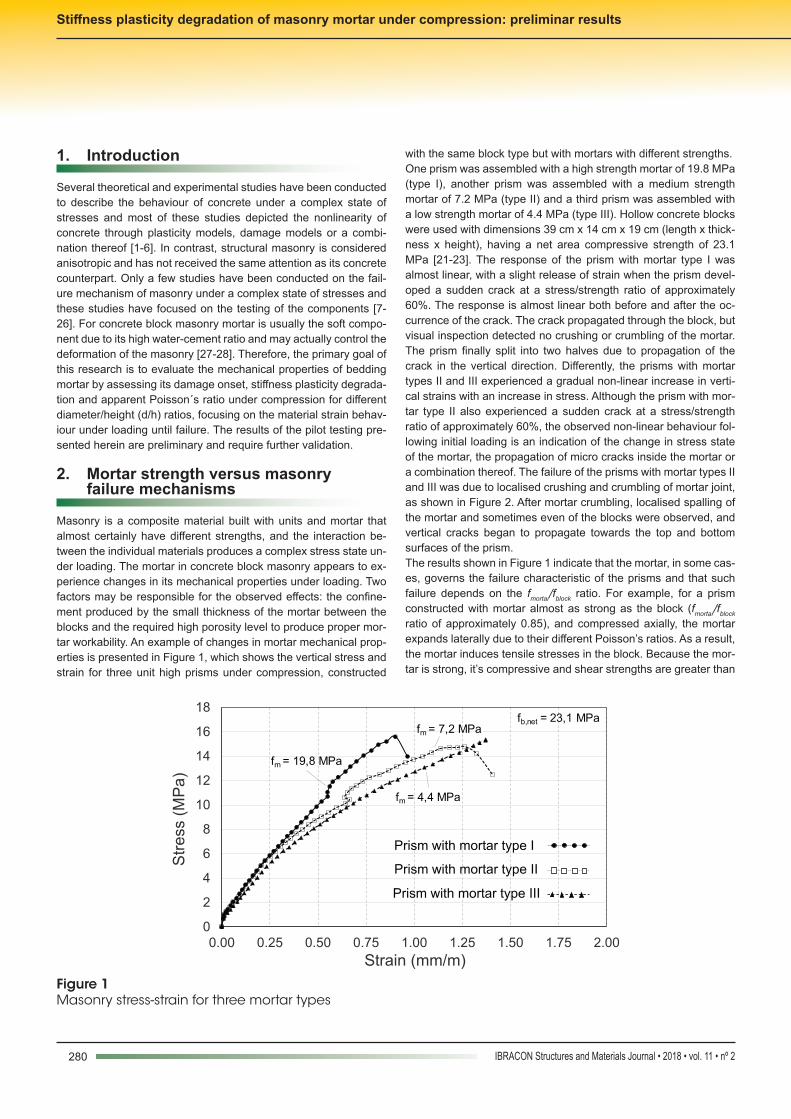
2. Mortar strength versus masonry failure mechanisms Masonry is a composite material built with units and mortar that almost certainly have different strengths, and the interaction be-tween the individual materials produces a complex stress state un-der loading. The mortar in concrete block masonry appears to ex-perience changes in its mechanical properties under loading. Two factors may be responsible for the observed effects: the confine-ment produced by the small thickness of the mortar between the blocks and the required high porosity level to produce proper mor-tar workability. An example of changes in mortar mechanical prop-erties is presented in Figure 1, which shows the vertical stress and strain for three unit high prisms under compression, constructed
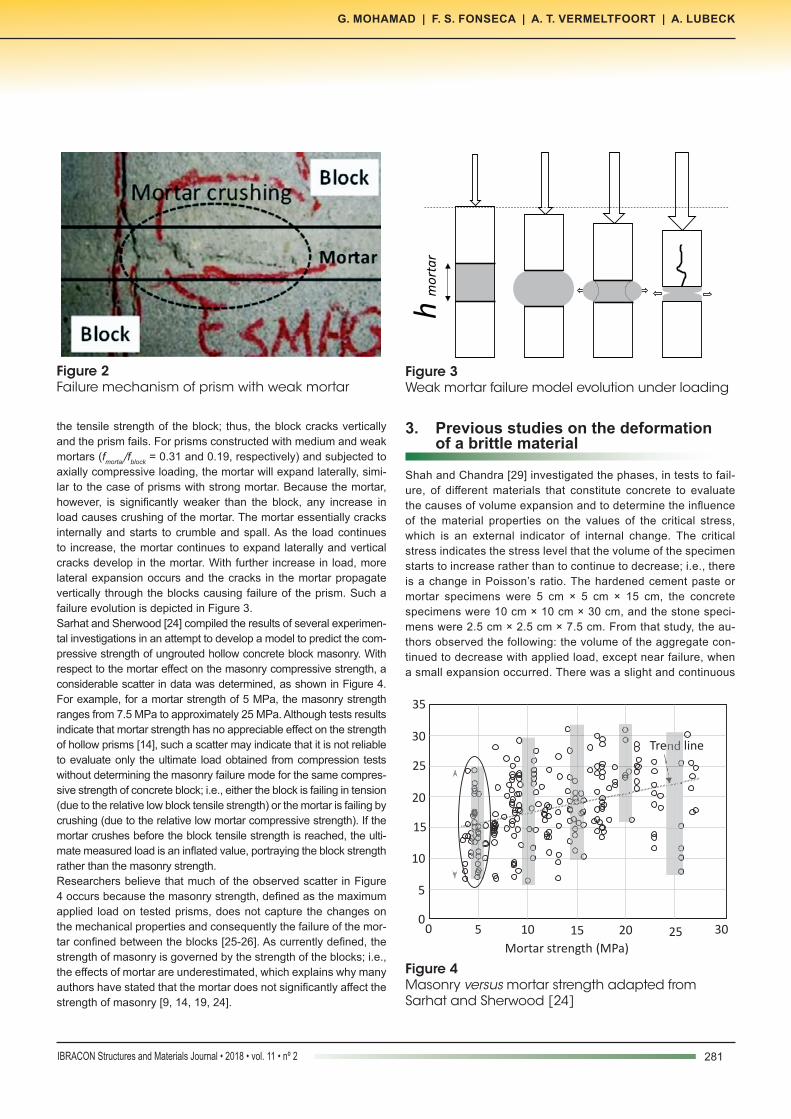
with the same block type but with mortars with different strengths. One prism was assembled with a high strength mortar of 19.8 MPa (type I), another prism was assembled with a medium strength mortar of 7.2 MPa (type II) and a third prism was assembled with a low strength mortar of 4.4 MPa (type III). Hollow concrete blocks were used with dimensions 39 cm x 14 cm x 19 cm (length x thick-ness x height), having a net area compressive strength of 23.1 MPa [21-23]. The response of the prism with mortar type I was almost linear, with a slight release of strain when the prism devel-oped a sudden crack at a stress/strength ratio of approximately 60%. The response is almost linear both before and after the oc-currence of the crack. The crack propagated through the block, but visual inspection detected no crushing or crumbling of the mortar. The prism finally split into two halves due to propagation of the crack in the vertical direction. Differently, the prisms with mortar types II and III experienced a gradual non-linear increase in verti-cal strains with an increase in stress. Although the prism with mor-tar type II also experienced a sudden crack at a stress/strength ratio of approximately 60%, the observed non-linear behaviour fol-lowing initial loading is an indication of the change in stress state of the mortar, the propagation of micro cracks inside the mortar or a combination thereof. The failure of the prisms with mortar types II and III was due to localised crushing and crumbling of mortar joint, as shown in Figure 2. After mortar crumbling, localised spalling of the mortar and sometimes even of the blocks were observed, and vertical cracks began to propagate towards the top and bottom surfaces of the prism.The results shown in Figure 1 indicate that the mortar, in some cas-es, governs the failure characteristic of the prisms and that such failure depends on the fmortar/fblock ratio. For example, for a prism constructed with mortar almost as strong as the block (fmortar/fblock ratio of approximately 0.85), and compressed axially, the mortar expands laterally due to their different Poisson’s ratios. As a result, the mortar induces tensile stresses in the block. Because the mor-tar is strong, it’s compressive and shear strengths are greater than
Figure 1Masonry stress-strain for three mortar types
281IBRACON Structures and Materials Journal • 2018 • vol. 11 • nº 2
G. MOHAMAD | F. S. FONSECA | A. T. VERMELTFOORT | A. LUBECK
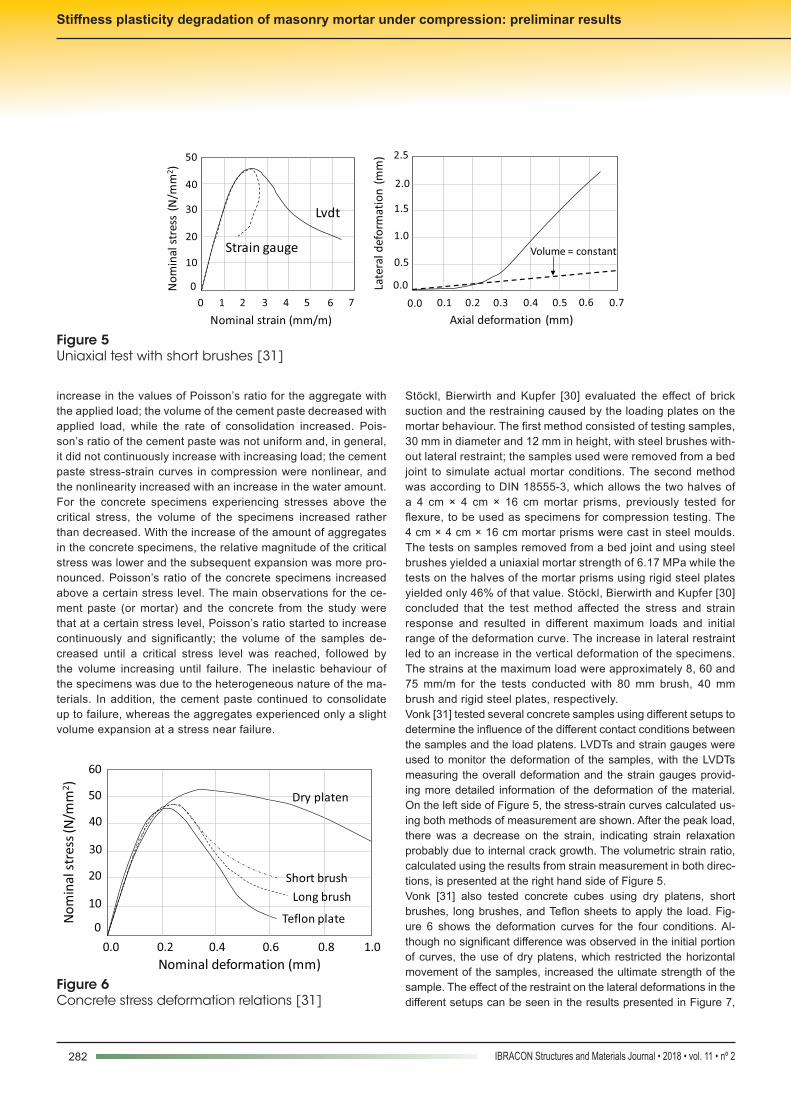
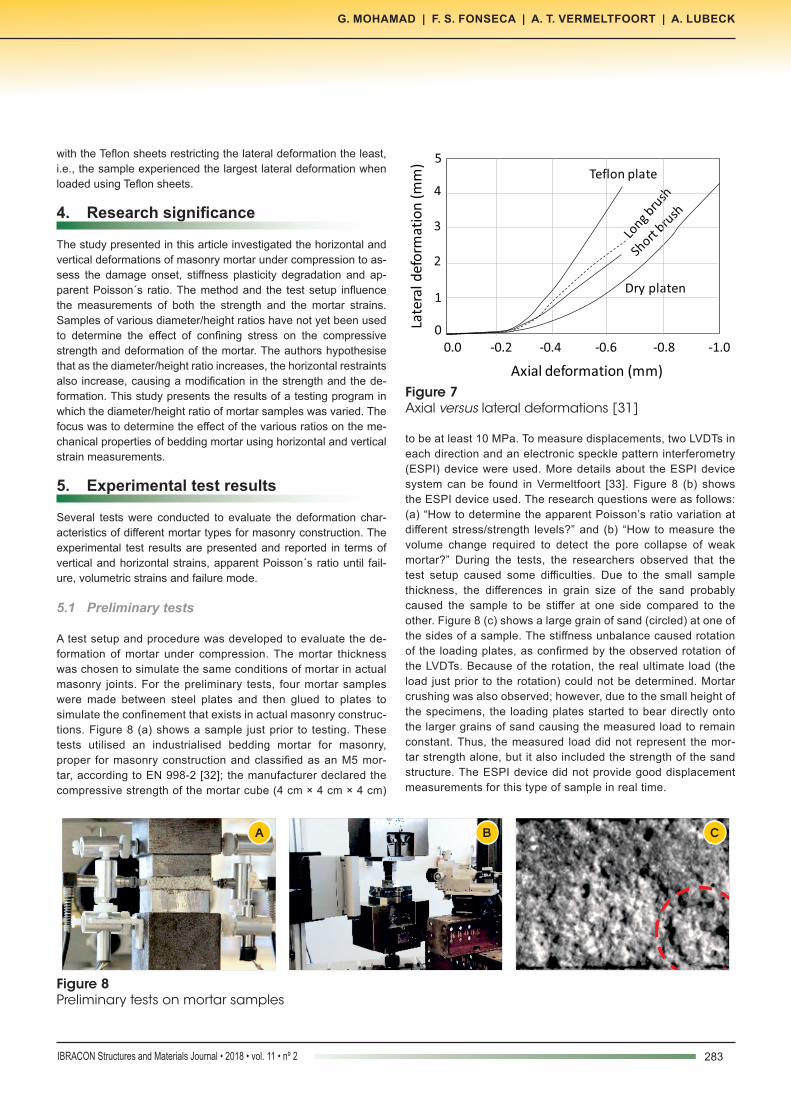
the tensile strength of the block; thus, the block cracks vertically and the prism fails. For prisms constructed with medium and weak mortars (fmortar/fblock = 0.31 and 0.19, respectively) and subjected to axially compressive loading, the mortar will expand laterally, simi-lar to the case of prisms with strong mortar. Because the mortar, however, is significantly weaker than the block, any increase in load causes crushing of the mortar. The mortar essentially cracks internally and starts to crumble and spall. As the load continues to increase, the mortar continues to expand laterally and vertical cracks develop in the mortar. With further increase in load, more lateral expansion occurs and the cracks in the mortar propagate vertically through the blocks causing failure of the prism. Such a failure evolution is depicted in Figure 3.Sarhat and Sherwood [24] compiled the results of several experimen-tal investigations in an attempt to develop a model to predict the com-pressive strength of ungrouted hollow concrete block masonry. With respect to the mortar effect on the masonry compressive strength, a considerable scatter in data was determined, as shown in Figure 4. For example, for a mortar strength of 5 MPa, the masonry strength ranges from 7.5 MPa to approximately 25 MPa. Although tests results indicate that mortar strength has no appreciable effect on the strength of hollow prisms [14], such a scatter may indicate that it is not reliable to evaluate only the ultimate load obtained from compression tests without determining the masonry failure mode for the same compres-sive strength of concrete block; i.e., either the block is failing in tension (due to the relative low block tensile strength) or the mortar is failing by crushing (due to the relative low mortar compressive strength). If the mortar crushes before the block tensile strength is reached, the ulti-mate measured load is an inflated value, portraying the block strength rather than the masonry strength.Researchers believe that much of the observed scatter in Figure 4 occurs because the masonry strength, defined as the maximum applied load on tested prisms, does not capture the changes on the mechanical properties and consequently the failure of the mor-tar confined between the blocks [25-26]. As currently defined, the strength of masonry is governed by the strength of the blocks; i.e., the effects of mortar are underestimated, which explains why many authors have stated that the mortar does not significantly affect the strength of masonry [9, 14, 19, 24].
3. Previous studies on the deformation of a brittle material
Shah and Chandra [29] investigated the phases, in tests to fail-ure, of different materials that constitute concrete to evaluate the causes of volume expansion and to determine the influence of the material properties on the values of the critical stress, which is an external indicator of internal change. The critical stress indicates the stress level that the volume of the specimen starts to increase rather than to continue to decrease; i.e., there is a change in Poisson’s ratio. The hardened cement paste or mortar specimens were 5 cm × 5 cm × 15 cm, the concrete specimens were 10 cm × 10 cm × 30 cm, and the stone speci-mens were 2.5 cm × 2.5 cm × 7.5 cm. From that study, the au-thors observed the following: the volume of the aggregate con-tinued to decrease with applied load, except near failure, when a small expansion occurred. There was a slight and continuous
Figure 2Failure mechanism of prism with weak mortar
Figure 3Weak mortar failure model evolution under loading
Figure 4Masonry versus mortar strength adapted from Sarhat and Sherwood [24]
282 IBRACON Structures and Materials Journal • 2018 • vol. 11 • nº 2
Stiffness plasticity degradation of masonry mortar under compression: preliminar results
increase in the values of Poisson’s ratio for the aggregate with the applied load; the volume of the cement paste decreased with applied load, while the rate of consolidation increased. Pois-son’s ratio of the cement paste was not uniform and, in general, it did not continuously increase with increasing load; the cement paste stress-strain curves in compression were nonlinear, and the nonlinearity increased with an increase in the water amount. For the concrete specimens experiencing stresses above the critical stress, the volume of the specimens increased rather than decreased. With the increase of the amount of aggregates in the concrete specimens, the relative magnitude of the critical stress was lower and the subsequent expansion was more pro-nounced. Poisson’s ratio of the concrete specimens increased above a certain stress level. The main observations for the ce-ment paste (or mortar) and the concrete from the study were that at a certain stress level, Poisson’s ratio started to increase continuously and significantly; the volume of the samples de-creased until a critical stress level was reached, followed by the volume increasing until failure. The inelastic behaviour of the specimens was due to the heterogeneous nature of the ma-terials. In addition, the cement paste continued to consolidate up to failure, whereas the aggregates experienced only a slight volume expansion at a stress near failure.
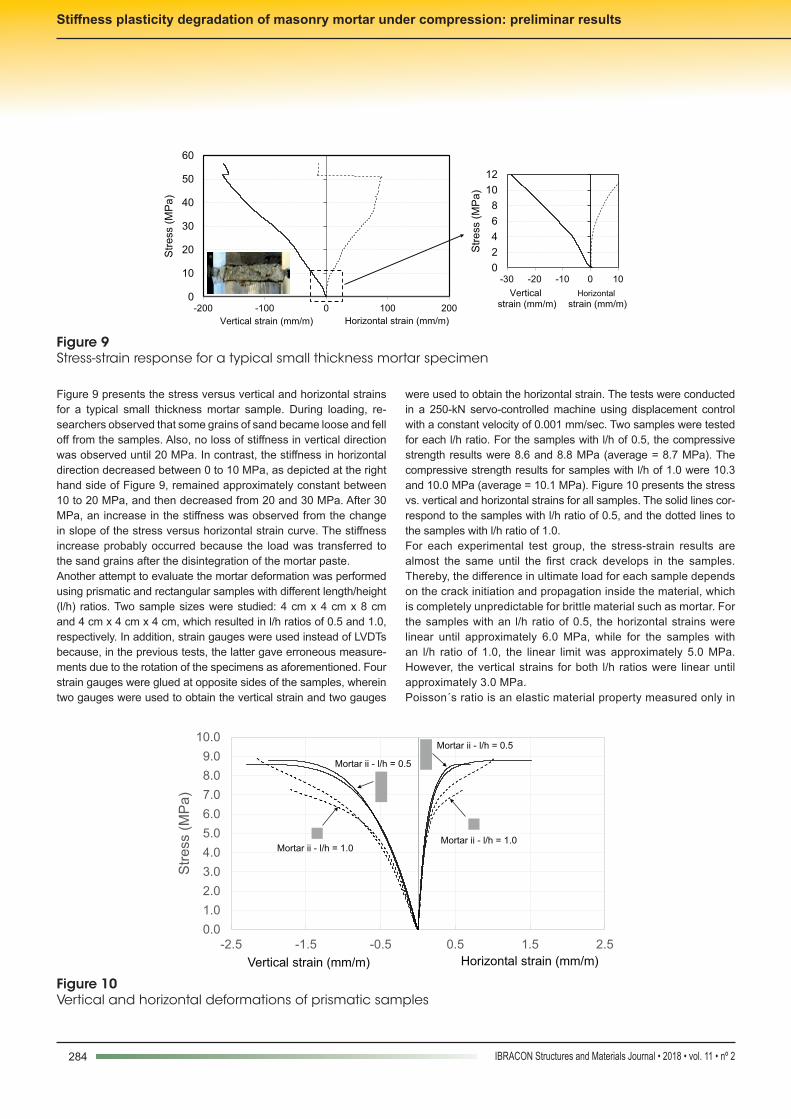
Stöckl, Bierwirth and Kupfer [30] evaluated the effect of brick suction and the restraining caused by the loading plates on the mortar behaviour. The first method consisted of testing samples, 30 mm in diameter and 12 mm in height, with steel brushes with-out lateral restraint; the samples used were removed from a bed joint to simulate actual mortar conditions. The second method was according to DIN 18555-3, which allows the two halves of a 4 cm × 4 cm × 16 cm mortar prisms, previously tested for flexure, to be used as specimens for compression testing. The 4 cm × 4 cm × 16 cm mortar prisms were cast in steel moulds. The tests on samples removed from a bed joint and using steel brushes yielded a uniaxial mortar strength of 6.17 MPa while the tests on the halves of the mortar prisms using rigid steel plates yielded only 46% of that value. Stöckl, Bierwirth and Kupfer [30] concluded that the test method affected the stress and strain response and resulted in different maximum loads and initial range of the deformation curve. The increase in lateral restraint led to an increase in the vertical deformation of the specimens. The strains at the maximum load were approximately 8, 60 and 75 mm/m for the tests conducted with 80 mm brush, 40 mm brush and rigid steel plates, respectively.Vonk [31] tested several concrete samples using different setups to determine the influence of the different contact conditions between the samples and the load platens. LVDTs and strain gauges were used to monitor the deformation of the samples, with the LVDTs measuring the overall deformation and the strain gauges provid-ing more detailed information of the deformation of the material. On the left side of Figure 5, the stress-strain curves calculated us-ing both methods of measurement are shown. After the peak load, there was a decrease on the strain, indicating strain relaxation probably due to internal crack growth. The volumetric strain ratio, calculated using the results from strain measurement in both direc-tions, is presented at the right hand side of Figure 5. Vonk [31] also tested concrete cubes using dry platens, short brushes, long brushes, and Teflon sheets to apply the load. Fig-ure 6 shows the deformation curves for the four conditions. Al-though no significant difference was observed in the initial portion of curves, the use of dry platens, which restricted the horizontal movement of the samples, increased the ultimate strength of the sample. The effect of the restraint on the lateral deformations in the different setups can be seen in the results presented in Figure 7,
Figure 5Uniaxial test with short brushes [31]
Late
ral d
efo
rmat
ion
(m
m)
Axial deformation (mm)
0.10.0 0.2 0.3 0.4 0.5 0.6 0.7
0.0
0.5
1.0
1.5
2.0
2.5
Volume = constant
No
min
al s
tres
s (N
/mm
2 )
0
Nominal strain (mm/m)
1 2 3 4 5 6 7
10
20
30
40
50
0
Lvdt
Strain gauge
Figure 6Concrete stress deformation relations [31]
10
20
30
40
50
60
0
0.20.0 0.4 0.6 0.8 1.0
No
min
al s
tres
s (N
/mm
2 )
Nominal deformation (mm)
Dry platen
Short brush
Long brush
Teflon plate
283IBRACON Structures and Materials Journal • 2018 • vol. 11 • nº 2
G. MOHAMAD | F. S. FONSECA | A. T. VERMELTFOORT | A. LUBECK
with the Teflon sheets restricting the lateral deformation the least, i.e., the sample experienced the largest lateral deformation when loaded using Teflon sheets.
4. Research significance
The study presented in this article investigated the horizontal and vertical deformations of masonry mortar under compression to as-sess the damage onset, stiffness plasticity degradation and ap-parent Poisson´s ratio. The method and the test setup influence the measurements of both the strength and the mortar strains. Samples of various diameter/height ratios have not yet been used to determine the effect of confining stress on the compressive strength and deformation of the mortar. The authors hypothesise that as the diameter/height ratio increases, the horizontal restraints also increase, causing a modification in the strength and the de-formation. This study presents the results of a testing program in which the diameter/height ratio of mortar samples was varied. The focus was to determine the effect of the various ratios on the me-chanical properties of bedding mortar using horizontal and vertical strain measurements.
5. Experimental test results
Several tests were conducted to evaluate the deformation char-acteristics of different mortar types for masonry construction. The experimental test results are presented and reported in terms of vertical and horizontal strains, apparent Poisson´s ratio until fail-ure, volumetric strains and failure mode.
5.1 Preliminary tests
A test setup and procedure was developed to evaluate the de-formation of mortar under compression. The mortar thickness was chosen to simulate the same conditions of mortar in actual masonry joints. For the preliminary tests, four mortar samples were made between steel plates and then glued to plates to simulate the confinement that exists in actual masonry construc-tions. Figure 8 (a) shows a sample just prior to testing. These tests utilised an industrialised bedding mortar for masonry, proper for masonry construction and classified as an M5 mor-tar, according to EN 998-2 [32]; the manufacturer declared the compressive strength of the mortar cube (4 cm × 4 cm × 4 cm)
to be at least 10 MPa. To measure displacements, two LVDTs in each direction and an electronic speckle pattern interferometry (ESPI) device were used. More details about the ESPI device system can be found in Vermeltfoort [33]. Figure 8 (b) shows the ESPI device used. The research questions were as follows: (a) “How to determine the apparent Poisson’s ratio variation at different stress/strength levels?” and (b) “How to measure the volume change required to detect the pore collapse of weak mortar?” During the tests, the researchers observed that the test setup caused some difficulties. Due to the small sample thickness, the differences in grain size of the sand probably caused the sample to be stiffer at one side compared to the other. Figure 8 (c) shows a large grain of sand (circled) at one of the sides of a sample. The stiffness unbalance caused rotation of the loading plates, as confirmed by the observed rotation of the LVDTs. Because of the rotation, the real ultimate load (the load just prior to the rotation) could not be determined. Mortar crushing was also observed; however, due to the small height of the specimens, the loading plates started to bear directly onto the larger grains of sand causing the measured load to remain constant. Thus, the measured load did not represent the mor-tar strength alone, but it also included the strength of the sand structure. The ESPI device did not provide good displacement measurements for this type of sample in real time.
Figure 7Axial versus lateral deformations [31]
1
2
3
4
5
0-0.20.0 -0.4 -0.6 -0.8 -1.0
Late
ral d
efo
rmat
ion
(m
m)
Axial deformation (mm)
Dry platen
Teflon plate
Figure 8Preliminary tests on mortar samples
A B C
284 IBRACON Structures and Materials Journal • 2018 • vol. 11 • nº 2
Stiffness plasticity degradation of masonry mortar under compression: preliminar results
Figure 9 presents the stress versus vertical and horizontal strains for a typical small thickness mortar sample. During loading, re-searchers observed that some grains of sand became loose and fell off from the samples. Also, no loss of stiffness in vertical direction was observed until 20 MPa. In contrast, the stiffness in horizontal direction decreased between 0 to 10 MPa, as depicted at the right hand side of Figure 9, remained approximately constant between 10 to 20 MPa, and then decreased from 20 and 30 MPa. After 30 MPa, an increase in the stiffness was observed from the change in slope of the stress versus horizontal strain curve. The stiffness increase probably occurred because the load was transferred to the sand grains after the disintegration of the mortar paste.Another attempt to evaluate the mortar deformation was performed using prismatic and rectangular samples with different length/height (l/h) ratios. Two sample sizes were studied: 4 cm x 4 cm x 8 cm and 4 cm x 4 cm x 4 cm, which resulted in l/h ratios of 0.5 and 1.0, respectively. In addition, strain gauges were used instead of LVDTs because, in the previous tests, the latter gave erroneous measure-ments due to the rotation of the specimens as aforementioned. Four strain gauges were glued at opposite sides of the samples, wherein two gauges were used to obtain the vertical strain and two gauges
were used to obtain the horizontal strain. The tests were conducted in a 250-kN servo-controlled machine using displacement control with a constant velocity of 0.001 mm/sec. Two samples were tested for each l/h ratio. For the samples with l/h of 0.5, the compressive strength results were 8.6 and 8.8 MPa (average = 8.7 MPa). The compressive strength results for samples with l/h of 1.0 were 10.3 and 10.0 MPa (average = 10.1 MPa). Figure 10 presents the stress vs. vertical and horizontal strains for all samples. The solid lines cor-respond to the samples with l/h ratio of 0.5, and the dotted lines to the samples with l/h ratio of 1.0. For each experimental test group, the stress-strain results are almost the same until the first crack develops in the samples. Thereby, the difference in ultimate load for each sample depends on the crack initiation and propagation inside the material, which is completely unpredictable for brittle material such as mortar. For the samples with an l/h ratio of 0.5, the horizontal strains were linear until approximately 6.0 MPa, while for the samples with an l/h ratio of 1.0, the linear limit was approximately 5.0 MPa. However, the vertical strains for both l/h ratios were linear until approximately 3.0 MPa. Poisson´s ratio is an elastic material property measured only in
Figure 9Stress-strain response for a typical small thickness mortar specimen
0
10
20
30
40
50
60
-200 -100 0 100 200
Str
ess
(M
Pa)
Vertical strain (mm/m) Horizontal strain (mm/m)
0
2
4
6
8
10
12
-30 -20 -10 0 10
Str
ess
(M
Pa)
Vertical strain (mm/m)
Horizontal
strain (mm/m)
Figure 10Vertical and horizontal deformations of prismatic samples
0.0
1.0
2.0
3.0
4.0
5.0
6.0
7.0
8.0
9.0
10.0
-2.5 -1.5 -0.5 0.5 1.5 2.5
Str
ess
(M
Pa
)
Vertical strain (mm/m)
Mortar ii - l/h = 0.5
Mortar ii - l/h = 0.5
Mortar ii - l/h = 1.0Mortar ii - l/h = 1.0
Horizontal strain (mm/m)
285IBRACON Structures and Materials Journal • 2018 • vol. 11 • nº 2
G. MOHAMAD | F. S. FONSECA | A. T. VERMELTFOORT | A. LUBECK
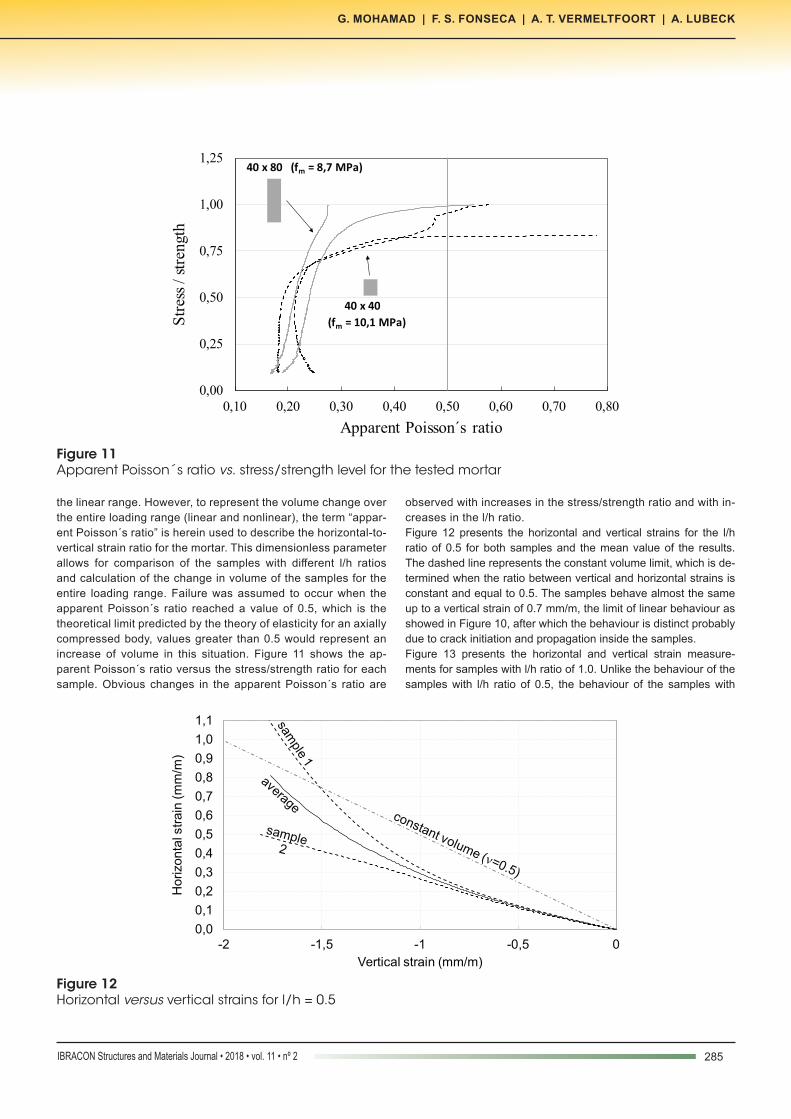
the linear range. However, to represent the volume change over the entire loading range (linear and nonlinear), the term “appar-ent Poisson´s ratio” is herein used to describe the horizontal-to-vertical strain ratio for the mortar. This dimensionless parameter allows for comparison of the samples with different l/h ratios and calculation of the change in volume of the samples for the entire loading range. Failure was assumed to occur when the apparent Poisson´s ratio reached a value of 0.5, which is the theoretical limit predicted by the theory of elasticity for an axially compressed body, values greater than 0.5 would represent an increase of volume in this situation. Figure 11 shows the ap-parent Poisson´s ratio versus the stress/strength ratio for each sample. Obvious changes in the apparent Poisson´s ratio are
observed with increases in the stress/strength ratio and with in-creases in the l/h ratio. Figure 12 presents the horizontal and vertical strains for the l/h ratio of 0.5 for both samples and the mean value of the results. The dashed line represents the constant volume limit, which is de-termined when the ratio between vertical and horizontal strains is constant and equal to 0.5. The samples behave almost the same up to a vertical strain of 0.7 mm/m, the limit of linear behaviour as showed in Figure 10, after which the behaviour is distinct probably due to crack initiation and propagation inside the samples. Figure 13 presents the horizontal and vertical strain measure-ments for samples with l/h ratio of 1.0. Unlike the behaviour of the samples with l/h ratio of 0.5, the behaviour of the samples with
Figure 11Apparent Poisson´s ratio vs. stress/strength level for the tested mortar
0,00
0,25
0,50
0,75
1,00
1,25
0,10 0,20 0,30 0,40 0,50 0,60 0,70 0,80
Str
ess
/ st
reng
th
Apparent Poisson´s ratio
40 x 40
40 x 80 (fm = 8,7 MPa)
(fm = 10,1 MPa)
Figure 12Horizontal versus vertical strains for l/h = 0.5
0,0
0,1
0,2
0,3
0,4
0,5
0,6
0,7
0,8
0,9
1,0
1,1
-2 -1,5 -1 -0,5 0
Ho
rizo
nta
l str
ain
(m
m/m
)
Vertical strain (mm/m)
286 IBRACON Structures and Materials Journal • 2018 • vol. 11 • nº 2
Stiffness plasticity degradation of masonry mortar under compression: preliminar results
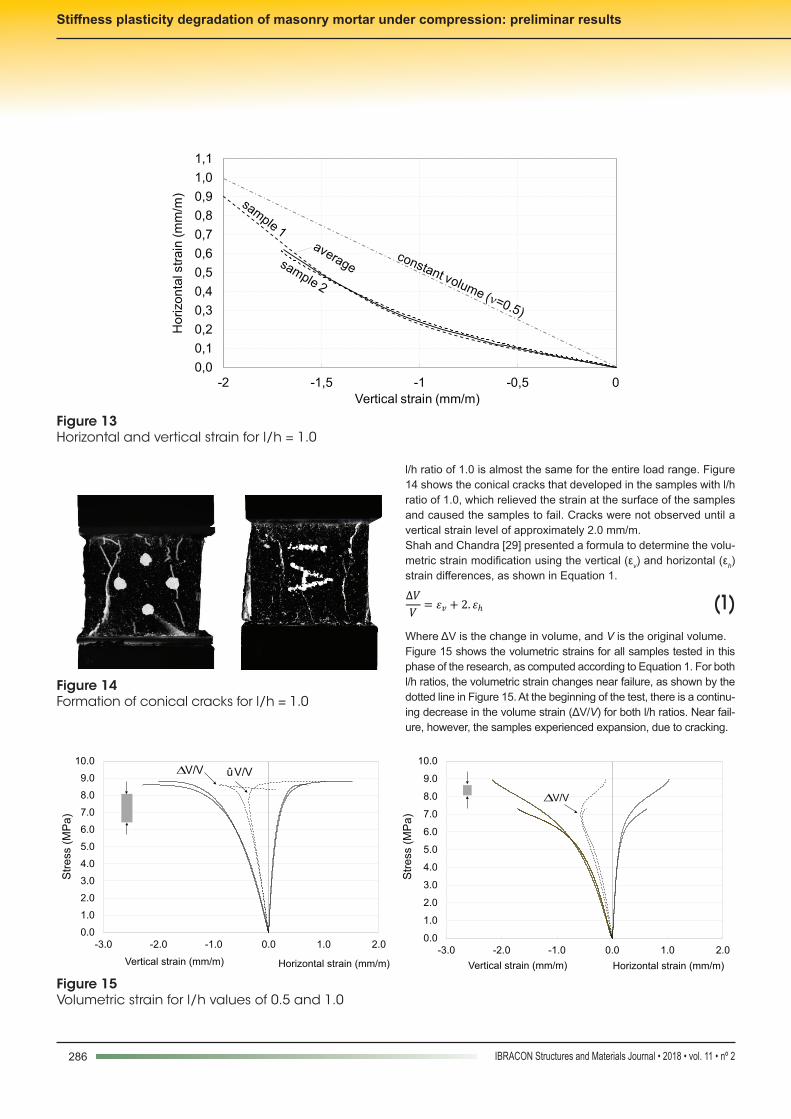
l/h ratio of 1.0 is almost the same for the entire load range. Figure 14 shows the conical cracks that developed in the samples with l/h ratio of 1.0, which relieved the strain at the surface of the samples and caused the samples to fail. Cracks were not observed until a vertical strain level of approximately 2.0 mm/m. Shah and Chandra [29] presented a formula to determine the volu-metric strain modification using the vertical (εv) and horizontal (εh) strain differences, as shown in Equation 1.
(1)Where ΔV is the change in volume, and V is the original volume.Figure 15 shows the volumetric strains for all samples tested in this phase of the research, as computed according to Equation 1. For both l/h ratios, the volumetric strain changes near failure, as shown by the dotted line in Figure 15. At the beginning of the test, there is a continu-ing decrease in the volume strain (ΔV/V) for both l/h ratios. Near fail-ure, however, the samples experienced expansion, due to cracking.
Figure 13Horizontal and vertical strain for l/h = 1.0
0,0
0,1
0,2
0,3
0,4
0,5
0,6
0,7
0,8
0,9
1,0
1,1
-2 -1,5 -1 -0,5 0
Ho
rizo
nta
l str
ain
(m
m/m
)
Vertical strain (mm/m)
Figure 14Formation of conical cracks for l/h = 1.0
Figure 15Volumetric strain for l/h values of 0.5 and 1.0
0.0
1.0
2.0
3.0
4.0
5.0
6.0
7.0
8.0
9.0
10.0
-3.0 -2.0 -1.0 0.0 1.0 2.0
Str
ess
(M
Pa
)
Vertical strain (mm/m)
DV/V
Horizontal strain (mm/m)
ûV/V
0.0
1.0
2.0
3.0
4.0
5.0
6.0
7.0
8.0
9.0
10.0
-3.0 -2.0 -1.0 0.0 1.0 2.0
Str
ess
(M
Pa
)
Vertical strain (mm/m)
DV/V
Horizontal strain (mm/m)
287IBRACON Structures and Materials Journal • 2018 • vol. 11 • nº 2
G. MOHAMAD | F. S. FONSECA | A. T. VERMELTFOORT | A. LUBECK
5.2 Tests on cylindrical samples
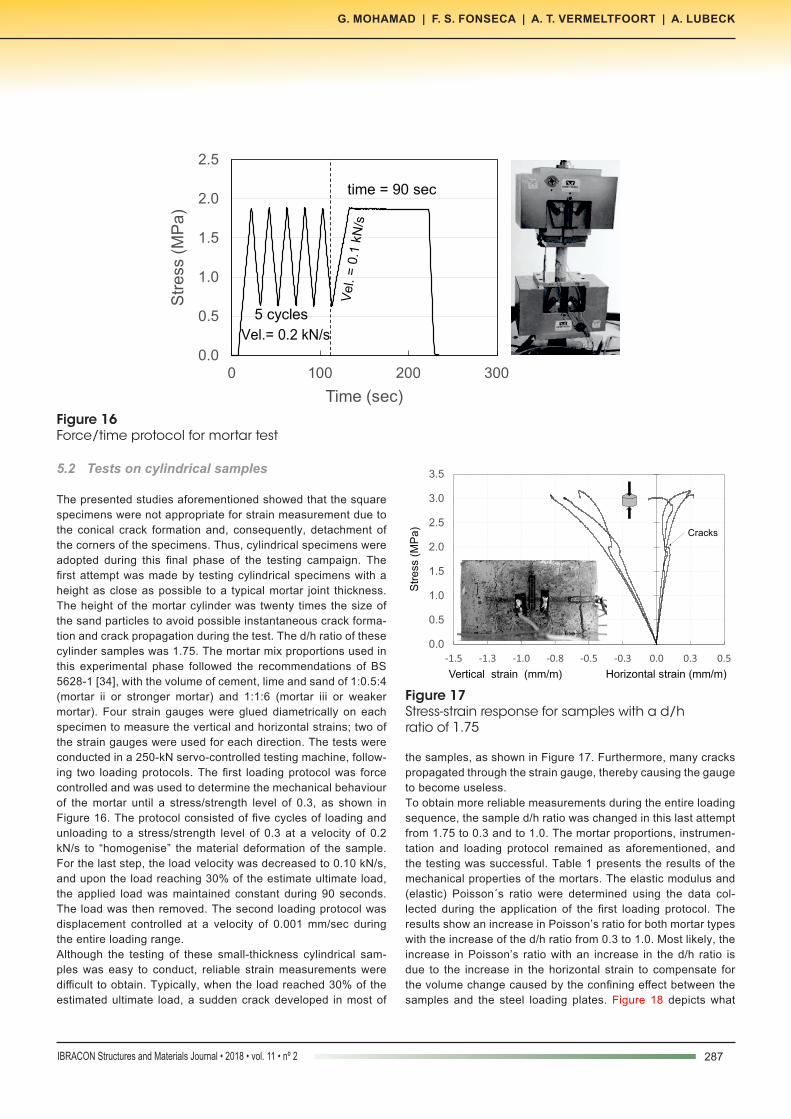
The presented studies aforementioned showed that the square specimens were not appropriate for strain measurement due to the conical crack formation and, consequently, detachment of the corners of the specimens. Thus, cylindrical specimens were adopted during this final phase of the testing campaign. The first attempt was made by testing cylindrical specimens with a height as close as possible to a typical mortar joint thickness. The height of the mortar cylinder was twenty times the size of the sand particles to avoid possible instantaneous crack forma-tion and crack propagation during the test. The d/h ratio of these cylinder samples was 1.75. The mortar mix proportions used in this experimental phase followed the recommendations of BS 5628-1 [34], with the volume of cement, lime and sand of 1:0.5:4 (mortar ii or stronger mortar) and 1:1:6 (mortar iii or weaker mortar). Four strain gauges were glued diametrically on each specimen to measure the vertical and horizontal strains; two of the strain gauges were used for each direction. The tests were conducted in a 250-kN servo-controlled testing machine, follow-ing two loading protocols. The first loading protocol was force controlled and was used to determine the mechanical behaviour of the mortar until a stress/strength level of 0.3, as shown in Figure 16. The protocol consisted of five cycles of loading and unloading to a stress/strength level of 0.3 at a velocity of 0.2 kN/s to “homogenise” the material deformation of the sample. For the last step, the load velocity was decreased to 0.10 kN/s, and upon the load reaching 30% of the estimate ultimate load, the applied load was maintained constant during 90 seconds. The load was then removed. The second loading protocol was displacement controlled at a velocity of 0.001 mm/sec during the entire loading range.Although the testing of these small-thickness cylindrical sam-ples was easy to conduct, reliable strain measurements were difficult to obtain. Typically, when the load reached 30% of the estimated ultimate load, a sudden crack developed in most of
the samples, as shown in Figure 17. Furthermore, many cracks propagated through the strain gauge, thereby causing the gauge to become useless.To obtain more reliable measurements during the entire loading sequence, the sample d/h ratio was changed in this last attempt from 1.75 to 0.3 and to 1.0. The mortar proportions, instrumen-tation and loading protocol remained as aforementioned, and the testing was successful. Table 1 presents the results of the mechanical properties of the mortars. The elastic modulus and (elastic) Poisson´s ratio were determined using the data col-lected during the application of the first loading protocol. The results show an increase in Poisson’s ratio for both mortar types with the increase of the d/h ratio from 0.3 to 1.0. Most likely, the increase in Poisson’s ratio with an increase in the d/h ratio is due to the increase in the horizontal strain to compensate for the volume change caused by the confining effect between the samples and the steel loading plates. Figure 18 depicts what
Figure 16Force/time protocol for mortar test
0.0
0.5
1.0
1.5
2.0
2.5
0 100 200 300
Str
ess
(M
Pa
)
Time (sec)
5 cycles
Vel.= 0.2 kN/s
time = 90 sec
Figure 17Stress-strain response for samples with a d/h ratio of 1.75
0.0
0.5
1.0
1.5
2.0
2.5
3.0
3.5
-1.5 -1.3 -1.0 -0.8 -0.5 -0.3 0.0 0.3 0.5
Str
ess (
MP
a)
Vertical strain (mm/m) Horizontal strain (mm/m)
Cracks
288 IBRACON Structures and Materials Journal • 2018 • vol. 11 • nº 2
Stiffness plasticity degradation of masonry mortar under compression: preliminar results
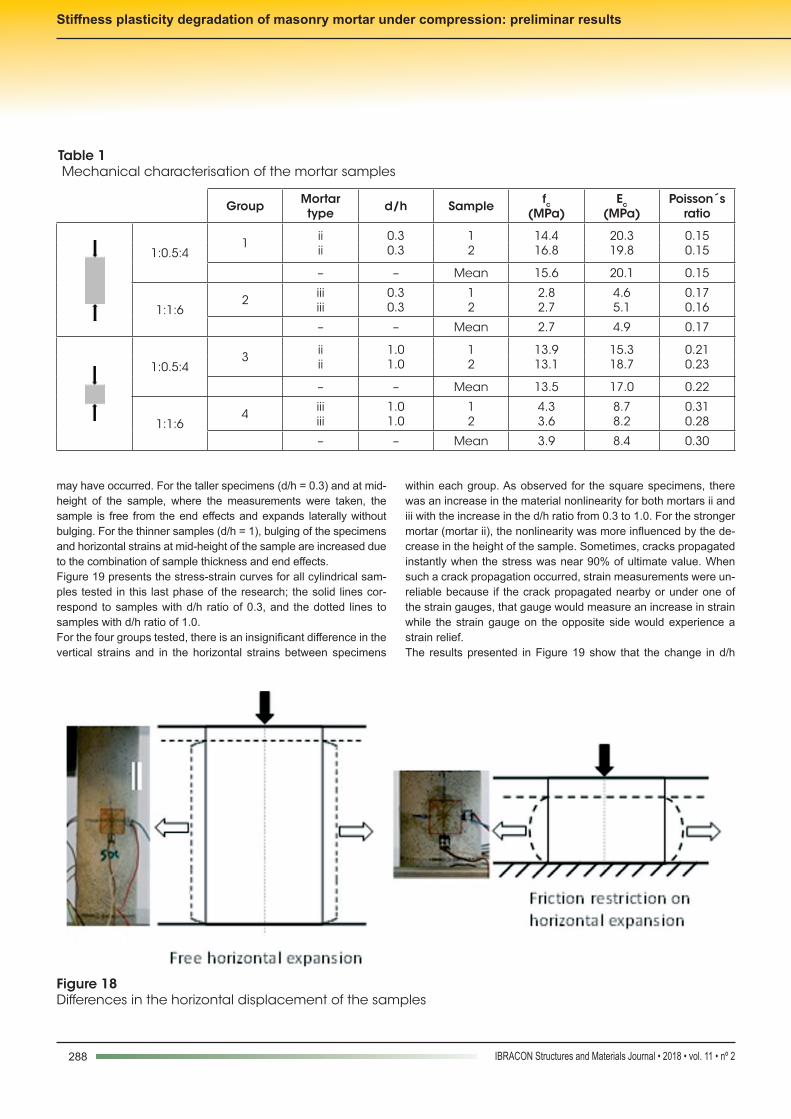
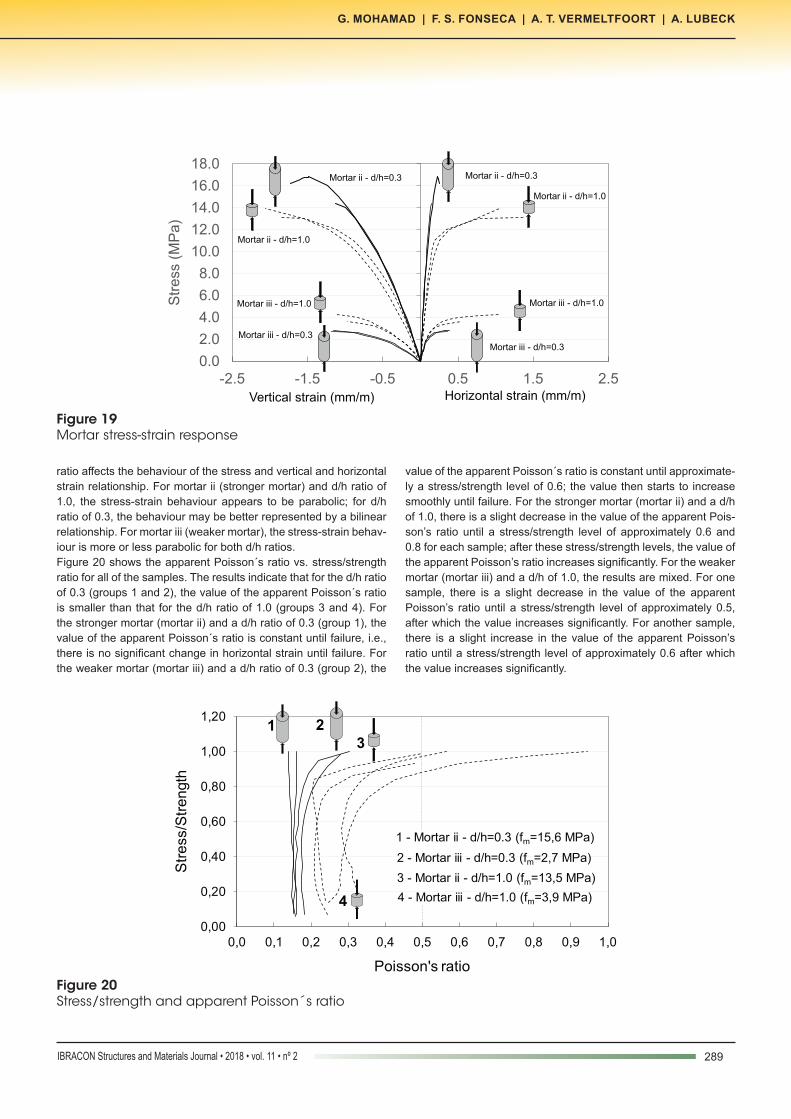
may have occurred. For the taller specimens (d/h = 0.3) and at mid-height of the sample, where the measurements were taken, the sample is free from the end effects and expands laterally without bulging. For the thinner samples (d/h = 1), bulging of the specimens and horizontal strains at mid-height of the sample are increased due to the combination of sample thickness and end effects. Figure 19 presents the stress-strain curves for all cylindrical sam-ples tested in this last phase of the research; the solid lines cor-respond to samples with d/h ratio of 0.3, and the dotted lines to samples with d/h ratio of 1.0.For the four groups tested, there is an insignificant difference in the vertical strains and in the horizontal strains between specimens
within each group. As observed for the square specimens, there was an increase in the material nonlinearity for both mortars ii and iii with the increase in the d/h ratio from 0.3 to 1.0. For the stronger mortar (mortar ii), the nonlinearity was more influenced by the de-crease in the height of the sample. Sometimes, cracks propagated instantly when the stress was near 90% of ultimate value. When such a crack propagation occurred, strain measurements were un-reliable because if the crack propagated nearby or under one of the strain gauges, that gauge would measure an increase in strain while the strain gauge on the opposite side would experience a strain relief. The results presented in Figure 19 show that the change in d/h
Table 1 Mechanical characterisation of the mortar samples
Group Mortartype d/h Sample fc
(MPa)Ec
(MPa)Poisson´s
ratio
1:0.5:41 ii
ii0.30.3
12
14.416.8
20.319.8
0.150.15
– – Mean 15.6 20.1 0.15
1:1:62 iii
iii0.30.3
12
2.82.7
4.65.1
0.170.16
– – Mean 2.7 4.9 0.17
1:0.5:43 ii
ii1.01.0
12
13.913.1
15.318.7
0.210.23
– – Mean 13.5 17.0 0.22
1:1:64 iii
iii1.01.0
12
4.33.6
8.78.2
0.310.28
– – Mean 3.9 8.4 0.30
Figure 18Differences in the horizontal displacement of the samples
289IBRACON Structures and Materials Journal • 2018 • vol. 11 • nº 2
G. MOHAMAD | F. S. FONSECA | A. T. VERMELTFOORT | A. LUBECK
ratio affects the behaviour of the stress and vertical and horizontal strain relationship. For mortar ii (stronger mortar) and d/h ratio of 1.0, the stress-strain behaviour appears to be parabolic; for d/h ratio of 0.3, the behaviour may be better represented by a bilinear relationship. For mortar iii (weaker mortar), the stress-strain behav-iour is more or less parabolic for both d/h ratios.Figure 20 shows the apparent Poisson´s ratio vs. stress/strength ratio for all of the samples. The results indicate that for the d/h ratio of 0.3 (groups 1 and 2), the value of the apparent Poisson´s ratio is smaller than that for the d/h ratio of 1.0 (groups 3 and 4). For the stronger mortar (mortar ii) and a d/h ratio of 0.3 (group 1), the value of the apparent Poisson´s ratio is constant until failure, i.e., there is no significant change in horizontal strain until failure. For the weaker mortar (mortar iii) and a d/h ratio of 0.3 (group 2), the
value of the apparent Poisson´s ratio is constant until approximate-ly a stress/strength level of 0.6; the value then starts to increase smoothly until failure. For the stronger mortar (mortar ii) and a d/h of 1.0, there is a slight decrease in the value of the apparent Pois-son’s ratio until a stress/strength level of approximately 0.6 and 0.8 for each sample; after these stress/strength levels, the value of the apparent Poisson’s ratio increases significantly. For the weaker mortar (mortar iii) and a d/h of 1.0, the results are mixed. For one sample, there is a slight decrease in the value of the apparent Poisson’s ratio until a stress/strength level of approximately 0.5, after which the value increases significantly. For another sample, there is a slight increase in the value of the apparent Poisson’s ratio until a stress/strength level of approximately 0.6 after which the value increases significantly.
Figure 19Mortar stress-strain response
0.0
2.0
4.0
6.0
8.0
10.0
12.0
14.0
16.0
18.0
-2.5 -1.5 -0.5 0.5 1.5 2.5
Str
ess
(M
Pa)
Vertical strain (mm/m) Horizontal strain (mm/m)
Mortar ii - d/h=0.3
Mortar ii - d/h=1.0
Mortar iii - d/h=1.0
Mortar iii - d/h=0.3
Mortar ii - d/h=0.3
Mortar ii - d/h=1.0
Mortar iii - d/h=1.0
Mortar iii - d/h=0.3
Figure 20Stress/strength and apparent Poisson´s ratio
0,00
0,20
0,40
0,60
0,80
1,00
1,20
0,0 0,1 0,2 0,3 0,4 0,5 0,6 0,7 0,8 0,9 1,0
Str
ess/S
tre
ngth
Poisson's ratio
1 - Mortar ii - d/h=0.3 (fm=15,6 MPa)
2 - Mortar iii - d/h=0.3 (fm=2,7 MPa)
3 - Mortar ii - d/h=1.0 (fm=13,5 MPa)
4 - Mortar iii - d/h=1.0 (fm=3,9 MPa)
1 23
4
290 IBRACON Structures and Materials Journal • 2018 • vol. 11 • nº 2
Stiffness plasticity degradation of masonry mortar under compression: preliminar results
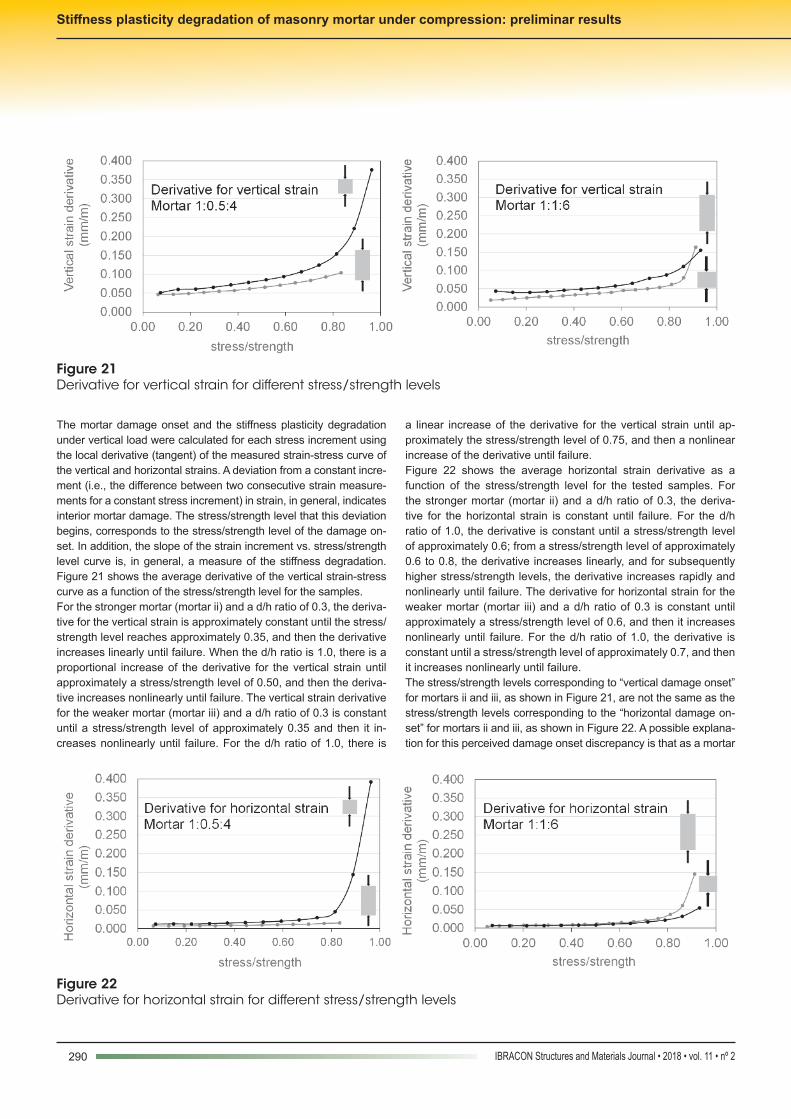
The mortar damage onset and the stiffness plasticity degradation under vertical load were calculated for each stress increment using the local derivative (tangent) of the measured strain-stress curve of the vertical and horizontal strains. A deviation from a constant incre-ment (i.e., the difference between two consecutive strain measure-ments for a constant stress increment) in strain, in general, indicates interior mortar damage. The stress/strength level that this deviation begins, corresponds to the stress/strength level of the damage on-set. In addition, the slope of the strain increment vs. stress/strength level curve is, in general, a measure of the stiffness degradation. Figure 21 shows the average derivative of the vertical strain-stress curve as a function of the stress/strength level for the samples.For the stronger mortar (mortar ii) and a d/h ratio of 0.3, the deriva-tive for the vertical strain is approximately constant until the stress/strength level reaches approximately 0.35, and then the derivative increases linearly until failure. When the d/h ratio is 1.0, there is a proportional increase of the derivative for the vertical strain until approximately a stress/strength level of 0.50, and then the deriva-tive increases nonlinearly until failure. The vertical strain derivative for the weaker mortar (mortar iii) and a d/h ratio of 0.3 is constant until a stress/strength level of approximately 0.35 and then it in-creases nonlinearly until failure. For the d/h ratio of 1.0, there is
a linear increase of the derivative for the vertical strain until ap-proximately the stress/strength level of 0.75, and then a nonlinear increase of the derivative until failure.Figure 22 shows the average horizontal strain derivative as a function of the stress/strength level for the tested samples. For the stronger mortar (mortar ii) and a d/h ratio of 0.3, the deriva-tive for the horizontal strain is constant until failure. For the d/h ratio of 1.0, the derivative is constant until a stress/strength level of approximately 0.6; from a stress/strength level of approximately 0.6 to 0.8, the derivative increases linearly, and for subsequently higher stress/strength levels, the derivative increases rapidly and nonlinearly until failure. The derivative for horizontal strain for the weaker mortar (mortar iii) and a d/h ratio of 0.3 is constant until approximately a stress/strength level of 0.6, and then it increases nonlinearly until failure. For the d/h ratio of 1.0, the derivative is constant until a stress/strength level of approximately 0.7, and then it increases nonlinearly until failure.The stress/strength levels corresponding to “vertical damage onset” for mortars ii and iii, as shown in Figure 21, are not the same as the stress/strength levels corresponding to the “horizontal damage on-set” for mortars ii and iii, as shown in Figure 22. A possible explana-tion for this perceived damage onset discrepancy is that as a mortar
Figure 21Derivative for vertical strain for different stress/strength levels
Figure 22Derivative for horizontal strain for different stress/strength levels
291IBRACON Structures and Materials Journal • 2018 • vol. 11 • nº 2
G. MOHAMAD | F. S. FONSECA | A. T. VERMELTFOORT | A. LUBECK
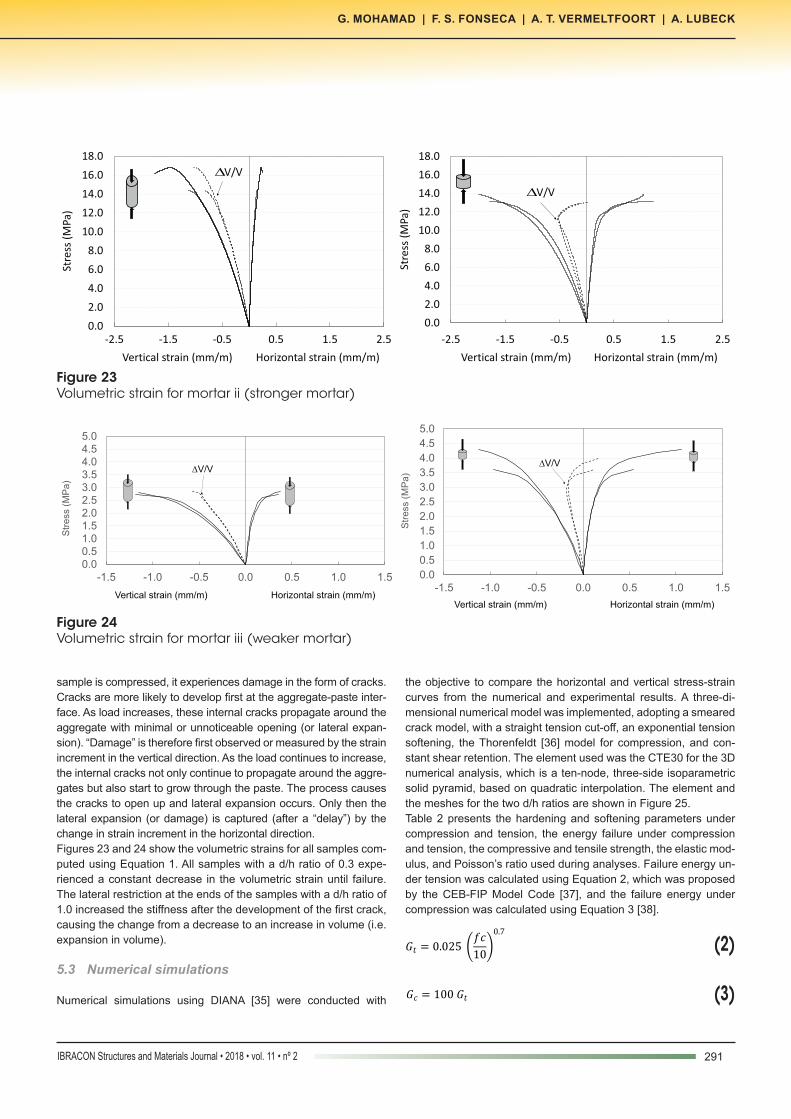
sample is compressed, it experiences damage in the form of cracks. Cracks are more likely to develop first at the aggregate-paste inter-face. As load increases, these internal cracks propagate around the aggregate with minimal or unnoticeable opening (or lateral expan-sion). “Damage” is therefore first observed or measured by the strain increment in the vertical direction. As the load continues to increase, the internal cracks not only continue to propagate around the aggre-gates but also start to grow through the paste. The process causes the cracks to open up and lateral expansion occurs. Only then the lateral expansion (or damage) is captured (after a “delay”) by the change in strain increment in the horizontal direction.Figures 23 and 24 show the volumetric strains for all samples com-puted using Equation 1. All samples with a d/h ratio of 0.3 expe-rienced a constant decrease in the volumetric strain until failure. The lateral restriction at the ends of the samples with a d/h ratio of 1.0 increased the stiffness after the development of the first crack, causing the change from a decrease to an increase in volume (i.e. expansion in volume).
5.3 Numerical simulations
Numerical simulations using DIANA [35] were conducted with
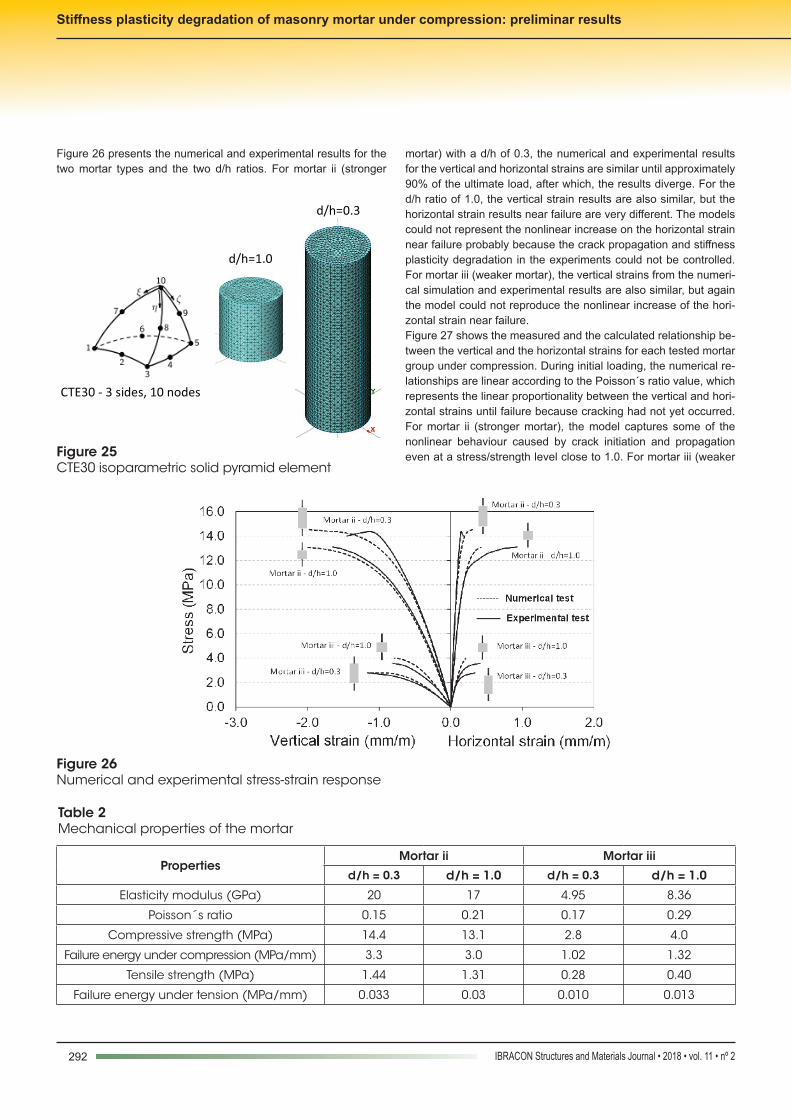
the objective to compare the horizontal and vertical stress-strain curves from the numerical and experimental results. A three-di-mensional numerical model was implemented, adopting a smeared crack model, with a straight tension cut-off, an exponential tension softening, the Thorenfeldt [36] model for compression, and con-stant shear retention. The element used was the CTE30 for the 3D numerical analysis, which is a ten-node, three-side isoparametric solid pyramid, based on quadratic interpolation. The element and the meshes for the two d/h ratios are shown in Figure 25.Table 2 presents the hardening and softening parameters under compression and tension, the energy failure under compression and tension, the compressive and tensile strength, the elastic mod-ulus, and Poisson’s ratio used during analyses. Failure energy un-der tension was calculated using Equation 2, which was proposed by the CEB-FIP Model Code [37], and the failure energy under compression was calculated using Equation 3 [38].
(2)
(3)
Figure 23Volumetric strain for mortar ii (stronger mortar)
0.0
2.0
4.0
6.0
8.0
10.0
12.0
14.0
16.0
18.0
-2.5 -1.5 -0.5 0.5 1.5 2.5
Stre
ss (
MPa
)
Vertical strain (mm/m) Horizontal strain (mm/m)
DV/V
0.0
2.0
4.0
6.0
8.0
10.0
12.0
14.0
16.0
18.0
-2.5 -1.5 -0.5 0.5 1.5 2.5
Stre
ss (
MPa
)
Vertical strain (mm/m) Horizontal strain (mm/m)
DV/V
Figure 24Volumetric strain for mortar iii (weaker mortar)
0.00.51.01.52.02.53.03.54.04.55.0
-1.5 -1.0 -0.5 0.0 0.5 1.0 1.5
Str
ess (
MP
a)
Vertical strain (mm/m) Horizontal strain (mm/m)
DV/VDV/V
0.0
0.5
1.0
1.5
2.0
2.5
3.0
3.5
4.0
4.5
5.0
-1.5 -1.0 -0.5 0.0 0.5 1.0 1.5
Str
ess (
MP
a)
Vertical strain (mm/m) Horizontal strain (mm/m)
292 IBRACON Structures and Materials Journal • 2018 • vol. 11 • nº 2
Stiffness plasticity degradation of masonry mortar under compression: preliminar results
Figure 25CTE30 isoparametric solid pyramid element
CTE30 - 3 sides, 10 nodes
d/h=1.0
d/h=0.3
Table 2Mechanical properties of the mortar
PropertiesMortar ii Mortar iii
d/h = 0.3 d/h = 1.0 d/h = 0.3 d/h = 1.0
Elasticity modulus (GPa) 20 17 4.95 8.36
Poisson´s ratio 0.15 0.21 0.17 0.29
Compressive strength (MPa) 14.4 13.1 2.8 4.0
Failure energy under compression (MPa/mm) 3.3 3.0 1.02 1.32
Tensile strength (MPa) 1.44 1.31 0.28 0.40
Failure energy under tension (MPa/mm) 0.033 0.03 0.010 0.013
Figure 26 presents the numerical and experimental results for the two mortar types and the two d/h ratios. For mortar ii (stronger
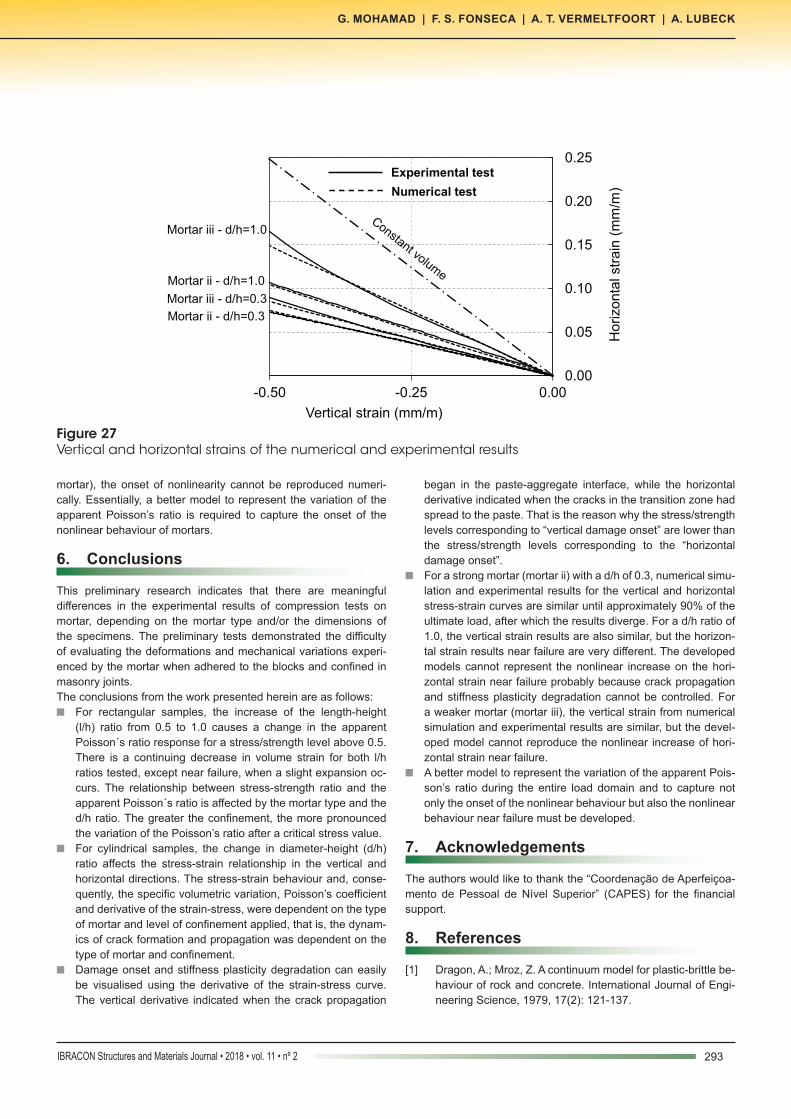
mortar) with a d/h of 0.3, the numerical and experimental results for the vertical and horizontal strains are similar until approximately 90% of the ultimate load, after which, the results diverge. For the d/h ratio of 1.0, the vertical strain results are also similar, but the horizontal strain results near failure are very different. The models could not represent the nonlinear increase on the horizontal strain near failure probably because the crack propagation and stiffness plasticity degradation in the experiments could not be controlled. For mortar iii (weaker mortar), the vertical strains from the numeri-cal simulation and experimental results are also similar, but again the model could not reproduce the nonlinear increase of the hori-zontal strain near failure.Figure 27 shows the measured and the calculated relationship be-tween the vertical and the horizontal strains for each tested mortar group under compression. During initial loading, the numerical re-lationships are linear according to the Poisson´s ratio value, which represents the linear proportionality between the vertical and hori-zontal strains until failure because cracking had not yet occurred. For mortar ii (stronger mortar), the model captures some of the nonlinear behaviour caused by crack initiation and propagation even at a stress/strength level close to 1.0. For mortar iii (weaker
Figure 26Numerical and experimental stress-strain response
293IBRACON Structures and Materials Journal • 2018 • vol. 11 • nº 2
G. MOHAMAD | F. S. FONSECA | A. T. VERMELTFOORT | A. LUBECK
mortar), the onset of nonlinearity cannot be reproduced numeri-cally. Essentially, a better model to represent the variation of the apparent Poisson’s ratio is required to capture the onset of the nonlinear behaviour of mortars.
6. Conclusions
This preliminary research indicates that there are meaningful differences in the experimental results of compression tests on mortar, depending on the mortar type and/or the dimensions of the specimens. The preliminary tests demonstrated the difficulty of evaluating the deformations and mechanical variations experi-enced by the mortar when adhered to the blocks and confined in masonry joints.The conclusions from the work presented herein are as follows:n For rectangular samples, the increase of the length-height
(l/h) ratio from 0.5 to 1.0 causes a change in the apparent Poisson´s ratio response for a stress/strength level above 0.5. There is a continuing decrease in volume strain for both l/h ratios tested, except near failure, when a slight expansion oc-curs. The relationship between stress-strength ratio and the apparent Poisson´s ratio is affected by the mortar type and the d/h ratio. The greater the confinement, the more pronounced the variation of the Poisson’s ratio after a critical stress value.
n For cylindrical samples, the change in diameter-height (d/h) ratio affects the stress-strain relationship in the vertical and horizontal directions. The stress-strain behaviour and, conse-quently, the specific volumetric variation, Poisson’s coefficient and derivative of the strain-stress, were dependent on the type of mortar and level of confinement applied, that is, the dynam-ics of crack formation and propagation was dependent on the type of mortar and confinement.
n Damage onset and stiffness plasticity degradation can easily be visualised using the derivative of the strain-stress curve. The vertical derivative indicated when the crack propagation
began in the paste-aggregate interface, while the horizontal derivative indicated when the cracks in the transition zone had spread to the paste. That is the reason why the stress/strength levels corresponding to “vertical damage onset” are lower than the stress/strength levels corresponding to the “horizontal damage onset”.
n For a strong mortar (mortar ii) with a d/h of 0.3, numerical simu-lation and experimental results for the vertical and horizontal stress-strain curves are similar until approximately 90% of the ultimate load, after which the results diverge. For a d/h ratio of 1.0, the vertical strain results are also similar, but the horizon-tal strain results near failure are very different. The developed models cannot represent the nonlinear increase on the hori-zontal strain near failure probably because crack propagation and stiffness plasticity degradation cannot be controlled. For a weaker mortar (mortar iii), the vertical strain from numerical simulation and experimental results are similar, but the devel-oped model cannot reproduce the nonlinear increase of hori-zontal strain near failure.
n A better model to represent the variation of the apparent Pois-son’s ratio during the entire load domain and to capture not only the onset of the nonlinear behaviour but also the nonlinear behaviour near failure must be developed.
7. Acknowledgements
The authors would like to thank the “Coordenação de Aperfeiçoa-mento de Pessoal de Nível Superior” (CAPES) for the financial support.
8. References
[1] Dragon, A.; Mroz, Z. A continuum model for plastic-brittle be-haviour of rock and concrete. International Journal of Engi-neering Science, 1979, 17(2): 121-137.
Figure 27Vertical and horizontal strains of the numerical and experimental results
0.00
0.05
0.10
0.15
0.20
0.25
-0.50 -0.25 0.00
Ho
rizo
nta
l st
rain
(m
m/m
)
Vertical strain (mm/m)
Experimental test
Numerical test
Mortar ii - d/h=0.3
Mortar iii - d/h=0.3
Mortar ii - d/h=1.0
Mortar iii - d/h=1.0
294 IBRACON Structures and Materials Journal • 2018 • vol. 11 • nº 2
Stiffness plasticity degradation of masonry mortar under compression: preliminar results
[2] Bazant, Z. P.; Oh, B. H. Microplane model for progressive fracture of concrete and rock. Journal of Engineering Me-chanics, 1985, 111(4): 559-582.
[3] Krajcinovic, D.; Fanella, D. A micromechanical damage model for concrete. Engineering Fracture Mechanics, 1986, 25(5): 585-596.
[4] Lubliner, J., et al. A plastic-damage model for concrete. Interna-tional Journal of solids and structures, 1989, 25(3): 299-326.
[5] Yazdani, S.; Schreyer, H. L. Combined plasticity and dam-age mechanics model for plain concrete. Journal of engi-neering mechanics, 1990, 116(7): 1435-1450.
[6] Feenstra, P. H.; De Borst, R. A composite plasticity model for concrete. International Journal of Solids and Structures, 1996, 33(5): 707-730.
[7] Hilsdorf, H.K. An investigation into the failure mechanism of brick masonry loaded in axial compression. Designing, Engineering and construction with masonry products; 1969, p. 34-41.
[8] Khoo, C.L; Hendry, A.W. A failure criterion for brickwork in axial compression. In: Proceedings of Third International Brick Masonry Conference, Essen, 1973, p. 139-45.
[9] Hendry, A.W. Structural Brickwork, Macmillan, London, 1981.
[10] Atkinson, R.H.; Noland, J.L. A proposed failure theory for brick masonry in compression. In: Proceedings 3rd Cana-dian Masonry Symposium, Edmonton, Canada, 1983, p. 1-7.
[11] Atkinson, R.H.; Noland, J.L. Abrams DP, McNary S. A defor-mation failure theory for stack-bond brick masonry prisms in compression. In: Proceedings 3rd North America Masonry Conference, Boulder, TMS, 1985, paper 18.
[12] Atkinson, R.H.; Noland, J.L.; Abrams, D.P. A deformation fail-ure theory for stack-bond brick masonry prism in compres-sion. In: Proceedings 7th International Brick Masonry Con-ference, Melbourne, February, v.1, 1985, p. 577-592.
[13] Hamid, A.A.; Drysdale, R.G. Suggested failure criteria for grouted masonry under axial compressive. ACI Journal, 1979; 76(10): 1047-1061.
[14] Hamid, A.A.; Drysdale, R.G. Behavior of concrete block mason-ry under axial compression. ACI Journal, 1979; 76(6): 707-721.
[15] Cheema, T.S.; Klingner, R.E. Compressive Strength of Concrete Masonry Prism. American Concrete Institute- ACI Journal, 1986; 83(1): 88-97.
[16] Afshari, F.; Kaldjian, M.J. Finite element analysis of concrete masonry prisms. American Concrete Institute. ACI Journal, 1989; 86(5): 525-530.
[17] Khalaf, F. M.; Hendry, A. W. and Fairbairn D. R. The strength of blockwork prisms tested parallel to the bed face. Masonry International- Journal of the British Masonry Society. 1992, 6(1): 29-35.
[18] Khalaf, F. M.; Hendry, A. W. and Fairbain D. R. Study of the compressive strength of blockwork masonry. American Con-crete Institute- ACI Structural Journal. 1994, 91(4): 367-375.
[19] Khalaf, F. M. (1996). Factors influencing compressive strength of concrete masonry prism. Magazine of Concrete Research. 1996, 48(175): 95-101.
[20] Khalaf, F. M. Blockwork masonry compressed in two orthog-onal directions. Journal of Structural Engineering-ASCE. 1997, 123(5): 591-596.
[21] Mohamad, G.; Rizzatti, E.; Roman, H. R. Failure mode, de-formability and compressive strength of small structural ma-sonry walls. Ambiente Construído, 2011, 11(3): 7-22.
[22] Mohamad, G.; Lourenço, P. B.; Roman, H. R. Mechanics of hollow concrete block masonry prisms under compression: review and prospects. Cement and Concrete Composites, 2007, 29(3): 181-192.
[23] Mohamad G. Mechanism failure of concrete block masonry under compression. PhD Thesis 2007, University of Minho, Portugal.
[24] Sarhat S.R, Sherwood E.G. The prediction of com-pressive strength of ungrouted hollow concrete block masonry. Construction and Building Materials, 2014; 58(1): 111-121.
[25] Berto L, Saetta RS, Vitaliani R. Failure mechanism of ma-sonry prism loaded in axial compression: computational as-pects. Materials and Structures, 2005, 38(2): 249-256.
[26] Barbosa CS, Lourenço PB, Hanai JB. On the compressive strength prediction for concrete masonry prisms. Materials and Structures, 2010; 43(3): 331-344.
[27] Knutson, H. H. The stress-strain relationship for Masonry. Masonry International- Journal of the British Masonry Soci-ety, 1993, 7(1): 31-33.
[28] Kubica, J. Investigation of the σ-ε relationship of unrein-forced masonry. In: Proceedings of 7th North American Ma-sonry Conference. University of Notre Dame, South Bend, Indiana, USA. June. 1996.
[29] Shah, S. P.; Chandra, S. Critical stress, volume change and microcracking of concrete. ACI Journal, 1968, 65(9): 770-780.
[30] Stöckl, S.; Bierwirth, H.; Kupfer, H. The influence of test method on the results of compression tests on mortar. In: Proceedings of the 10th International brick and block ma-sonry conference, Calgary, Alberta, Canada, July, 1994.
[31] Vonk, R. A. Softening of concrete loaded in compression. PhD dissertarion, Technische Universiteit Eindhoven, 1992, pp. 197.
[32] EN 998- 2. (2003). Specification for mortar for masonry- Part 2: Masonry mortar. European Standard.
[33] Vermeltfoort, A. T. Brick-mortar interaction in masonry under pressure. PhD thesis. Technical. University of Eindhoven. October. 2004.
[34] BS 5628-1. Code of practice for use of masonry – Part 1: Structural use of unreinforced masonry. British Standard In-stitution. 1992.
[35] DIANA, User’s Manual - Material Library, Release 9.6. TNO Diana. Delft, The Netherlands. 2014.
[36] Thorenfeldt, E., Tomaszewicz, A., and Jensen, J. J. Mechanical properties of high-strength concrete and applications in design. In Proceedings of Symposium Utilization of High-Strength Concrete, Stavanger, Nor-way. 1987.
[37] CEB - Comité Euro-International Du Béton. CEB MODEL CODE 1990, 1990.
[38] Feenstra, P. H.; Borst, R. DE. Aspects of robust computa-tional modelling for plain and reinforced concrete. HERON, 1993, 38(4), 3-76.
295IBRACON Structures and Materials Journal • 2018 • vol. 11 • nº 2
G. MOHAMAD | F. S. FONSECA | A. T. VERMELTFOORT | A. LUBECK
9. List of figure captions
Fig. 1. Masonry stress-strain for three mortar types.Fig. 2. Failure mechanism of prism with weak mortar.Fig. 3. Weak mortar failure model evolution under loading.Fig. 4. Masonry versus mortar strength adapted from Sarhat and
Sherwood [24].Fig. 5. Uniaxial test with short brushes [31].Fig. 6. Concrete stress deformation relations [31].Fig. 7. Axial versus lateral deformations [31].Fig. 8. Preliminary tests on mortar samples.Fig. 9. Stress-strain response for a typical small thickness mor-
tar specimen.Fig. 10. Vertical and horizontal deformations of prismatic samples.Fig. 11. Apparent Poisson´s ratio vs. stress/strength level for the
tested mortar.Fig. 12. Horizontal versus vertical strains for l/h = 0.5.Fig. 13. Horizontal and vertical strain for l/h = 1.0.Fig. 14. Formation of conical cracks for l/h = 1.0.Fig. 15. Volumetric strain for l/h values of 0.5 and 1.0.Fig. 16. Force/time protocol for mortar test.Fig. 17. Stress-strain response for samples with a d/h ratio of 1.75.Fig. 18. Differences in the horizontal displacement of the samples.Fig. 19. Mortar stress-strain response.Fig. 20. Stress/strength and apparent Poisson´s ratio.Fig. 21. Derivative for vertical strain for different stress/
strength levels.Fig. 22. Derivative for horizontal strain for different stress/strength
levels.Fig. 23. Volumetric strain for mortar ii (stronger mortar).Fig. 24. Volumetric strain for mortar iii (weaker mortar).Fig. 25. CTE30 isoparametric solid pyramid element.Fig. 26. Numerical and experimental stress-strain response.Fig. 27. Vertical and horizontal strains of the numerical and
experimental results.