Embed Size (px)
Citation preview
Perfect Order Index
PROBLEM
Supply Chain costs have steadily increased over time despite concerted efforts by many manufacturing, logistics and transportation companies to hold the line. For many of these companies, particularly those with large and complex supply chains, optimizing the sales and operations planning (S&OP) process to improve customer experience and control costs has not been easy. Evidence of the impact of poor performing S&OP includes missed deliveries, reduced brand image, lost customers, higher working capital in inventories, higher labor costs, inability to compete effectively, and reduced operational and financial performance. Worse, without meaningful operational insight, organizations can leave good money locked or stuck in the value chain.
Why is it still a problem? After all, sophisticated ERPs, supply chain management, warehouse management, manufacturing, and logistics execution systems became mainstream decades ago to avoid these problems. As it turns out, decades and tens of millions of dollars later, these applications are still managed in silos, on a per business unit, plant, or regional basis, and they tend to support a specific set of processes and related view of data. More often, these silos also still require significant manual intervention, creating business and systemic gaps. In response to customer demands and market conditions, changes in data requirements, such as packaging variations, shipping variations, and special orders, can exacerbate the problem, increasing the potential exposure to business process breakdowns. Further, because there is little or no consistent development coordination across business functions, these types of changes can be very costly to implement.
Gathering and interpreting information across the supply chain requires integrating disparate S&OP data from across multiple, distributed, heterogenous ERP systems. Moreover, many manufacturers often use a battery of metrics,
WHITE PAPER
1
In effect, POI = OTIF – (Percent of order damaged or incorrectly processed). So what? APQC’s benchmark of 2,561 companies shows POI can range from 95% to 82%, with a median of 90%.3 In other words, on average, 10 percent of all customer orders shipped have major errors. That could translate into millions of dollars of capital inefficiency somewhere in the supply chain, such as maintaining extra safety inventory to maintain high customer experience service levels.
BUSINESS VALUE
Understanding S&OP inconsistencies, failures, and associated costs can be an eye-opener for many manufacturers, especially for those that use a myriad of functional metrics, such as on-time shipments and line/unit fill rate, as a proxy for customer experience. There are numerous benefits of improving customer service and order fulfillment by process automation, including potentially 55% lower order processing costs, 99.6% order entry accuracy rate, and 60% reduction of labor overhead in order entry.4 These returns however cannot be achieved by process automation alone; they require good data management and data governance practices across the S&OP value chain.
According to Forrester Research, companies that layer the right tool and processes with the right metrics will enable themselves with three critical viewpoints: historical perspective, current trends, and forward looking projections.5 In addition, the Harvard Business Review points to three critical needs: 1) data integration; 2) analytics that drive growth; and, 3) treating supply chain planning as an enterprise-wide initiative that can be achieved incrementally through agile sprints with a focus on specific functions, products, and markets based on business priorities.6
WHITE PAPER
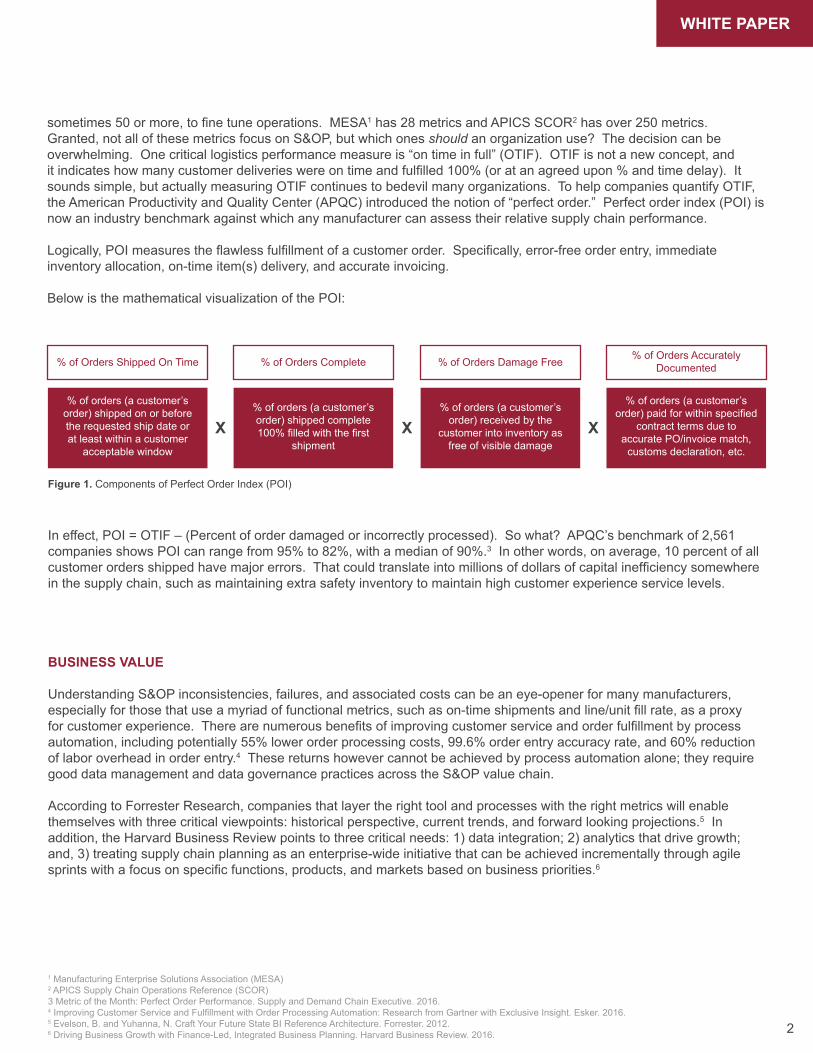
% of Orders Shipped On Time % of Orders Complete % of Orders Damage Free % of Orders Accurately Documented
% of orders (a customer’s order) shipped on or before the requested ship date or at least within a customer
acceptable window
% of orders (a customer’s order) shipped complete100% filled with the first
shipment
% of orders (a customer’s order) received by the
customer into inventory as free of visible damage
% of orders (a customer’s order) paid for within specified
contract terms due to accurate PO/invoice match,
customs declaration, etc.
X X X
Figure 1. Components of Perfect Order Index (POI)
sometimes 50 or more, to fine tune operations. MESA1 has 28 metrics and APICS SCOR2 has over 250 metrics. Granted, not all of these metrics focus on S&OP, but which ones should an organization use? The decision can be overwhelming. One critical logistics performance measure is “on time in full” (OTIF). OTIF is not a new concept, and it indicates how many customer deliveries were on time and fulfilled 100% (or at an agreed upon % and time delay). It sounds simple, but actually measuring OTIF continues to bedevil many organizations. To help companies quantify OTIF, the American Productivity and Quality Center (APQC) introduced the notion of “perfect order.” Perfect order index (POI) is now an industry benchmark against which any manufacturer can assess their relative supply chain performance.
Logically, POI measures the flawless fulfillment of a customer order. Specifically, error-free order entry, immediate inventory allocation, on-time item(s) delivery, and accurate invoicing.
Below is the mathematical visualization of the POI:
1 Manufacturing Enterprise Solutions Association (MESA)2 APICS Supply Chain Operations Reference (SCOR)3 Metric of the Month: Perfect Order Performance. Supply and Demand Chain Executive. 2016.4 Improving Customer Service and Fulfillment with Order Processing Automation: Research from Gartner with Exclusive Insight. Esker. 2016.5 Evelson, B. and Yuhanna, N. Craft Your Future State BI Reference Architecture. Forrester. 2012.6 Driving Business Growth with Finance-Led, Integrated Business Planning. Harvard Business Review. 2016. 2
SOLUTION APPROACH
Giving management access to more reliable, accurate and timely information in the appropriate format equips them with more actionable insight and opportunities to improve S&OP efficiency and effectiveness. How? This is where a foundational and strategic investment in the right technology – specifically an advanced, cohesive and comprehensive product suite – can be a “game changer,” empowering the organization to optimize its supply chain, meet and exceed customer expectations, and achieve critical business objectives.
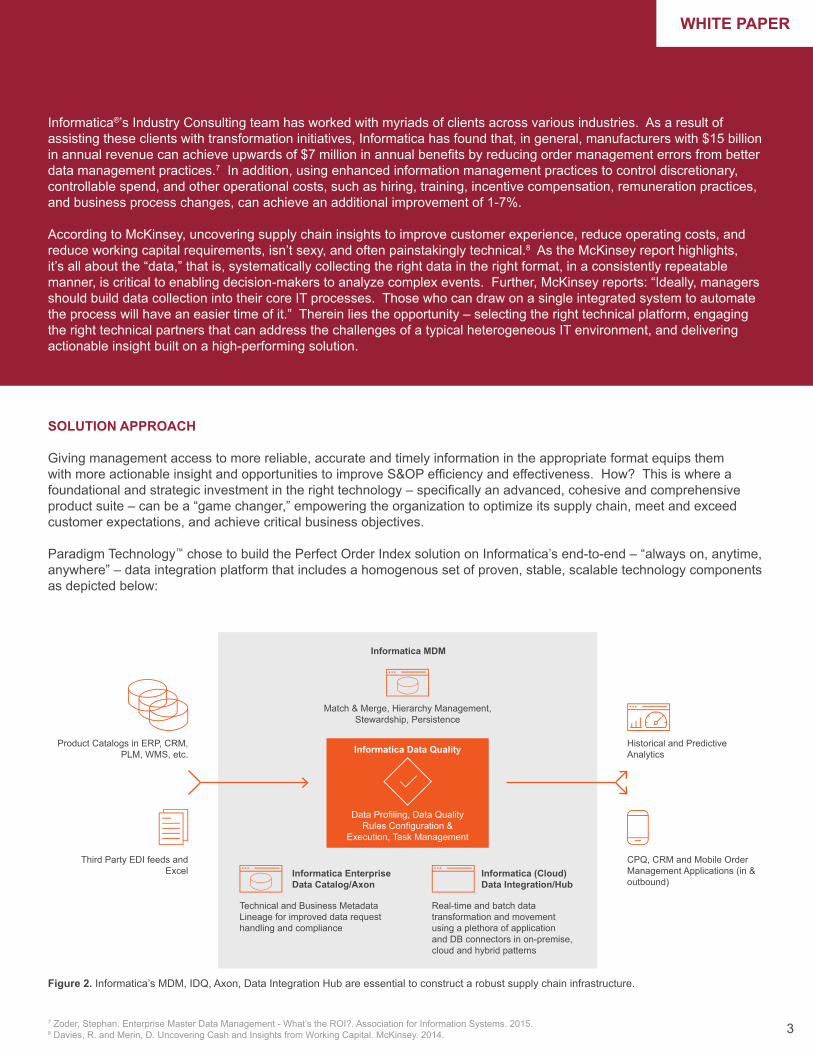
Paradigm Technology™ chose to build the Perfect Order Index solution on Informatica’s end-to-end – “always on, anytime, anywhere” – data integration platform that includes a homogenous set of proven, stable, scalable technology components as depicted below:
WHITE PAPER
Informatica®’s Industry Consulting team has worked with myriads of clients across various industries. As a result of assisting these clients with transformation initiatives, Informatica has found that, in general, manufacturers with $15 billion in annual revenue can achieve upwards of $7 million in annual benefits by reducing order management errors from better data management practices.7 In addition, using enhanced information management practices to control discretionary, controllable spend, and other operational costs, such as hiring, training, incentive compensation, remuneration practices, and business process changes, can achieve an additional improvement of 1-7%.
According to McKinsey, uncovering supply chain insights to improve customer experience, reduce operating costs, and reduce working capital requirements, isn’t sexy, and often painstakingly technical.8 As the McKinsey report highlights, it’s all about the “data,” that is, systematically collecting the right data in the right format, in a consistently repeatable manner, is critical to enabling decision-makers to analyze complex events. Further, McKinsey reports: “Ideally, managers should build data collection into their core IT processes. Those who can draw on a single integrated system to automate the process will have an easier time of it.” Therein lies the opportunity – selecting the right technical platform, engaging the right technical partners that can address the challenges of a typical heterogeneous IT environment, and delivering actionable insight built on a high-performing solution.
Figure 2. Informatica’s MDM, IDQ, Axon, Data Integration Hub are essential to construct a robust supply chain infrastructure.
7 Zoder, Stephan. Enterprise Master Data Management - What’s the ROI?. Association for Information Systems. 2015. 8 Davies, R. and Merin, D. Uncovering Cash and Insights from Working Capital. McKinsey. 2014. 3
Match & Merge, Hierarchy Management, Stewardship, Persistence
Historical and Predictive Analytics
CPQ, CRM and Mobile Order Management Applications (in & outbound)
Real-time and batch data transformation and movement using a plethora of application and DB connectors in on-premise, cloud and hybrid patterns
Technical and Business Metadata Lineage for improved data request handling and compliance
Third Party EDI feeds and Excel
Product Catalogs in ERP, CRM, PLM, WMS, etc.
Data Profiling, Data Quality Rules Configuration &
Execution, Task Management
Informatica Enterprise Data Catalog/Axon
Informatica (Cloud) Data Integration/Hub
Informatica Data Quality
Informatica MDM
WHITE PAPER
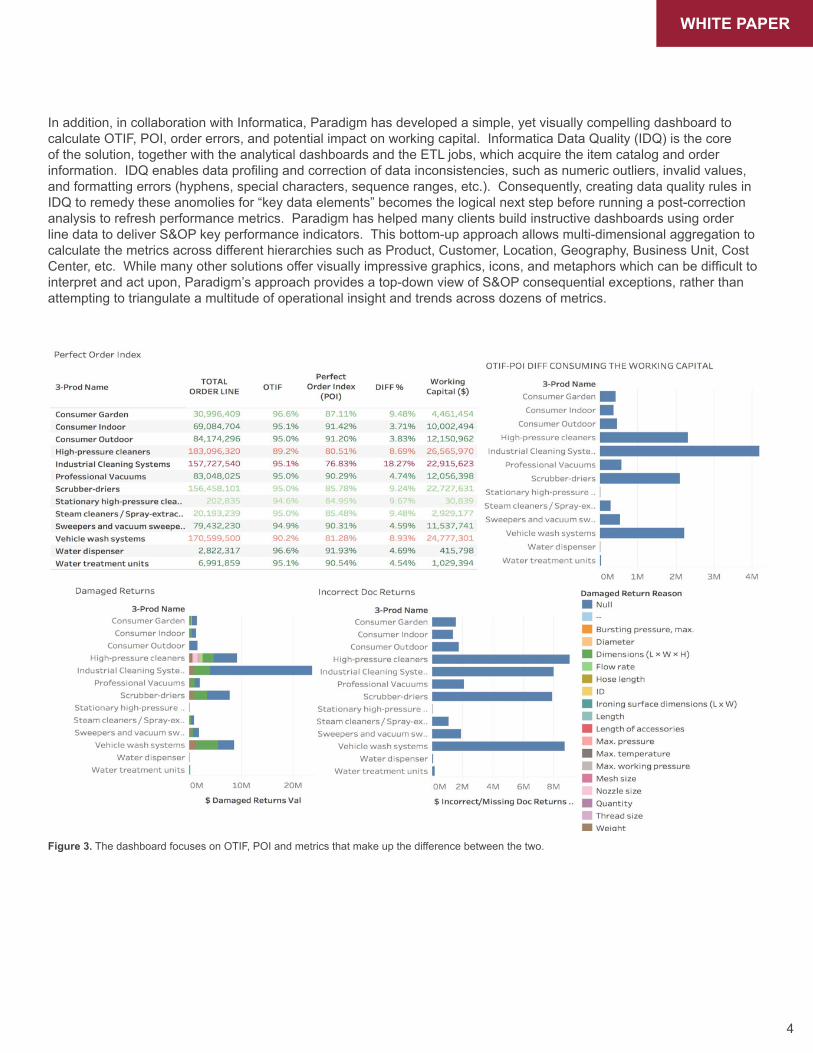
In addition, in collaboration with Informatica, Paradigm has developed a simple, yet visually compelling dashboard to calculate OTIF, POI, order errors, and potential impact on working capital. Informatica Data Quality (IDQ) is the core of the solution, together with the analytical dashboards and the ETL jobs, which acquire the item catalog and order information. IDQ enables data profiling and correction of data inconsistencies, such as numeric outliers, invalid values, and formatting errors (hyphens, special characters, sequence ranges, etc.). Consequently, creating data quality rules in IDQ to remedy these anomolies for “key data elements” becomes the logical next step before running a post-correction analysis to refresh performance metrics. Paradigm has helped many clients build instructive dashboards using order line data to deliver S&OP key performance indicators. This bottom-up approach allows multi-dimensional aggregation to calculate the metrics across different hierarchies such as Product, Customer, Location, Geography, Business Unit, Cost Center, etc. While many other solutions offer visually impressive graphics, icons, and metaphors which can be difficult to interpret and act upon, Paradigm’s approach provides a top-down view of S&OP consequential exceptions, rather than attempting to triangulate a multitude of operational insight and trends across dozens of metrics.
Figure 3. The dashboard focuses on OTIF, POI and metrics that make up the difference between the two.
4
WHITE PAPER
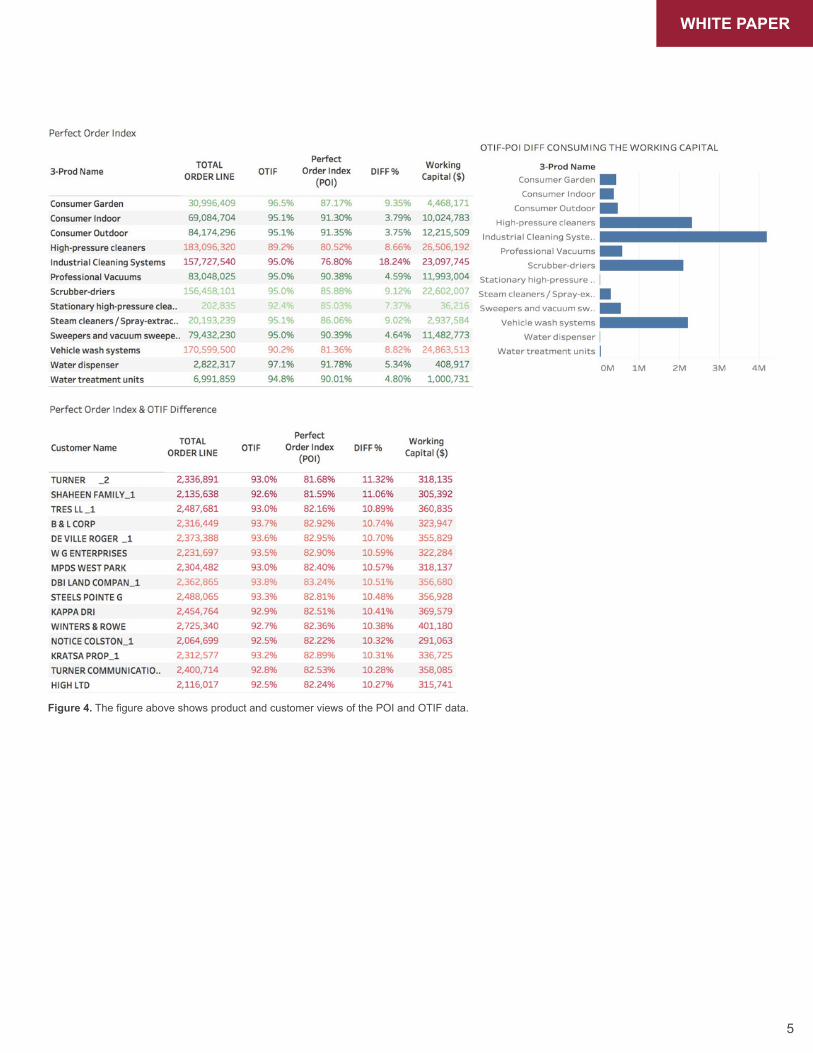
Figure 4. The figure above shows product and customer views of the POI and OTIF data.
5
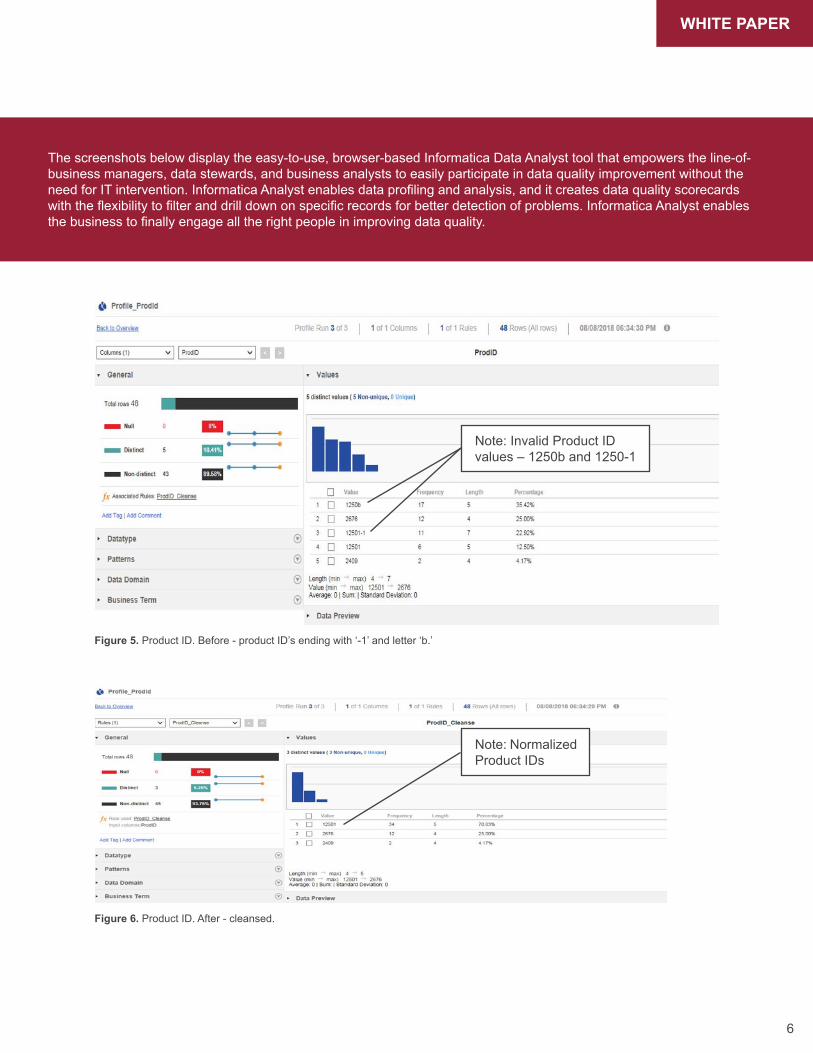
Figure 5. Product ID. Before - product ID’s ending with ‘-1’ and letter ‘b.’
Figure 6. Product ID. After - cleansed.
6
The screenshots below display the easy-to-use, browser-based Informatica Data Analyst tool that empowers the line-of- business managers, data stewards, and business analysts to easily participate in data quality improvement without the need for IT intervention. Informatica Analyst enables data profiling and analysis, and it creates data quality scorecards with the flexibility to filter and drill down on specific records for better detection of problems. Informatica Analyst enables the business to finally engage all the right people in improving data quality.
WHITE PAPER
Note: Invalid Product ID values – 1250b and 1250-1
Note: NormalizedProduct IDs
WHITE PAPER
7
SUMMARY
Increasingly, manufacturing companies are realizing that more insightful information across supply chain operations can improve customer experience and customer satisfaction in the face of increasing competition, market pressures, logistics, and supply chain performance challenges. A combination of the right technical and analytic components brought together in a holistic, integrated platform can provide more timely and accurate information from across the supply chain. This approach brings focus to the distribution and communication of S&OP metrics of supply chain performance, costs, risks, and exceptions. Giving management access to more reliable and accurate information in the appropriate format empowers them with options on how best to improve S&OP efficiency and effectiveness.
ABOUT THE AUTHORS
Paradigm Technology is a strategic consultancy that focuses on Digital Transformation, Analytics, Governance and Cloud. Started in 1994, we partner with clients to deliver business and technology solutions that enable our clients. Analytics and Governance are at the heart of the value we deliver.
Paradigm Technology and Informatica, the world’s leader in Enterprise Cloud Data Management, are prepared to help you intelligently lead - in any sector, category or niche. We invite you to explore all that Paradigm Technology and Informatica have to offer and unleash the power of data to drive your next intelligent disruption.
Mohit Sahgal, Vice President of Analytics at Paradigm Technology: Mohit has over 25 of data management consulting experience in Enterprise Information Architecture/Management and Business Analytics. Mohit has lead information management practice areas for Accenture, Capco, IBM and Ernst & Young.
Anshuman Sindhar, Senior Director at Paradigm Technology: Anshuman has experience in managing mission critical initiatives, requiring deep subject matter and technology expertise in banking, wealth management, computer hardware and software, and networking industries. He has held positions covering risk, customer analytics, regulatory compliance, systems integration and data management.
Stephan Zoder, Senior Director of Industry Consulting at Informatica: Stephan is the creative engine behind Informatica’s Infonomics and IT Business Consulting practice. As such, he is also responsible for Informatica’s go-to-market strategy for the energy, telecommunication, automotive and manufacturing sectors. Relying on his past project experience in CRM, MRO and SCM in the aerospace, automotive and telecom industry, his mission today is to connect and translate technical challenges into strategic financial outcomes appreciated by business executives. Stephan has been published numerous times during his time at IBM and Informatica and continues to push the boundaries of data management forward.
Copyright © 2018 Paradigm Technology™
www.pt-corp.com | 480-473-7111

![The Perfect Glass Paradigm: Disordered Hyperuniform ... · arXiv:1610.07399v3 [cond-mat.stat-mech] 21 Nov 2016 The Perfect Glass Paradigm: Disordered Hyperuniform Glasses Down to](https://img.pdfslide.net/doc/110x75/5eb1cf6bf81d19768254c32d/the-perfect-glass-paradigm-disordered-hyperuniform-arxiv161007399v3-cond-matstat-mech.jpg)