Embed Size (px)
Citation preview
14 Oilfield Review
Perforating Innovations—Shooting Holes in Performance Models
Explosive shaped charges punch holes through the casing of oil and gas wells and
create tunnels to connect the wellbore to the rock beyond the casing. To determine
penetration performance in known conditions, service companies conduct tests at
the surface, firing shaped charges into unstressed concrete targets. After determining
that modeling programs may not correctly predict downhole charge performance,
Schlumberger scientists developed software that accurately computes depth of
penetration, perforation effectiveness and system dynamic responses. They have also
used this knowledge to develop charges that are optimized for perforating stressed rocks.
Carlos BaumannAlfredo FayardBrenden GroveJeremy HarveyWenbo YangRosharon, Texas, USA
Amit GovilTananger, Norway
Andy MartinCambridge, England
Roberto Franco Mendez GarcíaArturo Ramirez RodriquezPetróleos Mexicanos (PEMEX)Agua Dulce, Veracruz, Mexico
Jock MunroAberdeen, Scotland
Cesar Velez TerrazasVillahermosa, Tabasco, Mexico
Lang ZhanShell Oil CompanyHouston, Texas
Oilfield Review Autumn 2014: 26, no. 3.Copyright © 2014 Schlumberger.ASFS, CIRP, HSD, PowerJet Nova, PowerJet Omega, PURE, S.A.F.E., SafeJet, Secure, Secure2, SPAN, SPAN Rock and TuffTRAC Mono are marks of Schlumberger.
Perforating with explosive shaped charges is the primary means of connecting hydrocarbon-bearing formations to the wellbore through casing. Operators have been perforating oil and gas wells for more than 60 years. For almost as long, scientists have been working to
create penetration models that link charge performance in controlled tests to downhole performance. However, validating charge per-formance downhole is difficult because of lack of direct access to the perforations after opera-tions are completed.
1. Behrmann L, Grove B, Walton I, Zhan L, Graham C, Atwood D and Harvey J: “A Survey of Industry Models for Perforator Performance: Suggestions for Improvements,” paper SPE 125020, presented at the SPE Annual Technical Conference and Exhibition, New Orleans, October 4–7, 2009.
2. American Petroleum Institute: RP 19B, Recommended Practices for Evaluation of Well Perforators, 2nd ed. Washington, DC: American Petroleum Institute, 2006.
3. For more on dynamic underbalance perforating: Baxter D, Behrmann L, Grove B, Williams H, Heiland J, Hong LJ, Khong CK, Martin A, Mishra VK, Munro J, Pizzolante I, Safiin N and Suppiah RR: “Perforating—When Failure Is the Objective,” Oilfield Review 21, no. 3 (Autumn 2009): 4–17.
> Concrete targets. A perforating specialist examines a concrete target to appraise the perforation tunnel geometry produced by deep-penetrating perforating charges (vertical lines). After the tests, the perforation tunnels in the concrete targets are oriented horizontally; the concrete target has been split open and set on its side for stability during examination. The API RP 19B Section 1 test provides specific procedures for constructing these concrete targets.
Autumn 2014 1515
In recent years, service companies have introduced perforating charges that penetrate deeper and create larger perforation tunnels in concrete test targets than ever before. Research indicates that the link between tests in con-crete and results in rocks subjected to condi-tions similar to those found downhole may not be as straightforward as many models suggest.1 The model predictions appear to be too optimis-tic for depth of penetration, perforation tunnel geometry and flow effectiveness under down-hole conditions.
Charge performance and penetration predic-tions are traditionally made with data acquired at the surface that are then corrected for the downhole environment. The American Petroleum Institute (API) Recommended Practice (RP) 19B establishes procedures for qualifying charge per-formance.2 Testing techniques and procedures in targets that simulate downhole conditions are included in API RP 19B; however, shaped-charge providers most often refer to Section 1 tests—charges fired into unstressed concrete—when comparing charges (previous page). Section 1 test results are also the basis of software model-
ing programs that predict charge performance using rock and formation parameters, cement and casing properties, wellbore completion fluid effects and temperature and pressure data.
In 2004, Schlumberger opened the oil and gas industry’s most advanced research labora-tory to study perforation sciences. This facility was an expansion of the industry’s first perforat-ing laboratory, which Schlumberger pioneered in 1953. At the Schlumberger Rosharon Campus (SRC), Texas, USA, laboratory specialists con-duct shaped-charge testing, including compari-sons of laboratory results with predicted performance from modeling software. Tests can be performed in rock targets subjected to stresses that replicate downhole conditions and thus produce results that are more representa-tive of real operations than those of surface tests in unstressed concrete.
Research at the SRC laboratory has led to updates in the understanding of the performance of shaped charges and perforating systems. Findings from laboratory testing were incorpo-rated in the SPAN Schlumberger perforating analy-sis software. This software predicts performance
that more closely matches test results in stressed rocks than do previous modeling systems. The updated program has been renamed SPAN Rock stressed-rock perforating analysis; the updated software also includes modeling of the PURE clean perforations and dynamic underbalance (DUB) perforating systems. The software can predict dynamic forces produced during perforating and provide realistic productivity expectations.3
Researchers working to understand charge performance have also developed charges that are optimized for real-world conditions. The PowerJet Nova extradeep-penetrating shaped charge is an example of an engineered charge design that incorporates ongoing research. This is the industry’s first comprehensive charge fam-ily optimized specifically for stressed rock.
In addition to enhancing charge performance, design engineers are developing new technolo-gies to improve perforating safety. The S.A.F.E. slapper-actuated firing equipment was the first intrinsically safe perforating system in the oil and gas industry. It used an exploding foil initia-tor (EFI) in place of the primary explosives com-monly found in blasting caps. The more advanced
16 Oilfield Review
SafeJet perforating gun system was recently introduced. It includes added safety features such as electronic initiators that enable selective firing of multiple individual charges or charge clusters. SafeJet technology improves efficiency in selective firing operations commonly used in fracture stimulation programs.
This article describes ongoing shaped-charge research and outlines recent developments in penetration and performance modeling software. Operators in Mexico and the North Sea took advantage of advances in modeling and shaped-charge design to enhance well productivity. An additional North Sea example demonstrates the benefits and operational efficiencies of SafeJet perforating technology.
Setting New StandardsEngineers and scientists have been conducting shaped-charge experiments since the 1950s. Most of the experimentation was focused on determining depth of penetration (DoP) because well productivity of natural completions—those that do not require stimulation—depends on the degree to which perforation tunnels extend beyond drilling-induced damage in the near-well-bore region.4 Recently, researchers compared the penetration performance of modern shaped charges under simulated downhole conditions
with penetration predictions from models com-monly used in the industry—most of which were developed before the 1990s. Test results indicate that the accuracy of performance predictions has not kept up with changes in charge design.5 In addition, when the same perforating system is evaluated under identical simulated conditions, large discrepancies exist in performance predic-tions between models (above).
Surface testing of charges forms the basis of performance predictions. Standards for testing perforation charges were developed by the API and described in RP 43 Section 1 concrete tests. These standards were first published in 1962. Over time, they evolved to include four test procedures:• Section 1: System tests in concrete at ambient
temperature and pressure• Section 2: Single-shot tests in stressed Berea
sandstone (3,000 psi [20.7 MPa]) at ambient temperature
• Section 3: System tests in steel at elevated temperature
• Section 4: Single-shot, flow performance tests in stressed Berea sandstone samples (3,000 psi) at ambient temperature.
To predict downhole DoP, early penetration models started with API RP 43 Section 1 penetra-tion data and applied a series of corrections (next page, top). The sequential process for converting
Section 1 test results to downhole DoP in predic-tive models generally follows these five steps:• Perform API RP 43 Section 1 concrete tests to
standards.• Normalize these results for Berea sandstone
with unconfined compressive strength (UCS) of 7,000 psi [48.3 MPa].
• Normalize corrected Berea sandstone data for other unstressed rock types.
• Correct unstressed rock penetration data for effective stress.
• Apply the effects of cement, casing and well-bore fluid to provide the final product.6
In 2001, API RP 19B, Recommended Practices for Evaluation of Well Perforators, replaced API RP 43; it was updated in 2006.7 The most signifi-cant change introduced by the new standards was strict specifications for concrete aggregate tar-gets used to evaluate charge penetration in Section 1 tests.8 These updated practices included narrow tolerances that ensured comparisons between shaped charges from various charge pro-viders were based on results from identical tar-gets. However, API RP 19B surface tests may not directly correlate with downhole charge perfor-mance predictions because most penetration models were developed from the outdated DoP data acquired using API RP 43 practices.
From extensive laboratory testing, SRC researchers discovered that the common prac-tice of sequentially applying corrections to API RP 19B Section 1 DoP data results in overly opti-mistic downhole performance predictions that are not representative of results observed in stressed-rock tests. The discrepancies between predicted performance and laboratory results are attributed to the following:• excessive reliance on API RP 19B Section 1
results in unstressed rocks• lack of research using modern charges• unrealistic treatment of in situ stress effects in
modeling programs.9
4. McDowell JM and Muskat M: “The Effect on Well Productivity of Formation Penetration Beyond Perforated Casing,” Transactions of the AIME 189 (1950): 309–312.
5. Behrman et al, reference 1.6. Harvey J, Grove B, Zhan L and Behrmann L: “New
Predictive Model of Penetration Depth for Oilwell-Perforating Shaped Charges,” paper SPE 127920, presented at the SPE International Symposium and Exhibition on Formation Damage Control, Lafayette, Louisiana, USA, February 10–12, 2010.
7. American Petroleum Institute, reference 2.8. For more on concrete aggregate effects on testing:
Brooks JE, Yang W and Behrmann LA: “Effect of Sand-Grain Size on Perforator Performance,” paper SPE 39457, presented at the SPE International Symposium on Formation Damage Control, Lafayette, Louisiana, February 18–19, 1998.
9. Harvey et al, reference 6.
> Industry penetration prediction models. Test results in concrete targets (left) built to API RP 19B Section 1 specifications are used in industry models to predict perforation performance under downhole conditions. The concrete is cured for 28 days before testing. Technicians use a test briquette made with the same batch of concrete to confirm the mechanical properties of the target. Researchers at Schlumberger compared several models (right) to predict charge penetration using the same type of charge under identical conditions. The traditional concrete-based SPAN model (light blue) predicted the shallowest depth of penetration (DoP). For further validation, a test was performed on a stressed-rock sample; the properties were input in the various models. All the model predictions were overly optimistic compared with the actual DoP in the stressed-rock sample. (Adapted from Harvey et al, reference 14.)
CasingGun
WaterTestbriquette
Steelculvert
28-day concrete
Pene
tratio
n pr
edic
tion,
in.
Penetration model
Penetration Model Results
0
5
10
15
20
25
30
35
40 Model 1Model 2Model 3Model 4SPAN model, concreteStressed-rock test
Autumn 2014 17
Newer shaped charges penetrate much deeper into test targets than did older generation charges, and simple extrapolations of test data often yield incorrect results. Compared with those from older perforating systems, modern shaped charges used in similar environments may exceed penetration performance by 100% or more. This greatly compounds the effects of model uncertainty (right). Tests in unstressed concrete targets may introduce large uncertain-ties in predicting actual penetration, even though the tests are conducted in targets that adhere to the stricter standards of API RP 19B Section 1.
Using industry models, engineers found a wide variability in charge performance predictions. These models begin with data from API RP 19B Section 1 performance in concrete followed by sequential applications of corrections for rock type, downhole stress and environmental condi-tions. Modern charges far exceed the penetration of older generation charges, although engineers
> Sequential modeling. Most predictive penetration modeling software used in the industry follows a sequential path: API RP 19B Section I test data in concrete (top left) are corrected for 7,000-psi [48.3-MPa] UCS Berea sandstone (top middle), corrected for rock type (right) and effective stress (bottom right) and then corrected for downhole conditions, including casing size and type, fluid properties and gun geometry. The result is often presented as a 2D model of DoP (bottom left). For the final results using the sequential model, the interaction of the various parameters with each other is given little consideration. (Adapted from Martin et al, reference 13.)
Section 1 concrete
Other rock types
Effective stressDownhole conditions
Basis of Industry ModelsSection 1 Concrete Tests
Tests in 7,000-psi Berea Sandstone
Rock
pen
etra
tion,
in.
Measured axial strength, psi2,000 6,000 10,000 14,000 18,000 22,000
4
6
8
10
12
14
16
18
20
22
24
Casing
Gun
WaterTestbriquette
Steelculvert
28-day concrete
Frac
tion
of s
urfa
ce p
enet
ratio
n
Applied effective stress, psi2,000
0.5
0.6
0.7
0.8
0.9
1.0
4,000 6,000 8,0000
BrineCement
FormationDamage zone
Average
060
120180240300
PhaseAngle, °
1.45
3.382.170.480.000.482.17
Clearance,in.
18.23
14.8917.6419.9919.2219.9917.64
Total Penetration, in.
17.07
13.7316.4918.8318.0718.8316.49
Formation Penetration, in.
Open Flow Area, in.2/ft
0.71
0.430.520.930.780.930.52
Formation Diameter, in.
0.48547 at6 shots per ft
0.32
0.200.250.430.360.430.25
Entrance Hole Diameter, in.
Shaped charge
Annulus fluid
Target plate
Rubber sleeve
4- or 7-in.diameter core
Core vent
Fluid inlet
SandstoneLimestone
System 1System 2System 3System 4
> Historical penetration data used in penetration prediction models. Historical data, based on API RP 43 guidelines (blue shading), were used to develop many penetration prediction models in use today. The DoP values (black dots) on which these models are based were all less than 30 in. [76 cm]; modern deep-penetrating charges, unavailable when most of these models were created, can exceed 60-in. [152-cm] DoP. Researchers at Schlumberger observed that the assumption of a linear relationship (black line) between DoP from tests in concrete and those in Berea sandstone does not hold true for these deep-penetrating charges. The relationship may be asymptotic (red). Because of the difference between historical and current penetration depths, small errors in the model can introduce a large uncertainty in predicting DoP in rock samples (pink shading). (Adapted from Martin et al, reference 13.)
API R
P 43
Sec
tion
2Be
rea
sand
ston
e pe
netra
tion,
in.
API RP 43 Section 1 concrete penetration, in.
Modern chargeperformance
Area of uncertainty
00
10
20
30
40
10 20 30 40 50 60
18 Oilfield Review
determined that performance of these charges is more affected by in situ stress than were the older generation charges. Researchers at SRC concluded that the simplistic approach of sequential corrections in prediction models pro-duces misleading results for modern charges. They also noted that effective stress has a greater effect on DoP and perforation tunnel geometry than previously believed, and model-ing programs do not fully account for these
effects. Penetration performance downhole can be overestimated by as much as 240% compared with traditional model predictions.10
Stressed-Rock Penetration CorrelationMost modeling software applies rock-strength effects on DoP predictions based on research conducted in the early 1960s.11 These models treat rock strength and downhole stress condi-tions separately without regard to how these conditions interact with each other. Researchers
at that time developed a simple logarithmic for-mula that computes DoP from expected down-hole UCS.12 The relationship is based on the following assumptions:• Penetration performance across multiple tar-
gets can be characterized from a measurement in a single target.
• Charges cannot be optimized for a given target strength.
• The correction for UCS is the same regardless of rock type.
• The performance trends in unstressed targets such as those in API RP 19B (or 43B) Section 1 tests will be the same as those in stressed targets.
Tests of state-of-the-art perforating gun systems have demonstrated that some of these assump-tions result in discrepancies between actual per-formance and model results.13
To address these discrepancies, Schlumberger researchers developed a new parameter—the ballistic indicator function, FBI. This function combines formation intrinsic properties (UCS and porosity) and extrinsic properties (overbur-den stress and pore pressure) to more accurately predict shot performance in downhole conditions (left). The parameter was defined after research-ers conducted more than 200 experiments using four charge types and targets with UCS values ranging from 11 to 110 MPa [1,600 to 16,000 psi].14
Based on the results of their experiments, the researchers developed and introduced a new DoP computation model. Previous models often used a simple equation to determine downhole DoP. Section 1 test results for DoP in concrete were adjusted using only the difference between test target UCS and the estimated downhole UCS. The new model requires six parameters: two shaped charge–specific parameters and four formation-
10. Harvey et al, reference 6.11. Thompson GD: “Effects of Formation Compressive
Strength on Perforator Performance,” paper API-62-191, presented at the Drilling and Production Practice Conference, New York City, January 1, 1962.
12. Unconfined compressive strength, a measure of rock strength, is the maximum uniaxial compressive stress that a material can withstand under the condition of no confining stress.
13. Martin A, Grove B, Harvey J, Zhan L and Atwood D: “A New Direction for Predicting Perforating Gun Performance,” paper MENAPS-11-12, presented at the Middle East and North Africa Perforating Symposium, Abu Dhabi, UAE, November 28–30, 2011.
14. Harvey J, Grove B and Zhan L: “Stressed Rock Penetration Depth Correlation,” paper SPE 151846, presented at the SPE International Symposium and Exhibition on Formation Damage Control, Lafayette, Louisiana, February 15–17, 2012.
15. Grove B, Harvey J and Zhan L: “Perforation Cleanup by Means of Dynamic Underbalance: New Understanding,” SPE Drilling & Completion 28, no. 1 (March 2013): 11–20.
16. For more on the perforation process, damage zones and tunnel debris: Baxter et al, reference 3.
> Predicting DoP using the ballistic indicator function. After performing hundreds of sample test shots, researchers at Schlumberger developed a realistic model for predicting DoP (top); the new model includes data from modern deep-penetrating charges. This method includes a ballistic indicator function (FBI), which is computed from UCS and ballistic effective stress, Peff . The Peff is determined from the confining stress, Pc, pore pressure, Pp, and a ballistic pore pressure coefficient, a. The ballistic pore pressure coefficient is computed from porosity. The stress influence coefficient, b, is a function of the UCS. The unitless exponential charge coefficient, α0, must be determined empirically for each shaped charge. For the exponential charge coefficient, a fixed value of 8 × 10⁻⁵ (bottom, dark blue) can be used, but an accurate choice of this parameter gives more representative predictions, especially in weaker rocks. The various parameters are then incorporated in an equation that includes two reference values, FBI ref and DoPref, which were determined from tests conducted in 69-MPa [10,000-psi] UCS rock. Since the introduction of this model, engineers have validated the results with thousands of tests. (Adapted from Harvey et al, reference 6.)
DoP,
in.
FBI, psi
00 5,000 10,000 15,000 20,000
5
10
20
30
15
25
35
αo = 8 × 10⁻⁵
αo = 7 × 10⁻⁵
αo = 6 × 10⁻⁵
αo = 5 × 10⁻⁵
αo = 4 × 10⁻⁵
DoP = DoP in the producing formation.
DoPref = DoP in a reference formation using FBI ref at 10,000 psi.αo = Exponential charge coefficient.
FBI = Ballistic indicator function of producing formation, psi.FBI ref = Ballistic indicator function in a reference formation at 10,000 psi.UCS = UCS of producing formation, psi.
Peff = Ballistic effective stress, psi.
Pc = Confining stress, psi.
Pp = Pore pressure, psi.
a = Ballistic pore pressure coefficient.
b = Stress influence coefficient.
φ = Porosity, %.
FBI = UCS + b × Peff .
Peff = Pc– a × Pp.
3.33 × e –9.55 ×10⁻⁵ × UCS, UCS > 30,000 psi. – =
0.7336 – 1.813 × 10⁻⁵ × UCS, UCS < 30,000 psi.b
( (DoPDoPref
In = FBI ref – FBIαo .
φ φ×( =0.0967 0.428a ) .
Autumn 2014 19
specific parameters (UCS, porosity, confining pressure and pore pressure). A reference FBI was chosen using a 69-MPa [10,000-psi] baseline, which represents the center of the dataset.Replacing one charge-specific parameter with two means that engineers can optimize perfora-tion designs for specific targets: for example,
hard versus soft formations. Following the intro-duction of the six-parameter model, hundreds of additional tests have been conducted to confirm the validity of the method (above). However, DoP is only part of the overall picture of perforation performance; researchers also looked at the flow effectiveness of the perforation tunnels.15
Effective PerforationsPerforating opens holes in solid steel casing and then creates perforation tunnels that are usually filled with debris and lined with a layer of shock-damaged rock (below).16 The damaged rock and debris impede fluid flow. The effects can be quan-tified in the term skin, which includes formation
> Logarithmic response and rock-specific corrections. Penetration tests, conducted in sandstone cores of varying applied stress and UCS (bottom left), indicate that the relationship between the FBI and DoP is logarithmic (top left ). In addition, the plot of DoP versus FBI (right ) indicates that performance is rock dependent. Using the same type of charge, technicians performed tests in sandstone (blue diamonds) and carbonate (red squares) cores; curves fit to the data—sandstone (blue) and carbonate (red)—indicate that the DoP in sandstone is greater than the DoP in carbonate. The difference in DoP is more pronounced in weaker rocks. The SPAN Rock program includes corrections for both rock strength and type. These tests further validate the ballistic indicator function model.
A
B
CD
DoP,
in.
FBI, psi
0
00 5,000 10,000 15,000 20,000 25,000
DoP,
in.
FBI, psi
5
10
15
20
25
5
10
20
15
25
30
35
40
5,000 10,000 15,000 20,000 25,000 30,0000
SandstoneCarbonate
Formation DoP, in. FBI , psi UCS, psi Pc, psi Pp, psi
A Castlegate 20.8 4,500 1,600 4,000 0
B Berea 16.5 10,400 8,000 4,000 0
C Nugget 9.0 17,800 16,000 4,000 0
D Berea 8.5 19,800 8,000 20,000 0
> Tunnel cleanup following traditional perforating. Tunnels produced by traditional perforating techniques may be plugged with flow-impeding debris (left). The walls of the tunnels are lined with damaged rock that may also act as an impediment to flow (middle top). Methods for predicting flow effectiveness into the wellbore assume uniform flow from the formation into the perforation tunnels (top right). Because the tunnels have nonuniform damage along the tunnel walls and varying degrees of plugging (middle bottom), uniform flow is atypical, and in reality, flow into perforation tunnels using conventional methods is restricted (bottom right). (Adapted from Grove et al, reference 15.)
1 in.
Perforating debris
Perforating debris
Uniform damage
Nonuniform damage
Assumed Condition After Conventional Treatment
Conventional Perforating
Likely Condition After Treatment
Unrealistic Model
Ineffective Flow
20 Oilfield Review
damage caused by drilling, completion and perfo-ration practices.17 Although DoP is often consid-ered the most crucial component in production efficiency, in practice, the condition and geometry of the perforation tunnel have as much to do with the effectiveness of perforating as does DoP.18
One conventional predictor of perforation effectiveness is core flow efficiency (CFE), which is the ratio of measured productivity to theoreti-cal productivity of a laboratory-perforated core. The CFE of an ideal undamaged perforation tun-nel is 1.0; anything less than 1.0 indicates dam-age caused during perforating. A CFE greater than 1.0 indicates stimulation.
A CFE computed from the ratio of measured to theoretical productivity raises many questions because of assumptions made in the method.19 Traditional CFE computation assumes 1D radial flow into perforation tunnels with a constant tun-nel diameter, which is not usually the case. The models for predicting CFE also assume that the crushed zone, the damaged rock along the tunnel wall, is the only contributor to reduced flow,
ignoring perforation debris in the tunnels.20 In addition, a permeability-impaired crushed zone of constant thickness is assumed for the length of the tunnel, although the thickness and permea-bility are known to vary along the length of the tunnel. Another assumption used to develop the CFE computation is that cleanup during flowback can improve crushed zone permeability, which may not be true for all perforation tunnels. One last crucial assumption is that CFE is the ratio of the damaged perforation tunnel productivity to that of a theoretical undamaged tunnel; however, undamaged perforation tunnel productivity may be difficult to quantify.
Many wells are allowed to flow after they have been perforated to remove damaged rock and per-foration debris. One common method used by operators to initiate flow immediately after perfo-rating is static underbalanced perforating—an operation in which the pressure in the wellbore prior to punching holes in the casing is main-tained below that of the formation pore pressure. The effectiveness of perforation cleanup using the static underbalanced technique depends on
individual perforation flow efficiency and the effectiveness of flow from the reservoir into the perforations. One problem with this method is that the perforations with the best flow character-istics contribute the majority of the flow, and those that would benefit the most from cleanup remain debris filled and damaged.
An alternative to static underbalanced per-forating is the PURE DUB perforating tech-nique, a proven method of improving flow efficiency of perforation tunnels as measured by the productivity ratio of the well (above).21 The technique removes damaged rock from the walls of the perforation tunnels and flow-restricting debris from the tunnels.22 In addition to improv-ing well performance, PURE DUB perforating offers operational and safety advantages; for example, PURE DUB perforating can be achieved even under conditions in which a well cannot maintain a static underbalanced state prior to perforating, such as when open perfora-tions are present, or when static overbalance is required for well control.
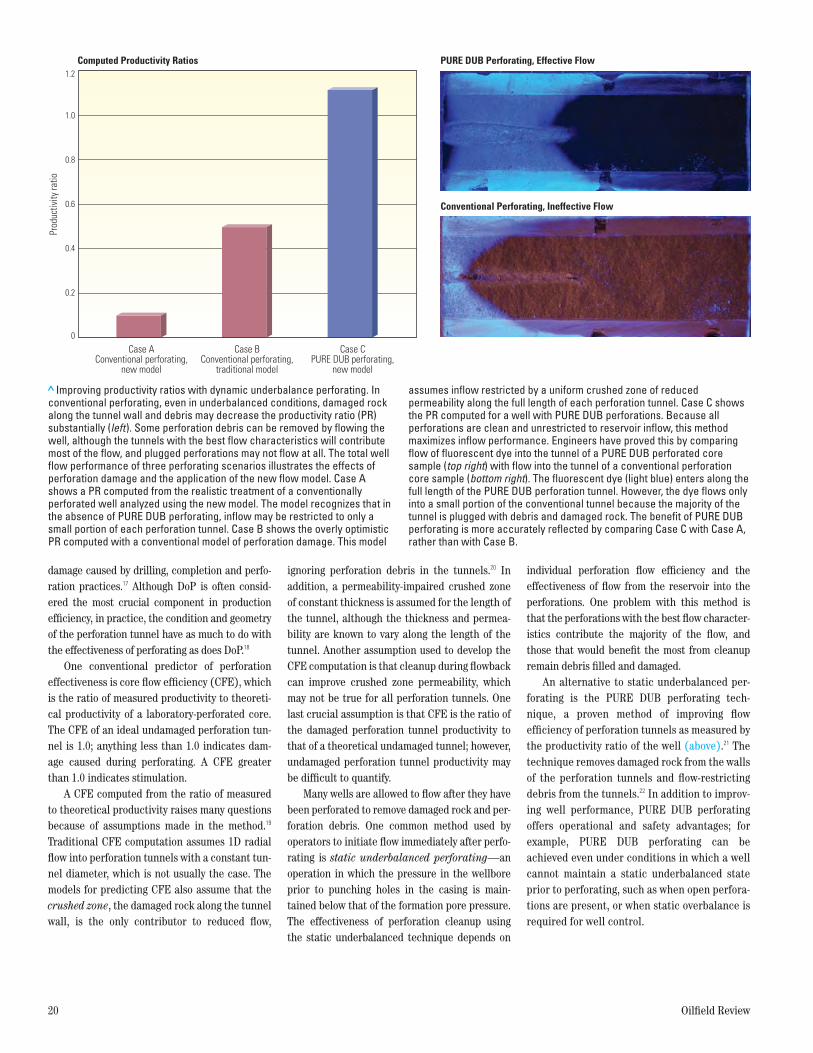
> Improving productivity ratios with dynamic underbalance perforating. In conventional perforating, even in underbalanced conditions, damaged rock along the tunnel wall and debris may decrease the productivity ratio (PR) substantially (left). Some perforation debris can be removed by flowing the well, although the tunnels with the best flow characteristics will contribute most of the flow, and plugged perforations may not flow at all. The total well flow performance of three perforating scenarios illustrates the effects of perforation damage and the application of the new flow model. Case A shows a PR computed from the realistic treatment of a conventionally perforated well analyzed using the new model. The model recognizes that in the absence of PURE DUB perforating, inflow may be restricted to only a small portion of each perforation tunnel. Case B shows the overly optimistic PR computed with a conventional model of perforation damage. This model
assumes inflow restricted by a uniform crushed zone of reduced permeability along the full length of each perforation tunnel. Case C shows the PR computed for a well with PURE DUB perforations. Because all perforations are clean and unrestricted to reservoir inflow, this method maximizes inflow performance. Engineers have proved this by comparing flow of fluorescent dye into the tunnel of a PURE DUB perforated core sample (top right) with flow into the tunnel of a conventional perforation core sample (bottom right). The fluorescent dye (light blue) enters along the full length of the PURE DUB perforation tunnel. However, the dye flows only into a small portion of the conventional tunnel because the majority of the tunnel is plugged with debris and damaged rock. The benefit of PURE DUB perforating is more accurately reflected by comparing Case C with Case A, rather than with Case B.
PURE DUB Perforating, Effective FlowComputed Productivity Ratios
Conventional Perforating, Ineffective Flow
Case CPURE DUB perforating,
new model
Case AConventional perforating,
new model
Case BConventional perforating,
traditional model
0.2
0.4
0.6
0.8
1.0
1.2
Prod
uctiv
ity ra
tio
0
Autumn 2014 21
The concept of DUB perforating grew out of studies performed at the SRC laboratory. The per-foration cleanup process is controlled primarily by formation properties and wellbore pressure transients created by a gun system (below). For cleanup, PURE DUB perforating is more effective than flowing the well or perforating underbal-anced. Recent research is shedding light on the technique and has demonstrated that wells per-forated with PURE DUB systems experience sig-nificant improvements in flow efficiency.
A feature of the SPAN Rock program is the introduction of an updated flow model that over-comes limitations of the conventional CFE method and more accurately predicts DUB perfo-rating results. The model developed at the SRC laboratory is based on multiple experiments, incorporates realistic flow modeling and is con-sistent with the actual mechanisms of perfora-tion cleanup.23
The processes involved in DUB perforating are complex, although modeling software to predict the effectiveness of a perforating sys-tem has been developed that accounts for well-
bore pressure transients, formation properties and inflow simulation.24 The workflow and modeling are integral parts of the SPAN Rock software program.
SPAN Rock SoftwareThe SPAN Schlumberger perforating analysis program was introduced in the 1980s. The pro-gram computed DoP from concrete target test results and predicted perforation geometry for any Schlumberger gun combination and charge type in any casing size, including multiple cas-ing strings. A productivity module was included in the program to evaluate perforation effective-ness and efficiency. A graphic interface allowed visual comparisons of the performance of vari-ous gun systems.
The SPAN software has undergone many updates since its introduction. In the current ver-sion, the newly developed, stressed rock–based penetration model replaces the original con-crete-based model.25 The updated name of the SPAN Rock program reflects this change. The penetration model is not the only addition to the
software; several major functionality enhance-ments have been included.
The SPAN Rock program features the indus-try’s first DUB perforation cleanup model.26 The model calculates perforation cleanup as a func-tion of wellbore pressure dynamics and forma-tion characteristics. Based on the current published and peer-reviewed research, the new model allows users to predict cleanup in either the conventional “crushed zone” (kc/k) frame-work, or the newly published “effective flowing length” (Lc/L) framework.27 The combination of more-accurate models for both DoP and cleanup translates to much more reliable predictions of well performance.
Along with the perforation crushed zone model described by the SPAN Rock software, new algorithms have been developed to estimate the effects of rock strength. These estimates com-pute productivity for both oil and gas wells. If petrophysical logs are available to construct a mechanical earth model, these data can be imported directly into the software and used to compute realistic penetration and production
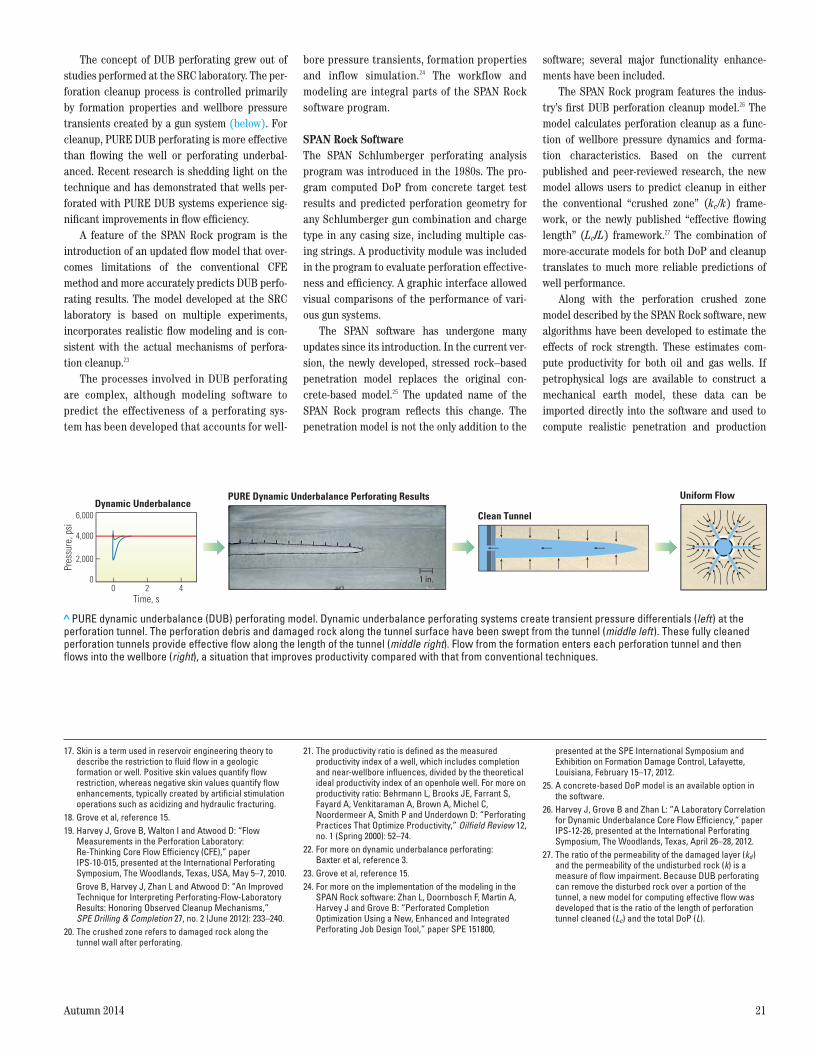
> PURE dynamic underbalance (DUB) perforating model. Dynamic underbalance perforating systems create transient pressure differentials (left) at the perforation tunnel. The perforation debris and damaged rock along the tunnel surface have been swept from the tunnel (middle left). These fully cleaned perforation tunnels provide effective flow along the length of the tunnel (middle right). Flow from the formation enters each perforation tunnel and then flows into the wellbore (right), a situation that improves productivity compared with that from conventional techniques.
00 2
Time, s
Dynamic UnderbalancePURE Dynamic Underbalance Perforating Results
Clean Tunnel
Uniform Flow
Pres
sure
, psi
4
2,000
4,000
6,000
1 in.
17. Skin is a term used in reservoir engineering theory to describe the restriction to fluid flow in a geologic formation or well. Positive skin values quantify flow restriction, whereas negative skin values quantify flow enhancements, typically created by artificial stimulation operations such as acidizing and hydraulic fracturing.
18. Grove et al, reference 15.19. Harvey J, Grove B, Walton I and Atwood D: “Flow
Measurements in the Perforation Laboratory: Re-Thinking Core Flow Efficiency (CFE),” paper IPS-10-015, presented at the International Perforating Symposium, The Woodlands, Texas, USA, May 5–7, 2010.
Grove B, Harvey J, Zhan L and Atwood D: “An Improved Technique for Interpreting Perforating-Flow-Laboratory Results: Honoring Observed Cleanup Mechanisms,” SPE Drilling & Completion 27, no. 2 (June 2012): 233–240.
20. The crushed zone refers to damaged rock along the tunnel wall after perforating.
21. The productivity ratio is defined as the measured productivity index of a well, which includes completion and near-wellbore influences, divided by the theoretical ideal productivity index of an openhole well. For more on productivity ratio: Behrmann L, Brooks JE, Farrant S, Fayard A, Venkitaraman A, Brown A, Michel C, Noordermeer A, Smith P and Underdown D: “Perforating Practices That Optimize Productivity,” Oilfield Review 12, no. 1 (Spring 2000): 52–74.
22. For more on dynamic underbalance perforating: Baxter et al, reference 3.
23. Grove et al, reference 15.24. For more on the implementation of the modeling in the
SPAN Rock software: Zhan L, Doornbosch F, Martin A, Harvey J and Grove B: “Perforated Completion Optimization Using a New, Enhanced and Integrated Perforating Job Design Tool,” paper SPE 151800,
presented at the SPE International Symposium and Exhibition on Formation Damage Control, Lafayette, Louisiana, February 15–17, 2012.
25. A concrete-based DoP model is an available option in the software.
26. Harvey J, Grove B and Zhan L: “A Laboratory Correlation for Dynamic Underbalance Core Flow Efficiency,“ paper IPS-12-26, presented at the International Perforating Symposium, The Woodlands, Texas, April 26–28, 2012.
27. The ratio of the permeability of the damaged layer (kd) and the permeability of the undisturbed rock (k) is a measure of flow impairment. Because DUB perforating can remove the disturbed rock over a portion of the tunnel, a new model for computing effective flow was developed that is the ratio of the length of perforation tunnel cleaned (Lc) and the total DoP (L).
22 Oilfield Review
predictions versus depth. The effects of gravel packing, reservoir boundaries and partial com-pletions can be included in the productivity analysis (above).
Engineered Gun System DesignsOne of the benefits of the SPAN Rock program is that an engineer can optimize a perforating strat-egy by performing a sensitivity analysis simulating different gun systems and perforating charges. In an example well with relatively deep formation
damage, a PURE DUB design—Gun System 1—used a 41/2-in. carrier loaded with deep-penetrating charges at 5 shots per ft (spf). For the analysis, 1 out of 10 charges was replaced with a DUB puncher charge, leading to an effective 4.5 spf (next page). Puncher charges allow wellbore and
No
Yes
New rock-basedpenetration model
Transient wellborepressure prediction
simulator
Accurate perforationskin model
Improved wellskin model
Productivity ratio, productivityindex, production rate, total skin
and all skin components andsensitivity analysis results
Data collection
Select optimalgun system
Well productivitycalculation and gun
performance evaluation
Perforation tunnelcondition
assessment
Perforation depth, entrance hole size and perforation
diameter estimation
Perforation depth, entrance holeand initial perforation
diameter values
Change input dataor gun systemparameters?
Reservoir Properties• Rock mechanical properties• Stress condition• Rock type• Formation permeability• Formation porosity• Formation anisotropy• Formation heterogeneity• Formation fluid properties (viscosity, reservoir pressure, temperature and others)
Charge, Gun and Toolstring System
• Charge type and size• Gun type and size• Charge loading pattern (phasing and shot density)• Other tools in the string• Toolstring setup condition (centered or eccentered and detailed geometries)
Near-WellboreFormation and Flow
Condition • Drilling fluid invasion and particle migration (near-wellbore formation damage radius and severity)• Near-wellbore fluid flow condition (laminar or turbulent flow)
Well and WellboreCondition
• Wellbore geometry• Tubing and cement specifications• Wellbore fluid properties• Wellbore orientation and deviation• Wellbore fluid pressure condition with respect to reservoir fluid pressure• Gravel packing• Screen properties
DUB properties, crushed zonedamage, tunnel fill, clean-tunnel
length and refined tunnel diameter
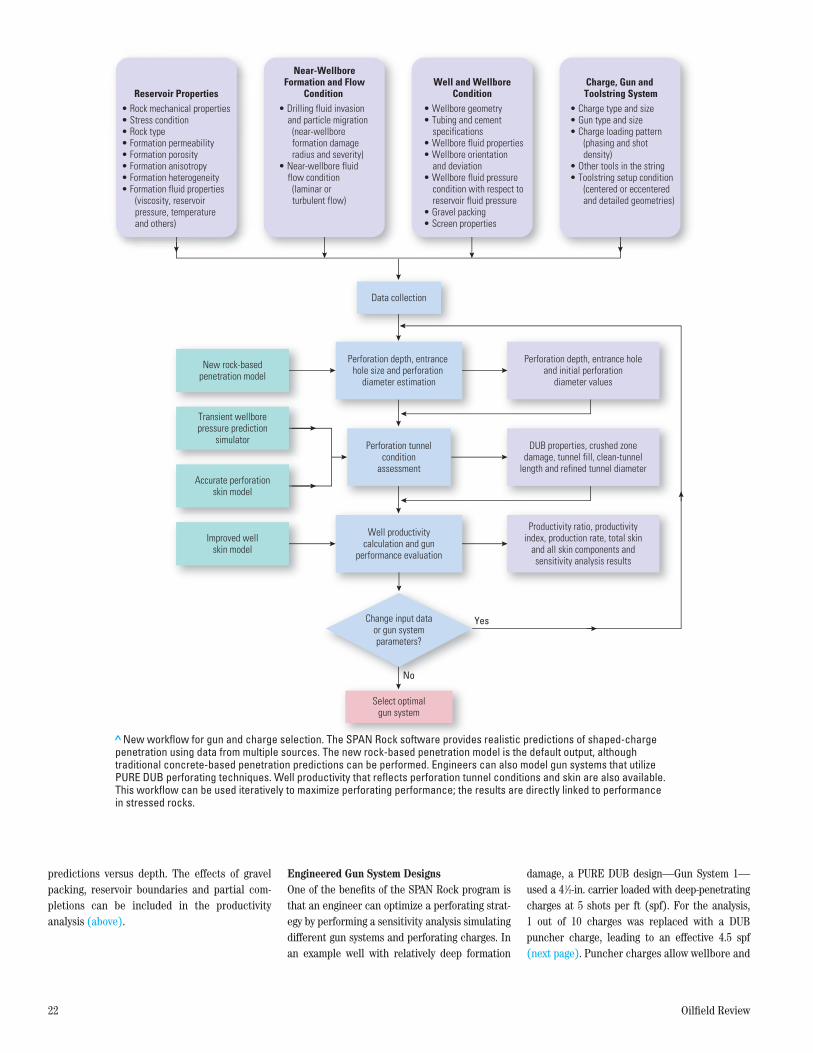
>New workflow for gun and charge selection. The SPAN Rock software provides realistic predictions of shaped-charge penetration using data from multiple sources. The new rock-based penetration model is the default output, although traditional concrete-based penetration predictions can be performed. Engineers can also model gun systems that utilize PURE DUB perforating techniques. Well productivity that reflects perforation tunnel conditions and skin are also available. This workflow can be used iteratively to maximize perforating performance; the results are directly linked to performance in stressed rocks.
Autumn 2014 23
formation fluids to rapidly enter the gun carrier, which creates a dynamic underbalance condition.
The permeability of the formation was high, a condition that can lead to non-Darcy skin effects for low-spf gun systems.28 Gun System 2 was loaded at 12 spf in a 41/2-in. carrier. This system had the potential to overcome the non-Darcy skin because of the increased flow area compared with that of the 4.5-spf system. However, the 12-spf gun includes trade-offs: The DoP is reduced because the gun must use smaller charges, and the DUB perforating effects do not occur because the gun included no DUB puncher charges.
After running the scenarios in the SPAN Rock program, the design engineer quantifiably dem-onstrated that Gun System 1 delivered a substan-tially higher productivity than did Gun System 2. A third gun system that used charges similar to those in Gun System 2 but that was loaded at 8 spf was modeled; Gun System 3 included DUB puncher charges. This gun system had a higher shot density than that of Gun System 1 to reduce non-Darcy skin, and DUB effects were generated with the puncher charges. Because deep-pene-trating PowerJet Omega charges in Gun System 1 penetrated beyond drilling-induced damage, Gun System 1 still outperformed Gun System 3.
Shock, the EnemyMost shaped-charge testing and characterization focus on the performance of individual charges with little regard to system dynamics. The tran-sient interactions that occur during and just after detonation are difficult to reproduce using sur-face testing systems; however, because of deeper understanding of perforation shock physics and advances in computational power, modeling soft-ware is now able to simulate gun shock loads. These dynamic forces are sensitive to casing and tubing geometry, gun hardware, shaped-charge variations, perforating gun shot density and fluid effects. By controlling the effects of gun shock, operators can improve perforating performance and avoid costly damage to downhole hardware.
During a typical casing gun operation, com-plex interactions occur in the wellbore and in the gun system when perforating jets exit the gun carrier. The wellbore hydrodynamics are affected primarily by by three conditions: detonation gas pressure inside the guns, wellbore fluid pressure and formation pore pressure.29 Liquid wellbore fluids typically have high density and low com-pressibility compared with the air initially inside the gun system and gases generated during perfo-rating. The pressure differential created between the pressure inside the guns and the hydrostatic wellbore pressure during detonation results in
transient pressure waves within the wellbore fluid that propagate radially and axially up and down the wellbore. These pressure waves travel through the wellbore at the fluid’s speed of sound, approximately 1,500 m/s [4,900 ft/s].
Predicting the hydrodynamic effects caused by these pressure waves and the structural loads they impose on gun systems, tubulars, downhole hardware, cables (for wireline-conveyed systems) and other well components requires knowledge of gun system dynamics, wellbore dynamics and reservoir pore pressure conditions. PURE plan-ner software developed to predict and optimize DUB perforating also enables engineers to evalu-ate gun-shock loads and structural dynamic response on completion hardware.
The value of this modeling capability was recently demonstrated in a tubing-conveyed per-forating (TCP) operation that used a 7-in. HSD
high shot density perforating gun system. The guns covered a 50-m [164-ft] net interval and were loaded at 39 shots per m (spm) with deep-penetrating charges. Initial wellbore pressure was expected to be 37.9 MPa [5,500 psi], and the brine completion fluid density was 1,102 kg/m3 [9.2 lbm/galUS]. The expected reservoir pore pressure was 44.8 MPa [6,500 psi]—6.9 MPa [1,000 psi] higher than the wellbore pressure,
28. Darcy’s law assumes laminar flow. Non-Darcy skin results from restricted fluid flow typically observed in high-rate gas wells when the flow converging on the wellbore attains high velocity and reaches turbulent flow. Since most of the turbulent flow takes place near the wellbore in producing formations, the effect of non-Darcy flow is a rate-dependent skin effect.
29. Baumann C, Dutertre A, Khaira K, Williams H and Mohamed HNH: “Risk Minimization when Perforating with Automatic Gun Release Systems,” paper SPE 156967, presented at the SPE Trinidad and Tobago Energy Conference and Exhibition, Port of Spain, Trinidad and Tobago, June 11–13, 2012.
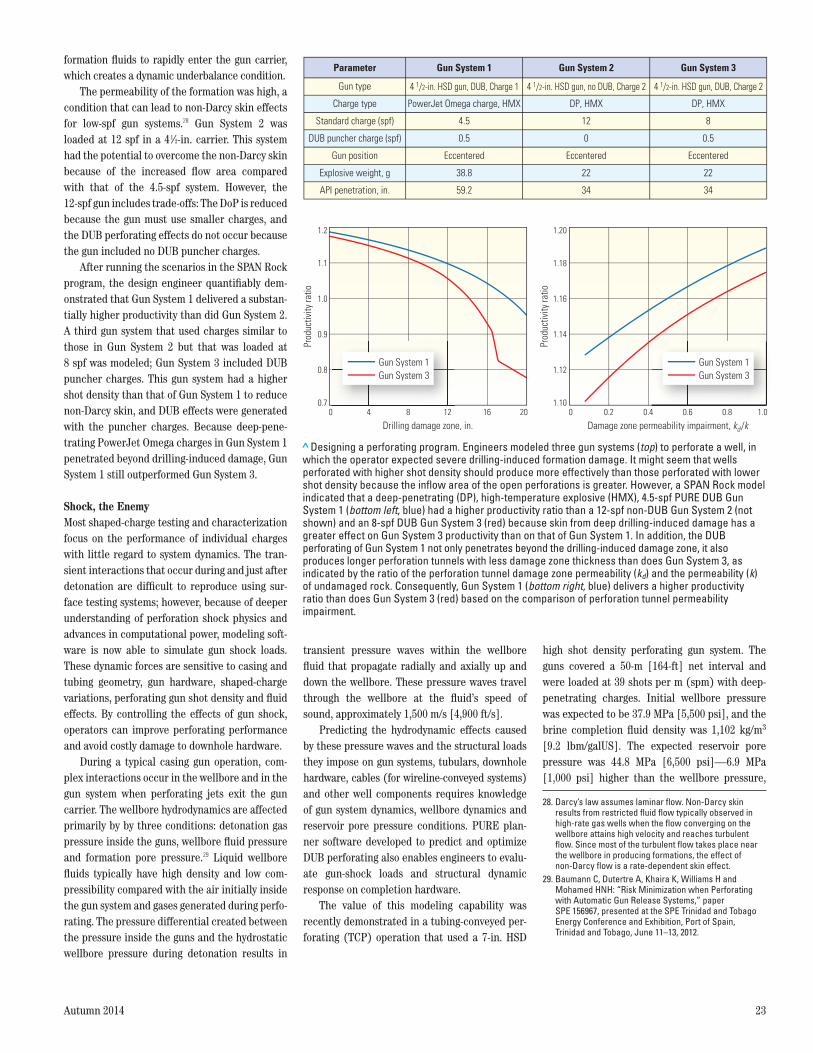
> Designing a perforating program. Engineers modeled three gun systems (top) to perforate a well, in which the operator expected severe drilling-induced formation damage. It might seem that wells perforated with higher shot density should produce more effectively than those perforated with lower shot density because the inflow area of the open perforations is greater. However, a SPAN Rock model indicated that a deep-penetrating (DP), high-temperature explosive (HMX), 4.5-spf PURE DUB Gun System 1 (bottom left, blue) had a higher productivity ratio than a 12-spf non-DUB Gun System 2 (not shown) and an 8-spf DUB Gun System 3 (red) because skin from deep drilling-induced damage has a greater effect on Gun System 3 productivity than on that of Gun System 1. In addition, the DUB perforating of Gun System 1 not only penetrates beyond the drilling-induced damage zone, it also produces longer perforation tunnels with less damage zone thickness than does Gun System 3, as indicated by the ratio of the perforation tunnel damage zone permeability (kd) and the permeability (k) of undamaged rock. Consequently, Gun System 1 (bottom right, blue) delivers a higher productivity ratio than does Gun System 3 (red) based on the comparison of perforation tunnel permeability impairment.
Gun type
Parameter
Gun position
Explosive weight, g
API penetration, in.
Charge type
Standard charge (spf)
DUB puncher charge (spf)
Gun System 1
Eccentered
38.8
59.2
4.5
0.5
4 1/2-in. HSD gun, DUB, Charge 1
PowerJet Omega charge, HMX
Gun System 2
Eccentered
22
34
12
0
4 1/2-in. HSD gun, no DUB, Charge 2
DP, HMX
Gun System 3
Eccentered
22
34
4 1/2-in. HSD gun, DUB, Charge 2
DP, HMX
8
0.5
Prod
uctiv
ity ra
tio
Drilling damage zone, in.0
0.7
0.8
0.9
1.0
1.1
1.2
4 8 12 16 20
Gun System 3Gun System 1
Prod
uctiv
ity ra
tio
Damage zone permeability impairment, kd/k0
1.10
1.12
1.14
1.16
1.18
1.20
0.2 0.4 0.6 0.8 1.0
Gun System 3Gun System 1
24 Oilfield Review
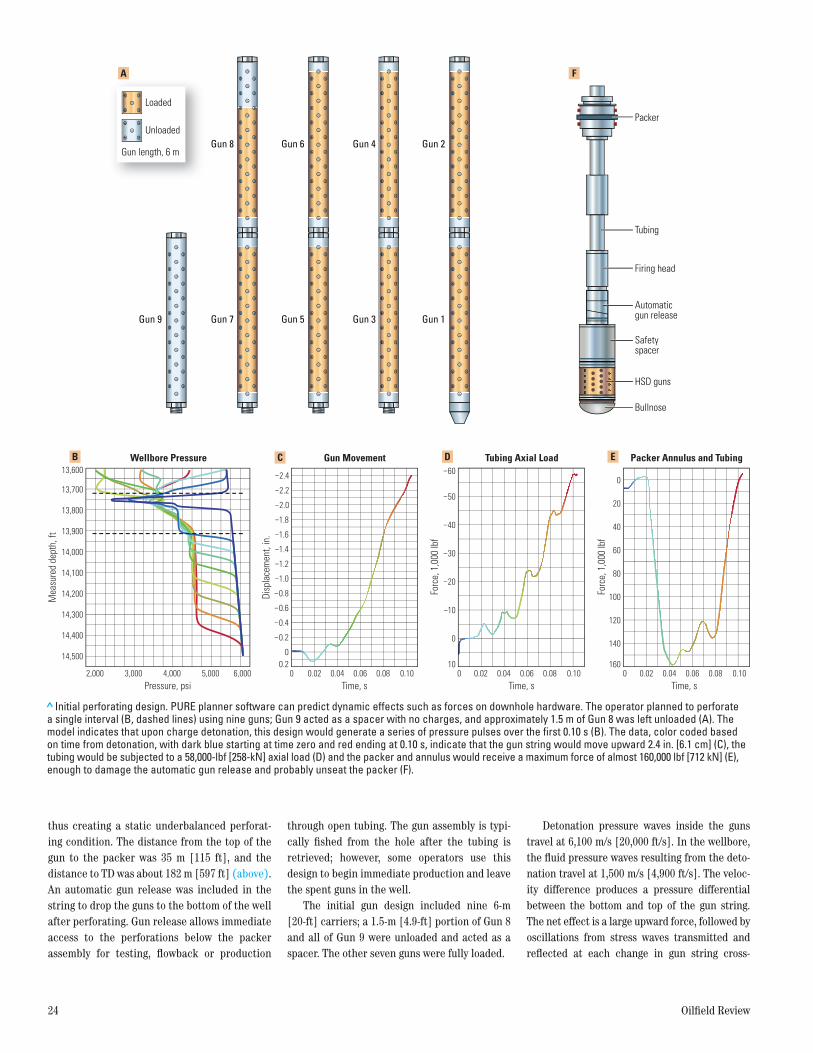
thus creating a static underbalanced perforat-ing condition. The distance from the top of the gun to the packer was 35 m [115 ft], and the distance to TD was about 182 m [597 ft] (above). An automatic gun release was included in the string to drop the guns to the bottom of the well after perforating. Gun release allows immediate access to the perforations below the packer assembly for testing, flowback or production
through open tubing. The gun assembly is typi-cally fished from the hole after the tubing is retrieved; however, some operators use this design to begin immediate production and leave the spent guns in the well.
The initial gun design included nine 6-m [20-ft] carriers; a 1.5-m [4.9-ft] portion of Gun 8 and all of Gun 9 were unloaded and acted as a spacer. The other seven guns were fully loaded.
Detonation pressure waves inside the guns travel at 6,100 m/s [20,000 ft/s]. In the wellbore, the fluid pressure waves resulting from the deto-nation travel at 1,500 m/s [4,900 ft/s]. The veloc-ity difference produces a pressure differential between the bottom and top of the gun string. The net effect is a large upward force, followed by oscillations from stress waves transmitted and reflected at each change in gun string cross-
> Initial perforating design. PURE planner software can predict dynamic effects such as forces on downhole hardware. The operator planned to perforate a single interval (B, dashed lines) using nine guns; Gun 9 acted as a spacer with no charges, and approximately 1.5 m of Gun 8 was left unloaded (A). The model indicates that upon charge detonation, this design would generate a series of pressure pulses over the first 0.10 s (B). The data, color coded based on time from detonation, with dark blue starting at time zero and red ending at 0.10 s, indicate that the gun string would move upward 2.4 in. [6.1 cm] (C), the tubing would be subjected to a 58,000-lbf [258-kN] axial load (D) and the packer and annulus would receive a maximum force of almost 160,000 lbf [712 kN] (E), enough to damage the automatic gun release and probably unseat the packer (F).
13,700
13,800
13,900
14,000−1.2
−1.0
−0.8
−0.6
−0.4
−0.2
0.20
−1.4
−1.6
−1.8
−2.0
−2.2
−2.4
14,100
14,200
14,300
14,400
14,500
2,000 0 00.02 0.020.04 0.040.06 0.060.08 0.080.10 0.10 0 0.02 0.04 0.06 0.08 0.103,000 4,000 5,000 6,000
Mea
sure
d de
pth,
ft
Disp
lace
men
t, in
.
Pressure, psi Time, s Time, s Time, s
−50
−60
−40
−30
−20
−10
0
0
20
40
60
80
100
120
140
16010
Forc
e, 1
,000
lbf
Forc
e, 1
,000
lbf
13,600
Gun 1
Gun 2
Gun 3
Gun 4
Gun 5
Gun 6
Gun 7Gun 9
Gun 8
Packer
Tubing
Firing head
Automaticgun release
Safety spacer
HSD guns
Bullnose
Loaded
Unloaded
Gun length, 6 m
Wellbore Pressure
A
B C D E
F
Gun Movement Tubing Axial Load Packer Annulus and Tubing
Autumn 2014 25
sectional area. The model showed that upon det-onation, this gun system would move upward forcefully, potentially damaging the hardware and negating the intended action of the gun drop-ping mechanism.
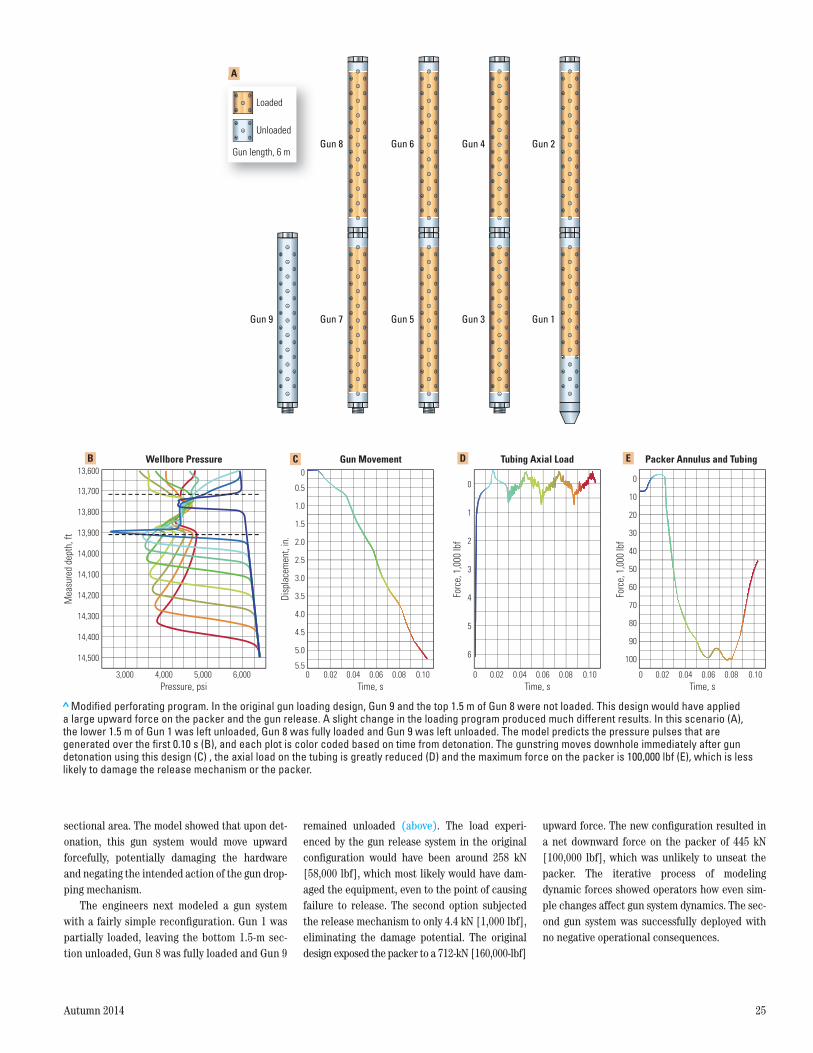
The engineers next modeled a gun system with a fairly simple reconfiguration. Gun 1 was partially loaded, leaving the bottom 1.5-m sec-tion unloaded, Gun 8 was fully loaded and Gun 9
remained unloaded (above). The load experi-enced by the gun release system in the original configuration would have been around 258 kN [58,000 lbf], which most likely would have dam-aged the equipment, even to the point of causing failure to release. The second option subjected the release mechanism to only 4.4 kN [1,000 lbf], eliminating the damage potential. The original design exposed the packer to a 712-kN [160,000-lbf]
upward force. The new configuration resulted in a net downward force on the packer of 445 kN [100,000 lbf], which was unlikely to unseat the packer. The iterative process of modeling dynamic forces showed operators how even sim-ple changes affect gun system dynamics. The sec-ond gun system was successfully deployed with no negative operational consequences.
>Modified perforating program. In the original gun loading design, Gun 9 and the top 1.5 m of Gun 8 were not loaded. This design would have applied a large upward force on the packer and the gun release. A slight change in the loading program produced much different results. In this scenario (A), the lower 1.5 m of Gun 1 was left unloaded, Gun 8 was fully loaded and Gun 9 was left unloaded. The model predicts the pressure pulses that are generated over the first 0.10 s (B), and each plot is color coded based on time from detonation. The gunstring moves downhole immediately after gun detonation using this design (C) , the axial load on the tubing is greatly reduced (D) and the maximum force on the packer is 100,000 lbf (E), which is less likely to damage the release mechanism or the packer.
0.5
1.0
2.0
3.0
4.0
5.0
5.5
4.5
1.5
2.5
3.5
0
0 0.02 0.04 0.06 0.08 0.10 0 0.02 0.04 0.06 0.08 0.10 0 0.02 0.04 0.06 0.08 0.103,000 4,000 5,000 6,000
Mea
sure
d de
pth,
ft
Disp
lace
men
t, in
.
Pressure, psi
Wellbore Pressure Gun Movement Tubing Axial Load Packer Annulus and Tubing
Time, s Time, s Time, s
00
10
20
30
40
50
60
70
80
90
100
1
2
3
4
5
6
Forc
e, 1
,000
lbf
Forc
e, 1
,000
lbf
13,700
13,800
13,900
14,000
14,100
14,200
14,300
14,400
14,500
13,600
Gun 1
Gun 2
Gun 3
Gun 4
Gun 5
Gun 6
Gun 7Gun 9
Gun 8
A
B C D E
A
Loaded
Unloaded
Gun length, 6 m
26 Oilfield Review
Perforating StrategyThe concrete target characterization defined in API RP 19B Section 1 was an attempt to simplify decision making during perforation program design, but it may actually confuse matters by providing unrealistic expectations. Contrary to a common perception, developing an optimal per-forating strategy is often neither simple nor straightforward. On many occasions, changing perforation methodologies can result in signifi-cant production increases.
Petróleos Mexicanos (PEMEX) traditionally perforated wells in two fields in southern Mexico with exposed-charge expendable guns. Exposed-charge guns often use larger and deeper penetrating charges than those used in hollow carrier casing guns, but they leave debris from spent charges in the wellbore after shoot-ing. Other operational concerns are vulnerabil-ity of exposed charges to damage during deployment and limitations on the type of con-veyance methods that may be used. Exposed-charge guns are usually run on wireline and are rarely run in horizontal completions. Unlike stiff, hollow carrier guns, pushing these types of guns downhole is difficult because of the flexi-bility of the gun string. The benefits from deeper penetration and the associated higher produc-tivity ratio made possible by the larger exposed charges must be weighed against debris, gun vulnerability and operational concerns.
PowerJet Nova charges are designed for maxi-mal penetration in stressed-rock conditions (see “Optimizing Charges for Stressed Rocks,” page 28). Modeling of charge performance under the expected conditions predicted up to 30% DoP increase compared with that from previous-gener-ation shaped charges. This improved penetration was achieved even though the PowerJet Nova charges, which were first available only in hollow carrier systems, were smaller than those used with the exposed-carrier guns. PEMEX opted to test the new charge and compare well performance with that of existing wells in the fields.
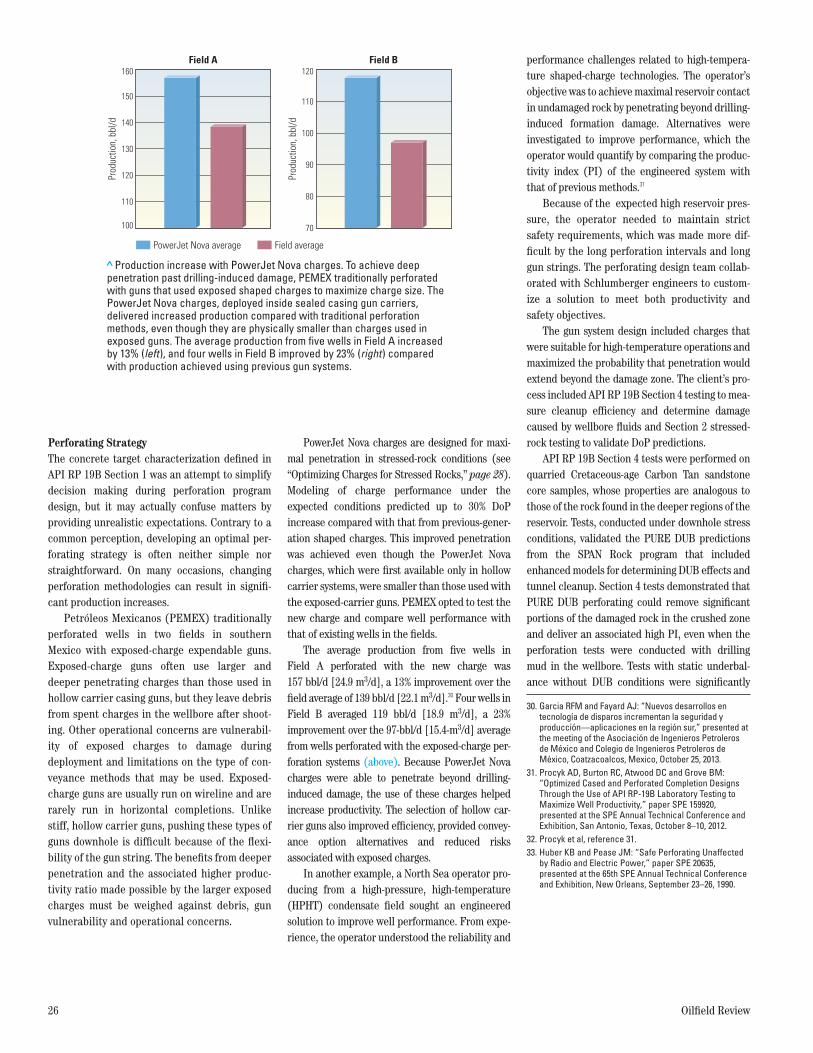
The average production from five wells in Field A perforated with the new charge was 157 bbl/d [24.9 m3/d], a 13% improvement over the field average of 139 bbl/d [22.1 m3/d].30 Four wells in Field B averaged 119 bbl/d [18.9 m3/d], a 23% improvement over the 97-bbl/d [15.4-m3/d] average from wells perforated with the exposed-charge per-foration systems (above). Because PowerJet Nova charges were able to penetrate beyond drilling-induced damage, the use of these charges helped increase productivity. The selection of hollow car-rier guns also improved efficiency, provided convey-ance option alternatives and reduced risks associated with exposed charges.
In another example, a North Sea operator pro-ducing from a high-pressure, high-temperature (HPHT) condensate field sought an engineered solution to improve well performance. From expe-rience, the operator understood the reliability and
30. Garcia RFM and Fayard AJ: “Nuevos desarrollos en tecnología de disparos incrementan la seguridad y producción—aplicaciones en la región sur,” presented at the meeting of the Asociación de Ingenieros Petroleros de México and Colegio de Ingenieros Petroleros de México, Coatzacoalcos, Mexico, October 25, 2013.
31. Procyk AD, Burton RC, Atwood DC and Grove BM: “Optimized Cased and Perforated Completion Designs Through the Use of API RP-19B Laboratory Testing to Maximize Well Productivity,” paper SPE 159920, presented at the SPE Annual Technical Conference and Exhibition, San Antonio, Texas, October 8–10, 2012.
32. Procyk et al, reference 31.33. Huber KB and Pease JM: “Safe Perforating Unaffected
by Radio and Electric Power,” paper SPE 20635, presented at the 65th SPE Annual Technical Conference and Exhibition, New Orleans, September 23–26, 1990.
performance challenges related to high-tempera-ture shaped-charge technologies. The operator’s objective was to achieve maximal reservoir contact in undamaged rock by penetrating beyond drilling-induced formation damage. Alternatives were investigated to improve performance, which the operator would quantify by comparing the produc-tivity index (PI) of the engineered system with that of previous methods.31
Because of the expected high reservoir pres-sure, the operator needed to maintain strict safety requirements, which was made more dif-ficult by the long perforation intervals and long gun strings. The perforating design team collab-orated with Schlumberger engineers to custom-ize a solution to meet both productivity and safety objectives.
The gun system design included charges that were suitable for high-temperature operations and maximized the probability that penetration would extend beyond the damage zone. The client’s pro-cess included API RP 19B Section 4 testing to mea-sure cleanup efficiency and determine damage caused by wellbore fluids and Section 2 stressed-rock testing to validate DoP predictions.
API RP 19B Section 4 tests were performed on quarried Cretaceous-age Carbon Tan sandstone core samples, whose properties are analogous to those of the rock found in the deeper regions of the reservoir. Tests, conducted under downhole stress conditions, validated the PURE DUB predictions from the SPAN Rock program that included enhanced models for determining DUB effects and tunnel cleanup. Section 4 tests demonstrated that PURE DUB perforating could remove significant portions of the damaged rock in the crushed zone and deliver an associated high PI, even when the perforation tests were conducted with drilling mud in the wellbore. Tests with static underbal-ance without DUB conditions were significantly
> Production increase with PowerJet Nova charges. To achieve deep penetration past drilling-induced damage, PEMEX traditionally perforated with guns that used exposed shaped charges to maximize charge size. The PowerJet Nova charges, deployed inside sealed casing gun carriers, delivered increased production compared with traditional perforation methods, even though they are physically smaller than charges used in exposed guns. The average production from five wells in Field A increased by 13% (left), and four wells in Field B improved by 23% (right) compared with production achieved using previous gun systems.
Field A Field B
100
110
120
130
140
150
160
Prod
uctio
n, b
bl/d
70
80
90
100
110
120
Prod
uctio
n, b
bl/d
PowerJet Nova average Field average
Autumn 2014 27
less effective in removing crushed zone damage, and tests conducted in drilling mud in the well-bore yielded poor productivity.32 Following the Section 4 testing, which confirmed the effective-ness of PURE DUB perforating at cleaning the per-forations in the reservoir’s more challenging zones, a series of Section 2 penetration tests was conducted. The Section 2 experiments included Early Mississippian-age Berea Buff sandstone, which was analogous to the reservoir’s shal-lower—lower strength, higher porosity—regions.
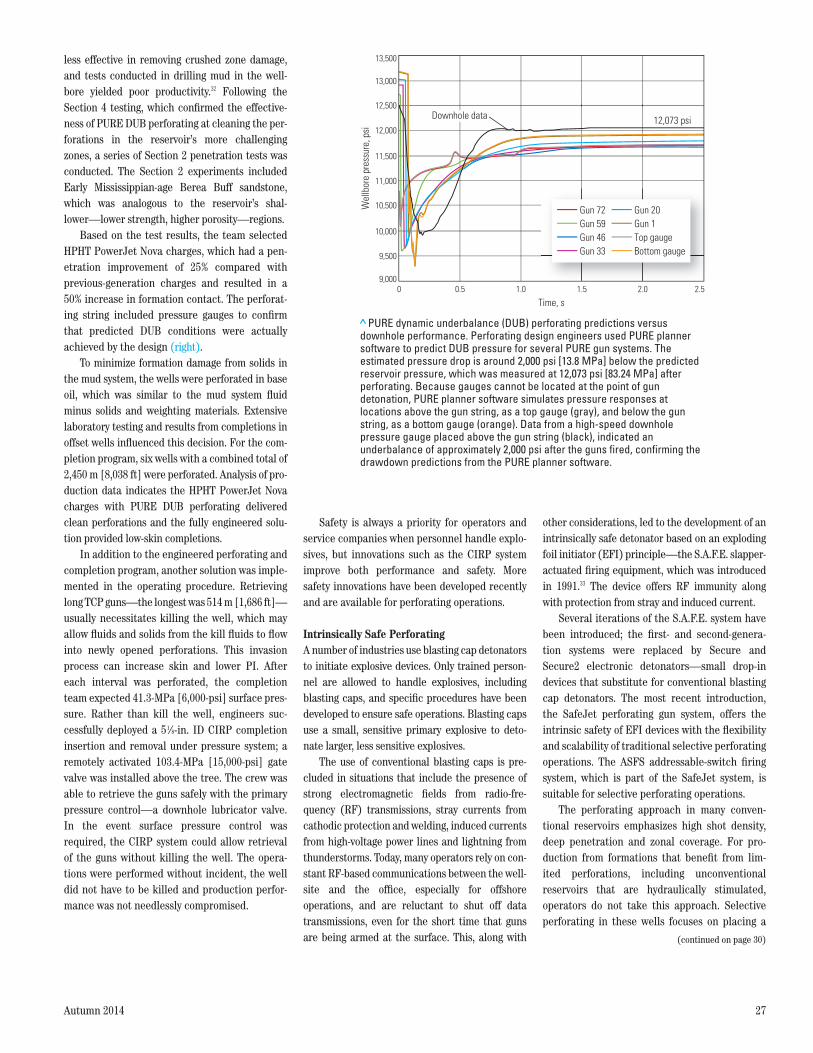
Based on the test results, the team selected HPHT PowerJet Nova charges, which had a pen-etration improvement of 25% compared with previous-generation charges and resulted in a 50% increase in formation contact. The perforat-ing string included pressure gauges to confirm that predicted DUB conditions were actually achieved by the design (right).
To minimize formation damage from solids in the mud system, the wells were perforated in base oil, which was similar to the mud system fluid minus solids and weighting materials. Extensive laboratory testing and results from completions in offset wells influenced this decision. For the com-pletion program, six wells with a combined total of 2,450 m [8,038 ft] were perforated. Analysis of pro-duction data indicates the HPHT PowerJet Nova charges with PURE DUB perforating delivered clean perforations and the fully engineered solu-tion provided low-skin completions.
In addition to the engineered perforating and completion program, another solution was imple-mented in the operating procedure. Retrieving long TCP guns—the longest was 514 m [1,686 ft]—usually necessitates killing the well, which may allow fluids and solids from the kill fluids to flow into newly opened perforations. This invasion process can increase skin and lower PI. After each interval was perforated, the completion team expected 41.3-MPa [6,000-psi] surface pres-sure. Rather than kill the well, engineers suc-cessfully deployed a 51/8-in. ID CIRP completion insertion and removal under pressure system; a remotely activated 103.4-MPa [15,000-psi] gate valve was installed above the tree. The crew was able to retrieve the guns safely with the primary pressure control—a downhole lubricator valve. In the event surface pressure control was required, the CIRP system could allow retrieval of the guns without killing the well. The opera-tions were performed without incident, the well did not have to be killed and production perfor-mance was not needlessly compromised.
Safety is always a priority for operators and service companies when personnel handle explo-sives, but innovations such as the CIRP system improve both performance and safety. More safety innovations have been developed recently and are available for perforating operations.
Intrinsically Safe PerforatingA number of industries use blasting cap detonators to initiate explosive devices. Only trained person-nel are allowed to handle explosives, including blasting caps, and specific procedures have been developed to ensure safe operations. Blasting caps use a small, sensitive primary explosive to deto-nate larger, less sensitive explosives.
The use of conventional blasting caps is pre-cluded in situations that include the presence of strong electromagnetic fields from radio-fre-quency (RF) transmissions, stray currents from cathodic protection and welding, induced currents from high-voltage power lines and lightning from thunderstorms. Today, many operators rely on con-stant RF-based communications between the well-site and the office, especially for offshore operations, and are reluctant to shut off data transmissions, even for the short time that guns are being armed at the surface. This, along with
other considerations, led to the development of an intrinsically safe detonator based on an exploding foil initiator (EFI) principle—the S.A.F.E. slapper-actuated firing equipment, which was introduced in 1991.33 The device offers RF immunity along with protection from stray and induced current.
Several iterations of the S.A.F.E. system have been introduced; the first- and second-genera-tion systems were replaced by Secure and Secure2 electronic detonators—small drop-in devices that substitute for conventional blasting cap detonators. The most recent introduction, the SafeJet perforating gun system, offers the intrinsic safety of EFI devices with the flexibility and scalability of traditional selective perforating operations. The ASFS addressable-switch firing system, which is part of the SafeJet system, is suitable for selective perforating operations.
The perforating approach in many conven-tional reservoirs emphasizes high shot density, deep penetration and zonal coverage. For pro-duction from formations that benefit from lim-ited perforations, including unconventional reservoirs that are hydraulically stimulated, operators do not take this approach. Selective perforating in these wells focuses on placing a
> PURE dynamic underbalance (DUB) perforating predictions versus downhole performance. Perforating design engineers used PURE planner software to predict DUB pressure for several PURE gun systems. The estimated pressure drop is around 2,000 psi [13.8 MPa] below the predicted reservoir pressure, which was measured at 12,073 psi [83.24 MPa] after perforating. Because gauges cannot be located at the point of gun detonation, PURE planner software simulates pressure responses at locations above the gun string, as a top gauge (gray), and below the gun string, as a bottom gauge (orange). Data from a high-speed downhole pressure gauge placed above the gun string (black), indicated an underbalance of approximately 2,000 psi after the guns fired, confirming the drawdown predictions from the PURE planner software.
Gun 72Gun 59Gun 46Gun 33
Gun 20Gun 1Top gaugeBottom gauge
13,500
11,500
10,500
9,000
9,500
0 0.5
Time, s
Wel
lbor
e pr
essu
re, p
si
1.5 2.0 2.51.0
10,000
13,000
12,500
12,000
11,000
12,073 psiDownhole data
(continued on page 30)
28 Oilfield Review
The relationship between shaped-charge DoP and rock strength is inversely proportional—penetration in a weak rock is greater than penetration of the same charge in a stronger rock. Recent research has demonstrated that charges optimized for weak, moderately stressed rocks will not perform as well in stronger, highly stressed rock.
It might seem that improving charge per-formance in one target would mean simulta-neously improving performance for all other targets, but this is not always the case. A look at the underlying physics of shaped-charge penetration can help explain why.
A perforating shaped charge consists of three primary parts: a small primer igniter, a conical liner and a main explosive charge (next page, top). The liner, which controls the formation of the perforating jet, is typi-cally made from a pressed blend of metal powders. An outer case provides contain-ment and confinement. In a loaded gun, the primer region of each charge is in contact with explosive detonator cord.
The systematic process of charge detona-tion and the resulting jet formation happen in a few microseconds. Detonator cord is initi-ated, usually by some type of blasting cap, which generates a detonation front that passes each charge in a perforating gun. The primer, which is in contact with the detonator cord, is located at the back of each charge; the primer detonates and causes the main explosive of the shaped charge to detonate. The pressure generated by this reaction causes the liner to collapse inward onto the charge centerline, and a jet forms with an extremely high velocity, exceeding 7,000 m/s [23,000 ft/s]. This forward moving jet of liner material penetrates the gun, well fluids, cas-ing, cement and formation (right).
As the detonation continues and the liner collapses further, the jet continues to form but with lower and lower velocities. The front of the jet, or tip, may be traveling at 7,000 m/s but the tail, the end of the jet, is typically trav-eling at 1,000 to 2,000 m/s [3,300 to 6,600 ft/s].
The velocity gradient along the jet gives rise to its length: A large spread between tip and tail velocities creates a longer jet. Reactions during this process happen so fast, and the differences
in velocity are great enough, that the tail is still forming as the energy of the tip is being consumed by whatever materials lie in front of the jet during formation of the perforation
Optimizing Charges for Stressed Rocks
> Perforator progression. To perforate a well, the engineer sends power downhole to set off a ballistic detonator, which initiates a rapid chain of events. The detonator explodes and transfers energy to the attached detonator cord that then propagates an explosive force through the gun to each shaped charge. A primer igniter at the back of the shaped charge (top right) is in contact with the detonator cord. The igniter detonates and initiates the main explosive in the charge. The force of the explosion causes the conical liner to collapse upon itself, forming a jet whose tip is traveling up to 7,000 m/s [23,000 ft/s]. The ultrahigh-velocity jet elongates as the liner continues to collapse, and the pressure at the tip may exceed 30 GPa [4.4 million psi]. The tail of the jet travels at 1,000 to 2,000 m/s [3,300 to 6,600 ft/s] or less. The velocity gradient is large enough that the tip has expended its energy in the target by the time the tail forms (left).
Time-Lapse Detonation and Penetration
Detonator cordPerforating gun
Explosive
Detonation front
Jet tip (7,000 m/s)
Jet tail (1,000 m/s)
Primer igniter
Jet tip pressure (30 GPa)
Tail particles
Liner
1 μs
10 μs
30 μs
50 μs
100 μs
Autumn 2014 29
tunnel. It is the tremendous pressure created by the hypervelocity jet that forms the perfo-ration tunnel.
The impact pressure of the jet is propor-tional to the target density, jet density and jet velocity squared. Impact pressures can exceed
30 GPa, which cause the material in front of the jet to flow like a fluid, although the pres-sure does not necessarily melt the material. Because the impact pressure is proportional to the square of the velocity, in later stages of penetration when the jet velocity rapidly
decreases, the impact pressure is significantly reduced.
Jet length is a main factor in determining DoP for a given target. The effective length of the jet is the portion of the jet traveling fast enough to create impact pressures sufficient to extend the perforation farther into the tar-get. A charge with a long jet and relatively slow tail will be effective in perforating a weak target. This jet will be less effective in a stron-ger target because the tail will create insuffi-cient impact pressure to continue penetrating and be essentially wasted energy. Therefore, the tail portion of certain jets can be wasted for strong targets.
A charge can be designed, however, that relocates its energy in the early part of the jet and more effectively penetrates a strong target (below left). Because of energy con-straints, this new design generates a shorter jet than that of earlier designs; more of the liner material has to be used in the early stages, reducing what is available later in the detonation for jet formation. Understanding and applying the physics of perforating have helped Schlumberger scientists and engi-neers design charges optimized for specific targets. This short-jet design can be used to manufacture a charge optimized for strong targets; the long-jet design can be optimized for weak targets.
A charge that will penetrate deeply into stressed rocks requires a high-velocity, high-density jet that is as long as possible but with-out wasted energy at the tail. This was the methodology used by engineers to develop the PowerJet Nova charge—a charge that has been optimized for a broad range of real reservoir conditions, including hard rocks.
> Components of a shaped charge. A perforating shaped charge (left) is composed of a small primer igniter, a conical liner and the main explosive charge. The parts are placed in a protective case. Detonating cord runs the length of the gun and connects to each charge. The raw materials used to manufacture shaped charges (top right) begin as powders. Liners (bottom right) are usually formed from compressed powdered metal.
Gun body
Case
Conical liner
Detonating cord
Mainexplosive charge
Primer
Casing
Case
Case
Liner powder
Linerpowder
Liner
Liner variations
Primerexplosive
Loadedcharge
Main explosive
> Designing perforators for strong rocks. In weak rocks, the tip and tail of a charge may have sufficient velocity to tunnel deeply into the rock once the threshold of the rock strength is exceeded. For strong rocks, the initial penetration threshold is high, and the tail energy may be insufficient to overcome the rock strength; therefore, the tail energy is wasted. Charge designers discovered that relocating energy closer to the tip region of the charge, which is the basic concept of the PowerJet Nova charge, increases DoP in hard rocks.
Jet v
eloc
ity
Threshold region for strong rocks
Jet energy wastedon strong target
Charge redesigned to move wastedenergy to where it will be useful
Threshold region for weak rocks
Jet position
30 Oilfield Review
few shots in clusters or widely spaced single shots over long intervals. Perforation clusters are commonly used in multistage hydraulic fracture stimulations. The clusters may be geometrically spaced or concentrated in zones identified as having optimal reservoir and completion quality characteristics.34 Only a few holes are necessary in each cluster, and operators typically use mul-tiple clusters for each stimulation stage.
Traditional selective perforating techniques use multiple shaped-charge carriers that have explosive detonators for each gun. The surface units used for perforating send DC current to ini-tiate the detonator and fire the gun. Guns are fired sequentially in a daisy-chain fashion using positive or negative polarity and diode switches to control the polarity of current that can pass (above). The diode switch is activated by pres-sure created in the carrier upon detonation. Although pressure-activated diode switches have proved reliable, should a switch fail to engage, the next gun cannot be fired, and the remaining unspent guns must be retrieved from the well.
A diode switch failing to engage is a real possibil-ity in selective perforating because the limited number of charges used for clusters, which may be a single charge, may not generate the force necessary to activate the switch.
SafeJet technology, which incorporates intrinsically safe features introduced in S.A.F.E. and Secure systems, includes a small ASFS microprocessor-controlled addressable switch on a circuit board for each detonator (next page). Each switch has a unique address and is directly accessed from the surface. The switches are con-nected using a single wire, which greatly simpli-fies assembly; this replaces the five wire connections that must be made to properly con-nect traditional switches. Arming a 10-gun tradi-tional system would require the engineer to make 50 connections, all of which must be completed on location to comply with safety guidelines. The single-wire connections of the SafeJet system add efficiency while greatly reducing the chance for human error.
To initiate detonation, the engineer at the surface sends a command to an addressable switch. Two-way communication between the surface and the microprocessor is required to proceed. Surface power is then directed to the detonator with the specific address. Should a gun or detonator fail to fire, the engineer can skip the misfired gun and continue to the next carrier in the string. This flexibility is not possible with tra-ditional diode switches. In addition, the guns can arrive at the field location loaded and ready for deployment, which eliminates time-consuming onsite arming procedures.
In a recent North Sea well, an operator used the SafeJet system to perforate a 4,100-ft [1,250-m] horizontal interval. The perforating program called for two stages with 90 holes per stage, totaling 180 single shots. The plan was to perforate with a single shot every 23 ft [7 m] along the horizontal section. A TuffTRAC Mono cased hole services tractor conveyed the gun sys-tem in the horizontal well.
Gun 4 Gun 3 Gun 2 Gun 1Type 1switch
Type 1switch
Type 2switch
Detonator Detonator Detonator
Diode
Switch
Detonator
> Diode pressure switches. Multiple guns can be shot on a single run using traditional diode pressure switches (top). The engineer fires Gun 1 with positive polarity direct current (DC); the Type 1 switch connects the circuit to a reversed diode, which allows only negative polarity DC to pass. The engineer then shoots Gun 2 using negative DC; the switch completes the circuit in the Type 2 switch, and Gun 3 can now be shot using positive DC. This process is repeated until all the guns are fired. Should any gun fail to fire, or if the pressure-activated switch does not engage, subsequent firing cannot take place. Using this type of switch is complicated by the number of wire connections (bottom, five pairs of wires) that can be connected only at the wellsite. Confirming the switch connections prior to perforating is not possible because sending current through an armed gun at the surface is not permitted.
Autumn 2014 31
The first 90-shot stage was limited by well tra-jectory and downhole conditions to 20 guns per run and was perforated in five runs. The second stage required only three gun runs because well conditions allowed the combination of 33 guns per descent. No field wiring was required, which greatly improved wellsite efficiency. Service qual-ity was enhanced because the loading system had integrated electronics, switches and polarity that did not have to be confirmed, dual conductor con-nections, field tester verification and built-in redundancy. Each gun was assigned its own address and the firing was controlled from the surface. Of the 181 shots attempted, 180 fired. System flexibility and redundancy allowed the engineer to include backup guns in the string; thus, all 180 depths from the original program were covered during the perforating operation.
Testing Methodology Update NeededResearch clearly indicates that traditional shaped-charge characterization tests of deep-penetrating charges produce unrealistic results. Qualification testing in stressed-rock samples more accurately represents downhole perfor-mance. Unfortunately, running tests on represen-tative core samples using the many charge options available can be prohibitively expensive for most operators. However, predictive modeling software developed by Schlumberger scientists includes the ballistic indicator function, and this method of DoP and performance prediction has proved to more closely match results from rock samples in a stressed state similar to downhole conditions.
Until all shaped-charge providers update pre-dictive penetration modeling, results from sur-face testing and actual downhole results may continue to show discrepancies. The ultimate test for charge performance is production. Drilling and completing deepwater prospects are expensive. Effective perforating in unconven-tional rocks to ensure successful hydraulic stimu-
lations is essential. Because of these and other factors, understanding what actually happens downhole during perforation is more important than ever.
Although the industry has been perforating wells for more than 60 years, operators and ser-vice companies continue to improve perforating methods and techniques. Regardless of charge improvements and the accuracy of predictive software, safety is of paramount importance. New technologies like the SafeJet system enhance safety while increasing operational efficiency. The ultimate goal is to connect the reservoir to the wellbore and produce hydrocarbons as effi-ciently, effectively and safely as possible. Recent advances in perforating science are helping to do exactly that. —TS
> Talking to perforating guns. The SafeJet system includes intrinsically safe detonators with addressable switches (top right) that are connected by a single-wire system (bottom right). The engineer fires each gun in sequence by sending commands to the addressable switch. Should a gun fail to fire, the engineer can skip it and fire the next gun in line. The SafeJet detonators are immune to induced current and cannot be set off by RF emissions. Prior to the job, technicians load shaped charges and detonator cord into the loading tubes (middle) and insert them into the carrier housing (top left). Up to 33 of these guns could be run in a single trip. Only one charge is shown loaded in the approximately 0.3-m [1-ft] carrier, although longer housings are available to accommodate more charges. Because this system uses no primary explosives, unlike traditional blasting caps, the guns can be fully prepared at the operations base, shipped directly to the rig and connected on location.
Carrier housingAddressable switch
and detonator
Loading tube Shaped charge Detonator cord
Single-wireconnectivity
34. For more on optimizing completion design based on reservoir characteristics: Glaser KS, Miller CK, Johnson GM, Toelle B, Kleinberg RL, Miller P and Pennington WD: “Seeking the Sweet Spot: Reservoir and Completion Quality in Organic Shales,” Oilfield Review 25, no. 4 (Winter 2013/2014): 16–29.