Embed Size (px)
Citation preview
Technical Report
Performance Analysisof BWA Alignment
November 5, 2013
Charlotte HerzeelPascal CostanzaThomas J. Ashby
Roel Wuyts
Performance Analysis BWA Alignment C. Herzeel et al.
Performance Analysis of BWA alignment
Charlotte Herzeel1,2∗, Pascal Costanza1,3,Thomas J. Ashby 1,2, Roel Wuyts1,2
1Intel Exascience Lab, Kapeldreef 75, B-3001 Leuven, Belgium2Imec, Kapeldreef 75, B-3001 Leuven, Belgium3Intel, Veldkant 31, B-2550 Kontich, Belgium
November 5, 2013
1 Objective
The primary objective of our experiments is to understand the performancecharacteristics of the BWA program for sequence alignment. We set up bench-mark experiments with different data sets, reflecting the varying data propertiesof the outputs produced by the sequencing machines.
1.1 Document Overview
We first give an overview of the BWA program in Section 2. Our focus is onanalysing the performance of the alignment component of BWA, namely BWAaln. In Section 3 we discuss our methodology for characterising the performanceof the BWA program, which consists of analysing the implementation itself, aswell as setting up benchmark experiments with realistic data sets. Subsequently,in Section 4 we describe the workloads we choose for our benchmark experimentsin detail. We discuss a workload from the 1000 Genomes project, a workloaddownloaded from the GCAT project, and a workload obtained from Illumina.In Section 5 we explain the types of measurements we do for each workload.Then in Section 6 we present the results for BWA aln. We observe a largeload imbalance and use performance counters to explain this. We also tie backthese results to an analysis of the algorithm underlying BWA aln. Additionally,we explain how the load imbalance can be removed using Cilk, resulting in afactor two performance improvement. A companion technical report discussesa similar analysis for BWA mem.
2 Burrows-Wheeler Aligner (BWA)
Burrows-Wheeler Aligner (BWA) [1] by Li and Durbin is a widely used readalignment tool. It uses the Burrows-Wheeler transformation of the referencegenome, which not only minimises the memory needed to store the reference,but also allows for a strategy for matching the reads that operates in the order
∗Corresponding author: [email protected]
Performance Analysis BWA Alignment C. Herzeel et al.
of the read length. The technique was originally proposed in the context oftext compression [8] and the matching process needed to be adapted for readalignment to handle mismatches due to mutations (such as SNPs) and indels [1].There are different options to handling mismatches, and BWA presents onesolution. Other read aligners based on Burrows-Wheeler transformation, such asBowtie and SOAP2, use different strategies for mismatches, which are consideredto produce faster albeit less accurate results than BWA [1, 9, 10].
2.1 BWA Components
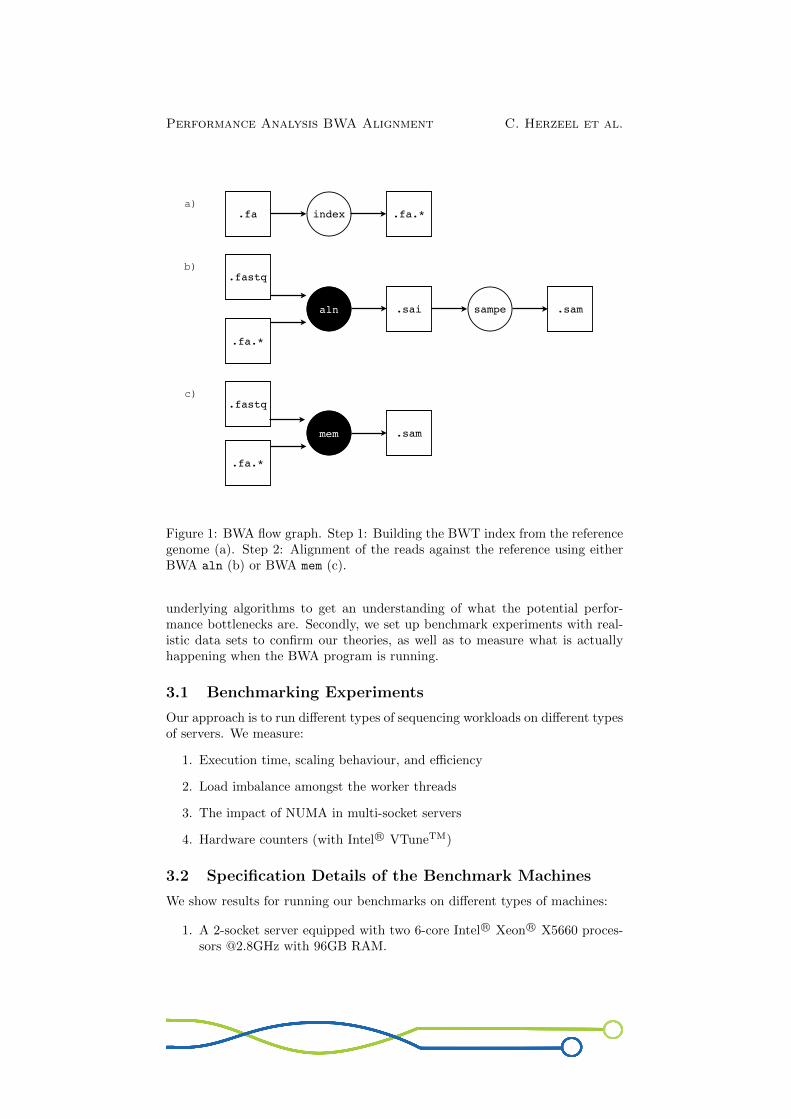
The BWA program consists of different components that need to be used in acertain order. Fig.1 gives an overview of the different components in the formof a flow chart:
1. The user first needs to build the BWT transformation of the referencegenome using the BWA index tool. BWA index takes as input a .fa fileand produces several .fa.* files to store the BWT transformation.
2. The BWA program uses the BWT transformation from step 1 for theactual alignment process. The user has the choice between two differentalignment tools: aln and mem. BWA aln is the original alignment algorithmfrom the BWA program’s release in 2009. It is designed for aligning readsup to 100bp long. The BWA mem tool was released in February 2013 and isdesigned for aligning reads between 70bp and 1 Mbp long, which matcheshow the read length is expected to evolve for future sequencing machines.
3. If alignment is performed with the BWA aln tool, a third step is requiredthat transforms the output from the aln tool to the .sam format which isa more standard format that can be used by other tools for interpretingthe alignment. In contrast, the BWA mem tool directly outputs to the .sam
format.
To give the reader an idea of the processing requirements of each step: To buildthe BWT transformation of the human reference genome (step 1), the BWAprogram takes ±78 minutes using a single thread on an Intel Xeon R© [email protected] with 96GB RAM. For aligning a sample read set of 16GB(step 2), the BWA aln tool requires approximately 25 hours using a singlethread on the same processor.In order to reduce the overall execution time, BWA supports multithreaded exe-cution of the alignment step when appropriate hardware resources are available.In this mode, the reads are evenly distributed over the available cores of a mul-ticore processor so that they can be aligned in parallel. In theory, this shouldgive a linear speedup compared to sequential or single-core execution. In theremainder of the report we investigate why this speedup is not achieved and howit can be improved substantially by replacing the pthread-based parallelisationin BWA by a Cilk solution.
3 Performance Analysis Methodology
Our approach to investigate the performance of the BWA program is two-fold.Firstly, we analyse how the program is implemented, and reverse-engineer the
Performance Analysis BWA Alignment C. Herzeel et al.
.fastq
.fa.*
aln sampe.sai .sam
.fastq
.fa.*
mem .sam
.fa index .fa.*a)
b)
c)
Figure 1: BWA flow graph. Step 1: Building the BWT index from the referencegenome (a). Step 2: Alignment of the reads against the reference using eitherBWA aln (b) or BWA mem (c).
underlying algorithms to get an understanding of what the potential perfor-mance bottlenecks are. Secondly, we set up benchmark experiments with real-istic data sets to confirm our theories, as well as to measure what is actuallyhappening when the BWA program is running.
3.1 Benchmarking Experiments
Our approach is to run different types of sequencing workloads on different typesof servers. We measure:
1. Execution time, scaling behaviour, and efficiency
2. Load imbalance amongst the worker threads
3. The impact of NUMA in multi-socket servers
4. Hardware counters (with Intel R© VTuneTM)
3.2 Specification Details of the Benchmark Machines
We show results for running our benchmarks on different types of machines:
1. A 2-socket server equipped with two 6-core Intel R© Xeon R© X5660 proces-sors @2.8GHz with 96GB RAM.
Performance Analysis BWA Alignment C. Herzeel et al.
2. A 4-socket server equipped with four 10-core Intel R© Xeon R© E7-4870 pro-cessors @2.4GHz with 512GB RAM.
All of the above machines run Ubuntu 10.04.3 LTS Lucid Lynx. All benchmarksare compiled using icc version 13.0.1 with -O2 enabled.
3.3 Sequencing Software Versions
To make this report, we use the following software:
1. BWA version 0.7.5a-r405
2. samtools version 0.1.19
3. vcftools version 0.1.11
4 Workloads
The data properties of sequencing workloads vary. For example, the lengthof the reads depends on the sequencing machine used to produce a data set.Different data sets also have different coverage, a property that determines thereliability of the read data. By default, reads within the same data set havethe same length, but quality clipping may be applied to keep only the parts ofwhich the quality is above a certain threshold, resulting in data sets where thereads have different lengths.We therefore choose to experiment with different types of sequencing work-loads. We define four workloads with different data properties: workshop,1000Genomes, Bioplanet, and Illumina. These workloads are all defined interms of existing (and realistic) data sets. Alternatively, one could generateartificial data sets using the dwgsim tool [5].
4.1 Workshop
This is a small example from a tutorial on how to use BWA. The data set itselfis a small subset of a data set from the 1000 Genomes project. This is not arealistic workload in terms of size, but the data itself is real. We use this dataset for small tests only.
Properties:
type: single-end, quality clipped
#reads: 2,621,440
read length: 37-108bp
coverage: 4x (?)
size: 181MB (zipped)
file: NA20589.fastq.gz
reference: human g1k v37 chr20.fa
Performance Analysis BWA Alignment C. Herzeel et al.
url: http://genome.sph.umich.edu/wiki/Tutorial:_Low_Pass_Sequence_Analysis
trimming: We set the threshold quality for read trimming to 15 (cf. -q option ofBWA aln).
cmd: bwa aln -t 12 -q 15 human_g1k_v37_chr20.fa NA20589.fastq.gz
1> output.sai 2> log
4.2 1000Genomes
This is a data set downloaded from the 1000 Genomes project[3]. Coverage of1000 Genomes data is low (4-60x).
Properties:
type: paired-end. We only use the first read set. Hence all benchmark numbersare for the 1st read set only.
#reads: 14,875,357
read length: 108bp
coverage: 4-60x (?)
size: 1.1GB (zipped)
file: ERR013029 1.filt.fastq.gz
reference: human g1k v37 chr20.fa
url: ftp://ftp.1000genomes.ebi.ac.uk/vol1/ftp/data/NA20589/sequence_read/
trimming: We set the threshold quality for read trimming to 15 (cf. -q option ofBWA aln).
cmd: bwa aln -t 12 -q 15 human_g1k_v37_chr20.fa ERR013029_1.filt.fastq.gz
1> output.sai 2> log
4.3 Bioplanet
This is a data set downloaded from the GCAT project [4]. GCAT stands forGenome Comparison & Analytics Testing. It is the name of a tool suite forcomparing and benchmarking the accuracy of alignment tools. The data setsthey offer are either artificially generated with the dwgsim tool [5] or subsetsfrom Illumina data. The data set we use is one that is generated with dwgsim.
Properties:
type: paired-end
#reads: 11,945,250
read length: 100bp
coverage: artificial
Performance Analysis BWA Alignment C. Herzeel et al.
size: 904MB (zipped)
file: gcat set 038.tar.gz
reference: hg19.fa
url: To download the data, one must register on the gcat website. The referenceof the data set is ”100bp-pe-large-indel”.
trimming: We set the threshold quality for read trimming to 15 (cf. -q optionof BWA aln).
cmd: bwa aln -t 12 -q 15 hg19.fa gcat_set_038.tar.gz 1> output.sai 2> log
4.4 Illumina
This data set is downloaded from the Illumina website [6]. This is real dataproduced by an Illumina HISeq system with high coverage (200x).
Properties:
type: paired-end. We only use the first read set. Hence all numbers are for the1st read set only.
#reads: 205,185,641
read length: 100bp
coverage: 200x
size: 16GB (zipped)
file: ERR091575 1.fastq.gz
reference: hg19.fa
url: Study PRJEB2891 from http://www.ebi.ac.uk/ena/data/view/ERP001230
trimming: We set the threshold quality for read trimming to 15 (cf. -q optionof BWA aln).
cmd: bwa aln -t 1-12 -q 15 hg19.fa ERR091575_1.fastq.gz 1> output.sai 2> log
4.5 Quality control of workloads
We can use the quality checks that bio-engineers perform on aligned data toverify the correctness of the output across different benchmark runs.
4.5.1 Pre-alignment QC
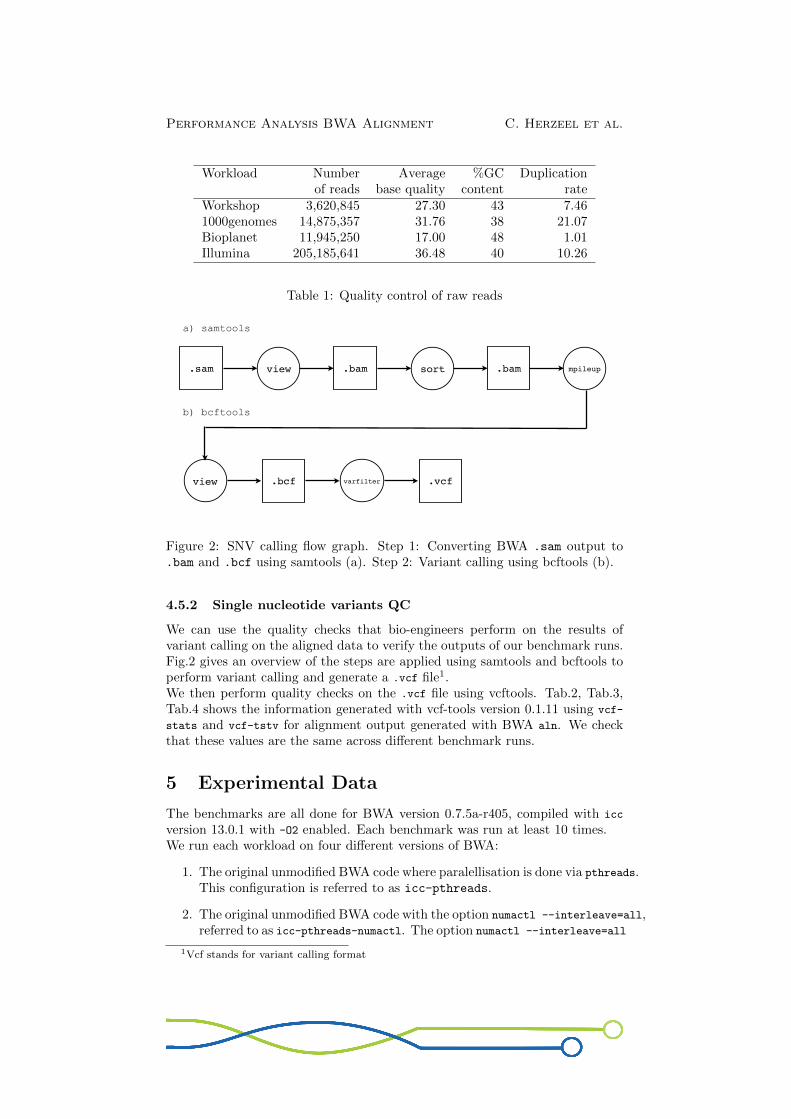
Before alignment, a number of quality checks are performed by the bio-engineerwhich give her an indication of what the alignment may look like, and may beused to change parameters of the alignment tool. We do not use these qualitychecks ourselves, but provide them for completeness. Tab. 1. gives an overviewof pre-alignment quality checks for each of our workloads. They are generatedusing FastQC version 0.10.1.
Performance Analysis BWA Alignment C. Herzeel et al.
Workload Number Average %GC Duplicationof reads base quality content rate
Workshop 3,620,845 27.30 43 7.461000genomes 14,875,357 31.76 38 21.07Bioplanet 11,945,250 17.00 48 1.01Illumina 205,185,641 36.48 40 10.26
Table 1: Quality control of raw reads
.sam view .bam sort .bam
.bcf
mpileup
view varfilter .vcf
a) samtools
b) bcftools
Figure 2: SNV calling flow graph. Step 1: Converting BWA .sam output to.bam and .bcf using samtools (a). Step 2: Variant calling using bcftools (b).
4.5.2 Single nucleotide variants QC
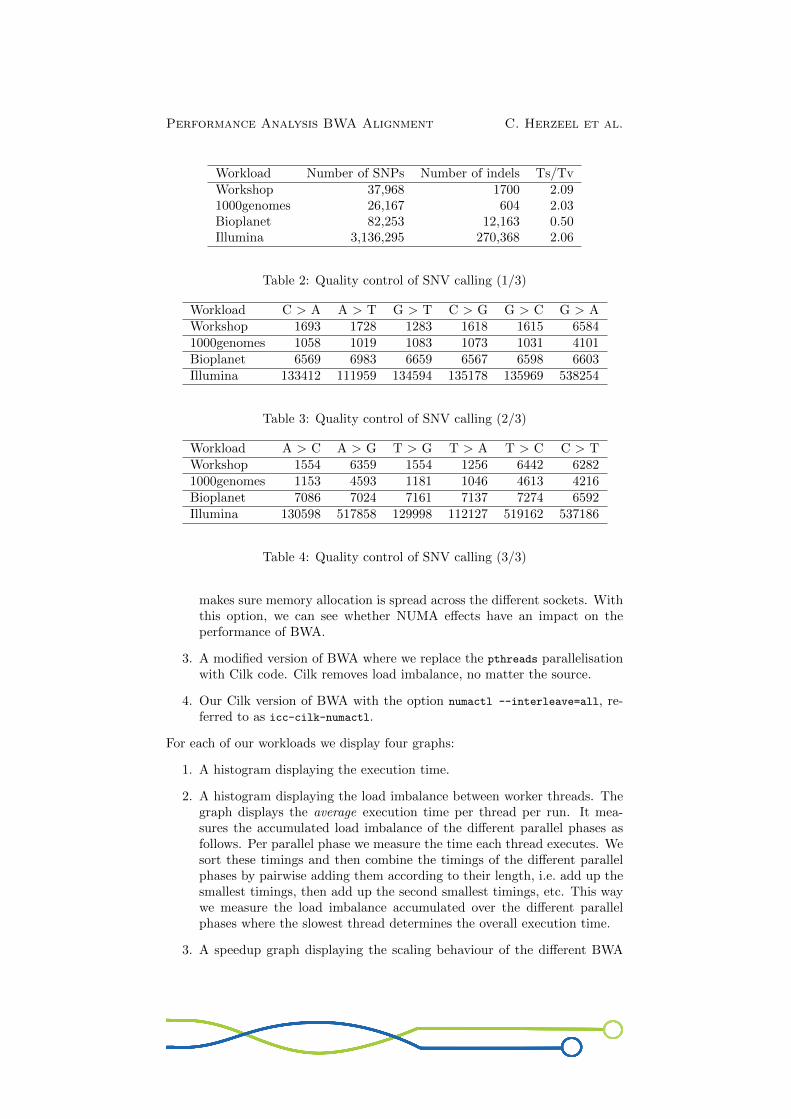
We can use the quality checks that bio-engineers perform on the results ofvariant calling on the aligned data to verify the outputs of our benchmark runs.Fig.2 gives an overview of the steps are applied using samtools and bcftools toperform variant calling and generate a .vcf file1.We then perform quality checks on the .vcf file using vcftools. Tab.2, Tab.3,Tab.4 shows the information generated with vcf-tools version 0.1.11 using vcf-
stats and vcf-tstv for alignment output generated with BWA aln. We checkthat these values are the same across different benchmark runs.
5 Experimental Data
The benchmarks are all done for BWA version 0.7.5a-r405, compiled with icc
version 13.0.1 with -O2 enabled. Each benchmark was run at least 10 times.We run each workload on four different versions of BWA:
1. The original unmodified BWA code where paralellisation is done via pthreads.This configuration is referred to as icc-pthreads.
2. The original unmodified BWA code with the option numactl --interleave=all,referred to as icc-pthreads-numactl. The option numactl --interleave=all
1Vcf stands for variant calling format
Performance Analysis BWA Alignment C. Herzeel et al.
Workload Number of SNPs Number of indels Ts/TvWorkshop 37,968 1700 2.091000genomes 26,167 604 2.03Bioplanet 82,253 12,163 0.50Illumina 3,136,295 270,368 2.06
Table 2: Quality control of SNV calling (1/3)
Workload C > A A > T G > T C > G G > C G > AWorkshop 1693 1728 1283 1618 1615 65841000genomes 1058 1019 1083 1073 1031 4101Bioplanet 6569 6983 6659 6567 6598 6603Illumina 133412 111959 134594 135178 135969 538254
Table 3: Quality control of SNV calling (2/3)
Workload A > C A > G T > G T > A T > C C > TWorkshop 1554 6359 1554 1256 6442 62821000genomes 1153 4593 1181 1046 4613 4216Bioplanet 7086 7024 7161 7137 7274 6592Illumina 130598 517858 129998 112127 519162 537186
Table 4: Quality control of SNV calling (3/3)
makes sure memory allocation is spread across the different sockets. Withthis option, we can see whether NUMA effects have an impact on theperformance of BWA.
3. A modified version of BWA where we replace the pthreads parallelisationwith Cilk code. Cilk removes load imbalance, no matter the source.
4. Our Cilk version of BWA with the option numactl --interleave=all, re-ferred to as icc-cilk-numactl.
For each of our workloads we display four graphs:
1. A histogram displaying the execution time.
2. A histogram displaying the load imbalance between worker threads. Thegraph displays the average execution time per thread per run. It mea-sures the accumulated load imbalance of the different parallel phases asfollows. Per parallel phase we measure the time each thread executes. Wesort these timings and then combine the timings of the different parallelphases by pairwise adding them according to their length, i.e. add up thesmallest timings, then add up the second smallest timings, etc. This waywe measure the load imbalance accumulated over the different parallelphases where the slowest thread determines the overall execution time.
3. A speedup graph displaying the scaling behaviour of the different BWA
Performance Analysis BWA Alignment C. Herzeel et al.
versions. All speedup graphs use the execution time using the originalBWA (cf. icc-pthreads) with 1 thread as a baseline.
4. An efficiency graph for the different BWA versions. Similarly to thespeedup graphs, the efficiency graphs use the execution time for 1 threadusing the original BWA code (cf. icc-pthreads) as a baseline.
6 BWA aln
BWA aln is the original alignment algorithm in the BWA program. It is designedfor aligning short reads up to 100bp long.
6.1 Original pthreads Parallelisation
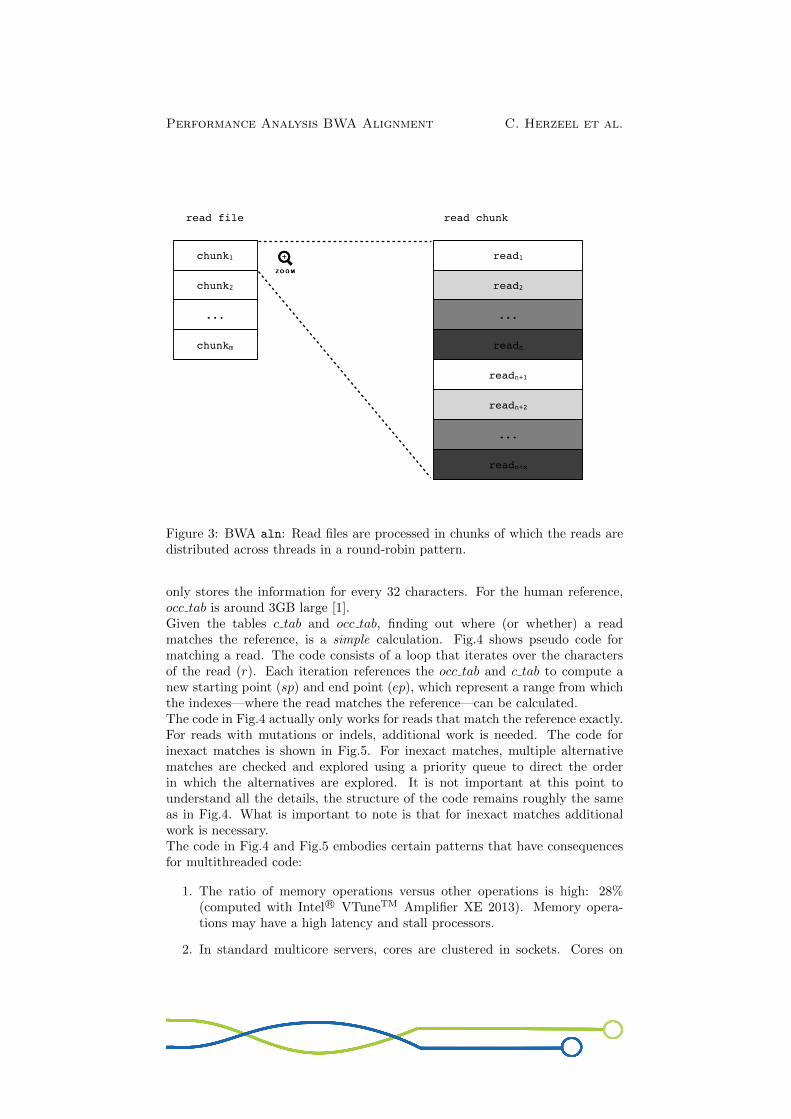
Read alignment is an embarrassingly parallel problem. In a typical workloadmillions of reads, up to 100bp (200 characters) long, need to be aligned. Readsare aligned independently from one another. Hence read alignment can beparallelised as a data parallel loop over the read set.Concretely, the BWA code2 sets up pthreads equal to the number of cores onthe target processor.3 Each pthread executes a sequential alignment loop for anequal share of the reads.The read file is not processed in one go, but rather processed in chunks of a fixedsize. Each of these chunks are distributed across the threads using a round-robinpattern, as shown in Fig.3. Hence given n threads, the 1st read is assigned tothe 1st thread, the 2nd read to the 2nd thread, the nth read to the nth thread,the n+1th read to the 1st thread, the n+2th read to the 2nd thread, and so on.Linear speedup for such an implementation is only guaranteed if the work tobe done is roughly equal for each pthread, in order to avoid load imbalance.To detect if there is load imbalance possible, we need to inspect the algorithmsunderlying the BWA aln tool.
6.2 Burrows-Wheeler Alignment Algorithm
We reverse-engineer the algorithm underlying the BWA aln tool from the pa-pers [1] and the BWA implementation. We discuss it to investigate the chal-lenges it presents for efficient multithreaded execution.The Burrows-Wheeler alignment algorithm relies on the definition of two auxil-iary data structures. These data structures are defined in terms of a compress-ible version of the reference, which is created via the so-called Burrows-Wheelertransformation. E.g. BWT (abracadabra) would be ard$rcaaaabb. Given theBurrows-Wheeler transformation of the reference, the table c tab stores for eachcharacter c in the (genetic) alphabet how many characters occur in the trans-formation that are lexicographically smaller than c. A second table, occ tab isdefined so that a function occ(occ tab, c, k) returns the number of occurrencesof the character c in the prefix BWT (ref)[1...k]. In principle, the table occ tabhas for each character as many entries as the length of the reference, but BWA
2We always refer to the latest version of BWA, i.e. the bwa-0.7.5a download on [2].3This is actually configured via the -t parameter of the BWA program.
Performance Analysis BWA Alignment C. Herzeel et al.
chunk1
chunk2
...
chunkm
read1
read2
...
readn
readn+1
readn+2
...
readn+x
read file read chunk
Figure 3: BWA aln: Read files are processed in chunks of which the reads aredistributed across threads in a round-robin pattern.
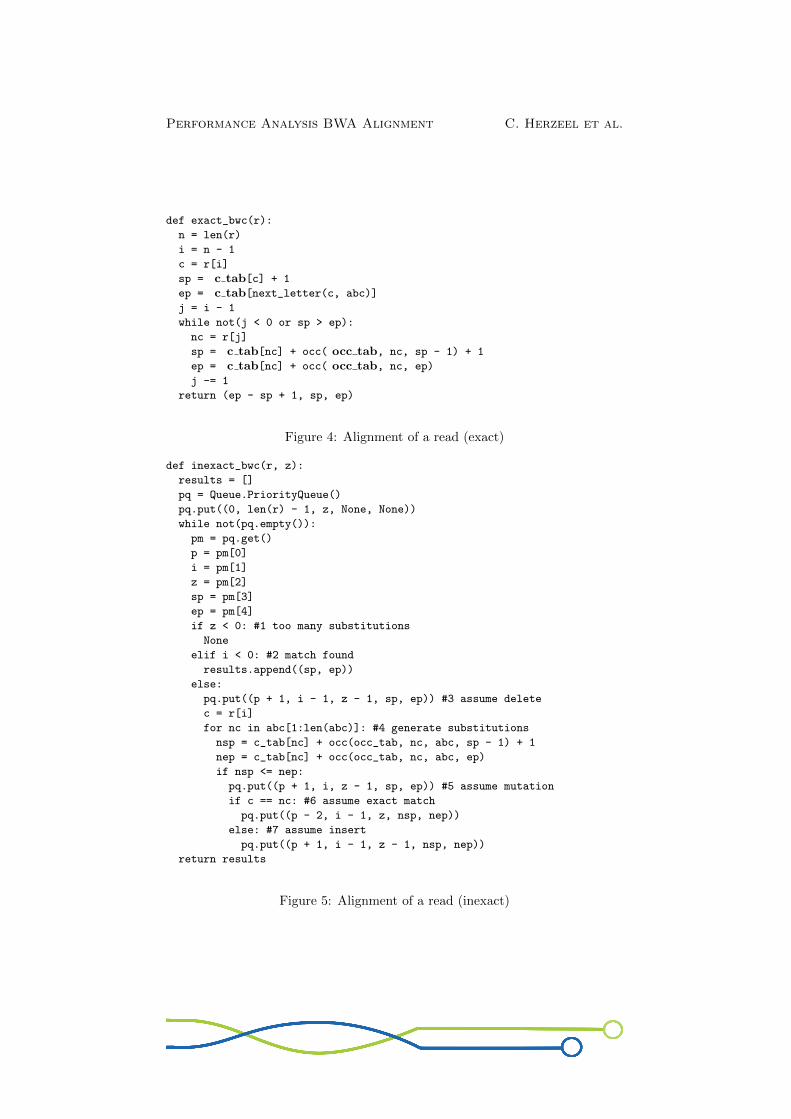
only stores the information for every 32 characters. For the human reference,occ tab is around 3GB large [1].Given the tables c tab and occ tab, finding out where (or whether) a readmatches the reference, is a simple calculation. Fig.4 shows pseudo code formatching a read. The code consists of a loop that iterates over the charactersof the read (r). Each iteration references the occ tab and c tab to compute anew starting point (sp) and end point (ep), which represent a range from whichthe indexes—where the read matches the reference—can be calculated.The code in Fig.4 actually only works for reads that match the reference exactly.For reads with mutations or indels, additional work is needed. The code forinexact matches is shown in Fig.5. For inexact matches, multiple alternativematches are checked and explored using a priority queue to direct the orderin which the alternatives are explored. It is not important at this point tounderstand all the details, the structure of the code remains roughly the sameas in Fig.4. What is important to note is that for inexact matches additionalwork is necessary.The code in Fig.4 and Fig.5 embodies certain patterns that have consequencesfor multithreaded code:
1. The ratio of memory operations versus other operations is high: 28%(computed with Intel R© VTuneTM Amplifier XE 2013). Memory opera-tions may have a high latency and stall processors.
2. In standard multicore servers, cores are clustered in sockets. Cores on
Performance Analysis BWA Alignment C. Herzeel et al.
different sockets have different access times to different regions in memory,cf. non-uniform memory access (NUMA) architecture. A core can accessmemory on its own socket faster than memory on other, remote sockets.By default, each pthread allocates memory on its own socket. In BWA, thedata structure that stores the reads, as well as the tables c tab and occ tabare allocated at the beginning of the execution, before the alignment starts.This means that all pthreads which are not on the first socket will haveslower access time to these tables.
3. Aligning a read that matches some part of the reference exactly is cheaperthan matching a read that has mutations or indels.
4. Reads may have varying lengths (e.g. after quality clipping). Since eachcharacter of a read needs to be processed by the loop in Fig.4, longer readswill take longer to match.
The above points are all sources for load imbalance amongst the pthreads: Thereis load imbalance because certain threads will have slower access to the c taband occ tab tables, as well as the data structure that stores the reads, and thereis load imbalance because certain threads may have to handle longer or moremutated reads than others.
6.3 Cilk Parallelisation
Intel R© CilkTM Plus [12, 13] is an extension for C/C++ for task-based paral-lel programming. It provides constructs for expressing fork/join patterns andparallel for loops. These constructs are mapped onto tasks that are executedby a dynamic work-stealing scheduler. With work stealing, a worker thread iscreated for each core. Every worker thread has its own task pool, but when aworker thread runs out of tasks, it steals tasks from worker threads that are stillbusy. This way faster threads take over work from slower threads, balancingthe overall workload.We replaced the pthread-based parallel loop in BWA by a Cilk for loop. Thereare some intricacies with regard to making sure that each worker thread has itsown priority queue for intermediate matches, to avoid contention of a sharedqueue. Our solution is to initialise the priority queues before executing theparallel loop, one for each worker thread. The priority queues are stored in aglobal array so that they are globally accessible by the worker threads. Insidethe for loop, we use Cilk’s introspective operator for querying the runningworker thread’s ID, which we then use to identify the priority queue the workerthread accesses.By using Cilk, we were able to drastically improve the scaling behaviour of BWAaln. A paper on this was accepted at PPAM’13 [11].
6.4 BWA aln on 2×6-core Intel R© Xeon R© X5660 @ 2.8GHz
This section discusses the runs on the server equipped with 2×6-core Intel R©
Xeon R© X5660 processors. This server thus has 12 cores, but we run the bench-marks with 24 threads, to see the impact of using hyper-threading. We claimthat hyper-threading may help for BWA because of the algorithm’s scattereddata access pattern and the fact that it is unpredictable which character will
Performance Analysis BWA Alignment C. Herzeel et al.
def exact_bwc(r):
n = len(r)
i = n - 1
c = r[i]
sp = c tab[c] + 1
ep = c tab[next_letter(c, abc)]
j = i - 1
while not(j < 0 or sp > ep):
nc = r[j]
sp = c tab[nc] + occ( occ tab, nc, sp - 1) + 1
ep = c tab[nc] + occ( occ tab, nc, ep)
j -= 1
return (ep - sp + 1, sp, ep)
Figure 4: Alignment of a read (exact)
def inexact_bwc(r, z):
results = []
pq = Queue.PriorityQueue()
pq.put((0, len(r) - 1, z, None, None))
while not(pq.empty()):
pm = pq.get()
p = pm[0]
i = pm[1]
z = pm[2]
sp = pm[3]
ep = pm[4]
if z < 0: #1 too many substitutions
None
elif i < 0: #2 match found
results.append((sp, ep))
else:
pq.put((p + 1, i - 1, z - 1, sp, ep)) #3 assume delete
c = r[i]
for nc in abc[1:len(abc)]: #4 generate substitutions
nsp = c_tab[nc] + occ(occ_tab, nc, abc, sp - 1) + 1
nep = c_tab[nc] + occ(occ_tab, nc, abc, ep)
if nsp <= nep:
pq.put((p + 1, i, z - 1, sp, ep)) #5 assume mutation
if c == nc: #6 assume exact match
pq.put((p - 2, i - 1, z, nsp, nep))
else: #7 assume insert
pq.put((p + 1, i - 1, z - 1, nsp, nep))
return results
Figure 5: Alignment of a read (inexact)
Performance Analysis BWA Alignment C. Herzeel et al.
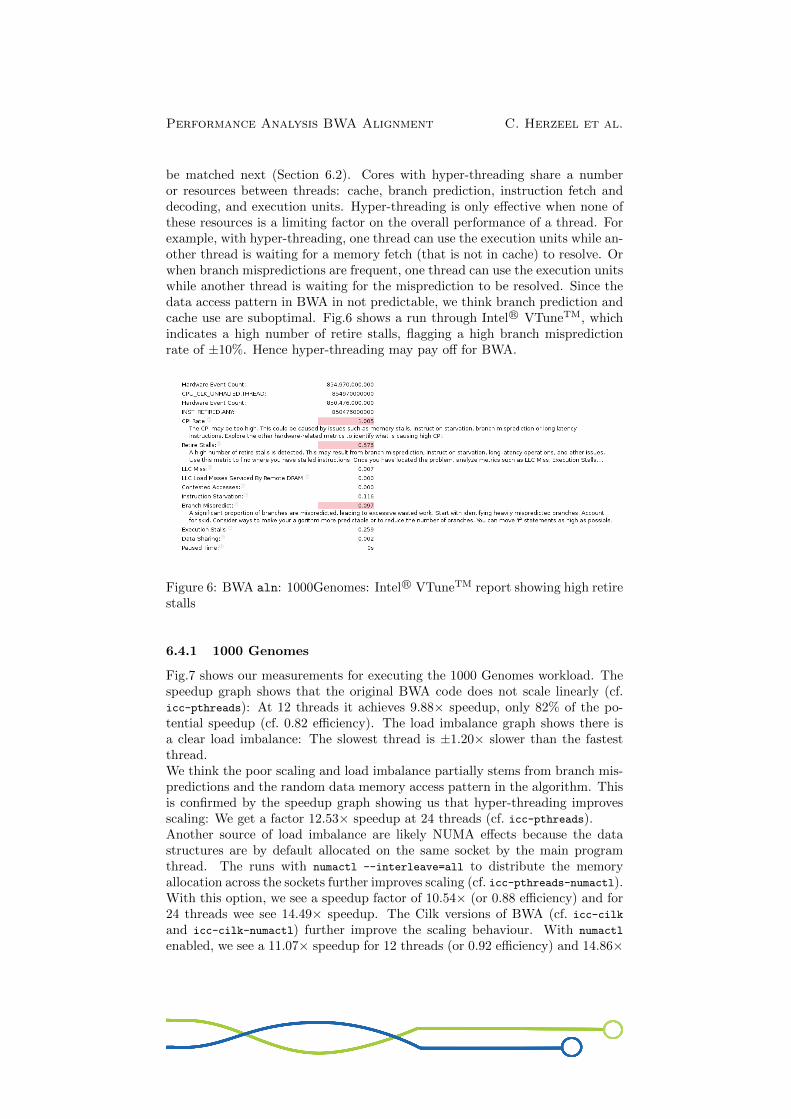
be matched next (Section 6.2). Cores with hyper-threading share a numberor resources between threads: cache, branch prediction, instruction fetch anddecoding, and execution units. Hyper-threading is only effective when none ofthese resources is a limiting factor on the overall performance of a thread. Forexample, with hyper-threading, one thread can use the execution units while an-other thread is waiting for a memory fetch (that is not in cache) to resolve. Orwhen branch mispredictions are frequent, one thread can use the execution unitswhile another thread is waiting for the misprediction to be resolved. Since thedata access pattern in BWA in not predictable, we think branch prediction andcache use are suboptimal. Fig.6 shows a run through Intel R© VTuneTM, whichindicates a high number of retire stalls, flagging a high branch mispredictionrate of ±10%. Hence hyper-threading may pay off for BWA.
Figure 6: BWA aln: 1000Genomes: Intel R© VTuneTM report showing high retirestalls
6.4.1 1000 Genomes
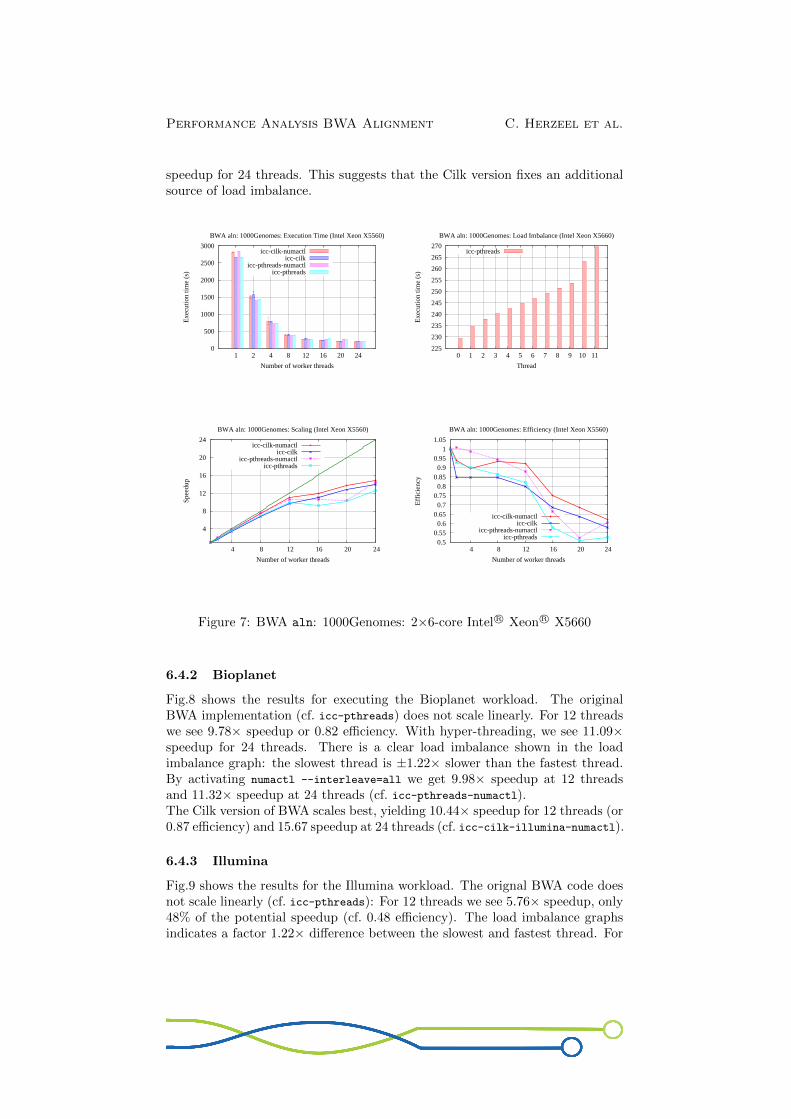
Fig.7 shows our measurements for executing the 1000 Genomes workload. Thespeedup graph shows that the original BWA code does not scale linearly (cf.icc-pthreads): At 12 threads it achieves 9.88× speedup, only 82% of the po-tential speedup (cf. 0.82 efficiency). The load imbalance graph shows there isa clear load imbalance: The slowest thread is ±1.20× slower than the fastestthread.We think the poor scaling and load imbalance partially stems from branch mis-predictions and the random data memory access pattern in the algorithm. Thisis confirmed by the speedup graph showing us that hyper-threading improvesscaling: We get a factor 12.53× speedup at 24 threads (cf. icc-pthreads).Another source of load imbalance are likely NUMA effects because the datastructures are by default allocated on the same socket by the main programthread. The runs with numactl --interleave=all to distribute the memoryallocation across the sockets further improves scaling (cf. icc-pthreads-numactl).With this option, we see a speedup factor of 10.54× (or 0.88 efficiency) and for24 threads wee see 14.49× speedup. The Cilk versions of BWA (cf. icc-cilk
and icc-cilk-numactl) further improve the scaling behaviour. With numactl
enabled, we see a 11.07× speedup for 12 threads (or 0.92 efficiency) and 14.86×
Performance Analysis BWA Alignment C. Herzeel et al.
speedup for 24 threads. This suggests that the Cilk version fixes an additionalsource of load imbalance.
0
500
1000
1500
2000
2500
3000
1 2 4 8 12 16 20 24
Exe
cutio
n tim
e (s
)
Number of worker threads
BWA aln: 1000Genomes: Execution Time (Intel Xeon X5560)
icc-cilk-numactlicc-cilk
icc-pthreads-numactlicc-pthreads
225
230
235
240
245
250
255
260
265
270
0 1 2 3 4 5 6 7 8 9 10 11
Exe
cutio
n tim
e (s
)
Thread
BWA aln: 1000Genomes: Load Imbalance (Intel Xeon X5660)
icc-pthreads
4
8
12
16
20
24
4 8 12 16 20 24
Spee
dup
Number of worker threads
BWA aln: 1000Genomes: Scaling (Intel Xeon X5560)
icc-cilk-numactlicc-cilk
icc-pthreads-numactlicc-pthreads
0.5 0.55 0.6
0.65 0.7
0.75 0.8
0.85 0.9
0.95 1
1.05
4 8 12 16 20 24
Eff
icie
ncy
Number of worker threads
BWA aln: 1000Genomes: Efficiency (Intel Xeon X5560)
icc-cilk-numactlicc-cilk
icc-pthreads-numactlicc-pthreads
Figure 7: BWA aln: 1000Genomes: 2×6-core Intel R© Xeon R© X5660
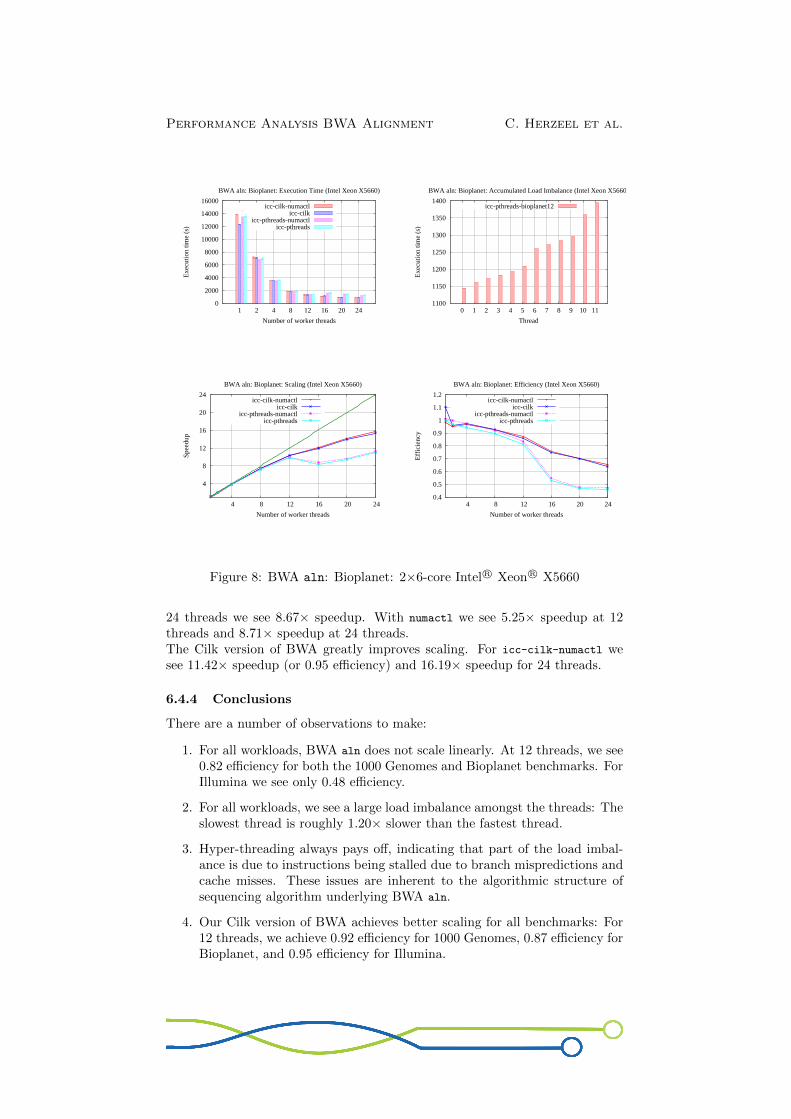
6.4.2 Bioplanet
Fig.8 shows the results for executing the Bioplanet workload. The originalBWA implementation (cf. icc-pthreads) does not scale linearly. For 12 threadswe see 9.78× speedup or 0.82 efficiency. With hyper-threading, we see 11.09×speedup for 24 threads. There is a clear load imbalance shown in the loadimbalance graph: the slowest thread is ±1.22× slower than the fastest thread.By activating numactl --interleave=all we get 9.98× speedup at 12 threadsand 11.32× speedup at 24 threads (cf. icc-pthreads-numactl).The Cilk version of BWA scales best, yielding 10.44× speedup for 12 threads (or0.87 efficiency) and 15.67 speedup at 24 threads (cf. icc-cilk-illumina-numactl).
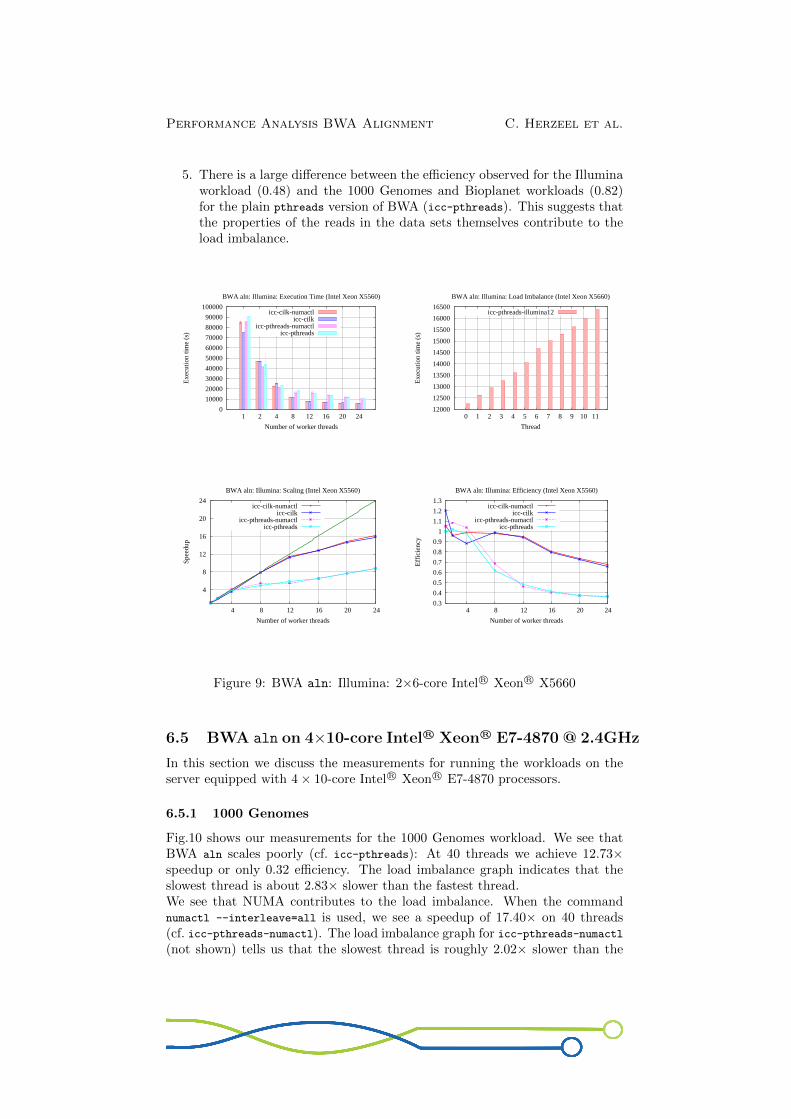
6.4.3 Illumina
Fig.9 shows the results for the Illumina workload. The orignal BWA code doesnot scale linearly (cf. icc-pthreads): For 12 threads we see 5.76× speedup, only48% of the potential speedup (cf. 0.48 efficiency). The load imbalance graphsindicates a factor 1.22× difference between the slowest and fastest thread. For
Performance Analysis BWA Alignment C. Herzeel et al.
0
2000
4000
6000
8000
10000
12000
14000
16000
1 2 4 8 12 16 20 24
Exe
cutio
n tim
e (s
)
Number of worker threads
BWA aln: Bioplanet: Execution Time (Intel Xeon X5660)
icc-cilk-numactlicc-cilk
icc-pthreads-numactlicc-pthreads
1100
1150
1200
1250
1300
1350
1400
0 1 2 3 4 5 6 7 8 9 10 11
Exe
cutio
n tim
e (s
)
Thread
BWA aln: Bioplanet: Accumulated Load Imbalance (Intel Xeon X5660)
icc-pthreads-bioplanet12
4
8
12
16
20
24
4 8 12 16 20 24
Spee
dup
Number of worker threads
BWA aln: Bioplanet: Scaling (Intel Xeon X5660)
icc-cilk-numactlicc-cilk
icc-pthreads-numactlicc-pthreads
0.4
0.5
0.6
0.7
0.8
0.9
1
1.1
1.2
4 8 12 16 20 24
Eff
icie
ncy
Number of worker threads
BWA aln: Bioplanet: Efficiency (Intel Xeon X5660)
icc-cilk-numactlicc-cilk
icc-pthreads-numactlicc-pthreads
Figure 8: BWA aln: Bioplanet: 2×6-core Intel R© Xeon R© X5660
24 threads we see 8.67× speedup. With numactl we see 5.25× speedup at 12threads and 8.71× speedup at 24 threads.The Cilk version of BWA greatly improves scaling. For icc-cilk-numactl wesee 11.42× speedup (or 0.95 efficiency) and 16.19× speedup for 24 threads.
6.4.4 Conclusions
There are a number of observations to make:
1. For all workloads, BWA aln does not scale linearly. At 12 threads, we see0.82 efficiency for both the 1000 Genomes and Bioplanet benchmarks. ForIllumina we see only 0.48 efficiency.
2. For all workloads, we see a large load imbalance amongst the threads: Theslowest thread is roughly 1.20× slower than the fastest thread.
3. Hyper-threading always pays off, indicating that part of the load imbal-ance is due to instructions being stalled due to branch mispredictions andcache misses. These issues are inherent to the algorithmic structure ofsequencing algorithm underlying BWA aln.
4. Our Cilk version of BWA achieves better scaling for all benchmarks: For12 threads, we achieve 0.92 efficiency for 1000 Genomes, 0.87 efficiency forBioplanet, and 0.95 efficiency for Illumina.
Performance Analysis BWA Alignment C. Herzeel et al.
5. There is a large difference between the efficiency observed for the Illuminaworkload (0.48) and the 1000 Genomes and Bioplanet workloads (0.82)for the plain pthreads version of BWA (icc-pthreads). This suggests thatthe properties of the reads in the data sets themselves contribute to theload imbalance.
0
10000
20000
30000
40000
50000
60000
70000
80000
90000
100000
1 2 4 8 12 16 20 24
Exe
cutio
n tim
e (s
)
Number of worker threads
BWA aln: Illumina: Execution Time (Intel Xeon X5560)
icc-cilk-numactlicc-cilk
icc-pthreads-numactlicc-pthreads
12000
12500
13000
13500
14000
14500
15000
15500
16000
16500
0 1 2 3 4 5 6 7 8 9 10 11E
xecu
tion
time
(s)
Thread
BWA aln: Illumina: Load Imbalance (Intel Xeon X5660)
icc-pthreads-illumina12
4
8
12
16
20
24
4 8 12 16 20 24
Spee
dup
Number of worker threads
BWA aln: Illumina: Scaling (Intel Xeon X5560)
icc-cilk-numactlicc-cilk
icc-pthreads-numactlicc-pthreads
0.3
0.4
0.5
0.6
0.7
0.8
0.9
1
1.1
1.2
1.3
4 8 12 16 20 24
Eff
icie
ncy
Number of worker threads
BWA aln: Illumina: Efficiency (Intel Xeon X5560)
icc-cilk-numactlicc-cilk
icc-pthreads-numactlicc-pthreads
Figure 9: BWA aln: Illumina: 2×6-core Intel R© Xeon R© X5660
6.5 BWA aln on 4×10-core Intel R© Xeon R© E7-4870 @ 2.4GHz
In this section we discuss the measurements for running the workloads on theserver equipped with 4× 10-core Intel R© Xeon R© E7-4870 processors.
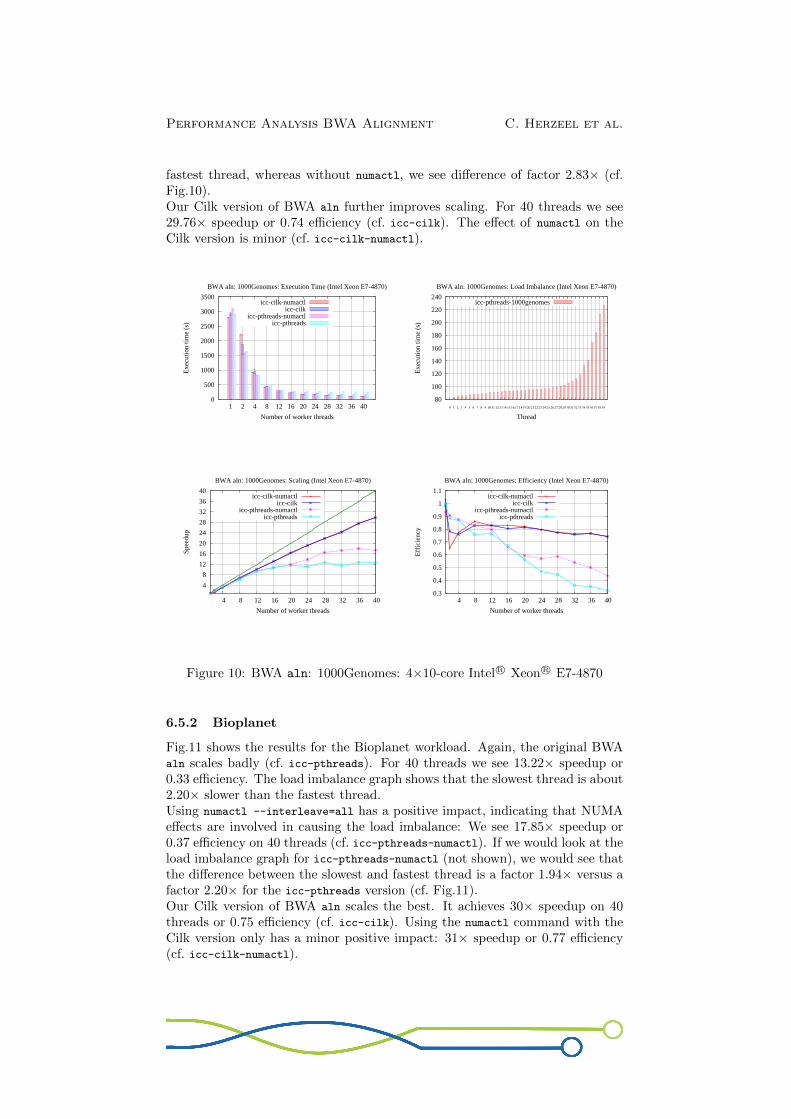
6.5.1 1000 Genomes
Fig.10 shows our measurements for the 1000 Genomes workload. We see thatBWA aln scales poorly (cf. icc-pthreads): At 40 threads we achieve 12.73×speedup or only 0.32 efficiency. The load imbalance graph indicates that theslowest thread is about 2.83× slower than the fastest thread.We see that NUMA contributes to the load imbalance. When the commandnumactl --interleave=all is used, we see a speedup of 17.40× on 40 threads(cf. icc-pthreads-numactl). The load imbalance graph for icc-pthreads-numactl(not shown) tells us that the slowest thread is roughly 2.02× slower than the
Performance Analysis BWA Alignment C. Herzeel et al.
fastest thread, whereas without numactl, we see difference of factor 2.83× (cf.Fig.10).Our Cilk version of BWA aln further improves scaling. For 40 threads we see29.76× speedup or 0.74 efficiency (cf. icc-cilk). The effect of numactl on theCilk version is minor (cf. icc-cilk-numactl).
0
500
1000
1500
2000
2500
3000
3500
1 2 4 8 12 16 20 24 28 32 36 40
Exe
cutio
n tim
e (s
)
Number of worker threads
BWA aln: 1000Genomes: Execution Time (Intel Xeon E7-4870)
icc-cilk-numactlicc-cilk
icc-pthreads-numactlicc-pthreads
80
100
120
140
160
180
200
220
240
0 1 2 3 4 5 6 7 8 9 10 11 12 13 14 15 16 17 18 19 20 21 22 23 24 25 26 27 28 29 30 31 32 33 34 35 36 37 38 39
Exe
cutio
n tim
e (s
)Thread
BWA aln: 1000Genomes: Load Imbalance (Intel Xeon E7-4870)
icc-pthreads-1000genomes
4
8
12
16
20
24
28
32
36
40
4 8 12 16 20 24 28 32 36 40
Spee
dup
Number of worker threads
BWA aln: 1000Genomes: Scaling (Intel Xeon E7-4870)
icc-cilk-numactlicc-cilk
icc-pthreads-numactlicc-pthreads
0.3
0.4
0.5
0.6
0.7
0.8
0.9
1
1.1
4 8 12 16 20 24 28 32 36 40
Eff
icie
ncy
Number of worker threads
BWA aln: 1000Genomes: Efficiency (Intel Xeon E7-4870)
icc-cilk-numactlicc-cilk
icc-pthreads-numactlicc-pthreads
Figure 10: BWA aln: 1000Genomes: 4×10-core Intel R© Xeon R© E7-4870
6.5.2 Bioplanet
Fig.11 shows the results for the Bioplanet workload. Again, the original BWAaln scales badly (cf. icc-pthreads). For 40 threads we see 13.22× speedup or0.33 efficiency. The load imbalance graph shows that the slowest thread is about2.20× slower than the fastest thread.Using numactl --interleave=all has a positive impact, indicating that NUMAeffects are involved in causing the load imbalance: We see 17.85× speedup or0.37 efficiency on 40 threads (cf. icc-pthreads-numactl). If we would look at theload imbalance graph for icc-pthreads-numactl (not shown), we would see thatthe difference between the slowest and fastest thread is a factor 1.94× versus afactor 2.20× for the icc-pthreads version (cf. Fig.11).Our Cilk version of BWA aln scales the best. It achieves 30× speedup on 40threads or 0.75 efficiency (cf. icc-cilk). Using the numactl command with theCilk version only has a minor positive impact: 31× speedup or 0.77 efficiency(cf. icc-cilk-numactl).

Performance Analysis BWA Alignment C. Herzeel et al.
0
2000
4000
6000
8000
10000
12000
14000
16000
18000
20000
1 2 4 8 12 16 20 24 28 32 36 40
Exe
cutio
n tim
e (s
)
Number of worker threads
BWA aln: Bioplanet: Execution Time (Intel Xeon E7-4870)
icc-cilk-numactlicc-cilk
icc-pthreads-numactlicc-pthreads
500
600
700
800
900
1000
1100
1200
1300
0 1 2 3 4 5 6 7 8 9 101112131415161718192021222324252627282930313233343536373839
Exe
cutio
n tim
e (s
)
Thread
BWA aln: Bioplanet: Load Imbalance (Intel Xeon E7-4870)
icc-pthreads-bioplanet
4
8
12
16
20
24
28
32
36
40
4 8 12 16 20 24 28 32 36 40
Spee
dup
Number of worker threads
BWA aln: Bioplanet: Scaling (Intel Xeon E7-4870)
icc-cilk-numactlicc-cilk
icc-pthreads-numactlicc-pthreads
0.3
0.4
0.5
0.6
0.7
0.8
0.9
1
4 8 12 16 20 24 28 32 36 40
Eff
icie
ncy
Number of worker threads
BWA aln: Bioplanet: Efficiency (Intel Xeon E7-4870)
icc-cilk-numactlicc-cilk
icc-pthreads-numactlicc-pthreads
Figure 11: BWA aln: Bioplanet: 4×10-core Intel R© Xeon R© E7-4870
6.5.3 Illumina
Fig.12 show the measurements for the Illumina workload. The original BWAaln code scales poorly, only achieving 17.84× speedup or 0.44 efficiency with 40threads. There is again a clear load imbalance: The slowest thread is ±1.83×slower than the fastest thread.NUMA effects seem to be part of the load imbalance: When using numactl
--interleave=all, we see a speedup of 20.26× or 0.51 efficiency for 40 threads.When we investigate the load imbalance graph for icc-pthreads-numactl (notshown), we see that the slowest thread is about 1.57× slower than the fastestthread, whereas the difference for the icc-pthreads version is a factor ±1.83×(cf. Fig.12).Our Cilk version again gives the best scaling results. For 40 threads, we see a28.42× speedup or 0.71 efficiency (cf. icc-cilk). With the numactl option, theCilk version achieves 29.23× speedup or 0.73 efficiency.
6.5.4 Conclusions
We make the following observations:
1. The original pthreads implementation of BWA aln scales very poorly forall of our workloads. For 40 threads, we see 0.32 efficiency for the 1000
Performance Analysis BWA Alignment C. Herzeel et al.
0
20000
40000
60000
80000
100000
120000
140000
1 4 8 16 32 40
Exe
cutio
n tim
e (s
)
Number of worker threads
BWA aln: Illumina: Execution Time (Intel Xeon E7-4870)
icc-cilk-numactlicc-cilk
icc-pthreads-numactlicc-pthreads
3000
3500
4000
4500
5000
5500
6000
0 1 2 3 4 5 6 7 8 9 101112131415161718192021222324252627282930313233343536373839
Exe
cutio
n tim
e (s
)
Thread
BWA aln: Illumina: Accumulated Load Imbalance (Intel Xeon E7-4870)
icc-pthreads-illumina
4
8
12
16
20
24
28
32
36
40
4 8 12 16 20 24 28 32 36 40
Spee
dup
Number of worker threads
BWA aln: Illumina: Scaling (Intel Xeon E7-4870)
icc-cilk-numactlicc-cilk
icc-pthreads-numactlicc-pthreads
0.4
0.5
0.6
0.7
0.8
0.9
1
4 8 12 16 20 24 28 32 36 40
Eff
icie
ncy
Number of worker threads
BWA aln: Illumina: Efficiency (Intel Xeon E7-4870)
icc-cilk-numactlicc-cilk
icc-pthreads-numactlicc-pthreads
Figure 12: BWA aln: Illumina: 4×10-core Intel R© Xeon R© E7-4870
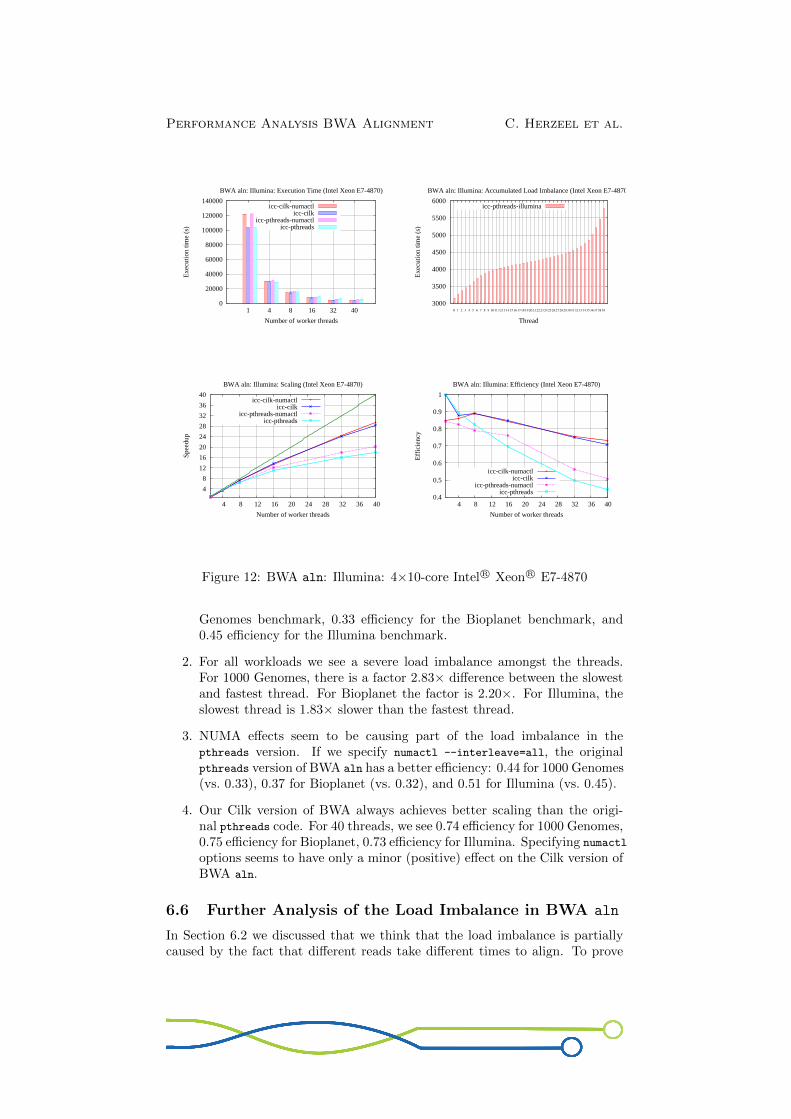
Genomes benchmark, 0.33 efficiency for the Bioplanet benchmark, and0.45 efficiency for the Illumina benchmark.
2. For all workloads we see a severe load imbalance amongst the threads.For 1000 Genomes, there is a factor 2.83× difference between the slowestand fastest thread. For Bioplanet the factor is 2.20×. For Illumina, theslowest thread is 1.83× slower than the fastest thread.
3. NUMA effects seem to be causing part of the load imbalance in thepthreads version. If we specify numactl --interleave=all, the originalpthreads version of BWA aln has a better efficiency: 0.44 for 1000 Genomes(vs. 0.33), 0.37 for Bioplanet (vs. 0.32), and 0.51 for Illumina (vs. 0.45).
4. Our Cilk version of BWA always achieves better scaling than the origi-nal pthreads code. For 40 threads, we see 0.74 efficiency for 1000 Genomes,0.75 efficiency for Bioplanet, 0.73 efficiency for Illumina. Specifying numactl
options seems to have only a minor (positive) effect on the Cilk version ofBWA aln.
6.6 Further Analysis of the Load Imbalance in BWA aln
In Section 6.2 we discussed that we think that the load imbalance is partiallycaused by the fact that different reads take different times to align. To prove
Performance Analysis BWA Alignment C. Herzeel et al.
this claim we set up an experiment where we measure the number of instructionsand time spent per read.
6.6.1 Counting the number of instructions per read
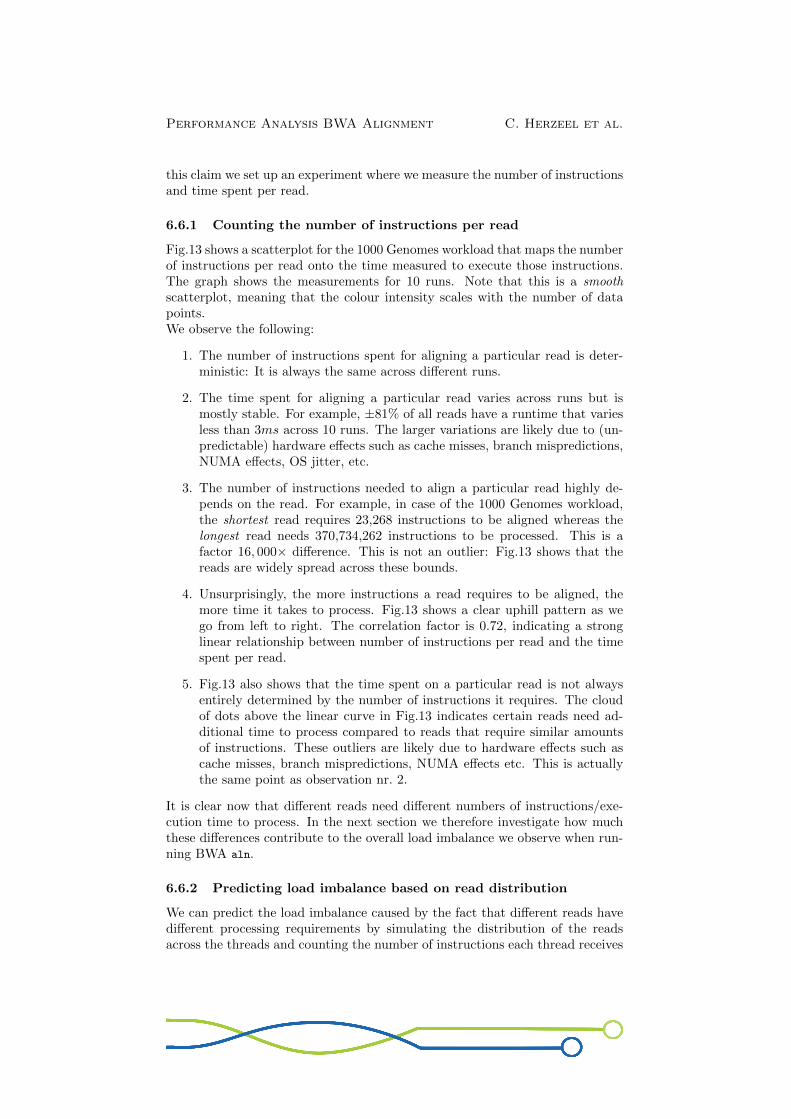
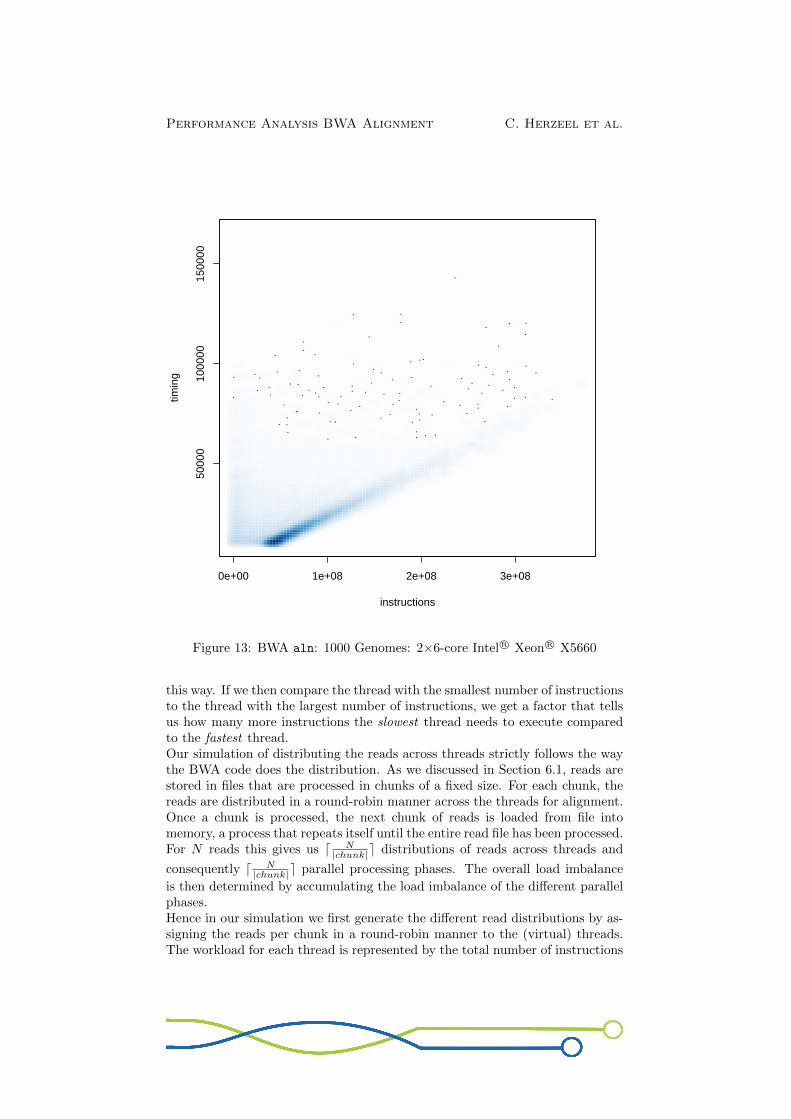
Fig.13 shows a scatterplot for the 1000 Genomes workload that maps the numberof instructions per read onto the time measured to execute those instructions.The graph shows the measurements for 10 runs. Note that this is a smoothscatterplot, meaning that the colour intensity scales with the number of datapoints.We observe the following:
1. The number of instructions spent for aligning a particular read is deter-ministic: It is always the same across different runs.
2. The time spent for aligning a particular read varies across runs but ismostly stable. For example, ±81% of all reads have a runtime that variesless than 3ms across 10 runs. The larger variations are likely due to (un-predictable) hardware effects such as cache misses, branch mispredictions,NUMA effects, OS jitter, etc.
3. The number of instructions needed to align a particular read highly de-pends on the read. For example, in case of the 1000 Genomes workload,the shortest read requires 23,268 instructions to be aligned whereas thelongest read needs 370,734,262 instructions to be processed. This is afactor 16, 000× difference. This is not an outlier: Fig.13 shows that thereads are widely spread across these bounds.
4. Unsurprisingly, the more instructions a read requires to be aligned, themore time it takes to process. Fig.13 shows a clear uphill pattern as wego from left to right. The correlation factor is 0.72, indicating a stronglinear relationship between number of instructions per read and the timespent per read.
5. Fig.13 also shows that the time spent on a particular read is not alwaysentirely determined by the number of instructions it requires. The cloudof dots above the linear curve in Fig.13 indicates certain reads need ad-ditional time to process compared to reads that require similar amountsof instructions. These outliers are likely due to hardware effects such ascache misses, branch mispredictions, NUMA effects etc. This is actuallythe same point as observation nr. 2.
It is clear now that different reads need different numbers of instructions/exe-cution time to process. In the next section we therefore investigate how muchthese differences contribute to the overall load imbalance we observe when run-ning BWA aln.
6.6.2 Predicting load imbalance based on read distribution
We can predict the load imbalance caused by the fact that different reads havedifferent processing requirements by simulating the distribution of the readsacross the threads and counting the number of instructions each thread receives
Performance Analysis BWA Alignment C. Herzeel et al.
0e+00 1e+08 2e+08 3e+08
5000
010
0000
1500
00
instructions
timin
g
Figure 13: BWA aln: 1000 Genomes: 2×6-core Intel R© Xeon R© X5660
this way. If we then compare the thread with the smallest number of instructionsto the thread with the largest number of instructions, we get a factor that tellsus how many more instructions the slowest thread needs to execute comparedto the fastest thread.Our simulation of distributing the reads across threads strictly follows the waythe BWA code does the distribution. As we discussed in Section 6.1, reads arestored in files that are processed in chunks of a fixed size. For each chunk, thereads are distributed in a round-robin manner across the threads for alignment.Once a chunk is processed, the next chunk of reads is loaded from file intomemory, a process that repeats itself until the entire read file has been processed.For N reads this gives us d N
|chunk|e distributions of reads across threads and
consequently d N|chunk|e parallel processing phases. The overall load imbalance
is then determined by accumulating the load imbalance of the different parallelphases.Hence in our simulation we first generate the different read distributions by as-signing the reads per chunk in a round-robin manner to the (virtual) threads.The workload for each thread is represented by the total number of instructions
Performance Analysis BWA Alignment C. Herzeel et al.
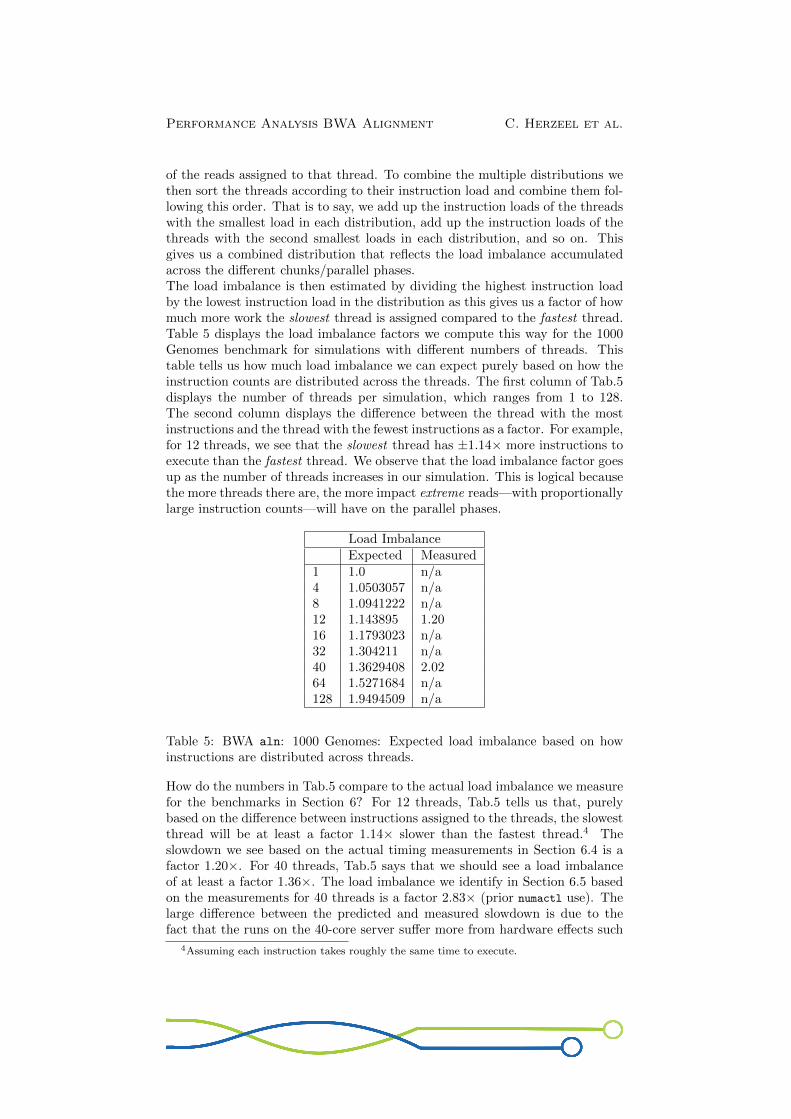
of the reads assigned to that thread. To combine the multiple distributions wethen sort the threads according to their instruction load and combine them fol-lowing this order. That is to say, we add up the instruction loads of the threadswith the smallest load in each distribution, add up the instruction loads of thethreads with the second smallest loads in each distribution, and so on. Thisgives us a combined distribution that reflects the load imbalance accumulatedacross the different chunks/parallel phases.The load imbalance is then estimated by dividing the highest instruction loadby the lowest instruction load in the distribution as this gives us a factor of howmuch more work the slowest thread is assigned compared to the fastest thread.Table 5 displays the load imbalance factors we compute this way for the 1000Genomes benchmark for simulations with different numbers of threads. Thistable tells us how much load imbalance we can expect purely based on how theinstruction counts are distributed across the threads. The first column of Tab.5displays the number of threads per simulation, which ranges from 1 to 128.The second column displays the difference between the thread with the mostinstructions and the thread with the fewest instructions as a factor. For example,for 12 threads, we see that the slowest thread has ±1.14× more instructions toexecute than the fastest thread. We observe that the load imbalance factor goesup as the number of threads increases in our simulation. This is logical becausethe more threads there are, the more impact extreme reads—with proportionallylarge instruction counts—will have on the parallel phases.
Load ImbalanceExpected Measured
1 1.0 n/a4 1.0503057 n/a8 1.0941222 n/a12 1.143895 1.2016 1.1793023 n/a32 1.304211 n/a40 1.3629408 2.0264 1.5271684 n/a128 1.9494509 n/a
Table 5: BWA aln: 1000 Genomes: Expected load imbalance based on howinstructions are distributed across threads.
How do the numbers in Tab.5 compare to the actual load imbalance we measurefor the benchmarks in Section 6? For 12 threads, Tab.5 tells us that, purelybased on the difference between instructions assigned to the threads, the slowestthread will be at least a factor 1.14× slower than the fastest thread.4 Theslowdown we see based on the actual timing measurements in Section 6.4 is afactor 1.20×. For 40 threads, Tab.5 says that we should see a load imbalanceof at least a factor 1.36×. The load imbalance we identify in Section 6.5 basedon the measurements for 40 threads is a factor 2.83× (prior numactl use). Thelarge difference between the predicted and measured slowdown is due to thefact that the runs on the 40-core server suffer more from hardware effects such
4Assuming each instruction takes roughly the same time to execute.
Performance Analysis BWA Alignment C. Herzeel et al.
as NUMA. For example, when using numactl to neutralise NUMA effects, weobserve a slowdown factor of roughly 2.02× (cf. Section 6.5), which is closer tothe predicted load imbalance of factor 1.36×, and our particular use of numactl
does not even guarantee the optimal memory layout for our 40-core server.Hence although it is clear that there is a load imbalance because threads areassigned different amounts of instructions, hardware factors such as NUMA alsocontribute to the observed load imbalance.
6.6.3 Impact of chunk size
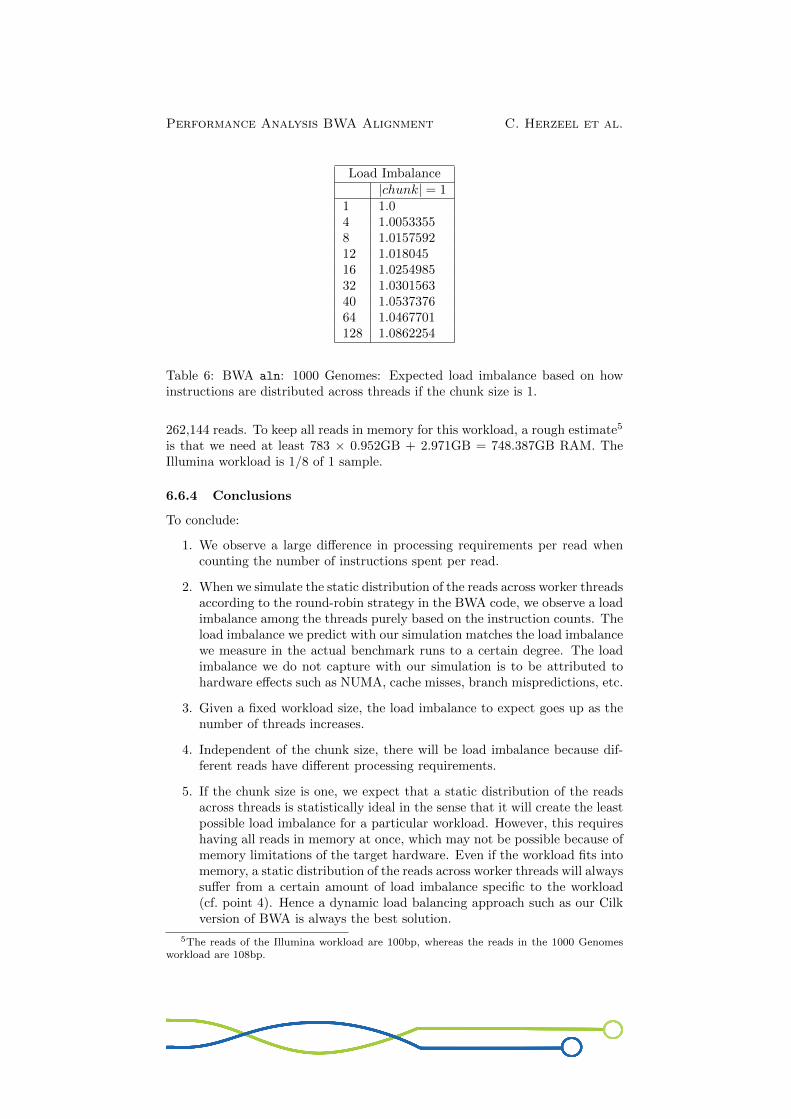
The chunk size has a big impact on the expected load imbalance for a particulardata set. In Tab.6 we show the load imbalance that would be expected if thechunk size were one, i.e. if all reads would be read into memory at the same timeand processed in one go by a single parallel phase. Although there is still loadimbalance expected for a chunk size of one, it is far less than what is predicted(and observed) for the default chunk size of the BWA program (cf. Tab.5).The chunk size determines how many reads are processed in one go and conse-quently how many parallel phases occur. The default chunk size of the BWAprogram is 262,144. For the 1000 Genomes data set, which consists of 14,845,357reads (cf. Section 4.2), this means there are 57 parallel phases required to processthe workload. We also note that the number of reads that each phase processesis much smaller than the total number of reads in a workload. We explainedin the previous section that different reads may have very different processingrequirements in terms of numbers of instructions, seeing extreme differences upto a factor 16000×. Statistically, given the large number of reads in a typicalworkload, if all reads are processed in one go as one big chunk, the extremereads will be distributed across the threads, minimising the overall load imbal-ance, giving us the load imbalance we predict in Tab.6. However, if the chunksizes are much smaller than the total read set, one extreme read may have asevere impact on the load imbalance of a single parallel phase. Because thereis an implicit synchronisation between phases, all threads but one are waitingfor the processing of the extreme read to finish. Overall, we can then expectto accumulate a more severe load imbalance across the different parallel phases,which is what we predict (and observe) in Tab.5 when using the default chunksize of the BWA program.It is important to stress that the numbers in Tab.5 and Tab.6 are specific to the1000 Genomes workload. Other workloads will have different load imbalances.Although the theoretical load imbalance is lowest when there is only one chunk,configuring this may not be possible as it requires storing all reads in memory atonce. As a test, we ran the BWA program for one chunk of the 1000 Genomesworkload through Valgrind/Massif. We observe that:
1. The support data structures, i.e. occ tab and c tab, use 2.971GB memory.
2. One chunk requires 0.952GB memory.
The 1000 Genomes workload consists of 57 chunks of 262,144 reads. Hencekeeping all reads in memory at once would require 57 × 0.952GB + 2.971GB= 57.235GB RAM. The Illumina workload, however, consists of 783 chunks ×
Performance Analysis BWA Alignment C. Herzeel et al.
Load Imbalance|chunk| = 1
1 1.04 1.00533558 1.015759212 1.01804516 1.025498532 1.030156340 1.053737664 1.0467701128 1.0862254
Table 6: BWA aln: 1000 Genomes: Expected load imbalance based on howinstructions are distributed across threads if the chunk size is 1.
262,144 reads. To keep all reads in memory for this workload, a rough estimate5
is that we need at least 783 × 0.952GB + 2.971GB = 748.387GB RAM. TheIllumina workload is 1/8 of 1 sample.
6.6.4 Conclusions
To conclude:
1. We observe a large difference in processing requirements per read whencounting the number of instructions spent per read.
2. When we simulate the static distribution of the reads across worker threadsaccording to the round-robin strategy in the BWA code, we observe a loadimbalance among the threads purely based on the instruction counts. Theload imbalance we predict with our simulation matches the load imbalancewe measure in the actual benchmark runs to a certain degree. The loadimbalance we do not capture with our simulation is to be attributed tohardware effects such as NUMA, cache misses, branch mispredictions, etc.
3. Given a fixed workload size, the load imbalance to expect goes up as thenumber of threads increases.
4. Independent of the chunk size, there will be load imbalance because dif-ferent reads have different processing requirements.
5. If the chunk size is one, we expect that a static distribution of the readsacross threads is statistically ideal in the sense that it will create the leastpossible load imbalance for a particular workload. However, this requireshaving all reads in memory at once, which may not be possible because ofmemory limitations of the target hardware. Even if the workload fits intomemory, a static distribution of the reads across worker threads will alwayssuffer from a certain amount of load imbalance specific to the workload(cf. point 4). Hence a dynamic load balancing approach such as our Cilkversion of BWA is always the best solution.
5The reads of the Illumina workload are 100bp, whereas the reads in the 1000 Genomesworkload are 108bp.
Performance Analysis BWA Alignment C. Herzeel et al.
6.6.5 Further optimisation possibilities
The fact that reads have extremely varying processing requirements—up to afactor 16000× difference in instructions for the 1000 Genomes workload—mayalso explain why our Cilk version of BWA does not achieve perfect parallelefficiency. For example, for the 1000 Genomes workload we see that our Cilkversion achieves only 0.90 efficiency on a 12-core server (cf. Section 6.4.1) and0.75 efficiency on a 40-core server (cf. Section 6.5.1).In theory, a work-stealing approach such as Cilk removes load imbalance so thatperfect linear scaling is possible (cf. Section 6.3). This however assumes eithera) that the parallel tasks that are indivisible require roughly the same time toprocess or b) that for every indivisible task that requires disproportionally moretime to process, there are enough compensating tasks so that all worker threadscan be kept busy for roughly the same amount of time.In our Cilk version of BWA, the alignment of one read is currently an indivisibletask. Given the extreme difference between reads in terms of instruction countsand the relatively small number of reads per chunk compared to the total numberof reads in the data set, it may be the case that while a certain worker threadis stuck aligning an extreme read, the other worker threads are idle becausethey cannot help out because the task of aligning a read cannot be divided, andthere are no other reads left to align. In such a situation, there could be loadimbalance even in a Cilk approach.There are a number of additional optimisations we could try to assist the Cilkwork-stealing scheduler:
1. We could try to parallelise the alignment of individual reads. That waythe alignment of a read becomes a divisible task so that different workerthreads can help processing the extreme reads.
2. We could reduce the number of chunking steps (cf. Section 6.6.3). Thisdecreases the chance that a worker thread that is stuck with an extremeread prevents the other worker threads from doing any work because thechance would be higher that they could simply fetch other reads to workon. However, as we already discussed in Section 6.6.3, the best possiblechunk size for a workload depends on the size of the workload and howmuch memory is available on the target server. Currently, the chunk sizeis hard-coded in the BWA program. We would either make this a user-configurable option or adapt the code to automatically detect the bestchunk size.
3. We could pipeline the process of reading the reads from file into memoryand the process of aligning reads. This way worker threads that cannotassist worker threads with tough reads may already start processing thenext chunk of reads. This approach would keep the advantage of thechunking approach w.r.t. reducing the stress on memory use.
References
[1] Li, H., Durbin, R.: Fast and accurate short read alignment with Burrows-Wheelertransform, Bioinformatics 2009, 25(14):1754-60 (2009)
[2] Burrows-Wheeler Aligner, http://bio-bwa.sourceforge.net/
Performance Analysis BWA Alignment C. Herzeel et al.
[3] 1000 Genomes Project, http://www.1000genomes.org/
[4] Genome Comparison & Analytics Testing, http://www.bioplanet.com/gcat/
[5] dwgsim read simulator, http://davetang.org/wiki2/index.php?title=DWGSIM
[6] http://www.illumina.com/platinumgenomes/
[7] Blumofe R., Leiserson C., Scheduling multithreaded computations by work steal-ing, Journal of the ACM (JACM) Vol. 46 Iss. 5, pp. 720-748, 1999
[8] Farragina, P., Manzini, G., Opportunistic data structures with applications, In:41st IEEE Annual Symposium on Foundations of Computer Science, pp. 390–398,IEEE Computer Society, Los Alamitos, CA, USA (2000)
[9] Langmead, B., Trapnell, C., Pop, M., Salzberg, S.L., Ultrafast and memory-efficient alignment of short DNA sequences to the human genome, Genome Biology2009, 10:R25 (2009)
[10] Li, R., Yu, C. et al, , SOAP2: an improved ultrafast tool for short read alignment,Bioinformatics 2009 25(15):1966–1967 (2009)
[11] Herzeel, C., Costanza, P., Ashby, T., Resolving Load Balancing Issues in BWAon NUMA Multicore Architectures, PPAM 2013 (to appear)
[12] Leiserson, C. E.: The Cilk++ concurrency platform, The Journal of Supercom-puting, vol. 51, iss. 3, pp. 244–257, March 2010, Kluwer Academic Publishers(2010)
[13] Intel R© Cilk Plus, http://software.intel.com/en-us/intel-cilk-plus