Embed Size (px)
Citation preview

GSJ: VOLUME 6, ISSUE 6, JUNE 2018 44
GSJ© 2018
www.globalscientificjournal.com
GSJ: Volume 6, Issue 6, June 2018, Online: ISSN 2320-9186
www.globalscientificjournal.com
PERFORMANCE ANALYSIS OF GAS TURBINE POWER
PLANT (A CASE STUDY OF DELTA III GT9 TRANSCORP GAS
TURBINE POWER PLANT, UGHELLI, NIGERIA) ODINIKUKU EJENAVI WILLIAM Odinikuku Ejenavi William is a lecturer in Department of Mechanical Engineering, Petroleum Training Institute, Effurun, Nigeria
KeyWords
Gas turbine power plant, Performance, Analysis, Thermodynamic principle, Data, Thermal efficiency
ABSTRACT
This research work is focused on the analysis and performance evaluation of a gas turbine power plant. The gas turbine power plant was evaluated using thermodynamic principles and the technical data of the plant. The data used for the study were obtained from the plant records of Delta III GT9 plant. The results of the analysis for a period of twelve (12) months (January to December, 2016) show that 92% of the expected capacity was available in the period under study. The thermal efficiency of the plant ranged from 26% to 32%, and the plant's capacity factors ranged from 68% to 80%. The reliability of the plant ranged from 21% to 98% (average 58%). For the period under study, only 20 MW of energy (power) was lost out of the expected power of 240 MW. The study revealed that the above performance parameters analyzed for Delta III GT9 plant are within the range of best industrial practice. Also, the efficiencies achieved for the period under study are within the best international value for a single cycle gas turbine plant.
ODINIKUKU EJENAVI WILLIAM

GSJ: VOLUME 6, ISSUE 6, JUNE 2018 45
GSJ© 2018
www.globalscientificjournal.com
Introduction A gas turbine, also known as a combustion turbine, is a rotary engine that removes energy from a flow of hot
gas produced by the combustion of gas or fuel oil in a stream of compressed air. It has an upstream air compressor with radial or axial flow mechanically coupled to a downstream turbine and a combustion chamber in between. Energy is released when compressed air is mixed with fuel and ignited in the combustion chamber (combustor) *1+. Energy is removed from gas turbine in the form of shaft power, and this is used to power electric generators and other machineries *1+. Gas turbines are becoming increasingly used for power generation for wide variety of applications around the world. The gas turbine performance is affected by the component efficiencies and turbine inlet temperature *1-3+.
Gas turbine performance is critically limited by temperature variation, especially in hot and rain region like Sub-Sahara Africa *4+. The increases in inlet air temperature become more noticeable especially in the hot weather, and this causes a significant decrease in gas turbine power output. It occurs because the power output is inversely propor-tional to the ambient temperature and because of the high specific volume of air drawn by the compressor *5+. The efficiency and power output of gas turbines changes according to the ambient conditions *6+. The resulted amount of these disparities greatly affects electricity generation, fuel consumption and plant incomes *7+. The effect of temperature is very predominant; for every 56 degree Celsius increase in turbine temperature, the work output increases approximately 10% and gives about 1.5% increase in efficiency *8+. The overall efficiency of the gas turbine cycle depends primarily upon the pressure ratio of the compressor *8+.
The performance analysis of a gas turbine power plant is geared basically towards the determination of the energy efficiency of the plant *9+. A plant’s energy efficiency has definite economic significance since the heat input at high temperature represents the energy that must be purchased and the net energy output represents the return for the purchased energy. Basically gas turbine which operates at lower turbine inlet temperatures will result in low performance and decreased efficiency. Lower efficiency of gas turbine means that low power output is produced *10+. According to Kakaras *11+, the gas turbine output and efficiency is a strong function of the ambient air temperature. For every 1oC rise in ambient temperature above ISO-rated conditions, the gas turbine losses 1% in terms of thermally efficiency and 1.47MW of its gross power output. At the same time the specific heat consumption increases by a percentage between 1.5% and 4%. The ISO ratings for ambient conditions are: ambient temperature, 15oC, ambient pressure, 1bar (100.16kPa), and relative Humidity of 60% *12-13+. Lamfon *14+ investigated the performance of a 23.7 MW gas turbine plant operated at ambient temperature of 30oC to 45 OC. The net power output is improved by 11% when the gas turbine engine is supplied with cold air at the inlet. At the ambient temperature of 30oC the net power output increases by 11% at ISO-rated condition, accompanied by a 2% rise in thermal efficiency and a drop in specific fuel consumption of 2%. Mohanty *15+ reported that increasing the inlet air temperature from the ISO-rated condition to a temperature of 30oC, would result in a 10% decrease in the net power output. For gas turbine of smaller capacities, this decreased in power output can be even greater. He also indicated that a rise in the ambient temperature by 1oC resulted in 1% drop of the gas turbine rated capacity. Ameri *16+ reported that when the ambient temperature decrease from 34.2oC to ISO-rated condition, the average power output can be increased by as much as 11.3%. He also pointed out that 1oC increase in ambient air temperature resulted in the power output and decreased the efficiency by 0.74%.
Considering the vital role energy plays in a country’s economic development and its expected significant future demand, energy conservation and efficient use becomes a major option. This research work therefore, evaluates the performance (in terms of efficiency and reliability) of Delta III GT9 (Hitachi H25 Gas Turbine Generator) plant of Transcorp Power Station Ughelli, over a period of one (1) year (January to December, 2016).
Research Methodology
The performance analysis was carried out on Delta III GT9 (Hitachi H25 Gas Turbine Generator) plant. Several trips were made to the plant during which operational data were collected from plant records from January to December, 2016 prepared by the Efficiency Department. The performance analysis is done based on

GSJ: VOLUME 6, ISSUE 6, JUNE 2018 46
GSJ© 2018
www.globalscientificjournal.com
thermodynamics principles, and the technical data of the plant. 2.1 Data Collection
The data used for this work were collected from Delta III GT9 (Hitachi H25 Gas Turbine Generator) plant's operational data from January to December, 2016. Information on the following parameters was used in the analysis:
i. Energy (power) generated by the plant (MW) ii. Mass of fuel consumed (kg) iii. Installed capacity of the plant (i.e. 25 MW) iv. Gross Calorific value of fuel (Natural gas)(i.e. 52590kJ/kg) v. Running Hours vi. Downtime
2.2 Data Analysis The performance of a gas turbine depends on several parameters and the most important are:
i. Compressor efficiency ii. Turbine efficiency iii. Thermal efficiency iv. Plant heat rate v. Plant fuel rate vi. Capacity factor vii. Reliability
In this study, the above parameters for a period of twelve (12) months (January to December) of the year 2016
were determine as the performance indicators of the plant. The key parameters are the plant capacity factor, plant fuel rate, plant Heat rate, and the thermal efficiency of the plant.
2.2.1 Power Generated and PLANT Capacity Factor
Table 1 shows the power generated and the capacity factor per month. The power generated is gotten from the data provided by the Efficiency Department.
Table1: Power Generated and the Capacity Factor of the Plant
Months Power Generated (MWH)
Running Hours Power Generated (MW)
Available Power (MW)
Capacity Factor (%)
January 11,817 607 19 20 76 February 5,967 329 18 20 72 March 2,681 159 17 20 68 April 11,612 609 19 20 76 May 10,381 593 18 20 72 June 5,067 281 18 20 72 July 5,388 275 20 20 80 August 9,861 523 19 20 72 September 5,602 322 17 20 68 October 7,786 428 18 20 72 November 4,200 230 18 20 72 December 13,809 731 19 20 76
Total 220 240 Average 18.33 20
The drop in the capacity factor below 70% in the month of March and September was as a result of major
inspection that was carried out on the plant. 2.2.2. Capacity Factor (CF)
From the table above the capacity factor was gotten by dividing the power generated by the plant capacity by the plant installed capacity.

GSJ: VOLUME 6, ISSUE 6, JUNE 2018 47
GSJ© 2018
www.globalscientificjournal.com
(1)
2.2.3 Plant Heat Rate (HR)
(2)
The values for the plant heat rate were obtained by calculations based on the operational data obtained. Table 2 shows the plant heat rate per month for the year 2016.
Table 2: Plant Heat Rate
Months Total Heat Supplied (KJ/h) Total Power Output (MW) Plant Heat Rate (KJ/MWH) January 261,477,480 19 13,761,973 February 242,965,800 18 13,498,100 March 225,874,050 17 13,286,909 April 216,460,440 19 11,392,655 May 226,189,590 18 12,566,088 June 203,681,070 18 11,315,615 July 247,856,670 20 12,392,834 August 236,812,770 19 12,463,830 September 221,983,390 17 13,057,846 October 233,815,140 18 12,989,730 November 245,910,840 18 13,661,713 December 242,702,850 19 12,773,834 Total 153,161,127 Average 12,763,427
2.2.4. Plant Fuel Rate (SFC)
(3)
The values for the plant fuel rate were obtained by calculations based on the operational data obtained. Table 3 shows the plant fuel rate per month for the year 2016.
Table 3: Plant Fuel Rate
Months Total Fuel Consumption (Kg/h) Total Power Output (KW) Plant Fuel Rate (Kg/KWh) January 4,972 19000 0.262 February 4,620 18000 0.256 March 4,295 17000 0.253 April 4,116 19000 0.217 May 4,301 18000 0.239 June 3,873 18000 0.215 July 4,713 20000 0.236 August 4,503 19000 0.237 September 4,221 17000 0.248 October 4,446 18000 0.247 November 4,676 18000 0.260 December 4,615 19000 0.243 Total 2.913 Average 0.243

GSJ: VOLUME 6, ISSUE 6, JUNE 2018 48
GSJ© 2018
www.globalscientificjournal.com
3.2.5 Thermal Efficiency (ηth)
(4)
The values for the thermal efficiency of the plant were obtained by calculations based on the operational data obtained. Table 4 shows the thermal efficiency of the plant per month for the year 2016.
Table 4: Thermal Efficiency of the Plant
Months Power Output (kW) Total Fuel consumed (kg/s) Calorific Value (kJ/kg) Thermal Efficiency (%)
January 19000 1.3811 52590 26
February 18000 1.2833 52590 27 March 17000 1.1931 52590 27 April 19000 1.1433 52590 32 May 18000 1.1947 52590 29 June 18000 1.0758 52590 32 July 20000 1.3092 52590 29 August 19000 1.2508 52590 29 September 17000 1.1725 52590 28 October 18000 1.2350 52590 28 November 18000 1.2989 52590 26 December 19000 1.2819 52590 28
2.2.6 Reliability of the Plant
(5)
Table 5 shows the calculated values of gas turbine plant reliability.
Table 5: Reliability of the Plant Months Expected Running Hours Actual Running Hours Downtime(Hrs.) Reliability (%) January 744 607 137 82 February 672 329 343 49 March 744 159 585 21 April 720 609 111 85 May 744 593 151 80 June 720 281 439 39 July 744 275 469 37 August 744 523 221 70 September 720 322 398 45 October 744 428 316 58 November 720 230 490 32 December 744 731 13 98
The drop in reliability below 40% for the month of March, June, July, and November was as a result of major
inspection that was carried out on the plant also the plant was out of service for a period due to gas shortage.
2.2.7. Compressor Efficiency (ηc) The values for the compressor efficiency of the plant were obtained by calculations based on the operational
data obtained. Table 6 shows the efficiency of the compressor in each month for the year 2016.
GSJ: VOLUME 6, ISSUE 6, JUNE 2018 49
GSJ© 2018
www.globalscientificjournal.com
Table 6: Compressor Efficiency (for 2016) Months Compressor Efficiency (%) January 82
February 81 March 80 April 82 May 81 June 81 July 83
August 82 September 80
October 81 November 81 December 82
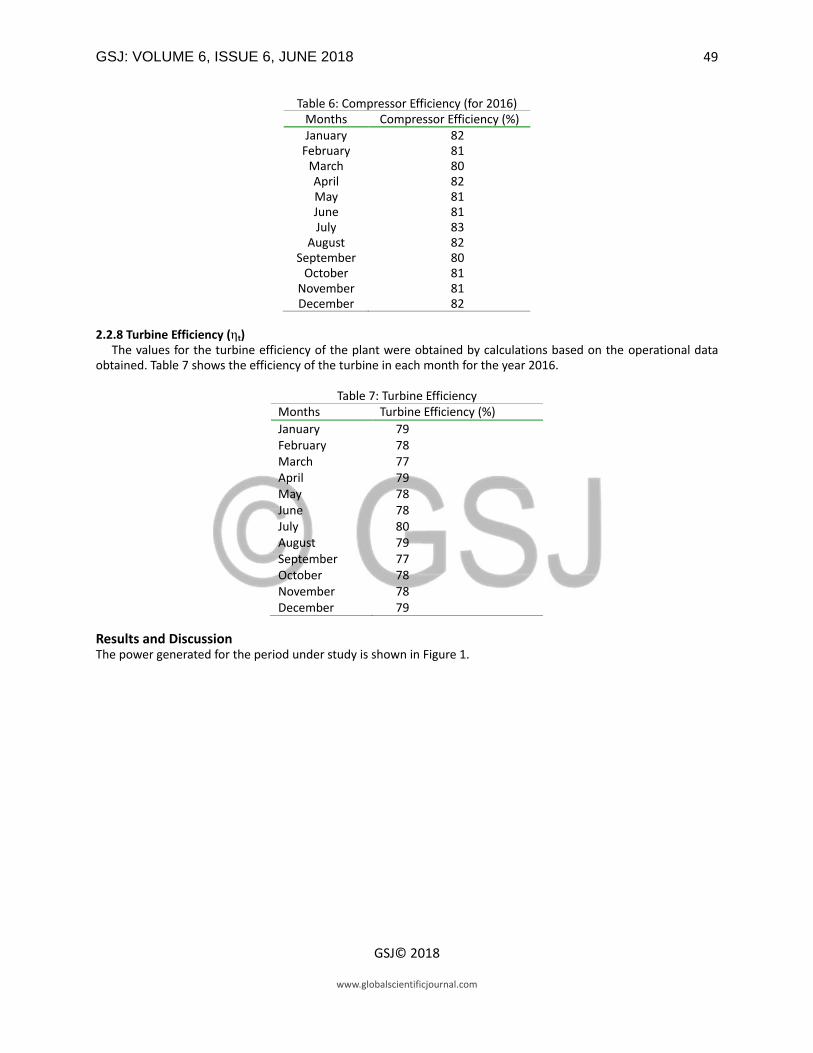
2.2.8 Turbine Efficiency (ηt)
The values for the turbine efficiency of the plant were obtained by calculations based on the operational data obtained. Table 7 shows the efficiency of the turbine in each month for the year 2016.
Table 7: Turbine Efficiency
Months Turbine Efficiency (%)
January 79 February 78 March 77 April 79 May 78 June 78 July 80 August 79 September 77 October 78 November 78 December 79
Results and Discussion The power generated for the period under study is shown in Figure 1.

GSJ: VOLUME 6, ISSUE 6, JUNE 2018 50
GSJ© 2018
www.globalscientificjournal.com
Figure 1: Power generated by Delta III GT9
The expected full load installed capacity of the plant under study is 25 MW of power for each month, then for the
whole year (January to December) it is expected to generate a total of 300 MW of power. But the available capacity
(the obtainable power) for each month is 20 MW (240 MW/year), and the actual generated capacity for each
month ranges from 17 MW to 20 MW (Figure 1). The average actual power generated by the plant from the data
obtained for the period under study is about 18 MW, and the total actual power generated is 220 MW against the
240 MW available powers. This shows that only 20 MW is lost, hence about 92% of the available power was
actually available. The power lost was as a result of the plant being out of service for a period in the month of
March, June and July due to gas shortage. Also, in the month of November a major inspection (MI) was carried out
on the plant resulted to downtime. The plant capacity for the period under study is presented in Figure 2.

GSJ: VOLUME 6, ISSUE 6, JUNE 2018 51
GSJ© 2018
www.globalscientificjournal.com
Figure 2: Plant’s Capacity Factor
The average capacity factor of Delta III GT9 from the data obtained from the period under study is 73% with a minimum value of 68% in the month of March and September, and a maximum value of 80% in July against the best industrial practice (between 40% to 80%). The values of the plant’s capacity factor signify that the average power generated is acceptable. The thermal efficiency of the plant for the period under study is shown in Figure 3.
Figure 3: Thermal efficiency of Delta III GT9
The thermal efficiency of a gas turbine is about 20% to 35%. From figure 4.3, the thermal efficiency of the plant for
each month is above the 20%, and the average efficiency is 28%. That is to say, the plant is quite efficient. The

GSJ: VOLUME 6, ISSUE 6, JUNE 2018 52
GSJ© 2018
www.globalscientificjournal.com
maximum thermal efficiency is 32% in the month of April and June, while the minimum thermal efficiency is 26% in
the month of January and November. The maximum efficiency corresponds to the minimum amount of fuel
consumed and the minimum efficiency corresponds to the maximum amount of fuel consumed. The plant fuel rate
under the period under study is presented in Figure 4.
Figure 4: Plant Fuel Rate
It can be seen that the best value of the plant fuel rate is for the month of June which only took 7.3% of the total plant fuel against the other months which fall between the ranges of 7.3% to 9.0%. The maximum value (9.0%) occurs in the month of January. The plant heat rate for the period under review is shown in Figure 5.
Figure 5: Plant Heat Rate

GSJ: VOLUME 6, ISSUE 6, JUNE 2018 53
GSJ© 2018
www.globalscientificjournal.com
The reliability of Delta III GT9 for the period under study is presented in Figure 6.
Figure 6: Reliability of Delta III GT9
The average reliability of the plant from the operational data obtained from for the period under study is 58%. The decreased in reliability of the plant in the month of March, June, July and November was as a result of major inspection (MI) that was carried out on the plant; also the plant was out of service for a period due to gas shortage. Generally, the behavior of the gas power plant depends majorly on the capacity factor. High capacity factor is desired for economic operation of the plant. Gas turbines are designed for standard air conditions. However, the operating periods at off-design conditions are much greater than that at design conditions. A difference between the actual power generated by a gas turbine and the design rated power tagged on the gas turbine is observed whenever a gas turbine operates at site ambient conditions that vary from the stipulated International Standard Organization (ISO). A detail study and extensive logging of operational data has shown the existence of a direct relationship between the ambient temperature and the de-rating of gas turbine power output. For every 1oC rise in ambient temperature above ISO condition, the gas turbine losses 1% in terms of thermally efficiency and 1.47 MW of its gross power output. The power output of gas turbine is a function of the inlet temperature of the turbine. The turbine inlet temperature plays a vital role on the performance of the single cycle plant. The gas turbine performance is affected by the component efficiencies and the turbine working temperature. The effect of temperature is very predominant; for every 56oC increase in temperature, the work output increases approximately 10% and gives about 1.5% increase in efficiency. The overall efficiency of the gas turbine cycle depends primarily upon the pressure ratio of the compressor. A summary of all the key performance parameters are shown in the Table 8.

GSJ: VOLUME 6, ISSUE 6, JUNE 2018 54
GSJ© 2018
www.globalscientificjournal.com
Table 8: Summary of the Values of the Key Performance Parameters Month Power Generated
(MW) Capacity Factor (%)
Plant Fuel Rate Plant Heat Rate Efficiency (%)
Kg/KWH % Total KJ/MWH % Total
Jan. 19 76 0.262 9.0 13,761,973 9.0 26 Feb. 18 72 0.256 8.8 13,498,100 8.8 27 March 17 68 0.253 8.6 13,286,909 8.7 27 April 19 76 0.217 7.4 11,392,655 7.4 32 May 18 72 0.239 8.2 12,566,088 8.2 29 June 18 72 0.215 7.3 11,315,615 7.4 32 July 20 80 0.236 8.1 12,392,834 8.1 29 August 19 76 0.237 8.1 12,463,830 8.1 29 Sept. 18 72 0.248 8.5 13,057,846 8.5 28 Oct. 17 68 0.247 8.5 12,989,730 8.5 28 Nov. 18 72 0.260 8.9 13,661,713 9.0 26 Dec. 18 72 0.243 8.3 12,773,834 8.3 28 Total 19 76 2.913 100 153,161,127 100
Conclusion
In this study, the performance of Delta III GT9 gas turbine power plant was evaluated and analyzed. Emphasis has been on the key performance parameters (such as power generated, capacity factor, plant fuel rate, plant heat rate and the thermal efficiency of the plant). The study shows that 92% of the expected capacity was available in the period. The thermal efficiencies of the plant in the period ranged from 26% to 32% as against the standard value of 20% to 35%. The plant’s capacity factor ranged from 68% to 80% against best industrial practice of 40% to 80%. The plant fuel rate ranged from 7.3% to 9.0%, and also the plant heat rate ranged from 7.4% to 9.0%. The average reliability of the plant for the period is 58%. Only 20 MW of energy (power) was lost out of the expected power of 240 MW for the period under study. The study revealed that the above performance parameters analyzed for Delta III GT9 plant are within the range of best industrial practice. Besides, the efficiencies achieved for the period under study are within the best international value for a single cycle gas turbine plant.
Recommendation
The performance and reliability of Delta III GT9 power plant can be greatly improved. The few ways in which the performance of the plant can be improved are as follow:
i. Increase the turbine inlet temperature, provided the turbine materials can withstand the high temperature or the parts can be replaced with those that can withstand the temperature. For every 56 oC increase in temperature, the work output increases approximately 10% and gives about 1.5% increase in efficiency.
ii. Install of a heat recovery steam generator (HRSG) to recover energy from the turbine’s exhaust. A heat recovery steam generator helps in generating steam by capturing the heat from the exhaust system. High pressure steam from the HRSG can be used to generate additional power with steam turbines, a configuration called combined cycle.
iii. Proper maintenance and cleaning of compressor inlet filters. Dirty and poorly maintained filters would cause monumental loss of efficiency due to damage and clogging of the compressor blades. Pressure drop is a consequence of dirty filters. Regular checkup and cleaning of the components can improve the performance and reliability of the plant.
iv. Planned maintenance such as Preventive, Running, Condition Monitoring should be carried out on the

GSJ: VOLUME 6, ISSUE 6, JUNE 2018 55
GSJ© 2018
www.globalscientificjournal.com
plant to keep it running smoothly and thus improve the reliability of the plant.
Acknowledgment
The author wishes to thank the staffs of Mechanical Engineering Department, Petroleum Training Institute, Effurun,
Nigeria.
References
[1] S.I. Ukwamba1, E.K. Orhorhoro, A.A. Omonoji, “Performance Evaluation of a Simple Gas Turbine Power Plant Using Vapour Absorption
Chiller”, IOSR Journal of Mechanical and Civil Engineering (IOSR-JMCE), 15(2), pp.13-18, 2018
[2] I. Al-Tobi, “Performance Enhancement of Gas Turbines by inlet Air Cooling”, International Conference on Communication, Computer and
Power (ICCCP'09) Muscat, 15(18), pp.165 – 170, 2009
[3] B. Firdaus, Y. Takanobu, N. Kimio, N. Soe “Effect of ambient temperature on the performance of micro gas turbine with cogeneration system
in cold region”,. Applied Thermal Engineering, 31, pp.1058– 1067, 2011
[4] EK. Orhorhoro, EN. Achimnole, MO. Onogbotsere1 and O. Oghoghorie, “Simulation of Gas Turbine Power Plant using High Pressure
Fogging Air Intake Cooling System”, European Journal of Advances in Engineering and Technology, 4(9):, pp.691-696, 2017
[5] AE. Nasser and MA. EL-Kalay, “A Heat-Recovery Cooling System to Conserve Energy in Gas – Turbine Power Stations in the Arabian Gulf”,
Applied Energy, 38 (2), pp.133-142, 1991
[6] YS. Kim, JJ. Lee, TS. Kim, and JL. Sohn, “Effects of Syngas Type on the Operation and Performance of a Gas Tur-bine in Integrated Gasification
Combined Cycle”, Energy Convers Manage, 52 (22), pp.62–71, 2011
[7] AG. Kaviri, MN. Jaafar, TM. Lazim, “Modeling and Multi-Objective Exergy Based Optimization of a Combined Cycle Power Plant Using a
Genetic Algorithm”, Energy conversion management, 58, pp.94-103, 2012
[8] T. Johnke and M. Mast, Gas Turbine Power Boosters to enhance power output. Siemens Power for generation, Siemens Power
[9] EK. Orhorhoro, and OW. Orhorhoro, ” Simulation of Air inlet Cooling system of a Gas Turbine Power Plant”, ELK Asia Pacific Journal of
Applied Thermal Engineering, 1(2), 2016
[10] FG. Mahmood and DD. Mahdi, “A New Approach for Enhancing performance of a gas turbine (case study: Khangiran Refinery)”, Applied
energy, 86, pp.2750-2759., 2009
[11] E. Kakaras, “Inlet Air cooling Methods for Gas Turbine Based Power Plant”, ASME, 128, pp. 312-317 , 2006
[12] B. Dawaud, “Thermodynamic Assessment of power requirement and impact of different Gas Turbine Air cooling technologies at two
locations in Oman”, Applied Thermal Engineering, 25, pp. 1579 – 1598, 2005
[13] W. Zhang, L. Chen, F. Sun, “Performance Optimization for an open cycle gas turbine power plant with a refrigeration cycle for compressor
inlet air cooling. Part 2: power and efficiency optimization”, Proceedings of the Institution of Mechanical Engineers, Part A. Journal of Power
and Energy, 223 (5), pp.515-522 , 2009
[14] JN. Lamfon, “Modeling and Simulation of Combined Gas Turbine Engine and heat Pipe System for Waste Heat Recovery and Utilization”,
Energy Convers, 39, pp. 81-86, 1998
[15] B. Mohanty, G. Paloso, “Enhancing gas turbine performance by intake air cooling using an absorption chiller”, Heat Recovery Systems and
CHP, 15, pp. 41-50 , 1995
[16] M. Ameri,, “The Study of Capacity Enhancement of The Chabahar Gas Turbine Installation Using an Absorption Chiller”, Applied thermal
Engineering, 24, pp. 59-


![Gas turbine-power-plant[1]](https://img.pdfslide.net/doc/110x75/55ad62501a28ab681b8b45db/gas-turbine-power-plant1.jpg)