Embed Size (px)
Citation preview

1
Performance assessment of low-cost environmental monitors and single sensors 1 under variable indoor air quality and thermal conditions 2
Ingrid Demanega 1,*, Igor Mujan 2,*, Brett C. Singer 3, Aleksandar S. Anđelković 2, Francesco Babich 1, 3 Dusan Licina 4,** 4
1 Institute for Renewable Energy, Eurac Research, Bolzano, Italy. 5 2 University of Novi Sad, Faculty of Technical Sciences, Novi Sad, Serbia 6 3 Indoor Environment Group and Residential Building Systems Group, Lawrence Berkeley National 7 Laboratory, Berkeley, USA 8 4 Human-Oriented Built Environment Lab, School of Architecture, Civil and Environmental Engineering, 9 École Polytechnique Fédérale de Lausanne, Lausanne, Switzerland 10
* These authors contributed equally to the paper 11
** Corresponding email: [email protected] 12
Abstract 13
Recent technological advancements have enabled the development and deployment of low-cost 14 consumer grade monitors for ubiquitous and time-resolved indoor air quality monitoring. With their 15 reliable performance, this technology could be instrumental in enhancing automatic controls and human 16 decision making. We conducted a comprehensive performance evaluation of eight consumer grade multi-17 parameter monitors and eight single-parameter sensors in detecting particulate matter, carbon dioxide, 18 total volatile organic compounds, dry-bulb air temperature, and relative humidity. In the controlled 19 chamber, we generated eight air pollution sources, each at two thermodynamic conditions — cool and 20 dry (20±1°C, 30±5%), and warm and humid (26±1°C, 70±5%). The majority of tested devices under-21 reported reference particle measurements by up to 50%, provided acceptable responses for carbon 22 dioxide within 15% and diverging results with poor quantitative agreement for total volatile organic 23 compounds. Despite the reported disparities in quantitative agreements, most of the low-cost devices 24 could detect source events and were strongly correlated with the reference data, suggesting that these 25 units could be suitable for measurement-based indoor air quality management. Most of the tested devices 26 have also proven to competently measure air temperature (within +/-0.6°C) and relative humidity (within 27 +/-5% RH) and maintained a stable measurement accuracy over the two thermodynamic conditions. 28
KEYWORDS 29
Indoor air quality monitoring, IoT sensing, Inhalation exposure, Source control, Thermal comfort 30
Highlights 31
● We evaluated 8 low-cost environmental monitors and 8 single sensors in 2 distinct seasons. 32 ● Most of the tested units can be used for measurement-based IAQ and comfort management. 33 ● Awair 2nd Edition scored highest overall accuracy in measuring multiple pollutants and 34
environmental parameters among the low-cost units. 35 ● Air pollution source type affects monitor accuracy while seasonal impact is not obvious. 36 ● Price of the low-cost monitors does not scale with their performance. 37

2
1. Introduction 38
Increasingly strict energy efficiency requirements for buildings have led to tightening of building 39 envelopes to reduce uncontrolled outdoor air infiltration. As a result, unless adequate ventilation is 40 provided, air pollutants emitted inside buildings could be present at higher concentrations due to less 41 dilution [1]. This has exacerbated concerns about health effects from indoor exposures to air pollutants. 42 Some indoor air pollutants can be recognized by their immediate impacts on our body, such as throat 43 irritation or watery eyes [2]. Others, which often bypass the human olfactory radar, are not necessarily 44 benign. According to the US Environmental Protection Agency, some health impacts like respiratory 45 diseases, heart disease, and cancer can show up years after exposure [3]. This highlights the importance 46 of proper indoor air quality (IAQ) management including monitoring of air pollutants. 47
According to ASHRAE Standard 62.1–2019 [4], acceptable indoor air quality has "air in which there are no 48 known contaminants at harmful concentrations, as determined by cognizant authorities, and with which 49 a substantial majority (80% or more) of the people exposed do not express dissatisfaction". Multiple field 50 studies, however, showed that buildings often do not meet even the minimum standard requirements 51 [5]. Even when average concentrations in a building meet requirements, air pollutants are often non-52 homogeneously distributed which may result in elevated exposures at some locations [6–8]. 53
The European Respiratory Society (ERS) has identified particulate matter (PM2.5 and PM10), volatile organic 54 compounds (VOCs) and carbon dioxide (CO2) as key air pollutants [9]. Most of these indoor pollutants 55 derive from indoor or outdoor anthropogenic sources [9] and their control can be achieved either by 56 limiting or eliminating the emitting source(s) or through adequate ventilation and filtration. To assure 57 adequate control, IAQ monitoring is an important aspect that can trigger the right chain of actions, via 58 real-time feedback to encourage human actions or through direct activation of automated control 59 devices. While there is no universal air pollutant metric established that benchmarks indoor air quality 60 [10], indoor CO2 concentrations have been used as an indicator of human bio-effluents in occupied 61 buildings and as a control metric for rooms equipped with demand-controlled ventilation [11]. However, 62 in buildings with low or no occupancy, or where other air pollutant sources which emit VOCs or particles 63 are problematic, ventilation control based on CO2 concentration only may not be sufficient [12]. This 64 highlights the importance of monitoring multiple relevant air pollutants. 65 66 Historically, indoor air quality monitoring has been performed by professionals with certified reference 67 instruments [13]. The high capital cost and large size makes such devices unsuitable for ubiquitous and 68 continuous IAQ monitoring in buildings [14]. Recently, technological advances in metal oxide 69 semiconductors (MOS) for the detection of gaseous compounds [15], light scattering for particles [16], 70 and non-dispersive infrared (NDIR) spectroscopy for the measurement of carbon dioxide [17] allowed the 71 development of low-cost sensors and consumer grade monitors. These monitors are typically designed 72 for the real-time monitoring of air temperature and relative humidity, along with several IAQ parameters, 73 commonly including PM2.5, PM10, CO2 and total VOCs (TVOCs) [18]. Some of the consumer grade monitors 74 include sensors for other gases, such as carbon monoxide, nitrogen dioxide, ozone, or other parameters 75 such as air pressure and sound level. The commonly available consumer grade monitors typically store 76 data on IoT servers, and the measurements can be visualized through the web or mobile applications. The 77 increased availability on the market of such consumer grade monitors and single low-cost sensors (devices 78

3
that measure individual IAQ parameters and send data to a logger) has drawn the attention of many 79 researchers. 80 81 To date, several studies examined the performance of low-cost sensors and monitors in detecting the PM 82 indoors [19–25] and outdoors[26–29]. Singer et al. [20] tested the performance of low-cost air quality 83 monitors in detecting fine particles from residential sources. They found a quantitative agreement within 84 a factor of two for most of the sources but very little response for particles with an optical diameter below 85 0.3 µm. These results were recently confirmed by Wang et al. [19]. Other studies found that the 86 performance of the integrated PM sensors into consumer grade monitors can be influenced by the air 87 temperature and relative humidity [30,31]. The accuracy of CO2 measurement with low-cost NDIR 88 sensors, frequently deployed within consumer grade monitors, was also found to be dependent on the 89 air temperature and relative humidity [32]. Beyond direct measurements, some devices estimate CO2 90 concentration from TVOC measurements, resulting in substantial errors [33]. The TVOC measurement 91 itself with metal oxide semiconductor or photoionization detector (PID) sensors is known to suffer from 92 cross-sensitivity to confounding compounds [34]. The VOCs comprise a large group of chemicals ranging 93 from harmless cooking odors to hazardous compounds such as aromatics (e.g. benzene, toluene, xylene), 94 and aldehydes (e.g. formaldehyde and acetaldehyde), which makes the detection and monitoring of VOCs 95 a challenge, along with exposure quantification. 96 97 Several studies examined sensor performance that in addition to air quality include other parameters of 98 indoor environment, such as thermal comfort [34–36]. Moreno-Rangel et al. [37] evaluated five “Foobot” 99 monitors in measuring residential air temperature, relative humidity, PM2.5, CO2, and TVOC; the study 100 found a sufficient accuracy for all sensors except for CO2 that was not recorded by a dedicated sensor but 101 derived through an algorithm from the TVOC data. Beyond this work, we know relatively little about 102 overall performance of consumer grade low-cost monitors and sensors. Additionally, the available 103 knowledge is limited when it comes to dynamic performance of these units under variable seasons and 104 associated thermodynamic conditions. 105 106 To bridge the knowledge gap, we evaluated the performance of various IAQ monitors and sensors under 107 a controlled range of indoor air pollution and thermal conditions. In an environmental chamber, we tested 108 the response of eight consumer grade multi-parameter monitors in measuring PM, CO2, and TVOC emitted 109 from eight common indoor sources. We also tested their response to the two main thermo-hygrometric 110 parameters, namely air temperature and relative humidity. To add value to the study, eight single-111 parameter low-cost sensors for air temperature, relative humidity, CO2, and PM were included in the 112 performance evaluation. Monitoring data from the tested units were compared with measurements from 113 research or professional-grade instruments. All the tests were performed at two distinct thermodynamic 114 conditions: warm & humid; cool & dry. 115
116
2. Methods 117
2.1. The chamber setup 118
Performance evaluation of low-cost consumer grade monitors and single-parameter sensors was 119 conducted in an environmental chamber with an interior volume of 63.3 m³ (Figure 1) located in Fribourg, 120 Switzerland. The chamber is equipped with a dedicated heating, ventilation, and air conditioning (HVAC) 121

4
system that enables control of air temperature, relative humidity, ventilation rate, and airflow 122 distribution. The conditioned air was supplied through a 2-stage media filter to eliminate nearly all 123 exogenous airborne particle contributions from outdoors to the chamber. The air was supplied through 124 six floor-mounted diffusers and exhausted via six diffusers on the ceiling. 125
The HVAC was turned off two minutes before the start of a pollutant generation and monitor testing, so 126 that the air exchange was provided solely by infiltration (mean air change rate during the experiments 127 was 0.34 h-1). Each experiment lasted for 1 hour with continuous data acquisition. Air pollutant generation 128 triggered the start of each experiment, which, depending on the source, lasted from 15 min to 1 hour 129 within the experiment time. After each 1-hour experiment, ventilation was turned on until air pollutant 130 concentrations dropped to the same level as before the generation. Research and consumer grade 131 monitors were placed on the table at the height of 75 cm above the ground. The monitors were positioned 132 nearly equidistant from the air pollutant source generation area (Figure 1). To ensure the maximum 133 uniformity of the air pollutant distribution, two pedestal mechanical fans were used, both pointing 134 towards chamber walls. To maintain the steady climatic conditions during the measurements, internal 135 heat sources were minimized. 136
137 Fig. 1. Plan and profile view of the environmental chamber, including the position of the air pollutant release, 138 consumer grade monitors and single sensors, research grade monitors, and professional grade monitors. 139
2.2. Test Activities 140
The performance of the consumer grade monitors and individual sensors was tested under two 141 thermodynamic conditions — warm and humid (26±1°C, 70±5%) and cool and dry (20±1°C, 30±5%). 142 Temperature and relative humidity values represent the values at the start of the experiments with 143 maximum deviations for each condition. The selected thermodynamic properties of the air are commonly 144 encountered indoors in many climates around the world. By applying this methodology, the performance 145 assessment was conducted at the two opposite ends of the standard thermal comfort zone [38,39]. 146 Recordings from the tested units were compared with measurement data from research and professional 147 grade monitors. 148
Eight common indoor air pollution sources were simulated inside the test chamber, each at the two 149 distinct indoor climate conditions (total of 16 experiments). Sources were chosen to cover a broad range 150 of particle sizes, from ultrafine (≤0.1µm) to coarse particles (<10 µm), and to cover the concentration 151 ranges of interest for TVOC and CO2. Common household activity such as frying was excluded as there is 152 sufficient data already existing in literature [19,20,22,40]. 153

5
The summary of air pollution sources and the highest 1-minute resolved air pollutant concentrations for 154 the given experimental conditions is reported in Table 1. 155 156
Table 1. Description of simulated activities and resulting air pollutant highest 1-min concentration reported by the 157 research and professional grade reference monitors.a 158
SOURCE CONDITION ACTIVITY DESCRIPTION PM1 PM2.5 PM10 TOTAL COUNTS CO2 TVOC
µg/m³ µg/m³ µg/m³ #/cm³ ppm ppb
CANDLE BURNING
Cool & Dry Six candles (scented and unscented mix) were lit by two matches and blown out after 1 hour 89 106 117 3.2 × 10⁴ 928 39
Warm & Humid
Eight candles (scented and unscented mix) were lit by two matches and blown out after 1 hour 110 114 122 7.8 × 10⁴ 998 151
MOSQUITO COIL BURNING
Cool & Dry Two mosquito coils were burned for 30 minutes inside the chamber and then removed. 2346 2384 2387 5.5 × 10⁵ 623 352
Warm & Humid
One mosquito coil was burned for 15 minutes inside the chamber and then removed. 512 515 517 1.5 × 10⁵ 499 113
WOOD LACQUER DRYING
Cool & Dry
A 0.45x0.45 m² wood board was extensively coated with oil-based wood lacquer and placed inside the chamber. The board was kept inside for the entire duration of the experiment (60 min).
4 6 10 3.1 × 10³ 532 10435
Warm & Humid
A 0.45x0.45 m² wood board was extensively coated with oil-based wood lacquer and placed inside the chamber. The board was removed after 15 minutes.
2 2 2 1.5 × 10³ 459 3781
ROOM DEODORANT INJECTION
Cool & Dry A conventional automatic room deodorant was used with a maximum scent setting. Deodorant sprayed at eight-minute intervals.
34 36 44 8.3 × 10³ 578 229 Warm & Humid 3 5 11 1.5 × 10³ 460 347
ESSENTIAL OIL HEATING
Cool & Dry Two cups with water and essential oil were heated by candles lit by matches.
10 10 10 1.4 × 10⁴ 559 237 Warm & Humid 30 31 31 4.7 × 10⁴ 551 388
CARPET VACUUMING
Cool & Dry Three carpets (1.2x0.5 m²) were placed inside the chamber. The carpets were vacuumed for 15 minutes.
6 49 727 1.4 × 10³ 1065 163 Warm & Humid 8 43 592 3.0 × 10³ 865 259
POPCORN COOKING
Cool & Dry 80 g of popcorn kernel and 20 g of sunflower oil were used to prepare popcorn over an electric stove.
291 413 643 1.5 × 10⁵ 930 83 Warm & Humid 127 244 450 5.6 × 10⁴ 631 296
CO2 INJECTION
Cool & Dry Chamber was sealed, and the CO2 was injected from a pure CO2 cylinder until it reached the desired concentration.
7 9 28 2.6 × 10³ 3784 89 Warm & Humid 4 5 15 2.8 × 10³ 3900 111
a Reported concentrations were obtained with the following research and professional grade instruments: Grimm 159 miniWRAS for particles, LI-COR 850 for CO2 and RH, and GrayWolf AdvancedSense Pro for TVOC, 1-minute resolved 160 data (see their description in the section 2.3). 161 162 163 2.3. Reference measurement equipment 164
For reference monitoring of time- and size- resolved particle levels we deployed a Grimm Model 1371, 165 Aerosol Technik (miniWRAS). The miniWRAS combines an optical light scattering sensor unit that counts 166 particles in 31 bins from 0.25 to 35 μm and an electrical mobility analyzer that resolves particles in 10 bins 167 from 10 to 193 nm. Measurements were taken at 1-minute intervals. The calibration of the miniWRAS 168 was verified using monodispersed 1.005 μm and 2.005 μm diameter polystyrene latex particles (PSL, 169 Thermal Scientific, 405 US), with error below 10%. The use of a particle counter to determine particle 170 mass concentrations requires the adoption of a particle density. It is known that depending on the 171 pollutant source, particle density could vary significantly [19]. However, during this study, no mass-based 172 measurement was performed and the particle mass concentration from miniWRAS was determined 173 assuming spherical particles having a density of 1.68 g/cm³ for all experiments. We also performed a 174 complementary set of analyses with adjusted source dependent densities to quantify the degree of bias 175 introduced owing to the constant density assumption. 176

6
The LI-COR 850 Biosciences gas analyzer (LI-COR) was used for the reference measurements of CO2 and 177 relative humidity. The LI-COR has a CO2 measurement range of 0-20'000 ppm and the manufacturer-178 specified accuracy within 1.5% of reading. The LI-COR directly measures water vapor in the air (accuracy 179 of 1.5%), which is used together with atmospheric pressure and dry bulb air temperature values to 180 compute the relative humidity. The calculated error of the instrument, including the atmospheric data is 181 ± 2%. The reference measurements for CO2 concentrations and relative humidity were taken at 10 second 182 intervals and averaged over 1 minute. The instrument response was confirmed through exposure to 183 calibration gases at 0 and 1'500 ppm. 184
For TVOC measurements, no true reference was considered owing to the current technological limitations 185 for measuring time-resolved TVOCs [41]. As an alternative, two professional grade TVOC monitors were 186 deployed: a) GrayWolf AdvancedSense Pro with an IQ-610 Indoor Air Quality Probe with a 10.6 eV lamp 187 (named here as GW) and a range of 0.02-20 ppm; and b) Aeroqual Photoionization Detector (PID, 188 abbreviated as AerPID) with a 10.6 eV lamp and a range of 0.01-20 ppm and a factory accuracy calibration 189 of < ±0.2 ppm + 10%. A lamp inside the PID sensor emits photons of UV light to ionize the targeted gases 190 that generate electrically charged ions. The ions are attracted by an electric field and result in an electrical 191 current proportional to the VOC concentration. Both GW and AerPID were calibrated by the manufacturer 192 against isobutene in synthetic air three months before the experiments. Also, a one-point calibration with 193 synthetic air was done for the GW TVOC sensor right before starting the experiments. The TVOC 194 concentrations were recorded with 10-second resolution for GW and 1-minute for the AerPID. The GW 195 data were averaged at 1-minute intervals. Apart from TVOCs, GW IQ-610 has sensors that detect CO, CO2, 196 relative humidity and dry bulb temperature. There sensors were not calibrated nor used in subsequent 197 analyses. 198
A thermal anemometer (Model 425, Testo) with an air velocity probe and a data logger (Model 435, Testo) 199 were used to acquire room dry bulb temperature. The hot wire anemometer uses an NTC thermistor with 200 a range of -20 to +70°C, and reported accuracy ±0.2°C. Air temperature measurements were taken at 1-201 second intervals and averaged over 1 minute. Before the experiments, the probe and the logger were 202 calibrated in the Testo official laboratory. Technical specifications of the reference equipment are 203 reported in Table S1. 204
2.4. Low-cost consumer grade monitors 205
Table 2 summarizes the model, type, and technical specifications of the seven consumer grade monitors 206 and one enterprise grade monitor tested in the experiments. Because the majority of relevant information 207 was not accessible directly from the manufacturer, the monitors had to be disassembled to retrieve sensor 208 information. The monitors were selected considering online available devices for the measurements of 209 indoor air quality, having a price between US$165 and US$329. An additional more expensive monitor 210 available for enterprises only (Clarity Node, US$1000) was included in the experiment. The increased price 211 can be attributed to the presence of a continuous network calibration model which other low-cost 212 monitors lack. Also, Clarity measures nitrogen dioxide levels which other monitors, except for uHoo, do 213 not. 214
215

7
Table 2. Technical specification of individual sensors embedded in the low-cost consumer grade monitors and the 216 associated price. 217
Monitor / reporting interval
Retail pricea Temperatu
re RH PM size PM concentration TVOC CO2
AirVisual Pro (AirVisual) - 10 sec - 5 min.
$269 Rangee 0 to 40°C 0 - 95% 0.3 - 2.5μm not specified - 400 – 10’000
ppm
Sensor Sensirion SHT30 AirVisualM25b - SenseAir S8 or LP8
Awair 2nd Editionb (Awair) - 10 sec.
$199 Rangee
-40 to 125°C ± 0.2°C
0 - 100% ±2% 0.3 - 2.5μm
0 – 1’000 μg/m3 ±15 μg/m3 or ±15%
0-60’000 ppb ±10%
400 – 5’000 ppm ± 75 ppm or 10%
Sensor Sensirion SHT30 Honeywell HPMA115S0-XXX Sensirion SGP30
Amphenol Telaire T6703-5K
Clarity Nodec (Clarity) - 2.5 min.
$1000 Rangee 15 – 45 °C;
±1°C 30 - 85%, ±5% 0.3 - 10 μm
0 – 1’000 μg/m3 ±10 μg/m3 or ±10%
- -
Sensor not specified
not specified Plantower PMS 6003 - -
Foobot (Foobot) - 5 min.
$199 Rangee 15 – 45°C
±1°C 30 - 85% ±5% 0.3 - 2.5μm 0 – 1’300 µg/m³
±20% Precision ±10%
estimated from TVOC
Sensor Sensirion SHT20 SHARP GPY1010AU0F iAQ-Core C iAQ-Core C Kaiterra Laser Egg + CO2 (Kaiterra) - 1 min.
$199
Rangee -20 – 100°C 0 – 99% 0.3 – 2.5μm 1-999 µg/m³ ±10% - 400 – 10’000
ppm
Sensor Sensirion SHT30 Plantower PMS 3003 - SenseAir S8 or LP8
uHood (uHoo) - 1 min.
$329 Rangee -40°C - 85°C
±0.5°C 0 – 100% ±3% 0.3 – 2.5μm
0 – 200 μg/m3 ±15 μg/m3 or ±10%
0-1’200 ppb ±10 ppb or ±5%
400 – 10’000 ppm ±50 ppm or ±3%
Sensor Bosch BME280 Shinyei ppd42 CSS811 ELT T110
Netatmo (inside unit) (Netatmo_i) - 5 min.
$165
Rangee 0°C - 50°C ±0.3°C
0 - 100% ±3% - - -
0 – 5’000 ppm ±50ppm ≤ 1’000ppm, ±5% > 1’000
Sensor Sensirion SHT20 - - - MH-Z14 NDIR CO2 Module
Netatmo (outside unit) (Netatmo_o) - 5 min.
Rangee -40 – 65°C ±0.3°C
0 – 100% ±3% - - - -
Sensor Sensirion SHT20 - - - -
aThe retail price was recorded in March of 2020. 218 bCurrently offered as Awair Element at lower price of $149 - August 2020. 219 cHas the ability to detect NO2: 0-1000 ppb, which was not tested. 220 dHas the ability to detect NO2: 0-1000 ppb, O3: 0-1000 ppb and CO: 0-1000 ppb which was not tested. 221 eMeasurement accuracy ranges were specified by the consumer grade monitor manufacturer. 222 223
2.5. Single low-cost sensors 224
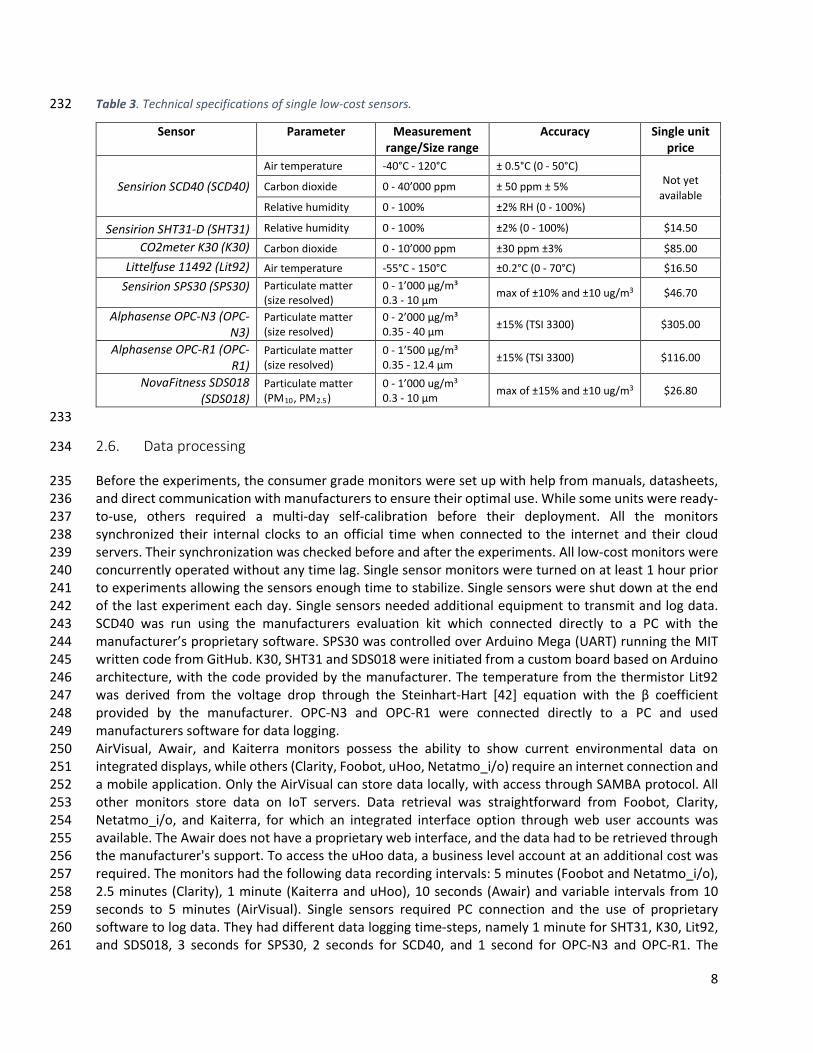
Measurements were additionally performed with eight single low-cost sensors that can capture levels of 225 particulate matter, carbon dioxide, air temperature, and relative humidity. The sensors were chosen 226 according to in-house availability, personal interest in specific technologies, and their widespread use in 227 consumer grade monitors. Also, sensors (except SHT31) were specifically chosen not to overlap with the 228 sensors already tested within the monitors. Table 3 summarizes the information about sensor type, 229 measurement range, particle size range, accuracy, and price. 230
231
8
Table 3. Technical specifications of single low-cost sensors. 232
Sensor Parameter Measurement range/Size range
Accuracy Single unit price
Sensirion SCD40 (SCD40) Air temperature -40°C - 120°C ± 0.5°C (0 - 50°C)
Not yet available
Carbon dioxide 0 - 40’000 ppm ± 50 ppm ± 5%
Relative humidity 0 - 100% ±2% RH (0 - 100%)
Sensirion SHT31-D (SHT31) Relative humidity 0 - 100% ±2% (0 - 100%) $14.50
CO2meter K30 (K30) Carbon dioxide 0 - 10’000 ppm ±30 ppm ±3% $85.00 Littelfuse 11492 (Lit92) Air temperature -55°C - 150°C ±0.2°C (0 - 70°C) $16.50
Sensirion SPS30 (SPS30) Particulate matter (size resolved)
0 - 1’000 μg/m³ 0.3 - 10 μm max of ±10% and ±10 ug/m3 $46.70
Alphasense OPC-N3 (OPC-N3)
Particulate matter (size resolved)
0 - 2’000 μg/m³ 0.35 - 40 μm ±15% (TSI 3300) $305.00
Alphasense OPC-R1 (OPC-R1)
Particulate matter (size resolved)
0 - 1’500 μg/m³ 0.35 - 12.4 μm ±15% (TSI 3300) $116.00
NovaFitness SDS018 (SDS018)
Particulate matter (PM10, PM2.5)
0 - 1’000 ug/m3
0.3 - 10 μm max of ±15% and ±10 ug/m3 $26.80
233
2.6. Data processing 234
Before the experiments, the consumer grade monitors were set up with help from manuals, datasheets, 235 and direct communication with manufacturers to ensure their optimal use. While some units were ready-236 to-use, others required a multi-day self-calibration before their deployment. All the monitors 237 synchronized their internal clocks to an official time when connected to the internet and their cloud 238 servers. Their synchronization was checked before and after the experiments. All low-cost monitors were 239 concurrently operated without any time lag. Single sensor monitors were turned on at least 1 hour prior 240 to experiments allowing the sensors enough time to stabilize. Single sensors were shut down at the end 241 of the last experiment each day. Single sensors needed additional equipment to transmit and log data. 242 SCD40 was run using the manufacturers evaluation kit which connected directly to a PC with the 243 manufacturer’s proprietary software. SPS30 was controlled over Arduino Mega (UART) running the MIT 244 written code from GitHub. K30, SHT31 and SDS018 were initiated from a custom board based on Arduino 245 architecture, with the code provided by the manufacturer. The temperature from the thermistor Lit92 246 was derived from the voltage drop through the Steinhart-Hart [42] equation with the β coefficient 247 provided by the manufacturer. OPC-N3 and OPC-R1 were connected directly to a PC and used 248 manufacturers software for data logging. 249 AirVisual, Awair, and Kaiterra monitors possess the ability to show current environmental data on 250 integrated displays, while others (Clarity, Foobot, uHoo, Netatmo_i/o) require an internet connection and 251 a mobile application. Only the AirVisual can store data locally, with access through SAMBA protocol. All 252 other monitors store data on IoT servers. Data retrieval was straightforward from Foobot, Clarity, 253 Netatmo_i/o, and Kaiterra, for which an integrated interface option through web user accounts was 254 available. The Awair does not have a proprietary web interface, and the data had to be retrieved through 255 the manufacturer's support. To access the uHoo data, a business level account at an additional cost was 256 required. The monitors had the following data recording intervals: 5 minutes (Foobot and Netatmo_i/o), 257 2.5 minutes (Clarity), 1 minute (Kaiterra and uHoo), 10 seconds (Awair) and variable intervals from 10 258 seconds to 5 minutes (AirVisual). Single sensors required PC connection and the use of proprietary 259 software to log data. They had different data logging time-steps, namely 1 minute for SHT31, K30, Lit92, 260 and SDS018, 3 seconds for SPS30, 2 seconds for SCD40, and 1 second for OPC-N3 and OPC-R1. The 261

9
processing and analyses of data were done with Python 3.7.0 [43,44]. Due to the different time resolutions 262 of the tested units, all data of sensors that sampled at frequency <1 minute were converted into average 263 1-minute values and this time resolution was used to generate all the line graphs for the pollutants. For 264 all the scatter plots and the processing of air temperature data, 5-minute averaged data were used, while 265 the relative humidity results were obtained with 15-minute averaged data. 266 267 2.7. Data analyses 268
The linear regression lines and the Pearson correlation coefficients (PCC) were computed using the NumPy 269 package of Python [45] and 5-min averaged data. To understand the quantitative response of the low-270 cost monitors and sensors relative to the reference instruments, the regression coefficients were 271 calculated with the NumPy polyfit() function which fits the dataset with a polynomial equation using the 272 least-squares method. The order of the equation was set to 1, and the function returned the slope 273 (regression coefficient, β) and the intercept of the regression line. To determine the PCC, the NumPy 274 corrcoef() function was used. A correlation coefficient close to 1 indicates a strong correlation, while a 275 unitary regression coefficient suggests a good accuracy of the measurement data. In practice, a good 276 correlation means that a tested device responds proportionally to concentration changes, while a good 277 accuracy indicates a quantitative agreement with a reference instrument. For IAQ measurements in this 278 study, the positive correlation was rated as very strong for PCC ≥ 0.8, strong for 0.6 ≤ PCC < 0.8, moderate 279 for 0.4 ≤ PCC < 0.6, weak for 0.2 ≤ PCC < 0.4 and very weak for 0 < PCC < 0.2 [46]. Concerning the thermo-280 hygrometric parameters, the measurement was considered acceptable if the mean absolute error (MAE) 281 compared to the reference was less than 0.5°C for air temperature and less than 5% RH for relative 282 humidity [38]. For the IAQ parameters, namely PM, CO2, and TVOC, no acceptance range was considered. 283 The performance of the tested devices in terms of quantitative agreement with the reference data was 284 additionally assessed through the comparison of the mean relative error (MRE) across devices. 285
286
3. Results 287
All results for the IAQ parameters PM, CO2, and TVOC are first reported for the warm and humid 288 conditions. Insights about the seasonal performance comparison are presented in the subsection 3.4. 289
3.1. Particulate matter 290
The 16 experimental runs summarized in Table 1 generated a broad range of pollutants, including 291 particulate matter of different sizes, as outlined in Figure 2. Combustion of candles and mosquito coils 292 generated a substantial number of fine and ultrafine particles with the diameter mode at 0.2 μm. Popcorn 293 cooking created the most widespread particle size distribution with the most considerable fraction of 294 emitted mass centered at 3.0 μm. Vacuuming produced the highest particle mass concentration with the 295 diameter mode at 13.1 μm. Room deodorant, candles, mosquito coil, and popcorn all contributed to the 296 generation of fine particles with widely varied fine particle emissions. Room deodorant generated the 297 lowest particle concentration with a peak PM2.5 of 4 μg/m³, while mosquito coil burning resulted in the 298 highest PM2.5 concentration of 515 μg/m³. As shown in Figure 2, most of the consumer grade monitors 299 responded to particle concentration changes with a strong correlation to the miniWRAS data. For each 300 monitor, quantitative agreement varied across the sources. 301

10
302
Fig. 2. Mass distribution over size, scatter plot and linear regression line for PM2.5 mass concentration – warm and 303 humid conditions. 5-min resolved data. PCC = Pearson’s correlation coefficient. Equation of the regression line (with 304 intercept and slope) is reported for each experiment and device. The green, yellow and red colors of the PM mass 305 distribution over the particle size correspond to the following particle size ranges (in μm): 10–2.5, 2.5–1, <1. 306
Figure 3 shows the dynamic variation of PM2.5 between the miniWRAS and the consumer grade monitors 307 and single sensors for candle burning, mosquito coil burning, and popcorn cooking. The peak particle 308 concentration for candle burning encompasses the effect of lighting the match at the beginning and 309

11
extinguishing the candles at the end of the experiment, as each instantly elevated the particle 310 concentration. The results show that the majority of consumer grade monitors under-reported PM2.5 311 (relative to the reference monitor) in case of sources dominated by fine particles. For the candle burning 312 activity, Clarity and Kaiterra were the closest to the reference concentration. They under-reported the 313 reference on average by 52% and 53% respectively, followed by Foobot with 57%, and AirVisual and Awair 314 with 67% and 73%, respectively. The uHoo showed by far the worst results with an MRE of 90% and PCC 315 of -0.30. For mosquito coil burning that produced the PM2.5 concentrations up to 492 μg/m³, we observed 316 that all monitors exhibited very strong correlation to the miniWRAS data (PCC > 0.9) and different 317 quantitative response: Kaiterra was the closest to the reference with an MRE of 11%, followed by Clarity 318 (MRE = 12%), AirVisual (MRE = 31%), Awair (MRE = 37%) and Foobot (MRE = 44%). Even in this scenario, 319 the uHoo monitor did not detect the majority of generated particles and under-reported particle 320 concentration on average by 90%, meaning it cannot be used for reliable measurements of fine particulate 321 matter. In the case of popcorn cooking, the consumer grade monitors were strongly correlated (PCC > 322 0.97) with MRE within 70% for all monitors. Foobot performed the best with the MRE of 19% compared 323 to the reference. Interestingly, in the case of popcorn cooking, uHoo performed much better than during 324 other activities and showed similar results as the rest of consumer grade monitors, suggesting a lower 325 sensitivity of the Bosch PM sensor to sub-micron particles. 326
Among the single sensors tested, the two Alphasense sensors, OPC-N3 and OPC-R1, showed very strong 327 correlations for PM2.5 concentrations (PCC > 0.90) for all the particle sources except for candle burning 328 and room deodorant. Depending on the pollutant source, different quantitative agreements between the 329 OPC-N3 and the miniWRAS were found: MRE of 43% for popcorn cooking, 88% for candle and 89% for 330 mosquito coil burning. The OPC-R1 also under-reported the reference values during mosquito coil burning 331 by 77% (β = 0.30), while it over-reported the reference by 20% in case of popcorn cooking (β = 1.18). The 332 SPS30 was also very strongly correlated with miniWRAS for PM2.5 concentrations reporting PCC above 333 0.80 for all particle sources. The SPS30 under-reported fine particle concentration by 24% during mosquito 334 coil burning, by 71% during popcorn cooking and by 73% during candle burning. The SDS018 sensor 335 responded to concentration changes, although with a delay in time of around 5-10 minutes, resulting in 336 significantly lower correlation coefficients (PCC = 0.09 - 0.65) depending on the source type. 337
338
Fig. 3. Particle mass concentration PM2.5 for candle burning (left) mosquito coil burning (center), popcorn cooking 339 (right) in warm and humid conditions, 1-minute resolved data. 340

12
Most of the tested consumer grade monitors do not report particle concentrations in size range larger 341 than 2.5 μm. Clarity is the only monitor that has this ability. As shown in Figure 4, coarse particulate matter 342 generated from the vacuuming activities peaked at 592 μg/m³. The Clarity monitor showed little to no 343 response to PM10 variation (MRE = 93%, PCC = 0.42). For popcorn, the PM10 concentration peaked at 450 344 μg/m³ and the Clarity monitor under-reported PM10 on average by 63% with strong correlation (PCC = 345 0.78), thus exhibiting better performance compared to the vacuuming test. 346
The single low-cost sensors OPC-N3 and OPC-R1 were very strongly correlated with reference miniWRAS 347 concentration (PCC > 0.90) for PM10. The OPC-N3 exhibited closer quantitative response (MRE = 31% for 348 popcorn cooking and 38% for vacuuming), while OPC-R1 over-reported the reference values resulting in 349 an MRE of 115% in case of popcorn cooking and 212% for vacuuming. Similar to Clarity, SPS30 and SDS018 350 sensors under-reported the PM10 concentration in case of vacuuming activity by 89% and 84%, 351 respectively. Even the correlation with the reference data was weak (PCC < 0.30). A significantly better 352 relationship was found for the SPS30 sensor during popcorn cooking (PCC = 0.92), although the sensor 353 was still under-reporting the concentration by 75% on average. The SDS018, indeed, showed a much 354 better quantitative agreement (MRE = 43%) but no positive correlation (PCC = -0.10) because of the time 355 delay. 356
357
Fig. 4. PM10 mass concentration during carpet vacuuming (left) and popcorn cooking (right) in warm and humid 358 conditions, 1-minute resolved data. 359
3.2. Carbon dioxide (CO2) 360
Figure 5 represents the results of the performance assessment of low-cost CO2 monitors and single-361 parameter sensors relative to the reference monitor. The performance of the tested units was good with 362

13
PCC > 0.80 and β in the range of 0.61 - 1.12 except for the Foobot monitor. All the consumer grade 363 monitors except uHoo reported peak values under the reference. Considering the whole duration of the 364 experiment, the Kaiterra under-reported the reference CO2 concentration with an MRE of 3%, the Awair 365 of 8%, the AirVisual of 11%, the Netatmo_i of 24% and the uHoo of 48%. The peak concentration recorded 366 by Netatmo_i had a delayed response relative to all other monitors. Thus, the PCC for Netatmo_i was 367 ~0.80, while all other monitors' PCC exceeded 0.97. The Foobot showed by far the worst results with no 368 positive correlation (PCC = -0.36) and MRE = 122%, meaning that it cannot reliably be used to monitor 369 CO2 concentrations. 370
The tested single sensors, namely SCD40 and K30, were very strongly correlated (PCC = 0.99 for both) with 371 the LI-COR data. The SCD40 was the most accurate as its reported peak concentration deviated from the 372 reference just by 3%, and the MRE was 6%, while the K30 under-reported the CO2 concentration by 12% 373 on average and showed a short time delay. The CO2 increase was also observed for candle burning and 374 essential oil heating activities, although not significant enough to merit further analysis when compared 375 to CO2 injection. 376
377 Fig. 5. CO2 scatter plots with linear regression lines (top, 5 min-resolved data) and concentration in time (bottom, 378 1-min resolved data) for warm and humid conditions. 379
380
3.3. Total volatile organic compounds (TVOC) 381
Figure 6 shows that the professional grade monitors (GW and AerPID) were very closely correlated in their 382 response to each major source. The quantitative response varied up to two times depending on the 383 source, despite being calibrated with the same chemical. GW showed the highest response during oil 384 wood lacquer drying at 3'781 ppb. All the other activities produced lower TVOC concentrations in the 385 range from 5 to 530 ppb. Generally, all consumer monitors showed good dynamic responses to different 386 source activities. Despite the absence of true reference values, the low-cost monitors responded to the 387 sources with similar time-response as PIDs. A comparison between consumer grade monitors and 388 professional grade monitors reveals that all consumer grade monitors under-reported the TVOC peak 389 levels generated from wood lacquer drying. This may be due to oversaturation of the sensors since the 390 TVOC concentrations exceeded 4 ppm. During the injection of room deodorant, the Foobot over-reported 391

14
the TVOC concentration measured by AerPID by 99% and GW by about 164%, while the Awair over-392 reported AerPID values by 54% and GW by 99%. The uHoo reported the lowest concentrations, with an 393 MRE of 62% compared to AerPID and 47% compared to GW. While heating the essential oil, the Foobot 394 over-reported the TVOC concentration by 215% compared to AerPID and 106% compared to GW. The 395 Awair mostly reported close to GW (MRE = 17%) and the uHoo close to AerPID (MRE = 27%). In all, despite 396 the relatively high disparity in recorded TVOC levels, all the units had a reliable dynamic response to TVOC 397 concentration changes. 398
399
Fig. 6. TVOC concentration in time for different pollutant sources in warm and humid conditions, 1-minute resolved 400 data. 401
402
3.4. Comparison of IAQ sensor performance in different thermodynamic conditions 403
To evaluate the performance of consumer grade monitors in different climatic conditions, the MRE to 404 reference was calculated and compared. As presented in Table 4, Awair proved to be the most stable 405 monitor overall while having sensors in all of the categories. An equally high performance for PM and CO2 406 was shown by Kaiterra which did not measure TVOCs. AirVisual and uHoo showed 20% higher MRE in cool 407 and dry conditions for PM measurements while the opposite can be said for Foobot. When measuring 408 CO2, the most deviation was shown by Foobot with more than 80% of a difference and with significant 409 error in both conditions. uHoo had an offset at 17% with better performance in cool and dry conditions. 410 Overall, it can be observed that similar magnitudes of MRE compared to reference were observed for the 411 tested monitors during the different seasons. This finding is supported by a one-year long evaluation of 3 412 consumer grade monitors which determined minimal measurement dependence on temperature and 413 relative humidity and minimal drift [47]. Even so, it needs to be stated that the majority of monitors were 414 slightly closer to reference in cool and dry conditions for PM2.5 and CO2 and in warm and humid conditions 415 in case of TVOC. 416
417

15
Table 4. Overview of mean relative error (MRE) of consumer grade monitors in different seasons and associated 418 thermodynamic conditions. 419
PM2.5 CO2 TVOC Monitor Cool&Dry Warm&Humid Cool&Dry Warm&Humid Cool&Dry Warm&Humid AirVisual 78% 55% 9% 11% Awair 50% 55% 7% 8% 43% 84% Clarity 50% 57% - - Foobot 91% 128% 38% 122% 153% 146% Kaiterra 43% 56% 5% 3% Netatmo_i - - 15% 24% uHoo 97% 70% 31% 48% 60% 57%
420
3.5. Relative humidity (RH) 421
The relative humidity variations inside the chamber during both simulated seasons are shown in Figure 7. 422 The LI-COR reported relative humidity values from 24% to 30% RH (mean = 26% RH) for cool and dry and 423 51% to 73% RH (mean = 64% RH) for warm and humid conditions. The tested devices followed the 424 reference values well and responded to changes in the relative humidity. The majority of tested consumer 425 grade monitors and single sensors were very strongly correlated with reference data (PCC > 0.8), except 426 for Netatmo_i (PCC = 0.73) in cool and dry conditions. Despite the good correlation for the majority of 427 devices, different quantitative responses could be observed. Some of the monitors, namely Awair, 428 Kaiterra, Netatmo_o, and uHoo reported acceptable values with MAE below 5% RH in both seasons. 429 Others, such as AirVisual, Foobot and Netatmo_i, reported relative humidity with an MAE compared to 430 the reference between 5.5 and 8.3% RH, in both seasons. The response of the Clarity monitor was 431 acceptable in cool and dry conditions (MAE = 4.3% RH) while it was outside the acceptance range by 432 under-reporting the reference by 12.5% on average in warm and humid conditions. 433
434
435
Fig. 7. Dynamic variation of relative humidity in cool and dry conditions (left) and warm and humid conditions 436 (right), 15-minute resolved data. 437

16
When it comes to the single-parameter sensors, the SHT31 sensor reported very close to the reference in 438 cool and dry conditions (MAE = 1.1% RH), while it exhibited higher errors during warm and humid 439 conditions (MAE = 7.4% RH). The SCD40 performed well in both seasons and resulted in an MAE of 0.3% 440 RH in cool and dry and 1.4% RH warm and humid conditions. In summary, the majority of tested units 441 overestimated the reference RH in cool and dry conditions and underestimated the reference in warm 442 and humid conditions. The MAE comparison for two thermodynamic conditions indicates that half of the 443 tested devices reported with higher accuracy in cool and dry conditions, while the other half was closer 444 to the reference in warm and humid conditions. 445
446
3.6. Air temperature 447
The results of air temperature variations captured by different monitors and single-parameter sensors 448 during the two thermodynamic conditions are reported in Figure 8. The air temperature during cool and 449 dry conditions varied from 19.7°C to 22.2°C (mean = 20.7 °C), and 25.8°C to 27.7°C (mean = 27.1°C) during 450 warm and humid conditions according to the reference Testo thermometer. The majority of tested 451 devices exhibited strong to very strong correlation with the reference temperature data (PCC > 0.6). 452 Moderate correlation resulted from Foobot in warm and humid conditions (PCC = 0.55), while the 453 AirVisual and the Netatmo_o exhibited weak correlation in cool and dry conditions (PCC = 0.37 and 0.35, 454 respectively). A very weak correlation emerged from the Clarity monitor in cool and dry conditions. Many 455 of the tested consumer grade monitors showed an acceptable quantitative agreement compared to the 456 reference: Awair, Foobot, and uHoo deviated from the reference by less than 0.5°C on average in both 457 seasons and thus complied with ISO 7726 [48]. Kaiterra had a MAE of 0.2°C in warm and humid conditions 458 and reached a MAE of 0.6°C in cool and dry conditions. AirVisual, Netatmo_i and Netatmo_o had MAE 459 around 0.5°C in cool and dry conditions. In the remaining conditions, the MAE of AirVisiual and 460 Netatmo_i/o were still below 0.9°C from the reference. The Clarity reported significantly higher errors, 461 ranging from as much as 2.5°C to 4°C during both thermodynamic conditions with an MAE of 3.6°C in cool 462 and dry and 3.0°C in warm and humid conditions. 463
The single-parameter sensors performed differently — SCD40 under-reported mean air temperature 464 difference to the reference of 1.0°C in cool and dry and 1.3°C in warm and humid conditions, while the 465 Lit92 sensor overestimated the air temperature on average by 1.4°C in cool and dry and 1.6°C in warm 466 and humid conditions. Out of 10 tested devices, 5 had lower MAE in cool and dry conditions and the 467 remaining in warm and humid conditions. 468

17
469
470
Fig. 8. Comparison of air temperatures during one day of the experiment in cool and dry conditions (left) and warm 471 and humid conditions (right), 5-minute resolved data. 472
4. Discussion 473
The results acquired in the test activities reaffirm the fact that optical light scattering technology used in 474 low-cost PM sensors cannot cover the whole particle size spectrum commonly emitted from indoor 475 sources. Singer et al. [21] evaluated 2 research grade and 7 consumer grade monitors and concluded that 476 consumer grade monitors have semi-quantitative responses (50 - 200%) to the majority of tested 477 pollutants and all of the devices had little or no response to events in which generated particles had the 478 optical threshold of 0.3 μm. This was confirmed in the study of Wang et al. [20] which reported the limit 479 of particle detection at around 0.25 μm. According to specifications, the majority of consumer grade 480 monitors are supposed to register particles with optical diameter between 0.3 µm and 2.5 µm. Depending 481 on the pollutant source and associated particle size distribution, a closer agreement with the reference 482 was found in case of optical particle diameter ranging from 1 μm to 2.5 μm where the majority of tested 483 devices reported around 50% of reference concentration at the worst. The agreement diminished when 484 the sources were dominated by submicron particles (< 1 μm) and during activities that generate coarse 485 particles (e.g. vacuuming). Studies [20, 21] also report that optical monitors (consumer, professional and 486 research grade) may be under-reporting the mass concentration of larger particles generated from 487 vacuuming if they have higher density. However, owing to the polydisperse nature of particle sources 488 indoors, the response of most of the sensors was time correlated. Strong correlation with reference data 489 was found also by Li et al. [24] for the tested consumer grade monitors. This means that the devices are 490 dynamically keeping track of concentration changes and can be used to detect an event despite poor 491 quantitative agreement. Analyzed data suggests no consistent bias for PM2.5 sensors. End-users should be 492 made aware that the PM data from the current low-cost sensors needs to be understood as an indication 493 of a state change or a rough estimation rather than actual concentration in indoor environments. 494
According to their specifications, Clarity and single sensors SPS30, OPC-R1 and OPC-N3 have the ability to 495 detect PM10. Our results showed that Clarity's sensor Plantower PMS 6003 and SPS30 are in the sub $50 496

18
category and that they can barely detect any PM10 concentration changes. Kaittera uses the Plantower 497 3003 which has the ability to detect PM10 but the manufacturer chooses not to relate that data to the 498 end-user. OPC-R1 with the double, and the OPC-N3 six-time higher price both correlate well to the 499 reference, with OPC-R1 still in the price range to be considered for a low-cost consumer grade monitor 500 integration. At their current state, Clarity and SPS30 cannot be used for determining PM10 concentrations. 501 Improvements in the algorithms used to determine PM mass concentrations from optical particle counting 502 are needed to improve measurement accuracy for coarse-mode particles. 503
An additional analysis was carried out to evaluate the effect of adopting different source dependent 504 particle densities for the reference miniWRAS. To calculate the mass concentration of particles, the 505 default densities of 1.68 g/cm³ for miniWRAS was adjusted with experimental values from literature for 506 each pollutant source. For the majority of tested devices, the PM2.5 concentration was closer to the 507 reference data with adjusted density in case of candle burning, popcorn cooking and mosquito coil 508 burning, regardless from the season, as reported in Table S3. 509
The consumer grade monitors and sensors evaluated in the experiments include non-dispersive infrared 510 (NDIR) technology to detect CO2 concentrations in the indoor environment except the Foobot. Despite 511 the same price range, the Foobot has no dedicated sensor and estimates the CO2 concentration from the 512 TVOC data with the use of an algorithm. As a result, all the sensors except Foobot were very strongly 513 correlated with the reference (PCC > 0.8). Foobot's very poor performance is a direct consequence of 514 manufacturers design choice and suggests that currently there is no alternative to a dedicated CO2 sensor. 515 The uHoo had a consistent offset from the reference which is indicative of a systematic instrument error. 516 The manufacturer could possibly correct this error with the use of better calibration procedures and 517 algorithms in future software updates. Despite the very strong correlation, Netatmo_i had a poor dynamic 518 response as it took ~15 minutes in both conditions to approach the reference, thereby not capturing the 519 peak CO2 event, which is not acceptable. Unlike other tested sensors, the CO2 sensor inside Netatmo_i 520 was introduced to the market over seven years ago. The results from newer devices suggest that the low-521 cost sensing technology has matured and is becoming more accurate and reliable. It is important to note 522 that all of the tested CO2 sensors, except Awair, include automatic baseline correction (ABC). At initial 523 device startup, ABC can take from a week up to two weeks which makes the whole procedure 524 cumbersome. Further, devices go into ABC mode once a week. This could result in erroneous readings in 525 environments that do not periodically reach global background outdoor CO2 levels, particularly in 526 buildings that are occupied continuously or have low enough ventilation and short periods without 527 occupancy. The data output on CO2 concentrations from the majority of the tested modern low-cost 528 sensors can be used with confidence in decision making if the ABC requirements are met. 529
TVOCs are composed of a multitude of volatile organic compounds, and each pollutant source is 530 generating different kinds of VOCs. A comprehensive study showed that TVOC sensors have different 531 sensitivity to various VOC sources, depending on their working principle [41]. This was shown to be most 532 evident for PID sensors, which can be expected to produce agreeable results to laboratory air sampling 533 only when measuring specific groups of compounds which they are calibrated for. This explains different 534 responses of the monitors and poor seasonal replication in different experiments. Consumer grade 535 monitors managed to capture TVOC concentration changes in time and could be adopted to detect events. 536 Similar to PM sensors, end-users should be made aware of the inaccuracies of absolute values. 537
In all tested monitors and single sensors, relative humidity and air temperature were measured by a single 538 sensor. This sensor integrates two components, a capacitive relative humidity sensor and the band gap 539 air temperature sensor. Interestingly, the majority of the units use the Sensirion SHT sensors from series 540 2 (Foobot, Netatmo_i, Netatmo_o) and 3 (AirVisual, Kaiterra, Awair), which suggests a trend on the 541

19
market. However, the best performance was shown by uHoo and its Bosch BME 280 sensor practically 542 being true to the reference. There is no logical clustering of measurements with regards to the SHT sensor 543 series. This indicates that consumer grade monitor manufacturers use different procedures for sensor 544 calibration and use custom signal conversion algorithms. Additional reasoning for the result disparities 545 may be caused by variable algorithms employed to compensate for internal heat gains inside the custom-546 built monitor shells that affect final readings and justify the result disparities. The air temperature was 547 reported accurately by most of the tested devices, with 3 out of 8 consumer grade monitors being within 548 +/-0.5°C from the reference air temperature in both seasons and all the monitors being within +/-0.6°C 549 from the reference regardless of the season, except for Clarity in both climatic conditions and for AirVisual 550 in warm and humid conditions. These results confirm the suitability of consumer grade monitors, apart 551 from Clarity, to monitor the air temperature inside buildings. The AirVisual and Kaiterra represent the 552 monitors with color displays with a higher heat output as shown in Figure 9. Our results suggest that the 553 air temperature measurements were well compensated for the local heat production, except for Clarity. 554 On the other hand, the Lit92 sensor was installed on a housing that accommodated multiple single sensors 555 and was in proximity of a microcontroller with a power converter. The heat output from the 556 microcontroller likely interfered with the air temperature field which led to overestimated temperature 557 values. 558
559
560 Fig. 9. Experimental setup taken with regular camera (left) and thermal imaging camera (right), (1 - Lit92, 2- 561 AirVisual, 3 - Netatmo_o, 4 - Netatmo_i, 5 - uHoo, 6 - Foobot, 7 - Kaiterra, 8 - Awair, 9 – Clarity, 10 – SCD40). 562
To better summarize the performance of consumer grade monitors in both thermodynamic conditions, 563 we developed an overall performance grading. First, the performance of the monitors was averaged 564 across all 16 experimental conditions. Then, according to the classification for MRE (PM2.5, PM10, CO2 and 565 TVOC) or MAE (relative humidity and temperature) and PCC, each monitor was given a grade from 1 to 5. 566 This was done by dividing the range between the minimum and maximum MRE or MAE for each 567 parameter into 5 categories where the grade 1 was assigned to the worst and 5 to the best category. The 568 score was averaged across two test thermodynamic conditions. For the PCC, the 5 categories were based 569 on the rating introduced in chapter 2.7. Table 5 shows the summarized performance for each monitor. 570 The MRE, MAE and PCC data used for the monitor ranking are given in the supplement Table S2. 571
572

20
Table 5. Overall performance grading of consumer grade monitors 573
Rating for MRE or MAEa Rating for PCCb Monitor PM2.5 PM10 CO2 TVOC RH T Average PM2.5 PM10 CO2 TVOC RH T Average
AirVisual 4 - 5 - 2 4 3.8 5 - 5 - 5 3 4.5 Awair 5 - 5 5 4 5 4.8 5 - 5 5 5 5 5.0 Clarity 5 5 - - 1 1 3.0 5 4 - - 5 2 4.0 Foobot 1 - 1 1 1 5 1.8 5 - 1 5 5 3 3.8 Kaiterra 5 - 5 - 4 5 4.8 4 - 5 - 5 4 4.5 Netatmo_o - - - - 4 5 4.5 - - - - 5 3 4.0 Netatmo_i - - 4 - 2 4 3.3 - - 5 - 5 4 4.7 uHoo 3 - 3 5 5 5 4.2 4 - 5 5 5 5 4.8
aThe rating for the MRE or MAE is calculated in relation to the other monitors' performance 574 bThe rating for the PCC is calculated with the same scale for all parameters as described in section 2.7 [46] 575
Among the tested consumer grade devices, Awair scored the highest in our rating scale for monitoring 576 pollutants, air temperature, and relative humidity; and it also scored highly for measuring TVOC 577 concentrations, unlike many other monitors. The Kaiterra monitor scored just a bit lower but lacks the 578 ability to report more than one gaseous pollutant (in this case TVOC). A slightly lower performance was 579 shown by the uHoo and AirVisual monitors, followed by Netatmo_i, but the latter monitor lacked the 580 ability to report PM and TVOC. The Clarity came in second to last despite not monitoring CO2 and TVOC. 581 However, these results need to be considered carefully. We determined that the device was connected 582 to the proprietary device hub used for calibration, but when data log was analyzed, we discerned that no 583 calibration from the network to the device was received which could account for the erroneous 584 measurements. Foobot showed the worst overall performance, especially in the IAQ category, and the 585 Netatmo_o exhibited a good overall performance for relative humidity and temperature but is not 586 monitoring any of the pollutants. Contrary to the expectation, monitors on the lower price spectrum had 587 the best performance in the tested categories. End-users should not regard the price of the low-cost 588 monitors as an indicator of their performance. 589
Seasonal comparison did not show a clear influence of indoor thermodynamic conditions on the accuracy 590 and stability of the measurements. Each device displayed comparable performance in both conditions. 591 The main differences could be observed between devices, when measuring individual parameters 592 regardless of the condition. 593
While interpreting the reported results, several limitations must be acknowledged. Only a single new 594 device of each model was tested and their durability and consistency over time was not considered. The 595 study did not evaluate the impact of automatic baseline correction on CO2 sensor performance and did 596 not consider the effect of intermittent high to very low ambient RH changes. Further, the performance 597 assessment did not consider the quality and richness of the real-time data reporting interface, nor the 598 accessibility and availability of the measured data. For PM measurements, miniWRAS was not adjusted 599 with the true size of particles with gravimetric measurements, and the default density of 1.68 g/cm³ was 600 used. There was no true reference for the TVOC measurement. Professional grade monitors were simply 601 used to determine the responsiveness of the low-cost units to VOC alterations. Lastly, the exact replication 602 of the experiments in both hygro-thermal conditions was not feasible. Nonetheless, our primary intention 603 was to provide a wide and relatively similar air pollutant concentration range per season, without 604 attention in matching the two conditions. 605
606

21
5. Conclusions 607
This paper presents a comprehensive performance evaluation of low-cost consumer grade monitors and 608 single-parameter sensors in detecting five indoor environmental parameters – particulate matter, carbon 609 dioxide, total volatile organic compounds, dry-bulb air temperature and relative humidity. Eight 610 experiments were chosen to simulate indoor air pollutant sources that were carried out at two distinct 611 climatic conditions – cool & dry, and warm & humid. 612
For PM measurements, despite MRE exceeding 100% for some devices, the dynamic responses were time-613 correlated for the majority of tested devices — meaning that the low-cost units could be used to detect 614 concentration changes of particulate matter spanning from 0.3 to 2.5 μm. On average, the best 615 performing monitor deviated from the reference by a factor of two. Among the single sensors, OPC-R1 616 provided the best results for PM2.5, while the OPC-N3 proved to be the best for PM10 monitoring. The 617 majority of the tested units performed well in detecting CO2 concentrations up to 3'500 ppm resulting in 618 errors within 25% from the reference, with the best monitors performing within 3% from the reference. 619 Foobot and uHoo monitors failed to accurately report the CO2 concentration, with the mean relative error 620 exceeding 30%. Low cost TVOC monitors Awair, Foobot and uHoo showed a strong correlation with the 621 professional grade monitors despite a poor quantitative agreement. For relative humidity, the majority of 622 tested devices gave time-correlated and acceptable results within 5% difference from the reference with 623 the tendency to over-report relative humidity in cool and dry conditions and under-report it in warm and 624 humid conditions. The uHoo, SCD40 and SHT31 showed the best performance with less than 0.6% RH 625 difference, while the Clarity was the worst in class resulting in a 12% difference from reference. The air 626 temperature was reported within +/-0.5°C from the reference temperature in both seasons by 3 out of 8 627 consumer grade monitors and within +/-0.6°C by the majority of tested devices. Seasonal comparison 628 revealed that the majority of consumer grade monitors displayed comparable performance in both 629 conditions, with the majority of consumer grade monitors being slightly closer to reference in cool and 630 dry conditions for PM and CO2 and in warm and humid conditions for TVOC. 631
Recent technological advancements have opened up an opportunity for more effective indoor air quality 632 control and management. The present study suggests that the majority of the tested low-cost consumer 633 grade monitors have the potential to be used to secure adequate indoor environments by triggering the 634 right chain of actions. This could be accomplished either via a feedback loop to encourage human actions 635 or through integration in a building management system with automated controllers and devices. To 636 assure continuous improvement of low-cost environmental sensing technology, future work should focus 637 on the examination of the longitudinal performance of these units, development of quality control 638 algorithms that minimize errors and remove bias, and development of the standards and guidelines for 639 their testing. 640
Acknowledgements 641
This study has been developed in the framework of the research activities of the COST Action CA16114 642 RESTORE funded by the Horizon 2020 Framework Programme of the European Union, who awarded Ms. 643 Ingrid Demanega to conduct collaborative research between EURAC Research and École polytechnique 644 fédérale de Lausanne. Authors also acknowledge the support from ASHRAE for awarding the 645 Undergraduate Program Equipment Grant to Igor Mujan for the development of "ENVIRA - Indoor 646 Environment Quality Platform". The contributions of Dr. Singer were supported by the U.S. Environmental 647 Protection Agency through Interagency Agreement DW-89-9232201-7 and the U.S. Department of Energy 648 Building Technologies Office under Contract No. DE-AC02-05CH1123. 649

22
References 650
[1] A.P. Jones, Chapter 3 Indoor air quality and health, Dev. Environ. Sci. 1 (2002) 57–115. 651 https://doi.org/10.1016/S1474-8177(02)80006-7. 652
[2] S.M. Joshi, The sick building syndrome, Indian J Occup Env. Med. 12 (2008) 61–64. 653 https://doi.org/10.4103/0019-5278.43262. 654
[3] U. States, Healthy buildings, healthy people: A vision for the 21st century, Indoor Pollut. Types, 655 Risks, Fed. Policies. (2012). 656
[4] American Society of Heating Refrigerating and Air-Conditioning Engineers - ASHRAE, Standard 657 62.1 - Ventilation for acceptable indoor air quality, American National Standards Institute, 658 Atlanta, GA, USA, 2019. 659
[5] R. Kosonen, M. Ahola, K. Villberg, T. Takki, Perceived IEQ Conditions: Why the Actual Percentage 660 of Dissatisfied Persons is Higher than Standards Indicate?, in: S.A. Abdul-Wahab (Ed.), Sick Build. 661 Syndr. Public Build. Work., Springer Berlin Heidelberg, Berlin, Heidelberg, 2011: pp. 75–88. 662 https://doi.org/10.1007/978-3-642-17919-8_4. 663
[6] J. Li, H. Li, Y. Ma, Y. Wang, A.A. Abokifa, C. Lu, P. Biswas, Spatiotemporal distribution of indoor 664 particulate matter concentration with a low-cost sensor network, Build. Environ. 127 (2018) 138–665 147. https://doi.org/10.1016/j.buildenv.2017.11.001. 666
[7] J. Pantelic, S. Liu, L. Pistore, D. Licina, M. Vannucci, S. Sadrizadeh, A. Ghahramani, B. Gilligan, E. 667 Sternberg, K. Kampschroer, S. Schiavon, Personal CO2 cloud: laboratory measurements of 668 metabolic CO2 inhalation zone concentration and dispersion in a typical office desk setting, J. 669 Expo. Sci. Environ. Epidemiol. 30 (2020) 328–337. https://doi.org/10.1038/s41370-019-0179-5. 670
[8] D. Licina, Y. Tian, W.W. Nazaroff, Inhalation intake fraction of particulate matter from localized 671 indoor emissions, Build. Environ. 123 (2017) 14–22. 672 https://doi.org/10.1016/j.buildenv.2017.06.037. 673
[9] J. Gibson, R. Loddenkemper, Y. Sibille, B. Lundbäck, European Lung White Book, (n.d.). 674 https://www.erswhitebook.org/ (accessed September 7, 2020). 675
[10] L. Cony Renaud Salis, M. Abadie, P. Wargocki, C. Rode, Towards the definition of indicators for 676 assessment of indoor air quality and energy performance in low-energy residential buildings, 677 Energy Build. 152 (2017) 492–502. https://doi.org/10.1016/j.enbuild.2017.07.054. 678
[11] S.J. Emmerich, A.K. Persily, State-of-the-Art Review of CO2 Demand Controlled Ventilation 679 Technology and Application, Diane Publishing Company, 2001. 680
[12] F. Babich, I. Demanega, F. Avella, A. Belleri, Low polluting building materials and ventilation for 681 good air quality in residential buildings: A cost-benefit study, Atmosphere (Basel). 11 (2020). 682 https://doi.org/10.3390/ATMOS11010102. 683
[13] N. Castell, F.R. Dauge, P. Schneider, M. Vogt, U. Lerner, B. Fishbain, D. Broday, A. Bartonova, Can 684 commercial low-cost sensor platforms contribute to air quality monitoring and exposure 685 estimates?, Environ. Int. 99 (2017) 293–302. https://doi.org/10.1016/j.envint.2016.12.007. 686
[14] N. Kularatna, B.H. Sudantha, An Environmental Air Pollution Monitoring System Based on the 687 IEEE 1451 Standard for Low Cost Requirements, IEEE Sens. J. 8 (2008) 415–422. 688

23
https://doi.org/10.1109/JSEN.2008.917477. 689
[15] X. Liu, S. Cheng, H. Liu, S. Hu, D. Zhang, H. Ning, A survey on gas sensing technology, Sensors 690 (Switzerland). 12 (2012) 9635–9665. https://doi.org/10.3390/s120709635. 691
[16] A. Morpurgo, F. Pedersini, A. Reina, A low-cost instrument for environmental particulate analysis 692 based on optical scattering, 2012 IEEE I2MTC - Int. Instrum. Meas. Technol. Conf. Proc. (2012) 693 2646–2650. https://doi.org/10.1109/I2MTC.2012.6229220. 694
[17] J. Kwon, G. Ahn, G. Kim, J.C. Kim, H. Kim, A study on NDIR-based CO2 sensor to apply remote air 695 quality monitoring system, ICCAS-SICE 2009 - ICROS-SICE Int. Jt. Conf. 2009, Proc. (2009) 1683–696 1687. 697
[18] A. Moreno-Rangel, Continuous IAQ monitoring with low-cost monitors: protocol development, 698 performance and application in residential buildings. The Glasgow School of Art Mackintosh 699 School of Architecture, The Glasgow School of Art, 2019. 700
[19] Z. Wang, W.W. Delp, B.C. Singer, Performance of low-cost indoor air quality monitors for PM2.5 701 and PM10 from residential sources, Build. Environ. 171 (2020) 106654. 702 https://doi.org/10.1016/j.buildenv.2020.106654. 703
[20] B.C. Singer, W.W. Delp, Response of consumer and research grade indoor air quality monitors to 704 residential sources of fine particles, Indoor Air. 28 (2018) 624–639. 705 https://doi.org/10.1111/ina.12463. 706
[21] A. Manikonda, N. Zíková, P.K. Hopke, A.R. Ferro, Laboratory assessment of low-cost PM monitors, 707 J. Aerosol Sci. 102 (2016) 29–40. https://doi.org/10.1016/j.jaerosci.2016.08.010. 708
[22] N. Zikova, P.K. Hopke, A.R. Ferro, Evaluation of new low-cost particle monitors for PM2.5 709 concentrations measurements, J. Aerosol Sci. 105 (2017) 24–34. 710 https://doi.org/10.1016/j.jaerosci.2016.11.010. 711
[23] J. Li, S.K. Mattewal, S. Patel, P. Biswas, Evaluation of nine low-cost-sensor-based particulate 712 matter monitors, Aerosol Air Qual. Res. 20 (2020) 254–270. 713 https://doi.org/10.4209/aaqr.2018.12.0485. 714
[24] Y. Zou, M. Young, M. Wickey, A. May, J.D. Clark, Response of eight low-cost particle sensors and 715 consumer devices to typical indoor emission events in a real home (ASHRAE 1756-RP), Sci. 716 Technol. Built Environ. 26 (2020) 237–249. https://doi.org/10.1080/23744731.2019.1676094. 717
[25] S. Sousan, K. Koehler, L. Hallett, T.M. Peters, Evaluation of consumer monitors to measure 718 particulate matter, J. Aerosol Sci. 107 (2017) 123–133. 719 https://doi.org/10.1016/j.jaerosci.2017.02.013. 720
[26] F.M.J. Bulot, S.J. Johnston, P.J. Basford, N.H.C. Easton, M. Apetroaie-Cristea, G.L. Foster, A.K.R. 721 Morris, S.J. Cox, M. Loxham, Long-term field comparison of multiple low-cost particulate matter 722 sensors in an outdoor urban environment, Sci. Rep. 9 (2019) 1–13. 723 https://doi.org/10.1038/s41598-019-43716-3. 724
[27] K.N. Genikomsakis, N.F. Galatoulas, P.I. Dallas, L.M.C. Ibarra, D. Margaritis, C.S. Ioakimidis, 725 Development and on-field testing of low-cost portable system for monitoring PM2.5 726 concentrations, Sensors (Switzerland). 18 (2018). https://doi.org/10.3390/s18041056. 727

24
[28] H.Y. Liu, P. Schneider, R. Haugen, M. Vogt, Performance assessment of a low-cost PM 2.5 sensor 728 for a near four-month period in Oslo, Norway, Atmosphere (Basel). 10 (2019) 1–19. 729 https://doi.org/10.3390/atmos10020041. 730
[29] B. Feenstra, V. Papapostolou, S. Hasheminassab, H. Zhang, B. Der Boghossian, D. Cocker, A. 731 Polidori, Performance evaluation of twelve low-cost PM2.5 sensors at an ambient air monitoring 732 site, Atmos. Environ. 216 (2019) 116946. https://doi.org/10.1016/j.atmosenv.2019.116946. 733
[30] X. Liu, R. Jayaratne, P. Thai, T. Kuhn, I. Zing, B. Christensen, R. Lamont, M. Dunbabin, S. Zhu, J. 734 Gao, D. Wainwright, D. Neale, R. Kan, J. Kirkwood, L. Morawska, Low-cost sensors as an 735 alternative for long-term air quality monitoring, Environ. Res. 185 (2020) 109438. 736 https://doi.org/10.1016/j.envres.2020.109438. 737
[31] L. Bai, L. Huang, Z. Wang, Q. Ying, J. Zheng, X. Shi, J. Hu, Long-term field evaluation of low-cost 738 particulate matter sensors in Nanjing, Aerosol Air Qual. Res. 20 (2020) 242–253. 739 https://doi.org/10.4209/aaqr.2018.11.0424. 740
[32] M.B. Marinov, N. Djermanova, B. Ganev, G. Nikolov, E. Janchevska, Performance Evaluation of 741 Low-cost Carbon Dioxide Sensors, in: 2018 IEEE 27th Int. Sci. Conf. Electron. 2018 - Proc., 2018: 742 pp. 2018–2021. https://doi.org/10.1109/ET.2018.8549621. 743
[33] G. Varzaru, A. Zarnescu, R. Ungurelu, M. Secere, Dismantling the confusion between the 744 equivalent CO2 and CO2 concentration levels, Proc. 11th Int. Conf. Electron. Comput. Artif. Intell. 745 ECAI 2019. (2019) 1–4. https://doi.org/10.1109/ECAI46879.2019.9042113. 746
[34] A. Schieweck, E. Uhde, T. Salthammer, L.C. Salthammer, L. Morawska, Smart homes and the 747 control of indoor air quality, Renew. Sustain. Energy Rev. 94 (2018) 705–718. 748 https://doi.org/10.1016/j.rser.2018.05.057. 749
[35] T. Parkinson, A. Parkinson, R. de Dear, Continuous IEQ monitoring system: Context and 750 development, Build. Environ. 149 (2019) 15–25. https://doi.org/10.1016/j.buildenv.2018.12.010. 751
[36] T. Parkinson, A. Parkinson, R. de Dear, Continuous IEQ monitoring system: Performance 752 specifications and thermal comfort classification, Build. Environ. 149 (2019) 241–252. 753 https://doi.org/10.1016/j.buildenv.2018.12.016. 754
[37] A. Moreno-Rangel, T. Sharpe, F. Musau, G. McGill, Field evaluation of a low-cost indoor air quality 755 monitor to quantify exposure to pollutants in residential environments, J. Sensors Sens. Syst. 7 756 (2018) 373–388. https://doi.org/10.5194/jsss-7-373-2018. 757
[38] American Society of Heating Refrigerating and Air-Conditioning Engineers - ASHRAE, Thermal 758 environmental conditions for human occupancy, ANSI/ASHRAE Stand. - 55. 7 (2017) 6. 759
[39] EN 16798-1:2019 Energy performance of buildings - Ventilation for buildings - Part 1: Indoor 760 environmental input parameters for design and assessment of energy performance of buildings 761 addressing indoor air quality, thermal environment, lighting and acous, (2019). 762
[40] R.E. Militello-Hourigan, S.L. Miller, The impacts of cooking and an assessment of indoor air quality 763 in Colorado passive and tightly constructed homes, Build. Environ. 144 (2018) 573–582. 764 https://doi.org/10.1016/j.buildenv.2018.08.044. 765
[41] E.L. Nirlo, N. Crain, R.L. Corsi, J.A. Siegel, Field evaluation of five volatile organic compound 766 measurement techniques: Implications for green building decision making, Sci. Technol. Built 767

25
Environ. 21 (2015) 67–79. https://doi.org/10.1080/10789669.2014.969172. 768
[42] C. Chen, Evaluation of resistance-temperature calibration equations for NTC thermistors, Meas. J. 769 Int. Meas. Confed. 42 (2009) 1103–1111. https://doi.org/10.1016/j.measurement.2009.04.004. 770
[43] G. Van Rossum, F.L. Drake, Python Tutorial, Technical Report CS-R9526, Cent. Voor Wiskd. En 771 Inform. (1995). https://doi.org/10.1016/j.abb.2004.09.015. 772
[44] Python 3.7, (n.d.). https://www.python.org/dev/peps/pep-0537/ (accessed June 25, 2020). 773
[45] T.E. Oliphant, Guide to NumPy, Methods. 1 (2010) 378. 774 https://doi.org/10.1016/j.jmoldx.2015.02.001. 775
[46] J.D. Evans, Straightforward statistics for the behavioral sciences., Cole Publishing Co., 1996. 776
[47] M.L. Zamora, J. Rice, K. Koehler, One year evaluation of three low-cost PM2.5 monitors, Atmos. 777 Environ. 235 (2020) 117615. https://doi.org/10.1016/j.atmosenv.2020.117615. 778
[48] I. Standard, ISO 7726 Ergonomics of the thermal environment — Instruments for measuring 779 physical quantities, ISO Stand. 1998 (1998) 1–56. https://doi.org/ISO 7726:1998 (E). 780
781

Supplementary Data
Performance assessment of low-cost environmental monitors and single sensors under variable indoor air quality and thermal conditions
Ingrid Demanega 1,*, Igor Mujan 2,*, Brett C. Singer 3, Aleksandar S. Anđelković 2, Francesco Babich 1, Dusan Licina 4,**
1 Institute for Renewable Energy, Eurac Research, Bolzano, Italy.
2 University of Novi Sad, Faculty of Technical Sciences, Novi Sad, Serbia
3 Indoor Environment Group and Residential Building Systems Group, Lawrence Berkeley National Laboratory, Berkeley, USA
4 Human-Oriented Built Environment Lab, School of Architecture, Civil and Environmental Engineering, École Polytechnique Fédérale de Lausanne, Lausanne, Switzerland
* These authors contributed equally to the paper
** Corresponding email: [email protected]
Table S1. Description of reference measurement equipment used to evaluate the performance of the low-cost consumer grade monitors and single-parameter sensors.
GRIMM - Model 1371 (miniWRAS) LI-COR LI-850 gas analyzer (LI-COR) GrayWolf AdvancedSense Pro - IQ-610 (GW)
Measured parameters
PM10, PM2.5, and PM1 and dust fractions acc. EN 481
CO2 measurement range 0 to 20'000 ppm VOCs Range
0.02 -20 ppm Resolution 1 ppb, LOD <5 ppb
Dust mass 0.1 µg/m³ - 100 mg/m³ Accuracy Within 1.5% of reading Aeroqual Photoionization Detector (AerPID)
Particle size range 10 nm - 35 µm Sensitivity to water
vapor <0.1 ppm CO2 / mmol mol-1 H2O VOCs Range 0 - 20 ppm
Size channels 41 in total Lower limit of detection 1.5 ppm Accuracy of Factory
Calibration <±0.2 ppm + 10%
Reproducibility ± 3% of total measuring range (optical) Relative humidity 0% - 100% Testo 435 logger with
Testo Hot-Wire Anemometer (Ø 7.5 mm)
Calculated accuracy ± 2% (20 - 80 %) Temperature –Measuring range -20 to +70°C
Accuracy ±0.2°C

Table S2. MRE, MAE and PCC data used for the monitor ranking.
PM2.5 PM10 CO2 TVOC Relative humidity Temperature
Monitor MRE PCC MRE PCC MRE PCC MRE PCC MAE [% RH] PCC MAE [°C] PCC
AirVisual 66% 0.84 - - 10% 0.97 - - 6.4 0.89 0.69 0.59 Awair 53% 0.89 - - 7% 1.00 63% 0.96 2.6 1.00 0.45 0.98 Clarity 53% 0.85 80% 0.66 - - - - 8.4 0.98 3.33 0.36 Foobot 109% 0.80 - - 80% -0.29 150% 0.88 7.4 0.98 0.40 0.59 Kaiterra 50% 0.70 - - 4% 1.00 - - 3.2 0.99 0.39 0.76 Netatmo_o - - - - - - - - 2.5 0.99 0.54 0.56 Netatmo_i - - - - 20% 0.82 - - 5.7 0.81 0.55 0.72 uHoo 83% 0.64 - - 39% 1.00 58% 0.86 1.5 0.99 0.29 0.90
Table S3. Variation of the mean relative error (MRE) for PM2.5 and PM10 when a source dependent density adjustment is applied*
MRE variation for PM2.5 MRE variation for PM10 Candle burning Mosquito coil Popcorn cooking Popcorn cooking Carpet vacuuming
Cool &Dry
Warm &Humid
Cool &Dry
Warm &Humid
Cool &Dry
Warm &Humid
Cool &Dry
Warm &Humid
Cool &Dry
Warm &Humid
AirVisual -7% -14% 54% 105% 18% -23% - - - - Awair -13% -12% -13% -19% -17% -24% - - - - Clarity -17% -22% -9% 37% -11% -14% -13% -15% -1% 3% Foobot 10% -14% 28% 37% 52% 20% - - - - Kaiterra -16% -22% 3% 42% -19% -20% - - - - uHoo -5% -5% -3% 0% 24% -17% - - - - OPC-N3 -7% -6% -7% -5% -17% -29% 5% 28% -11% -5% OPC-R1 -8% 0% -8% -9% 39% 63% 109% 44% -183% -130% SPS30 0% -13% 38% -9% 0% -16% -12% -12% 3% 5% SDS018 -2% -9% -9% -3% -11% -18% -11% -22% 2% 7%
* For the candle burning activity, the density was reduced to 1.13 g/cm³ being an average value of 1.05 and 1.21 g/cm³ determined by Wang et al. (2020) [1] for 6 unscented candles and 3 scented candles respectively. In case of the mosquito coil burning, the density was reduced to 1.17 g/cm³ [1], while for the popcorn cooking activity, the adjusted density was set to 1.10 g/cm³. For this latter, an average value between the densities determined for 90 g of popcorn heated in a microwave (1.32 g/cm³) [1] and 15 g of oil brought to bubble in a steel wok (0.88 g/cm³) [1] was taken. Contrarily, the density for carpet vacuuming was increased to 2.89 g/cm³ [1] and the average particle density from the room deodorant was not adjusted because no experimental value was found in literature.

References [1] Z. Wang, W.W. Delp, B.C. Singer, Performance of low-cost indoor air quality monitors for PM2.5
and PM10 from residential sources, Build. Environ. 171 (2020) 106654. https://doi.org/10.1016/j.buildenv.2020.106654.