Embed Size (px)
Citation preview
Performance Benefits of Fiber-reinforced Thin Concrete Pavement and Overlays
Wednesday, January 31, 2018 Slide Number: 1
Manik Barman
TL: Tom Burnham (MnDOT)
PI: Manik Barman (UMD) (Presenter)
TAP MEETING # 1
MnDOT Contract No. 1003325; Work Order 56
TAP Members
Wednesday, January 31, 2018 Slide Number: 2
Manik Barman
Tim Anderson, MnDOT
Kaye Bieniek, Minnesota LRRB
Tom Burnham, MnDOT (TL)
John Donahue, Missouri DOT
Christine Dulian, MnDOT
Debra Fick, MnDOT
Bernard Izevbekhai, MnDOT
James Krstulovich, Illinois DOT
Clifford, McDonald
Maria Masten, MnDOT
Luke Pinkerton, Helix Steel
Dulce Rufino, California DOT
Julie Vandenbossche, University of Pittsburgh
Matthew Zeller, Concrete Paving Association of Minnesota
Research Group
Wednesday, January 31, 2018 Slide Number: 3
Manik Barman
Manik Barman, Assistant Professor (PI)
Bryce Hansen, Graduate Student
Uma Arepalli, Post Doctoral Associate
Manik Barman
Wednesday, January 31, 2018 Slide Number: 4
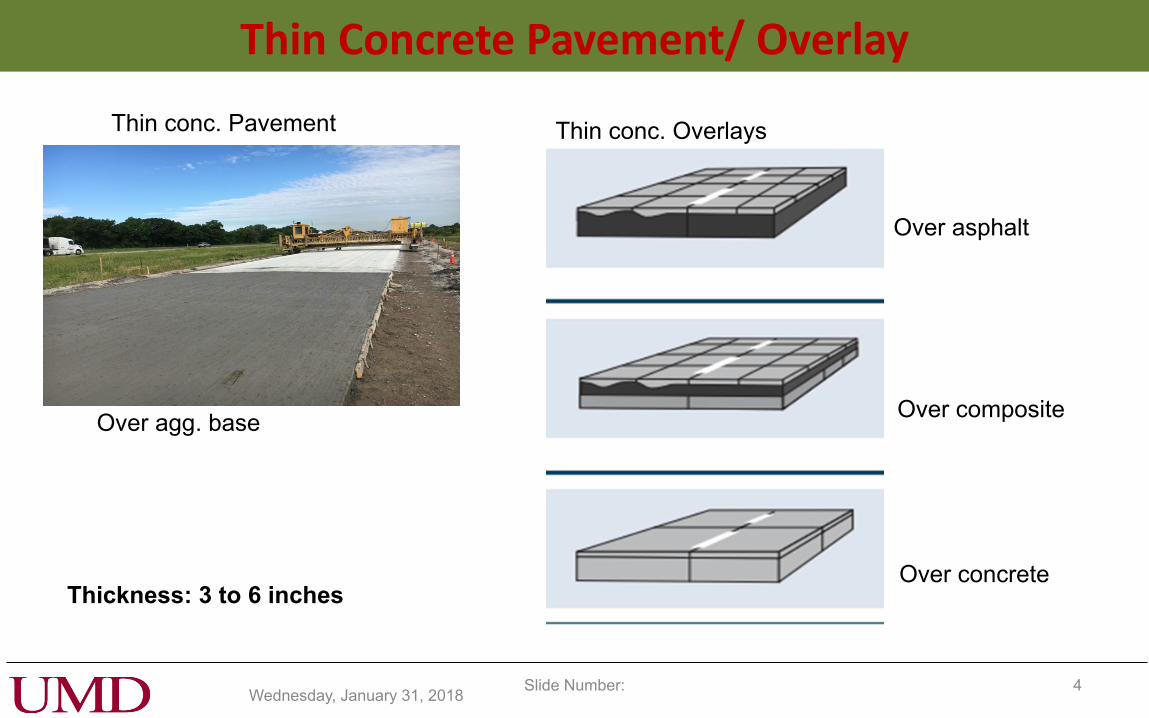
Thin Concrete Pavement/ Overlay
Over agg. base
Over asphalt
Over composite
Thin conc. Pavement Thin conc. Overlays
Over concrete Thickness: 3 to 6 inches
Wednesday, January 31, 2018 Slide Number: 5
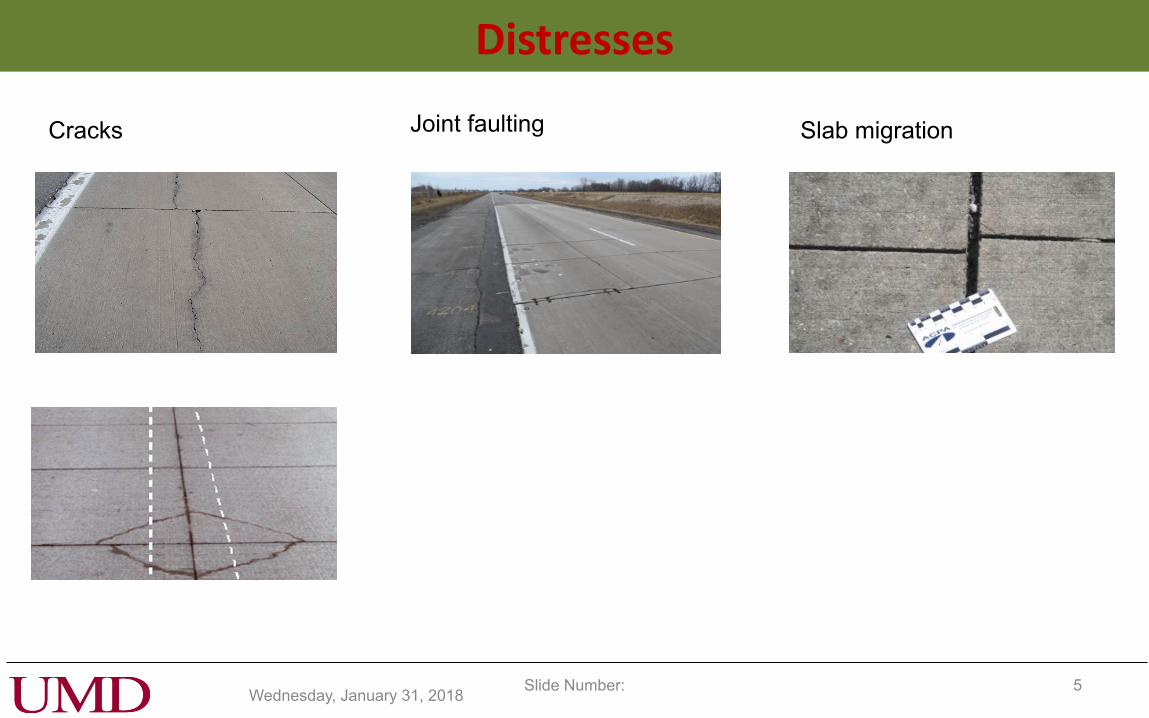
Distresses
Joint faulting Slab migration Cracks
Manik Barman
Wednesday, January 31, 2018 Slide Number: 6
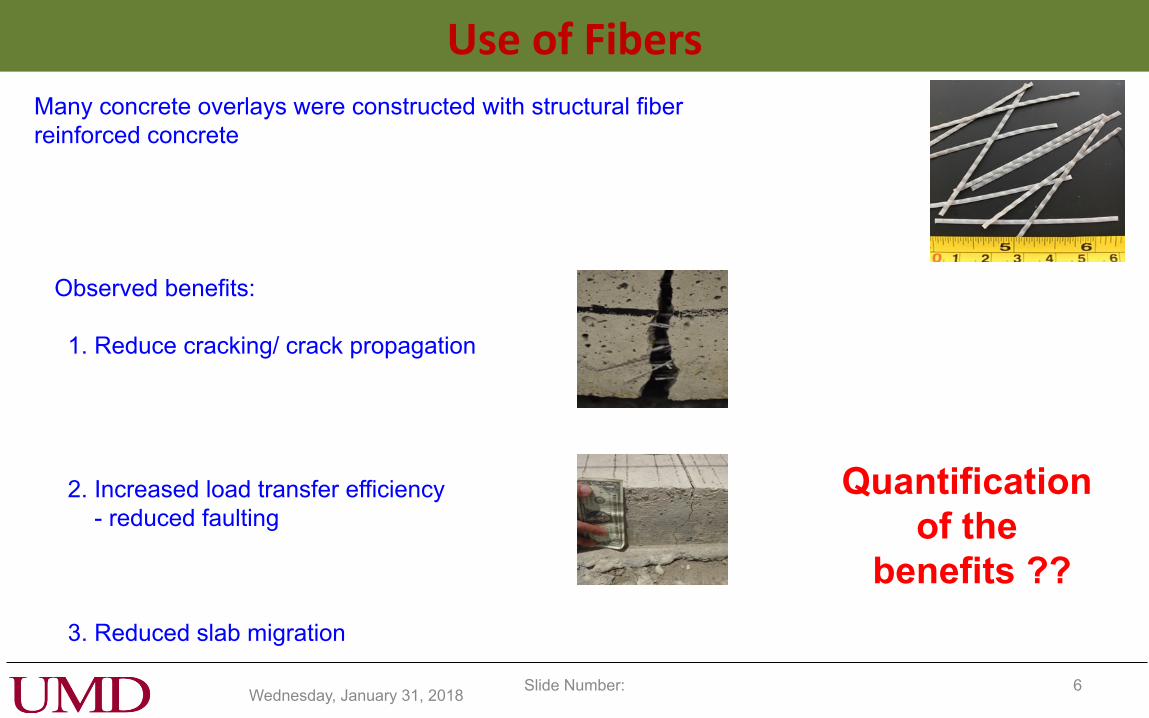
Use of Fibers
Observed benefits:
1. Reduce cracking/ crack propagation
2. Increased load transfer efficiency
- reduced faulting
3. Reduced slab migration
Many concrete overlays were constructed with structural fiber
reinforced concrete
Quantification
of the
benefits ??
Wednesday, January 31, 2018 Slide Number: 7
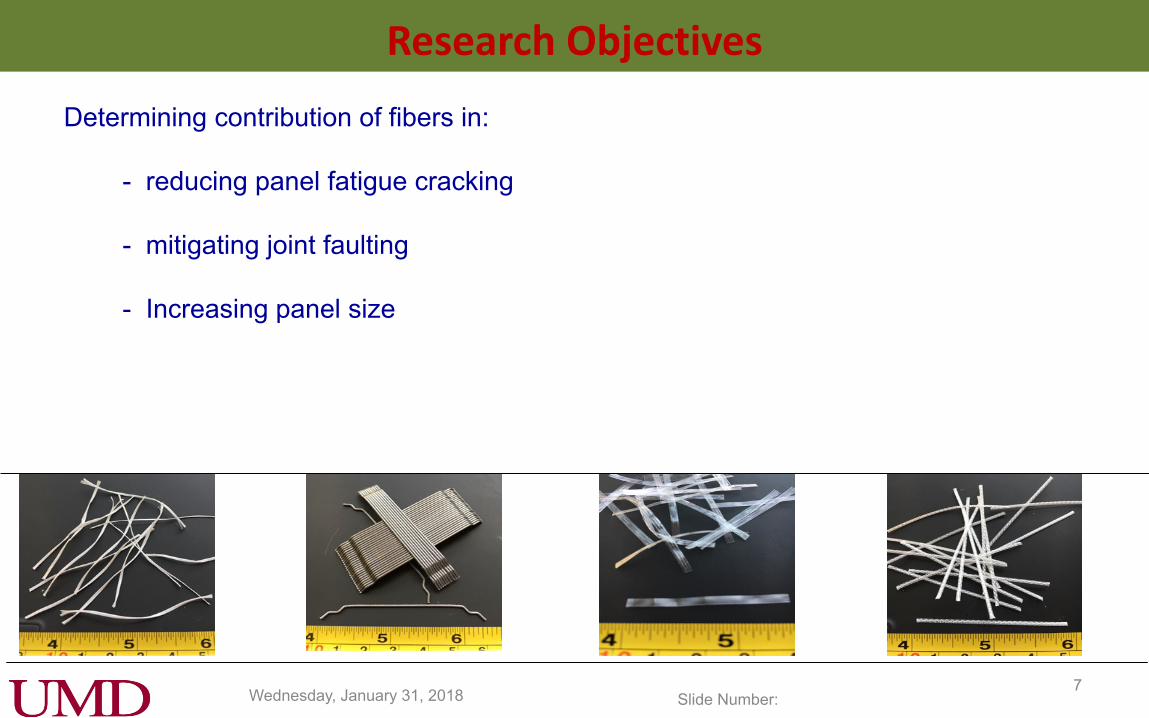
Research Objectives
Determining contribution of fibers in:
- reducing panel fatigue cracking
- mitigating joint faulting
- Increasing panel size
Wednesday, January 31, 2018 Slide Number: 8
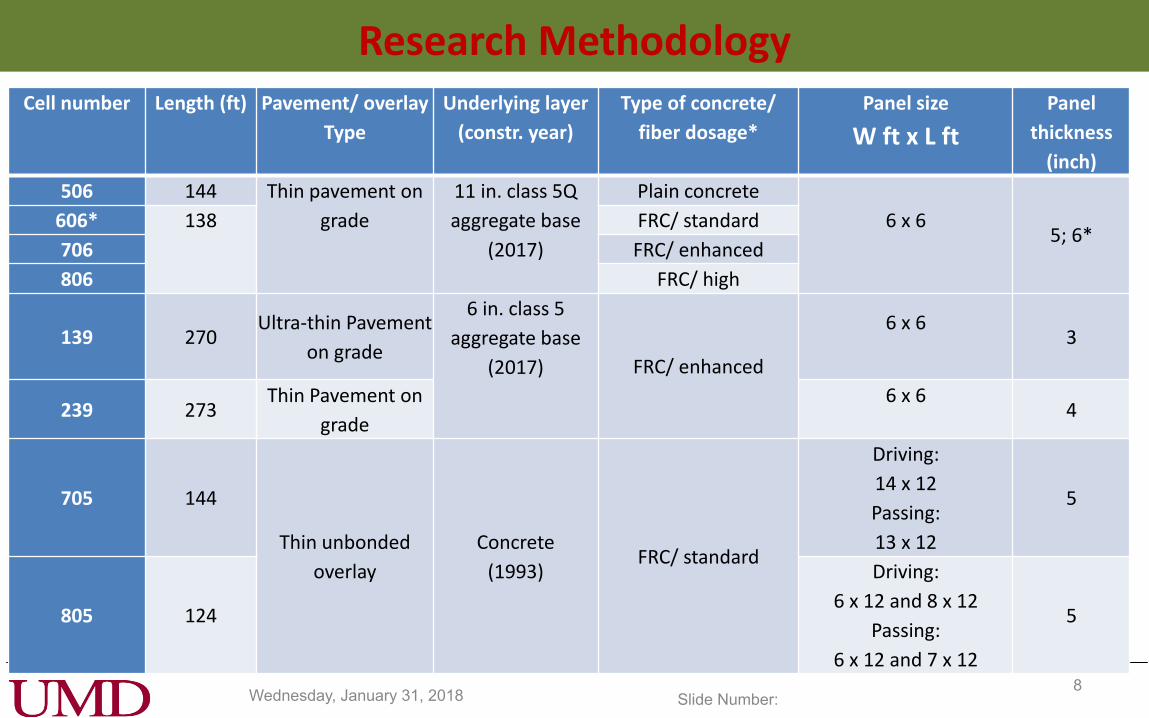
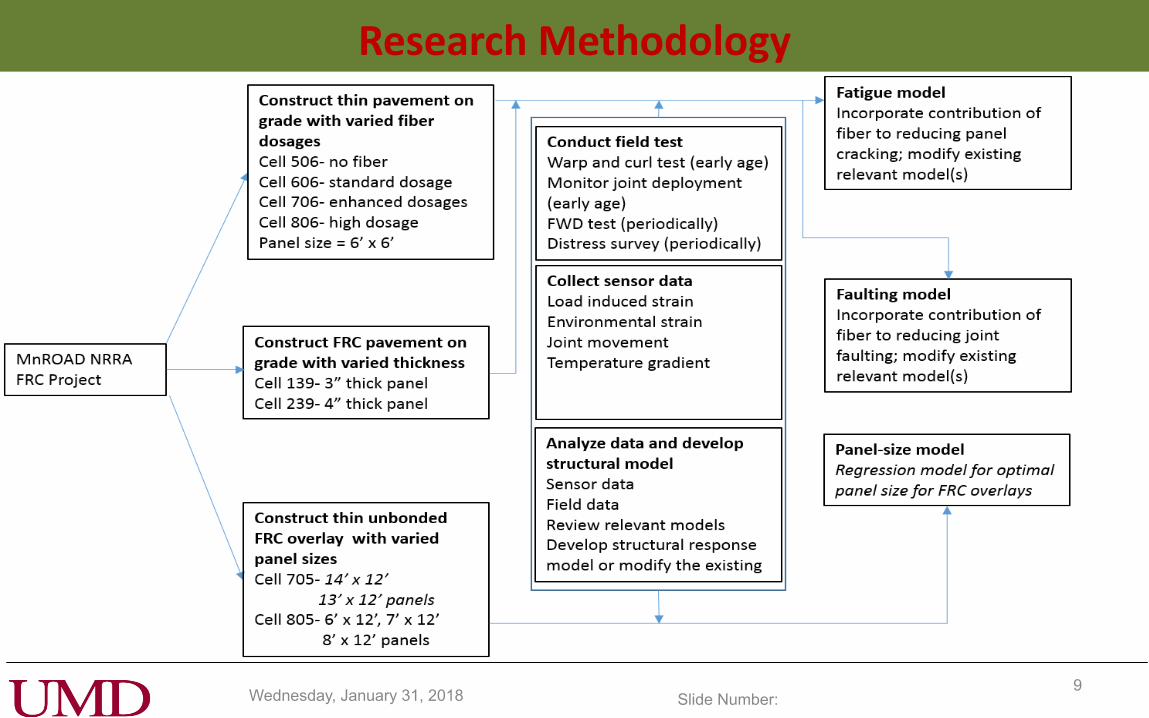
Research Methodology Cell number Length (ft) Pavement/ overlay
Type
Underlying layer
(constr. year)
Type of concrete/
fiber dosage*
Panel size
W ft x L ft
Panel
thickness
(inch)
506 144 Thin pavement on
grade
11 in. class 5Q
aggregate base
(2017)
Plain concrete
6 x 6
5; 6*
606* 138 FRC/ standard
706 FRC/ enhanced
806 FRC/ high
139 270 Ultra-thin Pavement
on grade
6 in. class 5
aggregate base
(2017)
FRC/ enhanced
6 x 6
3
239 273 Thin Pavement on
grade
6 x 6
4
705 144
Thin unbonded
overlay
Concrete
(1993) FRC/ standard
Driving:
14 x 12
Passing:
13 x 12
5
805 124
Driving:
6 x 12 and 8 x 12
Passing:
6 x 12 and 7 x 12
5
Wednesday, January 31, 2018 Slide Number: 9
Research Methodology
Wednesday, January 31, 2018 Slide Number: 10
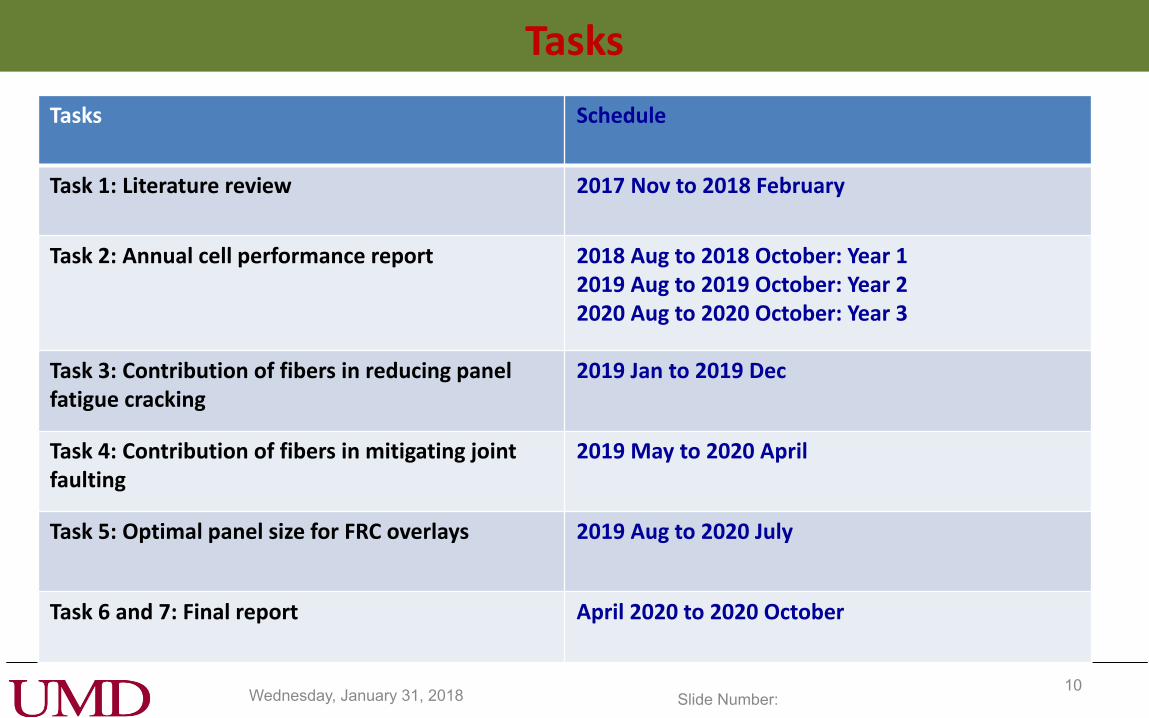
Tasks
Tasks Schedule
Task 1: Literature review 2017 Nov to 2018 February
Task 2: Annual cell performance report 2018 Aug to 2018 October: Year 1 2019 Aug to 2019 October: Year 2 2020 Aug to 2020 October: Year 3
Task 3: Contribution of fibers in reducing panel fatigue cracking
2019 Jan to 2019 Dec
Task 4: Contribution of fibers in mitigating joint faulting
2019 May to 2020 April
Task 5: Optimal panel size for FRC overlays 2019 Aug to 2020 July
Task 6 and 7: Final report April 2020 to 2020 October
Wednesday, January 31, 2018 Slide Number: 11
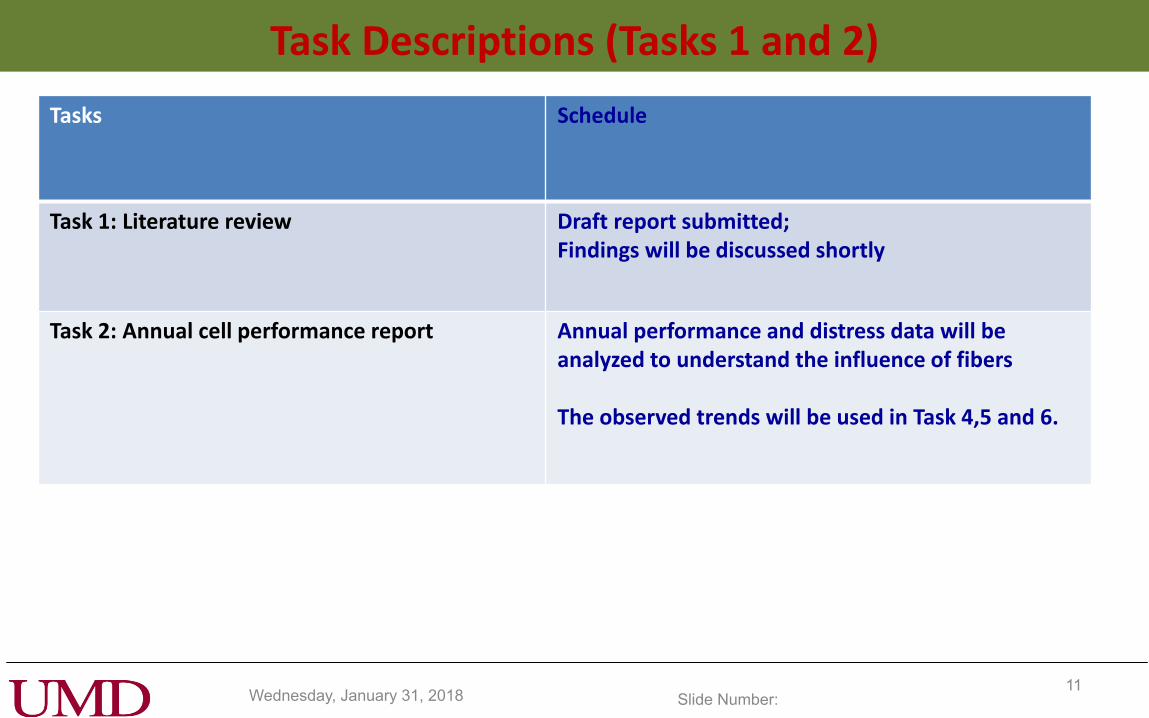
Task Descriptions (Tasks 1 and 2)
Tasks Schedule
Task 1: Literature review Draft report submitted; Findings will be discussed shortly
Task 2: Annual cell performance report Annual performance and distress data will be analyzed to understand the influence of fibers The observed trends will be used in Task 4,5 and 6.
Wednesday, January 31, 2018 Slide Number: 12
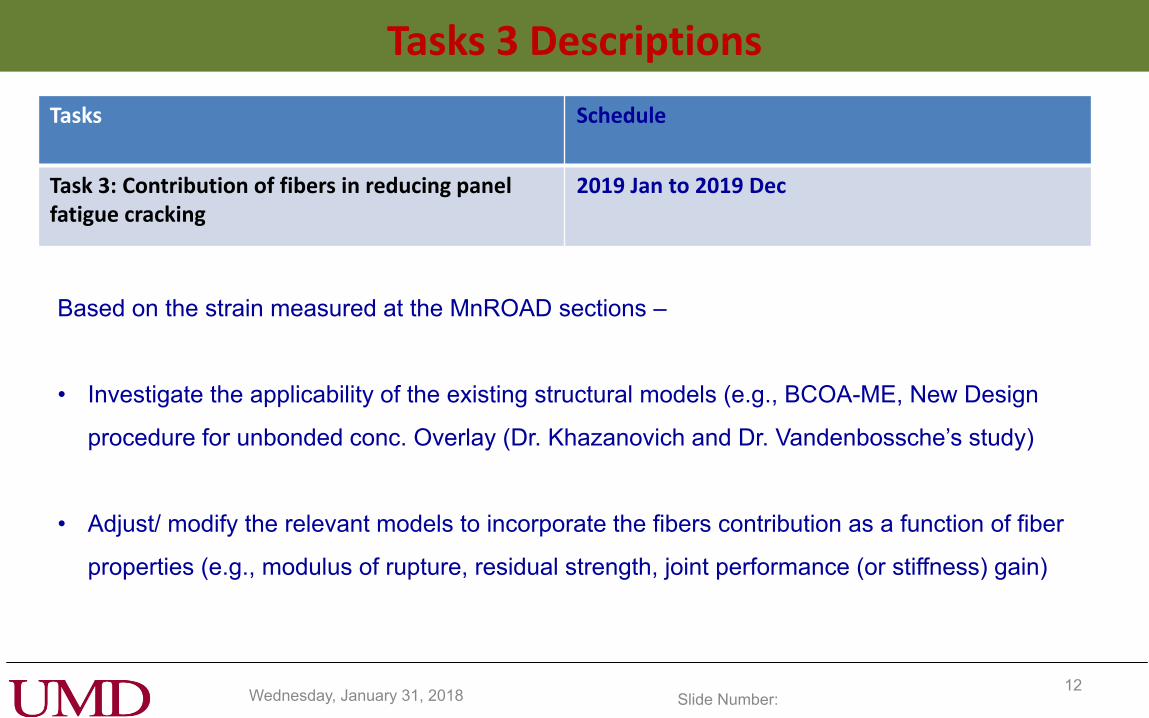
Tasks 3 Descriptions
Tasks Schedule
Task 3: Contribution of fibers in reducing panel fatigue cracking
2019 Jan to 2019 Dec
Based on the strain measured at the MnROAD sections –
• Investigate the applicability of the existing structural models (e.g., BCOA-ME, New Design
procedure for unbonded conc. Overlay (Dr. Khazanovich and Dr. Vandenbossche’s study)
• Adjust/ modify the relevant models to incorporate the fibers contribution as a function of fiber
properties (e.g., modulus of rupture, residual strength, joint performance (or stiffness) gain)
Wednesday, January 31, 2018 Slide Number: 13
Tasks 3 Descriptions
Tasks Schedule
Task 3: Contribution of fibers in reducing panel fatigue cracking
2019 Jan to 2019 Dec
Based on the performance and distress of the MnROAD and other similar projects –
• Develop incremental fatigue damage procedure (similar to AASHTO-ME); critical stress and strain
are function of fiber property, joint stiffness, effective slab length, etc., which will vary with crack
width = function of seasonal tempr.
Wednesday, January 31, 2018 Slide Number: 14
Tasks 4 Descriptions
Tasks Schedule
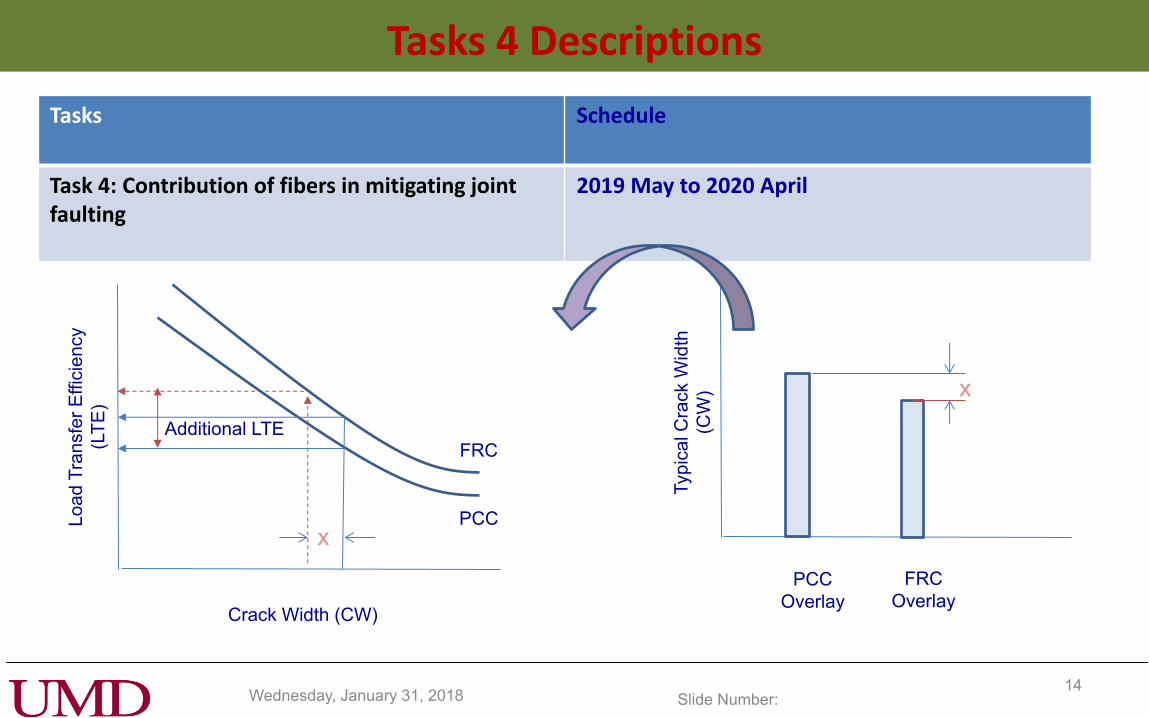
Task 4: Contribution of fibers in mitigating joint faulting
2019 May to 2020 April
FRC
PCC
Crack Width (CW)
Lo
ad
Tra
nsfe
r E
ffic
iency
(LT
E)
Additional LTE
PCC
Overlay
Typ
ical C
rack W
idth
(CW
)
FRC
Overlay
x
x
Wednesday, January 31, 2018 Slide Number: 15
Tasks 4 Descriptions
Tasks Schedule
Task 4: Contribution of fibers in mitigating joint faulting
2019 May to 2020 April
Based on the FWD and crack width movement data –
• Study the load transfer behavior of FRC (existing lab study)
• Consider creep issue or plastic elongation of fibers
• Verify the load transfer behavior of FRC sections with the FWD data
• Adjust/ modify the relevant models to incorporate the fibers contribution as a function of fiber
properties (e.g., modulus of rupture, residual strength, joint performance gain)
• To consider the seasonal crack width movement, incremental damage approached will be
adopted
Wednesday, January 31, 2018 Slide Number: 16
Tasks 5 Descriptions
Tasks Schedule
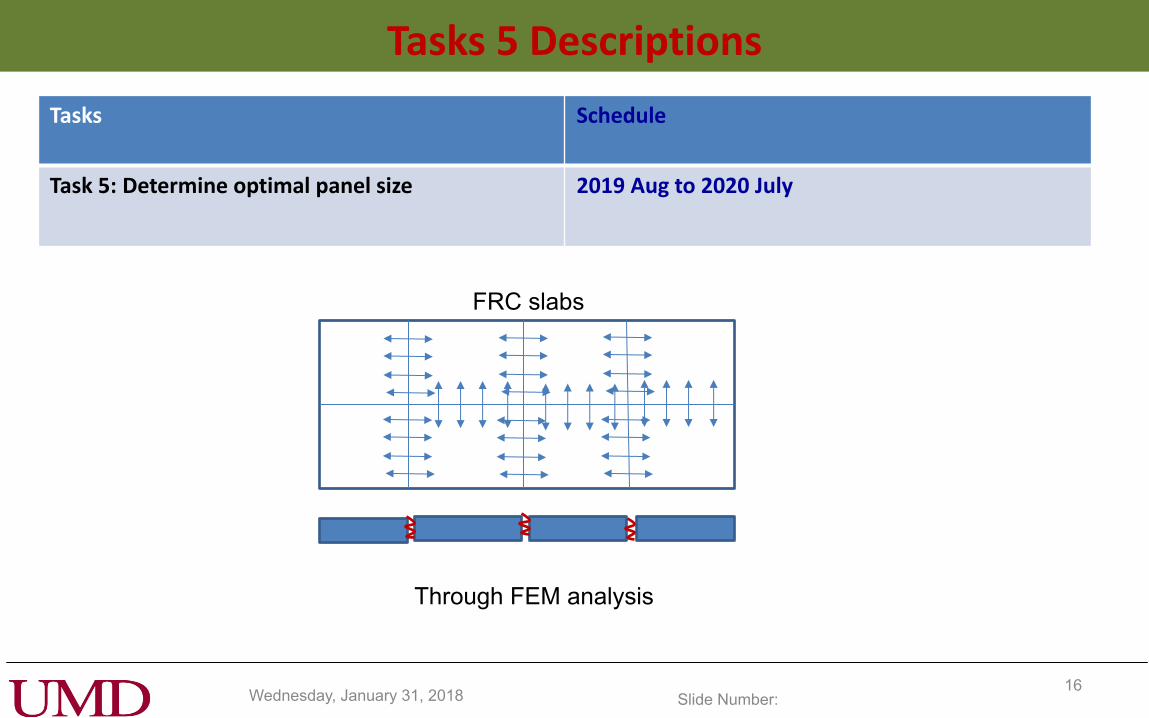
Task 5: Determine optimal panel size 2019 Aug to 2020 July
FRC slabs
Through FEM analysis
Wednesday, January 31, 2018 Slide Number: 17
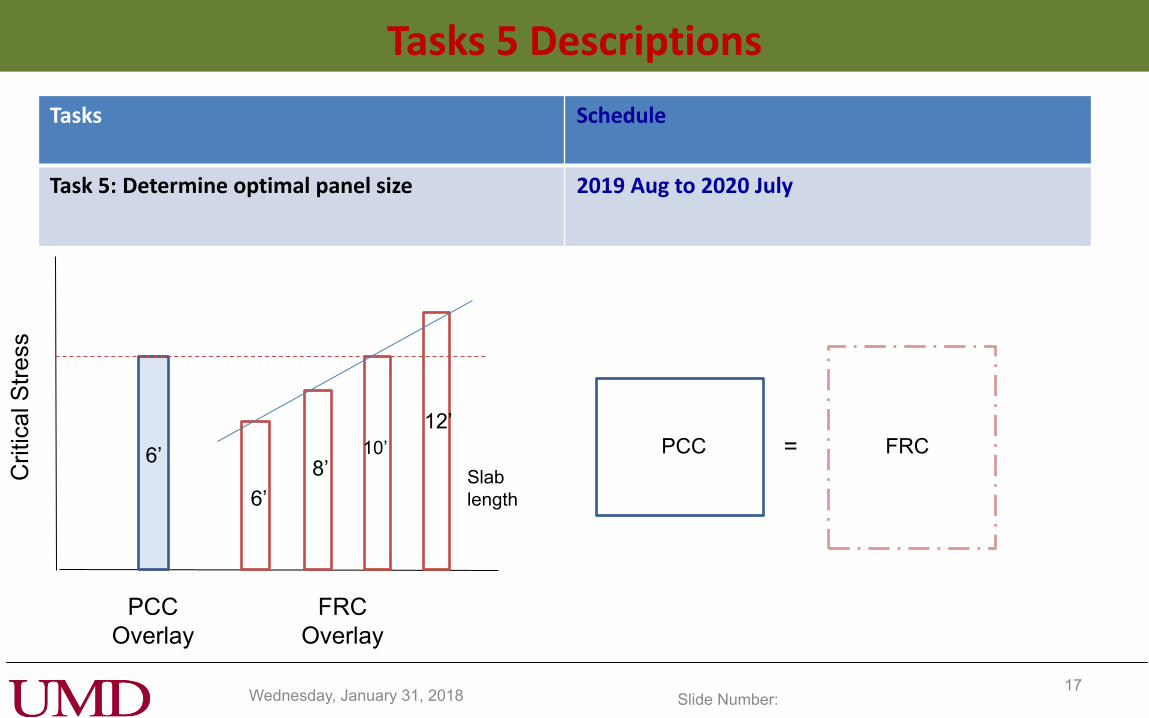
Tasks 5 Descriptions
Tasks Schedule
Task 5: Determine optimal panel size 2019 Aug to 2020 July
PCC
Overlay
Cri
tical S
tress
FRC
Overlay
6’ 10’
6’
8’
12’
Slab
length
PCC FRC =
Wednesday, January 31, 2018 Slide Number: 18
Tasks 5 Descriptions
Tasks Schedule
Task 5: Determine optimal panel size 2019 Aug to 2020 July
Based on the performance and distress of the Cells 139, 239, 705 and 805 and FEM analysis
findings-
Optimal slab size = f(fiber property, underlying layer properties, temperature change in the region,
etc.)
Wednesday, January 31, 2018 Slide Number: 19
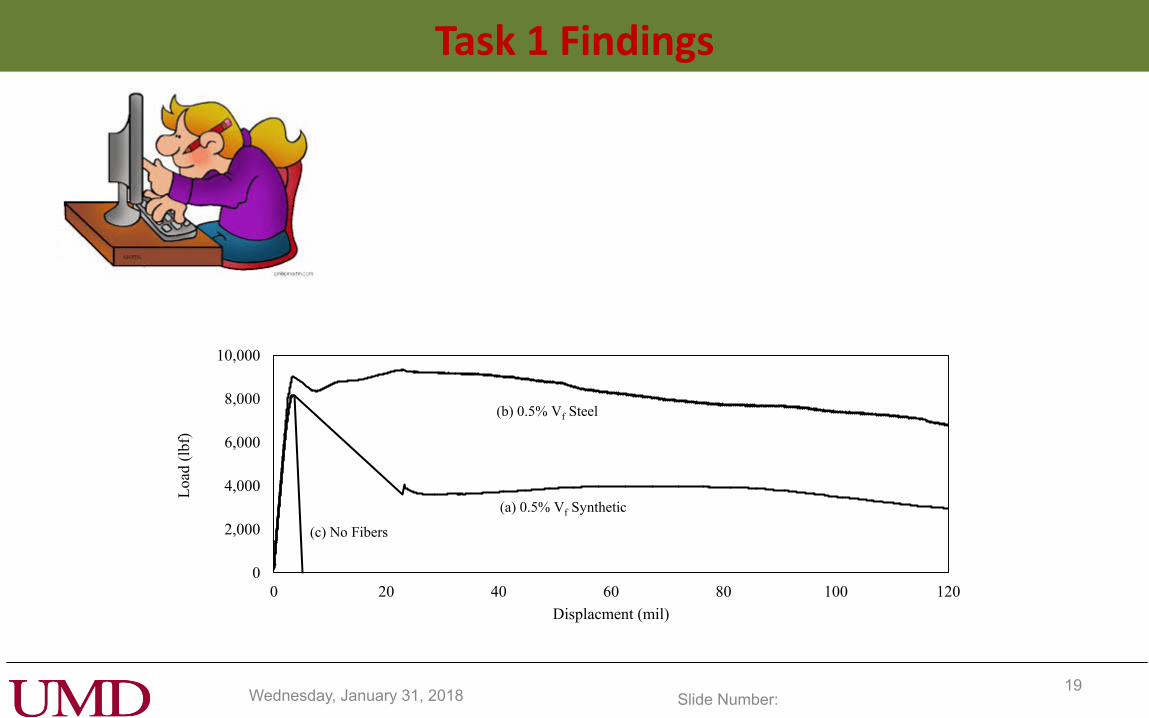
Task 1 Findings
0
2,000
4,000
6,000
8,000
10,000
0 20 40 60 80 100 120
Load
(lb
f)
Displacment (mil)
(b) 0.5% Vf Steel
(a) 0.5% Vf Synthetic
(c) No Fibers
Wednesday, January 31, 2018 Slide Number: 20
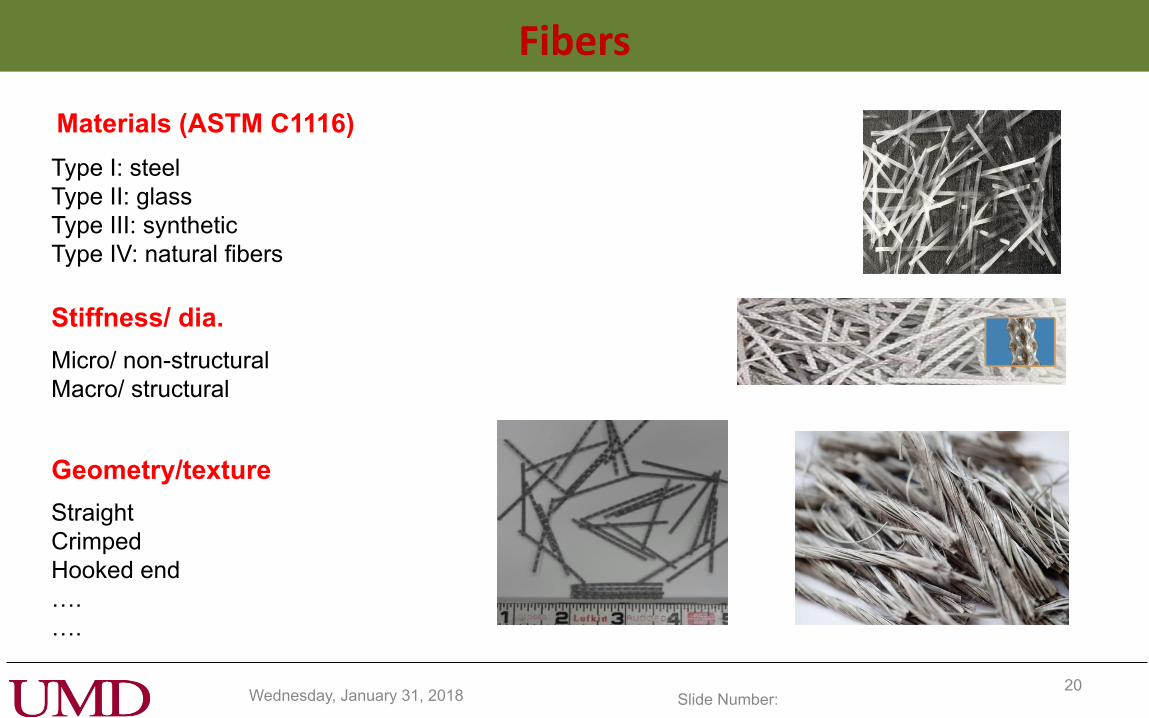
Fibers
Type I: steel
Type II: glass
Type III: synthetic
Type IV: natural fibers
Materials (ASTM C1116)
Micro/ non-structural
Macro/ structural
Stiffness/ dia.
Straight
Crimped
Hooked end
….
….
Geometry/texture
Wednesday, January 31, 2018 Slide Number: 21
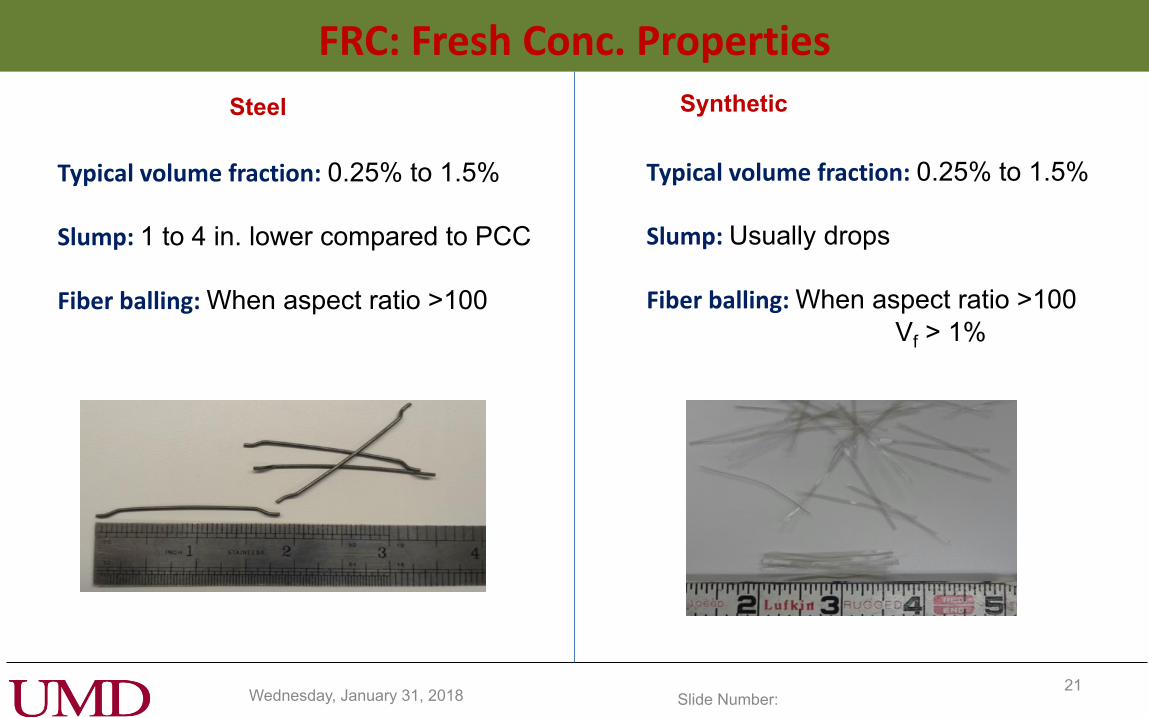
FRC: Fresh Conc. Properties
Typical volume fraction: 0.25% to 1.5%
Slump: 1 to 4 in. lower compared to PCC
Fiber balling: When aspect ratio >100
Steel
Typical volume fraction: 0.25% to 1.5%
Slump: Usually drops
Fiber balling: When aspect ratio >100
Vf > 1%
Synthetic
Wednesday, January 31, 2018 Slide Number: 22
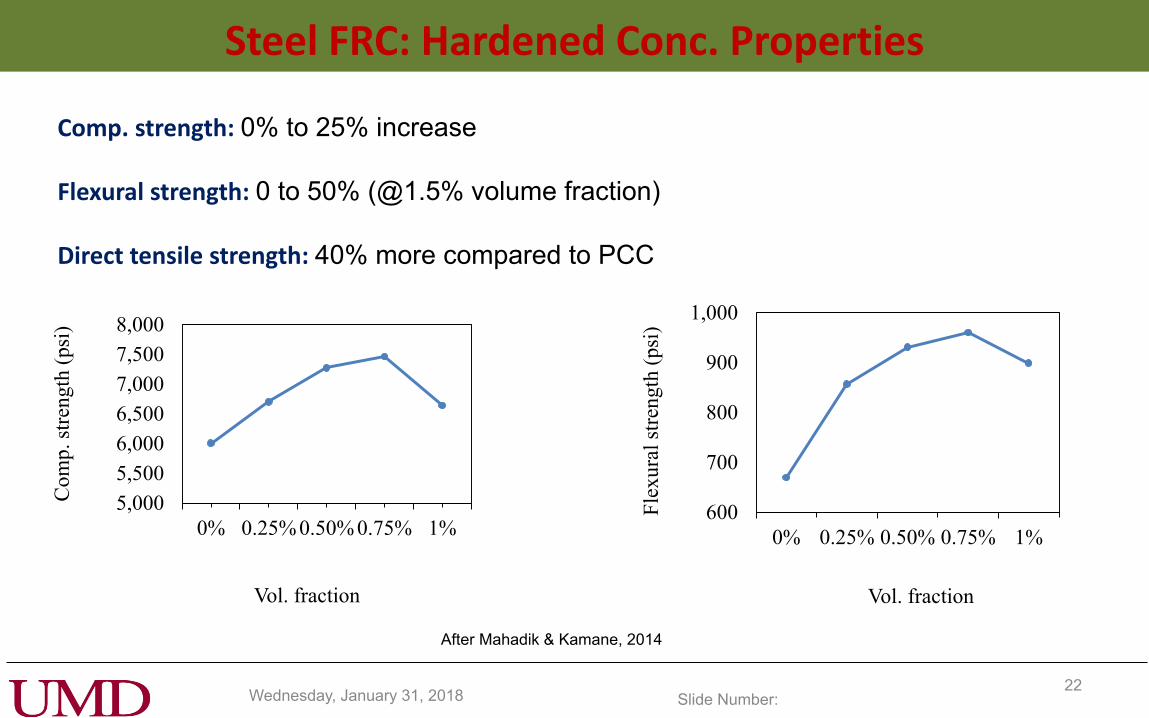
Steel FRC: Hardened Conc. Properties
Comp. strength: 0% to 25% increase
Flexural strength: 0 to 50% (@1.5% volume fraction)
Direct tensile strength: 40% more compared to PCC
5,000
5,500
6,000
6,500
7,000
7,500
8,000
0% 0.25% 0.50% 0.75% 1%
Com
p. st
ren
gth
(p
si)
Vol. fraction
After Mahadik & Kamane, 2014
600
700
800
900
1,000
0% 0.25% 0.50% 0.75% 1%
Fle
xura
l st
ren
gth
(p
si)
Vol. fraction
Wednesday, January 31, 2018 Slide Number: 23
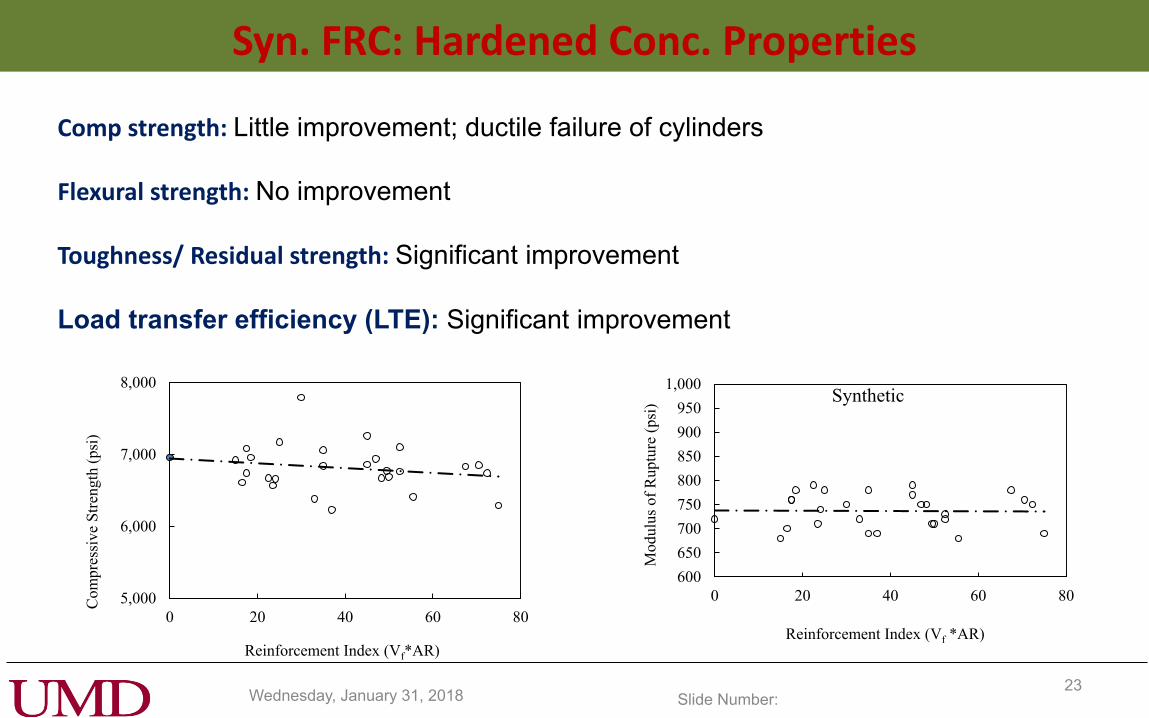
Syn. FRC: Hardened Conc. Properties
Comp strength: Little improvement; ductile failure of cylinders
Flexural strength: No improvement
Toughness/ Residual strength: Significant improvement
Load transfer efficiency (LTE): Significant improvement
5,000
6,000
7,000
8,000
0 20 40 60 80
Com
pre
ssiv
e S
tren
gth
(psi
)
Reinforcement Index (Vf*AR)
600
650
700
750
800
850
900
950
1,000
0 20 40 60 80
Mo
dulu
s of
Ruptu
re (
psi
) Reinforcement Index (Vf *AR)
Synthetic
Wednesday, January 31, 2018 Slide Number: 24
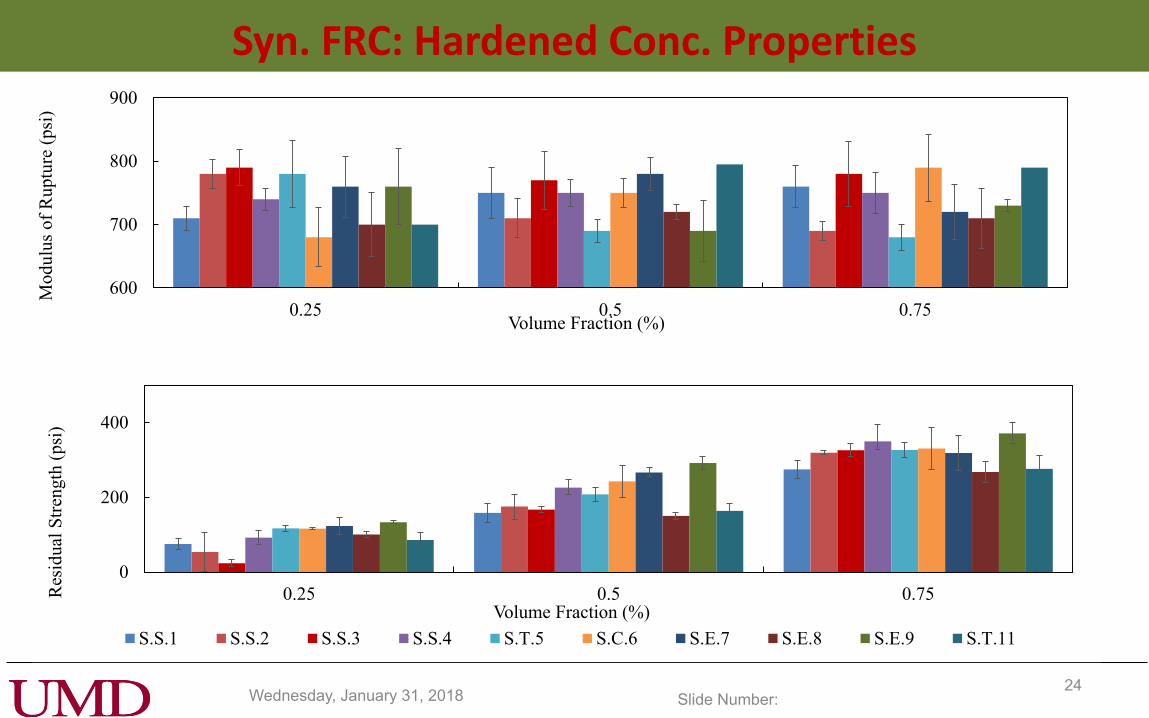
Syn. FRC: Hardened Conc. Properties
0
200
400
0.25 0.5 0.75Res
idu
al S
tren
gth
(p
si)
Volume Fraction (%)
S.S.1 S.S.2 S.S.3 S.S.4 S.T.5 S.C.6 S.E.7 S.E.8 S.E.9 S.T.11
600
700
800
900
0.25 0.5 0.75
Mod
ulu
s of
Ruptu
re (
psi
)
Volume Fraction (%)
Wednesday, January 31, 2018 Slide Number: 25
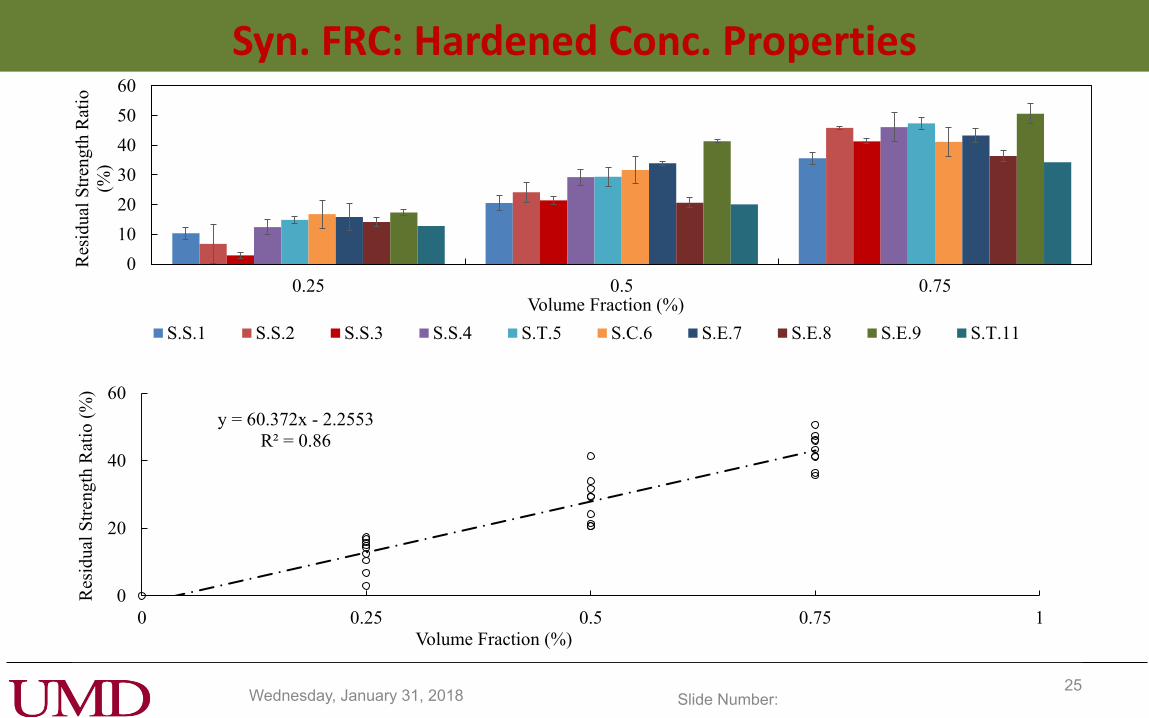
Syn. FRC: Hardened Conc. Properties
0
10
20
30
40
50
60
0.25 0.5 0.75
Res
idual
Str
ength
Rat
io
(%)
Volume Fraction (%)
S.S.1 S.S.2 S.S.3 S.S.4 S.T.5 S.C.6 S.E.7 S.E.8 S.E.9 S.T.11
y = 60.372x - 2.2553
R² = 0.86
0
20
40
60
0 0.25 0.5 0.75 1
Res
idual
Str
eng
th R
atio
(%
)
Volume Fraction (%)
Wednesday, January 31, 2018 Slide Number: 26
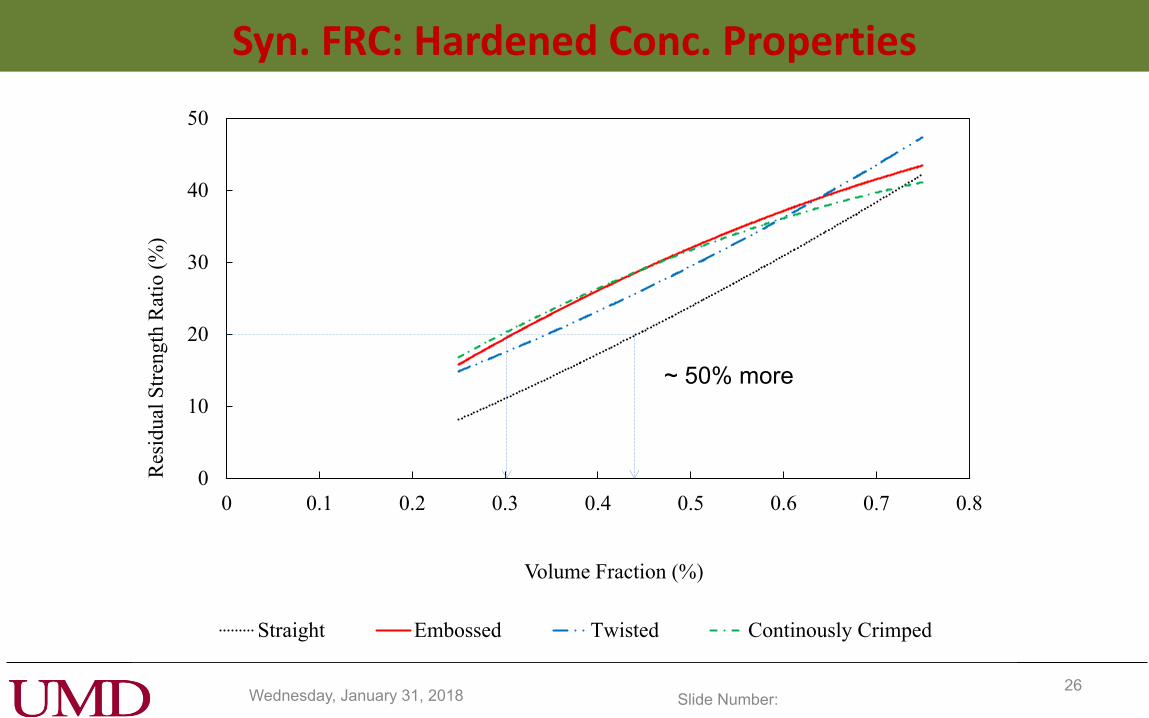
Syn. FRC: Hardened Conc. Properties
0
10
20
30
40
50
0 0.1 0.2 0.3 0.4 0.5 0.6 0.7 0.8
Res
idu
al S
tren
gth
Rat
io (
%)
Volume Fraction (%)
Straight Embossed Twisted Continously Crimped
~ 50% more
Wednesday, January 31, 2018 Slide Number: 27
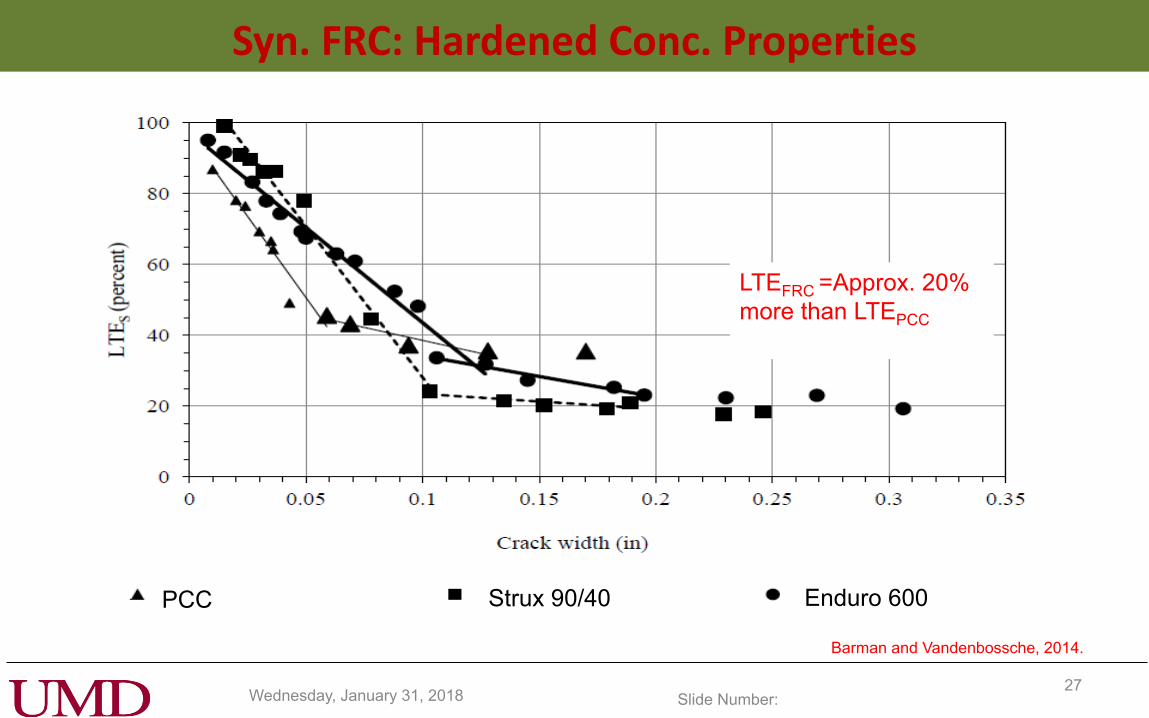
Syn. FRC: Hardened Conc. Properties
Barman and Vandenbossche, 2014.
Strux 90/40 Enduro 600
LTEFRC =Approx. 20%
more than LTEPCC
PCC
Wednesday, January 31, 2018 Slide Number: 28
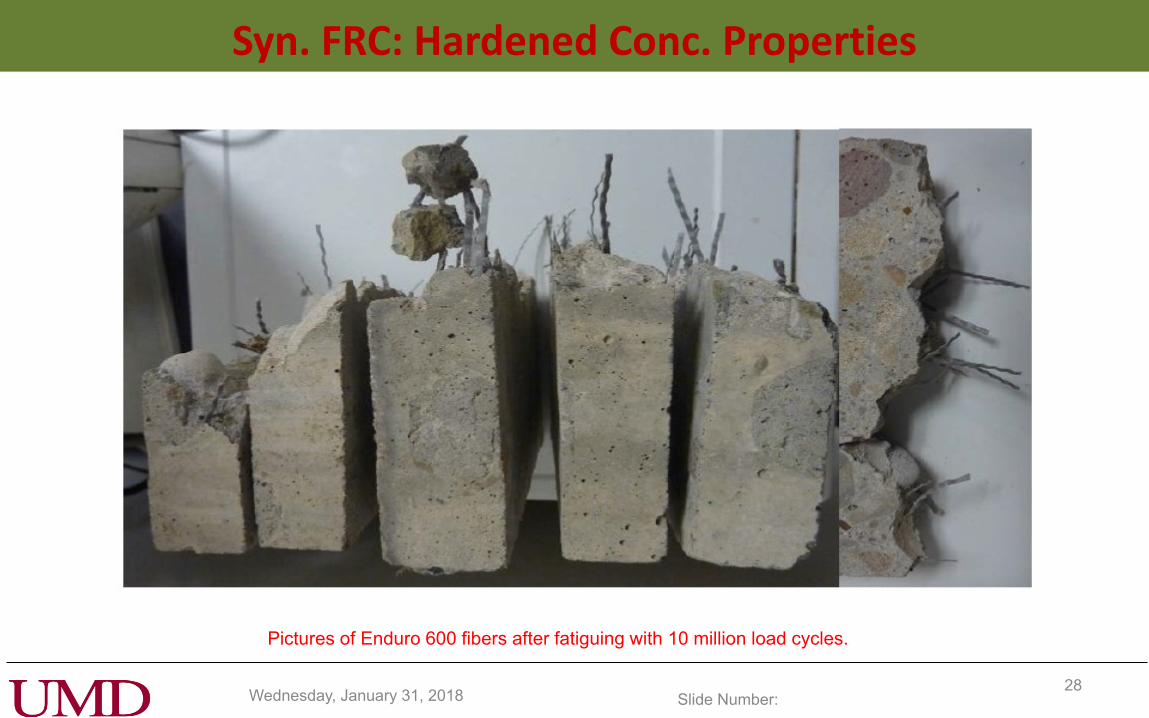
Syn. FRC: Hardened Conc. Properties
Pictures of Enduro 600 fibers after fatiguing with 10 million load cycles.
Wednesday, January 31, 2018 Slide Number: 29
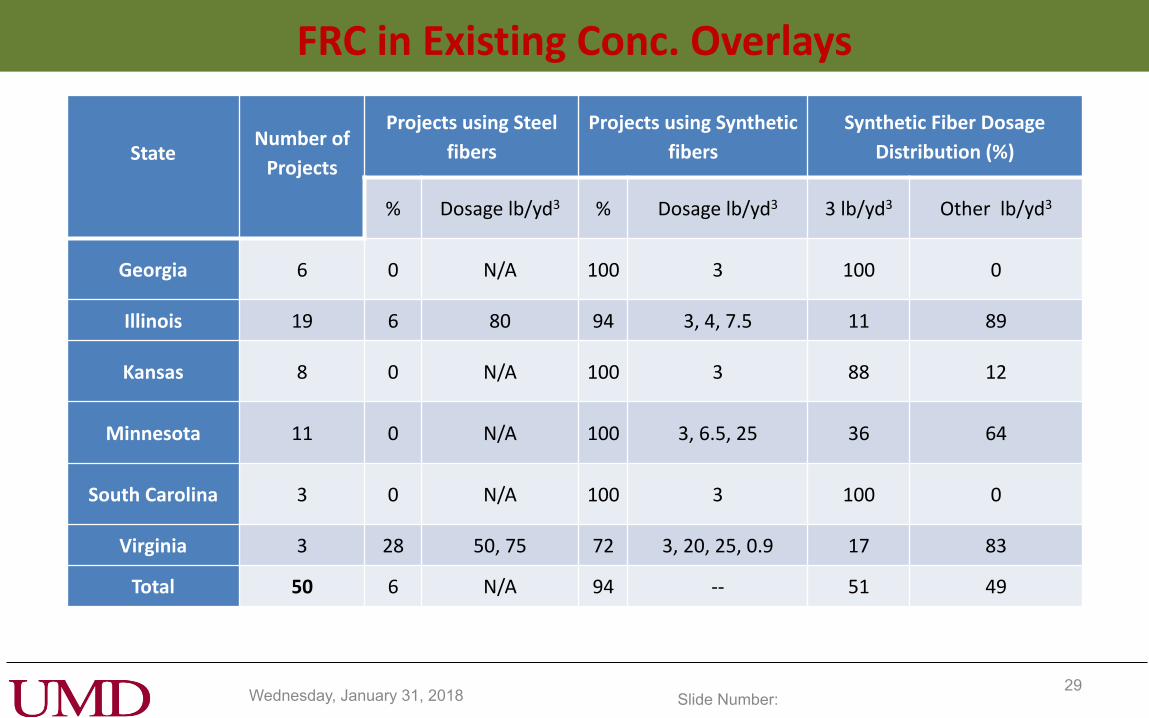
FRC in Existing Conc. Overlays
State
Number of
Projects
Projects using Steel
fibers
Projects using Synthetic
fibers
Synthetic Fiber Dosage
Distribution (%)
% Dosage lb/yd3 % Dosage lb/yd3 3 lb/yd3 Other lb/yd3
Georgia 6 0 N/A 100 3 100 0
Illinois 19 6 80 94 3, 4, 7.5 11 89
Kansas 8 0 N/A 100 3 88 12
Minnesota 11 0 N/A 100 3, 6.5, 25 36 64
South Carolina 3 0 N/A 100 3 100 0
Virginia 3 28 50, 75 72 3, 20, 25, 0.9 17 83
Total 50 6 N/A 94 -- 51 49

Wednesday, January 31, 2018 Slide Number: 30
FRC projects in other States State Project details Year
of
Const.
Traffic
(ADT)
Overlay
Thickness,
Inches
Fiber type
and dosage
(lb/yd3)
Distress data
Pennsylvania Intersection of State Route
(SR)-133 and SR-100, Chester
County
1988 36,079 4 Polypropylene, 3 N/A
Texas Intersections on LP-250 at
Wadley Road, Holiday Hill Road
and Midland Drive,
Midland
2005 26,650 3 Polypropylene, 3 A mid slab and corner cracks were
observed after one or two years of
construction which could be due to the
heavy traffic and wheel path adjacent to
the longitudinal joint.
Texas Intersection
of LP-250 at Midkiff Road and
Garfield Road, Midland
2001 25,000 3 Polypropylene, 3 N/A
New York Intersection at Waldon
Avenue and Central Avenue,
near Buffalo
2002 12,250 4 Polypropylene
fibers, N/A
Corner cracks along the free longitudinal
joints were found.
New York NY-408 and SH
-622, Rochester
2002 9,350 4 Polypropylene
fibers, N/A
Corner cracks along the free longitudinal
joints were found.
Michigan Patterson Avenue, from 44th
Street to 36th Street,
Kentwood
2006 31,891 4 fibrillated
polypropylene, 1.5
The overall performance of the project
found good; however, there are few
distress due to improper alignment of
edge of existing asphalt layer and the
joint between the white topping and full
depth widening.
Wednesday, January 31, 2018 Slide Number: 31
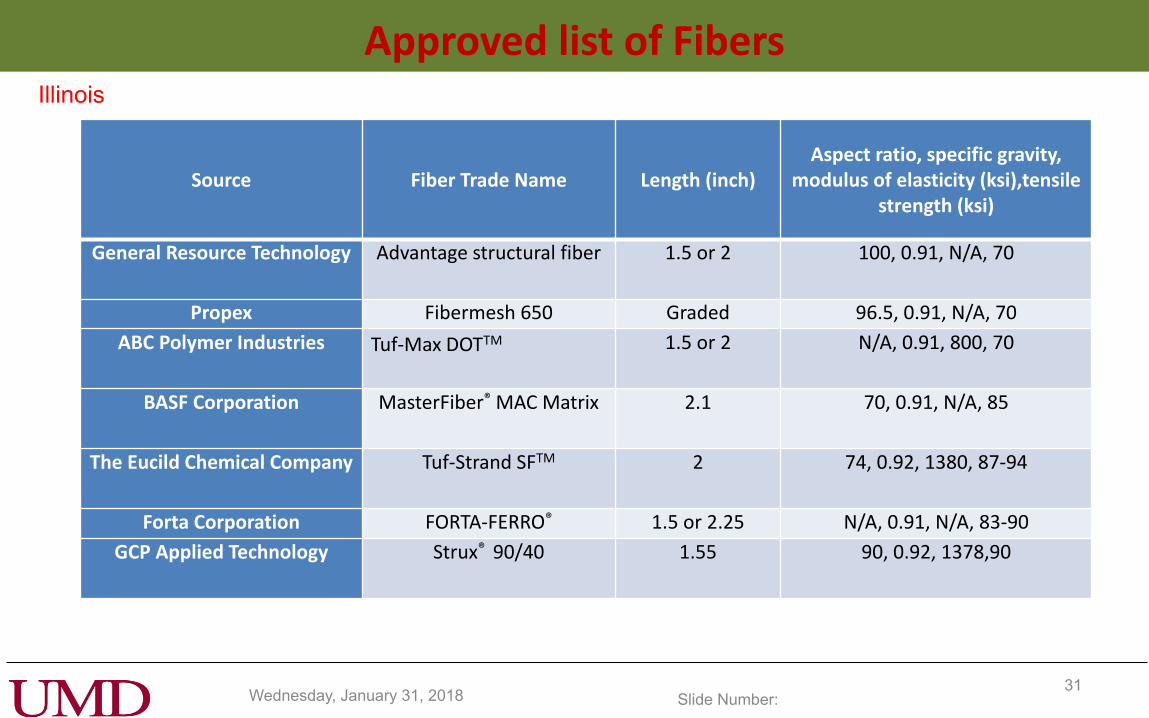
Approved list of Fibers
Source Fiber Trade Name Length (inch) Aspect ratio, specific gravity,
modulus of elasticity (ksi),tensile strength (ksi)
General Resource Technology Advantage structural fiber 1.5 or 2 100, 0.91, N/A, 70
Propex Fibermesh 650 Graded 96.5, 0.91, N/A, 70
ABC Polymer Industries Tuf-Max DOTTM 1.5 or 2 N/A, 0.91, 800, 70
BASF Corporation MasterFiber® MAC Matrix 2.1 70, 0.91, N/A, 85
The Eucild Chemical Company Tuf-Strand SFTM 2 74, 0.92, 1380, 87-94
Forta Corporation FORTA-FERRO® 1.5 or 2.25 N/A, 0.91, N/A, 83-90
GCP Applied Technology Strux® 90/40 1.55 90, 0.92, 1378,90
Illinois
Wednesday, January 31, 2018 Slide Number: 32
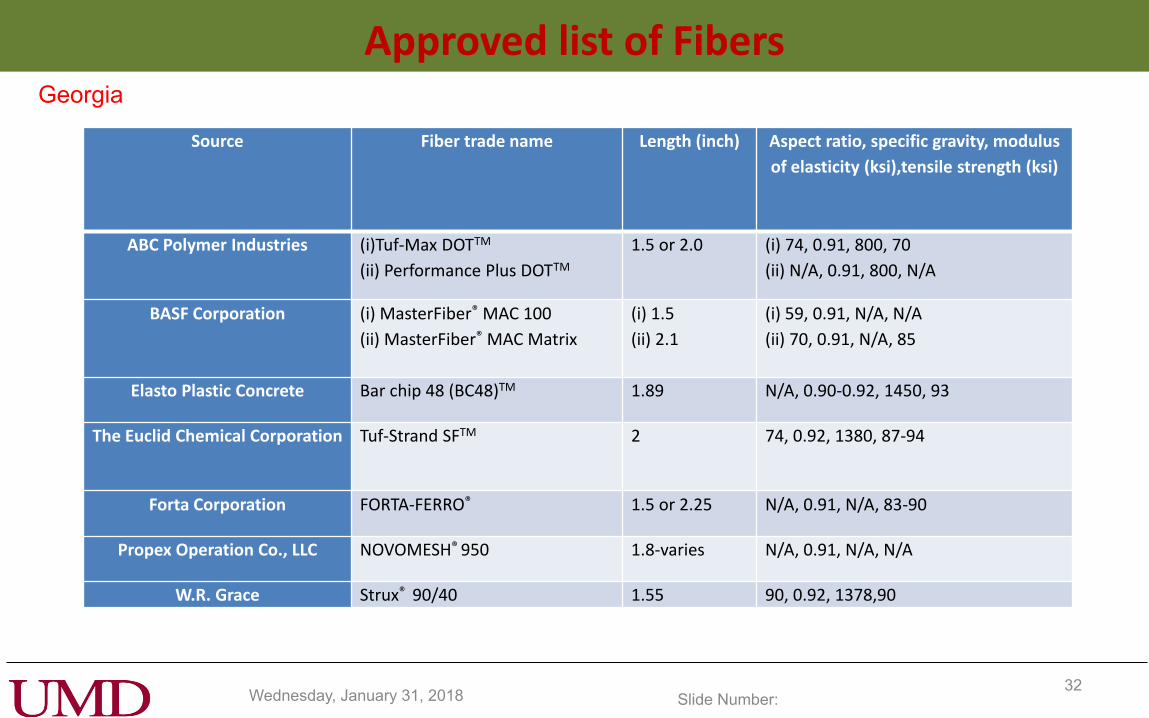
Approved list of Fibers Georgia
Source Fiber trade name Length (inch) Aspect ratio, specific gravity, modulus
of elasticity (ksi),tensile strength (ksi)
ABC Polymer Industries (i)Tuf-Max DOTTM
(ii) Performance Plus DOTTM
1.5 or 2.0 (i) 74, 0.91, 800, 70
(ii) N/A, 0.91, 800, N/A
BASF Corporation (i) MasterFiber® MAC 100
(ii) MasterFiber® MAC Matrix
(i) 1.5
(ii) 2.1
(i) 59, 0.91, N/A, N/A
(ii) 70, 0.91, N/A, 85
Elasto Plastic Concrete Bar chip 48 (BC48)TM 1.89 N/A, 0.90-0.92, 1450, 93
The Euclid Chemical Corporation Tuf-Strand SFTM 2 74, 0.92, 1380, 87-94
Forta Corporation FORTA-FERRO® 1.5 or 2.25 N/A, 0.91, N/A, 83-90
Propex Operation Co., LLC NOVOMESH® 950 1.8-varies N/A, 0.91, N/A, N/A
W.R. Grace Strux® 90/40 1.55 90, 0.92, 1378,90
Wednesday, January 31, 2018 Slide Number: 33
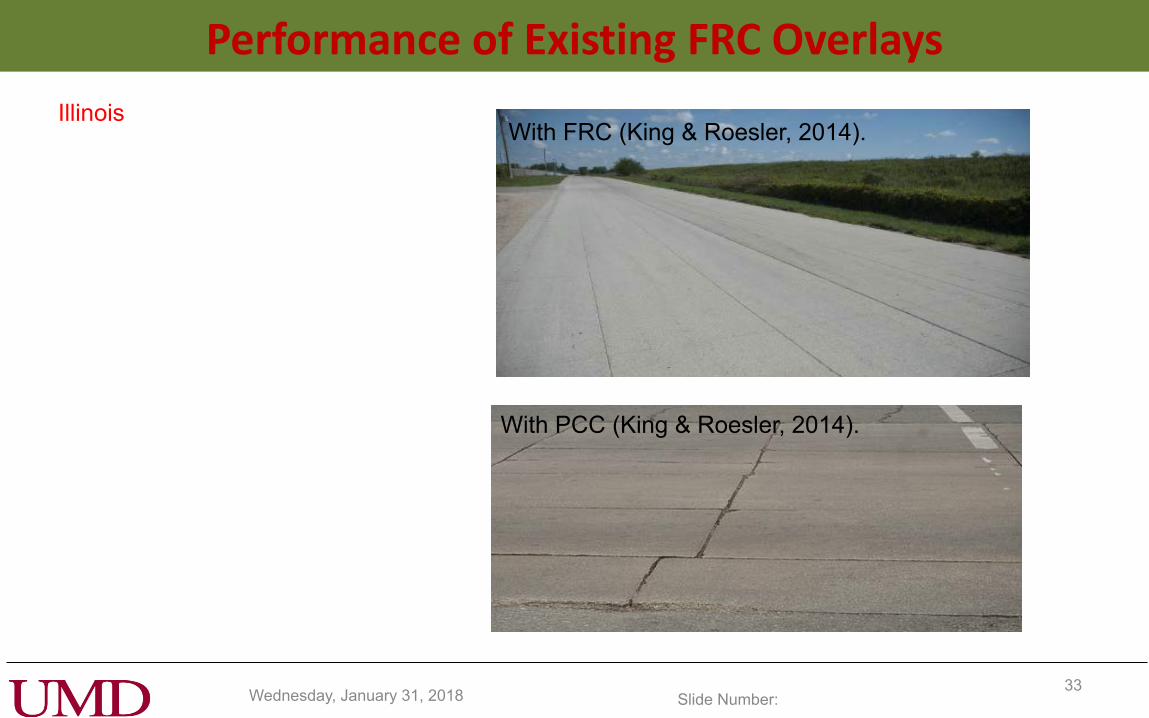
Performance of Existing FRC Overlays
With FRC (King & Roesler, 2014).
With PCC (King & Roesler, 2014).
Illinois
Wednesday, January 31, 2018 Slide Number: 34
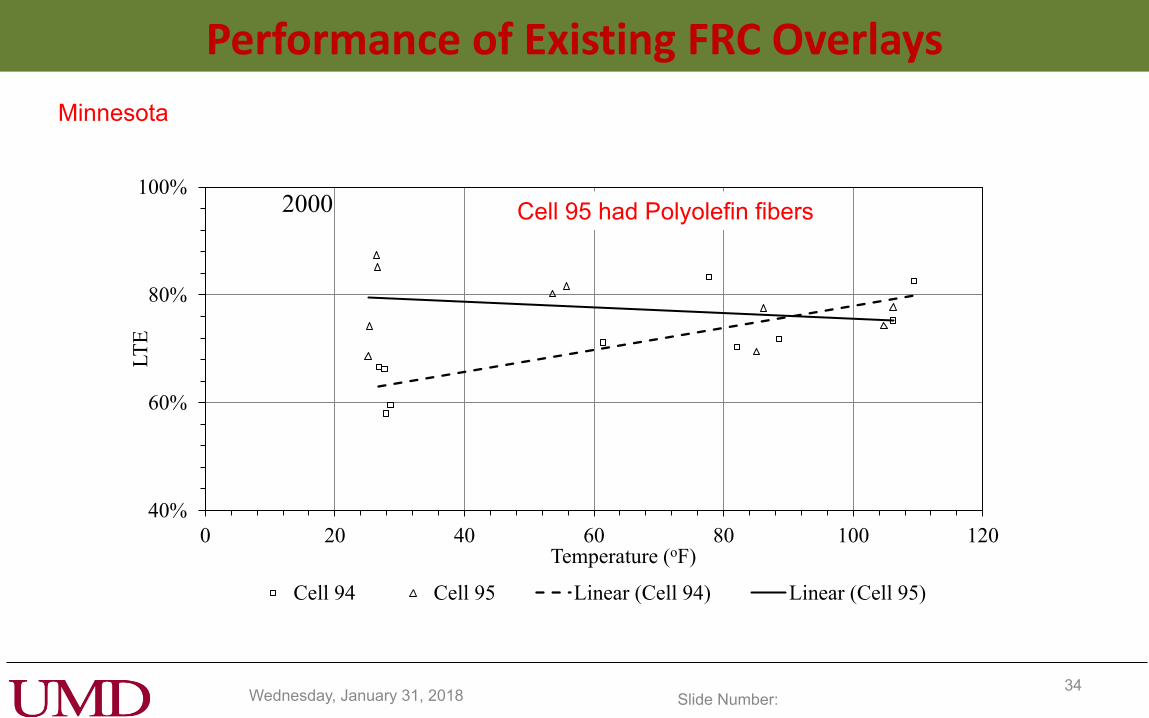
Performance of Existing FRC Overlays
Minnesota
40%
60%
80%
100%
0 20 40 60 80 100 120
LT
E
Temperature (oF)
2000
Cell 94 Cell 95 Linear (Cell 94) Linear (Cell 95)
Cell 95 had Polyolefin fibers
Wednesday, January 31, 2018 Slide Number: 35
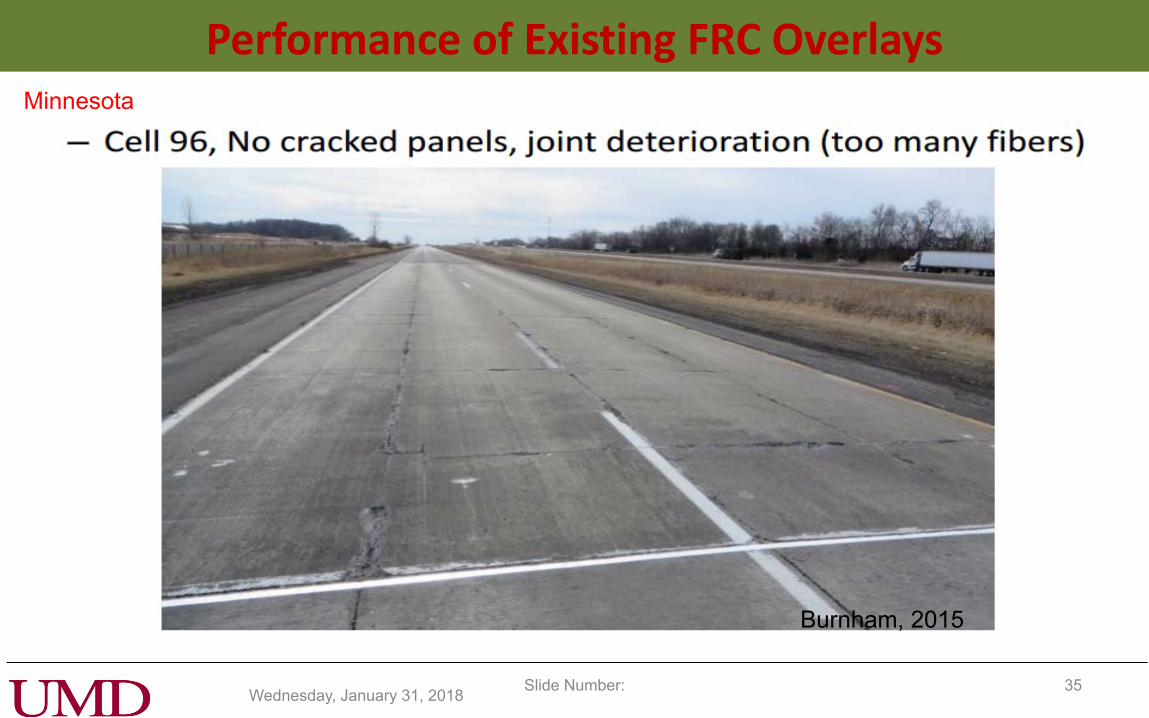
Burnham, 2015
Minnesota
Performance of Existing FRC Overlays
Wednesday, January 31, 2018 Slide Number: 36
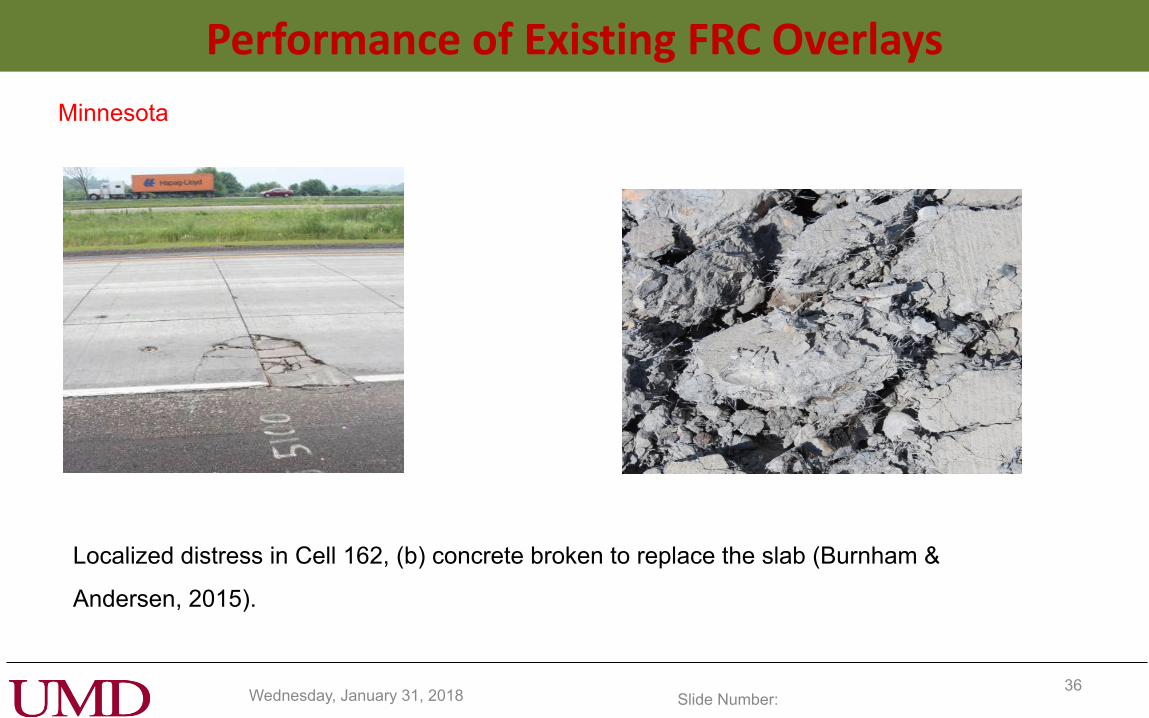
Minnesota
Localized distress in Cell 162, (b) concrete broken to replace the slab (Burnham &
Andersen, 2015).
Performance of Existing FRC Overlays
Wednesday, January 31, 2018 Slide Number: 37
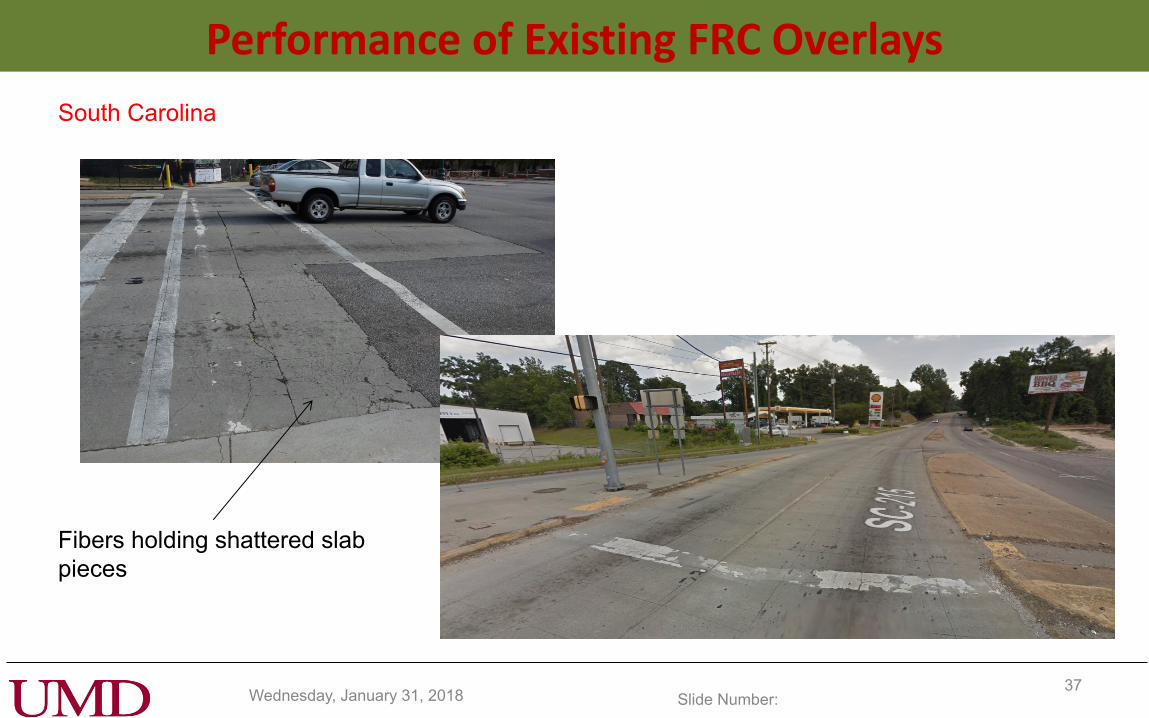
South Carolina
Fibers holding shattered slab
pieces
Performance of Existing FRC Overlays
Wednesday, January 31, 2018 Slide Number: 38
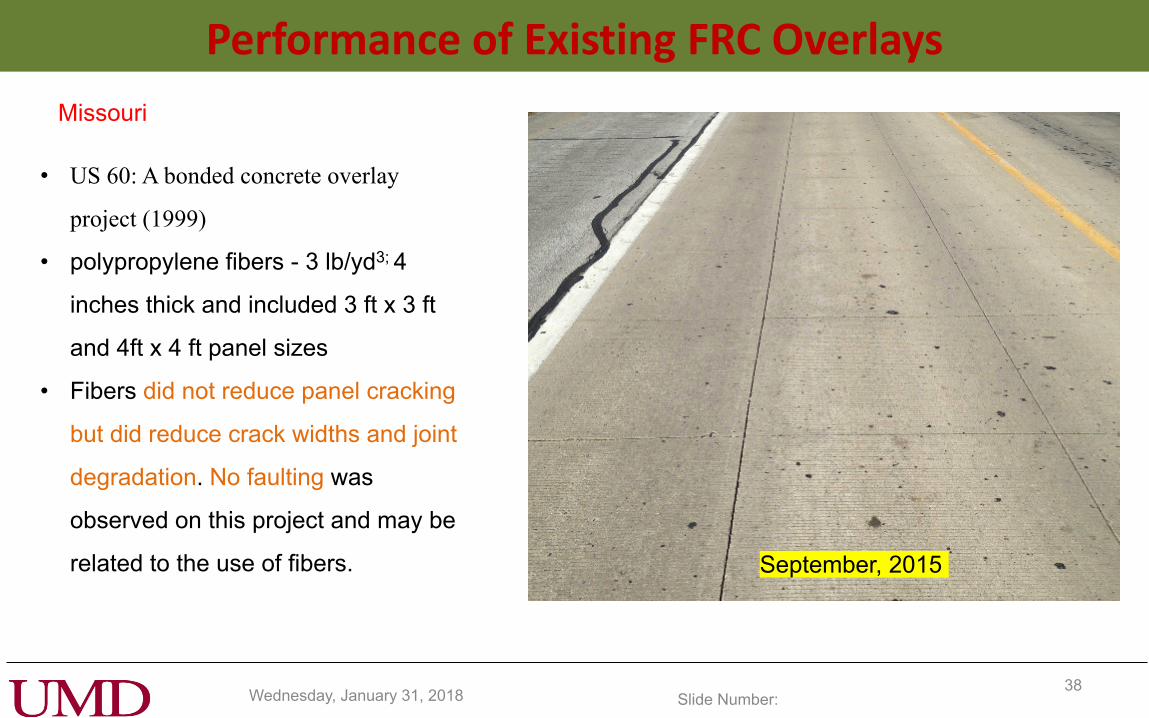
Performance of Existing FRC Overlays
Missouri
• US 60: A bonded concrete overlay
project (1999)
• polypropylene fibers - 3 lb/yd3; 4
inches thick and included 3 ft x 3 ft
and 4ft x 4 ft panel sizes
• Fibers did not reduce panel cracking
but did reduce crack widths and joint
degradation. No faulting was
observed on this project and may be
related to the use of fibers.
September, 2015
Wednesday, January 31, 2018 Slide Number: 39
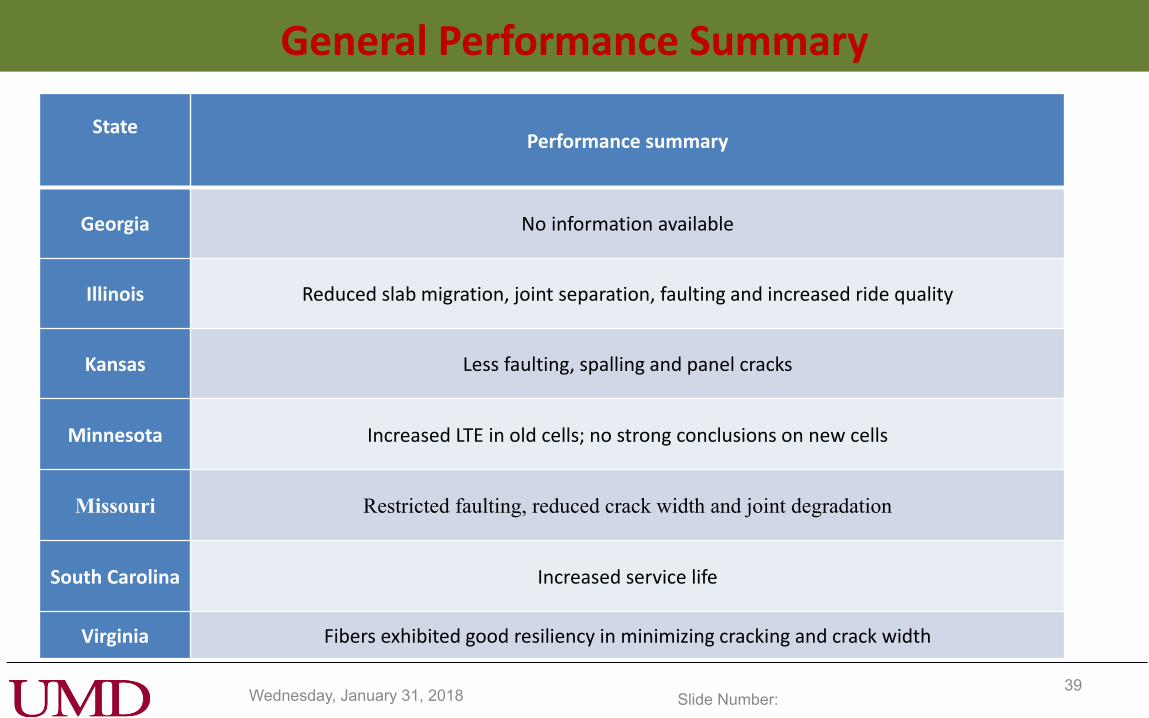
General Performance Summary
State
Performance summary
Georgia No information available
Illinois Reduced slab migration, joint separation, faulting and increased ride quality
Kansas Less faulting, spalling and panel cracks
Minnesota Increased LTE in old cells; no strong conclusions on new cells
Missouri Restricted faulting, reduced crack width and joint degradation
South Carolina Increased service life
Virginia Fibers exhibited good resiliency in minimizing cracking and crack width