Embed Size (px)
Citation preview
Performance Effects of Damage Arrestment Devices on Sandwich Composite Beams under
Monotonic Loading
A Senior Project
Presented to
the Faculty of the Aerospace Engineering Department
California Polytechnic State University, San Luis Obispo
In Partial Fulfillment
of the Requirements for the Degree
Bachelor of Science
by
Yvette Vanessa Wood
September 6, 2012
©2012 Yvette Vanessa Wood

1
Performance Effects of Damage Arrestment Devices on
Sandwich Composite Beams under Monotonic Loading
Yvette Vanessa Wood
California Polytechnic State University, Aerospace Engineering Department, San Luis Obispo, CA, 93405
Abstract
Face-core delamination has become a subject matter in the Aerospace industry, as it can
lead to early failure. In this study, sandwich composite beams are tested initially with no
delamination to obtain the ultimate strength. A second case of delamination in the center of
the beam in initialized to verify a decrease in ultimate strength. This experiment investigates
the performance effects of the addition of Damage Arrestment Devices (DADs), in composite
sandwich beams. The performance criterion is measured by strength in flexural loading test.
The objective of this project is to verify an increase in the strength and performance with the
addition of DADs in a sandwich composite. Theoretical and experimental results confirmed
that adding damage arrestment devices into the sandwich composite material increases the
loading capability of the structure.
Nomenclature
D = maximum deflection of the center of the beam
E = Youngs modulus
G = shear modulus
L = support span
M = resultant laminate moment
N = resultant laminate force
Q = reduced stiffness matrix
P = load at a given point on the load deflection curve, and d refers to the depth of the beam
R = rate of crosshead motion
S = maximum stress in the outer fibers occurs between the two central loading points
T = transformation matrix
Z = rate of straining of the outer fibers
b = width of the beam
d = depth of the beam
r = maximum strain in the outer fibers
z = incremental thickness
γ = shear strain
ε = strain
ν = Poissons ratio
σ = stress
τ = shear stress
θ = angle of rotation
subscripts
1 = primary horizontal axis
2 = primary vertical axis
k = kth
layer
2
I. Introduction
A. Introduction to Composite Materials
Composite structures, although new with regard to the aircraft industry, have been used in the construction of
shelters and buildings for thousands of years. When man began to build homes from mud, the builders eventually
found that adding straw to the mud created a much stronger structure. In more recent decades, steel bars (rebar) were
added to concrete structures in order to increase strength and reliability. Eventually, the findings of simple
composite applications have led to the development of modern composites and their application to advanced
airframe design
Modern composites owe their roots to the years spent manufacturing concrete and steel buildings, the
development of the glass fiber-polyester composites, wood working, and to nature. Composite materials exist in
nature almost everywhere and one of the best examples is wood. The grain seen in wood is strong in tension while
the supporting matrix of lignin is strong in compression. The tendency to have different material properties with and
against the grain is not only a characteristic of wood but as well of modern composites. 1
B. Advantages and Disadvantages of Composite Materials
The dilemma, which plagues design teams when considering composites, is deciding whether the advantages
outweigh the disadvantages. Composites are extremely versatile in that they can be designed and manufactured to
the material properties specific to a given application. Additionally, composites are able to reduce total airframe
weight by significant amounts, which in turn allow aircraft to travel farther and faster. However, because
composites require meticulous fabrication and quality control, the cost of composites is much higher than traditional
aircraft materials. Furthermore, the cost of maintenance also is much higher for composites. Thus, composite
materials are only used for aircraft design when specific material properties are needed or airframe weight is driving
the design.1
C. Advanced Composite Materials
The composites being used today for airframes are considered advanced composite materials. Advanced
composites consist of high modulus, continuous fibers like carbon and boron and an essentially homogenous
matrix.2 A basic example of a composite material is fiberglass, which uses glass fibers and an epoxy resin to create a
high strength composite used in everyday applications. Composite fibers are primarily used as reinforcement to the
surrounding matrix. Generally, reinforcement fibers consist of three types: organic fibers, ceramic fibers, and
metallic fibers. Organic fibers offer high strengths for very light weights (i.e. glass, graphite carbon, etc.). Ceramic
fibers are used when the material needs to withstand high temperatures and insulate against heat. Examples of
ceramic fibers are quartz, silicon carbide, alumina, etc. Last, metallic fibers allow the composite to conduct or
dissipate heat and electricity.1
D. Types of Matrix Materials
In addition to the fiber structure, the composite material requires a matrix to hold fibers in place. The matrix is
perhaps the most important part of the composite material because it not only keeps the fibers in the desired
location, but it also protects the fibers from moisture and chemical corrosion. This can lead to embrittlement and
premature failure. It is important to keep the fibers in the designed origin because they will be able to more
effectively bear the applied loads. Furthermore, the matrix also resists against crack propagation and provides all
the interlaminar shear strength of the composite. Ultimately, the matrix decides many important design parameters
for the composite. For example, the matrix type determines the compressive strength, shear, operating temperature
and the fabrication process. Matrices are either made from organic or non-organic materials. Organic matrices are
split up into two categories: thermoset and thermoplastic.
Thermoset matrices have recently been dominating the composite market because of their versatility. Most
importantly, thermoset matrix based composites can be formed into complex shapes while still providing very high
strengths. Thermoset composites are used in airframe design for primary structures. A thermoset matrix has many
distinct properties. During the long curing process the thermoset undergoes a chemical change, making the process
irreversible. Additionally, thermosets have low viscosity and a tacky prepreg. The advantages to using a thermoset
are their low processing temperature, low viscosity, good fiber wetting, and complex shaping. In contrast, the long
processing time, restricted storage and required refrigeration all hinder the use of thermosets. Types of thermosets
used in airframe design are epoxies, polyester, phenolics, bismaleimide, and polymides.2 The epoxy family is the
most widely used thermoset matrix system in the advanced composite field, but it’s low resistance to high
temperature variations restricts the use in aerospace applications, where high service temperatures are required.

3
Epoxy matrices are most useful for use with glass, carbon/graphite, boron, and aramid. Currently, the development
of more advanced epoxies is being done to accommodate increasing requirements. Epoxies that have been
unmodified are usually brittle and modification is necessary to increase its damage resistance, which results in a
toughened epoxies. The versatility of epoxy is advantageous; however, environmental hazards can have detrimental
effects on the matrix such as: temperature, moisture, fuel, cleaning agents, and ultraviolet light. These hazards
completely eliminate the demand for epoxy for the use on external aircraft pieces.
If the composite structure is in need of a more flexible organic matrix, thermoplastics may be the type to choose.
Thermoplastics are non-reacting (meaning no curing), can be reprocessed, are high viscosity, and have the ability to
endure short processing times. Furthermore, thermoplastics come with the advantages of having superior toughness,
reusable excess, reformable parts, rapid (low cost processing), infinite shelf life, and high delamination resistance.
The disadvantages to thermoplastics consist of a high processing temperature requirement, a smaller resistance to
chemical solvents, a limit in the amount of processing experience, and a small database. Generally, thermoplastic
composites have been used for non-structural airframe components.2
Non-organic matrices (metals, carbon, and ceramic materials), have not seen much progression in the past years
because of their high cost and limited applications. Types of metal matrices are aluminum, titanium, magnesium,
and copper. All metal matrices have high fracture resistance. Carbon matrix structures (carbon/carbon) are often
used in areas subjected to very high temperatures such as aircraft breaks, rocket nozzles, rocket nose cones, and jet
engine turbine wheels. Remarkably, the strength of the composite increases as the temperature rises. Ceramic
composites are generally characterized as having high melting points, high compressive strength, and excellent
resistance to oxidation. Like carbon/carbon composites, ceramic composites are also used for aircraft brakes.
Another advantage to ceramics is their ability to be made from performs which reduce the amount of post-machining
necessary to complete the part. However, ceramics are susceptible to moderate tension, impacts and thermal
shocks.1
E. Types of Fiber Materials
Once the designer has chosen a composite, the next step is to choose the type of material form to use. Material
forms are divided into two subgroups: staple and continuous. The staple orientation includes random orientation or
preferred orientation. Continuous forms include uni-tapes, woven fabrics (as shown in Figure 1), pre-forms, etc.
Most forms can be obtained either dry or preimpregnated with the desired matrix. Dry forms require some method of
applying matrix during the lay-up process, whereas
the prepreg forms require no additional matrix
application. Uni-tape forms are advantageous in that
they have flexibility in design and maximum
structural properties; however, they have poor
drapability and can lead to possible fiber
misalignment. Woven fabrics provide good drapability
and are least costly in the lay-up cost. The
disadvantages to woven fabrics are that there are
losses in properties due to cimping in the fiber and are
less flexible in design. Pre-plied fabrics and stitched
fabrics are similar and that they have reduced lay-up
costs while having a loss in design flexibility.
Furthermore, they allow for resin injection modling
and provide exceptional fiber stability needed for
pultrusion. Unidirectional fabrics, as tested in the
experiment, provide improved drapability, fiber
alignment, and minimal reductions in fiber strength.
With only one disadvantage for unidirectional fibers,
having a slight weight penalty, the variety of advantages outweighs the one disadvantage and lead to a great form.
F. Fabrication Methods
In addition to knowing the types of composite materials and forms, the fabrication process types are also
important to note. All composite manufacturing follows the same general process plus or minus a few steps
depending on the type of composite. Regardless, the process starts with material selection and material batch
acceptance. Then the composite is laid up based on the type of composite. The lay-up process can be broken up
into three types: Wet lay-up, draw, and pre-preg. Wet lay-up is a method where the reinforced product is made by
Figure 1. Woven carbon fiber is just one of the many
types of composite forms.2

4
introducing the matrix as a liquid to the reinforcing fibers. The draw lay-up method uses a vacuum to distribute the
liquid matrix throughout the fibers; thus, increasing the likelihood of the matrix being more evenly distributed. Last,
pre-preg lay-ups come ready to be molded and cured. Pre-pregs are great for basic projects and batch testing;
however, they create a storage problem, as they must be kept in a freezer.3
G. Composite Laminates
Furthermore, it is pertinent to understand the concept of a composite laminate. A laminate is a bonded stack of
laminae, where the fibers can be oriented symmetrically about the middle surface or antisymmetrically about the
middle surface of the laminate. The purpose of lamination is to tailor the directional dependence of strength and
stiffness of a composite material to match the loading environment of the structural element. Laminates are suitable
for this purpose because the principal material directions of each layer can be oriented according to need. For
example, to obtain an extensional stiffness far higher in one direction than the other, half of the layers in a laminate
would be oriented in a ninety direction from the other half of the layers in the laminate. Symmetry about the middle
surface of a laminate is often desirable to avoid coupling between bending and extension. In order to achieve
particular design requirements, the use of unsymmetrical laminates is necessary. This is true especially for a form of
coupling necessary to make jet turbine fan blades with pre-twist without the use of a complex mold. Anti-symmetric
laminates must have an even number of layers if adjacent laminae also have altering signs of the principal material
property directions with respect to the laminate axes. If the adjacent laminae do not have altering signs, this is not
necessary and the number of layers do not have to be even. A common type of an antisymmetric laminate is a cross-
ply antisymmetric laminate which consists of an even number of orthotropic laminae laid on each other with
principal material directions alternating at zero degrees and ninety degress to the laminate axes. A more complicated
cross-ply laminate is one where the adjacent layers do not always have an alternating sequence of zero and ninety
degrees. A regular antisymmetric angle ply laminate has all laminae with equal thickness and is common because of
the simplicity of fabrication. As the number of layers increases, the coupling stiffness will approach zero. A less
common type of an antisymmetric laminate is that of an angle-ply laminate. This type has laminae oriented at +α
degrees to the laminate coordinate axes on one side of the middle surface and the corresponding equal-thickness
laminae oriented at –α degrees on the other side at the same distance from the middle surface. A more complicate
version will include mixed materials with mixed lamination angles. A regular antisymmetric angle-ply laminate has
laminae all of the same material and thickness for ease of fabrication. As the number of layers in the laminate
increases the bending-extension coupling stiffnesses will approach zero. Overall, asymmetric laminates are the more
general class of laminate, where lack of symmetry often occurs by design as in deliberately constructing a non-
symmetric laminate. Further, often symmetric laminates subjected in service to heating from one side so that the
resulting thermal gradient acting on the temperature dependent material properties renders the laminate
unsymmetric.3
H. Composite Sandwich Structures and Damage Arrestment Devices (DADs)
The sandwich structure composite is a layered composite formed by the bonding of two thin facings to a
lightweight, but thick core. The core material is normally a low strength material, but its higher thickness provides
the sandwich composite with high bending stiffness with overall low density. The basic design concept of the
sandwich composite is to space strong, thin facings far enough apart to achieve a high ratio of stiffness to weight;
the light weight core that does this also provides the required resistance to shear and is strong enough to stabilize the
facings to their desired configuration through a bonding medium such as an adhesive layer. The sandwich is very
much analogous to an I-beam. Like the I-beam, a sandwich core panel consists of strong skins bonded to a core.
The skins are subject to tension/compression and are largely responsible for the strength of the ‘sandwich’. The
function of the core is to support the skins so that they do not buckle and stay fixed relative to each other. The core
experiences mostly shear stresses as well as some degree of vertical tension and compression. Its materials and
properties determine the stiffness of such a panel. Unlike the simple beam, which is designed to withstand the
stresses mostly along the x-axis and bending about the y axis, the sandwich panel can be stressed along and about
any axis lying in the x-y plane. The implication is that such a panel can extend ‘infinitely’ forming a strong and
continuous self-sustaining plate or shell. No reinforcing elements are needed because they are already built in the
structure.
This study outlines the fabrication, testing, and analysis of strips. The strips fabricated during this experiment
were in study of a DAD. Performance of mechanical systems is determined by many parameters, one of which is
stiffness. Current studies of a damage arrestment device have been determined to increase stiffness and prevent
failures due to delamination in composite structures. The goal of the DAD is to retain stiffness even after
delamination occurs. The DAD continues to be studied; however, the performance of the DAD under four point
5
bending, impact, and structural dynamics remains unknown. This study intends to make efforts in development of a
foam core utilizing the DAD to increase stiffness and studying the effects of four point bend testing. The results of
the study may lead to new applications in design to be introduced to composite structures. However, many more
tests and investigations remain to qualify the use of a DAD. The current studies of fabrication and analysis of the
DAD will serve as a foundation for future work utilizing the DAD. Future studies include research of the DAD
when used in application of industry products, such as a wing. The idea of the DAD can be expanded to any
composite structure and may serve as an important design factor for future products in a variety of fields.
I. Experimental Objective
The main objective for the experiment was to gain information on sandwich structured composites with and
without the addition of DADs under monotonic loading. Through my thesis, I will continue to investigate the effects
of DADs in composite sandwiches, particularly after the specimen has been impacted. The effects of DADs on a
simple sandwich composite, as shown in this study, needed to be evaluated as a basis to compare results for impact
testing.
II. Mechanical Characteristics: Fabrication and Testing
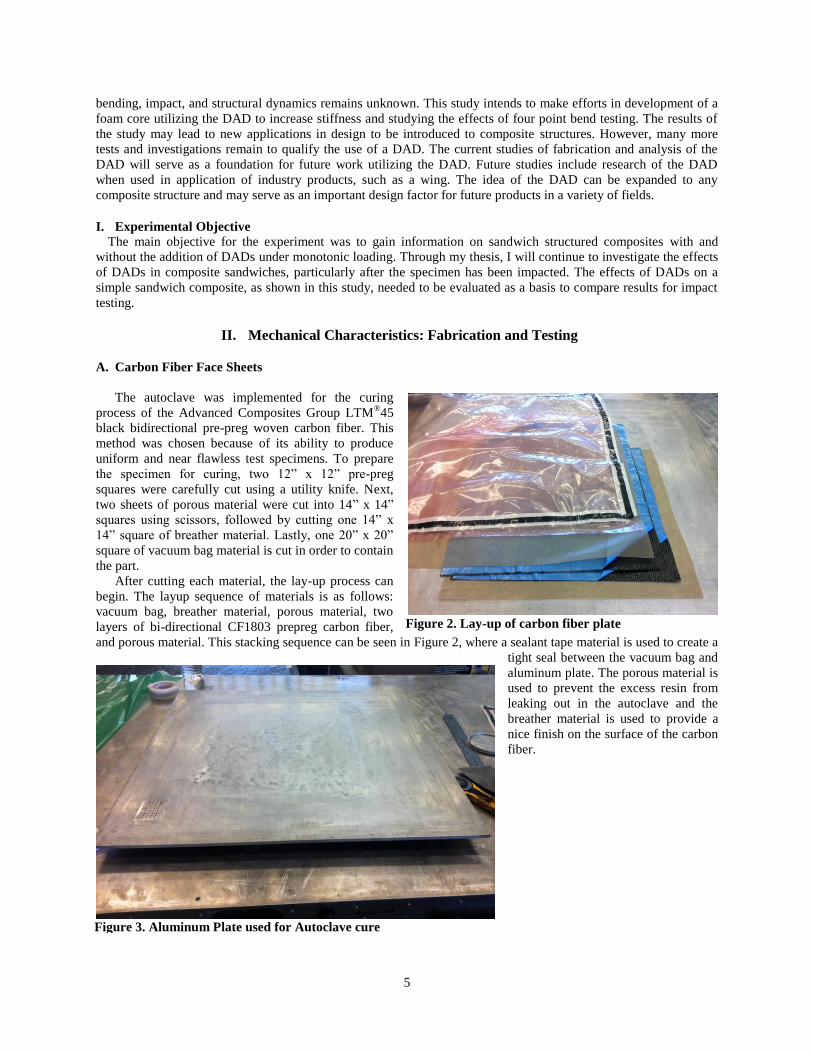
A. Carbon Fiber Face Sheets
The autoclave was implemented for the curing
process of the Advanced Composites Group LTM®45
black bidirectional pre-preg woven carbon fiber. This
method was chosen because of its ability to produce
uniform and near flawless test specimens. To prepare
the specimen for curing, two 12” x 12” pre-preg
squares were carefully cut using a utility knife. Next,
two sheets of porous material were cut into 14” x 14”
squares using scissors, followed by cutting one 14” x
14” square of breather material. Lastly, one 20” x 20”
square of vacuum bag material is cut in order to contain
the part.
After cutting each material, the lay-up process can
begin. The layup sequence of materials is as follows:
vacuum bag, breather material, porous material, two
layers of bi-directional CF1803 prepreg carbon fiber,
and porous material. This stacking sequence can be seen in Figure 2, where a sealant tape material is used to create a
tight seal between the vacuum bag and
aluminum plate. The porous material is
used to prevent the excess resin from
leaking out in the autoclave and the
breather material is used to provide a
nice finish on the surface of the carbon
fiber.
Figure 2. Lay-up of carbon fiber plate
Figure 3. Aluminum Plate used for Autoclave cure
6
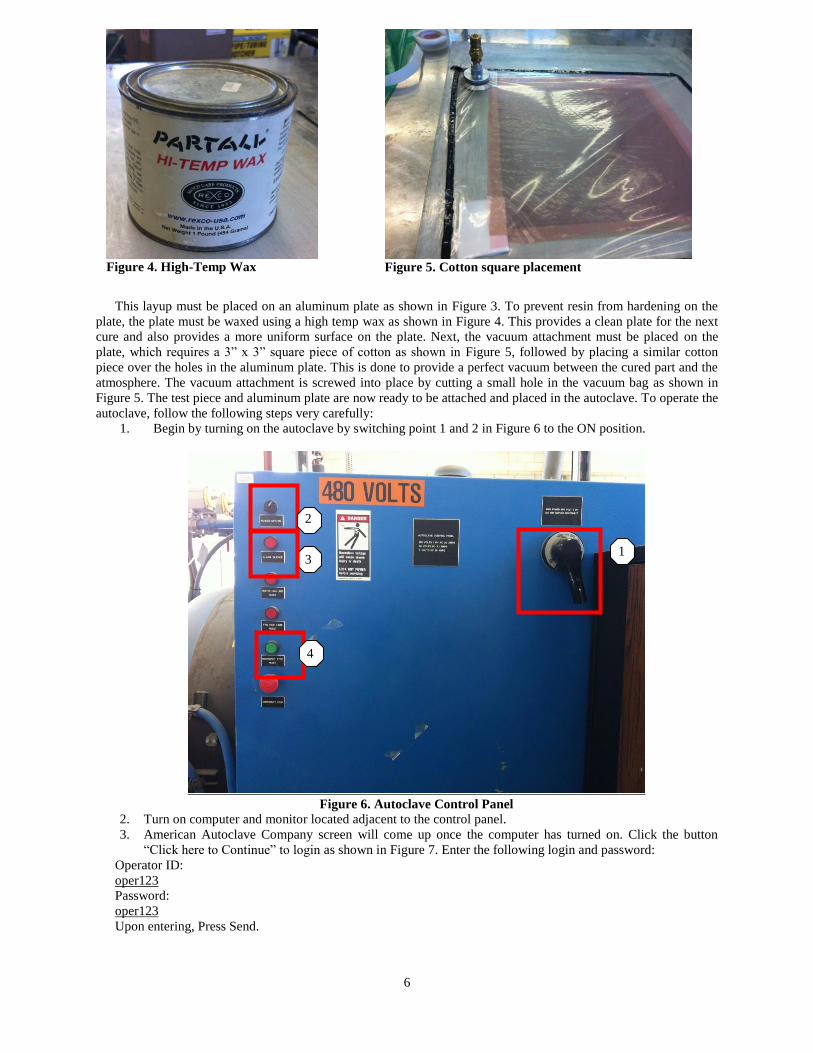
This layup must be placed on an aluminum plate as shown in Figure 3. To prevent resin from hardening on the
plate, the plate must be waxed using a high temp wax as shown in Figure 4. This provides a clean plate for the next
cure and also provides a more uniform surface on the plate. Next, the vacuum attachment must be placed on the
plate, which requires a 3” x 3” square piece of cotton as shown in Figure 5, followed by placing a similar cotton
piece over the holes in the aluminum plate. This is done to provide a perfect vacuum between the cured part and the
atmosphere. The vacuum attachment is screwed into place by cutting a small hole in the vacuum bag as shown in
Figure 5. The test piece and aluminum plate are now ready to be attached and placed in the autoclave. To operate the
autoclave, follow the following steps very carefully:
1. Begin by turning on the autoclave by switching point 1 and 2 in Figure 6 to the ON position.
Figure 6. Autoclave Control Panel
2. Turn on computer and monitor located adjacent to the control panel.
3. American Autoclave Company screen will come up once the computer has turned on. Click the button
“Click here to Continue” to login as shown in Figure 7. Enter the following login and password:
Operator ID:
oper123
Password:
oper123
Upon entering, Press Send.
2
1 3
4
Figure 4. High-Temp Wax
Figure 5. Cotton square placement

7
Figure 7. Start-up page
4. Once logged in, go to “Alarm Screen” and clear all errors. Press “Man in autoclave reset” button on alarm
screen. Alarm will siren and press “Alarm Silence” as seen in Figure 6 at point 3. Following, press “Alarm
Reset” as shown in Figure 6 at point 4. This will cause an automatic logout from the computer program.
5. Login in similarly to procedure in step 3.
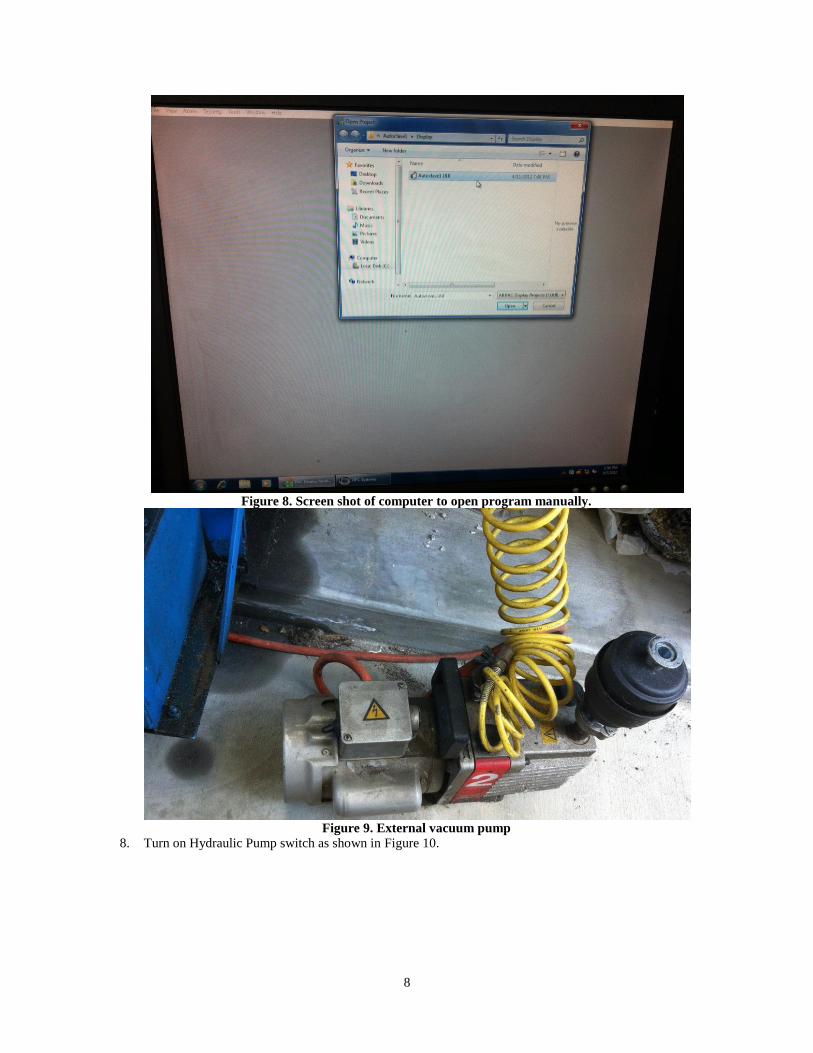
6. Once logged in, there will be a grey screen. To bring program back up, go to File->Open Project-
>AutoClave1.UII->Open as shown in Figure 8. This will allow for control of the autoclave through the
computer.
7. We can now place the part in the autoclave and begin the external vacuum.
External vacuum:
Turn Valve 1 on (On position will be turning the valve handle towards operator), followed by turning on
Vacuum 1(external vacuum as shown in Figure 9 )
Note: Valve 1 and 2 can both be turned on, but each vacuum correlating must also be turned on, e.g. If
Valve 2 is turned on, Vacuum 2 must also be turned on. There are two gauges that correlate to each valve to
monitor the pressure. [Gage 1 is on the left, Gage 2 is on the right]
8
Figure 8. Screen shot of computer to open program manually.
Figure 9. External vacuum pump
8. Turn on Hydraulic Pump switch as shown in Figure 10.

9
Figure 10. Hydraulic Pump Switch
9. Pull handle as shown in Figure 11 to open position.
Figure 11. Black handle to open autoclave door
10. Open door using black handle, shown in Figure11, until a “screeching” sounds is made which means it is
free to open- This means Stop! (Instructions are located on a black plate) ↑ To Open ↓ To Lock
11. Pull Autoclave door open and place desired part in chamber as shown in Figure 12 and 13. Hook up each
hose to part, one for the external vacuum and the other for the internal. Part should begin to vacuum and
check for any leaks in the vacuum bag. Once this has been achieved the autoclave door can be closed.

10
Figure 12. Inside look of Autoclave
Figure 13. Part inside autoclave with hoses attached
12. Close door and to lock push down on black handle until a “screeching” sounds is made which means it has
locked- This means Stop! (Instructions are located on a black plate) ↑ To Open ↓ To Lock
13. Use black handle mentioned in step 10 to lock the door by pulling the handle to the right into the lock
position, where you can see a locking mechanism (Pin is in place).
14. Turn off hydraulic pump
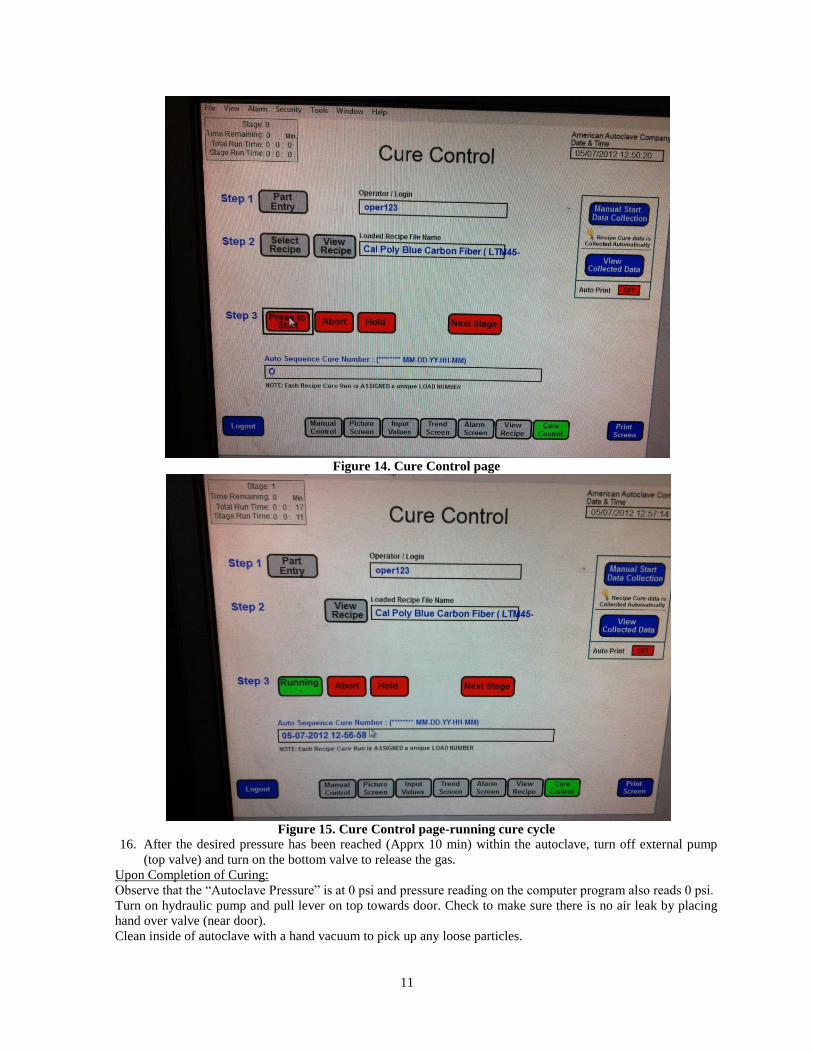
15. Return to computer screen. Upon entering program, select “Cure Control” as seen in Figure 14, followed by
“Select Recipe”. Once the desired recipe has been selected, select “Press to start” shown in Figure 14 on
the prompt screen. The cure cycle will now begin and the “Push to start” button should change to
“Running” as shown in Figure15.
11
Figure 14. Cure Control page
Figure 15. Cure Control page-running cure cycle
16. After the desired pressure has been reached (Apprx 10 min) within the autoclave, turn off external pump
(top valve) and turn on the bottom valve to release the gas.
Upon Completion of Curing:
Observe that the “Autoclave Pressure” is at 0 psi and pressure reading on the computer program also reads 0 psi.
Turn on hydraulic pump and pull lever on top towards door. Check to make sure there is no air leak by placing
hand over valve (near door).
Clean inside of autoclave with a hand vacuum to pick up any loose particles.
12
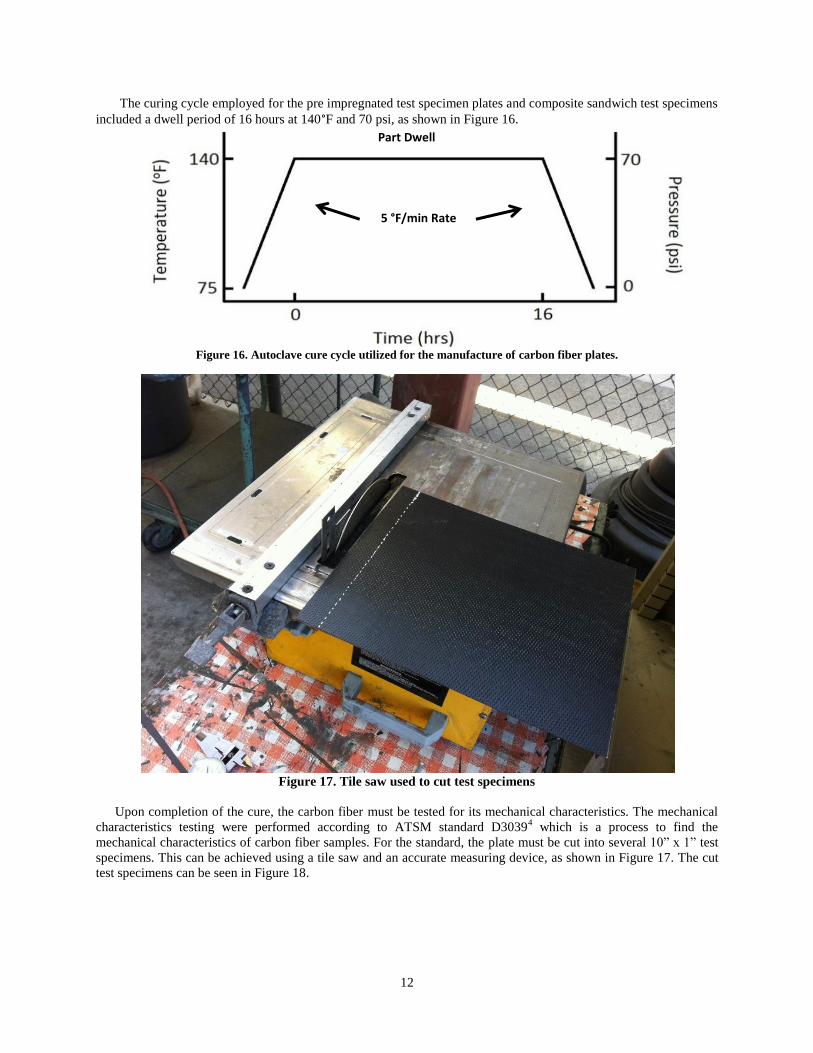
The curing cycle employed for the pre impregnated test specimen plates and composite sandwich test specimens
included a dwell period of 16 hours at 140°F and 70 psi, as shown in Figure 16.
Figure 16. Autoclave cure cycle utilized for the manufacture of carbon fiber plates.
Figure 17. Tile saw used to cut test specimens
Upon completion of the cure, the carbon fiber must be tested for its mechanical characteristics. The mechanical
characteristics testing were performed according to ATSM standard D30394 which is a process to find the
mechanical characteristics of carbon fiber samples. For the standard, the plate must be cut into several 10” x 1” test
specimens. This can be achieved using a tile saw and an accurate measuring device, as shown in Figure 17. The cut
test specimens can be seen in Figure 18.
5 °F/min Rate
Part Dwell
13
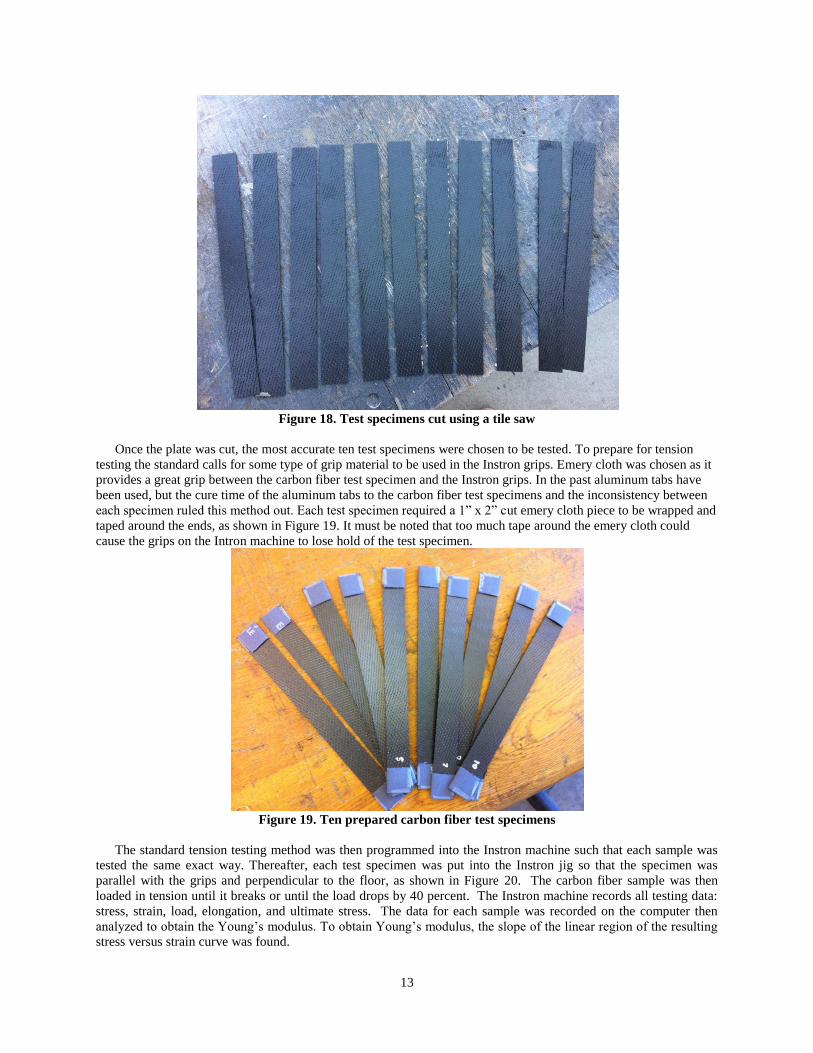
Figure 18. Test specimens cut using a tile saw
Once the plate was cut, the most accurate ten test specimens were chosen to be tested. To prepare for tension
testing the standard calls for some type of grip material to be used in the Instron grips. Emery cloth was chosen as it
provides a great grip between the carbon fiber test specimen and the Instron grips. In the past aluminum tabs have
been used, but the cure time of the aluminum tabs to the carbon fiber test specimens and the inconsistency between
each specimen ruled this method out. Each test specimen required a 1” x 2” cut emery cloth piece to be wrapped and
taped around the ends, as shown in Figure 19. It must be noted that too much tape around the emery cloth could
cause the grips on the Intron machine to lose hold of the test specimen.
Figure 19. Ten prepared carbon fiber test specimens
The standard tension testing method was then programmed into the Instron machine such that each sample was
tested the same exact way. Thereafter, each test specimen was put into the Instron jig so that the specimen was
parallel with the grips and perpendicular to the floor, as shown in Figure 20. The carbon fiber sample was then
loaded in tension until it breaks or until the load drops by 40 percent. The Instron machine records all testing data:
stress, strain, load, elongation, and ultimate stress. The data for each sample was recorded on the computer then
analyzed to obtain the Young’s modulus. To obtain Young’s modulus, the slope of the linear region of the resulting
stress versus strain curve was found.

14
Figure 20. Carbon fiber test specimen placed in Instron 8801 test jig
The stress versus strain curves for each sample were plotted on a graph, where there are a total of ten samples. The
subsequent plot is shown in figure 21. The ten curves are hard to distinguish because the slopes of each curves are so
similar, which shows that the testing is very consistent.
Figure 21. Mechanical characteristics results for carbon fiber
-20000
0
20000
40000
60000
80000
100000
120000
140000
-0.002 0 0.002 0.004 0.006 0.008 0.01 0.012 0.014
Ten
sile
Str
ess
(p
si)
Tensile Strain (in/in)
Carbon Fiber Stress versus Strain
15
Table 1. Mechanical characteristics summary
CARBON FIBER MECHANICAL CHARACTERISTICS Average Elastic Modulus (psi), ASTM D3039 9,619,014
Elastic Modulus Standard Deviation (psi) 431,484
Elastic Modulus Standard Deviation (%) 4.48
Average Ultimate Stress (psi), ASTM D3039 109,188
Ultimate Stress Standard Deviation (psi) 8,513
Ultimate Stress Standard Deviation (%) 8.51
The resulting Young’s modulus values and ultimate stress values are shown in Table 1. Ultimate stress is a very
important parameter later when calculating the theoretical ultimate stress value of the entire sandwich beam
structure. Table 1 gives a summary of the average Young’s modulus of the ten test samples, the average ultimate
stresses seen in the test specimens, and the standard deviations of each. Standard deviations were taken of the
average elastic modulus and the average ultimate stress to make sure that the results were not misleading and that
the curing method would be repeatable in the future. As seen in table 1, all of the standard deviations of the data are
within statistical reason to be considered repeatable and accurate. The average elastic modulus yielded was
9,619,014 psi and the average ultimate stress value yielded was 109,188 psi.
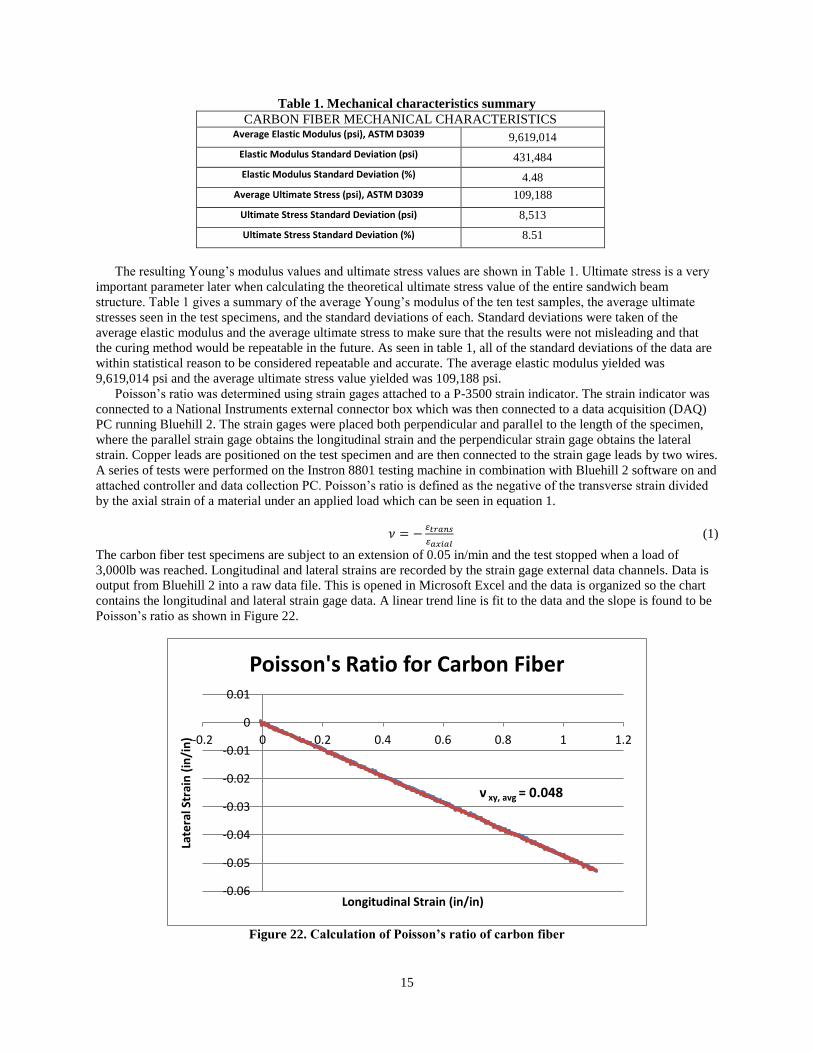
Poisson’s ratio was determined using strain gages attached to a P-3500 strain indicator. The strain indicator was
connected to a National Instruments external connector box which was then connected to a data acquisition (DAQ)
PC running Bluehill 2. The strain gages were placed both perpendicular and parallel to the length of the specimen,
where the parallel strain gage obtains the longitudinal strain and the perpendicular strain gage obtains the lateral
strain. Copper leads are positioned on the test specimen and are then connected to the strain gage leads by two wires.
A series of tests were performed on the Instron 8801 testing machine in combination with Bluehill 2 software on and
attached controller and data collection PC. Poisson’s ratio is defined as the negative of the transverse strain divided
by the axial strain of a material under an applied load which can be seen in equation 1.
(1)
The carbon fiber test specimens are subject to an extension of 0.05 in/min and the test stopped when a load of
3,000lb was reached. Longitudinal and lateral strains are recorded by the strain gage external data channels. Data is
output from Bluehill 2 into a raw data file. This is opened in Microsoft Excel and the data is organized so the chart
contains the longitudinal and lateral strain gage data. A linear trend line is fit to the data and the slope is found to be
Poisson’s ratio as shown in Figure 22.
Figure 22. Calculation of Poisson’s ratio of carbon fiber
-0.06
-0.05
-0.04
-0.03
-0.02
-0.01
0
0.01
-0.2 0 0.2 0.4 0.6 0.8 1 1.2
Late
ral S
trai
n (
in/i
n)
Longitudinal Strain (in/in)
Poisson's Ratio for Carbon Fiber
ν xy, avg = 0.048
16
The final Poisson’s ratio of the face sheets was found to be 0.048, which is a common value for materials like the bi-
directional carbon fiber sheets that are being used.
Face sheet density is relevant to this research because, during the finite element analysis, the mass of each
element is essential in calculating various mass property values. Experimentally the values of density are easily
found by taking a sample of the material and performing various volume and mass calculations to find the density.
To find the density of the LTM45/CF1803 carbon fiber face sheets, a sample that was already cured was cut to a
12” x 12” square where lengths and thicknesses were measured with a micrometer. The weight was then measured.
This procedure was repeated for 10 samples to ensure statistical accuracy. The density was then found by dividing
the masses of the samples by the volumes of the samples, which came out to be an average of 94.84 lb/ft3. To
validate the experimental density, the theoretical value was calculated using the densities of each constituent along
with the volume fraction of the laminae. The density of the LTM45 resin and CF1803 carbon fiber was provided by
the Advanced Composites Group11Company and was 1.24 and 1.76 grams per cubic centimeter respectively. With
the volume fraction of 60 percent known, equation 2 can be used to find the density of the entire laminate:
(2)
with this equation, a theoretical value of Poission’s ratio was calculated to be 96.89 lb/ft3, which differs only by 2.1
percent when compared value found through experiment.
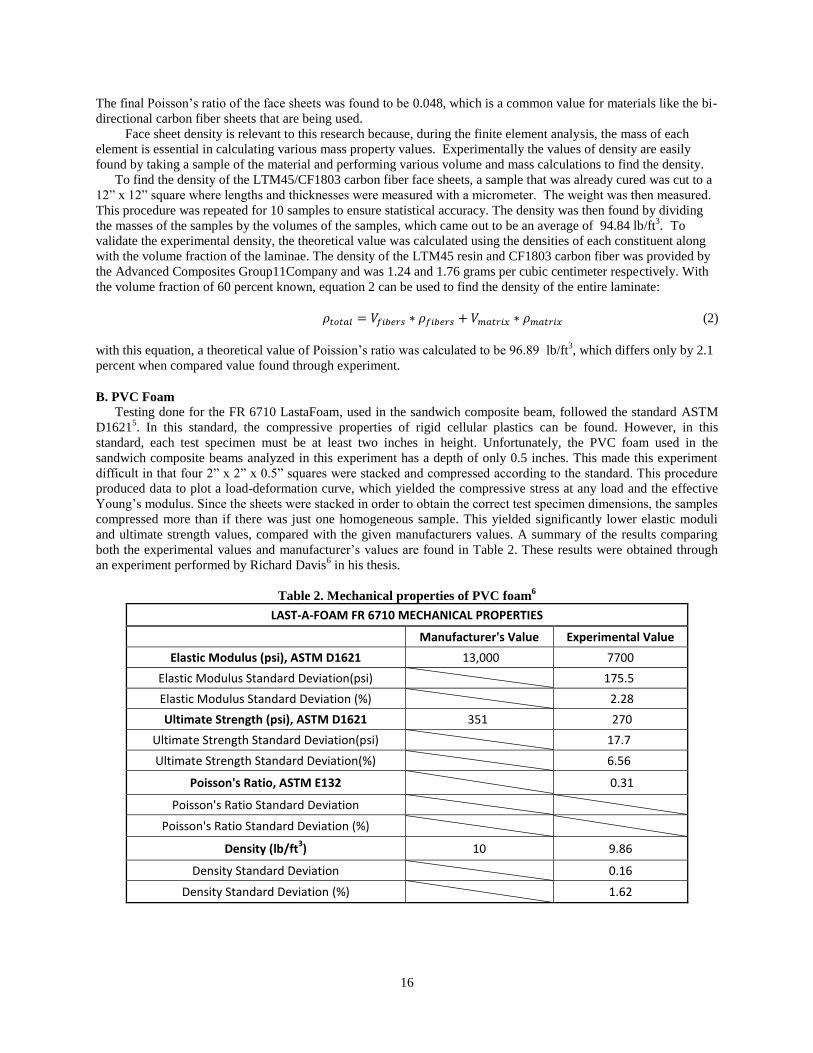
B. PVC Foam
Testing done for the FR 6710 LastaFoam, used in the sandwich composite beam, followed the standard ASTM
D16215. In this standard, the compressive properties of rigid cellular plastics can be found. However, in this
standard, each test specimen must be at least two inches in height. Unfortunately, the PVC foam used in the
sandwich composite beams analyzed in this experiment has a depth of only 0.5 inches. This made this experiment
difficult in that four 2” x 2” x 0.5” squares were stacked and compressed according to the standard. This procedure
produced data to plot a load-deformation curve, which yielded the compressive stress at any load and the effective
Young’s modulus. Since the sheets were stacked in order to obtain the correct test specimen dimensions, the samples
compressed more than if there was just one homogeneous sample. This yielded significantly lower elastic moduli
and ultimate strength values, compared with the given manufacturers values. A summary of the results comparing
both the experimental values and manufacturer’s values are found in Table 2. These results were obtained through
an experiment performed by Richard Davis6 in his thesis.
Table 2. Mechanical properties of PVC foam6
LAST-A-FOAM FR 6710 MECHANICAL PROPERTIES
Manufacturer's Value Experimental Value
Elastic Modulus (psi), ASTM D1621 13,000 7700
Elastic Modulus Standard Deviation(psi) 175.5
Elastic Modulus Standard Deviation (%) 2.28
Ultimate Strength (psi), ASTM D1621 351 270
Ultimate Strength Standard Deviation(psi) 17.7
Ultimate Strength Standard Deviation(%) 6.56
Poisson's Ratio, ASTM E132 0.31
Poisson's Ratio Standard Deviation
Poisson's Ratio Standard Deviation (%)
Density (lb/ft3) 10 9.86
Density Standard Deviation 0.16
Density Standard Deviation (%) 1.62

17
C. Fiberglass DADs
The mechanical characteristics of the damage arrestment devices were found previously through a student’s
senior project that tested the fiberglass material7. The elastic modulus was found to be 5,700,000 psi. This was the
only value necessary in order to perform the comparative finite element analysis, shown later in the report.
Figure 23. Woven roving fiberglass separated into unidirectional fiberglass strands.
The DADs were implemented in this research in order to potentially increase the ultimate strength in the
delaminated beam case. The DADs were fabricated using woven roving fiberglass sheets and separating each strand
as shown in figure 23, where each strand is 14” in length. Each fiberglass bundle is cut to this length so that it may
overlap the mold that the bundles are laid-up in. The mold, shown in figure 24, is made of aluminum and can hold
up to 22 bundles of fiberglass. Bundles are composed of 15 strands each and tied together using a rubber band. Each
bundle creates a 0.125 inch radius semicircular DAD.
Figure 24. Aluminum mold for DADs

18
Figure 25. Mold release wax used to separate curved fiberglass from mold
Before placing each fiberglass bundle in the mold, the aluminum mold must be waxed with a releasing agent that
allows for easy removal of the cured fiberglass DADs. This mold release wax is applied using a cloth until the entire
mold is covered with the wax as depicted in figure 25. Once the mold is prepared, the fiberglass bundles are ready to
be laid-up, as shown in figure 26.
Figure 26. Bundles composed of 15 strands of unidirectional fiberglass
To layup the fiberglass strands a mixture of AEROPOXY PR2032 Epoxy Resin and PH3660 Epoxy Hardener is
prepared. The matrix material is composed of 100:27 Resin to Hardener and care must be taken that the matrix is
completely mixed. Each bundle is then saturated thoroughly with the resin mixture and placed inside each slot in the
mold, as shown in figure 27.
Figure 27. Hand Lay-up Method Used to Fabricate DAD Keys

19
As shown in figure 26, non-porous material is placed under the plate. This is done so that the resin does not leak
onto surrounding surfaces. A separate sheet of non-porous material is placed on top of the plate, followed by another
aluminum plate. A total weight of 200-lb is then added on top of the plate to ensure the complete compacting of the
fiberglass into the mold as can be seen in figure 28.
Figure 28. 200-lb of weight used to compress fiberglass DADs into mold
After a 24 hour cure time, the weights are removed and the fiberglass DADs are ready to be removed. To remove the
DADs from the mold, a sander must be used to sand down the fiberglass until they are all separated by the
aluminum as seen in figure 29. The final DADs are 12 inches long with a semicircular radius of 0.125 inches as
shown in figure 30.
Figure 29. DADs are sanded down until separated from aluminum mold
20
Figure 30. Cured DADs separated from mold
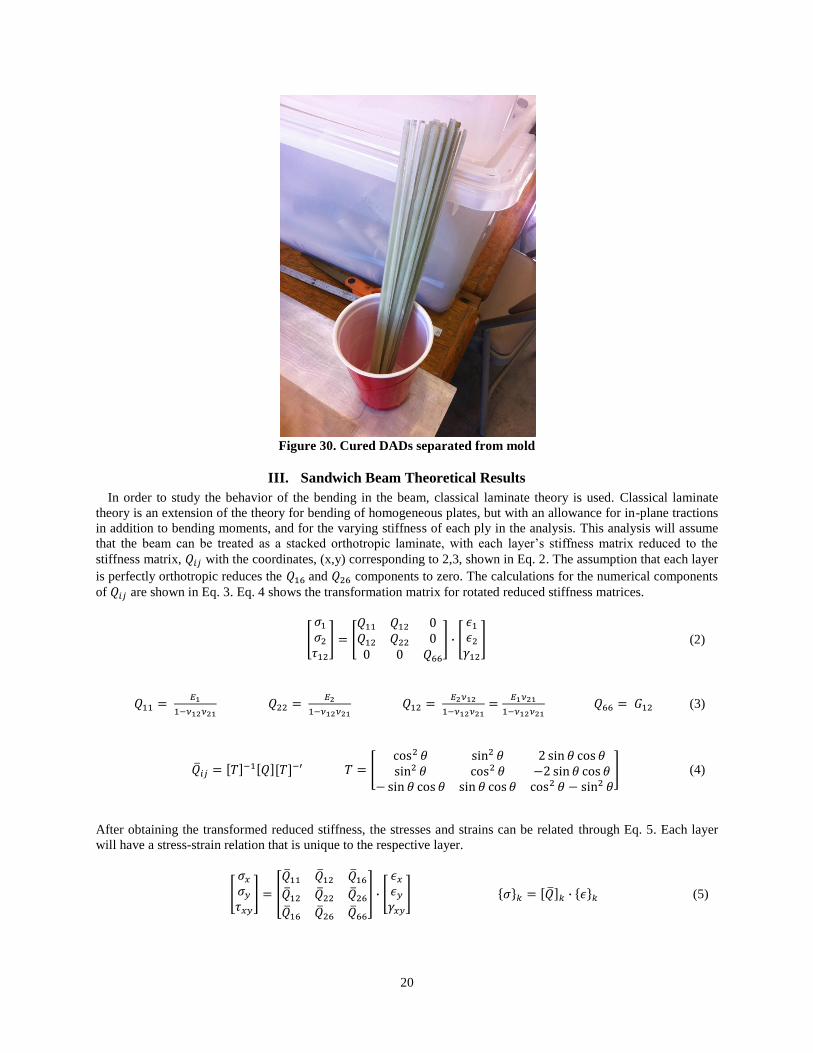
III. Sandwich Beam Theoretical Results
In order to study the behavior of the bending in the beam, classical laminate theory is used. Classical laminate
theory is an extension of the theory for bending of homogeneous plates, but with an allowance for in-plane tractions
in addition to bending moments, and for the varying stiffness of each ply in the analysis. This analysis will assume
that the beam can be treated as a stacked orthotropic laminate, with each layer’s stiffness matrix reduced to the
stiffness matrix, with the coordinates, (x,y) corresponding to 2,3, shown in Eq. 2. The assumption that each layer
is perfectly orthotropic reduces the and components to zero. The calculations for the numerical components
of are shown in Eq. 3. Eq. 4 shows the transformation matrix for rotated reduced stiffness matrices.
(2)
(3)
(4)
After obtaining the transformed reduced stiffness, the stresses and strains can be related through Eq. 5. Each layer
will have a stress-strain relation that is unique to the respective layer.
(5)

21
With the the stress and strain relationships identified through the reduced stiffness matrices, the resultant laminate
forces N and moments M can be determined through integration of the reduced stiffness matrices, laminate layer
thicknesses increment z, and strain. The integrations are shown in Eq. 6.
(6)
With the integration completed, a mechanical relationship between laminate force N and moment M and strain can
be found. (Eq. 7). The
, , and are functions of middle surface values.
(7)
The four point bend test was employed in this experiment. The experiment follows the test standards of the
American Society for Testing and Materials (ASTM), under the test standards for the Standard Test Method for
Flexural Properties of Unreinforced and Reinforced Plastics and Electrical Insulating Materials by Four-Point
Bending, reference #D6272–10.8 The test method utilizes tests for two different span loadings, the one-third support
span and the one-quarter support span. Figure 32 shows the two distinctive support spans. The one-third support
Figure 31. Shown here are the two distinctive support spans: the one third support span and the one
quarter support span.8

22
span was chosen in order to best fit the dimensions of the given four-point bending test instrumentation of the
Instron machine. Eight specimens were tested for each scenario, well within the standard five specimen. The rate of
crosshead motion R is shown in Eq. 8. The variable L refers to the support span, d refers to the depth of the beam,
and Z refers to the rate of straining of the outer fibers. The rate of straining of the outer fibers Z is equal to 0.01.
(8)
When a beam is loaded in flexure at two central points and supported at two outer points, the maximum stress in
the outer fibers occurs between the two central loading points that define the load span. The stress in the one third
support span case is shown in Eq. 9. The variable P refers to the load at a given point on the load deflection curve, L
refers to the support span, b refers to the width of the beam, and d refers to the depth of the beam. The flexural
strength is equal to the maximum stress S at the moment of fracture.
(9)
The maximum strain in the outer fibers also occurs at the midspan. The maximum strain in the outer fibers r can
be calculated in Eq. 10 for the one third support span case. The variables D refer to maximum deflection of the
center of the beam, L refers to the support span, and d refers to the depth.
(10)
With the given variables, we are able to calculate the experimental data from the Instron machine. After the test is
complete and a load-deflection curve is generated, the slope of the curve, m, can be used to find the elastic modulus
given by Eq. 11:
(11)
IV. Experiment: Fabrication and Testing of Sandwich Beams
A. Control Case Beam
The autoclave was also implemented for the curing process of the sandwich beams, which are comprised of the
Advanced Composites Group LTM®45 black bidirectional pre-preg woven carbon fiber and FR 6710 LastaFoam.
Two layers of preimpregnated carbon fiber were used to compose each face sheet while the core was made with one
sheet of 0.5 in thick foam. Again, this method was chosen because of its ability to produce uniform and near
flawless test specimens and to keep the manufacturing methods consistent. To prepare the specimen for curing, four
12” x 12” prepreg squares were carefully cut using a utility knife, followed by obtaining a pre-cut 12” x 12” foam
sheet. Next, two sheets of porous material were cut into 14” x 14” squares using scissors, followed by cutting one
14” x 14” square of breather material. Lastly, one 20” x 20” square of vacuum bag material is cut in order to contain
the part.
After cutting each constituent material, the lay-up process can begin. The layup sequence of materials is as follows:
vacuum bag, breather material, porous material, two layers of bi-directional CF1803 prepreg carbon fiber, FR 6710
LastaFoam, two layers of bi-directional CF1803 prepreg carbon fiber, and porous material. This stacking sequence
can be seen in Figure 30, where a sealant tape material is used to create a tight seal between the vacuum bag and
aluminum plate. The porous material is used to prevent the excess resin from leaking out in the autoclave and the
breather material is used to provide a nice finish on the surface of the carbon fiber.
This layup must be placed on an aluminum plate that has been waxed using a high temp was to prevent resin
from hardening on the plate, as discussed previously. This provides a clean plate for the next cure and also provides
a more uniform surface on the plate. Next, the vacuum attachment must be placed on the plate, which requires a 3” x
3” square piece of cotton, followed by placing a similar cotton piece over the holes in the aluminum plate. This is
done to provide a perfect vacuum between the cured part and the atmosphere. The vacuum attachment is screwed
into place by cutting a small hole in the vacuum bag. The test piece and aluminum plate are now ready to be
attached and placed in the autoclave. The curing cycle employed for the composite sandwich test specimens follows
23
the same curing cycle as the preimpregnated test specimens, which included a dwell period of 16 hours at 140°F and
70 psi in the autoclave.
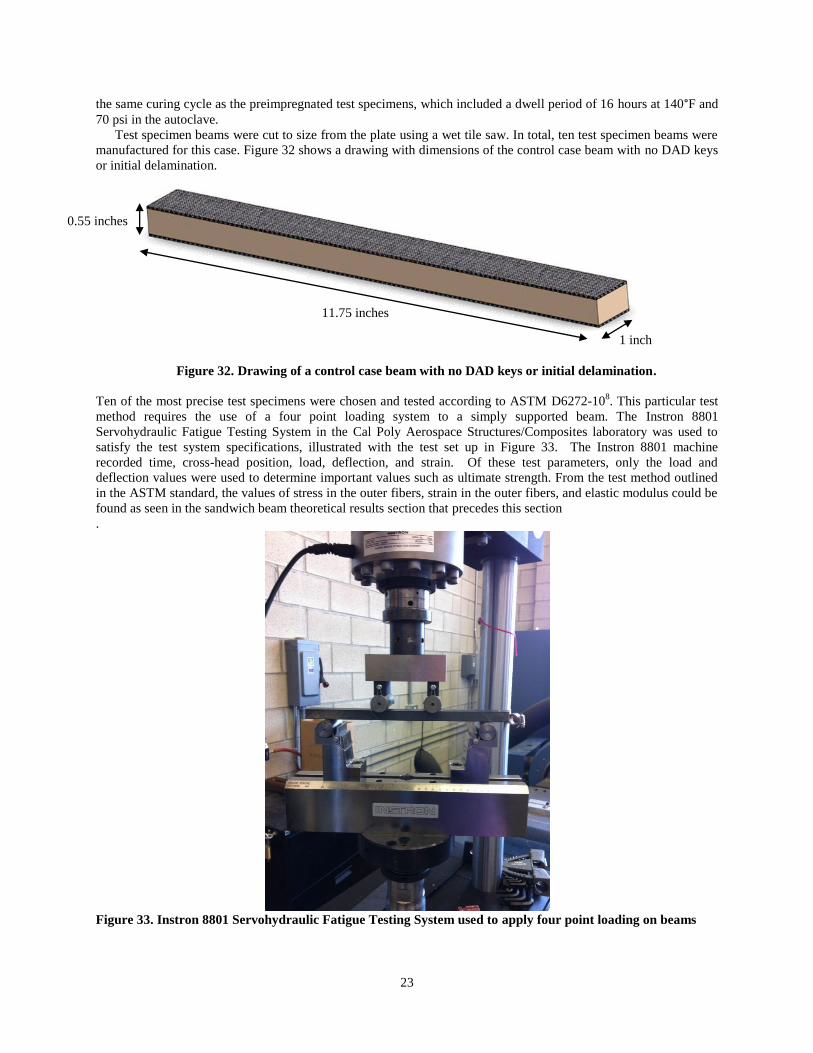
Test specimen beams were cut to size from the plate using a wet tile saw. In total, ten test specimen beams were
manufactured for this case. Figure 32 shows a drawing with dimensions of the control case beam with no DAD keys
or initial delamination.
Figure 32. Drawing of a control case beam with no DAD keys or initial delamination.
Ten of the most precise test specimens were chosen and tested according to ASTM D6272-108. This particular test
method requires the use of a four point loading system to a simply supported beam. The Instron 8801
Servohydraulic Fatigue Testing System in the Cal Poly Aerospace Structures/Composites laboratory was used to
satisfy the test system specifications, illustrated with the test set up in Figure 33. The Instron 8801 machine
recorded time, cross-head position, load, deflection, and strain. Of these test parameters, only the load and
deflection values were used to determine important values such as ultimate strength. From the test method outlined
in the ASTM standard, the values of stress in the outer fibers, strain in the outer fibers, and elastic modulus could be
found as seen in the sandwich beam theoretical results section that precedes this section
.
Figure 33. Instron 8801 Servohydraulic Fatigue Testing System used to apply four point loading on beams
11.75 inches
1 inch
0.55 inches
24
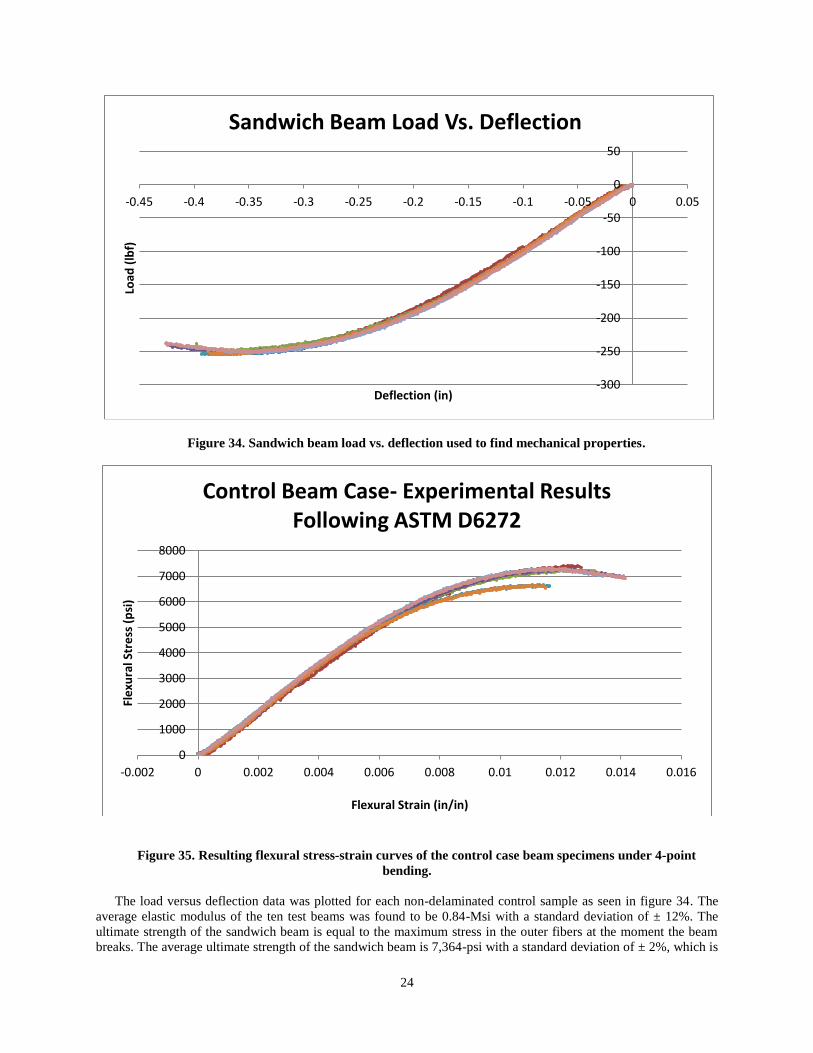
Figure 34. Sandwich beam load vs. deflection used to find mechanical properties.
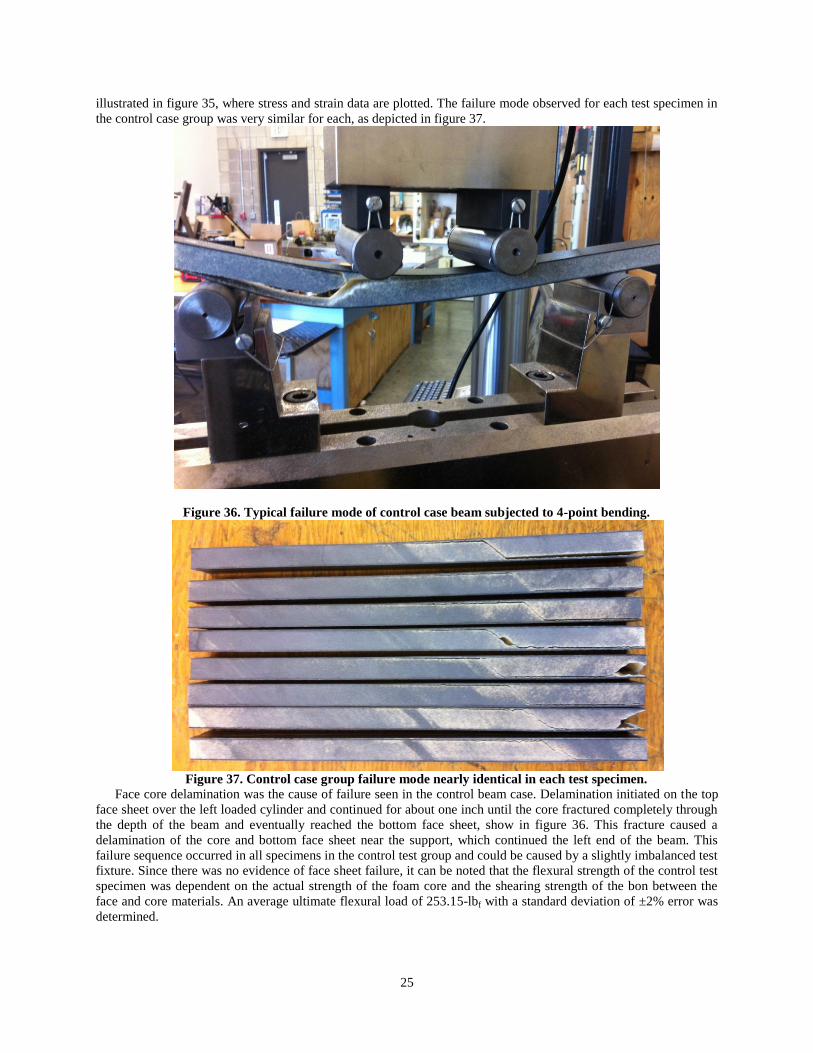
Figure 35. Resulting flexural stress-strain curves of the control case beam specimens under 4-point
bending.
The load versus deflection data was plotted for each non-delaminated control sample as seen in figure 34. The
average elastic modulus of the ten test beams was found to be 0.84-Msi with a standard deviation of ± 12%. The
ultimate strength of the sandwich beam is equal to the maximum stress in the outer fibers at the moment the beam
breaks. The average ultimate strength of the sandwich beam is 7,364-psi with a standard deviation of ± 2%, which is
-300
-250
-200
-150
-100
-50
0
50
-0.45 -0.4 -0.35 -0.3 -0.25 -0.2 -0.15 -0.1 -0.05 0 0.05
Load
(lb
f)
Deflection (in)
Sandwich Beam Load Vs. Deflection
0
1000
2000
3000
4000
5000
6000
7000
8000
-0.002 0 0.002 0.004 0.006 0.008 0.01 0.012 0.014 0.016
Fle
xura
l Str
ess
(p
si)
Flexural Strain (in/in)
Control Beam Case- Experimental Results Following ASTM D6272
25
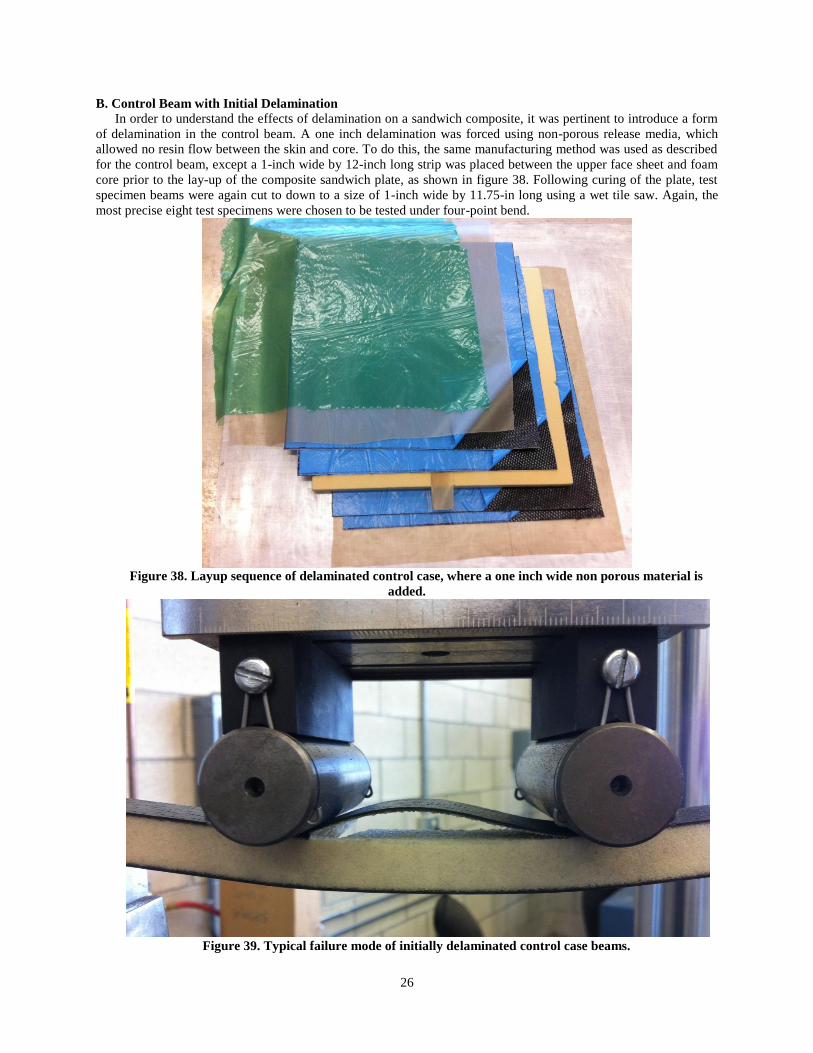
illustrated in figure 35, where stress and strain data are plotted. The failure mode observed for each test specimen in
the control case group was very similar for each, as depicted in figure 37.
Figure 36. Typical failure mode of control case beam subjected to 4-point bending.
Figure 37. Control case group failure mode nearly identical in each test specimen.
Face core delamination was the cause of failure seen in the control beam case. Delamination initiated on the top
face sheet over the left loaded cylinder and continued for about one inch until the core fractured completely through
the depth of the beam and eventually reached the bottom face sheet, show in figure 36. This fracture caused a
delamination of the core and bottom face sheet near the support, which continued the left end of the beam. This
failure sequence occurred in all specimens in the control test group and could be caused by a slightly imbalanced test
fixture. Since there was no evidence of face sheet failure, it can be noted that the flexural strength of the control test
specimen was dependent on the actual strength of the foam core and the shearing strength of the bon between the
face and core materials. An average ultimate flexural load of 253.15-lbf with a standard deviation of ±2% error was
determined.
26
B. Control Beam with Initial Delamination
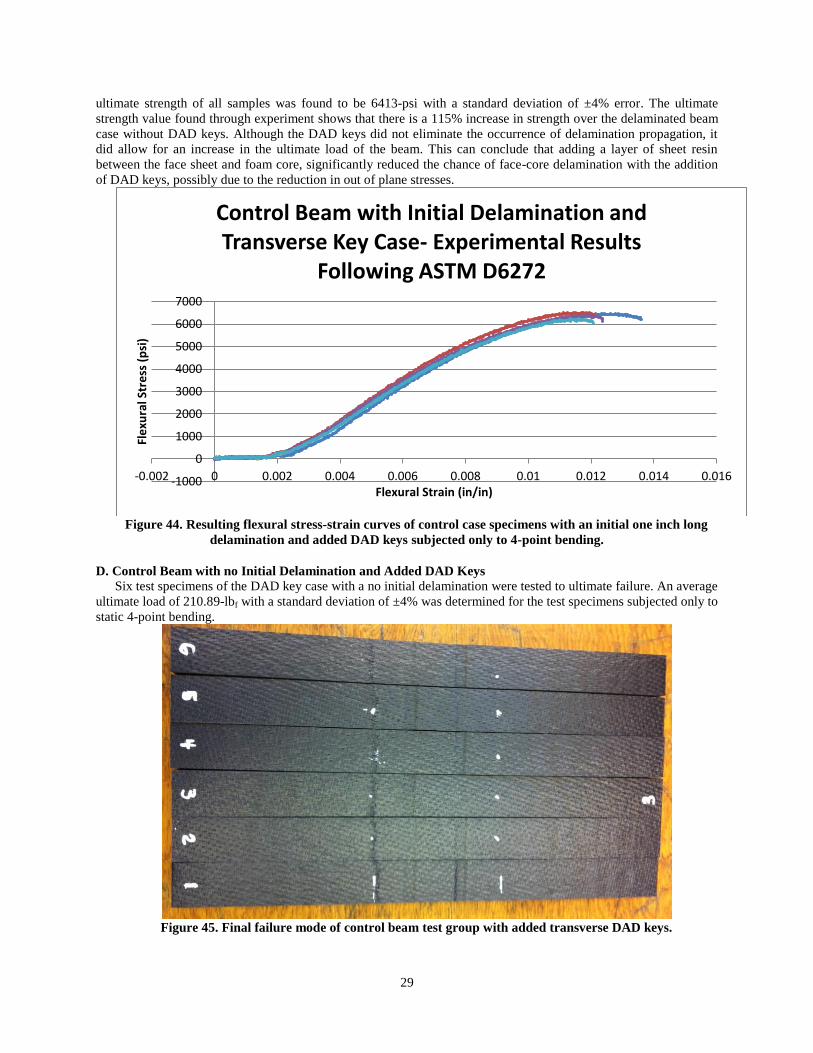
In order to understand the effects of delamination on a sandwich composite, it was pertinent to introduce a form
of delamination in the control beam. A one inch delamination was forced using non-porous release media, which
allowed no resin flow between the skin and core. To do this, the same manufacturing method was used as described
for the control beam, except a 1-inch wide by 12-inch long strip was placed between the upper face sheet and foam
core prior to the lay-up of the composite sandwich plate, as shown in figure 38. Following curing of the plate, test
specimen beams were again cut to down to a size of 1-inch wide by 11.75-in long using a wet tile saw. Again, the
most precise eight test specimens were chosen to be tested under four-point bend.
Figure 38. Layup sequence of delaminated control case, where a one inch wide non porous material is
added.
Figure 39. Typical failure mode of initially delaminated control case beams.

27
Figure 40. Final failure mode of control beam case with one inch initial delamination.
For this case, it was imperative that the delamination was placed directly in between the load span to yield
consistent results. As shown in figure 39, initial failure occurred due to face-core delamination in between the load
span in all test cases. An average ultimate flexural load of 102.58-lbf with a standard deviation of ±6% error was
determined. The control case beam with initial delamination initially failed similarly to the control case, where there
was an evident face-core separation under the load span area that continued one inch past the left loaded similar.
However, the initially delaminated case beam differed in the final failure, where the delamination also continued
past the right loaded cylinder. The delamination in this case is very symmetrical and continues about one inch past
the initial delamination in both directions, as seen in figure 40. In this case, there is no complete failure through the
core to the other face sheet, as seen in the control case. This resulted in a 60% decrease in flexural strength of the
control case with an initial one inch delamination compared to the control case. Again, no visible failure to the
composite face sheet was observed, which can concludes that the flexural strength of the control case beam with an
initial one inch delamination was largely driven by the flexural strength of the foam core. After obtaining
displacement and load parameters from the testing software, stress versus strain curves of the eight test specimens
were obtained. The resulting flexural stress versus strain curves are shown below in figure 41 for the control case
beams with an initial one inch delamination subjected to a static four-point bend. The ultimate strength of all
samples was found to be 2984-psi with a standard deviation of ±6% error.
Figure 41. Resulting flexural stress-strain curves of control case specimens with an initial one inch long
delamination subjected only to 4-point bending.
0
1000
2000
3000
4000
-0.001 0 0.001 0.002 0.003 0.004 0.005 0.006
Fle
xura
l Str
ess
(p
si)
Flexural Strain (in/in)
Control Beam with Initial Delamination Case- Experimental Results Following ASTM D6272

28
C. Control Beam with Initial Delamination and Added DAD Keys
Five test specimens of the DAD key case with a one-inch centrally located initial delamination between the
DADs were tested to ultimate failure. An average ultimate load of 220.44-lbf with a standard deviation of ±4% was
determined for the test specimens subjected only to static 4-point bending.
Figure 42. Final failure mode of control beam case with one inch initial delamination and added
transverse DAD keys.
Figure 43. Final failure mode of control beam test group with one inch initial delamination and added
transverse DAD keys.
The failure mode was similar to the two previously tested cases in that face-core delamination was the initial
failure mode. As shown in figure 42, the core facture propagated from the initial delamination towards the left
loaded roller, but face-core delamination occurred at the right roller support as well. Figure 43 shows the observed
failure mode for the DAD key case beams with an initial 1-inch long centrally located delamination. One can see
from the figure that core fracture occurs near the left DAD key location with face core delamination also occurring
past the area under the right roller load. Once testing was completed for all five test specimens, resulting flexural
stress vs. strain curves were obtained from the testing software for each specimen, and are shown in figure 44. The
29
ultimate strength of all samples was found to be 6413-psi with a standard deviation of ±4% error. The ultimate
strength value found through experiment shows that there is a 115% increase in strength over the delaminated beam
case without DAD keys. Although the DAD keys did not eliminate the occurrence of delamination propagation, it
did allow for an increase in the ultimate load of the beam. This can conclude that adding a layer of sheet resin
between the face sheet and foam core, significantly reduced the chance of face-core delamination with the addition
of DAD keys, possibly due to the reduction in out of plane stresses.
Figure 44. Resulting flexural stress-strain curves of control case specimens with an initial one inch long
delamination and added DAD keys subjected only to 4-point bending.
D. Control Beam with no Initial Delamination and Added DAD Keys
Six test specimens of the DAD key case with a no initial delamination were tested to ultimate failure. An average
ultimate load of 210.89-lbf with a standard deviation of ±4% was determined for the test specimens subjected only to
static 4-point bending.
Figure 45. Final failure mode of control beam test group with added transverse DAD keys.
-1000
0
1000
2000
3000
4000
5000
6000
7000
-0.002 0 0.002 0.004 0.006 0.008 0.01 0.012 0.014 0.016
Fle
xura
l Str
ess
(p
si)
Flexural Strain (in/in)
Control Beam with Initial Delamination and Transverse Key Case- Experimental Results
Following ASTM D6272
30
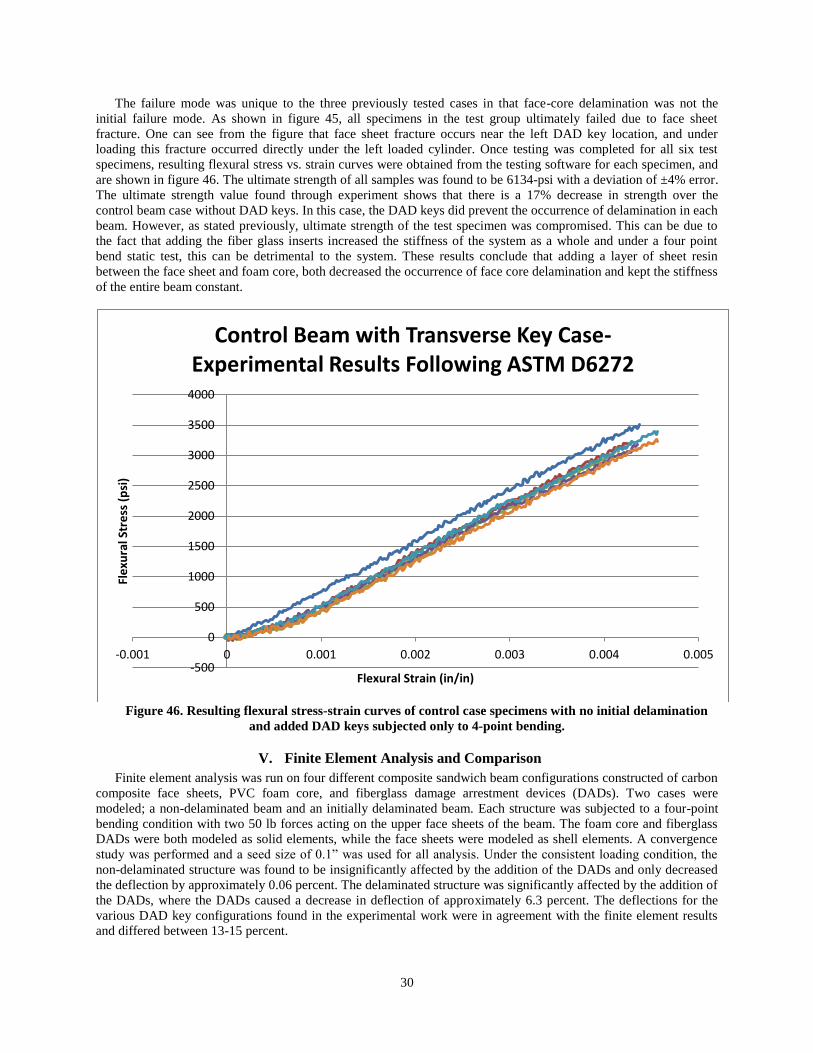
The failure mode was unique to the three previously tested cases in that face-core delamination was not the
initial failure mode. As shown in figure 45, all specimens in the test group ultimately failed due to face sheet
fracture. One can see from the figure that face sheet fracture occurs near the left DAD key location, and under
loading this fracture occurred directly under the left loaded cylinder. Once testing was completed for all six test
specimens, resulting flexural stress vs. strain curves were obtained from the testing software for each specimen, and
are shown in figure 46. The ultimate strength of all samples was found to be 6134-psi with a deviation of ±4% error.
The ultimate strength value found through experiment shows that there is a 17% decrease in strength over the
control beam case without DAD keys. In this case, the DAD keys did prevent the occurrence of delamination in each
beam. However, as stated previously, ultimate strength of the test specimen was compromised. This can be due to
the fact that adding the fiber glass inserts increased the stiffness of the system as a whole and under a four point
bend static test, this can be detrimental to the system. These results conclude that adding a layer of sheet resin
between the face sheet and foam core, both decreased the occurrence of face core delamination and kept the stiffness
of the entire beam constant.
Figure 46. Resulting flexural stress-strain curves of control case specimens with no initial delamination
and added DAD keys subjected only to 4-point bending.
V. Finite Element Analysis and Comparison
Finite element analysis was run on four different composite sandwich beam configurations constructed of carbon
composite face sheets, PVC foam core, and fiberglass damage arrestment devices (DADs). Two cases were
modeled; a non-delaminated beam and an initially delaminated beam. Each structure was subjected to a four-point
bending condition with two 50 lb forces acting on the upper face sheets of the beam. The foam core and fiberglass
DADs were both modeled as solid elements, while the face sheets were modeled as shell elements. A convergence
study was performed and a seed size of 0.1” was used for all analysis. Under the consistent loading condition, the
non-delaminated structure was found to be insignificantly affected by the addition of the DADs and only decreased
the deflection by approximately 0.06 percent. The delaminated structure was significantly affected by the addition of
the DADs, where the DADs caused a decrease in deflection of approximately 6.3 percent. The deflections for the
various DAD key configurations found in the experimental work were in agreement with the finite element results
and differed between 13-15 percent.
-500
0
500
1000
1500
2000
2500
3000
3500
4000
-0.001 0 0.001 0.002 0.003 0.004 0.005
Fle
xura
l Str
ess
(p
si)
Flexural Strain (in/in)
Control Beam with Transverse Key Case- Experimental Results Following ASTM D6272
31
A. Model
Figure 47. Composite Sandwich Beam.
The FE software was used to model four configurations of the composite sandwich beam, all under four-point
loading.
Four configurations of the sandwich composite beam are considered. Two control cases are considered, a non-
delaminated beam and a delaminated beam. For the delaminated case, an initial delamination is introduced in
between the load span of the beam and is one inch in length. Each of these cases consists of two structure-critical
parts that were modeled in ABAQUS.
Face Sheets (2)
Core (1)
Each control case is then tested with the addition of DADs and each of these configurations consists of three
structure-critical parts that were modeled in ABAQUS.
Face Sheets (2)
Core (1)
DADs (2)
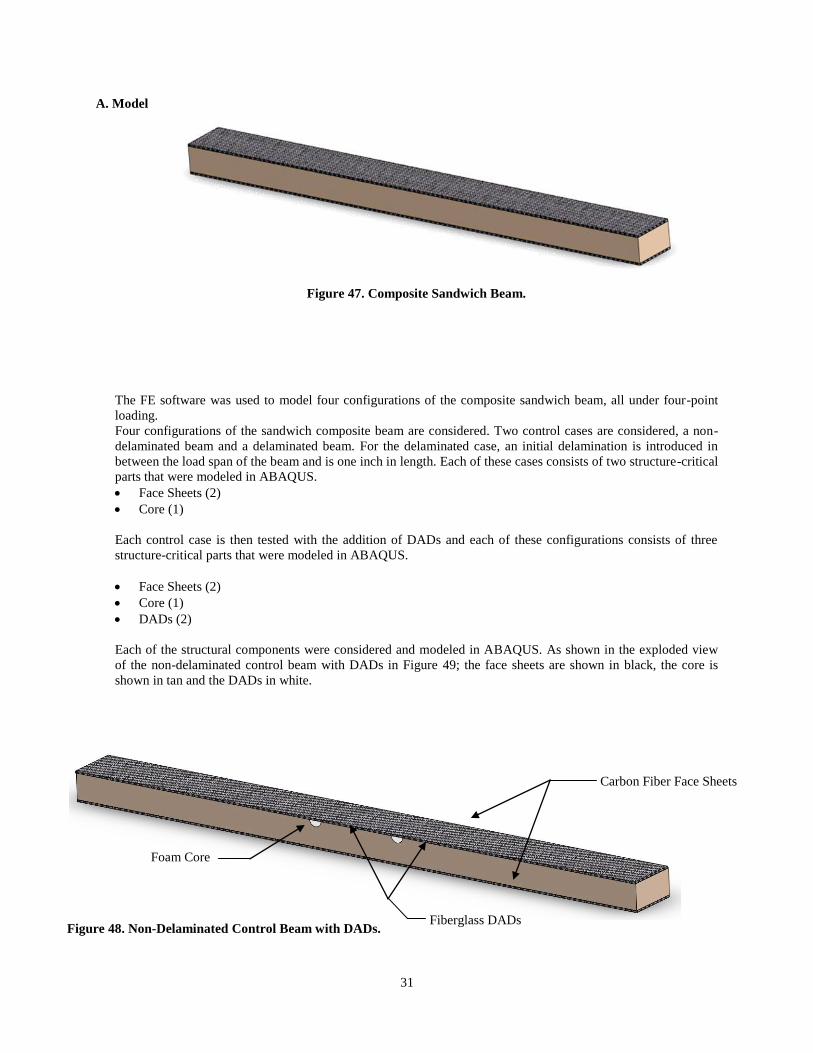
Each of the structural components were considered and modeled in ABAQUS. As shown in the exploded view
of the non-delaminated control beam with DADs in Figure 49; the face sheets are shown in black, the core is
shown in tan and the DADs in white.
Figure 48. Non-Delaminated Control Beam with DADs.
Fiberglass DADs
Carbon Fiber Face Sheets
Foam Core

32
Model development
ABAQUS was used to model a representation of the composite sandwich beam for each of the four configurations. Each part was
given an elastic definition, density, and dimension as shown in Table 3. The material properties shown were found through the
experimental portion of this research with the exception of the modulus of elasticity of the PVC foam, which was obtained from
the manufacturer’s specification sheet. Each component in the model was defined in the base length unit of inches.
Table 3. FE Simulation material properties for sandwich composite beam.
Figure 49. Non-Delaminated Sandwich Beam with DADs Exploded View (inches).
Figure 50. Four-Point Bending Loading Condition, Two 50-lb loads
The standard units of the output used force in pounds, due to the inch units used, but pressures were measured in
pounds per square inch (psi).
The composite sandwich beam with no delamination was modeled as two separate parts in ABAQUS. The first
part was the PVC foam core, which was modeled as a 3-D deformable solid. The second part was the carbon fiber
face sheets, which were modeled as a 3-D shell. A solid section was created with the PVC foam material properties
shown in Table 3 for implementation in the core. Similarly, a shell section was created for implementation in the
face sheets, with the given material properties of the carbon fiber used and a shell thickness corresponding to the
face sheet depth. The two face sheets were sketched and modeled as one part; therefore the distance between the two
face sheets accounted for both the thickness of the core and the thickness of one face sheet since ABAQUS
generates the shell thickness equally between the sketch line. In the assembly, the instances were translated to their
appropriate places before each part received their appropriate constraints. Since the bonding strength from the sheet
resin between the carbon fiber and the foam is unknown, two tie constraints were created in order to allow for shared
nodes between the two parts. For the first tie constraint, the top surface of the core was chosen as the master and the
bottom surface of the top face sheet was chosen as the slave. The second tie constraint consisted of a tie between the
bottom surface of the core and the top surface of the bottom face sheet. The surface of the core was chosen as the
slave surface, while the surface of the bottom face sheet was chosen as the master.
Part Material E (psi) Poisson’s
Ratio
Length
(in)
Width
(in)
Depth
(in)
Radius
(in)
Part
Type
Section
Type
Core Last-A-Foam
FR 6710 PVC Foam 13,000 0.31 12 1 0.5 -
3-D
Solid
3-D Solid
Face
Sheets
LTM45/CF1803
Carbon Fiber 9,619,014 0.048 12 1 0.0385 -
3-D
Shell
3-D Shell
DAD Woven
Roving Fiberglass 5,700,000 0.2 0.25 1 - 0.125
3-D
Solid
3-D Solid
Face Sheets (12 X 1 X 0.0385) X2
Foam Core (12 X 1 X 0.5)
DADs (1 X rad 0.125) X2
6.75
5
9 in
3 in 3 in
33
The composite sandwich beam with an initial delamination was modeled identically with the exception of the tie
constraints. In order to model the delamination, the tie constraint must be modified slightly to account for the one
inch delamination in the center of the beam span. First a partition was made to the bottom face of the top face sheet.
This partition created a one inch square located in the center span of the face sheet. Once this was completed, the tie
constraint the ties the top face sheet to the core was modified to exclude the one inch partitioned square by selecting
all surfaces of the top face sheet except the one inch square in the center. This ensures that the middle square and the
foam core do not share nodes, and therefore simulate a delamination at the face core interface. The second tie
constraint is constrained identically to the non-delaminated control case.
The composite sandwich beam with no delamination and the addition of the DADs was modeled as three
separate parts in ABAQUS. The first part was the PVC foam core, which was modeled as a 3-D deformable solid.
The second part was the carbon fiber face sheets, which were modeled as a 3-D shell. The third part was the
fiberglass DAD, which was modeled as a 3-D solid. The sections for the face sheets and core were modeled
similarly to the previous models, however, the third section created was a 3-D solid section with the material
properties of the fiberglass seen in Table 3. This section was assigned to the fiberglass parts in the model, which
totaled to two. In the assembly, the instances were translated to their appropriate places before each part received
their appropriate constraints. Three tie constraints were created in order to allow for shared nodes between the three
parts. For the first tie constraint, the top surface of the core and the top surfaces of the DADs were chosen as the
master and the bottom surface of the top face sheet was chosen as the slave. The second tie constraint consisted of a
tie between the bottom surface of the core and the top surface of the bottom face sheet. The surface of the core was
chosen as the slave surface, while the surface of the bottom face sheet was chosen as the master. The last tie
constraint tied the DADs to the foam core. The bottom surfaces of the DADs were chosen as the slave and the top
face of the foam core was chosen as the master.
The final beam configuration consisted of a model that included both initial delamination and DADs. This model
was modeled similar to the composite sandwich beam with no delamination and the addition of DADs with the
exception of the tie constraints. The delamination was again modeled similarly to the control sandwich beam with
delamination in that a partition was created in order to exclude the one inch square in the center of the beam span
from the tie constraint between the face sheet and the core.
B. Static load analysis
To ensure the composite sandwich beam was modeled correctly, a model of a composite beam was created with
the same static loading and boundary conditions as the sandwich beams tested in experiment. Using this method, the
FE maximum deflection results could be compared with theoretical hand calculations found by analyzing the system
in closed form. The model was made out of a layer of steel (EST= 30 X 106
psi)1 sandwiched between two layers of
aluminum (EAL = 10 X 106
psi).1 The loading condition consisted of two 50-lb loads placed near the center span of
the beam as shown in Figure 50. The total load of 100 pounds was chosen because it lies in the linear region of the
load-deflection curve. Because the simulation assumes small angles of deflection and linearity, the load value of
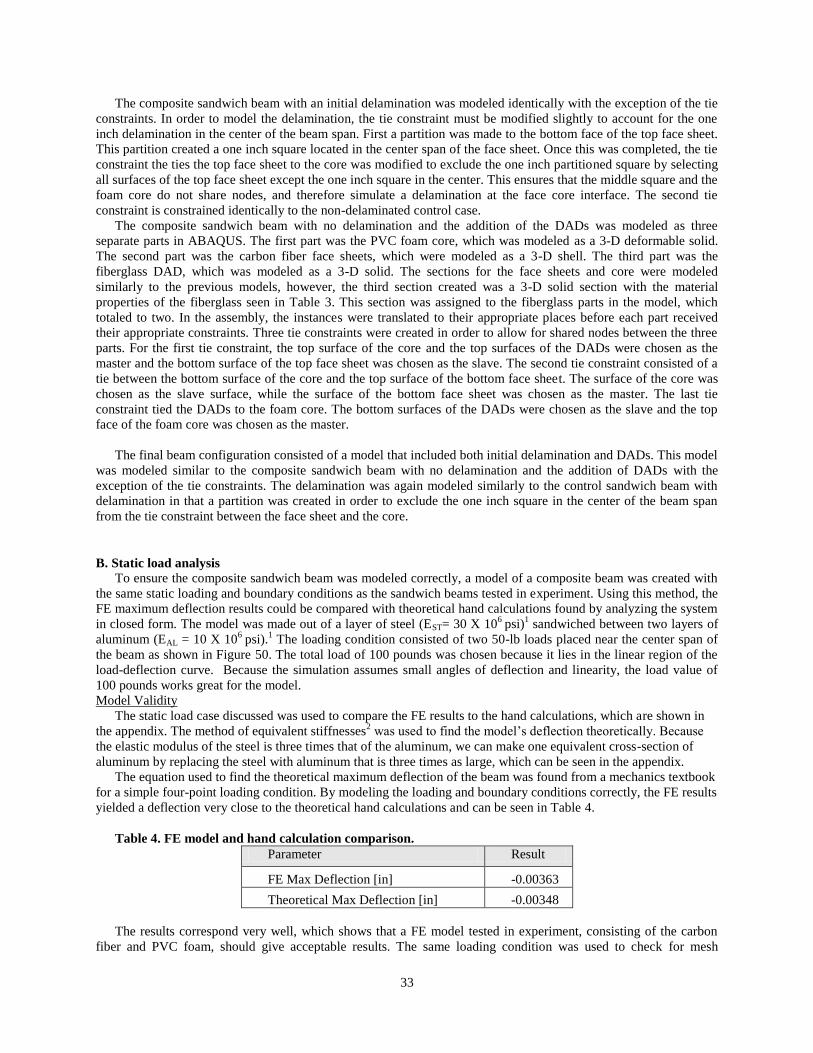
100 pounds works great for the model.
Model Validity
The static load case discussed was used to compare the FE results to the hand calculations, which are shown in
the appendix. The method of equivalent stiffnesses2 was used to find the model’s deflection theoretically. Because
the elastic modulus of the steel is three times that of the aluminum, we can make one equivalent cross-section of
aluminum by replacing the steel with aluminum that is three times as large, which can be seen in the appendix.
The equation used to find the theoretical maximum deflection of the beam was found from a mechanics textbook
for a simple four-point loading condition. By modeling the loading and boundary conditions correctly, the FE results
yielded a deflection very close to the theoretical hand calculations and can be seen in Table 4.
Table 4. FE model and hand calculation comparison.
Parameter Result
FE Max Deflection [in] -0.00363
Theoretical Max Deflection [in] -0.00348
The results correspond very well, which shows that a FE model tested in experiment, consisting of the carbon
fiber and PVC foam, should give acceptable results. The same loading condition was used to check for mesh
34
convergence on the non-delaminated control beam. This was done to produce an adequate mesh to be used for the
other configurations of the beam. Square linear elements were used since the geometry of the model was relatively
simple and square.
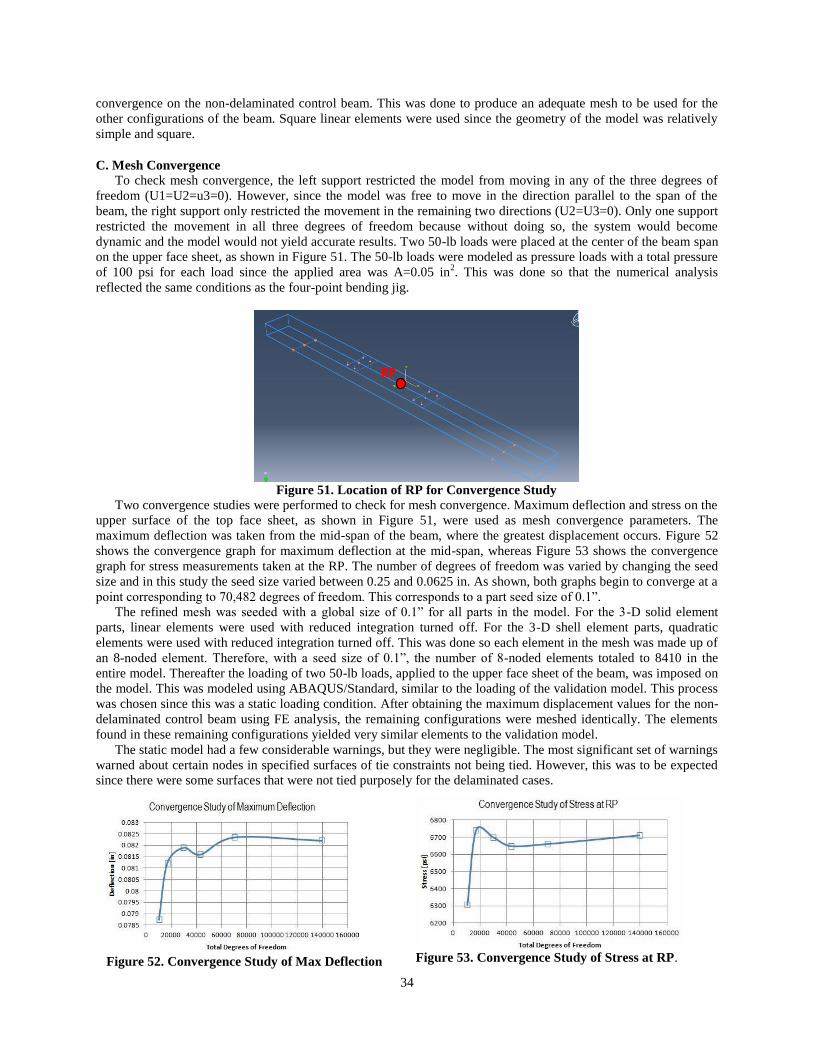
C. Mesh Convergence
To check mesh convergence, the left support restricted the model from moving in any of the three degrees of
freedom (U1=U2=u3=0). However, since the model was free to move in the direction parallel to the span of the
beam, the right support only restricted the movement in the remaining two directions (U2=U3=0). Only one support
restricted the movement in all three degrees of freedom because without doing so, the system would become
dynamic and the model would not yield accurate results. Two 50-lb loads were placed at the center of the beam span
on the upper face sheet, as shown in Figure 51. The 50-lb loads were modeled as pressure loads with a total pressure
of 100 psi for each load since the applied area was A=0.05 in2. This was done so that the numerical analysis
reflected the same conditions as the four-point bending jig.
Figure 51. Location of RP for Convergence Study
Two convergence studies were performed to check for mesh convergence. Maximum deflection and stress on the
upper surface of the top face sheet, as shown in Figure 51, were used as mesh convergence parameters. The
maximum deflection was taken from the mid-span of the beam, where the greatest displacement occurs. Figure 52
shows the convergence graph for maximum deflection at the mid-span, whereas Figure 53 shows the convergence
graph for stress measurements taken at the RP. The number of degrees of freedom was varied by changing the seed
size and in this study the seed size varied between 0.25 and 0.0625 in. As shown, both graphs begin to converge at a
point corresponding to 70,482 degrees of freedom. This corresponds to a part seed size of 0.1”.
The refined mesh was seeded with a global size of 0.1” for all parts in the model. For the 3-D solid element
parts, linear elements were used with reduced integration turned off. For the 3-D shell element parts, quadratic
elements were used with reduced integration turned off. This was done so each element in the mesh was made up of
an 8-noded element. Therefore, with a seed size of 0.1”, the number of 8-noded elements totaled to 8410 in the
entire model. Thereafter the loading of two 50-lb loads, applied to the upper face sheet of the beam, was imposed on
the model. This was modeled using ABAQUS/Standard, similar to the loading of the validation model. This process
was chosen since this was a static loading condition. After obtaining the maximum displacement values for the non-
delaminated control beam using FE analysis, the remaining configurations were meshed identically. The elements
found in these remaining configurations yielded very similar elements to the validation model.
The static model had a few considerable warnings, but they were negligible. The most significant set of warnings
warned about certain nodes in specified surfaces of tie constraints not being tied. However, this was to be expected
since there were some surfaces that were not tied purposely for the delaminated cases.
RP
Figure 52. Convergence Study of Max Deflection
Figure 53. Convergence Study of Stress at RP.
D. Results
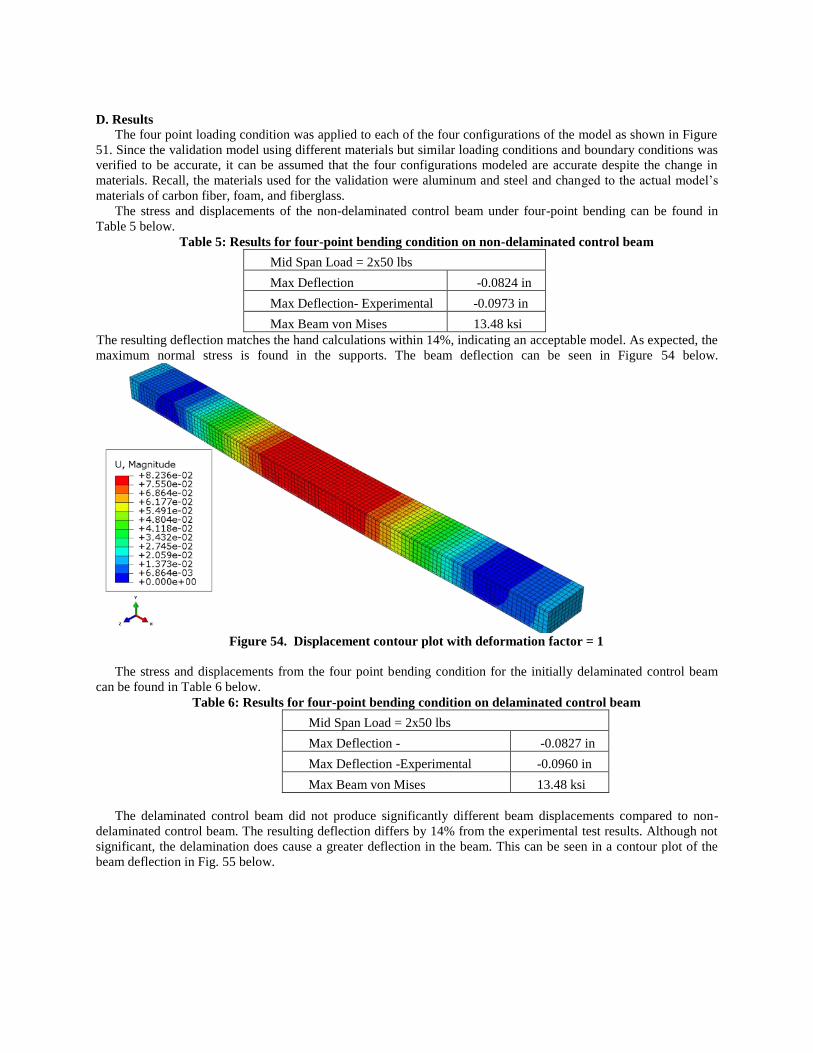
The four point loading condition was applied to each of the four configurations of the model as shown in Figure
51. Since the validation model using different materials but similar loading conditions and boundary conditions was
verified to be accurate, it can be assumed that the four configurations modeled are accurate despite the change in
materials. Recall, the materials used for the validation were aluminum and steel and changed to the actual model’s
materials of carbon fiber, foam, and fiberglass.
The stress and displacements of the non-delaminated control beam under four-point bending can be found in
Table 5 below.
Table 5: Results for four-point bending condition on non-delaminated control beam
Mid Span Load = 2x50 lbs
Max Deflection -0.0824 in
Max Deflection- Experimental -0.0973 in
Max Beam von Mises 13.48 ksi
The resulting deflection matches the hand calculations within 14%, indicating an acceptable model. As expected, the
maximum normal stress is found in the supports. The beam deflection can be seen in Figure 54 below.
Figure 54. Displacement contour plot with deformation factor = 1
The stress and displacements from the four point bending condition for the initially delaminated control beam
can be found in Table 6 below.
Table 6: Results for four-point bending condition on delaminated control beam
Mid Span Load = 2x50 lbs
Max Deflection - -0.0827 in
Max Deflection -Experimental -0.0960 in
Max Beam von Mises 13.48 ksi
The delaminated control beam did not produce significantly different beam displacements compared to non-
delaminated control beam. The resulting deflection differs by 14% from the experimental test results. Although not
significant, the delamination does cause a greater deflection in the beam. This can be seen in a contour plot of the
beam deflection in Fig. 55 below.

36
Figure 55. Displacement contour plot with deformation factor = 1
The stress and displacements of the non-delaminated beam with the addition of DADs under four-point bending
can be found in Table 7 below.
Table 7. Results for four-point bending condition on non-delaminated beam with DADs
Mid Span Load = 2x50 lbs
Max Deflection -0.0819 in
Max Deflection- Experimental -0.0943 in
Max Beam von Mises 13.49 ksi
The resulting deflection matches the hand calculations within 13%, indicating an acceptable model. This is a
decrease in the maximum deflection of the beam compared to the control case, which is expected with the addition
of the DADs. The beam deflection can be seen in Figure 56 below.
Figure 56. Displacement contour plot with deformation factor = 1
The deflection and stress results for the final configuration, delaminated beam with DADs, can be seen below.
37
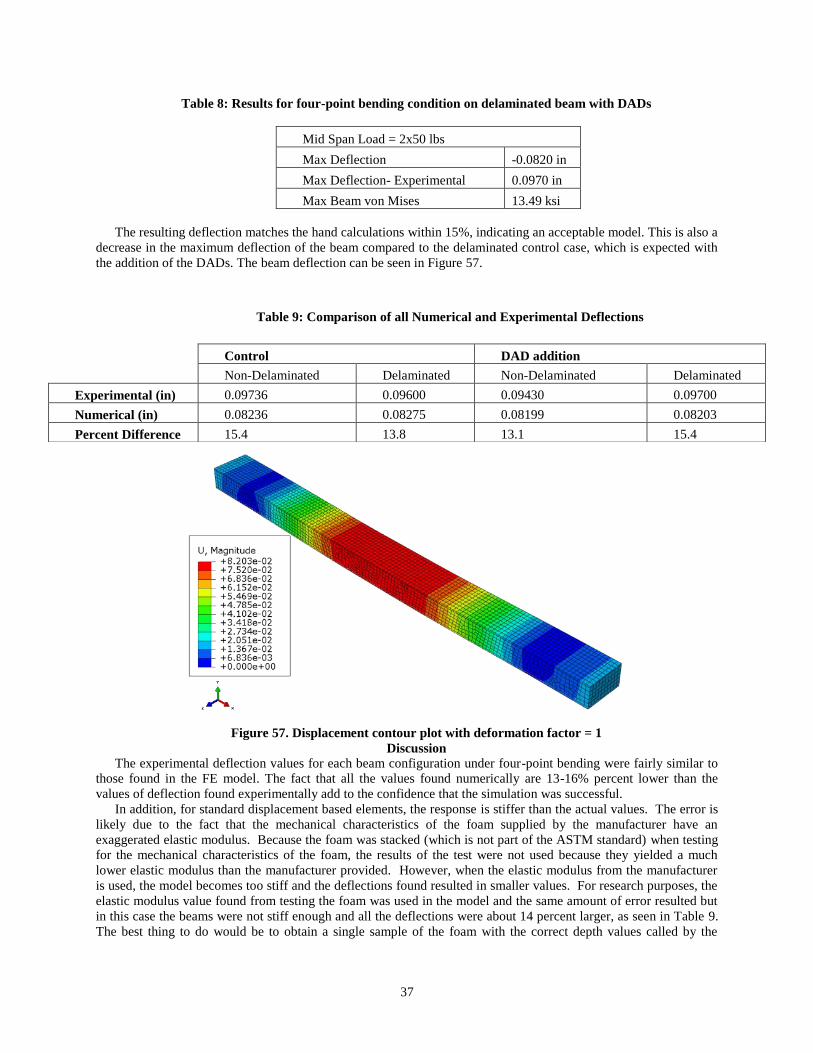
Table 8: Results for four-point bending condition on delaminated beam with DADs
Mid Span Load = 2x50 lbs
Max Deflection -0.0820 in
Max Deflection- Experimental 0.0970 in
Max Beam von Mises 13.49 ksi
The resulting deflection matches the hand calculations within 15%, indicating an acceptable model. This is also a
decrease in the maximum deflection of the beam compared to the delaminated control case, which is expected with
the addition of the DADs. The beam deflection can be seen in Figure 57.
Figure 57. Displacement contour plot with deformation factor = 1
Discussion
The experimental deflection values for each beam configuration under four-point bending were fairly similar to
those found in the FE model. The fact that all the values found numerically are 13-16% percent lower than the
values of deflection found experimentally add to the confidence that the simulation was successful.
In addition, for standard displacement based elements, the response is stiffer than the actual values. The error is
likely due to the fact that the mechanical characteristics of the foam supplied by the manufacturer have an
exaggerated elastic modulus. Because the foam was stacked (which is not part of the ASTM standard) when testing
for the mechanical characteristics of the foam, the results of the test were not used because they yielded a much
lower elastic modulus than the manufacturer provided. However, when the elastic modulus from the manufacturer
is used, the model becomes too stiff and the deflections found resulted in smaller values. For research purposes, the
elastic modulus value found from testing the foam was used in the model and the same amount of error resulted but
in this case the beams were not stiff enough and all the deflections were about 14 percent larger, as seen in Table 9.
The best thing to do would be to obtain a single sample of the foam with the correct depth values called by the
Control DAD addition
Non-Delaminated Delaminated Non-Delaminated Delaminated
Experimental (in) 0.09736 0.09600 0.09430 0.09700
Numerical (in) 0.08236 0.08275 0.08199 0.08203
Percent Difference 15.4 13.8 13.1 15.4
Table 9: Comparison of all Numerical and Experimental Deflections
38
ASTM test to avoid stacking and obtain the correct mechanical properties of the samples (which would probably be
in between the values tested and the values supplied by the manufacturer) and use that for the simulation.
Since the FE model yielded acceptable deflection results, maximum stress in the beams were plotted for the
beam Von Mises for each beam configuration can be found in the Appendix.
Non Delaminated Configurations When subjected to the total static downward force of 100-lbs, the non-delaminated control beam deflected most
at the midspan of the beam. After the addition of the DADs, the deflection decreased by approximately 0.06%. This
is not a significant decrease, which is expected since there was no initial delamination in the beam. With the addition
of the DADs, the maximum stress that occurs at the supports increases.
Delaminated Configurations
In the case of the delaminated control beam, the addition of the DADs provided a significant decrease in the
beams maximum deflection. The FE results showed that there was a decrease in beam deflection of approximately
6.3%. These results followed the experimental results found in the four point bending test.
In the experimental testing it was found the there was a significant increase in ultimate strength of the beam with
the addition of the DADs. Since the ASTM standards used to find the ultimate strengths and other mechanical data
use equations which are functions of the beam deflection, the deflections found numerically must follow closely to
those in experiment to ensure the testing is valid. In this research, the experimental deflection values found are
validated with the deflections found through FE.
The four different configured composite sandwich beam models illustrate how simple fiberglass inserts can
affect stress and displacement values. All models have a net 100 lbs downward force applied to the same location on
the beam, but each is configured differently. The addition of the DADs in a delaminated beam, affect the
displacement quite significantly, whereas the DADs do not affect the deflections very much in a non-delaminated
beam. The addition of the DADs affect the maximum stress seen in the beam in both cases.
VI. Conclusion
The theoretical and experimental results confirmed that adding damage arrestment devices into the sandwich
composite material will increase the loading capability of the structure when initially delaminated. It can be
concluded that adding a DAD into the material increases the robustness of a delaminated composite, and also alters
the stiffness of the control specimen slightly. As stated before, both the control and shear key sandwich carried the
highest load before fracturing. The delaminated two shear key sandwich had values that were slightly lower than the
control group, but had a significantly higher value of the delaminated sandwich. Nonetheless, adding a damage
arrestment increased the stiffness of a damaged composite, but has a limiting factor to adding strength and
increasing extension. Examining the addition of damage arrestment devices to sandwich composite panels is
necessary, as sandwich composite panels are used extensively throughout the aerospace industry. Many aircraft
wings utilize sandwich composite panels and face sheet delamination is a very common occurrence. Currently, there
is no cost effective solution to repairing the composite panels, and many times the panels must be replaced
completely, which is extremely expensive. By implementing DAD devices as tested in this experiment, face sheet
delamination can be prolonged, saving aerospace companies from frequent repair costs. Further research can
determine how many or the locations of the shear keys which can give the sandwich composite a high strength to
weight ratio. Future theses can consider the damage arrestment devices in impact and in vibration to determine if
there is still a high increase in strength in different applications. Throughout manufacturing and experiment of the
sandwich composite beams, some problems arose. One problem in the manufacturing of the sandwich composite
panel was the overall finish of the composite sandwich skin, where much of the plate was compromised due to face
sheet impurities.

39
Acknowledgements I would like to thank the Cal Poly Aerospace Engineering Department, the Cal Poly Aerospace Student Fee
Committee, and C3RP for their funding and support of this project. Without their assistance in materials and lab
upgrades it would not be possible to conduct the research. I would also like to thank Dr. Elghandour and Kodi Rider
for their knowledge and guidance in the composites fabrication and testing.
References 1Niu, Michael Chun-Yung. Composite Airframe Structures: Practical Design Information and Data. North Point:
Hong Kong Conmilit, 1992. Print. 2" Carbon Fiber." Composite Envisions. Web. 5 March. 2011.
< http://compositeenvisions.com/raw-fabric-cloth-2/carbon-fiber-97/>. 3Robert M. Mechanics of Composite Materials. 2nd. Ann Arbor, MI: Taylor & Francis, 1999. Print.
4Instron Corporation. Instron 100kN Hydraulic Wedge Grips Operator's Manual. N.p.: Instron Corporation, 1994.
Print. 5"Standard Test Method for Compressive Properties of Rigid Cellular Plastics." ASTM International (2010): 1-5.
Print. 6Davis, Richard A. The Effects of a Damage Arrestment Device on the Mechanical Behavior of Sandwich Composite
Beams under Four-Point Bending. Thesis. California Polytechnic State University, San Luis Obispo, May 2011.
Print. 7 Surano, Dominic, and Jonathan Russo. Compression Testing of Composite Laminated Foam under Thermal
Loading and with Central Holes. Senior Project. California Polytechnic State University, San Luis Obispo. Print. 8"Standard Test Method for Flexural Properties of Unreinforced and Reinforced Plastics and Electrical Insulating
Materials by Four-Point Bending." ASTM International. American Society for Testing and Materials, 01 04 2011.
Web. 1 Jun 2011.