Embed Size (px)
Citation preview

THE EFFECTS OF A DAMAGE ARRESTMENT DEVICE ON THE MECHANICAL
BEHAVIOR OF SANDWICH COMPOSITE BEAMS UNDER FOUR-POINT BENDING
A Thesis
presented to
the Faculty of California Polytechnic State University,
San Luis Obispo
In Partial Fulfillment
of the Requirements for the Degree
Masters of Science in Aerospace Engineering
by
Richard Anthony Davis
May 2011

Richard Davis
ii
© 2011
Richard Anthony Davis
ALL RIGHTS RESERVED

Richard Davis
iii
TITLE: The Effects of a Damage Arrestment Device on the Mechanical
Behavior of Sandwich Composite Beams under Four-Point Bending
AUTHOR: Richard Anthony Davis
DATE SUBMITTED: May 2011
COMMITTEE CHAIR: Faysal Kolkailah, Ph.D, P.E.
COMMITTEE MEMBER: Eltahry Elghandour, Ph.D
COMMITTEE MEMBER: Eric Kasper, Ph.D, P.E.
COMMITTEE MEMBER: Susan Opava, Ph.D
Richard Davis
iv
ABSTRACT
The Effects of a Damage Arrestment Device on the Mechanical Behavior of Sandwich
Composite Beams under Four-Point Bending
The demand for an insert on composite sandwich structures to aid in the arrestment of
face-core delamination is of great need. This research studies the use of a damage arrestment
device (DAD) that connects the carbon fiber face sheets to the foam core to find whether an
increase in the structural integrity of the sandwich beam results. Experimental analysis was
employed to test the samples and was verified by a theoretical and finite element approach.
The mechanical properties of LTM45/CF1803 pre-impregnated carbon fiber and Last-A-
foam FR 6710 polyvinylchloride foam were experimentally analyzed using ASTM D3039 and
ASTM D1621 standards respectively to verify the manufacturer’s data for the given material.
With all the mechanical data, the effects of adding DAD keys to a delaminated composite
sandwich beam were studied under a four-point bending test using ASTM standard D6272 and
compared with non-delaminated beams to see if an increase in ultimate strength could be
achieved. The initial delamination in the beams under consideration was one inch in length and
located in between the loaded span of the beam. Two control beams were utilized for
comparison: one with no defects, and another with a one inch delamination introduced at the face-
core interface. The DAD keys were added in two different configurations to potentially stop the
delamination propagation and increase the ultimate strength. In the first configuration DAD keys
were added 0.25 inches on either side of the initial delamination in the transverse direction and
provided a significant increase in strength over the delaminated control beam. The second
configuration had a DAD key running along the longitudinal axis of the sandwich beam and
resulted in a significant increase in ultimate strength over the delaminated control beam. After
testing ten successful samples for each of the six different configurations, it was concluded that
the addition of DAD keys in both configurations significantly increased the structural integrity of
both the delaminated and non-delaminated control beams.
With all the experimental data acquired, finite element models were created in COSMOS.
The purpose of the finite element analysis was to validate the experimental results by comparing
the deflections of the beam subjected to four-point bending during the experiment to the
deflections found numerically. The deflections for the various DAD key configurations found in
the experimental work were in agreement with the finite element results.

Richard Davis
v
ACKNOWLEDGEMENT
I would like to thank my advisors Dr. Kolkailah and Dr. Elghandour for the opportunity
to work on such an interesting and challenging project. Their support and consideration during
all the stages of this thesis are appreciated. It was Dr. Kolkailah’s outlook and methodology of
teaching structures that first interested me in pursuing a master’s degree in this subject. I would
also like to especially thank Dr. Elghandour for his never ending help with all the experimental
testing in the lab. I was able to contact Dr. Elghandour at any time of the day and he would be
there to answer any questions and provide any assistance that I needed.
I give great thanks to my mother and father who are now experts in composite design and
manufacturing after hearing me talk on and on about my thesis work. They were always there for
support throughout my college career. They taught me to ―think big‖ with everything I do and to
not let anything get in my way of achieving my dreams. On those days where school was the last
thing I wanted to think of, my fiancé Kim was there to keep me focused on my work. She
brought me food when I had been in the lab for long hours and picked me up when it was raining
too hard to walk home.
I would also like to thank the Cal Poly Aerospace Engineering Department and C3RP for
their funding and support of this project. In addition, I would also like to thank Cody Thompson
the lab technician and Michael Jacobson for their help in the lab and with the CNC machine used
to cut the foam.

Richard Davis
vi
TABLE OF CONTENTS
List of Tables ............................................................................................................................................ ix
List of Figures ............................................................................................................................................x
List of Symbols ...................................................................................................................................... xiii
1 Introduction ..................................................................................................................................... 1
1.1 Composites Overview .......................................................................................................................... 1
1.2 Types of Composites ............................................................................................................................ 1
1.3 Sandwich Composites .......................................................................................................................... 4
1.4 Advantages and Disadvantages of Sandwich Composites .................................................... 5
1.5 Manufacturing Methods ...................................................................................................................... 5
1.6 Experimental Testing of Composite Sandwiches ..................................................................... 8
1.7 Applications ............................................................................................................................................. 9
1.8 Previous Work ..................................................................................................................................... 10
1.9 Objective of Work ............................................................................................................................... 13
1.10 Scope of Work ...................................................................................................................................... 13
2 Mechanical Characteristics: Testing, Fabrication of Materials, and Theory ........... 15
2.1 Carbon Fiber Face Sheet Mechanical Characteristics .......................................................... 15
2.1.1 Obtaining a Fabrication Method ............................................................................................... 15
2.1.2 The Three Fabrication Methods Considered ......................................................................... 15
2.1.3 Face Sheet Mechanical Characteristics Testing Method (ASTM D3039) ................... 18
2.1.4 Results of Face Sheet Mechanical Characteristics Testing .............................................. 20
2.1.5 Poisson’s Ratio Of Face Sheets (ASTM E132)........................................................................ 23
2.1.6 Density of Face Sheets Theoretical and Experimental Values ........................................ 25
2.2 PVC Foam Mechanical Characteristics ....................................................................................... 26
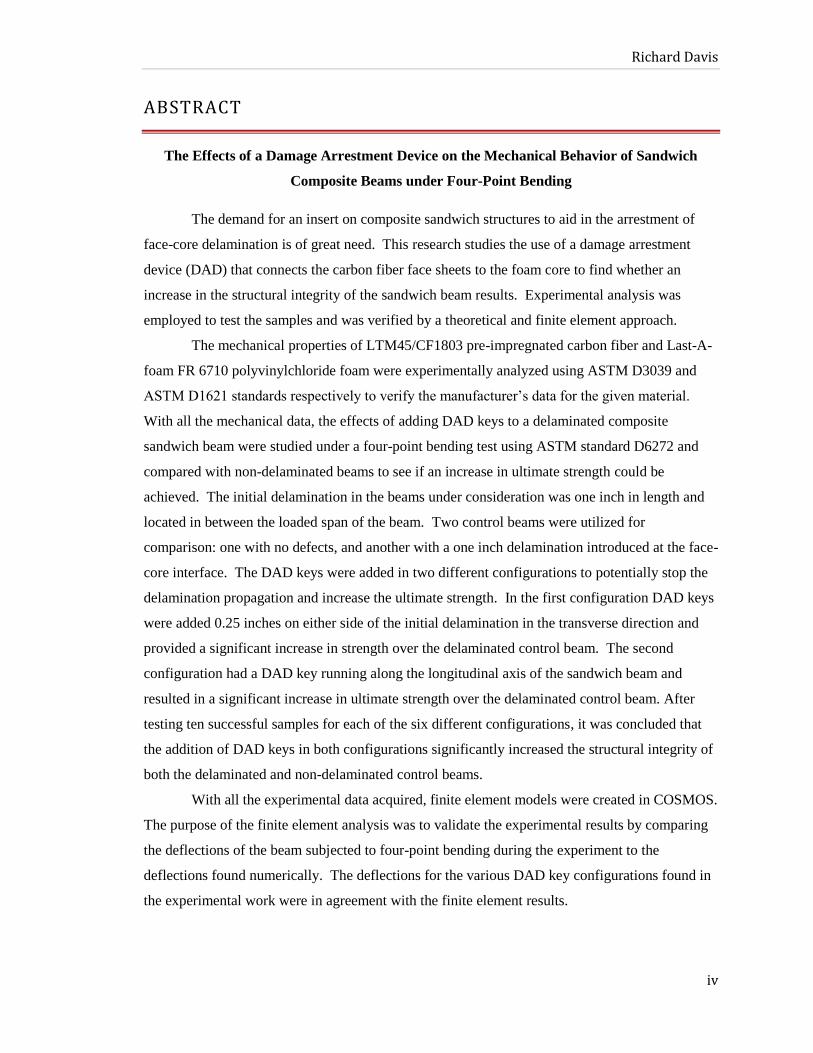
2.2.1 Foam Mechanical Characteristics Testing Method (ASTM D1621) .......................... 26
2.2.2 Foam Mechanical Characteristics Results ............................................................................. 29
2.3 Sandwich Beam Mechanical Characteristics ........................................................................... 30
2.3.1 Sandwich Beam Fabrication Method ...................................................................................... 30
2.3.2 Sandwich Beam Mechanical Properties Test Method (ASTM D6272)......................... 31
2.3.3 Experimental Results For The Mechanical Properties Of The Sandwich Beam ....... 34
2.3.4 Sandwich Beam Mechanical Properties Theoretical Results .......................................... 36
2.4 Comparison of Experimental And Manufacturer Provided Properties........................ 37
3 Experimental Task: Fabrication and Testing of Sandwich Beams .............................. 41
3.1 The Control Specimen (No Delamination) ............................................................................... 41

Richard Davis
vii
3.1.1 Fabrication of Control Specimen .............................................................................................. 41
3.1.2 Control Specimen Test Method (ASTM D6272) ................................................................... 41
3.1.3 Control Specimen Test Results ................................................................................................... 41
3.2 Beam with Initial Delamination.................................................................................................... 42
3.2.1 Fabrication of Delaminated Beam ........................................................................................... 42
3.2.2 Delaminated Beam Test Method (ASTM D6272) ................................................................ 43
3.2.3 Delaminated Beam Test Results ................................................................................................ 44
3.3 Delaminated Beam with Transverse DAD Keys ..................................................................... 45
3.3.1 Fabrication of DAD Keys .............................................................................................................. 45
3.3.2 Fabrication of Foam Core to Accept DAD Keys .................................................................... 49
3.3.3 Fabrication of Delaminated Sandwich Beams with DAD Keys ...................................... 50
3.3.4 Delaminated Beam with Transverse DAD Keys Test Results .......................................... 51
3.4 Non-Delaminated Beam with Transverse DAD Keys ........................................................... 53
3.4.1 Fabrication of Sandwich Beams with Transverse DAD Keys .......................................... 53
3.4.2 Non-Delaminated Beams with Transverse DAD Key Test Results ................................ 53
3.5 Delaminated Beam with Longitudinal DAD Keys .................................................................. 55
3.5.1 Fabrication of Sandwich Beams with Longitudinal DAD Keys ...................................... 55
3.5.2 Delaminated Beams with Longitudinal Case DAD Key Test Results ............................ 56
3.6 Non-Delaminated Beam with Longitudinal DAD Keys........................................................ 57
3.6.1 Fabrication of Non-Delaminated Sandwich Beams with Longitudinal DAD Keys .. 57
3.6.2 Non-Delaminated Beams with Longitudinal DAD Key Test Results ............................. 58
3.7 Comparison of Sandwich Beam Results .................................................................................... 59
4 Numerical Task: Verification of Experimental Deflection ............................................. 61
4.1 Verification of Sandwich Beam Data .......................................................................................... 61
4.2 Control Sandwich Beam Verification ......................................................................................... 61
4.2.1 Mesh Generation and Loading of Control Beam ................................................................. 61
4.2.2 Results and Analysis of Control Beam ..................................................................................... 64
4.3 Control Sandwich Beam with Delamination Verification .................................................. 65
4.3.1 Mesh Generation and Loading of Control Beam with Delamination ........................... 65
4.3.2 Results and Analysis of Control Beam with Delamination .............................................. 66
4.4 Transverse DAD Key Sandwich Beam Verification .............................................................. 67
4.4.1 Mesh Generation and Loading of Transverse DAD Key Sandwich Beam ................... 67
4.4.2 Results and Analysis of The Transverse DAD Key Beam ................................................... 68
4.5 Transverse Case Sandwich Beam with Delamination Verification ................................ 70

Richard Davis
viii
4.5.1 Mesh Generation and Loading of Transverse Case Sandwich Beam with Delamination .................................................................................................................................................. 70
4.5.2 Results and Analysis of Transverse Case Sandwich Beam with Delamination ......... 70
4.6 Longitudinal Case Sandwich Beam Verification .................................................................... 72
4.6.1 Mesh Generation and Loading of Longitudinal Case Sandwich Beam ........................ 72
4.6.2 Results and Analysis of Longitudinal Case Sandwich Beam ........................................... 73
4.6.3 Mesh Generation and Loading of Longitudinal Case Sandwich Beam with Delamination .................................................................................................................................................. 75
4.6.4 Results and Analysis of Longitudinal Case Sandwich Beam with Delamination ..... 75
4.7 Comparison of Experimental and Numerical Deflection ................................................... 76
4.8 Validation Of Model ........................................................................................................................... 77
5 Conclusion ....................................................................................................................................... 79
5.1.1 Overview of Research and Results ............................................................................................ 79
5.1.2 Future Use for the DAD Key Concept ....................................................................................... 80
5.1.3 Future Work ..................................................................................................................................... 80
6 References ....................................................................................................................................... 82

Richard Davis
ix
LIST OF TABLES
Table 1 - Summary of Mechanical Characteristics Testing for Face Sheets ........................................ 22 Table 2 - Beam Test Specimen Dimensions ................................................................................................... 32 Table 3 - Manufacturer's data on Mechanical Properties of Face Sheets and Foam .......................... 37 Table 4 - Summary of Carbon Fiber Mechanical Properties ..................................................................... 38 Table 5 - PVC Foam Core Mechanical Properties Summary .................................................................... 39 Table 6 - Summary of Mechanical Properties of the Composite Sandwich Beam ............................. 39 Table 7 - Summary of All Beam Test Results ................................................................................................ 59 Table 8 - Comparison of all Numerical and Experimental Deflections ................................................. 77

Richard Davis
x
LIST OF FIGURES
Figure 1 – Unidirectional Fibrous Composite .................................................................................................. 2 Figure 2 - Example of how bimetals interact with each other ..................................................................... 2 Figure 3 - Laminated fibrous composite with specific stacking pattern................................................... 3 Figure 4 – Particulate composite on the microscopic level .......................................................................... 4 Figure 5 - A sandwich composite With two carbon-fiber face sheets and a PVC foam core ............ 4 Figure 6 - The wet lay-up method pictorial representation .......................................................................... 6 Figure 7 - Spray-up method pictorial representation ...................................................................................... 6 Figure 8 - Vacuum resin infusion lay-up method ............................................................................................ 7 Figure 9 - The first ten ton sandwich composite boat hull ........................................................................... 9 Figure 10 - Boeing’s first composite commercial aircraft — the 787 Dreamliner ............................. 10 Figure 11 - Peel-stopper concept designed by Jakobsen
3 ........................................................................... 11 Figure 12 - Grenestedt found that this design functioned best in bending and worst in shear
4 ...... 12 Figure 13 - LTM45/CF1803 Prepreg Carbon Fiber With Fabrication Materials ................................ 16 Figure 14 - LTM45 Manufacturer Suggested Cure Cycle .......................................................................... 16 Figure 15 - Tetrahedron Heating Press ............................................................................................................. 17 Figure 16 - Vacuum Bagging Lay-up Stacking Pattern of Materials ...................................................... 18 Figure 17 - Preparation of 10 Samples for Mechanical Properties Testing .......................................... 19 Figure 18 - The Scored Aluminum Tabs Used to Test for Mechanical Properties ............................. 19 Figure 19 - Final Carbon Fiber Test Specimen Dimensions ...................................................................... 20 Figure 20 - Instron Grips with Specimen Loaded ......................................................................................... 20 Figure 21 - Mechanical Characteristics Results From 1000 lbf Lay-up Method ................................ 21 Figure 22 - Mechanical Characteristics From Vacuum Bag and 1000 lbf Lay-up Method ............. 21 Figure 23 - Mechanical Characteristics Results From Vacuum Bag Lay-up Method ....................... 22 Figure 24 - Carbon Fiber Sample Loaded in the Instron Machine for Poisson's Ratio Testing ..... 24 Figure 25 - Poisson's Ratio Obtained by Dividing Slopes of the StRain-Load Curves ..................... 24 Figure 26 - Poisson's Ratio of LTM45/CF1803 Carbon Fiber .................................................................. 25 Figure 27 - Cutting the 2" X 2" Foam Samples ............................................................................................. 27 Figure 28 - Finished Foam Samples Ready for Testing .............................................................................. 27 Figure 29 - The Final Sample Loaded in the Instron Machine to Find Elastic Properties ............... 28 Figure 30 - Stress-Strain Curve of PVC Foam Used to Obtain Mechanical Properties .................... 29 Figure 31 - Lay-Up of a Sandwich Plate .......................................................................................................... 30 Figure 32 - Entire Lay-Up of Sandwich Plate Before Curing ................................................................... 31 Figure 33 - Sandwich Composite Plate Before Cut To Test Dimensions .............................................. 31 Figure 34 –Four-Point Loading of the Sandwich Beam According to ASTM D6272 ...................... 32 Figure 35 - Ten Sandwich Beams Ready to be Tested With ASTM D6272 Standard ...................... 33 Figure 36 - Sandwich Beam Load Versus Deflection to Help Find Mechanical Properties ............ 34 Figure 37 - Sandwich Beam Stress Versus Strain Curve to Find Ultimate Strength ......................... 35 Figure 38 - Typical Failure Mode of the Beam was Face-Core Delamination .................................... 35 Figure 39 - Theory Behind Mechanical Properties of A Sandwich Beam ............................................ 36 Figure 40 - Stress versus Strain Curves for Sandwich Beam Control .................................................... 42 Figure 41 - Non-Porous Material Added to a Sandwich Plate to Create a Delaminated Section... 43 Figure 42 - Delaminated Beam Samples Cut to the Standard Size .......................................................... 43 Figure 43 - Beam With Delaminated Section Located Directly Between the Load-Span................ 44 Figure 44 - Stress versus Strain Plot of Sandwich Beam with Initial Delamination .......................... 45 Figure 45 - Sandwich Beam with Transverse DAD Keys Expanded View .......................................... 45

Richard Davis
xi
Figure 46 - Fifteen-strand Fiberglass Bundles Used to Create DAD Keys ........................................... 46 Figure 47 - Fiberglass Mold Used to Fabricate DAD Keys ....................................................................... 46 Figure 48 - Adding Release Wax to the Mold for Easy DAD Key Removal ....................................... 47 Figure 49 - Hand Lay-up Method Used to Fabricate DAD Keys ............................................................. 47 Figure 50 - 180 Pounds Added On Top of the Plate to Compact the Fiberglass into the Mold ..... 48 Figure 51 - DAD Keys Are Sanded Down Until Each is Separated by the Aluminum Mold ......... 48 Figure 52 - CNC Machines Used to Cut Grooves into the Foam to Accept DAD Keys .................. 49 Figure 53 - Finished Foam Core Pieces Ready to Accept DAD Keys ................................................... 50 Figure 54 - Aeroepoxy Added to DAD Keys ................................................................................................. 50 Figure 55 - Foam with DAD Keys and Initial Delamination Inserted .................................................... 51 Figure 56 - Sandwich Beams with Transverse DAD Keys Cut to Final Testing Dimensions ........ 51 Figure 57 - Stress versus Strain Curve of Delaminated Beam with Transverse DAD Keys ........... 52 Figure 58 - Atypical Failure of Beam with Transverse DAD Key Placement ..................................... 52 Figure 59 - Typical Failure Mode of Delaminated Specimens with Transverse DAD Keys .......... 53 Figure 60 - All the Non-Delaminated Beams Failed Similarly to the Control Specimen ................ 54 Figure 61 – Stress-Strain Curve for Non-Delaminated Beam with Transverse DAD Keys ............ 54 Figure 62 - Sandwich Beam with Longitudinal DAD Key Expanded View ........................................ 55 Figure 63 - Longitudinal Case DAD Keys Added to the Foam Ready to be Laid-up ....................... 55 Figure 64 - Longitudinal Case DAD Key Orientation Side View ........................................................... 56 Figure 65 – The Two Failure Modes Associated with the Longitudinal Delaminated Beam ......... 56 Figure 66 – Stress-Strain Curve for Delaminated Longitudinal Beam With DAD Key ................... 57 Figure 67 - Non-Delaminated Beams with Longitudinal DAD Keys ..................................................... 58 Figure 68 - Typical Failure Mode of Non-Delaminated Beams with Longitudinal DAD keys ..... 58 Figure 69 – Stress-Strain Curve for the Non-Delaminated Beam with Longitudinal DAD Keys . 59 Figure 70 - Control Beam to be Modeled in COSMOS .............................................................................. 62 Figure 71 - Volumes Used to Mesh the Control Beam ................................................................................ 62 Figure 72 - Eight-Node Solid Element Used for all Meshing
15 ................................................................ 63 Figure 73 - Control Beam with Mesh, Loads, and Boundary Conditions Applied ............................. 63 Figure 74 - Displacement Contour Plot of Control Beam .......................................................................... 64 Figure 75 - Deflection Convergence of the Control Sandwich Beam .................................................... 65 Figure 76 - Delamination Modeled by Detached Nodes at the Face-Core Interface ......................... 66 Figure 77 - Stress Contour Plot of the Delaminated Region ...................................................................... 66 Figure 78 - Deflection of Control Beam with Delamination ..................................................................... 67 Figure 79 - Transverse Sandwich Beam to be Verified in COSMOS ..................................................... 67 Figure 80 - Volumes of Non-Delaminated Transverse Sandwich Beam ............................................... 68 Figure 81 - Loads and Boundary Conditions Applied to the Transverse Sandwich Beam .............. 68 Figure 82 - Displacement Contour Plot of Transverse Case Beam ......................................................... 69 Figure 83 - Deflection Convergence of the Transverse Case Sandwich Beam.................................... 69 Figure 84 - Simulation of the Delaminated Region in the Transverse Case Sandwich Beam ........ 70 Figure 85 - Verification of the Delamination's Existence in the Transverse Sandwich Beam ........ 71 Figure 86 - Deflection of the Delaminated Transverse Case Sandwich Beam .................................... 71 Figure 87 - The Longitudinal Case Sandwich Beam to be Verified in COSMOS .............................. 72 Figure 88 - Volumes Generated in COSMOS to Model the Longitudinal Sandwich Beam ........... 72 Figure 89 - Longitudinal Case Sandwich Beam's Loading and Boundary Conditions ..................... 73 Figure 90 - End View of the Longitudinal Case Sandwich Beam's Mesh ............................................. 73 Figure 91 - Midspan Deflection of Longitudinal Case Sandwich Beam ............................................... 74 Figure 92 - Convergence History of the Longitudinal Case Sandwich Beam Solution .................... 74

Richard Davis
xii
Figure 93 - Stress Contours Verifying the Delamination in the Longitudinal Case Beam .............. 75 Figure 94 - Deflection Contours of the Delaminated Longitudinal Case Sandwich Beam .............. 76 Figure 95 - Simply supported composite beam used for validation ................................................. 77 Figure 96 - Equivalent Section Based on Theory ...................................................................................... 78 Figure 97 - Numerical Deflection contours of the Validation Example ........................................... 78

Richard Davis
xiii
LIST OF SYMBOLS
Latin
A Area (in2)
b Width (in)
D Sandwich Beam Deflection (in)
d Depth (in)
E Elastic Modulus (psi)
h Specimen Height (in)
I Moment of Inertia (in4)
L Specimen Length (in)
m Slope
P Load (lbf)
R Load Rate (lbf/min)
V Volume Fraction
Z Strain Rate (in/in)/min
Greek
Δ Change in a given variable
δ Homogeneous Beam deflection (in)
ϵ Strain
ν Poisson's Ratio
ρ Density (lbm/ft3)
ζ Normal Stress (psi)
Subscripts
AL Aluminum
c Compression
fc Foam Core
fibers Relating to the fibers
fs Face Sheets
l Longitudinal
matrix Relating to the matrix
max Maximum Value
ST Steel
t Transverse
y y-direction
x x-direction
xx x-axis

Richard Davis
1
1 INTRODUCTION
1.1 COMPOSITES OVERVIEW
Composites date back to ancient times when indigenous people would use mud and straw
to create a form of shelter. The composites of today’s age still use the same principles. The
straw used to reinforce the walls of the structure is now called the fiber, and the mud is called the
matrix, which holds the fiber in place. We have since moved away from mud and straw for
shelter to carbon fiber and epoxy to create our advanced structures of today.
Composites are two or more materials that are combined on a macroscopic scale to create
a useful material. The word macroscopic is highly significant here because many materials such
as metals are changed on the microscopic level leaving the resulting material homogeneous.
Composites are non-homogeneous materials that can exhibit many improved characteristics on
the macroscopic scale such as: increased strength, stiffness, fatigue life, corrosion resistance, and
thermal insulation.
1.2 TYPES OF COMPOSITES
The three main types of composite materials are fibrous composites, laminated
composites, and particulate composites. Fibrous composites are fibers in a matrix, such as carbon
fiber in epoxy; laminated composites are different layers of various materials, such as a certain
types of knight’s armor; particulate composites consist of one or more materials suspended in a
matrix of another material, such as concrete.
Fibrous composites, as seen in figure 1, depend highly on the length of the fibers in the
matrix. Long fibers are generally much stiffer and stronger than the same material as one
homogeneous bulk material. For example, ordinary plate glass fractures at stresses of only a few
thousand pounds per square inch, yet glass fibers have strengths up to 400,000 to 700,000 psi1.
From this example we can see the geometry of the fibers place a critical role in the evaluation of
the material’s strength. The reason that fibers exhibit increased structural performance, is
because the crystal structure is aligned along the axis of the fiber itself. In the bulk plate of glass,
there are many dislocations of fiber crystal structure that hinder the overall performance of the
plate. Typical fibers used in many composite applications include: E-glass, carbon, graphite,
steel, aluminum, and titanium. The fibers would be completely useless unless there was a
material used to bind them together to form a structural element to take loads. This binding
material, as stated in the previous paragraph, is called the matrix. The matrix is essential to

Richard Davis
2
support the fibers and transfer stresses and loads. The matrix is generally much lower in density,
stiffness, and strength than the fibers; however when the constituents are combined the result can
have a high stiffness and still maintain the low density.
FIGURE 1 – UNIDIRECTIONAL FIBROUS COMPOSITE
In laminated composites, a structure is created such that different layers of various
materials create a new macroscopic structure that combines the best aspects of the constituent
layers. There are five categories of laminated composites: bimetals, clad metals, laminated glass,
plastic-based laminates, and laminated fibrous composites. Bimetals, which are illustrated in
figure 2, are laminates of two materials with different coefficients of thermal expansion. When
the two materials are bound together and there is a significant temperature change, then there will
be a deflection change.
FIGURE 2 - EXAMPLE OF HOW BIMETALS INTERACT WITH EACH OTHER
Clad metal composites are very useful in allowing two materials with different
characteristics to create another material with the best properties of both. For example, nails are
clad with galvanization so that they do not rust when they are exposed to varying weather
conditions. In this case, the strong steel nails that would normally exhibit corrosion are able to
withstand harsh weather conditions by being clad with another material.

Richard Davis
3
The most common example of laminated glass is what we call safety glass. Normal glass
can be very dangerous because under relatively small strains the glass can fracture and send razor
sharp shards everywhere. Another material that is as transparent as glass is polyvinyl butryal
plastic. This material can withstand large strains, but has the disadvantage of scratching easily.
Safety glass is laminated glass, in which there is one sheet of plastic covered with two sheets of
normal glass. This laminated glass can tolerate higher strains and still not scratch so it takes on
an improved form compared to normal glass.
Plastic-based laminates are sheets of different materials that are saturated with various
materials and subsequently treated for many purposes. One example is Formica, which consists
of many layers of phenolic resin-impregnated kraft paper overlaid by a plastic-saturated sheet
which is then overlaid with a plastic cellulose mat. Heat and pressure are used to bind the layers
together resulting in Formica1.
Laminated fibrous composites are a mix of fibrous composites and lamination
composites. In this type of composite, material is built up with the fibers and matrix, then
oriented in different directions with each sheet such that there can be more stiffness in one
direction or another. A fibrous laminate can be seen in figure 3 with a direction-specific stacking
pattern. This is a common technique used in the aerospace, marine, and automotive industry,
where there are specific design requirements that must be met.
FIGURE 3 - LAMINATED FIBROUS COMPOSITE WITH SPECIFIC STACKING PATTERN
Particulate composites consist of particles of one or more materials suspended in a matrix
of another material1. There can be both metallic and nonmetallic particles. One example of a
particulate composite is concrete, where sand and rock are bound together by cement and
hardened. Like concrete, the particles that are added to the mixture can be anything from rubber
to glass flakes to steel. Figure 4 shows a particulate composite on the microscopic level; the
different colors represent the different materials that make up the element.

Richard Davis
4
FIGURE 4 – PARTICULATE COMPOSITE ON THE MICROSCOPIC LEVEL
1.3 SANDWICH COMPOSITES
ASTM (American Society for Testing and Materials) defines a sandwich structure as a
special form of a laminated composite comprised of different materials that are bonded to each
other so as to utilize the properties of each separate component to the structural advantage of the
whole assembly. A sandwich structure, as seen in figure 5, is one that is layered with two very
strong and stiff face sheets that are bonded to a lightweight and compliant core.
FIGURE 5 - A SANDWICH COMPOSITE WITH TWO CARBON-FIBER FACE SHEETS AND A PVC
FOAM CORE
The premise behind sandwich structures is similar to the idea behind I-beams. These two
structures are efficient because as much of the material as possible is placed in the flanges
situated farthest from the center of bending or neutral axis2. Only enough material is left in the
connecting web to allow the flanges to act in unison and resist shear and buckling loads. In the
sandwich structure, the faces take the place of the flanges and the core takes the place of the web.
In most sandwich structures used in industry, the core material is generally a thick, low-
density, low-performing material and the faces are normally thin, high-density, high-performing
material. This configuration allows the entire specimen to have the strength and rigidity of the
face material and have a low density given from the core material.

Richard Davis
5
1.4 ADVANTAGES AND DISADVANTAGES OF SANDWICH COMPOSITES
The biggest advantage of sandwich structures is their ability to utilize each material
comprising the sandwich to its ultimate limit. Utilizing thin face sheets with high stiffness along
with low density cores gives an overall specimen with a high stiffness-to-weight ratio and a high
bending strength-to-weight ratio. Sandwich composites have the continuous support of the face
sheet, unlike a stiffened structure, which implies that surfaces can remain flat even under quite
high compressive stress without buckling2. The ability of sandwich structures to remain flat under
high loads is a very important quality that aircraft control surfaces must have. The use of foam
cores in sandwich structures allows for them to be of great use in spacecraft because of the
additional thermal insulation from the core; ensuring a low structural weight. High thermal
insulation is what is called an ―integrated function‖ for sandwich structures because this
characteristic comes gratis with the concept. Sandwich composites also are free from any nuts,
bolts, or rivets ensuring a continuous design, which is a more structurally sound design method.
Unlike metals, sandwich composites can be manufactured in one piece, thus reducing assembly
costs and ensuring smooth and continuous load paths. As with most design methods, there are
numerous disadvantages associated with the sandwich structure.
Because metal has been around for hundreds of years, there are many standards,
manufacturing techniques, and accepted methods to making structures utilizing these materials.
However, because sandwich composites are relatively new, there are not nearly as many
standards for manufacturing methods. Any used manufacturing methods are in their youth and
are not common practice. Because there are no standards, any type of quality control is a difficult
task especially when the structure being made is an aircraft or spacecraft that must pass the most
strict design requirements. The limited data available on composites forces engineers to be extra
cautious and conservative in their designs thus designing the structures heavier than needed,
which contradicts the main goal of composites: saving weight.
1.5 MANUFACTURING METHODS
There are four main methods that industry uses to manufacture their composite parts: the
wet lay-up method, the spray-up method, the vacuum resin infusion method, and the pre-
impregnated lay-up method. The goal of all these methods is to insert the fibers in a matrix with
a certain curing cycle so as to create a strong structural element to take loads.
The wet lay-up method, seen in figure 6, is one of the oldest methods to creating
composites and is still widely used. In this method a male or female mold that is predesigned to
the specified component dimensions is used to house the fibers and matrix for the curing cycle.

Richard Davis
6
This method is very flexible yet labor intensive and is thus best used for components in a short
production series. Once the mold is made, a special type of gel is coated on the surface to allow
the part to be easily taken out once cured. After the mold is coated, the fibers can be added to the
mold and the resin can be applied. This is the most labor intensive aspect of the process because
the resin must be moved around by hand until the specimen has the correct saturation level of
resin to matrix. Although this process is labor intensive and messy, an experienced wet lay-up
manufacturer can do much better work than any machine used in the other methods.
FIGURE 6 - THE WET LAY-UP METHOD PICTORIAL REPRESENTATION
In the spray-up method a special mixture of resin and discontinuous fibers are mixed
together and shot out of a gun onto a mold; this reduces the manual work required from the wet
lay-up method. As can be seen in figure 7, the roving is moved through a chopper and mixed
with the resin to makeup a paste of discontinuous and randomly oriented fibers. The manual
labor of this method is far less than the wet lay-up method but the final specimen is of far less
quality because of the many dislocations of the fibers, resulting in inferior mechanical properties.
When using this method to create sandwich structures, the core material is the actual mold and
the face material is sprayed directly onto the core.
FIGURE 7 - SPRAY-UP METHOD PICTORIAL REPRESENTATION

Richard Davis
7
The vacuum resin infusion method seen in figure 8 illustrates how a part is created by
pulling resin over a component via a vacuum and allowed to cure in the vacuum bag. The
sandwich composite with its two faces and a core, are put into the vacuum bag with other
materials such as flow media, breathing fabric, and separator to allow the resin to be flowed over
the part. After all the components are in the bag and it is sealed, a hole on one side of the bag is
created and a vacuum is assembled there. Another hole is made on the opposite side of the bag
which allows resin to enter the system. When the vacuum is turned on at one side of the bag, the
resin flows into the bag from the opposite side allowing the part to be saturated with the matrix
material. The flow media is used so that there is an even layer of resin covering the part; the
breather is in place so that the vacuum is always able to suck air and does not get full of resin
before the process is over. One large drawback to this procedure is the fact that the component
being laid-up does not always get a full and even coat of resin because of the way the resin flows
in the bag. Another drawback is the ease at which the vacuum bag can start to leak. Any hole in
the sealing tape or in the bag itself is a recipe for disaster since a hole creates air bubbles in the
bag and allows for inadequate flowing of the resin. When the proper time and methods are used
with the VRI technique, this process can be very effective in making quick accurate parts;
however, any small mistakes can lead to disaster.
FIGURE 8 - VACUUM RESIN INFUSION LAY-UP METHOD
Another method that is in large use in the aerospace industry is utilizing heat to cure pre-
impregnated (prepreg) carbon fiber. Prepreg is a type of carbon fiber that has already been
manufactured into rolls that contain the correct ratio of resin to fiber. To make a part, the prepreg
needs to be heated and cured at a specified curing cycle. Prepreg is the least messy, most
reproducible, most quality controlled method for creating composite structures. The largest

Richard Davis
8
drawback is the high cost of obtaining prepreg, which limits its use to the aerospace sector and
more technical industries. Prepreg is very expensive because it takes many more manufacturing
processes, time, and labor to make the composite product with the matrix pre-embedded into the
fibers.
1.6 EXPERIMENTAL TESTING OF COMPOSITE SANDWICHES
The theory and differential equations behind composite sandwiches can get messy very
quickly. To find such properties as stresses, strains, Young’s modulus, Poisson’s ratio, and other
mechanical characteristics, it is sometimes easier to test the material. Theoretical estimations are
sometimes good tools in the early design stages to obtain approximate mechanical properties.
However, at later stages more accurate data might be a necessity and then one must rely on
testing2. Testing is the most important part of the design and verification process of a structure.
For example, at some point in a design process one may need to verify the physical behavior of a
sub-structure. As hand calculations can give good estimates of mechanical phenomenon, testing
or numerical simulation is often necessary to get more accurate real life data.
The testing of composite sandwiches is unlike the testing of any other type of structure.
Composites have very few ASTM standards to guide the tester with a proven method. Much of
the research currently being conducted on composites involves how to come up with an accurate
test method for certain properties. There are some general guidelines that must be followed when
attempting to test a composite specimen. Taking extra precaution to avoid notches, uneven
surfaces, undercuts, or creating delaminations is key when machining the parts. Also, when
machining an entire sandwich specimen, extra measures must be taken to ensure that the sample
does not get ruined because of the different materials comprising the sandwich. Some drilling
procedures used to cut through the rigid face sheets can start to melt some of the softer cores with
lower heat resistances.
The key to testing sandwich composites is to give extreme attention to detail to all lay-up,
machining, and physical testing procedures. The extra time that it takes to write down
configurations, dimensions, angles, etc. can save a lot of time later in the process when those
details are needed.
There are many different physical properties that can be found from testing composite
sandwiches. The mechanical properties of the face sheets, core, and entire sandwich can be found
from either tension or compression testing in an Instron machine. These types of tests for tensile
and compressive properties have ASTM and ISO standards to help guide the process. Other tests

Richard Davis
9
that have ASTM standards relating to them include in-plane shear tests, flexural tests, three-point
bending tests, four-point bending tests, impact tests, fatigue tests, and many more.
1.7 APPLICATIONS
The use of composites is in high demand because of their great mechanical characteristics
and material properties. The use of the sandwich configuration is a hot topic in the aerospace
industry because of its increased stiffness and lightweight properties when compared to the
aviation standard which is aluminum. In recent years, the sandwich structure is becoming a
widely researched topic because of the continual exploration of the perfect material for the newest
spacecraft, car, or racing yacht.
In the civilian world the use of sandwich composites is seen in many of our common
modes of transportation. Some of the big rigs we see on the road have storage containers built of
sandwich composites. This design configuration allows for great thermal insulation to allow for
the shipping of goods such as chemicals, livestock, and even fruit. In addition to the great
thermal effects the design has, it also allows for a lower overall structural weight to allow the
carrier to increase its payload capacity. Racecars and boats are also seeing a large movement into
fiberglass and carbon fiber for the weight reduction. The use of composites in these modes of
transportation allows the designers to create complicated geometries that are low in weight,
structurally sound, with fewer parts. Figure 9 illustrates the first large commercial boat hull
created entirely from sandwich composites.
FIGURE 9 - THE FIRST TEN TON SANDWICH COMPOSITE BOAT HULL
The military and aerospace industry have the ability to take the use of sandwich
composites to the next level. One of the largest problems associated with designing aircraft is
making a feasible design that is light enough to fly the desired mission. Sandwich composites
allow just that. The two face sheets create a material that is almost as stiff as steel and the core

Richard Davis
10
allows for a lower density, which makes the aircraft’s total weight much less. Some of the
heaviest structures of an aircraft such as the wings, floor, fuselage, and even control surfaces are
able to be created from sandwich structures. Figure 10 shows the newest addition to the
commercial aircraft transportation world: the Boeing 787. This is the first commercial aircraft in
existence to be created almost entirely from composites. The military is currently looking into
using sandwich composites on their tanks to allow aircraft to be able to carry multiple vehicles in
one trip. As we can see, sandwich composites are a very versatile material that will hold a strong
position in both the commercial and military future.
FIGURE 10 - BOEING’S FIRST COMPOSITE COMMERCIAL AIRCRAFT — THE 787 DREAMLINER
1.8 PREVIOUS WORK
To aid in finding the best materials, manufacturing methods, and test procedures,
reviewing previous work on similar research is of great value. Researching previous work can
help an investigator know what has worked in the past and what has failed, which can save time
and money. All the previous work that has been reviewed has been published papers on Science
Direct related to composite sandwiches, delamination, and three and four-point bending test
methods. The work that has been the most helpful is J. Jakobsen’s Peel-Stopper Design for
Sandwich Composites3, Grenestedt’s Development of a New Peel-Stopper for Sandwich
Structures4, Wisnom’s Failure Mechanisms in Three and Four-Point Bending Tests
5, Zenkert and
Burman’s Fatigue of Foam Core Sandwich Beams6, and Kim and Lee’s Evaluation of Durability
and Strength of Stitched Foam-Cored Sandwich Structures7.
In J. Jakobsen’s paper that addresses the peel-stopper, the purpose of the peel stopper is
to effectively stop the development of delamination by rerouting it to a predefined zone in the
structure. The peel-stopper design, as can be seen in figure 11, was experimentally tested with
various types of materials to make sandwich beams that were subjected to a three-point bending
load. This design was successful in stopping delamination in the face-core interface. What the

Richard Davis
11
researchers found was that the peel-stoppers that worked the best were made with materials with
large straining capabilities, i.e. ductile materials. This paper also explained that the three-point
bending test is the test of choice for delamination research because it provides a constant shear
load across the entire specimen. The experiment discovered that the ability for the peel-stopper to
effectively stop crack propagation was highly dependent upon the stiffness of the inserted wedge.
This finding of Jakobsen’s is of high interest to the work discussed in this paper; the material
used as the wedge, or in this case the DAD key, makes a large impact on the end result. Jakobsen
also found that the peel-stopper only worked when it was embedded throughout the entire
specimen, connected to both face sheets. The design under consideration in this paper does not
connect both face sheets so the difference between the results of each experiment will be
interesting to compare.
FIGURE 11 - PEEL-STOPPER CONCEPT DESIGNED BY JAKOBSEN3
Joachim Grenestedt’s research on peel-stoppers for sandwich structures found that the
specimen could be fabricated with the peel-stopper inserted without affecting the overall
structural strength of the part. Grenestedt’s idea of coming up with a new peel-stopper design
arose from the failing of boat hulls when a small crack would make the skin debond and grow
like a fatigue crack. Two main tests were performed: quasi-static mechanical tests were
performed to verify the function of the peel-stopper, and the strength of the structure
incorporating the peel-stopper4. The results concluded that the peel-stopper design was as strong
as a control specimen without an insert when faced with a bending load. However, the specimen
with a peel-stopper was not as strong as the control specimen when subjected to a shear load.
This paper concludes that peel-stopping devices should be placed in areas where shear loads are
not too high because they have an adverse affect on the overall structural integrity of the sample.
Again, this method uses an anti-delamination device that connects the two face sheets. Like
Jakobsen’s paper, our results will be interesting to compare to the results of this paper to see how

Richard Davis
12
a DAD key compares to a peel-stopping insert. Although the same basic method used in
Jakobsen’s and Grenestedt’s paper has proved the ability for the insert to stop crack propagation,
the ability for the insert’s use in industry seems limited because of the complex fabrication
techniques that must be used to create and employ the inserts.
FIGURE 12 - GRENESTEDT FOUND THAT THIS DESIGN FUNCTIONED BEST IN BENDING AND
WORST IN SHEAR4
Michael Wisnom’s paper that addresses the interaction between the overall interlaminar
shear and stresses at terminating plies, concentrates on the fact that composite structures are
susceptible to delamination where fiber plies are terminated. It was found via three-point bending
tests that the delamination started in the matrix material in the area of the terminated plies.
Wisnom also performed four-point bending tests and found that they too delaminated; however,
they fail in flexure before they reach full delamination failure. This research has been helpful in
showing that when testing specimens for delamination, three-point bending tests are preferred to
four-point bending tests because they allow for a prolonged delamination state without the high
flexure associated with the four-point test.
From all the research conducted, it is widely agreed that the largest contributor to the
failure of these structures is face-core delamination, which is the crack initiation and propagation
between the face-core interface8. Previous methods to study the effects of delamination include
the famous double-cantilever beam tests under a monotonic load, and three and four-point
bending tests. Crack initiation and propagation under a three-point bending load was studied by
Zenkert and Burman who found that the failure started near the center of the specimen and moved
to the face-sheets to continue delaminating outward6. A great amount of research has also found
that an insert into the core-face interface exerts a significant influence on the fatigue life of the
sandwich assembly. Face-core delamination was found to be the dominating failure mode. The
tendency for sandwich structures to fail rapidly once in the face-core delamination mode make
the configuration very dangerous for systems that must have a low safety factor.

Richard Davis
13
A large amount of research has been dedicated toward finding ways to stop or inhibit
delamination failure. One of the theoretical solutions being researched is called the stitching
method, which physically connects the upper and lower face sheets with fibers. This method
increases the fracture toughness between the core and the face sheets by several magnitudes7.
Although this method used to inhibit crack propagation seems highly applicable to industry, it is
extremely difficult to manufacture these sandwich specimens for large scale projects which limits
their use.
1.9 OBJECTIVE OF WORK
The goal of this research is to study whether adding a DAD key into a sandwich
composite beam can add strength to the specimen before failure due to delamination. All
published research on stopping delamination through the utilization of an insert has only
considered inserts that physically connect both face sheets through the foam core. Although this
is a proven method to increase sandwich beam strength with an initial delamination, it is hard to
implement on designs because of the component complexity. The DAD key is an innovative
method that has not been considered in the past to add structural integrity to a sandwich beam that
is also much easier to manufacture and implement than previous methods. The DAD key design
that is considered in this paper as a means to help prevent delamination propagation can be
employed on many aerospace structures such as cargo floors of commercial and military jets, the
marine industry, and many others. The DAD keys could be implemented at places of high stress
concentration where delamination is most likely to occur, which would raise the ultimate stress
level of the local area. Another potentially far reaching use for the DAD key design is in
repairing structures that are already starting to experience crack growth or unforeseen high stress
concentrations.
1.10 SCOPE OF WORK
The remainder of this research is organized in the chronological order of experimental
events that took place leading up to the final conclusion. Chapter one will focus on the
fabrication and mechanical characteristics testing of the material to find a common production
method for the sandwich beam. This chapter also goes through the process in which the elastic
modulus of the face sheets, foam, and the sandwich beams were discovered experimentally.
Chapter two covers the four-point bending test method used to obtain results for the ultimate
strength of the control specimens as well as the specimens with a delamination and DAD keys.
Chapter three goes through a finite element approach to this experimentation using COSMOS
FEA software. Chapter four offers a comparison between experimental and numerical results for

Richard Davis
14
the four-point bending test considered in chapter two. The last major section of this paper is the
conclusion where all the test results are put into their final form and interpreted on a global scale.

Richard Davis
15
2 MECHANICAL CHARACTERISTICS: TESTING, FABRICATION OF MATERIALS, AND THEORY
This chapter will discuss the three different fabrication methods considered for all sample
testing throughout the experimental phase. This section will also address the testing of each
fabrication method and have a comparison of all results to show which method will be best for
laying up the sandwich beams. Finding the elastic modulus, ultimate strength, Poisson’s ratio,
and density of the face sheets, foam, and the two combined using the selected fabrication method
is the goal of this chapter. At the end of the chapter there will be a comparison of theoretical and
experimental results for the sandwich beam.
2.1 CARBON FIBER FACE SHEET MECHANICAL CHARACTERISTICS
2.1.1 OBTAINING A FABRICATION METHOD
There are too many ways to lay-up carbon fiber sandwich composite beams; therefore, a
common method for all testing must be established. There are three common ways to lay-up
prepreg carbon fiber: with heat and force, heat and force and vacuum bagging, and heat and
vacuum bagging only. To come up with an established method of fabricating all specimens in the
future all the characteristics of each method must be considered to find the best fit.
Samples of each of the three methods were tested and the mechanical characteristics were
compared. For each method considered, an auxiliary test accompanied each set of samples that
included a layer of sheet resin in between two layers of carbon fiber. The sheet resin is used to
super-saturate the carbon fiber with resin, simulating the process that is used when bonding the
face-sheets to the foam core. More often than not, the resin in the prepreg is not enough to make
a strong enough bond to the foam core; therefore the sheet resin is utilized to make the bond
stronger. The metric that made one process better than another was the method that yielded the
highest consistent Young’s modulus. In addition to providing the answer to the best fabrication
method, the Young’s Modulus is also essential in the numerical stage where the mechanical
characteristics of each constituent must be known to create a valid finite element model.
2.1.2 THE THREE FABRICATION METHODS CONSIDERED
Each method uses LTM45 prepreg matrix with CF1803 bidirectional woven carbon fiber,
which can be seen in figure 13. The LTM45 has a manufacturer’s specification as to the cooking
cycle of the laminates. The cooking cycle seen in figure 14, displays how the carbon fiber starts

Richard Davis
16
at room temperature under the force of a vacuum or press and is heated to 149 degrees Fahrenheit
at a rate of four degrees per minute and sustained at that level for sixteen hours then cooled to
room temperature at 5 degrees per minute.
FIGURE 13 - LTM45/CF1803 PREPREG CARBON FIBER WITH FABRICATION MATERIALS
FIGURE 14 - LTM45 MANUFACTURER SUGGESTED CURE CYCLE
The first method considered uses the heating cycle specified above with the 1000 pound
force of the Tetrahedron press seen in figure 15. The prepreg is cut into 12‖ x 12‖ squares and
inserted between two layers of porous and non-porous material respectively. The stacking of the
materials is as follows: non-porous material, porous material, two layers of bi-directional CF1803
prepreg carbon fiber, porous material, and non-porous material. The porous material is essential
because it allows for resin to flow through its layer and fully saturate the prepreg carbon fiber.
The non-porous material is used for multiple reasons. First, it does not allow resin to travel
through its layer so it keeps the heating press clean from resin, and second, it also allows for the
0
50
100
150
200
0 5 10 15 20
Tem
pe
ratu
re (
°F)
Time (hrs)
LTM45 Cure Cycle

Richard Davis
17
carbon fiber plate to be peeled easily from the press because it does not stick. The porous material
is also cut to the same dimensions as the prepreg; however, because the resin becomes liquid
during the heating cycle, the non-porous material is cut to 14‖ x 14‖ so that the resin does not
leak everywhere. This stacking pattern, seen in figure 13, allows the carbon fiber to fully cure
while also keeping a clean environment for the heating press machine. It is crucial to line up the
two sheets of carbon fiber at right angles to each other so that comparing results between two
different panels is accurate. If the prepreg orientation were not implemented carefully, then any
small angles of disorientation would have dramatic changes on the end result. The materials are
subsequently placed between two heavy galvanized steel plates to create a perfectly flat surface
for the plates of carbon fiber and then cured in the Tetrahedron press. This same method is
repeated with a sheet of resin added between the two prepreg layers to simulate the case where
the face sheets are bonded to the foam. The sheet resin is from the Advanced Composites Group
lab in the United Kingdom and must be kept in the freezer. When the sheet resin is taken out of
the freezer there is only about a two minute time period where the resin is solid before it starts to
melt and run off the plate. It is important that the resin is kept in the freezer until it is needed so
that it can easily be added between the two layers of prepreg before it begins to melt.
FIGURE 15 - TETRAHEDRON HEATING PRESS
The second method uses the same curing cycle but with vacuum bagging instead of the
1000 pound force used in the first method. Although there is no force, the heating press must still
make contact with the specimen so there is a force set on the machine to ten pounds. The
stacking of the materials in the bagging is the following: vacuum bag, non-porous material,
porous material, carbon fiber, porous material, non-porous material, vacuum bagging. There is
also a breather and a hole in the bag that allows for the vacuum to take out all air without sucking

Richard Davis
18
in resin; the vacuum bagging materials are seen in figure 16. Like the first method, sheet resin can
be inserted in between the two layers of carbon fiber and fabricated the same way.
FIGURE 16 - VACUUM BAGGING LAY-UP STACKING PATTERN OF MATERIALS
The third method uses the same curing cycle with force and vacuum bagging as the
second method. This technique is the same as the second process except the heat press is set to
1000 pounds instead of ten pounds.
2.1.3 FACE SHEET MECHANICAL CHARACTERISTICS TESTING METHOD (ASTM D3039)
Testing the face-sheets that were laid up using the three different fabrication methods
were performed according to ASTM standard D30399—a process used to find mechanical
characteristics of carbon fiber samples. In this standard, samples are cut to the dimension 10‖ x
1‖ as can be seen in figure 17. Cutting the specimens to the desired dimensions required a tile
saw with an accurate measuring device to ensure repeatability between samples. When the
specimens were cut, the order and orientation of each sample was noted so that an accurate
comparison of results could be attained. With carbon fiber, a slight change in order or orientation
could be devastating to a series of tests; it is important that the necessary attention to detail be
paid for keeping an organized testing order.
Aluminum tabs, also seen in figure 17, were then purchased from a machine shop that
were fabricated to the exact dimensions called for in the standard with a tolerance of +/- .005
inches. Adherence of this standard yielded accurate results. In the past, aluminum tabs were cut
by hand without an accurate measuring device using a saw that left burred edges that have the
potential to fracture the composite material. The tabs were then scored, as seen in figure 18, with

Richard Davis
19
a cutting device. Scoring the tabs allows for a better grip between the smooth carbon fiber and the
otherwise smooth aluminum; with the tabs scored, the bonded surface area increases significantly.
These tabs were then cleaned and attached to the carbon fiber samples with a resin-epoxy
adhesive. Once the samples were cured, they were ready to start the tension testing in the Instron
machine. Figure 19 shows the final samples with the proper dimensions.
FIGURE 17 - PREPARATION OF 10 SAMPLES FOR MECHANICAL PROPERTIES
TESTING
FIGURE 18 - THE SCORED ALUMINUM TABS USED TO TEST FOR MECHANICAL
PROPERTIES
The standard tension testing method was then programmed into the Instron machine such
that each sample was tested the same exact way. Each specimen was put into the Instron jig so
that the specimen was parallel with the grips and perpendicular to the floor as can be seen in
figure 20. The carbon fiber sample was then loaded in tension until it breaks or until the load
drops by 40 percent. The Instron machine records all testing data: stress, strain, load, elongation,
and ultimate stress. The data for each sample was recorded on the computer then analyzed to
obtain the Young’s modulus. The Young’s modulus was found by graphing the stress against the
strain and finding the value of the slope. The resulting slope in the linear region is the Young’s
modulus value. This standard testing process was then repeated for each of the three lay-up
methods considered above.

Richard Davis
20
FIGURE 19 - FINAL CARBON FIBER TEST SPECIMEN DIMENSIONS
FIGURE 20 - INSTRON GRIPS WITH SPECIMEN LOADED
2.1.4 RESULTS OF FACE SHEET MECHANICAL CHARACTERISTICS TESTING
The three different methods considered to lay-up the LTM45/CF1803 prepreg system
were all tested according to ASTM D3039 testing standard and the results were all compared.
The stress versus strain curves for each sample were plotted on a graph that pertained to a certain
lay-up method. On each plot, ten samples are of two layers of carbon fiber and ten samples are
from two layers of carbon fiber with a layer of sheet resin in between. In every method
considered, the case with only two layers of carbon fiber had the higher elastic modulus.
Specimens with sheet resin were all much lower in the modulus value. This phenomenon is
expected because the sheet resin adds more cross-sectional area to the test specimen, which
lowers stress values.
The slopes of the stress-strain curves in the linear region were all taken and the elastic
modulus was calculated. The moduli for each test method were then averaged resulting in an
elastic modulus that could be assigned to each method. Figures 21 through 23 illustrate the
average elastic modulus for each case in addition to depicting how accurately each testing
procedure was followed. The slopes of each specimen for the separate cases are almost on top of

Richard Davis
21
each other, which demonstrates how there are distinct characteristics of each testing process that
affect the laminae differently.
FIGURE 21 - MECHANICAL CHARACTERISTICS RESULTS FROM 1000 LBF LAY-UP
METHOD
FIGURE 22 - MECHANICAL CHARACTERISTICS FROM VACUUM BAG AND 1000 LBF
LAY-UP METHOD
0
20000
40000
60000
80000
100000
120000
0 0.005 0.01 0.015 0.02
Ten
sile
Str
ess
(p
si)
Tensile Strain (in/in)
1000 lbf Only
No Sheet Resin: Eavg = 7,454,900 psi
Sheet Resin: Eavg = 5,642,200 psi
0
20000
40000
60000
80000
100000
120000
0 0.005 0.01 0.015 0.02
Ten
sile
Str
ess
(p
si)
Tensile Strain (in/in)
Vacuum Bag + 1000 lbf
No Sheet Resin: Eavg = 7,138,700 psi
Sheet Resin: Eavg = 5,311,200 psi

Richard Davis
22
FIGURE 23 - MECHANICAL CHARACTERISTICS RESULTS FROM VACUUM BAG LAY-
UP METHOD
In addition to recording all the elastic moduli for each test method considered, the
ultimate stress values were also recorded for each sample. This value is important when
theoretically determining the ultimate stress of the entire sandwich beam. A summary of all the
mechanical characteristics testing can be seen in table 1. This table shows the average elastic
modulus, the average ultimate stress, and some important statistical factors that were considered
in choosing a method for the rest of the research to be carried out.
TABLE 1 - SUMMARY OF MECHANICAL CHARACTERISTICS TESTING FOR FACE
SHEETS
Force Only Force + SR Force + VB Force + VB + SR No Force +VB No Force + VB + SR
Average Elastic Modulus (psi), ASTM D3039 7,454,900 5,642,200 7,138,700 5,311,200 7,008,100 5,023,200
Elastic Modulus Standard Deviation (psi) 187,062 142,642 160,182 135,572 171,672 73,578
Elastic Modulus Standard Deviation (%) 2.51 2.53 2.24 2.55 2.45 1.46
Average Ultimate Stress (psi), ASTM D3039 112,300 86,700 104,200 81,800 101,600 83,300
Ultimate Stress Standard Deviation (psi) 2737 1826 1701 4179 7754 1912
Ultimate Stress Standard Deviation (%) 2.44 2.11 1.63 5.12 7.63 2.29
VB = Vacuum Bag, SR = Sheet Resin
The factors considered in choosing a fabrication method were the elastic modulus,
ultimate stress, lay-up complexity, cost, and some statistics of the mechanical properties testing.
0
20000
40000
60000
80000
100000
120000
0 0.005 0.01 0.015 0.02
Ten
sile
Str
ess
(p
si)
Tensile Strain (in/in)
Vacuum Bag Only
No Sheet Resin: Eavg = 7,008,100 psi
Sheet Resin: Eavg = 5,023,200 psi

Richard Davis
23
The need for a method that produces consistent results is of great importance when investigating
sandwich beam behavior; for this reason some statistics such as averages and standard deviations
were considered for each method. Standard deviations were taken of the average elastic modulus
and the average ultimate stress to make sure that the results were not misleading, and that the use
of that method would be repeatable in the future. As seen in table 1, all of the standard deviations
of the data are within statistical reason to be considered repeatable and accurate. The smallest
standard deviation for the elastic modulus was 1.46 percent and the largest was 2.55 percent,
which conveys statistical confidence in the values obtained. The ultimate stress had standard
deviations that ranged from 1.63 to 7.63 percent. The first method, with only force from the heat
press, was the easiest to perform, had the lowest operating costs, lowest material costs, and
yielded the best mechanical properties.
The standard deviations for the method with only force were 2.51 and 2.44 for the elastic
modulus and the ultimate stress respectively, which shows that this method is statistically
repeatable and accurately tested. The average elastic modulus was 7,454,900 psi and the average
ultimate stress was 112,300 psi, which were both the largest values of each category. For these
reasons, this method was chosen for the production of sandwich samples used in further
investigations.
In addition to finding the elastic modulus and ultimate strength of the face sheets, a strain
gauge was added in the lateral direction to the loading in order to find the Poisson’s ratio of the
material. This is found by taking the negative of the strain in the lateral direction and dividing it
by the strain in the longitudinal direction.
2.1.5 POISSON’S RATIO OF FACE SHEETS (ASTM E132)
The method used for finding the Poisson’s ratio of the face sheets follows ASTM E13210
testing standard, which is a subsidiary standard of ASTM D3039. This method follows the exact
fabrication and test method as the ASTM D3039 standard, which finds the elastic modulus of a
carbon fiber sample. The only difference between this test and the previous test is that a strain
gage is added in the transverse direction in order to capture the two-dimensional behavior of the
laminae.
The Instron machine calculates the strain in the longitudinal direction during the tension
test so the extensometer strain gage is added to each sample in the transverse direction and loaded
as seen in figure 24.

Richard Davis
24
FIGURE 24 - CARBON FIBER SAMPLE LOADED IN THE INSTRON MACHINE FOR
POISSON'S RATIO TESTING
To obtain the values of Poisson’s ratio the ASTM standard suggests plotting the average
strain versus the load for both the longitudinal and transverse direction as seen in figure 25.
FIGURE 25 - POISSON'S RATIO OBTAINED BY DIVIDING SLOPES OF THE STRAIN-
LOAD CURVES

Richard Davis
25
To obtain the Poisson’s ratio from this data, the derivative of the strain (slope) in the
transverse direction is divided by the derivative of the strain in the longitudinal direction as seen
in equation 1.
(1)
Where ν is the Poisson’s ratio, P is the applied load, and εt and εl are the transverse and
longitudinal strains respectively. A plot of the strain versus load curve for the average strains in
the longitudinal and transverse directions can be seen in figure 26. The final Poisson’s ratio of the
face sheets was found to be 0.091, which is a common value for materials like the bi-directional
carbon fiber sheets that are being used.
FIGURE 26 - POISSON'S RATIO OF LTM45/CF1803 CARBON FIBER
2.1.6 DENSITY OF FACE SHEETS THEORETICAL AND EXPERIMENTAL VALUES
Face sheet density is relevant to this research because, during the finite element analysis,
the mass of each element is essential in calculating various mass property values. Experimentally
the values of density are easily found by taking a sample of the material and performing various
volume and mass calculations to find the density.
To find the density of the LTM45/CF1803 carbon fiber face sheets, a sample that was
already cured was cut to a 12‖ x 12‖ square where lengths and thicknesses were measured with a
micrometer. The weight was then measured. This procedure was repeated for 10 samples to
0
0.0005
0.001
0.0015
0.002
0.0025
0.003
0.0035
0.004
0.0045
0.005
0 200 400 600 800 1000 1200
Stra
in (
in/i
n)
Load (lbf)
Poisson's Ratio Tension Test
ν xy, avg = 0.091

Richard Davis
26
ensure statistical accuracy. The density was then found by dividing the masses of the samples by
the volumes of the samples, which came out to be an average of 93.31 pounds per cubic foot.
To validate the experimental density, the theoretical value was calculated using the
densities of each constituent along with the volume fraction of the laminae. The density of the
LTM45 resin and CF1803 carbon fiber was provided by the Advanced Composites
Group11
Company and was 1.24 and 1.76 grams per cubic centimeter respectively. With the
volume fraction of 60 percent known, equation 2 can be used to find the density of the entire
laminate:
(2)
with this equation, the theoretical value of 96.89 pounds per cubic foot was found, which differs
by only 3.7 percent when compared with the experimental value obtained.
2.2 PVC FOAM MECHANICAL CHARACTERISTICS
2.2.1 FOAM MECHANICAL CHARACTERISTICS TESTING METHOD (ASTM D1621)
The test method for obtaining the PVC (polyvinylchloride) foam mechanical
characteristics follows ASTM D162112
standard: the test method for finding compressive
properties of rigid cellular plastics. This test method describes the procedure for determining the
compressive properties of rigid cellular materials, particularly expanded plastics. In this
procedure, data is acquired and a complete load-deformation curve is obtained, which yields the
compressive stress at any load as well as the effective modulus of elasticity.
The test specimen is made from PVC rigid foam and is cut to a 2‖x 2‖ square cross-
section with a height of 2 inches. Extra care is taken to ensure the loaded ends of the specimen
are parallel to each other and perpendicular to the sides. If samples contain any defects it is
imperative that the sample is discarded and a new one made. Because the foam is only 0.5 inches
thick, the layers had to be stacked in order to obtain the proper dimensions according to the
testing standard. Figure 27 shows how the foam was cut from the larger sheet with a straight
edge and razor blade, and figure 28 illustrates a finished sample.
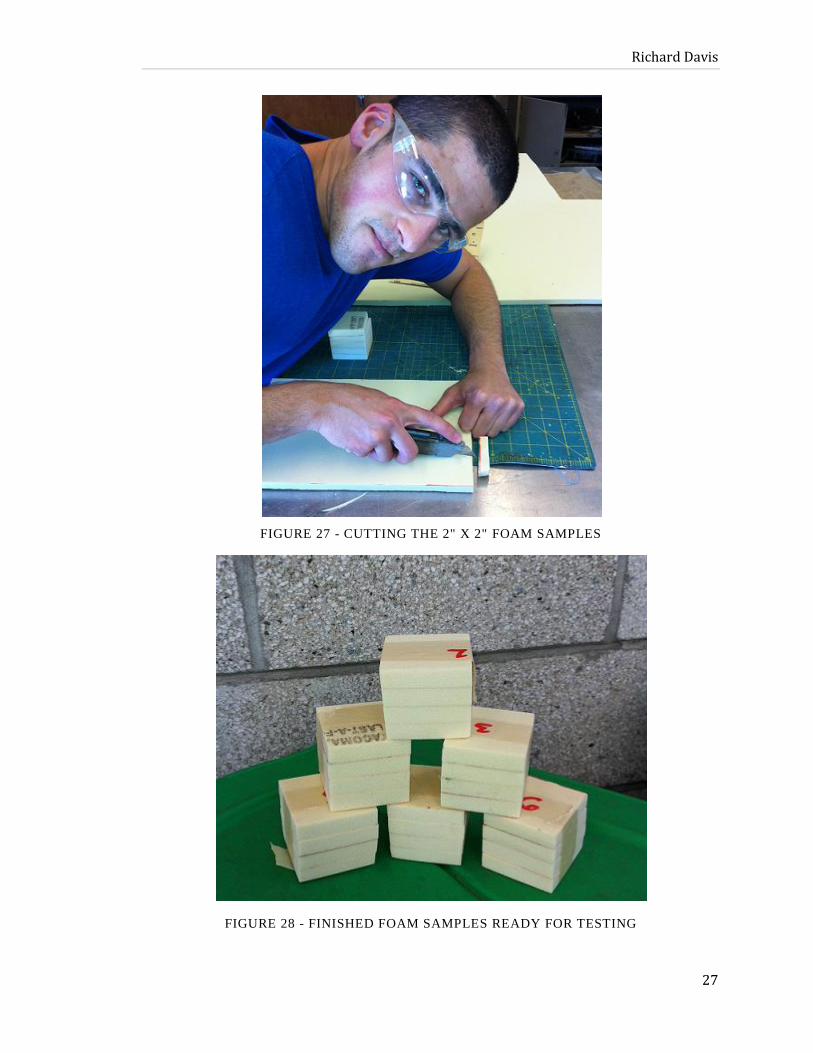
Richard Davis
27
FIGURE 27 - CUTTING THE 2" X 2" FOAM SAMPLES
FIGURE 28 - FINISHED FOAM SAMPLES READY FOR TESTING

Richard Davis
28
Before starting the actual compressive testing, all samples are measured with a
precision measuring device with a tolerance of ± 1% of the to tal dimension. All
dimensions are recorded three times and averaged to obtain an average dimension. The
specimen is then positioned in the Instron machine that is equipped with two parallel
plates used to compress the test specimen, ensuring that the sample is centered in the
plates so that the load is uniformly distributed over the entire specimen. The specimen
is then compressed at a rate of 0.1‖ per minute for each inch of specimen thickness.
The samples loaded in the Instron machine between the para llel anvil plates can be seen
in figure 29. The load-deformation curve is then generated and the mechanical
properties are obtained. The sample is compressed until a yield point is reached or
until the specimen has compressed 13% of its overall thickness
FIGURE 29 - THE FINAL SAMPLE LOADED IN THE INSTRON MACHINE TO FIND
ELASTIC PROPERTIES
After the samples are tested, the load-deformation curve is generated by the Instron
machine which allows for the elastic modulus to be determined. The elastic modulus can be
calculated by using the following equation from the testing standard:
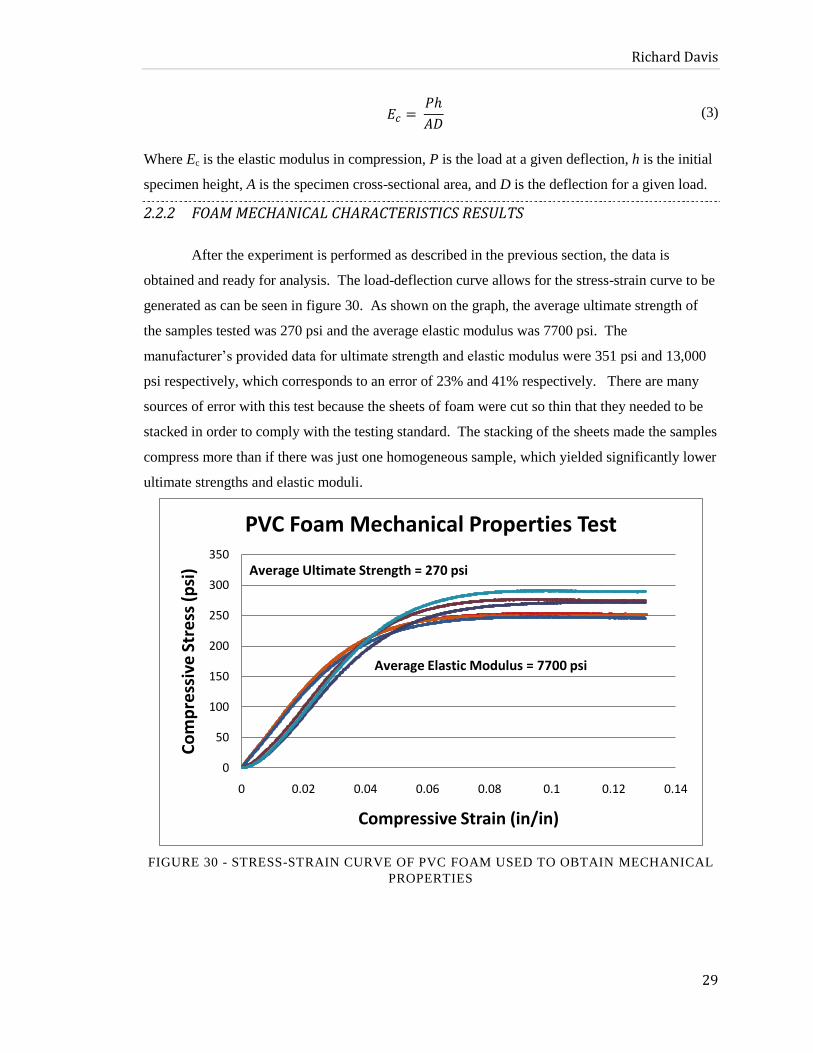
Richard Davis
29
(3)
Where Ec is the elastic modulus in compression, P is the load at a given deflection, h is the initial
specimen height, A is the specimen cross-sectional area, and D is the deflection for a given load.
2.2.2 FOAM MECHANICAL CHARACTERISTICS RESULTS
After the experiment is performed as described in the previous section, the data is
obtained and ready for analysis. The load-deflection curve allows for the stress-strain curve to be
generated as can be seen in figure 30. As shown on the graph, the average ultimate strength of
the samples tested was 270 psi and the average elastic modulus was 7700 psi. The
manufacturer’s provided data for ultimate strength and elastic modulus were 351 psi and 13,000
psi respectively, which corresponds to an error of 23% and 41% respectively. There are many
sources of error with this test because the sheets of foam were cut so thin that they needed to be
stacked in order to comply with the testing standard. The stacking of the sheets made the samples
compress more than if there was just one homogeneous sample, which yielded significantly lower
ultimate strengths and elastic moduli.
FIGURE 30 - STRESS-STRAIN CURVE OF PVC FOAM USED TO OBTAIN MECHANICAL
PROPERTIES
0
50
100
150
200
250
300
350
0 0.02 0.04 0.06 0.08 0.1 0.12 0.14
Co
mp
ress
ive
Str
ess
(p
si)
Compressive Strain (in/in)
PVC Foam Mechanical Properties Test
Average Ultimate Strength = 270 psi
Average Elastic Modulus = 7700 psi

Richard Davis
30
2.3 SANDWICH BEAM MECHANICAL CHARACTERISTICS
2.3.1 SANDWICH BEAM FABRICATION METHOD
After performing the mechanical properties testing on the face sheets and foam core, the
method that uses the force from the tetrahedron heat press has been determined as the method of
choice. In this method two layers of LTM45/CF1803 prepreg carbon fiber were combined to
make a face sheet in which there are two sets of face sheets per sandwich beam. A layer of sheet
resin was added on each side of the foam core to allow the bond between the face sheets and core
to be absolute. These constituents were then placed between some composite fabrication
materials and put in the heat press to cure at the manufacturer’s suggested curing cycle. Figure 31
illustrates how the sandwich beam was prepared before being put into the heat press.
FIGURE 31 - LAY-UP OF A SANDWICH PLATE
The first step of the fabrication method is to cut the foam to the correct dimensions of 12‖
x 12‖; this is performed by using the tile saw to cut the sheet to the desired size. After the foam is
cut, the carbon fiber is taken from the freezer and cut to 12‖ x 12‖ so that it fits flush with the
foam core. Before placing the carbon fiber on the foam core to be cured, a layer of sheet resin is
placed on the foam to ensure a strong bond between the foam and the face sheets. The face sheets
are then placed on the sheet resin one at a time to make sure that the orientation of the carbon
fiber sheet is square with the foam and with the other carbon fiber sheets. This part of the process
must be handled with care because if a sheet is not squared with accuracy, results between
specimens can vary drastically. This process is repeated for both sides of the foam so that there
are two sheets of carbon fiber, and a layer of sheet resin on both sides of the foam core. These
constituents are then placed between two layers of porous material to allow the resin to move

Richard Davis
31
through its walls; this is then put between two layers of non-porous material, which prohibits the
resin to move through its walls and ensures that the resin does not leak all over the heating press.
A picture of the entire specimen before it is put into the heating press can be seen in figure 32.
FIGURE 32 - ENTIRE LAY-UP OF SANDWICH PLATE BEFORE CURING
The constituents are cured at the manufacturer’s suggested curing cycle which can be
found in figure 14. Figure 33 shows a picture of a fully cured sandwich composite plate before it
was cut to the specified testing dimensions. When fully cured, the sandwich panel is then cut to
the dimensions that are required in the testing procedure.
FIGURE 33 - SANDWICH COMPOSITE PLATE BEFORE CUT TO TEST DIMENSIONS
2.3.2 SANDWICH BEAM MECHANICAL PROPERTIES TEST METHOD (ASTM D6272)
The sandwich beam is tested according to ASTM standard D627213
. This test method
allows the researcher to determine the mechanical properties of the beam to be found through the

Richard Davis
32
use of a four-point bending test. The properties that are essential to this research and are found
from this test are the elastic modulus and ultimate stress of the entire sandwich beam.
In this testing procedure, a beam of rectangular cross section rests on two supports and is
loaded by two internal point forces as shown in figure 34. The distance between the loading point
forces is one-third the length of the support distance. The supports are distanced 16 times the
thickness (depth as the standard calls it) of the specimen apart from each other.
FIGURE 34 –FOUR-POINT LOADING OF THE SANDWICH BEAM ACCORDING TO ASTM
D6272
The specimen is then loaded until rupture or until the maximum fiber strain of 5% is reached.
The specimens are cut to the dimensions that are called out in the standard: the thickness of the
beam is considered the ―depth‖ dimension; the length of the beam is the support span ―L‖ plus
one inch on either side for the beam to overhang the supports, the width of the beam may not be
greater than one-quarter the support span. The beam dimensions that are used in this experiment
are summarized in table 2.
TABLE 2 - BEAM TEST SPECIMEN DIMENSIONS
Dimension Size (in.)
Support Span (L) 9.232
Actual Beam Length 11.94
Depth (d) 0.577
Width (b) 1
Ten specimens are cut to the precise measurements above to ensure statistical accuracy in the
method. Figure 35 shows the test specimens cut to the precise dimensions above.

Richard Davis
33
FIGURE 35 - TEN SANDWICH BEAMS READY TO BE TESTED WITH ASTM D6272
STANDARD
The rate at which the sample is loaded (R) in flexure is given by equation 4, which is from the
ASTM standard:
(4)
where Z is the strain rate of the outer fibers, which is .01 (in/in)/min for this test. The maximum
stress ( of the beam located in the middle of the load span is also given by the ASTM
standard and is:
(5)
where P is the load in pounds. The maximum strain is given by equation 6, and pertains to
the strain in between the load span:
(6)
where D is the midspan deflection, which is found from the Instron machine. Because this
equation is based on empirical data, an extensometer strain gage supplied by the Instron
Company will be used to verify the strain in the outer fibers. After the test is complete and a
load-deflection curve is generated, the slope of the curve (m) can be used to find the elastic
modulus given by equation 7:
(7)

Richard Davis
34
2.3.3 EXPERIMENTAL RESULTS FOR THE MECHANICAL PROPERTIES OF THE
SANDWICH BEAM
A total of 20 samples were tested according to ASTM D6272. The Instron machine
recorded time, cross-head position, load, deflection, and strain. The only values that were
actually used from the Instron data were the load and deflection figures. From the test method
outlined in the ASTM standard, the values of stress in the outer fibers, strain in the outer fibers,
and elastic modulus could be found as seen in the test method section that precedes this section.
The load versus deflection data was plotted for each non-delaminated control sample as
seen in figure 36. The slope of the steepest region of the load-deflection curve (m) is used along
with equation 7 and the dimensions of the sandwich beam to find the combined modulus of
elasticity of the beam in bending. The average of all 20 elastic moduli was found to be 898,300
psi.
The ultimate strength of the sandwich beam is equal to the maximum stress in the outer
fibers at the moment the beam breaks. It is calculated by using equation 5 with P equal to the
force at the moment the structure fails. With the stress plotted versus strain data, illustrated in
figure 37, we can see that the average ultimate strength of the sandwich beam is 6874 psi.
FIGURE 36 - SANDWICH BEAM LOAD VERSUS DEFLECTION TO HELP FIND
MECHANICAL PROPERTIES
-300
-250
-200
-150
-100
-50
0
-0.5 -0.4 -0.3 -0.2 -0.1 0
Load
(lb
f)
Deflection (in)
Sandwich Beam Load Vs. Deflection
Average Elastic Modulus= 898,300 psi
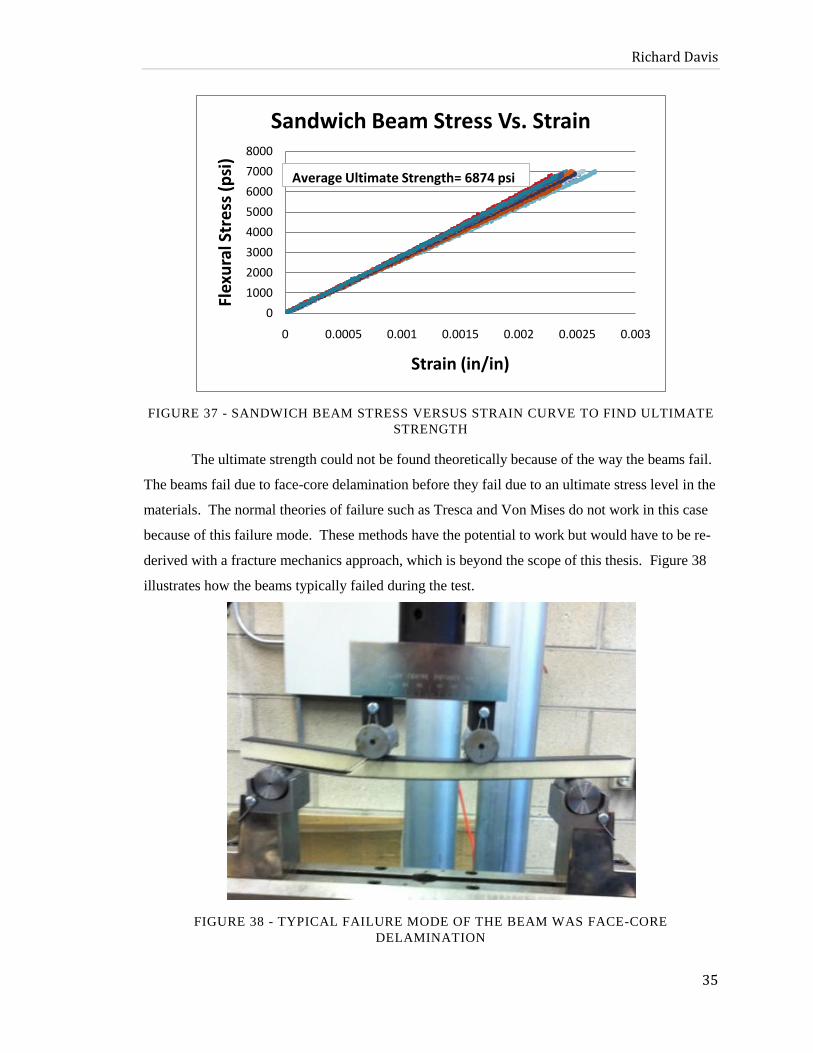
Richard Davis
35
FIGURE 37 - SANDWICH BEAM STRESS VERSUS STRAIN CURVE TO FIND ULTIMATE
STRENGTH
The ultimate strength could not be found theoretically because of the way the beams fail.
The beams fail due to face-core delamination before they fail due to an ultimate stress level in the
materials. The normal theories of failure such as Tresca and Von Mises do not work in this case
because of this failure mode. These methods have the potential to work but would have to be re-
derived with a fracture mechanics approach, which is beyond the scope of this thesis. Figure 38
illustrates how the beams typically failed during the test.
FIGURE 38 - TYPICAL FAILURE MODE OF THE BEAM WAS FACE-CORE
DELAMINATION
0
1000
2000
3000
4000
5000
6000
7000
8000
0 0.0005 0.001 0.0015 0.002 0.0025 0.003
Flex
ura
l Str
ess
(p
si)
Strain (in/in)
Sandwich Beam Stress Vs. Strain
Average Ultimate Strength= 6874 psi

Richard Davis
36
2.3.4 SANDWICH BEAM MECHANICAL PROPERTIES THEORETICAL RESULTS
The method used to determine the theoretical mechanical properties was taken from
Jones’s Mechanics of Composite Materials1. All the values used in this section for the elastic
moduli of the face sheets and foam are the manufacturer’s values, not the values found from
testing. The method is used to find an equivalent elastic modulus for two separate materials. To
find this value a large assumption must be made: the strains in the face sheet and foam are equal.
A pictorial representation essential to the understanding of this theory is illustrated in figure 39.
FIGURE 39 - THEORY BEHIND MECHANICAL PROPERTIES OF A SANDWICH BEAM
Because of the assumption of equal strains in the foam core and face sheets, we can write
the separate stresses in each material as seen in equations 8 and 9:
(8)
(9)
where the subscripts fs and fc stands for face sheet and foam core respectively. We can now say
that the average stress acting on the entire cross-sectional area A is . The cross-sectional area of
the face sheets and foam are Afs and Afc respectively. Therefore, the force on the entire cross-
section can be displayed as is equation number 10:
(10)
if we then substitute equations 8 and 9 into equation 10 we get the following relation for the
entire beam:
(11)
where EL is the elastic modulus in the longitudinal direction. We can now rewrite this equation in
the following form:

Richard Davis
37
(12)
however, the volume fraction of the face sheets and core can be written as in equations 13 and 14:
(13)
(14)
The entire elastic modulus of the composite beam can now be written in terms of each
component’s elastic modulus and contribution to the volume of the specimen as seen in equation
15:
(15)
Equation 15 was then used with the manufacturer’s given values of the elastic modulus to find the
theoretical value for the entire beam’s equivalent elastic modulus. The manufacturer’s material
data can be seen in table 3. The carbon fiber data is approximate because the Advanced
Composites group that makes the product has not officially published any mechanical data;
however, a consultant provided these approximate values.
TABLE 3 - MANUFACTURER'S DATA ON MECHANICAL PROPERTIES OF FACE
SHEETS AND FOAM
Carbon Fiber Foam Core
Elastic Modulus (psi) About 7,800,000 13,000
Ultimate Strength (psi) About 130,000 351
Using these values for the carbon fiber and foam and a volume fraction of 0.873 and 0.127 for the
foam and face sheets respectively, we get the equivalent elastic modulus to be 898,300 psi.
2.4 COMPARISON OF EXPERIMENTAL AND MANUFACTURER PROVIDED
PROPERTIES
A summary of all the experimental, theoretical, and provided data taken from the carbon
fiber, foam, and sandwich beam can be seen in tables 4 through 6.

Richard Davis
38
TABLE 4 - SUMMARY OF CARBON FIBER MECHANICAL PROPERTIES
LTM45/CF1803 PREPREG CARBON FIBER MECHANICAL PROPERTIES
Manufacturer's
Value Experimental
Value
Elastic Modulus (psi), ASTM D3039 7,800,000 7,454,900
Elastic Modulus Standard Deviation(psi)
187,062
Elastic Modulus Standard Deviation (%)
2.51
Ultimate Strength (psi), ASTM D3039 114,000 112,300
Ultimate Strength Standard Deviation(psi)
2737
Ultimate Strength Standard Deviation(%)
2.44
Poisson's Ratio, ASTM E132
0.091
Poisson's Ratio Standard Deviation
0.011
Poisson's Ratio Standard Deviation (%)
11.95
Density (lb/ft3) 96.89 93.31
Density Standard Deviation (lb/ft3)
1.72
Density Standard Deviation (%)
1.85
The carbon fiber elastic modulus varied only 4% between the experimental and manufacturer’s
data, which shows that the ASTM tension testing procedure is an accurate method and also shows
that the material is also in good condition. The ultimate strength of the face sheets had only 2%
difference between the experimental and manufacturer’s values. The manufacturer did not include
the value of Poisson’s ratio in the mechanical properties section of the material data sheet;
however, the experimental value of 0.091 for Poisson’s ratio is reasonable because many similar
materials have the same approximate value. The manufacturer provided the density of the carbon
fiber to be 96.89 lb/ft3, which was found to be consistent with the experimental value found of
93.31 lb/ft3, which is only 1.85 percent lower than the provided value.
The mechanical properties of the foam used as the core for the sandwich beam are found
in table 5. The PVC foam core was found to have an elastic modulus 7700 psi, which is 41%
different from the manufacturer’s provided value of 13,000 psi. The ultimate strength provided
was 351 psi in compression and was only 23% different than the value of 270 obtained
experimentally. The Poisson’s ratio of the foam was not provided by the manufacturer but the
experimental value found by an experiment on the same foam was .31, which is in the range that
the book The Handbook of Sandwich Construction2 says that PVC foam of this density should be
in. The manufacturer did provide the density of the foam and it was 10 lb/ft3. The experimental
value found consistent results of 9.86 lb/ft3 after measuring and testing a number of samples.

Richard Davis
39
TABLE 5 - PVC FOAM CORE MECHANICAL PROPERTIES SUMMARY
LAST-A-FOAM FR 6710 MECHANICAL PROPERTIES14
Manufacturer's Value Experimental Value
Elastic Modulus (psi), ASTM D1621 13,000 7700
Elastic Modulus Standard Deviation(psi) 175.5
Elastic Modulus Standard Deviation (%) 2.28
Ultimate Strength (psi), ASTM D1621 351 270
Ultimate Strength Standard Deviation(psi) 17.7
Ultimate Strength Standard Deviation(%) 6.56
Poisson's Ratio, ASTM E132 0.31
Poisson's Ratio Standard Deviation
Poisson's Ratio Standard Deviation (%)
Density (lb/ft3) 10 9.86
Density Standard Deviation 0.16
Density Standard Deviation (%) 1.62
The entire sandwich beam was theoretically determined to have an elastic modulus of
1,052,166 as describer earlier in this section. The theoretical elastic modulus was only 14%
higher than the experimental value found using ASTM D6272. Even though the theoretical value
was larger, this was expected because if each of the elastic moduli of the face sheets and foam
had larger manufacturer values than what was experimentally found in the lab, then it is safe to
say that theory would predict a larger value. The ultimate strength of the beam was found to be
6,874 psi; this value will be used as the control value for the ultimate strength of a beam with any
initial delamination.
TABLE 6 - SUMMARY OF MECHANICAL PROPERTIES OF THE COMPOSITE
SANDWICH BEAM
SANDWICH BEAM MECHANICAL PROPERTIES
Theoretical Value Experimental Value
Elastic Modulus (psi), ASTM D6272 1,056,066 898,300
Elastic Modulus Standard Deviation(psi) 14,642
Elastic Modulus Standard Deviation (%) 1.63
Ultimate Strength (psi), ASTM D6272 6,874
Ultimate Strength Standard Deviation(psi) 167
Ultimate Strength Standard Deviation(%) 2.4

Richard Davis
40
Using the ASTM testing standards allowed for the precise calculation of all the important
values needed for the analysis of the sandwich beam. The values found theoretically, and
experimentally were all very close to the manufacturer’s provided data, which leads to the
conclusion that the fabrication methods considered all yield consistent results from test to test.

Richard Davis
41
3 EXPERIMENTAL TASK: FABRICATION AND TESTING OF SANDWICH BEAMS
The aim of this chapter is to discuss whether or not the DAD keys added to the sandwich
beam can increase the structural integrity of the beam when an initial delamination exists. The
beams will be loaded in a four-point bending jig and tested for their ultimate strength according to
ASTM D6272. There will be six cases that are addressed in the analysis: a control specimen with
no delamination, a specimen with a one inch initial delamination, two specimens with no
delamination and DAD keys added in the transverse and longitudinal directions respectively, and
two specimens with a one inch initial delamination with DAD keys added in the transverse and
longitudinal directions respectively. An in-detail discussion will address the fabrication of all
materials for testing as well as go over the testing method. The chapter will be concluded with a
comparison of the results to see if the DAD keys provided an increase in ultimate strength.
3.1 THE CONTROL SPECIMEN (NO DELAMINATION)
3.1.1 FABRICATION OF CONTROL SPECIMEN
The fabrication of the control specimen is of the most importance because it is the basis
for how all other beams will be manufactured. The control specimen was made the same way
that the beam was created in chapter two on page 30. Please refer to this page in order to obtain
the full fabrication method.
3.1.2 CONTROL SPECIMEN TEST METHOD (ASTM D6272)
The control specimen test method follows the same testing standard as that explained in
chapter two on page 31. Please refer to this page in order to view the entire testing method.
3.1.3 CONTROL SPECIMEN TEST RESULTS
After the beams were laid-up and tested according to ASTM Standard D6272, the Instron
machine was able to export its results in an excel file to be analyzed. Every sample’s stress-strain
curve was plotted, as seen in figure 40, and the ultimate strength was found by finding the largest
stress value associated with each beam. The ultimate strength of 20 samples was calculated and
the average and standard deviation was also noted to ensure statistical significance was achieved
between tests.
The average ultimate strength of the control specimen was found to be 6870 psi with a
standard deviation of 167 psi. The standard deviation was only 2.4 percent of the entire ultimate

Richard Davis
42
strength value, which means that the testing, fabrication, and analysis methods all yielded
statistically significant results.
FIGURE 40 - STRESS VERSUS STRAIN CURVES FOR SANDWICH BEAM CONTROL
3.2 BEAM WITH INITIAL DELAMINATION
3.2.1 FABRICATION OF DELAMINATED BEAM
The delaminated beam is created the same way as the control beam except that an initial
delamination is introduced between the foam core and face sheet interface. The initial
delamination is introduced to the specimen by adding a thin layer of non-porous material between
the face sheets and foam core. The non-porous material does not allow any resin to flow through
its boundary thus not allowing the two interfaces to bond together.
The layer of foam is covered with a layer of sheet-resin just as with the case of the
control specimen. Next, the layer of non-porous material is added between the sheet-resin and
face sheets as seen in figure 41. Because the sheet resin starts to cure even at room temperature,
it gets very sticky quickly, which allows the layer of non-porous material to stay in position when
placed on the sample. To ensure that the non-porous material is situated in the right position (in
the direct center of the plate), the lines of the delamination location are marked on the foam and
can be seen through the transparent sheet resin.
The layers of carbon fiber are added to the foam the same way as the control specimen
with two layers of LTM45/CF1803 on each side. These layers are covered with porous and non-
0
1000
2000
3000
4000
5000
6000
7000
8000
0 0.0005 0.001 0.0015 0.002 0.0025 0.003
Flex
ura
l Str
ess
(p
si)
Strain (in/in)
Sandwich Beam Control
Average Ultimate Strength= 6870 psi

Richard Davis
43
porous material and cured in the tetrahedron heat press with the same curing cycle specified by
the manufacturer.
FIGURE 41 - NON-POROUS MATERIAL ADDED TO A SANDWICH PLATE TO CREATE A
DELAMINATED SECTION
3.2.2 DELAMINATED BEAM TEST METHOD (ASTM D6272)
After the specimen is cured, the 12‖ x 12‖ plate is cut to the standard beam size of 12‖ by
1‖ by 0.577‖ as seen in figure 42.
FIGURE 42 - DELAMINATED BEAM SAMPLES CUT TO THE STANDARD SIZE

Richard Davis
44
The delamination is difficult to view once the specimen is cut but it is essential to know
its location so that it could be loaded in the Instron machine correctly. The delamination location
is important because when the beam is loaded into the four-point bending jig, the delaminated
section of the beam must be located directly between the load span as seen in figure 43. The
extensometer strain gage is then added directly on the opposite side of the delamination to
measure the maximum strain in the outer fibers of the beam.
FIGURE 43 - BEAM WITH DELAMINATED SECTION LOCATED DIRECTLY BETWEEN
THE LOAD-SPAN
The Instron machine collects the same data as the control beam (position, load,
deflection, stress, strain).
3.2.3 DELAMINATED BEAM TEST RESULTS
All of the delaminated beams failed due to face-core delamination as can be seen in
figure 43. Face-core delamination is the typical failure mode of sandwich composites that are
loaded in bending. The problem with these specimens is not the fact that the materials are not
strong enough for a given structure; it is the interface between the two constituents that creates
the distinctive failure mode.
The plot of stress versus strain was created according to the ASTM standard to find the
ultimate strength. A total of ten samples were tested and their plots were superimposed as seen in
figure 44.

Richard Davis
45
FIGURE 44 - STRESS VERSUS STRAIN PLOT OF SANDWICH BEAM WITH INITIAL
DELAMINATION
The ultimate strength was found by seeing where each sample fractured and that stress
value was noted. The ultimate strength of all samples was averaged to find the mean value of
4590 psi.
3.3 DELAMINATED BEAM WITH TRANSVERSE DAD KEYS
FIGURE 45 - SANDWICH BEAM WITH TRANSVERSE DAD KEYS EXPANDED VIEW
3.3.1 FABRICATION OF DAD KEYS
The DAD keys are used in order to potentially increase the ultimate strength of the
delaminated sample. The DAD keys are fabricated from fiberglass strands that are oriented
0
1000
2000
3000
4000
5000
6000
0 0.0005 0.001 0.0015 0.002
Stre
ss (
psi
)
Strain (in/in)
Beam With Delamination
Average Ultimate Strength = 4590 psi

Richard Davis
46
unidirectionally as seen in figure 45. There are 15 strands of fiberglass for each bundle seen in
figure 46, wrapped by rubber bands in order to keep them together. Each fiberglass bundle is cut
so that it measures 14 inches, which is enough length such that overlaps the 12 inch mold that
each bundle is laid-up in. The mold, seen in figure 47, is made of aluminum and can hold 22
bundles of fiberglass at a time. The mold creates 0.125 inch radius semicircular DAD keys.
FIGURE 46 - FIFTEEN-STRAND FIBERGLASS BUNDLES USED TO CREATE DAD KEYS
FIGURE 47 - FIBERGLASS MOLD USED TO FABRICATE DAD KEYS
Before the bundles of fiberglass are added to the mold, the mold must be waxed by a
releasing agent that allows the DAD keys to be easily removed once they are cured. The wax is

Richard Davis
47
added by hand onto the mold until the entire sheet of aluminum is completely covered as
illustrated in figure 48.
FIGURE 48 - ADDING RELEASE WAX TO THE MOLD FOR EASY DAD KEY REMOVAL
The bundles of fiberglass are then laid-up by hand using Aeroepoxy 24-hour-cure resin as seen in
figure 49. Great care is taken when laying up the fiberglass by hand to ensure that the entire
DAD key is completely saturated with resin.
FIGURE 49 - HAND LAY-UP METHOD USED TO FABRICATE DAD KEYS

Richard Davis
48
Each bundle of fiberglass is then inserted into the aluminum mold and a layer of porous and non-
porous material are added on top the mold so that resin does not stick to the plate. The plate is
used to completely compress the DAD keys into the mold. Weight is then added on top of the
plate to ensure the complete compacting of the fiberglass into the mold as can be viewed in figure
50.
FIGURE 50 - 180 POUNDS ADDED ON TOP OF THE PLATE TO COMPACT THE
FIBERGLASS INTO THE MOLD
Once the DAD keys are completely cured 24-hours later, the materials on top of the mold are
taken off and the keys are sanded down until they are all separated by the aluminum as seen in
figure 51.
FIGURE 51 - DAD KEYS ARE SANDED DOWN UNTIL EACH IS SEPARATED BY THE
ALUMINUM MOLD

Richard Davis
49
The final DAD key dimensions are 12 inches long with a semicircular radius of 0.125 inches.
3.3.2 FABRICATION OF FOAM CORE TO ACCEPT DAD KEYS
The foam must be cut precisely to accept the DAD keys such that when they are inserted
a flat surface results. If the grooves are cut too deep into the foam the DAD keys will not be able
to bond to the face sheets; if the grooves are too shallow the DAD keys will stick out of the foam
and the face sheets will not have a complete bond with the foam core. Because the fabrication of
the foam is such a delicate procedure, the Haas CNC machine was used to cut the grooves to the
exact dimensions required. Figure 52, illustrates the CNC vertical mill being used with a 0.25
round bit to cut the grooves into the foam.
FIGURE 52 - CNC MACHINES USED TO CUT GROOVES INTO THE FOAM TO ACCEPT
DAD KEYS
The finished foam pieces used to accept the longitudinal and transverse DAD key configurations
can be seen in figure 53.

Richard Davis
50
FIGURE 53 - FINISHED FOAM CORE PIECES READY TO ACCEPT DAD KEYS
3.3.3 FABRICATION OF DELAMINATED SANDWICH BEAMS WITH DAD KEYS
Once the DAD keys and foam were fabricated the delaminated beams could be
fabricated. To create the beams, the DAD keys were first added to the foam using Aeroepoxy
applied to the DAD keys as seen in figure 54. It is essential to add the epoxy to the DAD keys so
that there is a full bond between the key and the foam.
FIGURE 54 - AEROEPOXY ADDED TO DAD KEYS
The DAD keys are then inserted into foam being careful to ensure that the top of the
DAD key is flush with the top of the foam as seen in figure 55. A layer of sheet resin is then
added on top the DAD keys to help the face sheets bond to the foam and DAD keys. A one inch
wide strip of non-porous material is added directly in between the DAD keys and on top of the
sheet resin to create the initial delamination. The layers of non-porous material, porous material,
and carbon fiber are added to each side of the foam core as with the previous beam fabrication
methods.

Richard Davis
51
FIGURE 55 - FOAM WITH DAD KEYS AND INITIAL DELAMINATION INSERTED
The sandwich lay-up is then put into the tetrahedron press to cure at the manufacturer’s
suggested curing cycle. Once the sandwich panel is fully cured it is cut with the tile saw to the
same specifications as the previous beams: 12‖ x 1‖ x 0.577‖ as can be seen in figure 56. From
the figure one can see that the face sheets are completely attached to the DAD keys and foam.
FIGURE 56 - SANDWICH BEAMS WITH TRANSVERSE DAD KEYS CUT TO FINAL
TESTING DIMENSIONS
3.3.4 DELAMINATED BEAM WITH TRANSVERSE DAD KEYS TEST RESULTS
Once the beams were tested according to ASTM D6272 as all the previous beams were
tested, all the data could be exported from the Instron machine to excel and Matlab to be
analyzed. The ultimate strength was found by taking the stress value at the point of sample

Richard Davis
52
rupture. Figure 57 shows the stress versus strain curve of the ten samples tested along with the
average ultimate stress value of 6630 psi.
FIGURE 57 - STRESS VERSUS STRAIN CURVE OF DELAMINATED BEAM WITH
TRANSVERSE DAD KEYS
The ultimate strength value of 6630 psi shows that there is a 45% increase in strength over the
beam that is delaminated without DAD keys. This increase in ultimate strength means that
adding DAD keys to a delaminated sample does decrease the tendency for the face-core
delamination failure mode. None of the test samples had failure due to face-core delamination
except for one, which was a partial delamination as seen in figure 58. As the figure illustrates,
one of the DAD keys did its job by inhibiting delamination propagation and the other DAD key
failed allowing the delamination to propagate to the load support.
FIGURE 58 - ATYPICAL FAILURE OF BEAM WITH TRANSVERSE DAD KEY
PLACEMENT
010002000300040005000600070008000
0 0.0005 0.001 0.0015 0.002 0.0025 0.003
Stre
ss (
psi
)
Strain (in/in)
Delaminated Worst Case Shear Key
Average Ultimate Strength = 6630 psi

Richard Davis
53
The rest of the samples failed just as the control specimen, which did not involve any face-core
delamination. Figure 59 shows that this typical failure mode is more a result of the fracture of the
carbon fiber face sheets and not a result of the failure of the interfacial bond between the two
constituents.
FIGURE 59 - TYPICAL FAILURE MODE OF DELAMINATED SPECIMENS WITH
TRANSVERSE DAD KEYS
3.4 NON-DELAMINATED BEAM WITH TRANSVERSE DAD KEYS
3.4.1 FABRICATION OF SANDWICH BEAMS WITH TRANSVERSE DAD KEYS
All the non-delaminated beams with the transverse configuration of DAD keys were
fabricated using the same method as the delaminated beams except for the initial delamination.
The DAD keys and foam were all fabricated using the same method as that described in the
previous section. The step that uses non-porous material to insert an initial delamination between
the core and the face sheets is left out for this fabrication method.
3.4.2 NON-DELAMINATED BEAMS WITH TRANSVERSE DAD KEY TEST RESULTS
All of the non-delaminated beams with the transverse DAD keys failed in the same mode
as the control specimen: due to a face sheet fracture as seen in figure 60.
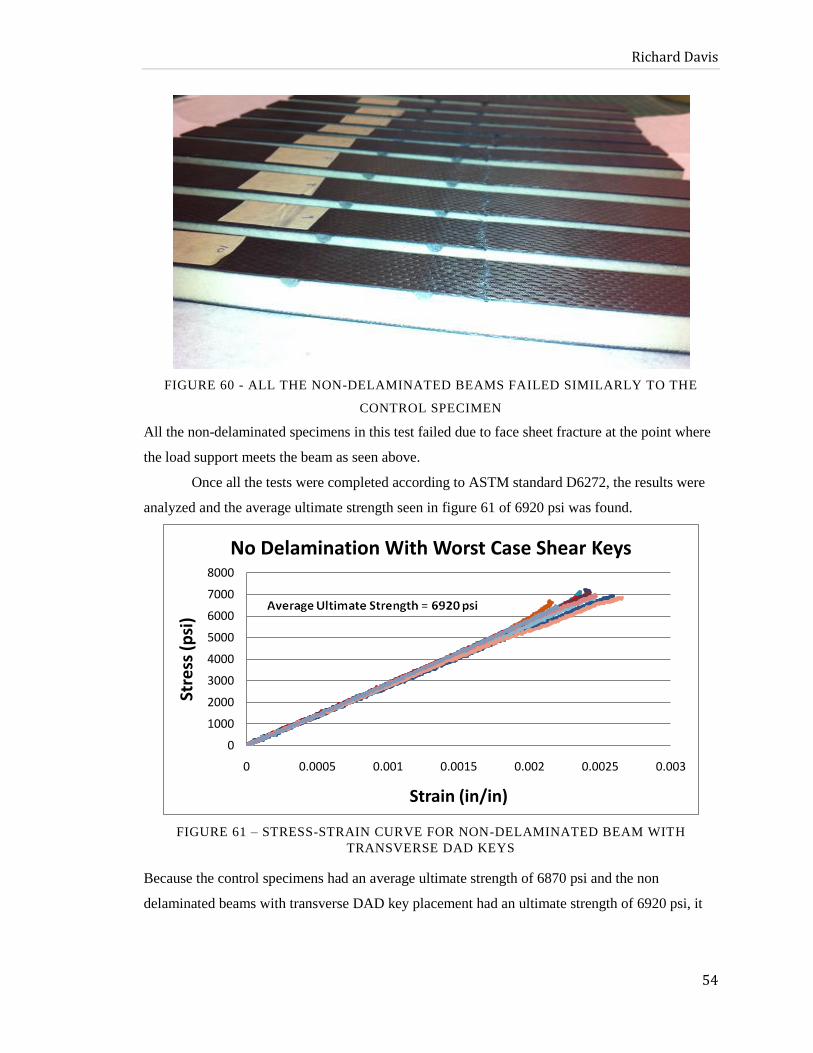
Richard Davis
54
FIGURE 60 - ALL THE NON-DELAMINATED BEAMS FAILED SIMILARLY TO THE
CONTROL SPECIMEN
All the non-delaminated specimens in this test failed due to face sheet fracture at the point where
the load support meets the beam as seen above.
Once all the tests were completed according to ASTM standard D6272, the results were
analyzed and the average ultimate strength seen in figure 61 of 6920 psi was found.
FIGURE 61 – STRESS-STRAIN CURVE FOR NON-DELAMINATED BEAM WITH
TRANSVERSE DAD KEYS
Because the control specimens had an average ultimate strength of 6870 psi and the non
delaminated beams with transverse DAD key placement had an ultimate strength of 6920 psi, it
0
1000
2000
3000
4000
5000
6000
7000
8000
0 0.0005 0.001 0.0015 0.002 0.0025 0.003
Stre
ss (
psi
)
Strain (in/in)
No Delamination With Worst Case Shear Keys

Richard Davis
55
can be assumed that there is no change in the ultimate strength of the beams when DAD keys are
added with no delamination.
3.5 DELAMINATED BEAM WITH LONGITUDINAL DAD KEYS
FIGURE 62 - SANDWICH BEAM WITH LONGITUDINAL DAD KEY EXPANDED VIEW
3.5.1 FABRICATION OF SANDWICH BEAMS WITH LONGITUDINAL DAD KEYS
The foam and DAD keys are all fabricated using the same methods described in the
previous sections with the other DAD key orientations. The difference between DAD keys being
inserted in the longitudinal and transverse orientations is that the DAD key runs along the
longitudinal axis of the beam instead of perpendicular to that axis. Figure 63 shows the
orientation of the DAD keys in the foam before they are laid up.
FIGURE 63 - LONGITUDINAL CASE DAD KEYS ADDED TO THE FOAM READY TO BE
LAID-UP

Richard Davis
56
The sandwich core with DAD keys is sandwiched between layers of sheet resin, two layers of
LTM45/CF1803 carbon fiber, porous material, and non porous material. The entire sample is
placed between two steel places just like the previous methods and cured with the same curing
cycle in the Tetrahedron heat press.
The plate is then cut such that the DAD keys run along the longitudinal axis of the beam.
Each specimen is the same dimensions as the previous tests but this time the DAD key is runs
directly down the middle of the beam as seen in figure 64.
FIGURE 64 - LONGITUDINAL CASE DAD KEY ORIENTATION SIDE VIEW
3.5.2 DELAMINATED BEAMS WITH LONGITUDINAL CASE DAD KEY TEST RESULTS
The delaminated beams with the longitudinal case DAD key orientations had two typical
failure modes: the first mode is the same as the control specimen where the face sheets fracture
and the second is where the face sheet delaminates to the load then crosses through the foam to
continue propagation on the opposite face sheet as seen in figure 65.
FIGURE 65 – THE TWO FAILURE MODES ASSOCIATED WITH THE LONGITUDINAL
DELAMINATED BEAM
The ultimate strength was found using the same testing standard used in all the other
beam configurations (ASTM D6272). The stress versus strain plot was generated for each sample
and the ultimate stresses were averaged to attain the mean ultimate strength of the beams. The

Richard Davis
57
average ultimate strength for this beam configuration was found to be 7020 psi as can be seen in
figure 66. This ultimate strength value gave a 53% increase over the original delaminated beam,
which had an ultimate strength of 4590 psi.
FIGURE 66 – STRESS-STRAIN CURVE FOR DELAMINATED LONGITUDINAL BEAM
WITH DAD KEY
3.6 NON-DELAMINATED BEAM WITH LONGITUDINAL DAD KEYS
3.6.1 FABRICATION OF NON-DELAMINATED SANDWICH BEAMS WITH
LONGITUDINAL DAD KEYS
The non-delaminated sandwich beams are fabricated the same way as the delaminated
beams except the initial delamination is taken out so that the face sheet is completely attached to
the foam core. The fabrication of DAD keys and foam are exactly the same as the previous beam
configurations. The constituents are all organized in the same manner as the previous cases and
cured with the same curing cycle in the Tetrahedron heating press. Once cured, the final beams
are cut to the standard dimensions of 12‖ x 1‖ x 0.577‖ as seen in figure 67.
010002000300040005000600070008000
0 0.0005 0.001 0.0015 0.002 0.0025 0.003
Stre
ss (
psi
)
Strain (in/in)
Delaminated Best Case Shear Key
Average Ultimate Strength = 7020

Richard Davis
58
FIGURE 67 - NON-DELAMINATED BEAMS WITH LONGITUDINAL DAD KEYS
3.6.2 NON-DELAMINATED BEAMS WITH LONGITUDINAL DAD KEY TEST RESULTS
All sandwich beam samples were tested according to ASTM D6272 standard to find the
average ultimate strength. The typical failure mode was face-core delamination mixed with a
foam core fracture as can be seen in figure 68.
FIGURE 68 - TYPICAL FAILURE MODE OF NON-DELAMINATED BEAMS WITH
LONGITUDINAL DAD KEYS
The results were exported from the Instron machine as an excel file and analyzed to
generate stress-strain curves for every sample tested. The curves were superimposed and the
average ultimate strength was obtained according to the standard’s specifications. The ultimate
strength attained was 7620 psi as illustrated in figure 69. This value is a 66% increase over the
4590 psi generated from the beam with only an initial delamination and an 11% increase over the
control beam. This large increase is expected because the bond between the face-core interface is
much larger and the stiffness of the entire beam is greatly increased.

Richard Davis
59
FIGURE 69 – STRESS-STRAIN CURVE FOR THE NON-DELAMINATED BEAM WITH
LONGITUDINAL DAD KEYS
3.7 COMPARISON OF SANDWICH BEAM RESULTS
The results of all the sandwich beam tests were essentially expected: the more the surface
area and stiffness between the face-core interface, the larger the ultimate strength. The primary
conclusion found from this testing is that the addition of DAD keys to delaminated beams greatly
increases the structural integrity and ultimate strength of the beams. The addition of DAD keys
to a non-delaminated beam does not have as great of an effect as the delaminated case but it was
still signified by small gains in strength.
A summary of all results can be seen in table 7 comparing the average ultimate stresses,
standard deviations, and percent differences from control beams.
TABLE 7 - SUMMARY OF ALL BEAM TEST RESULTS
Non-Delaminated Delaminated
DAD Key Orientation No DAD Keys (Control) Transverse Long. No DAD Keys (Control) Transverse Long.
Average Ultimate Strength (psi) 6870 6920 7620 4590 6630 7020
Ultimate Strength Standard Deviation (psi) 166 225 237 312 291 344
Ultimate Strength Standard Deviation (%) 2.42 3.25 3.11 6.79 4.39 4.9
Increase over Non-Delaminated Control 0% 1% 11% -33% -3% 2%
Increase over Delaminated Control 50% 51% 66% 0% 44% 53%
The delaminated configurations with DAD keys showed the largest gains in ultimate
strength, which demonstrates promise for the future of utilizing DAD keys in industry. The
transverse and longitudinal configurations had a 44% and 53% increase over the delaminated
control beam respectively. The standard deviations of the delaminated beams were larger than
0100020003000400050006000700080009000
0 0.0005 0.001 0.0015 0.002 0.0025 0.003 0.0035
Stre
ss (
psi
)
Strain (in/in)
No Delamination Best Case Shear Key
Average Ultimate Stress = 7620 psi

Richard Davis
60
the non-delaminated beams but still small comparatively. The non-delaminated beams all had
very small standard deviations on the order of three percent. The percent difference from one
testing method to another was so small that these results can be considered statically significant
and repeatable.

Richard Davis
61
4 NUMERICAL TASK: VERIFICATION OF EXPERIMENTAL
DEFLECTION
The aim of this chapter is to verify the deflections found experimentally in each of the
sandwich beams cases by using COSMOS finite element analysis software for mesh generation
and analysis. The control, transverse, and longitudinal sandwich beams are all numerically
verified. The section provides a detailed description as to how the beams are meshed, loaded, and
analyzed. This chapter ends with a final comparison of all the experimental and numerical
deflection results.
4.1 VERIFICATION OF SANDWICH BEAM DATA
The ASTM standards used to find the ultimate strengths and other mechanical data use
equations which are functions of the beam deflection. Experimentally, the deflection is obtained
directly from the Instron machine for a specified load. Because deflection values are of the
utmost importance to all the data of this research, it is necessary to verify the values found.
All the beams are to be verified numerically by discretizing the sandwich beam geometry
for the given case and applying the same load configuration and boundary conditions as seen in
the experimental testing. Load levels are chosen to keep the response in the linear region of the
stress-strain curve are to be used and the assumption of small deflections is applied to verify data.
4.2 CONTROL SANDWICH BEAM VERIFICATION
4.2.1 MESH GENERATION AND LOADING OF CONTROL BEAM
The control beam, seen in figure 70, was created in COSMOS by generating a separate
volume for each of the different constituent materials. Each separate volume can be meshed and
have mechanical characteristics defined solely for that volume. For the foam, the mechanical
characteristics provided by the manufacturer were used for those particular elements, and for the
carbon fiber face sheets, the mechanical properties found by experimental testing were used. The
volumes of the sandwich beam can be seen in figure 71.

Richard Davis
62
FIGURE 70 - CONTROL BEAM TO BE MODELED IN COSMOS
FIGURE 71 - VOLUMES USED TO MESH THE CONTROL BEAM
A total of seven separate volumes were created to model the control beam. The four
volumes on the upper face sheet seen in the figure above are created such that the load can be
applied on the curves instead of node-by-node, which is too tedious. The center volume on the
upper face sheet is there to allow for an initial delamination to be added in future analysis.
Each volume is meshed such that the elements resemble the geometry of a cube, which
has the highest accuracy in finite element analysis. When the elements get too elongated or
distorted, the accuracy of the model decreases. The element type used for this case and all cases
in the research is the eight-node solid element, which can be seen in figure 72. The solid element
has a hybrid integration type, global stress-strain direction, and linear elastic small displacement
properties. The mechanical properties of each constituent are then applied to each element group
volume-by-volume.

Richard Davis
63
FIGURE 72 - EIGHT-NODE SOLID ELEMENT USED FOR ALL MESHING15
The 100 pound load is applied along the two curves (50 pounds each) on the upper face
sheet as seen in figure 73. The load value of 100 pounds is chosen because it results in a linear
response and yields small deflections. The boundary conditions are added so that the numerical
analysis reflects the same conditions as the four-point bending jig. As with the experimental
analysis, the translation in the y and z directions are fixed at the boundary points just like the
experimental conditions. The experimental jig is on rollers that allow the sandwich beam to
translate along the x-axis but the finite element model needs this movement to be fixed or else it
turns into a dynamic model. To solve this problem, the translation in the x-direction is fixed at
the midspan point as seen in figure 73. The fixation of the translation in the x-axis in the center
allows the beam to still translate at the point of the rollers but also keeps the beam centered
between the rollers so that the model is static. Note: due to symmetry, the beam could have been
modeled as one-half the beam.
FIGURE 73 - CONTROL BEAM WITH MESH, LOADS, AND BOUNDARY CONDITIONS
APPLIED

Richard Davis
64
4.2.2 RESULTS AND ANALYSIS OF CONTROL BEAM
The post-processing analysis of the sandwich beam is conducted statically under the
specified loads and boundary conditions. The displacement contour plot is then able to be plotted
and compared with experimental data. The average deflection found at 100 pounds of force
experimentally was .09736 inches at the midspan. The deflection found numerically was .08739
inches as can be seen in figure 74.
FIGURE 74 - DISPLACEMENT CONTOUR PLOT OF CONTROL BEAM
The value of deflection found numerically was only 10.24 percent lower than the values found
experimentally, which gives great verification that the control beam’s data is significant. Just this
one mesh is not enough for the researcher to say that the solution found is a converged solution.
To ensure that the deflection found numerically is a converged solution, the same
geometry and load conditions were plotted for four different meshes of different element sizes to
show that as the mesh gets more fine, the solution converges. The mesh for the solution above
had 33,792 elements; three other meshes that get as coarse as 132 elements were analyzed and
their deflection values were plotted in figure 75.

Richard Davis
65
FIGURE 75 - DEFLECTION CONVERGENCE OF THE CONTROL SANDWICH BEAM
The values of deflection found for each of the meshes analyzed are as expected: as the
mesh gets more coarse, the accuracy of the model is depleted. Adjacent elements of different size
or material properties greatly increase the condition number for the system of equations, which in
turn reduces the accuracy of the solution. This trend is observed because as the mesh gets more
crude, the size of the elements in the face sheets are about ten times smaller than the elements in
the foam core, which forces the elements to be less like their ideal cubic shape. The elements in
the refined mesh are perfect cubes and fit the geometry perfectly, which is why the solution is a
converged solution.
4.3 CONTROL SANDWICH BEAM WITH DELAMINATION VERIFICATION
4.3.1 MESH GENERATION AND LOADING OF CONTROL BEAM WITH
DELAMINATION
The loading, boundary conditions, geometry, and volumes of the delaminated control
beam are the same as the control beam in the previous section. However, there is one large
difference between the control beam and the control beam with a delamination: the nodes
between the foam core and middle volume of the face sheet are disconnected to simulate a
delamination at the face core interface. Figure 76 shows the disconnected nodes at the face-core
interface.
0.076
0.078
0.08
0.082
0.084
0.086
0.088
0 5000 10000 15000 20000 25000 30000Mid
span
Def
lect
ion
(in
)
Number of Elements
Elemental Convergence of Control

Richard Davis
66
FIGURE 76 - DELAMINATION MODELED BY DETACHED NODES AT THE FACE-CORE
INTERFACE
4.3.2 RESULTS AND ANALYSIS OF CONTROL BEAM WITH DELAMINATION
The static analysis and postprocessing of the delaminated control beam was performed in
the same manner as the previous section.
FIGURE 77 - STRESS CONTOUR PLOT OF THE DELAMINATED REGION
To verify that the delaminated region is indeed working, a plot of the stress contours was
generated. Figure 77, which illustrates the stress diagram, shows that there is a region of
delamination (indicated by the white arrow) where the stress in the face sheet is not transferred in
the foam core. This area of no stress transfer verifies that the simulation of the delamination
works.
Figure 78 demonstrates that the finite element simulation of the delaminated control
beam has a midspan deflection of .08741 inches, which is only 8.95 percent lower than the
experimental value measured of .09600 inches.
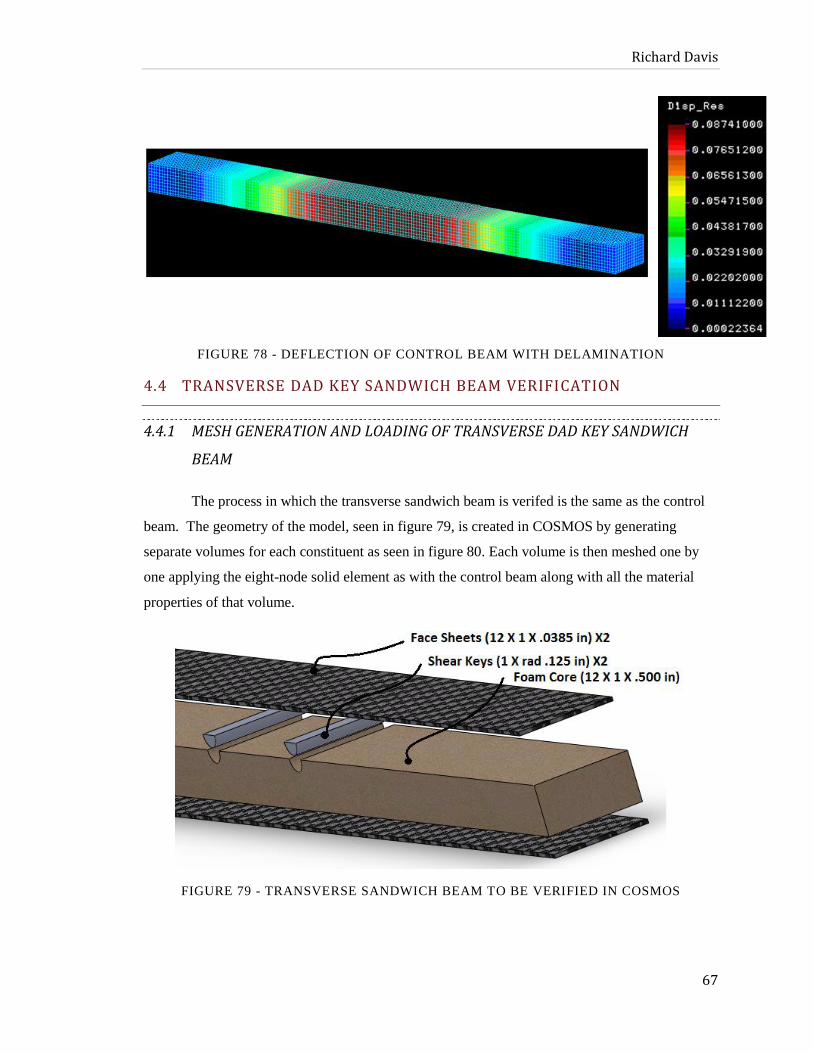
Richard Davis
67
FIGURE 78 - DEFLECTION OF CONTROL BEAM WITH DELAMINATION
4.4 TRANSVERSE DAD KEY SANDWICH BEAM VERIFICATION
4.4.1 MESH GENERATION AND LOADING OF TRANSVERSE DAD KEY SANDWICH
BEAM
The process in which the transverse sandwich beam is verifed is the same as the control
beam. The geometry of the model, seen in figure 79, is created in COSMOS by generating
separate volumes for each constituent as seen in figure 80. Each volume is then meshed one by
one applying the eight-node solid element as with the control beam along with all the material
properties of that volume.
FIGURE 79 - TRANSVERSE SANDWICH BEAM TO BE VERIFIED IN COSMOS

Richard Davis
68
FIGURE 80 - VOLUMES OF NON-DELAMINATED TRANSVERSE SANDWICH BEAM
The mesh of the sandwich beam is idealized by creating each element such that its sides
are nearly the same dimentions to ensure accuracy. In addition to ideal sized elements, there are
no large jumps from an element of one size to an element of an extream different size, which also
adds to the accuracy of the model.
The loads and boundary conditions are then added to the mesh as can be seen in figure
81. The load of 100 pounds it separated into two separate loads of 50 pounds each and loaded
along the curves seen on each side of the DAD keys. The boundary conditions are implemented
in the same mannar and orientation as the control beam. The mechanical properties used to
model the DAD keys were found from another student’s research on the fiberglass material16
.
The elastic modulus found was 5,700,000 psi.
FIGURE 81 - LOADS AND BOUNDARY CONDITIONS APPLIED TO THE TRANSVERSE
SANDWICH BEAM
4.4.2 RESULTS AND ANALYSIS OF THE TRANSVERSE DAD KEY BEAM
Once the mesh generation is complete with all the desired loads and boundary conditions
applied, the solution phase and postprocessing of the discretization can be performed. The mesh
is run statically for the 100 pound load that lies in the linear region of the load-deflection curve.
The displacement contour plot is then generated to find the midspan deflection due to the
specified load. The displacement plot, seen in figure 82, illustrates that the midspan deflection

Richard Davis
69
for this specific case is .08679 inches, which is only 7.96 percent less than the experimental value
measured of .09430 inches.
FIGURE 82 - DISPLACEMENT CONTOUR PLOT OF TRANSVERSE CASE BEAM
In order to verify that the deflection solution is a converged solution, four different
meshes with varying element sizes were created to illustrate the convergence of the transverse
case beam. As can be seen in figure 83, as the number of elements increases from a coarse mesh
to a fine mesh, the midpan solution converges to the result obtained. Because the version of
COSMOS used has a limit of 50000 elements, the most elements that could be used for this
geometry was about 28,000.
FIGURE 83 - DEFLECTION CONVERGENCE OF THE TRANSVERSE CASE SANDWICH
BEAM
0
0.02
0.04
0.06
0.08
0.1
0 5000 10000 15000 20000 25000 30000Mid
span
Def
lect
ion
(in
)
Number of Elements
Elemental Convergence of Trans. Case

Richard Davis
70
4.5 TRANSVERSE CASE SANDWICH BEAM WITH DELAMINATION
VERIFICATION
4.5.1 MESH GENERATION AND LOADING OF TRANSVERSE CASE SANDWICH BEAM
WITH DELAMINATION
The volumes, loading, and boundary conditions of the delaminated transverse case beam
are all the same as the non-delaminated transverse case beam addressed in the previous section.
The delamination was created by detaching the nodes at the interface of the face sheet and foam
core as seen in figure 84.
FIGURE 84 - SIMULATION OF THE DELAMINATED REGION IN THE TRANSVERSE
CASE SANDWICH BEAM
4.5.2 RESULTS AND ANALYSIS OF TRANSVERSE CASE SANDWICH BEAM WITH
DELAMINATION
To verify that the delamination was successfully simulated in the finite element model, a
contour plot of the stress distribution of the sandwich beam was created. In the upper portion of
figure 85, it can be seen that there is a transfer of stress between the connected face sheet and
foam core, which is expressive of the non-delaminated beam. However, in the lower portion of
the figure, the stress in the delaminated region is not transferred to the foam core, which conveys
that the delamination was successfully simulated.

Richard Davis
71
FIGURE 85 - VERIFICATION OF THE DELAMINATION'S EXISTENCE IN THE
TRANSVERSE SANDWICH BEAM
The deflection of the transverse case delaminated sandwich beam can be seen in figure
86. The midspan deflection was found to be .08679 inches, which is only 10.53 percent lower
than the experimental value measured of .09700 inches. Because this value is statistically
significant, the delaminated transverse case beam can be considered verified.
FIGURE 86 - DEFLECTION OF THE DELAMINATED TRANSVERSE CASE SANDWICH
BEAM

Richard Davis
72
4.6 LONGITUDINAL CASE SANDWICH BEAM VERIFICATION
4.6.1 MESH GENERATION AND LOADING OF LONGITUDINAL CASE SANDWICH
BEAM
The longitudinal case sandwich beam has the same loading and boundary conditions as
all the previous cases. The longitudinal case sandwich beam, seen in figure 87, was created in
COSMOS by extruding 13 different volumes representing the different sections of the beam. The
volumes of the longitudinal case sandwich beam can be viewed in figure 88.
FIGURE 87 - THE LONGITUDINAL CASE SANDWICH BEAM TO BE VERIFIED IN
COSMOS
FIGURE 88 - VOLUMES GENERATED IN COSMOS TO MODEL THE LONGITUDINAL
SANDWICH BEAM
The eight-node solid element mesh was applied to each volume with its corresponding
mechanical properties. The mesh, illustrated in figure 89, has the same boundary conditions as
the experimental setup where the y and z-direction translation is fixed in addition to constraining
the middle of the beam to have no translation in the x-axis. This set of boundary conditions

Richard Davis
73
allows the beam to rotate at the rollers, but keeps the beam from sliding longitudinally with the x-
direction fixed.
FIGURE 89 - LONGITUDINAL CASE SANDWICH BEAM'S LOADING AND BOUNDARY
CONDITIONS
An end vew of the beam is a convienient way to view the way in which the DAD key was
simulated in the mesh and can be viewed in figure 90.
FIGURE 90 - END VIEW OF THE LONGITUDINAL CASE SANDWICH BEAM'S MESH
4.6.2 RESULTS AND ANALYSIS OF LONGITUDINAL CASE SANDWICH BEAM
After the mesh generation and loading, the longitudinal case sandwich beam could be
verified. The loads totaling 100 pounds were placed at the same points along the span of the
beam as the previous beams studied. The load of 100 pounds was chosen because it lies in the
linear region of the load-deflection curve. Because the simulation assumes small angles of
deflection and linearity, the load value of 100 pounds works great for the model. Contours of the
deflection of the longitudinal case sandwich beam can be seen in figure 91. As illustrated, the
midspan deflection was found to be .080645 inches, which was only 9.39 percent lower than the
value measured of .08900 inches. The increase in stiffness and face sheet to foam core bonding

Richard Davis
74
given from the DAD key adds a significant amount of strength to the specimen, giving it a
decrease in deflection of 7.72 percent found numerically from the control beam.
FIGURE 91 - MIDSPAN DEFLECTION OF LONGITUDINAL CASE SANDWICH BEAM
As with the previous cases the mesh was checked to ensure that the result was a
converged solution. Four different cases were plotted to see the effect that the number of
elements has on the final solution. In each of the points plotted in figure 92, the number of
elements in each volume is multiplied by 23 because the number of nodes in each direction is
doubled from the case before. For instance, a model with 4000 nodes would then have 32,000 at
the next point etc. It is clear from the figure that the solution converges around the 4000 element
point because the difference in deflection between that value and the next is less and one-tenth
percent.
FIGURE 92 - CONVERGENCE HISTORY OF THE LONGITUDINAL CASE SANDWICH
BEAM SOLUTION
0.07
0.072
0.074
0.076
0.078
0.08
0.082
0 5000 10000 15000 20000 25000 30000 35000Mid
span
Def
lect
ion
(in
)
Number of Elements
Elemental Convergence of Long. Case

Richard Davis
75
4.6.3 MESH GENERATION AND LOADING OF LONGITUDINAL CASE SANDWICH
BEAM WITH DELAMINATION
The mesh generation, loading, and boundary conditions were all implemented in the same
mannar as the previous cases studied. The delamination, like the other models, was added in
between the loaded span of the beam. This was accomplished by detaching the nodes in the
region of the delamination so that the face- core interface is free.
4.6.4 RESULTS AND ANALYSIS OF LONGITUDINAL CASE SANDWICH BEAM WITH
DELAMINATION
To ensure that the delamination was properly modeled in the mesh, a plot of the stress
contours was generated. Figure 93, illustrates that the delamination was successfully modeled
because there is no transfer of stress between the face-core interface like there is with the non-
delaminated sample.
To verify that the experimental deflections measured were accurate, figure 94 was
generated to illustrate the deflection contours of the beam. As seen in the figure, the midspan
deflection of the delaminated longitudinal case sandwich beam was found to be .08065 inches,
which is 6.20 percent lower than the experimental value measured of .08601 inches. This value
of error is consistent with the other values found for the different beam cases.
FIGURE 93 - STRESS CONTOURS VERIFYING THE DELAMINATION IN THE
LONGITUDINAL CASE BEAM

Richard Davis
76
FIGURE 94 - DEFLECTION CONTOURS OF THE DELAMINATED LONGITUDINAL CASE
SANDWICH BEAM
4.7 COMPARISON OF EXPERIMENTAL AND NUMERICAL DEFLECTION
The validation of the deflections found experimentally was successful. The final
comparison of numerical and experimental values can be found in table 8. The table
demonstrates that all the deflections used in the equations to find the mechanical data of the
sandwich beams are significant.
The fact that all the values found numerically are 6-10 percent lower than the values of
deflection found experimentally add to the confidence that the simulation was successful. In
addition, for standard displacement based elements, the response is stiffer than the actual values.
The error is likely due to the fact that the mechanical characteristics of the foam supplied by the
manufacturer have an exagerated elastic modulus. Because the foam was stacked (which is not
part of the ASTM standard) when testing for the mechanical characteristcs of the foam, the results
of the test were not used because they yielded a much lower elastic modulus than the
manufacturer provided. However, when the elastic modulus from the manufacturer is used, it is
too stiff and the deflections found resulted in smaller values. For research purposes, the elastic
modulus value found from testing the foam was used in the model and the same amount of error
resulted but this time the beams were not stiff enough and all the deflections were about 10
percent larger. The best thing to do would be to obtain a single sample of the foam to avoid
stacking and get the correct mechanical properties of the samples (which would probably be in
between the values tested and the values supplied by the manufacturer) and use that for the
simulation.

Richard Davis
77
TABLE 8 - COMPARISON OF ALL NUMERICAL AND EXPERIMENTAL DEFLECTIONS
Control Transverse Case Longitudinal Case
Non-Delaminated Delaminated Non-Delaminated Delaminated Non-Delaminated Delaminated
Experimental (in) 0.09736 0.09600 0.09430 0.09700 0.08900 0.08600
Numerical (in) 0.08739 0.08741 0.08679 0.08679 0.08060 0.08070
Percent Difference 10.24 8.95 7.96 10.53 9.39 6.20
4.8 VALIDATION OF MODEL
To ensure that the values of deflection found are accurate, a model of a composite
beam was created with the same loads and boundary conditions as the sandwich beams
tested and compared with theory. The model is made out of a layer of steel (EST= 30 X 106
psi) sandwiched between two layers of aluminum (EAL = 10 X 106 psi) as seen in figure 95.
FIGURE 95 - SIMPLY SUPPORTED COMPOSITE BEAM USED FOR VALIDATION
The method of equivalent stiffnesses17 and superposition18 was used to find the
model’s deflection theoretically. This type of linear elastic Euler-Bernoulli beam theory
works by taking the cross-section of different homogeneous materials and making one
equivalent cross-section that has the same bending stiffness as the original. Because the
elastic modulus of the steel is three times that of the aluminum, we can make one equivalent
cross-section of aluminum by replacing the steel with alminum that is three times as large
which can be seen in figure 96.
AL
ST
AL
3 in 3 in
9 in
1 in
.75 in
.25 in
AL
AL
ST
AL
AL
AL
1 in
1 in 1 in
.25 in
.75 in
1 in

Richard Davis
78
FIGURE 96 - EQUIVALENT SECTION BASED ON THEORY
The total moment of inertia was then found for this new section using equation 16:
(16)
The moment of inertia was found for each section using this equation and then
summed to obtain the total moment of inertia for the entire cross-section, which was
.03776 in4. With both the moment of inertia and the elastic modulus of the new section, the
deflection could be found through super-position. The equation used for the super-position
was for one load (see equation 17), and must be multiplied by two to obtain the result for
the beam with two loads.
(16)
Where is the maximum deflection of the beam, b is the distance from the right support to
the load location, and L is the length of the beam. Using this method, we find the deflection
of the beam to be .006919 inches for the case with two loads of 100 pounds each.
For the numerical simulation in COSMOS the loads and boundary conditions are
applied in the same mannar as all the previous sandwich composite beams. The material
properties of each material were added to the elements corresponding to that constituent.
The same eight-node solid element used for the previous analysis was also used for this
comparison. The deflection was numerically found to be .006945, as can be seen in figure
97, which is only 0.375 percent larger than the theoretical value obtained.
The small difference in deflection found in this model validation indicates that the
deflection values found in the previous examples were highly accurate.
FIGURE 97 - NUMERICAL DEFLECTION CONTOURS OF THE VALIDATION EXAMPLE

Richard Davis
79
5 CONCLUSION
5.1.1 OVERVIEW OF RESEARCH AND RESULTS
The use of a damage arrestment device (DAD) key that connects the carbon fiber face
sheets to the foam core to find whether an increase in the structural integrity of the sandwich
beam results was the scope of this research. An experimental method aided by theory was
employed to test the samples and was verified by a finite element approach.
ASTM standards D3039 and D1621 were used to verify the manufacturer’s data for the
mechanical properties of LTM45/CF1803 pre-impregnated carbon fiber and Last-A-foam FR
6710 polyvinylchloride foam respectively. With all the mechanical data, the effects of adding
DAD keys to a delaminated composite sandwich beam were studied under a four-point bending
test using ASTM standard D6272 and compared with non-delaminated beams to see if an increase
in ultimate strength resulted. The initial delamination in the beams under consideration was one
inch in length and located in between the loaded span of the beam. Two control beams were
utilized to compare experimental results with: one with no defects, and another with a one-inch
delamination introduced at the face-core interface. The DAD keys were added in two different
configurations signifying the worst and best possible cases to potentially stop the delamination
propagation and increase the ultimate strength. In the first configuration DAD keys were added
0.25 inches on either side of the initial delamination in the transverse direction and is considered
the worst case. The second configuration had a DAD key running along the longitudinal axis of
the sandwich beam and is considered the best case.
The key conclusions drawn from this research were:
Adding DAD keys to delaminated beams increases the ultimate strength of the beam by
44 percent in the transverse scenario and by 53 percent in the longitudinal scenario over
the delaminated control beam.
Adding DAD keys to a non-delaminated beam increases the ultimate strength by one and
11 percent in the transverse and longitudinal cases respectively over the non-delaminated
control.
Without DAD keys, the control beam’s primary failure mode is face-core delamination.
With DAD keys, the failure mode is material fracture at the load.
With all the experimental data, finite element models were created in COSMOS to
compare the test results to numerical data. The purpose of the finite element analysis was to
validate the experimental results by comparing the deflections of the beam subjected to four-point

Richard Davis
80
bending during the experiment to the deflections found numerically. All of the beams were
successfully validated with only a 6-10 percent difference in the deflections found between the
experimental and numerical data. All of the cases studied numerically were a small percentage
lower than the experimental values found, which means that the potential source of error was in
the mechanical properties of the material tested.
5.1.2 FUTURE USE FOR THE DAD KEY CONCEPT
A way to decrease the size of the delamination or cease the delamination from propagating at
the face-core interface can provide many benefits and advantages. The DAD keys reduce the
delamination growth, diminishing safety hazards. The reduction of delamination growth will
decrease the need for repair or replacement of the composite structure, reducing cost. Maintaining
the lightweight design reduces the time and the costs for transportation. In addition, the increased
structural integrity of the composite structure will enhance its dependability and endurance.
This research has shown that there is great potential for the use of DAD keys in industry.
As the DAD key concept is still in the research phase, there would need to be a lot of time and
money dedicated toward their implementation into structures before they can ever be utilized in
industry. Any place where a load is located that creates a bending moment in a structure is a
potential place that the DAD key inserts can be used. A pilot standing on a fuselage floor, a
mechanic stepping on a wing, a wrench being dropped on a cargo truck floor are all common
occurrences that can be addressed by the use of DAD keys in design.
5.1.3 FUTURE WORK
DAD key inserts have proven that they will likely have a future whether it is only in
research or in industry. Nevertheless, the concept still needs a large amount of future work to get
the idea into use. More investigation into size of the delamination, geometry of the DAD keys,
and the orientation of the DAD keys is of great need. Furthermore, research into the effects of
DAD keys after having the sandwich beam impacted is also pertinent to the future of the DAD
key.
There is a whole area of structural research on the subject of the geometry and material of
peel-stopping devices. Characterstics such as material selection, thickness, and orientation are all
attributes that are under investigation to see their effects on the impedence of face-core
delamination.

Richard Davis
81
In this research only the best and worst (longitudinal and transverse) case DAD key
orientations were studied. Research to see how the angle of the DAD key along the beam has an
effect on the stuctural integrity of the sample is also an essential area of study that needs further
investigation.

Richard Davis
82
6 REFERENCES
[1] Jones, R. M., Mechanincs of Composite Materials, 1st ed., Hempshire Publishing, United States, 1975, Chap. 1.
[2] Zenkert, D., The Handbook of Sandwich Construction, 1st ed., Engineering Materials Advisory Services, United
Kingdom, 1997, Chaps. Intro, Testing.
[3] Jakobsen, J., Bozhevolnaya, E., and Thomsen, O. T., ―New Peel Stopper Concept for Sandwich Structures,‖
Aalborg University, Denmark., Science Direct 3378-3385, April. 2007.
[4] Grenestedt, J., ―Development of a New Peel-Stopper for Sandwich Structures,‖ Lehigh University, P.A., Science
Direct 1555-1559, April. 2001.
[5] Wisnom, M. R., and Jones, M. I., ―Delamination Dues to Interaction Between Overall Interlaminar Shear and
Stresses at Terminating Plies,‖ University of Bristol, United Kingdom., Science Direct 39-47, 1995.
[6] Burman, M., and Zenkert, D., ―Fatigue of Foam Core Sandwich Beams, Part II: Effect of Initial Damages",
International Journal of Fatigue, Vol, 19, Nov. 1997.
[7] Kim, J. H., Lee, Y. S., Park, B. J., and Kim, D. H., ―Evaluation of Durability and Strength of Stitched Foam-Cored
Sandwich Structures,‖ Chungnam National University, Taejon, South Korea., Elsevier Science, Aug. 2000.
[8] Tsai, S. W., Gay, D., and Hoa, S. V., Composite Materials: Design and Application, 4th ed., CRC Press LLC., Boca
Raton, FL, 2003.
[9] ASTM Standard D3039, ―Tensile Properties of Polymer MatrixComposite Materials.‖ ASTM International. West
Conshohocken, PA., 2008.
[10] ASTM Standard E132, ―Poisson’s Ratio at Room Temperature.‖ ASTM Inernational. West Conshohocken, PA.,
2010.
[11] Advanced Composites Group, ―LTM 45-1 Component Prepreg‖. Umeco Composites. Debrishire, UK. 2009.
[12] ASTM Standard D1621, ―Compressive Properties of Rigid Cellular Plastics.‖ ASTM International. West
Conshohocken, PA., 2010.
[13] ASTM Standard D6272, ―Flexural Properties of Unreinforced and Reinforced Plastics and Electrical Insulating
Materials by Four-Point Bending.‖ ASTM International. West Conshohocken, PA., 2010.
[14] General Plastics Company, ―Last-A-Foam 6700 Series Property Graphs‖. General Plastics Manufacturing
Company. Tacoma, WA. 2008.
[15] Structural Research and Analysis Corporation (Multiple Authors), COSMOS/M Basic FEA System, 2nd ed.,
Structural Research and Analysis Corporation, United States, October 1998, Chap. 5.

Richard Davis
83
[16] Eswonia, Eugene, Composite Sandwich Structure Delamination Investigation, California Polytechnic State
University, United States, May 2009, Chap. 4.
[17] American Society of Testing and Materials, Applications of Composite Materials STP 524, 1st ed., Library of
Congress, Tallahassee FL., 1973, Chap. 1.
[18] Beer, F. P., Johnston, R. E., Dewolf T. J., Mechanincs of Materials, 4st ed., McGraw Hill, United States, 2006, pg.
762.