Embed Size (px)
Citation preview
IOSR Journal of Engineering (IOSRJEN)
e-ISSN: 2250-3021, p-ISSN: 2278-8719 Vol. 3, Issue 11 (November. 2013), ||V1|| PP 29-41
www.iosrjen.org 29 | P a g e
Performance Evaluation of a Gas Turbine Power Plant by the
application of Compressor Off-Line and On-Line Water Washing
Techniques. (A Case Study of 450MW Sapele Power Station in
Delta State, Nigeria)
A. J. Ujam, P. O. Ekere, and T. O. Chime. a. Department of Mechanical and Production Engineering, Enugu State University of Science and Technology, Enugu.
b. Department of Engineering Research, Development and Production, Project Development Institute (PRODA), Enugu. c. Department of Chemical Engineering, Enugu State University of Science and Technology, Enugu.
Abstract: - The aim of this research is to appraise the performance of a gas turbine engine through the use of
compressor online and off-line water washing optimization maintenance technique. Data were collected from the power generation station, Sapele, Delta State over a period of twenty four months (two yrs) from two gas
turbine engines “GT1 & GT2”, of the same capacity, and at the same location, commissioned the same time.
GT1 uses both compressor online and off-line water washing optimization technique, while GT2 uses only off-
line water washing optimization technique. The data collected were analyzed. It shows that before the offline
water washing exercise, GT2 were operating at 8.47 bar, as depicted in trend for GT2. The compressor outlet
pressure is an indication of fouling, as this menace causes a reduction of the pressure. The application of online
water washing to GT1 increases the pressure to 9.99 bar. The trend shows that the use of online water washing
improved the firing temperature of GT1 by 6.96%. The trend shows that the use of online water washing
improved the Network output of GT1 by 6.42%. The network output momentarily decreases due to redeposition
of foulants in the later stages of the compressor indicating inappropriate application of washing procedure. GT1
yielded compressor efficiency of 81.6% as a result of online water washing against the 78.5% of GT2. It also implies that the air pumping capacity of the GT1 compressor has increased. It is observed that a small change of
the compressor efficiency have a significant effect on the overall GT performance and efficiency. GT1 has
compressor efficiency of 81.6% which resulted to overall GT efficiency of 28.3% against 27.7% of GT2. GT1
fuel consumption was less by 2.14kg/kwh as a result of online water washing against the 18.55kg/kwh of GT2.
Key words: - Gas Turbine, Compressor, Pressure, Online washing, Offline washing, Fuel Consumption,
Efficiency, Fouling.
I. INTRODUCTION
Power generation is an important issue today, prompt by the zeal to have an efficient energy sector
which is generally regarded as a pre-requisite for the realization of goals and objectives of economic reforms
such as wealth creation, employment generation, poverty reduction and eradication. In the face of these challenges, government after government have not lacked in the amount of pious resolves to steer the nation on
the path of reform that would dramatically cure the apparently intractable energy problem. The growth in
electricity demand being experienced in Nigeria has resulted in the need to build power plants that generate
maximum power output overtime, with a reduction in down-time. Due to less installation time, low installation
cost and availability of natural gas in the country, many states of the country and private establishments are
currently building gas turbine power plants to meet this demand. However, one major disadvantage that
penalizes the gas turbine performing is the adverse effect of the environment on the gas turbine power output
and efficiency. Gas turbines designed to operate at maximum efficiency at standard ambient temperatures and
relative humidity may tend to reduce in performance due to adaptation problems resulting from variation in
weather conditions as they are installed at different locations.
The ability to predict the behaviour of a gas turbine engine and optimize its performance is critical in economic, thermal and condition monitoring studies. To utilize the high economic and energy saving potential
of a gas turbine engine in their simple and combined cycles, it is important to identify their optimal design
parameters and determine the impact of the deviation of these parameters from the standard conditions, on the
overall performance of the engine. Compressor fouling has been identified as one of the major sources of this
deviation and gas- turbine degradation. Thus compressor online water washing optimization technique is often
applied to recover gas turbine performance loss.
Performance Evaluation of a Gas Turbine Power Plant by the application of Compressor Off-Line
www.iosrjen.org 30 | P a g e
Offline Washing: Offline washing is a typical “soak and rinse” procedure for which the gas turbine must be shut down
and cooled. The compressor is rotated at crank-speed while a cleaning fluid is injected via the injector nozzles, installed in the air inlet plenum.
Offline washing is almost always carried-out with the aid of detergent, and extremely effective power recovery
can usually be achieved. However, it is important that the manufacturer‟s recommendations are followed with
respect to water quality, detergent/water ratio and other operating procedures. The downtime for a crank wash
depends mainly on the time it takes for cooling the engine. Larger heavy-duty engines can take 8 to 10 hours to
cool whereas on light engines only 1.5 to 3 hours may be needed because of the low metal mass.
Online Washing: The primary objective of online washing is to extend the operating period between offline washes by
minimizing the build-up of deposits in the compressor, and thereby reducing the ongoing incremental power
losses. Online washing is performed with the unit in full operation, and under load. Outages or shutdown period are not required. The procedure involves the injection of a mixture of water and chemical detergent via
atomizing spray nozzles positioned around the compressor air intake plenum. This is followed by a flushing
period using pure water. With online cleaning, it is mandatory to use demineralized water for preparing the
cleaning fluid and for flushing. This is because the turbine is in operation, and high temperature corrosion
damage may occur if sodium or other contaminant metals enter the combustion path. An online washing
program should always be started on a clean engine, after an overhaul or crank wash. It is not recommended to
perform online washing on a heavily fouled engine, because large quantities of dirt removed from the front
stages would instantaneously pass through the compressor. Therefore, after starting an online wash program, the
time intervals between subsequent washings should be kept short: approximately every three days to weekly,
depending on the local conditions. The duration of each online wash can also be varied according to the degree
of fouling, engine size, and plant experiences, etc. Typical online cleaning cycles are in the order of 10 to 20
minutes and a flushing or rinsing cycle (using only demineralized water) of about the same duration should be applied after each cleaning cycle with detergent – for example, 10 to 20 minutes flushing cycle without
detergent.
Optimal compressor cleaning can normally be achieved by adopting a combined program of regular
and routine online washing, plus periodic offline washing during planned outages.
Correct application of these optimization techniques allows the turbine performance loss to be kept close to that
due to aging of the machine, identified as non-recoverable degradation.
The use of Hot water for offline washing requires that compressor wash skids should be equipped with
a heating system, insulated tanks, and insulated piping, etc, and this significantly increase acquisition costs,
equipment maintenance cost and operating cost. Engdar, et al. [1] conducted computational fluid Dynamics
(CFD) studies on hot water injection for offline compressor washing. The author concluded that, regardless of
its inlet temperature, i.e. “the inlet temperature of the washing fluid”, injected wash fluid is cooled down to ambient air temperature well before the spray reaches the inlet guide vanes. The author indicates that heating the
wash fluid may serve little benefit, despite that it is conceivable that hot water may improve cleaning efficiency
by helping to soften deposits and increase solubility.
Foulant deposits often contain sodium and potassium chlorides. These combine with water to form an
aggressive solution that promotes pitting corrosion of the blades. Corrosion is rarely observed beyond the eight
compressor stage, as no moisture will survive at the temperature beyond this point.
Cyrus B. Meher – Homji et al [2] studied the Environmental Impact of Online Washing. According to
their study, online washing will create a small increase in CO emission due to disturbance of the combustion
conditions associated with the injection of water. They concluded that this should not however, be
misinterpreted as a reason not to perform online cleaning, since the emission increase will be short-lived (only
for the duration of the wash and rinse cycle) and is normally classified as a “transient condition”. On the other
hand, according to their study, low mass flow online injection system will have less impact on CO emissions than high mass flow designs, because less water is injected. Also the use of detergent during online washing
have an insignificant impact on emissions, compared to the effect of water alone.
(Ogbonnaya, Ezenwa [3] studied the optimization of the performance of gas turbine engines. His study
recommended that operators should perform a combination of compressor hand cleaning, offline and online
washing simultaneously. He carried out a fifteen-week comparative performance analysis of a gas turbine on
industrial duty for electricity generation in Sapele, Delta State of Nigeria.
Elisabeth Syverud [4] conducted a detailed analytical investigation into the deterioration of turbine
operation including drop in compressor efficiency, fouling, first stage nozzle distortion, internal bleed seal
deterioration, drop in turbine efficiency, inlet filter fouling, and low fuel heating value. These parameters were
Performance Evaluation of a Gas Turbine Power Plant by the application of Compressor Off-Line
www.iosrjen.org 31 | P a g e
examined to study the effect on the turbine operating line. His study concluded that compressor fouling has a
pronounced effect on the operating line and causes the movement of the operating line toward the surge line.
The susceptibility of gas turbine axial flow compressor to fouling (as a function of gas turbine design parameters) has been studied by Tarabrin, et al. [5]. Their work concluded that the rate of particle deposition on
blades increases with a growing angle of attack and that smaller engines exhibit a high sensitivity to fouling than
larger engines. Further, the sensitivity to fouling increases with increasing compressor stage head (Cp∆T).
Design parameters such as air inlet velocity at the inlet guide vanes, compressor pressure ratio, aerodynamic &
geometrical characteristics will determine the inherent sensitivity to fouling for a specific compressor design.
Tarabrin, et al. [5] have suggested that the index of axial compressor sensitivity to fouling can be represented
mathematically as:
6
3210
)1(
x
Dr
TmCISF
ch
stagep (1)
Where rh= Hub/tip ratio for the first stage.
Dc = Tip diameter of axial compressor first stage, m.
Cp = Specific heat (J/kg k).
∆Tstage = Average total temperature rise/stage, 0c.
According to Tarabrin, et al. [5] assuming engines operating under similar environmental conditions and with the same level and quality of air filtration, engines with higher ISF values would exhibit a greater
reduction of air flow, pressure and efficiency than engines with a lower ISF.
An empirical formular proposed by Tarabrin, et al. [5], for fouling Degradation Rate is given by
∆Power = a [1 – e-bt] (2)
Where: a = 0.07; b = 0.005; t = time
According to his study, fouling tends to occur during initial operation and roughly follows an
exponential law.
According to Elizabeth Syverud & Lars E. Bakken [6] successful online washing requires close
attention to the gas turbine flow path geometry, the operating profile and the nature of the airborne fouling at the
compressor inlet (after filtration). According to their study, there is currently no consensus on a recommended method for effective online water washing. System properties like droplet size, droplet velocity and fluid
injection rate vary from one system to another. This makes it difficult for operators to select the best online
water wash system for their application. They recommend that high water flow rate and moderate droplet size is
the most significant parameter for efficient online water wash. But low flow rate and smaller droplets causes re-
deposition of the fouling in the aft stages, and increased water injection time cannot compensate for low flow
rates.
Elizabeth Syverud and Lars E. Bakken carried-out online water wash test of a GE J85-13 jet engine at
the test facilities of the Royal Norwegian Air Force. The engine performance was deteriorated by injecting
atomized saltwater at the engine inlet. Then, the engine was online washed with water injected at three different
droplet sizes (25, 75, and 200µm) and at water-to-air ratios ranging from 0.4% to 3% by mass. Engine
performance was measured using standard on-engine instrumentation. According to their study, 75µm droplets are the most effective in recovering the overall engine performance, and in cleaning the fourth-stage; however,
the smaller droplets seem to redeposit the fouling in the sixth-stage and cause increased sixth-stage deterioration
The water was supplied at 24 bar pressure and a 5 minute online wash completely clean the compressor of salt
deposit.
This study therefore focuses on the performance evaluation of two gas turbine plants in the Niger Delta region
of Nigeria (Sapele).
According to Hart [7], Power generating gas turbine sets installed in Niger Delta area were inefficient
and problematic. Among the serious problems that have been common are failures of bladings, ruptured
combustion chambers, excessive vibration, all which occur after relatively short periods of operation of the sets.
The incidence compressors stalls, surges are also common. According to his study, industrial gas turbines are
generally designed with temperate region climatic and environmental condition, since most of the users of the
machines are in that region. The ambient conditions in the temperate regions are also relatively closer to those required for optimum performance of gas turbines. However Niger Delta lies on the equatorial rain forest region
which has climatic conditions that are sharply different from those of temperate regions. According to his study,
a degree centigrade (1˚C) rise in ambient temperature above ISO condition could be responsible for the
following: 0.83% reduction in power output, 0.17% increase in heat rate and 0.40% decrease in required air flow
rate. His study reveals that GTs is more sensitive to initial fouling than the later one. Changes in power output
Performance Evaluation of a Gas Turbine Power Plant by the application of Compressor Off-Line
www.iosrjen.org 32 | P a g e
and compressor isentropic efficiency fell by as much as between 3% to 5% and 5% to 7% respectively in the
first 500 hours of operation after cleaning but changed by as little as 2% to 3% and 3% to 5% respectively for
periods of 4000 hours or more after the initial 500 hours. Thus operating gas turbines designed with temperate region conditions in Niger Delta will experience performance problem if appropriate remedies are not put in
place.
II. METHODOLOGY AND RESULTS
Data were collected from daily log sheets and annual generation reports at the instrumentation
Department of the Station. In processing the data average daily values were obtained as appropriate. Using the
same method, average values for the various weeks, months and the years were obtained.
GT1 were maintained by weekly online washing and periodic offline washing (six months interval), whereas
GT2 were maintained by periodic offline washing only (four months interval). From table 7 & 8 below, T1, T2, T3, T4, P1 & P2 were collated from the generation station over a period of twenty-four months starting from May
2010 to April 2012. While other variables (Wc, Wt, Wnet, ηc. ηo, SFC), were derived from equation (19) to (32)
using Scilab programming language. For Compression process Cp = 1.005kJ/kgk, γ = 1.4
For Combustion process & Expansion process Cp = 1.11kJ/kgk, γ = 1.3
2.1 Description of the GT (GE Frame PG9171E):
The GT is a single shaft, three bearing heavy duty industrial unit with a 17 – stage axial flow
compressor (equipped with eight (8) plugged nozzles located in the forward wall of the compressor inlet bell
mouth for off-line washing and sixteen (16) plugged nozzles for on-line washing located as follows: eight (8) on
the forward wall and back wall of the compressor inlet bell mouth respectively), can-annular type combustor
and a 3- stage axial flow turbine. The rotor assembly consisting of one compressor rotor joined to one turbine rotor by a flanged joint, and lays on three journal bearings (two elliptical and one tilting pad type). Two thrust
bearings; one Kingsbury type (loaded) and one tilting pad type (unloaded) are also provided. The engine is
designed for 3000 rpm nominal speed, to be directly coupled to a two-pole synchronous electric generator. The
gas turbine unit casings and shells are split and flanged horizontally for convenience of disassembling.
Table 1:Typical Water Quality Requirements for an on/offline washing
Offline Washing
(1) Total solids (dissolved and undissolved)
(2) Total alkali metal
(3) Other metals
(4) pH (determined by glass electrode)
Quality Specification
100 ppm
25 ppm
1.0 ppm
6.5 to 7.5
Online Washing Quality Specification
(1) Total solids (dissolved & undissolved)
(2) Total alkali metal & other metals
(3) pH (determined by glass electrode)
5 ppm
0.5 ppm
6.5 to 7.5
Hint: ppm = part per million
Table 2: Technical specifications of GE frame 9E gas turbine:
Parameter Design Specification ISO Specification
Atmospheric Pressure 1.013 bar 1.013 bar
Design Ambient Temperature 50˚C = 323˚K 15˚C = 288˚K
Minimum Ambient Temperature -5˚C = 268˚K -
Maximum Ambient Temperature 55˚C = 328˚K -
Design Relative Humidity 30% 60%
Minimum Relative Humidity 5% -
Maximum Relative Humidity 95% -
Basic Wind Speed 3.2 m/s 3.2 m/s
Performance Evaluation of a Gas Turbine Power Plant by the application of Compressor Off-Line
www.iosrjen.org 33 | P a g e
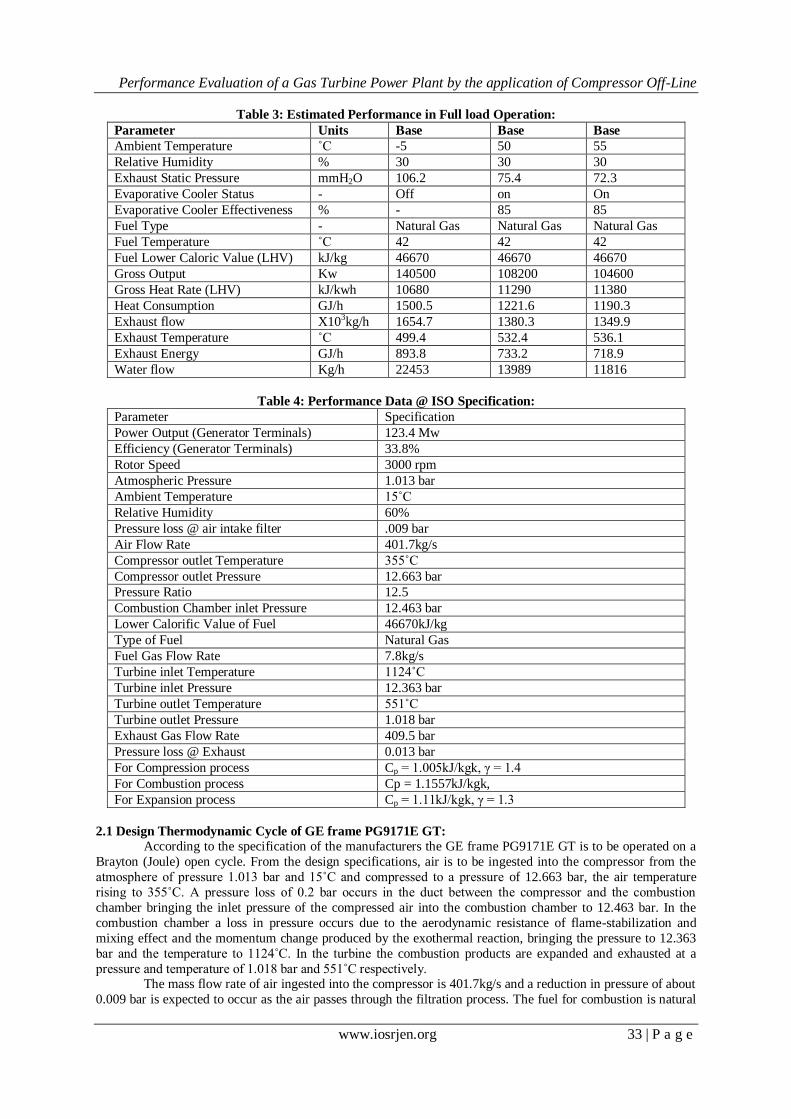
Table 3: Estimated Performance in Full load Operation:
Parameter Units Base Base Base
Ambient Temperature ˚C -5 50 55
Relative Humidity % 30 30 30
Exhaust Static Pressure mmH2O 106.2 75.4 72.3
Evaporative Cooler Status - Off on On
Evaporative Cooler Effectiveness % - 85 85
Fuel Type - Natural Gas Natural Gas Natural Gas
Fuel Temperature ˚C 42 42 42
Fuel Lower Caloric Value (LHV) kJ/kg 46670 46670 46670
Gross Output Kw 140500 108200 104600
Gross Heat Rate (LHV) kJ/kwh 10680 11290 11380
Heat Consumption GJ/h 1500.5 1221.6 1190.3
Exhaust flow X103kg/h 1654.7 1380.3 1349.9
Exhaust Temperature ˚C 499.4 532.4 536.1
Exhaust Energy GJ/h 893.8 733.2 718.9
Water flow Kg/h 22453 13989 11816
Table 4: Performance Data @ ISO Specification:
Parameter Specification
Power Output (Generator Terminals) 123.4 Mw
Efficiency (Generator Terminals) 33.8%
Rotor Speed 3000 rpm
Atmospheric Pressure 1.013 bar
Ambient Temperature 15˚C
Relative Humidity 60%
Pressure loss @ air intake filter .009 bar
Air Flow Rate 401.7kg/s
Compressor outlet Temperature 355˚C
Compressor outlet Pressure 12.663 bar
Pressure Ratio 12.5
Combustion Chamber inlet Pressure 12.463 bar
Lower Calorific Value of Fuel 46670kJ/kg
Type of Fuel Natural Gas
Fuel Gas Flow Rate 7.8kg/s
Turbine inlet Temperature 1124˚C
Turbine inlet Pressure 12.363 bar
Turbine outlet Temperature 551˚C
Turbine outlet Pressure 1.018 bar
Exhaust Gas Flow Rate 409.5 bar
Pressure loss @ Exhaust 0.013 bar
For Compression process Cp = 1.005kJ/kgk, γ = 1.4
For Combustion process Cp = 1.1557kJ/kgk,
For Expansion process Cp = 1.11kJ/kgk, γ = 1.3
2.1 Design Thermodynamic Cycle of GE frame PG9171E GT:
According to the specification of the manufacturers the GE frame PG9171E GT is to be operated on a
Brayton (Joule) open cycle. From the design specifications, air is to be ingested into the compressor from the
atmosphere of pressure 1.013 bar and 15˚C and compressed to a pressure of 12.663 bar, the air temperature
rising to 355˚C. A pressure loss of 0.2 bar occurs in the duct between the compressor and the combustion
chamber bringing the inlet pressure of the compressed air into the combustion chamber to 12.463 bar. In the
combustion chamber a loss in pressure occurs due to the aerodynamic resistance of flame-stabilization and
mixing effect and the momentum change produced by the exothermal reaction, bringing the pressure to 12.363
bar and the temperature to 1124˚C. In the turbine the combustion products are expanded and exhausted at a
pressure and temperature of 1.018 bar and 551˚C respectively. The mass flow rate of air ingested into the compressor is 401.7kg/s and a reduction in pressure of about
0.009 bar is expected to occur as the air passes through the filtration process. The fuel for combustion is natural
Performance Evaluation of a Gas Turbine Power Plant by the application of Compressor Off-Line
www.iosrjen.org 34 | P a g e
gas with lower calorific value of about 46670kJ/kg and the fuel should come in at the 7.8kg/s while the total
mass of the exhaust gas is about 409.5kg/s.
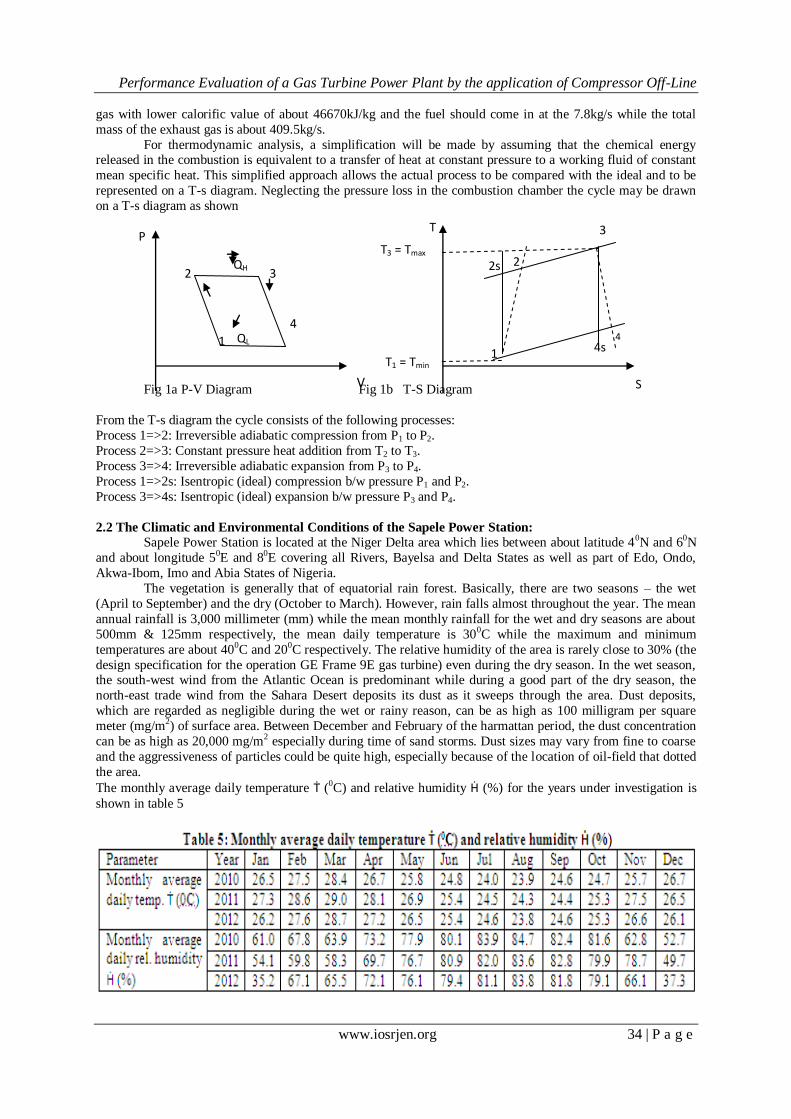
For thermodynamic analysis, a simplification will be made by assuming that the chemical energy released in the combustion is equivalent to a transfer of heat at constant pressure to a working fluid of constant
mean specific heat. This simplified approach allows the actual process to be compared with the ideal and to be
represented on a T-s diagram. Neglecting the pressure loss in the combustion chamber the cycle may be drawn
on a T-s diagram as shown
Fig 1a P-V Diagram Fig 1b T-S Diagram
From the T-s diagram the cycle consists of the following processes:
Process 1=>2: Irreversible adiabatic compression from P1 to P2.
Process 2=>3: Constant pressure heat addition from T2 to T3.
Process 3=>4: Irreversible adiabatic expansion from P3 to P4.
Process 1=>2s: Isentropic (ideal) compression b/w pressure P1 and P2.
Process 3=>4s: Isentropic (ideal) expansion b/w pressure P3 and P4.
2.2 The Climatic and Environmental Conditions of the Sapele Power Station: Sapele Power Station is located at the Niger Delta area which lies between about latitude 40N and 60N
and about longitude 50E and 80E covering all Rivers, Bayelsa and Delta States as well as part of Edo, Ondo,
Akwa-Ibom, Imo and Abia States of Nigeria.
The vegetation is generally that of equatorial rain forest. Basically, there are two seasons – the wet
(April to September) and the dry (October to March). However, rain falls almost throughout the year. The mean
annual rainfall is 3,000 millimeter (mm) while the mean monthly rainfall for the wet and dry seasons are about
500mm & 125mm respectively, the mean daily temperature is 300C while the maximum and minimum
temperatures are about 400C and 200C respectively. The relative humidity of the area is rarely close to 30% (the
design specification for the operation GE Frame 9E gas turbine) even during the dry season. In the wet season, the south-west wind from the Atlantic Ocean is predominant while during a good part of the dry season, the
north-east trade wind from the Sahara Desert deposits its dust as it sweeps through the area. Dust deposits,
which are regarded as negligible during the wet or rainy reason, can be as high as 100 milligram per square
meter (mg/m2) of surface area. Between December and February of the harmattan period, the dust concentration
can be as high as 20,000 mg/m2 especially during time of sand storms. Dust sizes may vary from fine to coarse
and the aggressiveness of particles could be quite high, especially because of the location of oil-field that dotted
the area.
The monthly average daily temperature Ṫ (0C) and relative humidity Ḣ (%) for the years under investigation is
shown in table 5
1
2 3
4 QL
QH T3 = Tmax
T1 = Tmin
S
3
2
P
V
T
1
2s
4s 4
Performance Evaluation of a Gas Turbine Power Plant by the application of Compressor Off-Line
www.iosrjen.org 35 | P a g e
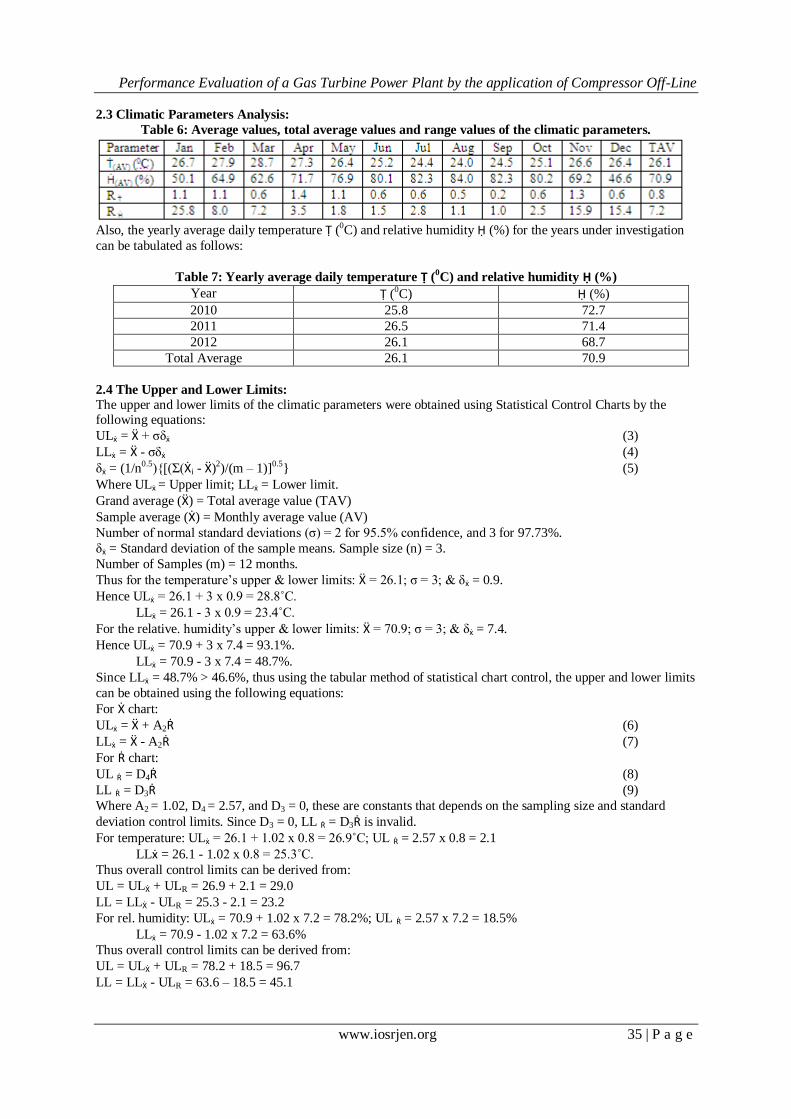
2.3 Climatic Parameters Analysis:
Table 6: Average values, total average values and range values of the climatic parameters.
Also, the yearly average daily temperature Ṭ (0C) and relative humidity Ḥ (%) for the years under investigation
can be tabulated as follows:
Table 7: Yearly average daily temperature Ṭ (0C) and relative humidity Ḥ (%)
Year Ṭ (0C) Ḥ (%)
2010 25.8 72.7
2011 26.5 71.4
2012 26.1 68.7
Total Average 26.1 70.9
2.4 The Upper and Lower Limits:
The upper and lower limits of the climatic parameters were obtained using Statistical Control Charts by the following equations:
ULẋ = Ẍ + σδẋ (3)
LLẋ = Ẍ - σδẋ (4)
δẋ = (1/n0.5){[(Σ(Ẋi - Ẍ)2)/(m – 1)]0.5} (5)
Where ULẋ = Upper limit; LLẋ = Lower limit.
Grand average (Ẍ) = Total average value (TAV)
Sample average (Ẋ) = Monthly average value (AV)
Number of normal standard deviations (σ) = 2 for 95.5% confidence, and 3 for 97.73%.
δẋ = Standard deviation of the sample means. Sample size (n) = 3.
Number of Samples (m) = 12 months.
Thus for the temperature‟s upper & lower limits: Ẍ = 26.1; σ = 3; & δẋ = 0.9.
Hence ULẋ = 26.1 + 3 x 0.9 = 28.8˚C.
LLẋ = 26.1 - 3 x 0.9 = 23.4˚C.
For the relative. humidity‟s upper & lower limits: Ẍ = 70.9; σ = 3; & δẋ = 7.4.
Hence ULẋ = 70.9 + 3 x 7.4 = 93.1%.
LLẋ = 70.9 - 3 x 7.4 = 48.7%.
Since LLẋ = 48.7% > 46.6%, thus using the tabular method of statistical chart control, the upper and lower limits
can be obtained using the following equations:
For Ẋ chart:
ULẋ = Ẍ + A2Ṙ (6)
LLẋ = Ẍ - A2Ṙ (7)
For Ṙ chart:
UL Ṙ = D4Ṙ (8)
LL Ṙ = D3Ṙ (9)
Where A2 = 1.02, D4 = 2.57, and D3 = 0, these are constants that depends on the sampling size and standard
deviation control limits. Since D3 = 0, LL Ṙ = D3Ṙ is invalid.
For temperature: ULẋ = 26.1 + 1.02 x 0.8 = 26.9˚C; UL Ṙ = 2.57 x 0.8 = 2.1
LLẋ = 26.1 - 1.02 x 0.8 = 25.3˚C.
Thus overall control limits can be derived from:
UL = ULẊ + ULR = 26.9 + 2.1 = 29.0
LL = LLẊ - ULR = 25.3 - 2.1 = 23.2
For rel. humidity: ULẋ = 70.9 + 1.02 x 7.2 = 78.2%; UL Ṙ = 2.57 x 7.2 = 18.5%
LLẋ = 70.9 - 1.02 x 7.2 = 63.6%
Thus overall control limits can be derived from:
UL = ULẊ + ULR = 78.2 + 18.5 = 96.7
LL = LLẊ - ULR = 63.6 – 18.5 = 45.1
Performance Evaluation of a Gas Turbine Power Plant by the application of Compressor Off-Line
www.iosrjen.org 36 | P a g e
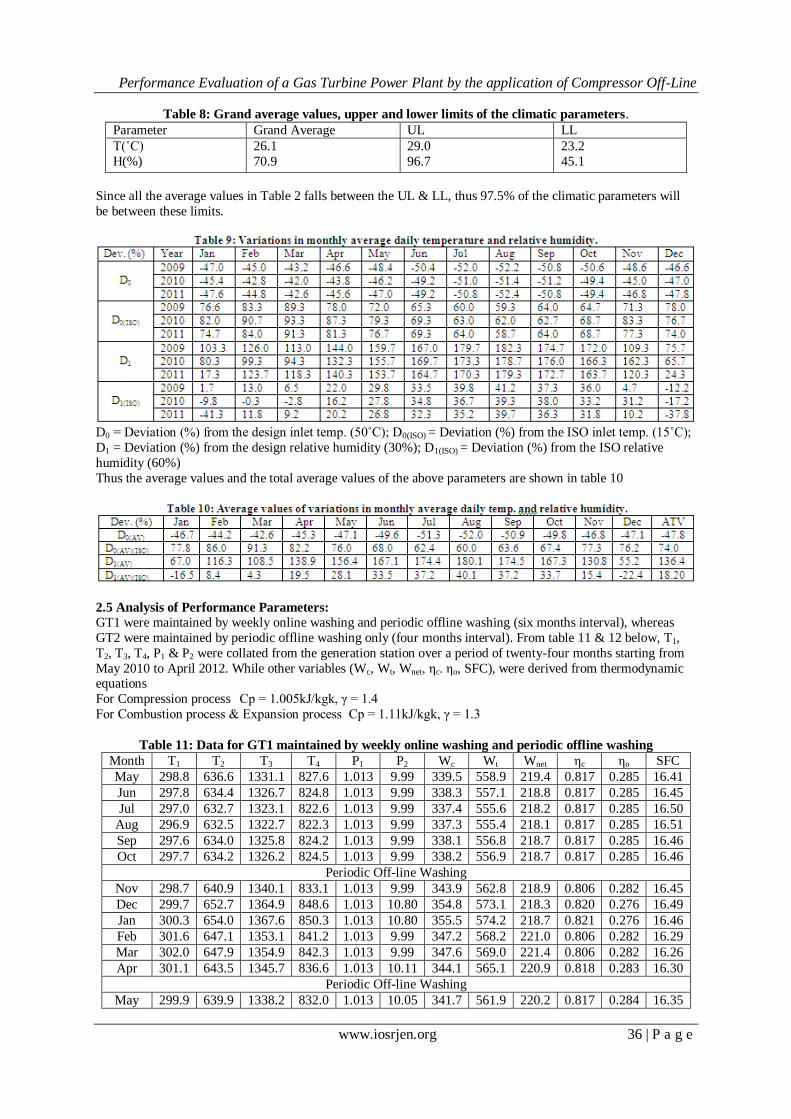
Table 8: Grand average values, upper and lower limits of the climatic parameters.
Parameter Grand Average UL LL
T(˚C)
H(%)
26.1
70.9
29.0
96.7
23.2
45.1
Since all the average values in Table 2 falls between the UL & LL, thus 97.5% of the climatic parameters will
be between these limits.
D0 = Deviation (%) from the design inlet temp. (50˚C); D0(ISO) = Deviation (%) from the ISO inlet temp. (15˚C);
D1 = Deviation (%) from the design relative humidity (30%); D1(ISO) = Deviation (%) from the ISO relative
humidity (60%)
Thus the average values and the total average values of the above parameters are shown in table 10
2.5 Analysis of Performance Parameters: GT1 were maintained by weekly online washing and periodic offline washing (six months interval), whereas
GT2 were maintained by periodic offline washing only (four months interval). From table 11 & 12 below, T1,
T2, T3, T4, P1 & P2 were collated from the generation station over a period of twenty-four months starting from
May 2010 to April 2012. While other variables (Wc, Wt, Wnet, ηc. ηo, SFC), were derived from thermodynamic equations
For Compression process Cp = 1.005kJ/kgk, γ = 1.4
For Combustion process & Expansion process Cp = 1.11kJ/kgk, γ = 1.3
Table 11: Data for GT1 maintained by weekly online washing and periodic offline washing
Month T1 T2 T3 T4 P1 P2 Wc Wt Wnet ηc ηo SFC
May 298.8 636.6 1331.1 827.6 1.013 9.99 339.5 558.9 219.4 0.817 0.285 16.41
Jun 297.8 634.4 1326.7 824.8 1.013 9.99 338.3 557.1 218.8 0.817 0.285 16.45
Jul 297.0 632.7 1323.1 822.6 1.013 9.99 337.4 555.6 218.2 0.817 0.285 16.50
Aug 296.9 632.5 1322.7 822.3 1.013 9.99 337.3 555.4 218.1 0.817 0.285 16.51
Sep 297.6 634.0 1325.8 824.2 1.013 9.99 338.1 556.8 218.7 0.817 0.285 16.46
Oct 297.7 634.2 1326.2 824.5 1.013 9.99 338.2 556.9 218.7 0.817 0.285 16.46
Periodic Off-line Washing
Nov 298.7 640.9 1340.1 833.1 1.013 9.99 343.9 562.8 218.9 0.806 0.282 16.45
Dec 299.7 652.7 1364.9 848.6 1.013 10.80 354.8 573.1 218.3 0.820 0.276 16.49
Jan 300.3 654.0 1367.6 850.3 1.013 10.80 355.5 574.2 218.7 0.821 0.276 16.46
Feb 301.6 647.1 1353.1 841.2 1.013 9.99 347.2 568.2 221.0 0.806 0.282 16.29
Mar 302.0 647.9 1354.9 842.3 1.013 9.99 347.6 569.0 221.4 0.806 0.282 16.26
Apr 301.1 643.5 1345.7 836.6 1.013 10.11 344.1 565.1 220.9 0.818 0.283 16.30
Periodic Off-line Washing
May 299.9 639.9 1338.2 832.0 1.013 10.05 341.7 561.9 220.2 0.817 0.284 16.35
Performance Evaluation of a Gas Turbine Power Plant by the application of Compressor Off-Line
www.iosrjen.org 37 | P a g e
Jun 298.4 635.7 1329.3 826.5 1.013 9.99 339.0 558.2 219.2 0.817 0.285 16.42
Jul 297.5 633.8 1325.3 824.0 1.013 9.99 338.0 556.5 218.6 0.817 0.285 16.47
Aug 297.3 633.4 1324.4 823.4 1.013 9.99 337.8 556.2 218.4 0.817 0.285 16.48
Sep 297.4 633.6 1324.9 823.7 1.013 9.99 337.9 556.3 218.5 0.817 0.285 16.48
Oct 298.3 635.5 1328.9 826.2 1.013 9.99 338.9 558.0 219.1 0.817 0.285 16.43
Periodic Off-line Washing
Nov 300.5 640.2 1338.7 832.3 1.013 9.99 341.4 562.1 221.8 0.817 0.285 16.23
Dec 299.5 652.3 1364.0 848.0 1.013 10.80 354.6 572.8 218.2 0.820 0.276 16.50
Jan 299.6 654.7 1369.1 851.2 1.013 10.97 357.3 574.9 217.6 0.821 0.274 16.54
Feb 300.6 642.5 1343.5 835.2 1.013 10.11 343.6 564.1 220.6 0.818 0.284 16.32
Mar 301.7 644.8 1348.4 838.3 1.013 10.11 344.8 566.2 221.4 0.818 0.284 16.26
Apr 300.2 641.5 1341.7 834.1 1.013 10.11 343.1 563.4 220.3 0.818 0.284 16.34
Average value 640.8 1339.9 833.0 - 10.16 343.3 562.7 219.4 0.816 0.283 16.41
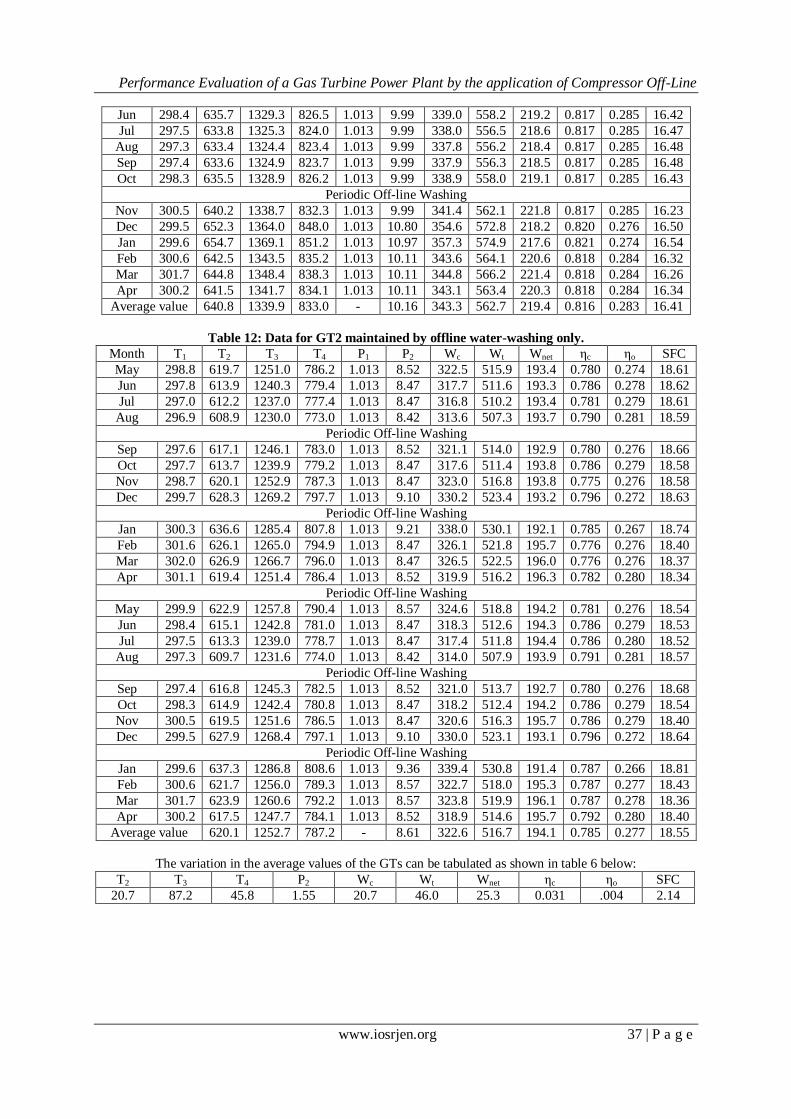
Table 12: Data for GT2 maintained by offline water-washing only.
Month T1 T2 T3 T4 P1 P2 Wc Wt Wnet ηc ηo SFC
May 298.8 619.7 1251.0 786.2 1.013 8.52 322.5 515.9 193.4 0.780 0.274 18.61
Jun 297.8 613.9 1240.3 779.4 1.013 8.47 317.7 511.6 193.3 0.786 0.278 18.62
Jul 297.0 612.2 1237.0 777.4 1.013 8.47 316.8 510.2 193.4 0.781 0.279 18.61
Aug 296.9 608.9 1230.0 773.0 1.013 8.42 313.6 507.3 193.7 0.790 0.281 18.59
Periodic Off-line Washing
Sep 297.6 617.1 1246.1 783.0 1.013 8.52 321.1 514.0 192.9 0.780 0.276 18.66
Oct 297.7 613.7 1239.9 779.2 1.013 8.47 317.6 511.4 193.8 0.786 0.279 18.58
Nov 298.7 620.1 1252.9 787.3 1.013 8.47 323.0 516.8 193.8 0.775 0.276 18.58
Dec 299.7 628.3 1269.2 797.7 1.013 9.10 330.2 523.4 193.2 0.796 0.272 18.63
Periodic Off-line Washing
Jan 300.3 636.6 1285.4 807.8 1.013 9.21 338.0 530.1 192.1 0.785 0.267 18.74
Feb 301.6 626.1 1265.0 794.9 1.013 8.47 326.1 521.8 195.7 0.776 0.276 18.40
Mar 302.0 626.9 1266.7 796.0 1.013 8.47 326.5 522.5 196.0 0.776 0.276 18.37
Apr 301.1 619.4 1251.4 786.4 1.013 8.52 319.9 516.2 196.3 0.782 0.280 18.34
Periodic Off-line Washing
May 299.9 622.9 1257.8 790.4 1.013 8.57 324.6 518.8 194.2 0.781 0.276 18.54
Jun 298.4 615.1 1242.8 781.0 1.013 8.47 318.3 512.6 194.3 0.786 0.279 18.53
Jul 297.5 613.3 1239.0 778.7 1.013 8.47 317.4 511.8 194.4 0.786 0.280 18.52
Aug 297.3 609.7 1231.6 774.0 1.013 8.42 314.0 507.9 193.9 0.791 0.281 18.57
Periodic Off-line Washing
Sep 297.4 616.8 1245.3 782.5 1.013 8.52 321.0 513.7 192.7 0.780 0.276 18.68
Oct 298.3 614.9 1242.4 780.8 1.013 8.47 318.2 512.4 194.2 0.786 0.279 18.54
Nov 300.5 619.5 1251.6 786.5 1.013 8.47 320.6 516.3 195.7 0.786 0.279 18.40
Dec 299.5 627.9 1268.4 797.1 1.013 9.10 330.0 523.1 193.1 0.796 0.272 18.64
Periodic Off-line Washing
Jan 299.6 637.3 1286.8 808.6 1.013 9.36 339.4 530.8 191.4 0.787 0.266 18.81
Feb 300.6 621.7 1256.0 789.3 1.013 8.57 322.7 518.0 195.3 0.787 0.277 18.43
Mar 301.7 623.9 1260.6 792.2 1.013 8.57 323.8 519.9 196.1 0.787 0.278 18.36
Apr 300.2 617.5 1247.7 784.1 1.013 8.52 318.9 514.6 195.7 0.792 0.280 18.40
Average value 620.1 1252.7 787.2 - 8.61 322.6 516.7 194.1 0.785 0.277 18.55
The variation in the average values of the GTs can be tabulated as shown in table 6 below:
T2 T3 T4 P2 Wc Wt Wnet ηc ηo SFC
20.7 87.2 45.8 1.55 20.7 46.0 25.3 0.031 .004 2.14
Performance Evaluation of a Gas Turbine Power Plant by the application of Compressor Off-Line
www.iosrjen.org 38 | P a g e
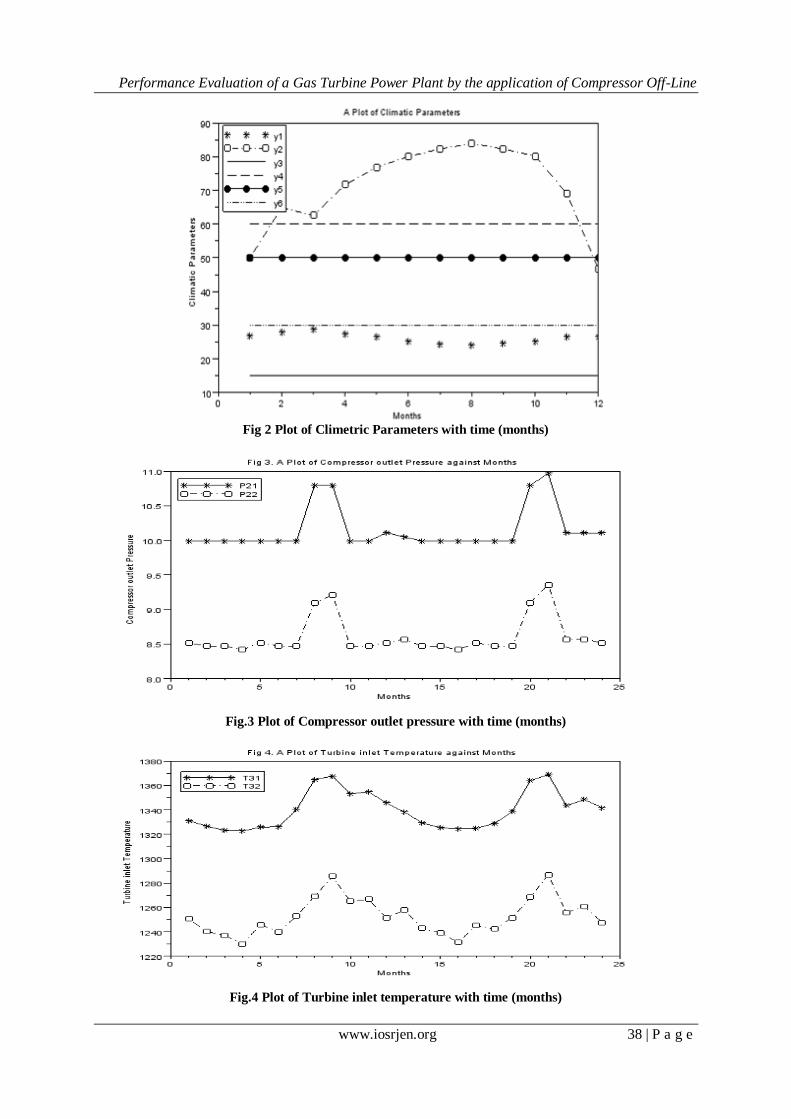
Fig 2 Plot of Climetric Parameters with time (months)
Fig.3 Plot of Compressor outlet pressure with time (months)
Fig.4 Plot of Turbine inlet temperature with time (months)
Performance Evaluation of a Gas Turbine Power Plant by the application of Compressor Off-Line
www.iosrjen.org 39 | P a g e
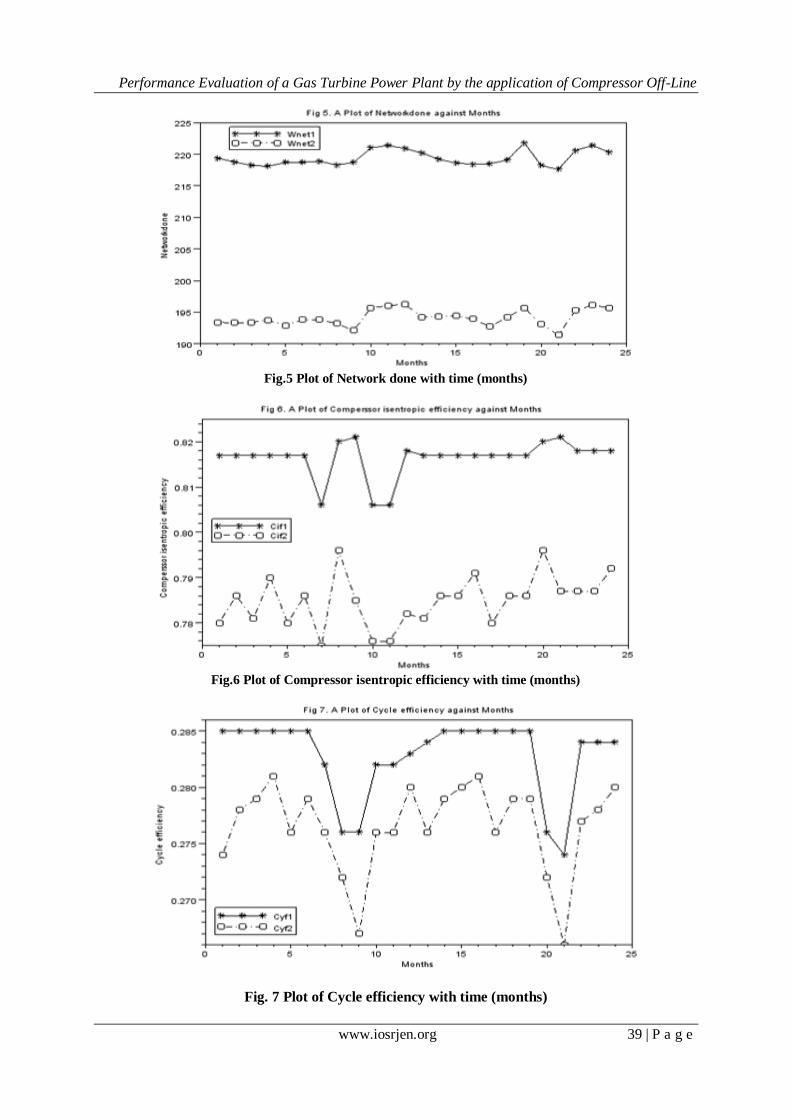
Fig.5 Plot of Network done with time (months)
Fig.6 Plot of Compressor isentropic efficiency with time (months)
Fig. 7 Plot of Cycle efficiency with time (months)
Performance Evaluation of a Gas Turbine Power Plant by the application of Compressor Off-Line
www.iosrjen.org 40 | P a g e
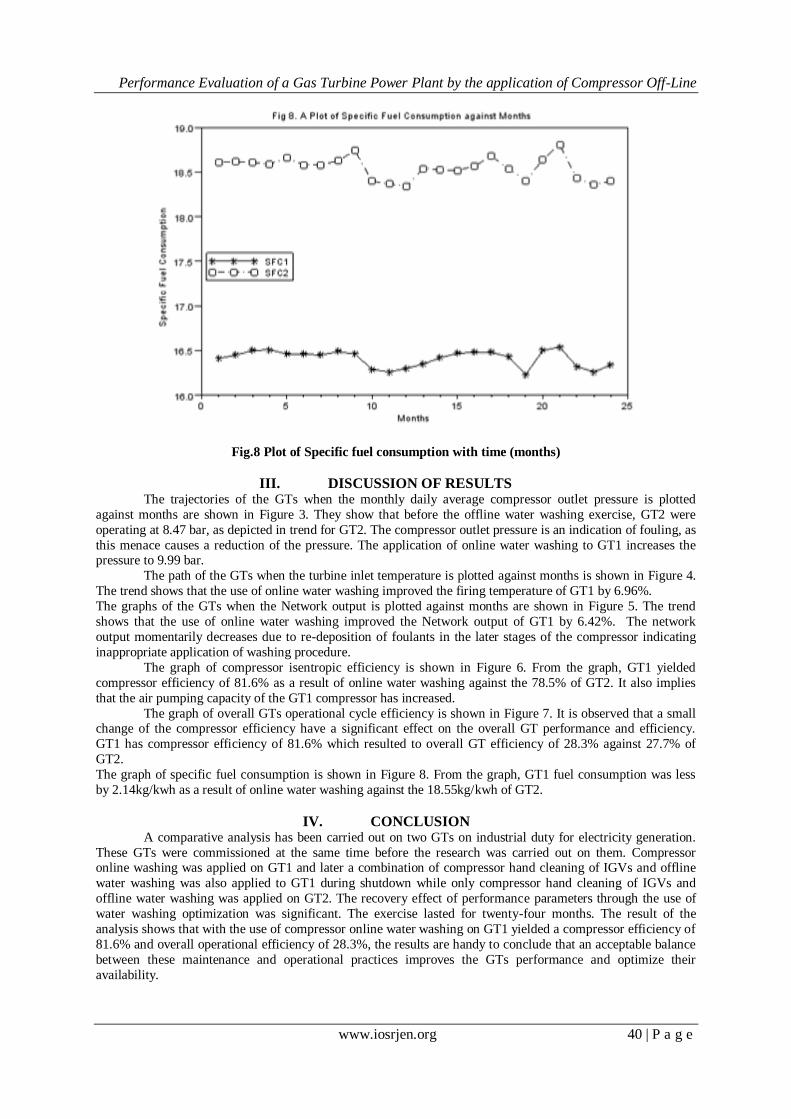
Fig.8 Plot of Specific fuel consumption with time (months)
III. DISCUSSION OF RESULTS
The trajectories of the GTs when the monthly daily average compressor outlet pressure is plotted
against months are shown in Figure 3. They show that before the offline water washing exercise, GT2 were
operating at 8.47 bar, as depicted in trend for GT2. The compressor outlet pressure is an indication of fouling, as
this menace causes a reduction of the pressure. The application of online water washing to GT1 increases the pressure to 9.99 bar.
The path of the GTs when the turbine inlet temperature is plotted against months is shown in Figure 4.
The trend shows that the use of online water washing improved the firing temperature of GT1 by 6.96%.
The graphs of the GTs when the Network output is plotted against months are shown in Figure 5. The trend
shows that the use of online water washing improved the Network output of GT1 by 6.42%. The network
output momentarily decreases due to re-deposition of foulants in the later stages of the compressor indicating
inappropriate application of washing procedure.
The graph of compressor isentropic efficiency is shown in Figure 6. From the graph, GT1 yielded
compressor efficiency of 81.6% as a result of online water washing against the 78.5% of GT2. It also implies
that the air pumping capacity of the GT1 compressor has increased.
The graph of overall GTs operational cycle efficiency is shown in Figure 7. It is observed that a small change of the compressor efficiency have a significant effect on the overall GT performance and efficiency.
GT1 has compressor efficiency of 81.6% which resulted to overall GT efficiency of 28.3% against 27.7% of
GT2.
The graph of specific fuel consumption is shown in Figure 8. From the graph, GT1 fuel consumption was less
by 2.14kg/kwh as a result of online water washing against the 18.55kg/kwh of GT2.
IV. CONCLUSION
A comparative analysis has been carried out on two GTs on industrial duty for electricity generation.
These GTs were commissioned at the same time before the research was carried out on them. Compressor online washing was applied on GT1 and later a combination of compressor hand cleaning of IGVs and offline
water washing was also applied to GT1 during shutdown while only compressor hand cleaning of IGVs and
offline water washing was applied on GT2. The recovery effect of performance parameters through the use of
water washing optimization was significant. The exercise lasted for twenty-four months. The result of the
analysis shows that with the use of compressor online water washing on GT1 yielded a compressor efficiency of
81.6% and overall operational efficiency of 28.3%, the results are handy to conclude that an acceptable balance
between these maintenance and operational practices improves the GTs performance and optimize their
availability.
Performance Evaluation of a Gas Turbine Power Plant by the application of Compressor Off-Line
www.iosrjen.org 41 | P a g e
REFERENCES
[1] Engdar, D (2004) „‟Gas Turbines Axial Compressor Fouling and Washing‟‟. Proceeding of the Thirty –
Third Turbo – Machinery Symposium , U. S. A
[2] Cyrus B. Meher-Homji & Andrew Bromley (2004), “Gas Turbine Axial Compressor Fouling and
Washing”. Proceeding of the Thirty Third Turbo-machinery Symposium U. S. A.
[3] Ezenwa Alfred Ogbonnaya (2011), “Gas Turbine Performance Optimization using Compressor Online
Water Washing Technique”. doi: 10.4263/eng.2011.35058. (http:/www.SciRP.Org/journal/eng).
[4] Elisabeth Syverud (2007), “Axial Compressor Performance Deterioration and Recovery through Online
Washing”. A Ph.D Thesis, Department of Energy and Process Engineering. Norwegian University
of Science and Technology, Norway.
[5] Tarabrin A.P., Bodrou A.I., Schurovsky .V.A, and Stalder, J.P (1996), “An analysis of Axial Compressor Fouling and a cleaning method of their Blading”, ASME International Gas
[6] Turbine and Aero engine congress, Birmingham, United Kingdom, ASME Paper No. 96-GT-363. 6.
Elisabeth Syverud and Lars E. Bakken (2005) “Online Water Wash Test of GE J85-13”. ASME Turbo
Expo 2005: Power for Land, Sea and Air. GT 2005-ASME Paper No. GT-2005- 68702.
[7] Howell Hart (1998), “Thermodynamic Appraisal of Gas Turbine Performance in the Niger Delta”. A
Ph.D Thesis, Department of Mechanical Engineering, University of Nigeria Nsukka, Enugu State.


![Gas turbine-power-plant[1]](https://img.pdfslide.net/doc/110x75/55ad62501a28ab681b8b45db/gas-turbine-power-plant1.jpg)