Embed Size (px)
Citation preview

Performance Incentive Mechanisms
National Governors Association
Wisconsin Retreat
March 29, 2016
Melissa Whited

Slide 2
Background
• Synapse Energy Economics is a research and consulting firm specializing in energy, economic, and environmental topics.
• Since its founding in 1996, Synapse has been a leader in providing rigorous analysis of energy, environmental and regulatory issues, for public interest and government clients.
• Report for the Western Interstate Energy Board: Utility Performance Incentive Mechanisms (PIMs): A Handbook for Regulators
Available at www.synapse-energy.com
Synapse Energy Economics

Slide 3
Regulatory Models (simplified comparison)
Synapse Energy Economics
Regulatory
Element
Cost of Service
Regulation
Performance-Based
Regulation (MRPs)
New Regulatory Models
(e.g., RIIO)
Frequency of rate
casesAs needed
Pre-determined, fixed
period (e.g., 5 years)
Pre-determined, fixed
period (e.g., 8 years)
Revenue
adjustments
between rate
cases
Generally noneAttrition relief
mechanisms
Attrition relief
mechanisms
Performance
Incentive
Mechanisms
Typically include safety,
reliability, and customer
service
Focus on areas that may
experience service
degradation due to cost
reductions
Designed to create
incentives to achieve a
broad set of desired
outcomes

4
The Regulatory Context and PIMs
• Each regulatory model has its own embedded incentives. PIMs can address/offset these incentives.
o Incentive to increase sales
o Incentive to build rate base
oLittle incentive to innovate (inadequate risk and reward opportunity)
• Are there regulatory goals that are not fully addressed in the current system?
oNew customer services for the evolving grid
• PIMs can help to articulate goals and provide the right incentives
Synapse Energy Economics

5
Four Discrete Steps
1. Identify
dimensions of utility performance to track
3. Set a
performance target
2. Develop
metrics for tracking and reporting performance
4. Add a
financial reward or penalty
Performance Metrics
Performance Incentive Mechanisms
Synapse Energy Economics
PIMs can be implemented incrementally, allowing for flexibility

6
1. Identify areas of performance to track
Safety
Reliability
Power plant performance
Customerservice
Lowercosts
Energy efficiency
Reduced losses
Improved load factor
Planning
Smart grid
DG
Customer engagement
Resiliency
Traditional Goals
Environmental Goals
Emerging Areas
Customer-targeted services
Renewable energy
Reduced emissions
Flexible Resources

7
1. Identify areas of performance to track
• What are Wisconsin’s goals? What are areas of interest?
• Possibilities:
o Ensuring AMI investments are cost-effective and customers reap all potential benefits
o Greater use of off-system sales to lower rates for Wisconsin ratepayers
o Improved customer load factors
o Better reliability
o Improved power plant performance
o Customer engagement/empowerment through better tools & information

8
2. Develop metrics
• Ensure the metric is tied to the policy goal and will provide useful
information about whether the goal is being attained
• Define metrics precisely, using regional or national definitions where
possible
• Helps avoid contention, and facilitates comparisons over time and across jurisdictions
• Reliability data could be collected in both standardized and Wisconsin-specific formats
• Utilities already report a large amount of data to the EIA, FERC, EPA, NERC, and other entities
• Choose metrics that are largely free from arbitrary influence
• Choose metrics that are easily measured and interpreted
o Complex data analyses reduce transparency
• Use independent parties to collect or verify data
Synapse Energy Economics

Slide 9
Examples of possible metrics
Synapse Energy Economics
Metric Purpose Metric Formula
System load factorIndication of improvement in system load factor over time
System average load / peak load
Line losses Indication of reductions in losses over timeTotal electricity losses / MWh generation, excluding station use
Demand response (DR)
Indication of participation and actual deployment of DR resources
Potential and actual peak demand savings (MW)
Distributed generation (DG)
Indication of the technologies, capacity, and rate of DG installations, and whether policies are supporting DG growth
Number of customers with DG
MW installed by type (PV, CHP, small wind, etc.)
Information
availability
Indicator of customers' ability to access their usage information
Number of customers able to access daily
usage data via a web portal
Percent of customers with access to
hourly or sub-hourly usage data via web
Time-varying ratesIndication of saturation of time-varying rates
Number of customers on time-varying
rates

Slide 10
Data Dashboards
• Data dashboards enable regulators and other stakeholders to quickly review
utility performance across a large number of performance areas
• Publicly accessible (website)
• Show historical trends, possibly comparison across utilities
Synapse Energy Economics
Example: Interactive website displaying utility performance

Slide 11
3. Set performance targets
• Balance the costs of achieving the target with the benefits to ratepayers
• What is the value of achieving the target? Customer surveys can help determine value to customers (e.g., is extra reliability worth the additional cost?)
• What are the costs of achieving the target? Does the utility have a budget cap on how much it can spend to achieve the target? Will costs be automatically passed on to customers?
• Set a realistic target. Various analytical techniques can help:
• Historical performance (if still relevant)
• Peer utility performance (if inherent differences between utilities can be controlled for)
• Frontier methods (measures technical efficiency of various firms)
• Utility-specific studies (IRPs and engineering studies can be useful)
• Use deadbands to mitigate uncertainty around a target
• Adjust targets only slowly and cautiously
Synapse Energy Economics

Slide 12
4. Set Financial Rewards and Penalties
• Symmetric vs. Asymmetric
• Symmetric rewards/penalties are common
• Reward-only incentives may encourage utilities to be more innovative, and may result in more collaborative and less adversarial processes
• Penalty-only incentives are sometimes appropriate when the outcome is an essential requirement for the utility, or when performance above the target provides little additional benefit to customers.
• Avoid “cliff effects” – sharp changes in penalty or reward due to small
change in performance
• Ensure a reasonable magnitude for incentive
• Large enough to capture utility management’s attention
• Should not overly reward or penalize utility
• Use a cap on maximum reward or penalty to ensure it remains within a reasonable bound
• Start with small incentives; increase only if necessary
Synapse Energy Economics

13
Types of Incentive Formulas
$(5,000,000)
$(2,500,000)
$-
$2,500,000
$5,000,000
-2 -1.5 -1 -0.5 0 0.5 1 1.5 2
Step Function
Std. Dev. from Target
$(5,000,000)
$(2,500,000)
$-
$2,500,000
$5,000,000
-2.5 -1.5 -0.5 0.5 1.5 2.5
Std Dev from Target
Linear with Deadband
Synapse Energy Economics
Avoid such cliff effects
Use deadbands to mitigate uncertainty

14
How big should financial incentives be?
• In the United States, the total maximum of all financial rewards/penalties
has often been set at approximately 1% - 3% of base revenues.
• In the UK, the RIIO model could have an impact greater than 5% of base
revenues (equivalent to +/- 500 basis points on ROE).
Synapse Energy Economics

15
What units should financial incentives be in?
• ROE basis points (but can encourage maximizing rate base)
• Avoided costs (but can vary too much)
o Example: energy efficiency rewards tied to avoided costs of energy are volatile
o Example: Diablo Canyon windfall
• Percent of base revenues
• Percent of pre-tax earnings
Synapse Energy Economics

RIIO
Slide 16Synapse Energy Economics

Slide 17
PIMs in RIIO
Synapse Energy Economics

Slide 18
Selected RIIO Outputs
• Environment:
Synapse Energy Economics
Deliverable Penalty or Reward Metric and Target Description
Electricity losses Discretionary reward Utilities report annually on loss reduction activities
undertaken, improvements achieved, and actions planned
for the following year.
Performance measured according to the effectiveness of
actions taken to reduce losses, engagement with
stakeholders, innovative approaches to loss reductions,
and sharing of best practices with other companies.
Business Carbon
Footprint (BCF)
Reputational Annual reporting requirement on CO2 equivalent
emissions, actions taken to reduce emissions over the past
year and their effectiveness.

Slide 19
RIIO Outputs, cont.
• Customer satisfaction and social obligations
Synapse Energy Economics
Deliverable Penalty or Reward Metric and Target Description
Customer
satisfaction
survey
Reward or penalty
up to 1% of annual
base revenue
A survey is used to measure the satisfaction of customers who have
required a new connection, have experienced an interruption to their
supply, or have made a request for a service or job to be completed.
Complaints Penalty of up to
0.5% of annual
base revenue.
Complaints and their weightings are measured based on how long it
takes to resolve complaints, percentage of repeat complaints, and
number of Energy Ombudsman decisions that go against the utility .
Stakeholder
engagement
Reward of up to
0.5% of annual
base revenue.
Assessment of utilities’ ability to understand and identify effective
solutions for vulnerable consumers, as well as their ability to integrate
this into core business activities.

Slide 20
RIIO Outputs, cont.
• Connections (including DG)
Synapse Energy Economics
Deliverable Penalty or Reward Metric and Target Description
Time to Connect
Incentive for Small
Connections
Reward of up to 0.4%
of annual base
revenue.
Time taken from initial application received to connection
completion.
Incentive on
Connection
Engagement (ICE)
for Large
Connections
Penalty of up to 0.9%
of annual base
revenue..
Each utility must submit evidence of how they have identified,
engaged with, and responded to the needs of their customers.

Pitfalls to Avoid
Slide 21Synapse Energy Economics
22
Pitfalls to Avoid
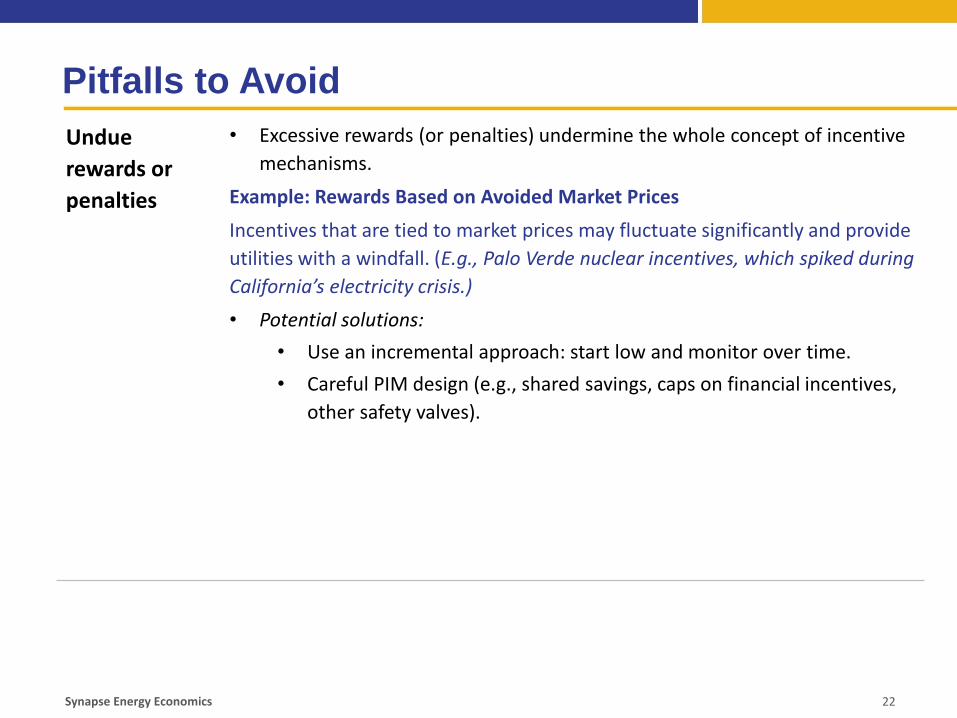
Undue
rewards or
penalties
• Excessive rewards (or penalties) undermine the whole concept of incentive
mechanisms.
Example: Rewards Based on Avoided Market Prices
Incentives that are tied to market prices may fluctuate significantly and provide
utilities with a windfall. (E.g., Palo Verde nuclear incentives, which spiked during
California’s electricity crisis.)
• Potential solutions:
• Use an incremental approach: start low and monitor over time.
• Careful PIM design (e.g., shared savings, caps on financial incentives,
other safety valves).
Synapse Energy Economics

23
Pitfalls to Avoid
Costs
Outweigh
Benefits
• Value to customers of achieving target is less than the cost (including the cost of
any shareholder incentives, regulatory cost, and project costs.)
• Potential solutions:
• Set a cap on the costs that can be passed on to customers.
• Ensure benefits are realized.
Example: Advanced Metering Infrastructure Incentive
Ensure customer savings are actually realized.
Shareholder incentives + actual project costs < actual customer savings
Synapse Energy Economics

24
Pitfalls to Avoid
Unintended
consequences
• An incentive for one performance area may cause the utility to under-
perform in areas that do not have incentives.
• Potential solutions:
• Focus on performance areas that are isolated from others.
• Be cautious of implications for other performance areas.
• Consider implementing a diverse, balanced set of incentives.
Regulatory
burden
• PIMs can be too costly, time-consuming, or too much of a distraction.
• Can be a problem for utilities, regulators, and stakeholders.
• Potential solutions:
• Streamline using existing data, protocols, and simple designs.
• Reduce the amount of money at stake.
Example: Penalties for Energy Efficiency
Some states have found that implementing penalties for energy efficiency is
not worthwhile, given the contentiousness of the proceedings.
Synapse Energy Economics
25
Pitfalls to Avoid
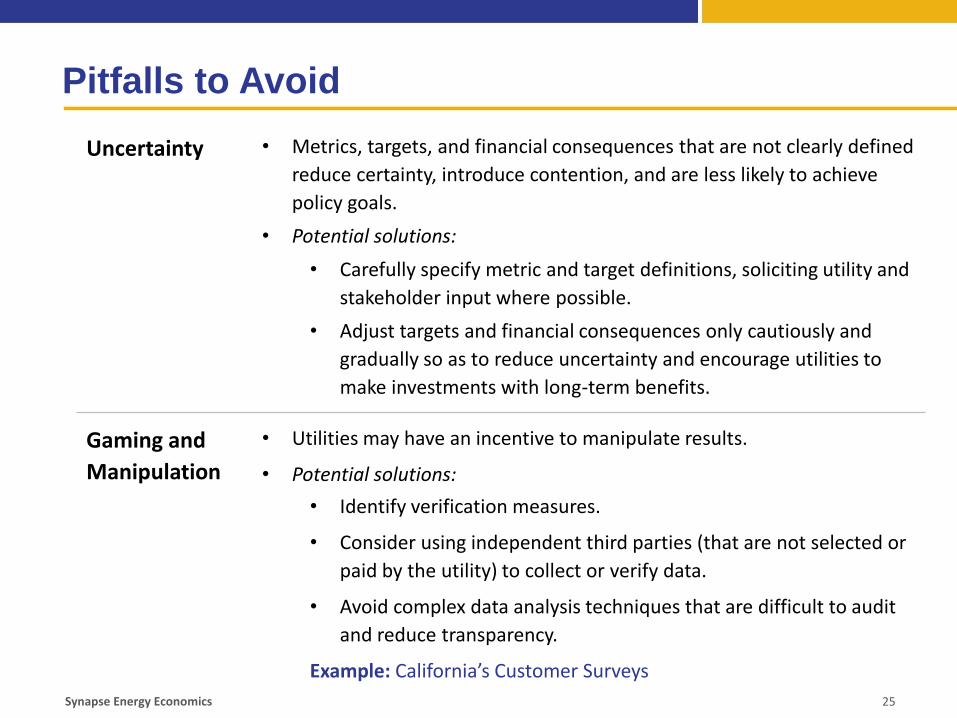
Uncertainty • Metrics, targets, and financial consequences that are not clearly defined
reduce certainty, introduce contention, and are less likely to achieve
policy goals.
• Potential solutions:
• Carefully specify metric and target definitions, soliciting utility and
stakeholder input where possible.
• Adjust targets and financial consequences only cautiously and
gradually so as to reduce uncertainty and encourage utilities to
make investments with long-term benefits.
Gaming and
Manipulation
• Utilities may have an incentive to manipulate results.
• Potential solutions:
• Identify verification measures.
• Consider using independent third parties (that are not selected or
paid by the utility) to collect or verify data.
• Avoid complex data analysis techniques that are difficult to audit
and reduce transparency.
Example: California’s Customer Surveys
Synapse Energy Economics

Slide 26
Key Take-Aways
• The goal is to improve performance cost-effectively• Ideally, both utility and customers should benefit
• Cost should never outweigh value to customers
• PIMs may be best coupled with MRPs to provide cost containment incentives
• Setting a good PIM can be difficult• Requires significant stakeholder engagement, discovery process, and lots of
analysis
• Good baseline data is vital
• Financial incentives might not be needed
• Better information = better results• A key benefit of PIMs (or metrics) is the ability to better understand what is
happening on the system
Synapse Energy Economics
Slide 27
Options for Different Contexts and Goals
Synapse Energy Economics
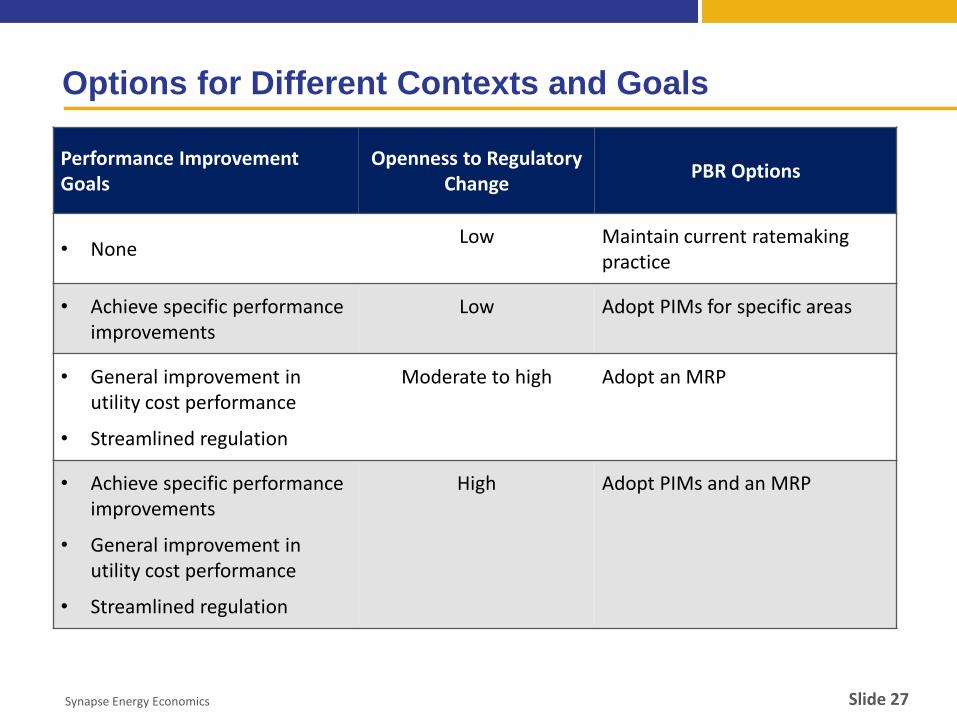
Performance Improvement Goals
Openness to Regulatory Change
PBR Options
• NoneLow Maintain current ratemaking
practice
• Achieve specific performance improvements
Low Adopt PIMs for specific areas
• General improvement in utility cost performance
• Streamlined regulation
Moderate to high Adopt an MRP
• Achieve specific performance improvements
• General improvement in utility cost performance
• Streamlined regulation
High Adopt PIMs and an MRP
Contact
• Synapse Energy Economics is a research and consulting firm specializing in energy, economic, and environmental topics.
• Since its founding in 1996, Synapse has been a leader in providing rigorous analysis of energy, environmental and regulatory issues, for public interest and government clients.
Melissa Whited
Synapse Energy Economics
617-661-3248

Slide 29
Appendix
Synapse Energy Economics

Slide 30
Selected RIIO Outputs
• Environment:
Synapse Energy Economics
Deliverable Penalty or Reward Metric and Target Description
Electricity losses Discretionary reward of
up to £4 million in year
2, £10 million in year 4,
and £14 million in year
6 for utilities that
exceed the loss
reduction commitments
in their business plans.
Utilities report annually on loss reduction activities
undertaken, improvements achieved, and actions planned
for the following year. Performance will be measured
according to multiple criteria, including the effectiveness of
actions taken to reduce losses, engagement with
stakeholders, innovative approaches to loss reductions,
and sharing of best practices with other companies.
Business Carbon
Footprint (BCF)
Reputational Annual reporting requirement on CO2 equivalent
emissions, actions taken to reduce emissions over the past
year and their effectiveness. All utilities' performance on
this metric summarized in one table.

Slide 31
RIIO Outputs, cont.
• Customer satisfaction and social obligations
Synapse Energy Economics
Deliverable Penalty or Reward Metric and Target Description
Customer
satisfaction
survey
Reward or penalty
up to 1% of annual
base revenue
A survey is used to measure the satisfaction of customers who have
required a new connection, have experienced an interruption to their
supply, or have made a request for a service or job to be completed.
Performance is measured based on the response to the question:
“Overall how satisfied were you with the service that you received?”
The target score will be set at a level that "can be objectively assessed to
represent a good level of performance."
Complaints Penalty of up to
0.5% of annual
base revenue. No
reward.
Complaints and their weightings are measured based on: (a) percentage
of complaints that are outstanding after one day (10% weighting); (b)
percentage of complaints that are outstanding after 31 days (30%
weighting); (c) percentage of complaints that are repeat complaints
(50% weighting); and number of Energy Ombudsman decisions that go
against the utility as a percentage of total complaints (10% weighting).
An industry target is set.
Stakeholder
engagement
Reward of up to
0.5% of annual
base revenue. No
penalty.
The regulator will develop a mechanism for assessing the utilities' use of
data and customer insight to understand and identify effective solutions
for vulnerable consumers, as well as their ability to integrate this into
core business activities.

Slide 32
RIIO Outputs, cont.
• Connections (including DG)
Synapse Energy Economics
Deliverable Penalty or Reward Metric and Target Description
Time to Connect
Incentive for Small
Connections
Reward of up to 0.4%
of annual base
revenue. No penalty.
Measures the time taken from initial application received to
the issue of a quotation and the time taken from quotation
acceptance to connection completion. Target based on
historical performance data, and target will become more
stringent over the period.
Incentive on
Connection
Engagement (ICE)
for Large
Connections
Penalty of up to 0.9%
of annual base
revenue. No reward.
Each utility must submit evidence of how they have identified,
engaged with, and responded to the needs of their customers.
These submissions will be compared to a set of minimum
requirements, which will likely to require each utility to
demonstrate how they have engaged with a broad range of
customers, established relevant performance indicators, and
developed a forward-looking work plan of actions to improve
performance (with associated delivery dates). Separate
submissions will be required for different market segments,
including distributed generation customers. A penalty will be
assessed for failing to meet the minimum requirements for
that market segment. The regulator will also continue to
engage with stakeholders to identify key issues and gather
feedback on utility performance.