Embed Size (px)
Citation preview

PERFORMANCE INDICATORS IN PRIMARY SCHOOLS
F E E D B A C K R E P O R T
K E Y S TA G E S 1 amp 2
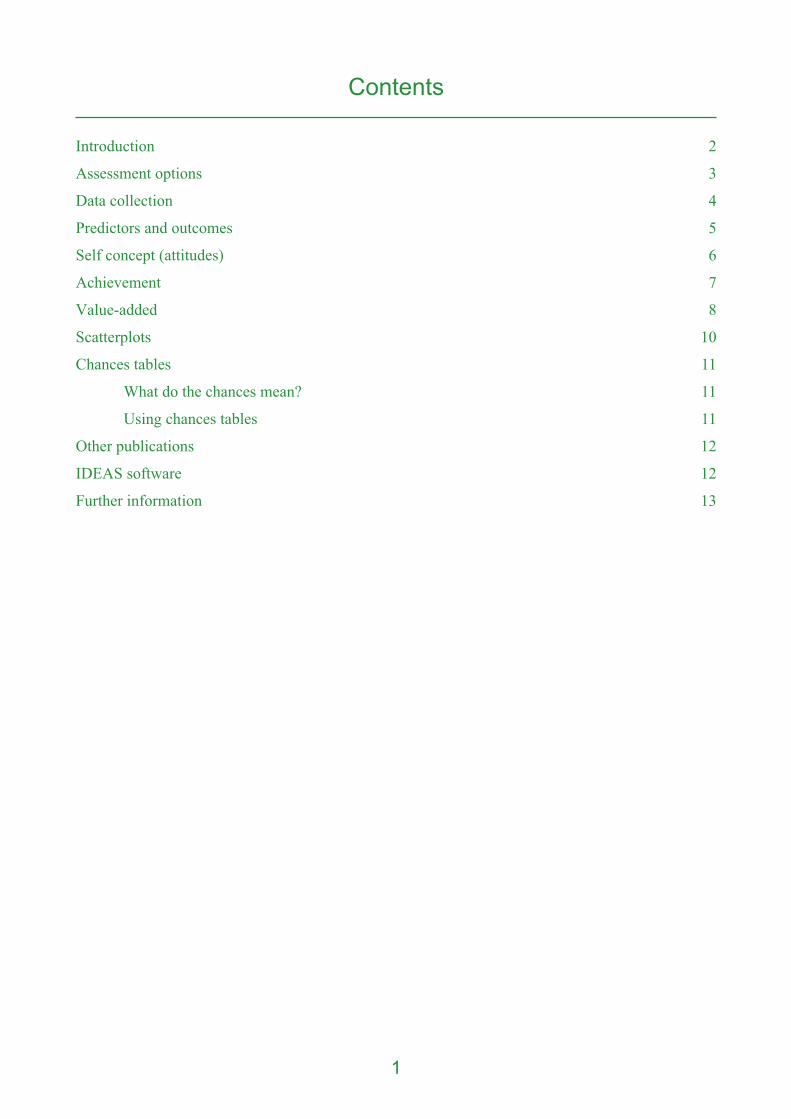
Contents
Introduction
Assessment options
Data collection
Predictors and outcomes
Self concept (attitudes)
Achievement
Value-added
Scatterplots
Chances tables
What do the chances mean
Using chances tables
Other publications
IDEAS software
Further information
2
3
4
5
6
7
8
10
11
11
11
12
12
13
1
Introduction
The intention of the PIPS Project is to provide high quality confidential information for use by professionals within schools to promote improvement Information is fed back regarding the self-concept (attitude) and achievement of individual pupils Two types of achievement measure are provided These are the levels of attainment reached and the relative progress (value-added) made in each curriculum area
The purpose of this report is to describe the feedback that you will receive if you have taken part in any of the PIPS assessments available from the end of Year 1 through to the end of Year 6 The report has been kept as brief as possible whilst containing all of the information necessary for you to make sense of your feedback For those requiring a fuller treatment there are additional publications available from the CEM Centre Details of how to obtain these are given at the end of this report
2
Assessment Options
Every year from Year 1 to Year 6 we offer a set of assessments that provide a comprehensive view of the pupils attitudes and achievements This includes assessment of reading and maths and in Year 6 science
At the end of Key Stage 1 and Key Stage 2 (Y2 and Y6) we can incorporate the national assessments instead of the PIPS assessments of reading maths and science
In the years when there is no end of Key Stage assessment the measures of mathematics and reading are necessary to form a complete system In Years 2 and 6 it is possible to omit the PIPS assessment of mathematics reading and science (in Year 6 only) and to rely on the statutory tests This is the Basic option
The Extended option for Years 2 and 6 involve PIPS tests of reading mathematics and science (at Year 6 only) but not the Key Stage assessments
The Full option includes the statutory test data and the PIPS tests of reading mathematics and science (at Year 6 only)
The options are summarised below
Attitudes picture vocabulary and non-verbal
ability
PIPS maths reading amp science1
Key Stage assessments
Scatterplots amp value-added
Chances tables
Basic option
Extended option
Full option
1 Only in Year 6
3
Data Collection
The PIPS Project collects pupil level data for a range of variables These data are used to determine each pupils achievement and self-concept The data collected are listed below
bull Predictors
bull picture vocabulary
bull non-verbal ability
bull (cultural capital data are collected but not recorded in the eedback)
bull Cognitive Outcomes
bull PIPS attainment measures
bull Key Stage statutory assessment results
bull Affective Outcomes
bull Attitude to school
bull Attitude to mathematics
bull Attitude to reading
bull Attitude to science
4
Predictors amp Outcomes
Predictors and cognitive outcomes are the measures that are used to calculate value-added Outcomes are the scores achieved in a curriculum dependent measure of attainment for example a maths or reading assessment Predictors are other measures that can be used to forecast the result of such an assessment
The PIPS assessment materials provide outcome measures for mathematics reading and in Year 6 science The Key Stage 1 outcomes analysed by PIPS are mathematics reading and spelling At Key Stage 2 the outcomes are mathematics English and science
Predictor and outcome measures derived from PIPS assessment materials are converted to standardised scores These are reported on the Pupil Scores table (or Pupil Attitudes table for those doing the basic option) and are used for generating the scatterplots Standardised scores are used in preference to raw scores because they allow straightforward comparisons between different parts of the assessment and also enable you to see how well your pupils are performing in relation to those in other schools
Using standardised scores the average is 50 and the standard deviation is 101 This means that 84 of the sample will always have a score of 40 or more 16 will have a score of 60 or above Pupils with scores below 30 and above 70 are exceptional This is summarised in the following table
range of standardised scores proportion of pupils
less than 30
30 to 40
40 to 50
50 to 60
60 to 70
more than 70
25
135
340
340
135
25
Scores from the Key Stage assessments are not standardised Key Stage levels are reported back in the tables and raw test scores are used to generate the scatterplots and value-added
The predictors used by PIPS are the context and prior achievement scores The context score is a measure of developed ability and is used to determine concurrent value-added It is calculated from the picture vocabulary and non-verbal ability measures The attainment and context scores from the previous PIPS assessment are combined into one prior score This prior score can then be used to calculate the relative progress made by a pupil over that period of time This is called the prior value-added Obviously if a child has not been assessed previously using PIPS they will not have a prior score and we are therefore unable to calculate prior value-added
1 Technically they are known as T scores
5
Self-concept (Attitudes)
Self-concept or attitude measures are generated for different curriculum areas and for school generally They are reported on the Pupil Grades table (or Pupil Attitudes table for those doing the basic option)
The attitude scores are criterion referenced We simply report back the childs average response for each category Attitudes are reported within a row of 3 or 5 dots depending on the scale used to collect the data The childs average response is highlighted within the row of dots (see table) Presenting the data in this way makes it easier to read and interpret
years 1 to 4 years 5 amp 6 average attitude
positive
neutral
negative
6
Achievement
As was noted in the introduction PIPS reports achievement in terms of both academic attainment and relative progress (value-added) Academic attainment is reported in the form of standardised scores or Key Stage levels as discussed in a previous section In addition the PIPS standardised scores are reported back in the form of grades Levels of attainment are given letter grades (A to E) The table outlines the distribution of these grades
attainment achievement grade proportion of pupils
A 10
B 15
C 50
D 15
E 10
Achievement grades are reported in the Pupil Grades table andor the Key Stage Levels table depending on if you are doing the basic extended or full option
7
Value-added
As outlined in a previous section there are two possible types of value-added The first is based on the contextual assessment (non-verbal ability and picture vocabulary) giving a concurrent value-added The second value-added score is based upon prior achievement giving value-added over time This can only be calculated for those children that have previously been assessed using PIPS
The value-added grade which is represented using the scale -- - 0 + ++ shows how well a pupil has performed in relation to their context score or prior achievement score Where a child scores 0 they are performing in line with expectations In other words their attainment score is in line with the score predicted from their context score or prior achievement score Therefore a value-added grade of 0 can be regarded as average Those children with positive value-added (+ or ++) have done better than predicted those with negative value-added (- or --) have not done as well as expected
The proportion of children falling into each category is shown below
value-added proportion of pupils
++ 10
+ 15
0 50
- 15
-- 10
Schools that have been in the PIPS project long enough to receive prior value-added grades may find it interesting to compare these with their concurrent value-added grades
Prior and concurrent value-added differ in what they use to predict a childs present level of attainment Concurrent value-added uses the childs Context score that is a measure of developed ability to predict their current level of attainment In effect it gives us a snapshot of where the child is at this moment in time By contrast prior value-added uses the attainment in previous assessments as the predictor This gives us a measure of the childs progress up to this moment in time To put it another way concurrent value-added tells us if a child is doing as well better or worse than expected given their developed ability but tells us very little about how they got to that point Prior value-added tells us something about the childs progress since the last PIPS assessment but little about whether we can expect them to do better still
continued
8
Value-added continued
It is possible to put children into one of nine categories according to their two value-added grades This is summarised in the value-added grid below The colours on the grid indicate how the children were probably performing the last time they were assessed using PIPS Children that fall in the white boxes were probably ahead of similar children the last time they were assessed Those in the light green boxes were probably behind similar children The darker green boxes contain children that were on track the last time they were assessed
It is tempting to speculate on the kinds of children that might be found in different parts of the grid Those toward the top left-hand corner may include children that appear to be doing well but are in fact coasting It may also contain children that have not been sufficiently challenged by the curriculum presented to them The bottom right-hand corner may contain children who are catching up even though they could still do better This could include children that have had some difficulties (settling into school SEN etc) that are now being addressed The top right-hand corner contains children that are really thriving The bottom left hand corner contains children that are failing to thrive This could indicate a special educational need It could also indicate children with some other difficulty such as family problems illness or disillusionment
9
Scatterplots
All of the scatterplots produced by PIPS plot a predictor score on the horizontal axis against anoutcome score on the vertical axis In the following example the context score is plotted against themaths score
75
70
65
60
55
50
45
40
35
30
25
Yames
Rachel
Ashle Chr
istophe
r
Michae
l
ethan
Yunior
Anthon
Hannah
imeer
le
Yames
Daneel
l
Samant
ha
Roeert
LLSimo
nLL25 30 35 40 45 50 55 60 65 70 75
Atta
inmen
t Sco
re
Context Score
The middle blue line is the regression line also known as the line of best fit Pupils falling on or closeto this line are performing as expected Pupils falling above this line are performing better thanexpected (ie they have a positive value-added) while pupils below the line are under-performing
The two outer blue lines hold 95 of all pupils Pupils above this line are performing well aboveexpectations while pupils falling below the bottom line fall well below expectations Teachers maywell understand the reason behind such unusual scores In fact the position of many of the pupils maywell fit in with the teachers perception Some might however be unexpected and some furtherinvestigation would then be appropriate
Some children with exceptionally high or exceptionally low scores fall outside the boundaries of thescatterplot To indicate this chevrons are placed around their names In the example above Simonwho actually scored 23 in his maths assessment appears at the bottom of the chart as laquolaquoSimonlaquolaquo
Each scatterplot contains two boxplots These are useful for looking at the distribution of scores inthe class The boxplot at the top of the scatterplot refers to the predictor (eg context) score whilethe one on the right hand side refers to the outcome (eg maths) score The middle 50 of pupils liewithin the box The lines extending from the box represent most of the other pupils Pupils lying outside these bands are called outliers The line in the middle of the box represents the middle pupil in the class The middle pupil in the whole project would score 50
PIPS 02-03 Year Five Start
Scatterplot
Subject Maths School 1234567 Class Example
10
Chances Taeles
PIPS 02 - 03 Year Five Start
KS Chances School 1234567
Chances tables show the chance of gaining each Key Stage level in the next statutory assessment Thechances are calculated separately for each child using their PIPS scores as a predictor The overallaverage chances for all of the children of the same year group in the school are also calculated Thechances are calculated using a statistical model that was developed from PIPS and Key Stage assessmentdata collected in previous years
What do the Chances Mean The easiest way to explain what the chances mean is to use an example The Key Stage Two chancesfor an imaginary Year 5 class are given in the following table
Kevstage Two Chances ()
class name
Maths level Enlish level Science level lt2 3 4 5 gt_6 lt2 3 4 5 gt_6 lt2 3 4 5 gt_6
Year Group Average 3 32 43 23 0 3 31 46 20 0 2 27 4_ 23 0 Example Simon 18 71 10 - - 18 71 10 - - 14 72 14 - -Example Roeert 10 71 19 1 - 10 71 19 1 - 7 68 25 1 -Example Samantha 4 61 33 3 - 4 60 34 2 - 3 53 41 3 -Example imeerle 3 53 40 5 - 2 52 42 4 - 1 44 50 5 -Example ell 3 55 38 4 - 3 55 40 3 - 2 47 47 4 -Example Dane 3 53 40 5 - 2 52 42 4 - 1 44 50 5 -Example Yunior - 25 56 19 - - 24 60 16 - - 18 62 20 -Example Yames 1 31 54 14 - 1 30 58 12 - - 23 62 15 -Example ethan - 17 56 27 - - 17 60 23 - - 12 60 28 -Example Hannah - 22 56 21 - - 21 61 18 - - 16 62 22 -Example Christopher - 13 54 33 - - 13 59 29 - - 9 57 34 -Example Ashle - 10 51 39 - - 9 56 35 - - 6 53 41 -Example Anthon - 15 55 30 - - 14 60 26 - - 10 59 31 -Example Rachel - 8 49 42 - - 8 54 38 - - 5 50 44 1 Example Michael - 5 42 52 1 - 5 47 48 - - 3 42 54 1 Example Yames - 2 30 67 1 - 2 34 64 - - 1 29 68 3
Consider Simons chances These figures show that in previous years 18 of children with similarPIPS scores to Simon went on to get a Level 2 or less in their statutory maths assessment at the endof Key Stage Two Seventy one percent of children like Simon went on to gain a Level 3 and 10went on to get a Level 4 Almost no children with scores like Simons in Year 5 went on to achievea Level 5 or higher
Using Chances Taeles Chances tables should be used with caution They were generated using data from previous years andthis may not agree exactly with what will happen in the future For example we can say that 71 ofchildren like Simon got a Level 3 in maths but that does not necessarily mean that the same numberwill get a Level 3 next time
When setting targets it may be useful to look at the Year Group Average which appears at the topof the table It gives an estimate for the likely distribution of levels for the cohort at the end of KeyStage 2 It is more accurate than the results for one pupil because the level of uncertainty associatedwith the percentage chances decreases if you consider a group of children In fact the larger the groupthe greater the confidence you can have in the overall average figures In the example above we cansay that the chances of getting a Level 4 or better in maths for the group as a whole is 66 (43 +23) In turn this means that about 66 of children might be expected to get a level 4 or above Thisdoes not of course say which 66 of the children it will be
Used in conjunction with teachers judgements and a historical perspective of the schools results afair picture of what might be a reasonable target can be developed
NB Chances tables are not applicable in Scotland at the moment Different chances tables are sent to Scotland (see letter attached to feedback)
11
Other Puelications
The PIPS Project has produced a range of documents that enable you to explore many of the topics discussed here in more detail Many of these are available from the CEM Centre for a small charge Some example publications are given below however the list is constantly being updated and revised An up to date publications list is available from the CEM Centre and is also on our web site
Baseline Assessment and Monitoring in Primary Schools Achievements Attitudes and Value-added Indicators by Peter Tymms London David Fulton 1999
Analysing your schools data and setting targets for primary schools by Peter Tymms Curriculum Evaluation and Management Centre
Using Concurrent and Prior Value-added Curriculum Evaluation and Management Centre April 1999
Target-setting at Key Stage 2 An investigation carried out with the support of the NAHT by Peter Tymms amp Jane Stout Curriculum Evaluation and Management Centre May 1999
IDEAS Software
IDEAS (Interactive Data Exploration amp Analysis Software) is a software package available to the users of the PIPS Project It allows schools to analyse their PIPS data in finer detail so as to gain the most from it
The software provides facilities to
bull Create individual pupil reports
bull Generate bar charts and frequency tables that give an alternative representation of the data
bull Track progress of a cohort over time using longitudinal charts
bull Compare prior and concurrent value-added using value-added grids
bull Produce chances graphs and chances tables that can provide a useful guide for target setting
bull Analyse data separately for boys and girls for each class or for any other criteria that may be of interest to you
The IDEAS software can be downloaded from the PIPS+ website Please see the web site for details or telephone Brian Henderson on 0191 334 4223 The software requires a Windows based PC running Microsoft Excel
wwwpipsprojectorg
12
Further Information
If you require further information about the PIPS Project you can contact us at
The CEM Centre Mountjoy Research Centre 4 University of Durham Stockton Road Durham DH1 3UZ
Telephone (0191) 334 4221
Fax (0191) 334 4180
Email pipscemduracuk
Professor Peter Tymms is the Director of the PIPS Project Professor Carol Taylor Fitz-Gibbon is the Director of the CEM Centre
PIPS Wee Site
The PIPS web site contains general PIPS information which is continually updated and includes
bull Latest PIPS developments
bull Overview of all the assessments including examples of feedback costs and timetables
bull Details of forthcoming conferences and roadshows
bull PIPS publications including newsletters journal articles and reports
bull How to book In-Service training
bull Details of new PIPS assessments
The web site address is wwwpipsprojectorg
PIPS+PIPS+
PIPS+ is a web site with specific school and consortium information This enables teachers to
bull Print additional copies of feedback bull Download the IDEAS software and school specific data files bull Download MTF files for entering PIPS data into the SIMS Assessment Manager bull Check registrations and tracking information bull Receive a list of PIPS pupil identifier numbers bull Print copies of PIPS documentation bull Return Keystage and FSP results using online forms
As the site contains confidential school data a user name and password are required to gain access to the site This is provided to schools with their paper feedback If you have lost your username and password please go to wwwpipsprojectorgpassword and complete the online form
PIPS+ can be accessed at no additional charge by going to the PIPS web site (see address above) then clicking on the PIPS+ button
13
PIPS ProjectCEM Centre
University of DurhamMountjoy Research Centre 4
Stockton Road DURHAM DH1 3UZ
CEM Centre 2003 ISBN 0903 380 900c

PIPS ProjectCEM Centre
University of DurhamMountjoy Research Centre 4
Stockton Road DURHAM DH1 3UZ
CEM Centre 2003 ISBN 0903 380 900c