Embed Size (px)
Citation preview
Prepared by Aon Talent, Rewards & Performance
Performance Management Perception vs. Perspective
15th National Employment Law Conference 2019 Intercontinental Hotel Kuala LumpurApril 3, 2019
Aon | Talent, Rewards & PerformanceProprietary & Confidential | 1 April 2019
2
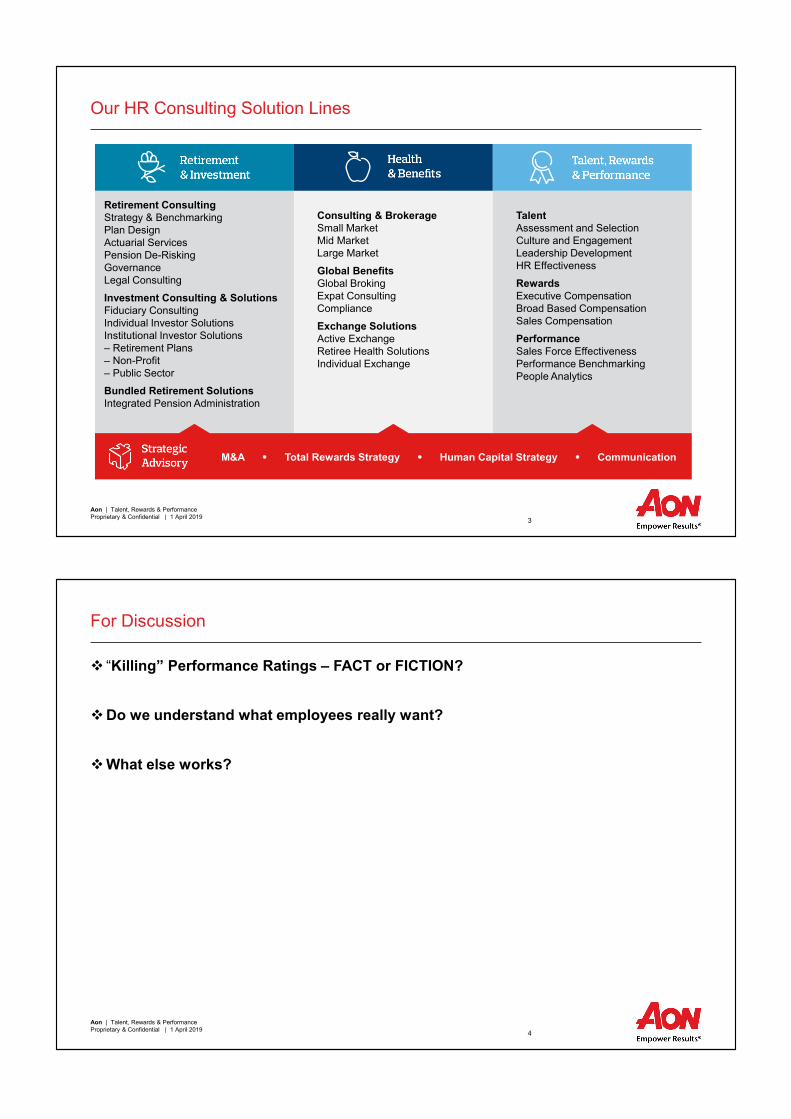
About Aon Human Capital Consulting
A Clear Strategy Aligned with Each Solution
Aon | Talent, Rewards & PerformanceProprietary & Confidential | 1 April 2019
3
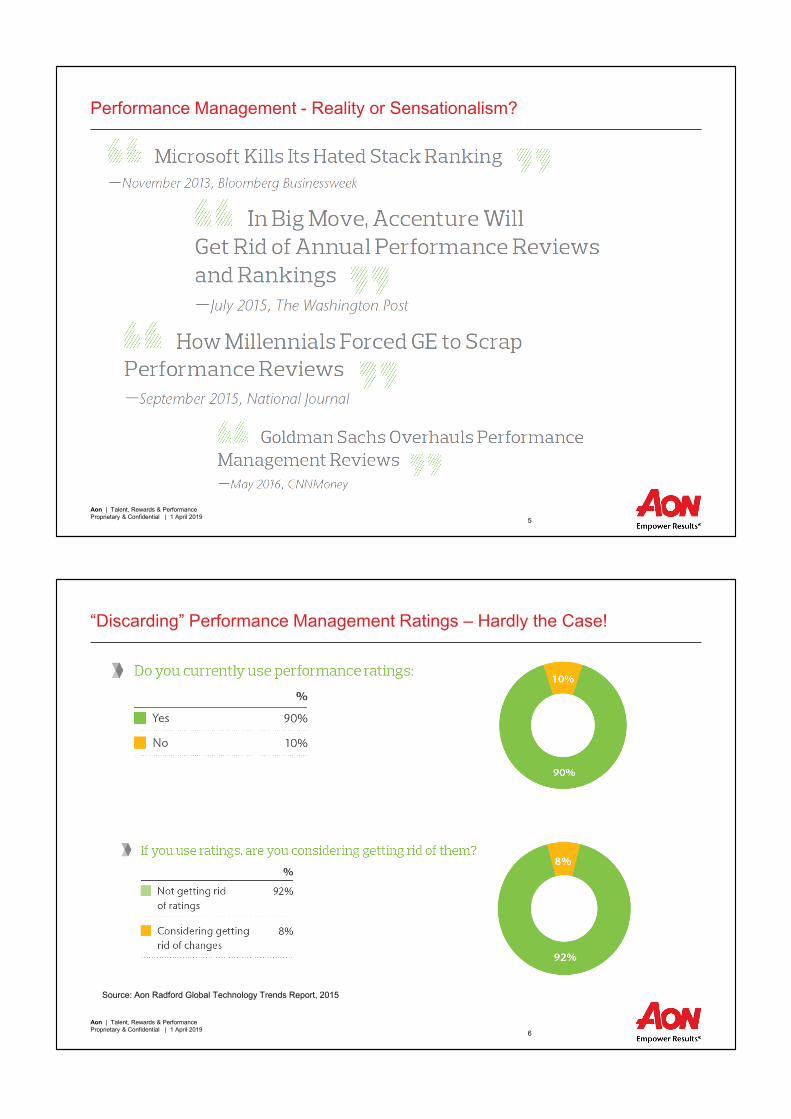
Our HR Consulting Solution Lines
Retirement Consulting
Strategy & BenchmarkingPlan DesignActuarial ServicesPension De-RiskingGovernanceLegal Consulting
Investment Consulting & Solutions
Fiduciary ConsultingIndividual Investor SolutionsInstitutional Investor Solutions– Retirement Plans– Non-Profit– Public Sector
Bundled Retirement Solutions
Integrated Pension Administration
Consulting & Brokerage
Small MarketMid MarketLarge Market
Global Benefits
Global BrokingExpat ConsultingCompliance
Exchange Solutions
Active ExchangeRetiree Health SolutionsIndividual Exchange
Talent
Assessment and SelectionCulture and EngagementLeadership DevelopmentHR Effectiveness
Rewards
Executive CompensationBroad Based CompensationSales Compensation
Performance
Sales Force EffectivenessPerformance BenchmarkingPeople Analytics
M&A Total Rewards Strategy Human Capital Strategy Communication
Aon | Talent, Rewards & PerformanceProprietary & Confidential | 1 April 2019
4
For Discussion
❖ “Killing” Performance Ratings – FACT or FICTION?
❖Do we understand what employees really want?
❖What else works?
Aon | Talent, Rewards & PerformanceProprietary & Confidential | 1 April 2019
5
Performance Management - Reality or Sensationalism?
Aon | Talent, Rewards & PerformanceProprietary & Confidential | 1 April 2019
6
“Discarding” Performance Management Ratings – Hardly the Case!
Source: Aon Radford Global Technology Trends Report, 2015
Aon | Talent, Rewards & PerformanceProprietary & Confidential | 1 April 2019
7
Employees View on Performance Management
“…High performers and millennials in particular want to know how they
are doing in relation to their roles,
manager’s expectations and against peers” - Reimagining Performance
Management
Aon Advisory Brief, May 2016
Source: Aon Workforce Mindset™ Study, 2015
Aon | Talent, Rewards & PerformanceProprietary & Confidential | 1 April 2019
8
What Then Are the Real Issues?
Continued challenges Emerging challenges
▪ The changing nature of work and
organisations
▪ Employees don’t believe there’s a connection between their performance
and pay
▪ The process is perceived as
demotivating by employees
▪ Managers believe the process is an
onerous task which wastes time
▪ Managers shy away from having
uncomfortable conversations.
▪ The changing nature of work and
organisations
▪ Forced distribution is seen as creating
competition when collaboration is
necessary
▪ Employees feel individual development
has taken a back seat and they are not
being coached
▪ Annual reviews draw attention away from
ongoing conversations
▪ Rating biases are playing havoc with
ratings and assessments.
The constant throughout: HR is on the receiving end of all of the complaints!

Aon | Talent, Rewards & PerformanceProprietary & Confidential | 1 April 2019
9
Understanding Manager Impact on Employee Engagement
ResponsesActively
disengagedPassive
Moderately
engaged
Highly
engaged
Total
engagement
Very ineffective 21 71% 19% 10% 0% 10%
Mostly ineffective 28 46% 21% 29% 4% 33%
Slightly ineffective 40 28% 45% 15% 13% 28%
Slightly effective 111 16% 41% 35% 8% 43%
Mostly effective 206 3% 17% 59% 20% 79%
Very effective 87 7% 15% 44% 34% 78%
Ho
w e
ffe
cti
ve
is
yo
ur
ma
na
ge
r in
pro
vid
ing
pe
rfo
rma
nc
e f
ee
db
ac
k a
nd
co
ac
hin
g?
Distribution of engagement
%s indicate the engagement distribution within each category of manager rating.Dark green = biggest concentration of people within each manager rating category.White = lowest concentration of people within each manager rating category.
Source: Aon’s Performance Management/Career Development Survey; 2013 Global Performance Management Survey Report/2014 Global Top Companies for Leaders Research
Aon | Talent, Rewards & PerformanceProprietary & Confidential | 1 April 2019
10
So What is Changing or Will Likely Change?
Revisit Normal Curve
Crowd source
performance data
Differentiate Pay –Fair but Unequal
Enable Managers and
Hold them accountable
1 2
4 6
3Refine the KPIs and
Measurability
?
5
Enhance Agility of
the Process
Aon | Talent, Rewards & PerformanceProprietary & Confidential | 1 April 2019
11
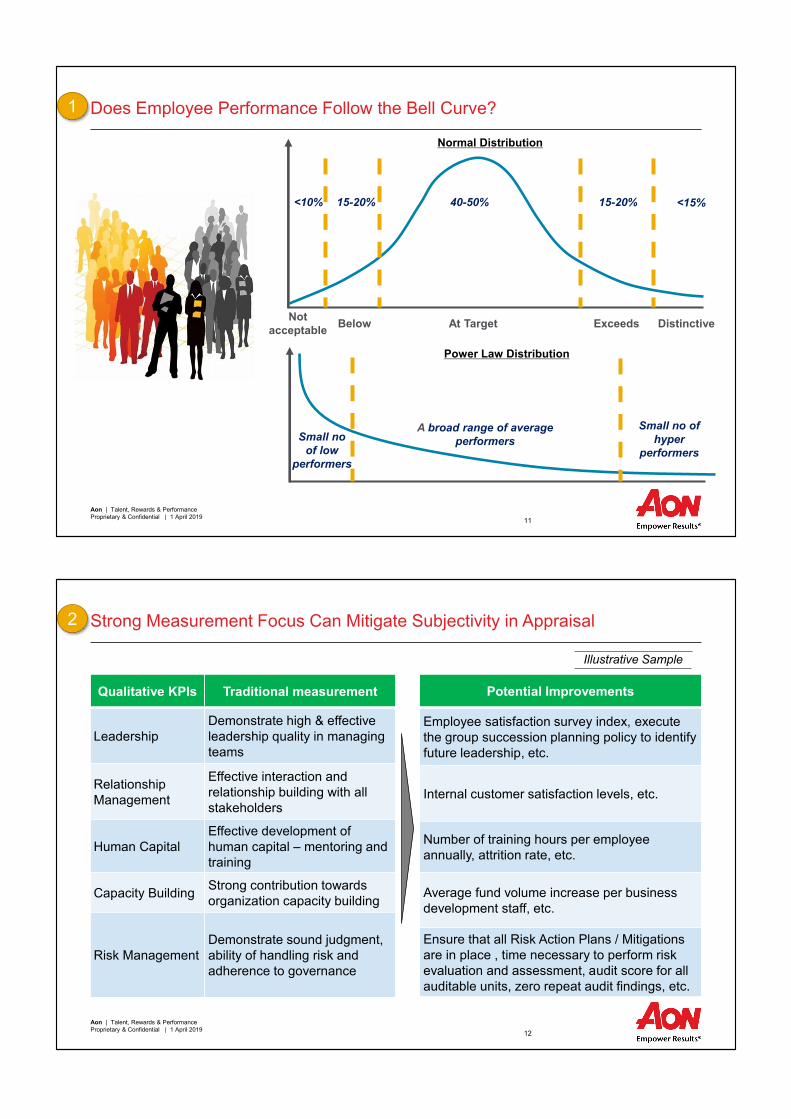
Does Employee Performance Follow the Bell Curve?
DistinctiveExceeds At TargetBelow Not
acceptable
<10% 15-20% 40-50% 15-20% <15%
Normal Distribution
Power Law Distribution
Small no
of low
performers
A broad range of average
performers
Small no of
hyper
performers
1
Aon | Talent, Rewards & PerformanceProprietary & Confidential | 1 April 2019
12
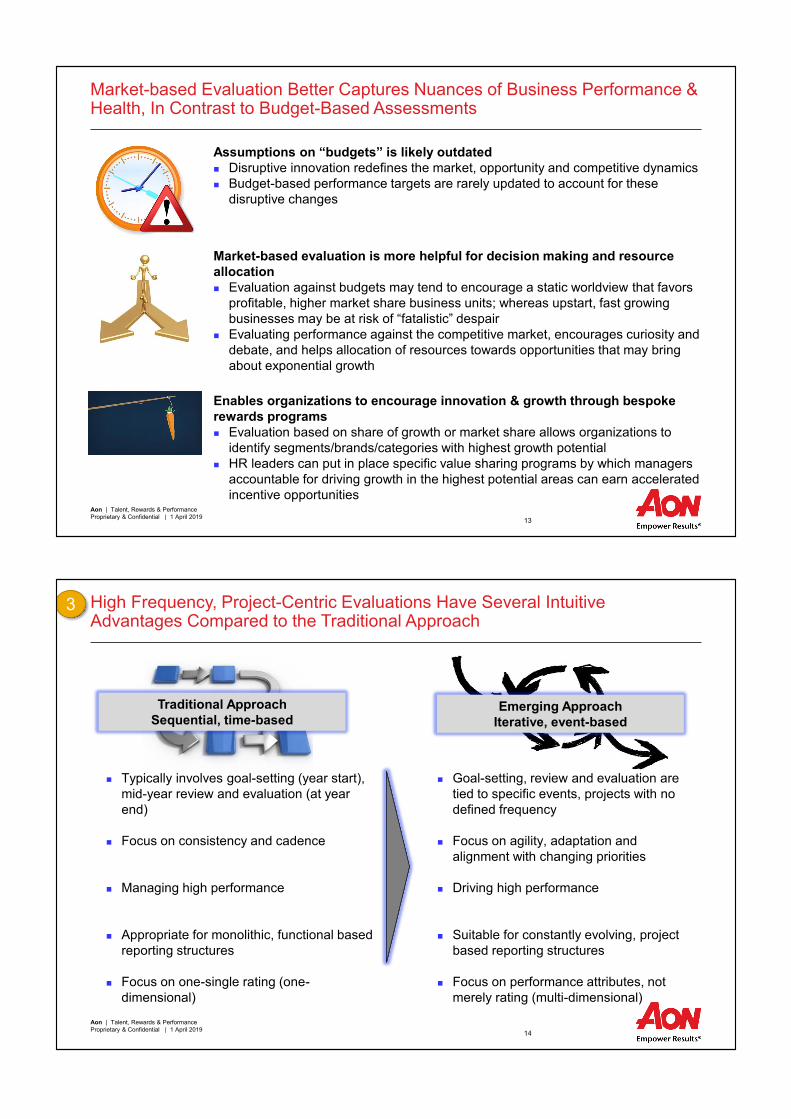
Strong Measurement Focus Can Mitigate Subjectivity in Appraisal
Qualitative KPIs Traditional measurement
LeadershipDemonstrate high & effective leadership quality in managing teams
RelationshipManagement
Effective interaction and relationship building with all stakeholders
Human CapitalEffective development of human capital – mentoring and training
Capacity BuildingStrong contribution towards organization capacity building
Risk ManagementDemonstrate sound judgment, ability of handling risk and adherence to governance
Potential Improvements
Employee satisfaction survey index, execute the group succession planning policy to identify future leadership, etc.
Internal customer satisfaction levels, etc.
Number of training hours per employee annually, attrition rate, etc.
Average fund volume increase per business development staff, etc.
Ensure that all Risk Action Plans / Mitigations are in place , time necessary to perform risk evaluation and assessment, audit score for all auditable units, zero repeat audit findings, etc.
Illustrative Sample
2
Aon | Talent, Rewards & PerformanceProprietary & Confidential | 1 April 2019
13
Market-based Evaluation Better Captures Nuances of Business Performance & Health, In Contrast to Budget-Based Assessments
Assumptions on “budgets” is likely outdated Disruptive innovation redefines the market, opportunity and competitive dynamics Budget-based performance targets are rarely updated to account for these
disruptive changes
Market-based evaluation is more helpful for decision making and resource
allocation
Evaluation against budgets may tend to encourage a static worldview that favors profitable, higher market share business units; whereas upstart, fast growing businesses may be at risk of “fatalistic” despair
Evaluating performance against the competitive market, encourages curiosity and debate, and helps allocation of resources towards opportunities that may bring about exponential growth
Enables organizations to encourage innovation & growth through bespoke
rewards programs
Evaluation based on share of growth or market share allows organizations to identify segments/brands/categories with highest growth potential
HR leaders can put in place specific value sharing programs by which managers accountable for driving growth in the highest potential areas can earn accelerated incentive opportunities
Aon | Talent, Rewards & PerformanceProprietary & Confidential | 1 April 2019
14
High Frequency, Project-Centric Evaluations Have Several Intuitive Advantages Compared to the Traditional Approach
Traditional Approach
Sequential, time-basedEmerging Approach
Iterative, event-based
Typically involves goal-setting (year start), mid-year review and evaluation (at year end)
Focus on consistency and cadence
Managing high performance
Appropriate for monolithic, functional based reporting structures
Focus on one-single rating (one-dimensional)
Goal-setting, review and evaluation are tied to specific events, projects with no defined frequency
Focus on agility, adaptation and alignment with changing priorities
Driving high performance
Suitable for constantly evolving, project based reporting structures
Focus on performance attributes, not merely rating (multi-dimensional)
3

Aon | Talent, Rewards & PerformanceProprietary & Confidential | 1 April 2019
15
Rewarding Hyper Performers
Performance Ranking Percentile
Bottom 25% Middle 50% Top 25%
0%
50%
100%
150%
200%
250%
300%
350%
400%
450%
500%
0% 10% 20% 30% 40% 50% 60% 70% 80% 90% 100%
40% 50%
Ac
tua
l In
ce
nti
ve
as
% o
f M
ed
ian
In
ce
nti
ve
10%
Bottom 25% of the
employees get 10%
of the incentive
The 10:40:50 Rule
Middle 50% of the
employees get 40%
of the incentive
Top 25% of the
employees get 50%
of the incentive
Top 5% of performers get
about 3X of the average
performer
4
Aon | Talent, Rewards & PerformanceProprietary & Confidential | 1 April 2019
16
Creating “HiPo” Pool in Bonus Distribution
Firm-wide Bonus Pool
Senior Management
Other employees
Captain’s Pot/Group
Bank
Final Approval by Remuneration Committee
20-30% of the pool taken out of the ‘formula driven pool’ and allocated at CEO’s discretion
▪ The allocation process starts with the sum of all business divisions through approved funding rates for respective businesses and support function requirements forms the firm-wide incentive funding.
▪ Incentive funding approach varies according to business specific stage of development with mature businesses adopting a top-down approach while Business Divisions in investment mode adopting a combination of top-down and bottom-up approach.
▪ A Captain’s Pot is separately allocated to reward high performers, based on recommendation from CEO and HR
CEO
Rest allocated as per formula driven allocation principles
Aon | Talent, Rewards & PerformanceProprietary & Confidential | 1 April 2019
17
Typical Incentive Models Used By Global Companies To Encourage Innovation
Model II – Patent Holder
Innovation organization
Idea generator
Revenue$$$
Files a
‘patent’
Share of
revenue
generated
Approves idea
and deploys
idea
Project
based
incentive
or profit
share
▪ Employee/Team is made a notional/co-owner of model and is paid a ‘royalty’ payment based on sales generated
▪ Generally recommended if idea generation and deployment functions /stakeholders can be de-coupled
▪ Examples include Staples, Texas Instruments, etc
Model III – Venture Partner
Innovation organization
Idea generator
Project ‘Venture’
Idea Execution,
Funding
Profit $$$
▪ Employee/Team is co-opted as a
owner into the project ‘venture’ ▪ Project profit is typically shared equally
among all stakeholders ▪ Generally recommended if idea team
can participate in development/execution
▪ Examples include P&G, Apple, Pixar
Profit
Share
Profit
Share
Model I – One-time Recognition
Innovation organization
Idea generator
Submits idea
One-time
recognition
payment
▪ One-time award for approved ideas ▪ Short-term incentive, limited ‘skin in
the game’ for the idea contributor, but simple to communicate and encourage broad-based idea flow
▪ Examples include 3M
Revenue$$$
Approves idea
and deploys
idea
Project
based
incentive
or profit
share
Aon | Talent, Rewards & PerformanceProprietary & Confidential | 1 April 2019
18
Pay for Performance – “Making a 2-3% Salary budget Interesting and effective” and a Lever for Retention
Performance Distribution Curve▪ Analysis of pay data across infrastructure shows top performers receiving salary increases ONLY 2x more than effective employee
▪ A “normalized distribution” would allow top performers and/or key critical roles to be identified and rewarded at multiples of broader population
8.6%
6.2%
4.3%
0.3% 0.3%11%
29%
56%
4%
0% 0%
3%
6%
9%
12%
0%
10%
20%
30%
40%
50%
60%
Outstanding Highly Efficetive
Effective Partially Effective
Not Effective
Performance
Rating
Percentage of
Employees
Average Same Store
Salary Increases
Top Performer 10.6% 8.6%
Highly Effective 29.5% 6.2%
Effective 55.9% 4.3%
Partially Effective 3.6% 0.3%
Not Effective 0.4% 0.3%
Grand Total 100% 5.2%
Performance RatingPercentage of
Employees
Average Same Store
Salary Increases
Top Performer/Critical 5.0% 18.0%
Outstanding/Exceptional 5.0% 9.0%
Highly Effective 25.0% 6.5%
Effective 60.0% 3.5%
Partially Effective 3.5% 0.3%
Not Effective 1.5% 0.3%
Grand Total 100% 5.2%
Proposed ModelCurrent Performance Model
Sa
lary In
cre
ase
Pe
rce
nta
ge
of E
mp
loye
es
Top Performer: Effective- 2:1 Top Performer/Critical: Effective- 5:1
Aon | Talent, Rewards & PerformanceProprietary & Confidential | 1 April 2019
19
Recognition Programs Complement Pay to Engage Employees
Source: Trends in Global Employee Engagement, 2015
Aon | Talent, Rewards & PerformanceProprietary & Confidential | 1 April 2019
20
Crowd Sourcing Performance Feedback Can Supplement Managerial Evaluation
Acceptable Outstanding
What did you think of Steve’s proposal presentation to the Client Evaluation Panel today?
“Clever use of info graphics…- Lisa
“Great storylining, Clear response to Q&A….- Eric
“Good storyline, but too much “tell” and not enough dialogue…- Mollie
“Did not leave enough time for client questions… - Chris
5
Aon | Talent, Rewards & PerformanceProprietary & Confidential | 1 April 2019
21
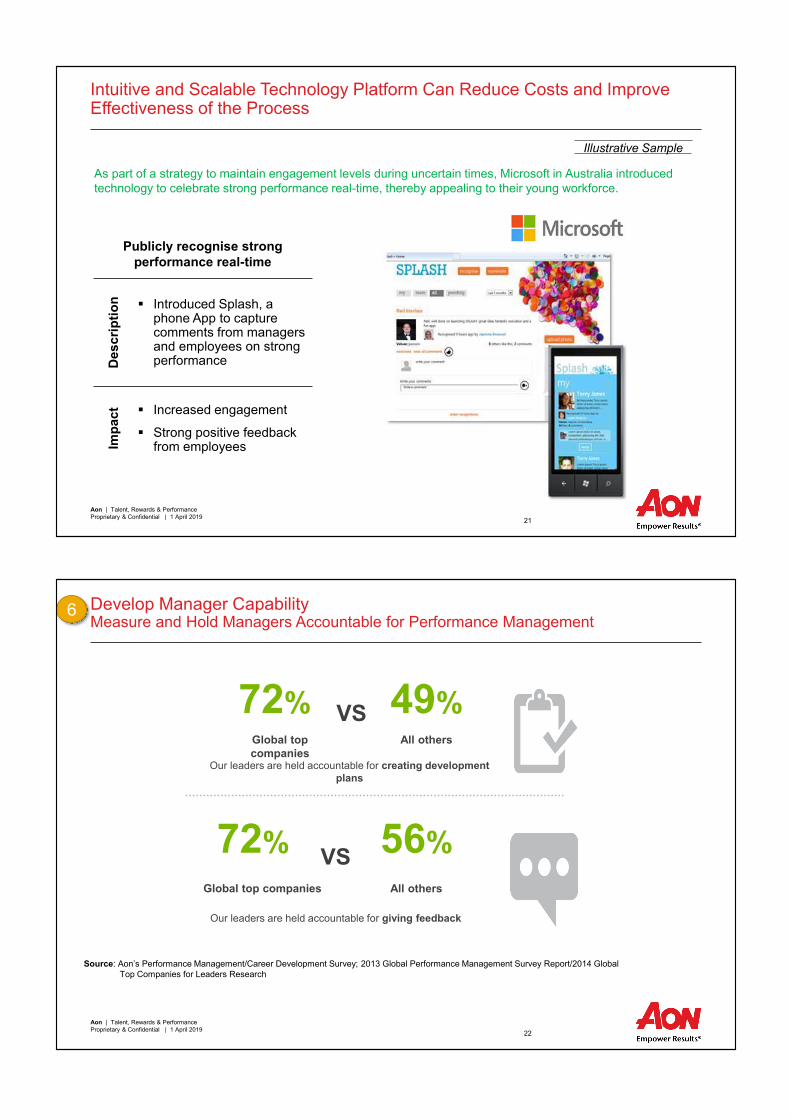
Intuitive and Scalable Technology Platform Can Reduce Costs and Improve Effectiveness of the Process
As part of a strategy to maintain engagement levels during uncertain times, Microsoft in Australia introduced technology to celebrate strong performance real-time, thereby appealing to their young workforce.
Publicly recognise strong
performance real-time
De
sc
rip
tio
n ▪ Introduced Splash, a phone App to capture comments from managers and employees on strong performance
Imp
ac
t ▪ Increased engagement
▪ Strong positive feedback from employees
Illustrative Sample
Aon | Talent, Rewards & PerformanceProprietary & Confidential | 1 April 2019
22
Develop Manager CapabilityMeasure and Hold Managers Accountable for Performance Management
72%Global top
companies
VS 49%All others
Our leaders are held accountable for creating development
plans
72%
Global top companies
VS56%
All others
Our leaders are held accountable for giving feedback
Source: Aon’s Performance Management/Career Development Survey; 2013 Global Performance Management Survey Report/2014 Global Top Companies for Leaders Research
6

Aon | Talent, Rewards & PerformanceProprietary & Confidential | 1 April 2019
23
How Managers Can be Better Equipped for Performance Conversations
Providing crowd-sourced
anecdotes to support the
performance conversation
Performance Management Coaching
Build the
conversation
Seek and receive
feedback
Give feedback Discuss poor performance/ bad behaviors
Articulate Development
plan
Being directive about very
frequent check-ins
Bi-weekly As many
as needed
Informal
check-ins
End of Project
Reviews
Quarterly
Performance
Assessment
Annual
Performance
Conversations
Aon | Talent, Rewards & PerformanceProprietary & Confidential | 1 April 2019
24
Finishing Touches
➢ Do not fall into the trap of false choices
➢ Prioritize the need for continuous feedback.. and hold the managers accountable
❖ Train managers, do not give cheat sheets
❖ Support with technology
❖ Lay out a cadence of interactions and track them diligently
➢ Differentiate and make the tough choices
Unacceptable
Performance
Acceptable
Performance