Embed Size (px)
Citation preview

Performance Management:What It Is and Why You Need It
May 2012
Roberta Broeker, CPAChief Financial Officer
Missouri Department of Transportation

Today’s Discussion
What is performance management?
What is the purpose of performance management?
Why have performance management?

What Kind Do You Have?
Every organization has a performance management system – some less formal
Options for performance management:
o Guesseso Anecdoteso Intuitiono Hunches
o Rumorso Traditiono Habitso Rules of Thumb

Definition of Performance Management
Performance management is an ongoing, systematic approach to improving results through: Evidence-based decision-making Continuous organizational learning A focus on accountability for performance

Purpose of a Performance Management System
Tool used to focus on and improve performance Management tool to make the best decisions
based on fact Planning tool to ensure the best use of resources
and to meet objectives Accountability tool to drive performance
throughout the organization

Gives MoDOT high level direction
Sets boundaries for MoDOT to work within
Clearly identifies what the customer expects from MoDOT
Holds MoDOT accountable to achieve those results by specific indicators
Mission
Values
Tangible Results(Strategies)
TRACKER(Results)
Linking Strategic Directionto Performance
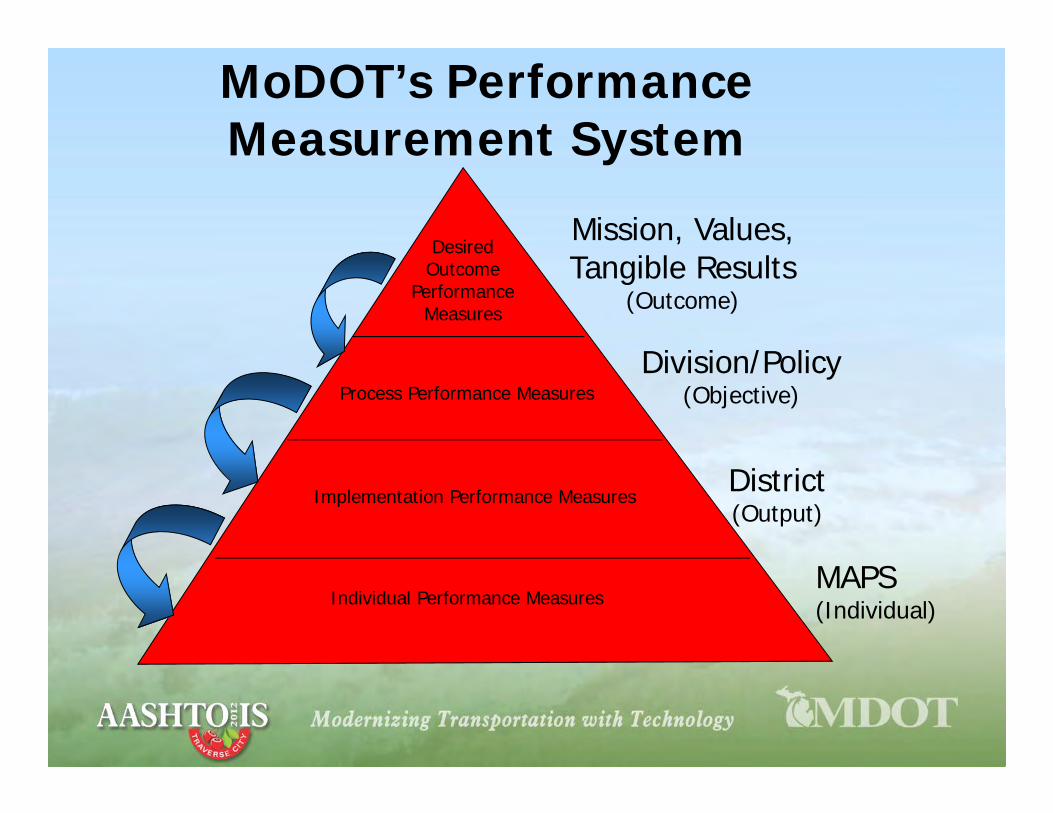
MoDOT’s Performance Measurement System
Mission, Values,Tangible Results
(Outcome)
Division/Policy(Objective)
District(Output)
MAPS(Individual)
Desired Outcome
Performance Measures
Process Performance Measures
Implementation Performance Measures
Individual Performance Measures

Why Performance Measures for Information Technology?
Demonstrates accountability What gets measured gets done Helps make decisions Helps focus on what needs to improve Evaluates our results (input & output)
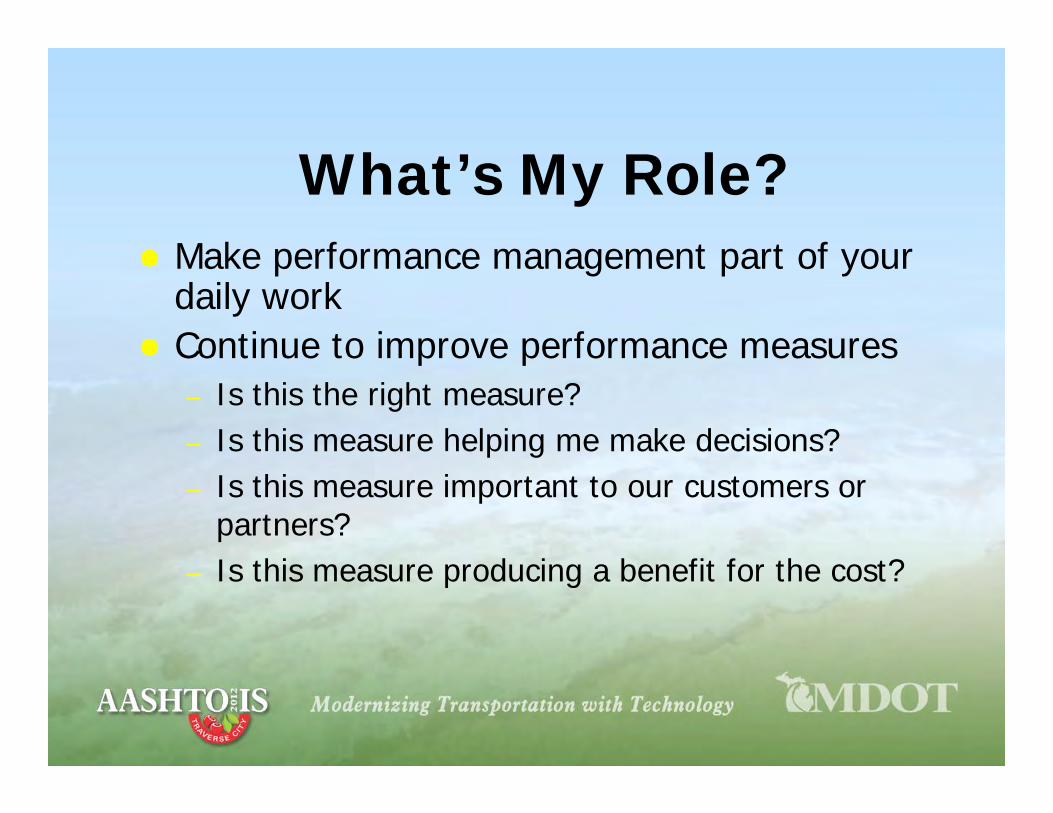
What’s My Role? Make performance management part of your
daily work Continue to improve performance measures
– Is this the right measure?– Is this measure helping me make decisions?– Is this measure important to our customers or
partners?– Is this measure producing a benefit for the cost?

Questions? Thank You!
For more information, contact:
Roberta BroekerMissouri Department of Transportation
(573) [email protected]

Portfolio and Project Management Performance Measures
May 2012

12
What we’ll cover
• Why Project Management Metrics?• The Purpose of Performance Metrics• Sample Metrics

13
Why Portfolio/Project Metrics?
Project success rates for organizations without effective project management practices:• 31% of projects are cancelled before
completion• Only 12% are completed on schedule and
within budget• Average cost overrun is 189%• Average time overrun is 222%

14
Critical Success Factor -Metrics
• Quantitative information on the health of your project
• Understand the impact of scope changes• Predict budget and schedule• Understand resource impacts• Ensure a quality product is delivered• Peace of Mind

15
Key Questions that Need Answered
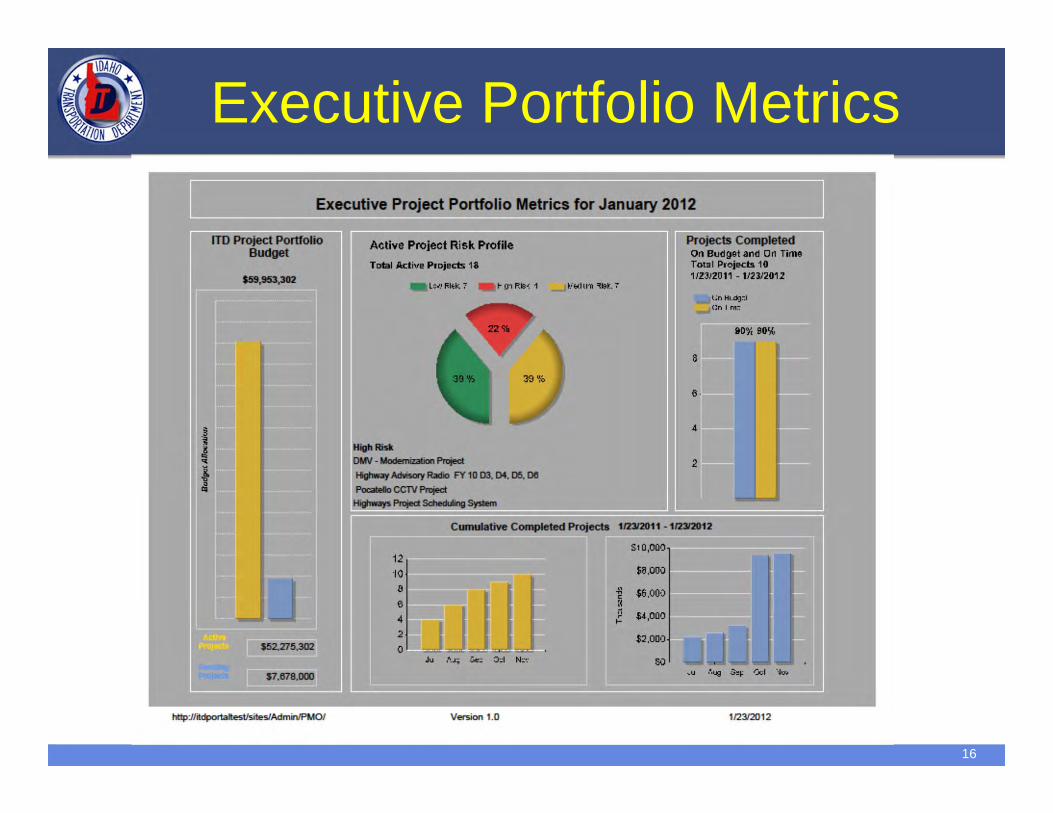
• How many projects are in your portfolio? • What is our financial investment?• Are the projects being completed on time and
on budget?• How many projects did we complete?• Is my portfolio being managed effectively?
16
Executive Portfolio Metrics
17
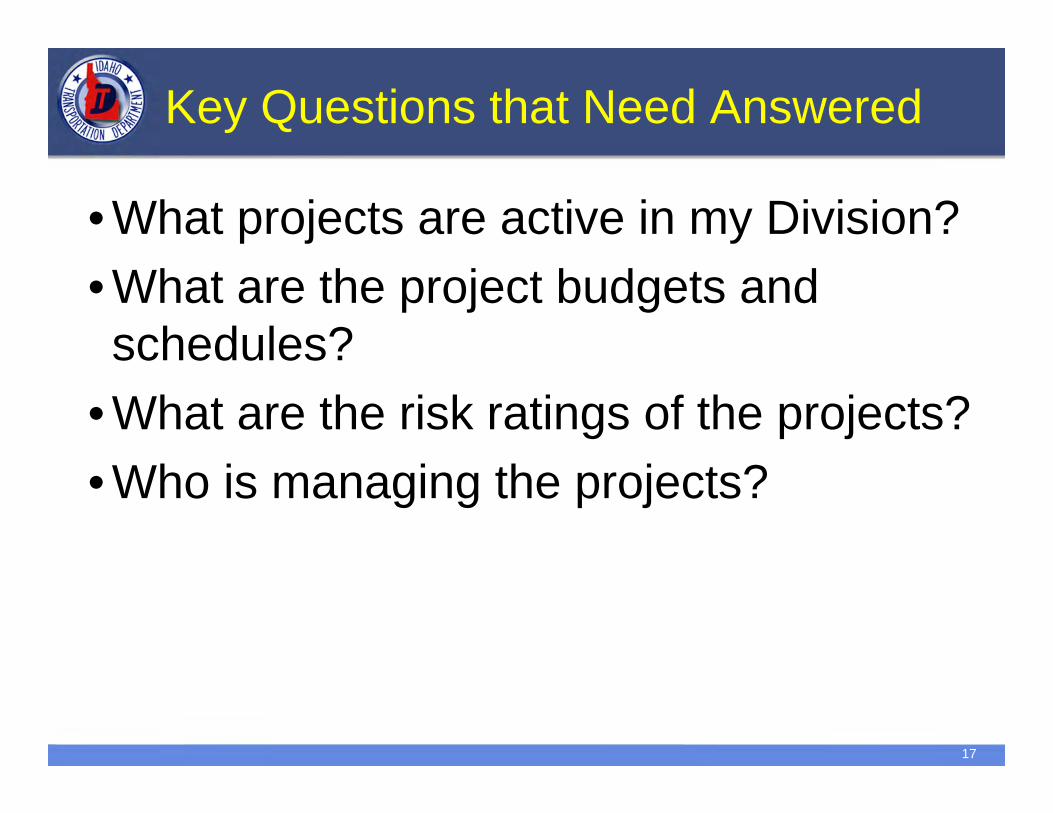
Key Questions that Need Answered
• What projects are active in my Division?• What are the project budgets and schedules?
• What are the risk ratings of the projects?• Who is managing the projects?

18
Executive Portfolio Metrics

19
Project Schedule Metrics
0
50
100
150
200
250
300
7/8/
11
7/22
/11
8/5/
11
8/19
/11
9/2/
11
9/16
/11
9/30
/11
10/1
4/11
10/2
8/11
11/1
1/11
11/2
5/11
12/9
/11
12/2
3/11
1/6/
12
1/20
/12
2/3/
12
2/17
/12
3/2/
12
3/16
/12
3/30
/12
4/13
/12
4/27
/12
5/11
/12
5/25
/12
6/8/
12
6/22
/12
Rem
aini
ng W
ork
(wor
k pa
ckag
es)
Phase 1 (DLRS) Analysis & Designby Catchup Cycle
Catchup Cycle 1
Planned
Actual
Catchup Cycle 2
Planned
Actual
Catchup Cycle 3
Planned
Actual
Catchup Cycle 4
Planned
Ahead of Schedule
Behind Schedule

20
20
6
10
36
14
7
0
21
0
0
0
0
1
0
1
2
6
102
22
130
0% 10% 20% 30% 40% 50% 60% 70% 80% 90% 100%
ATMM
DLRS
Common
Phase 1(All)
Pass
Fail
Blocked
To Be Run
Not Delivered
17
1
15
0
14
0
8
7
31
2
25
4
0 10 20 30 40 50 60 70
Total Bugs
Pending Triage
Pending 3M Fix
Verified as FixedSeverity 1Severity 2Severity 3
Project Testing Metrics

21
Key Questions that Need Answered
• Do I have the technology needed to implement and manage the upcoming projects?
• What new technologies or upgrades should be built into the project budget?
• Will there be an increase in operating costs?• How much money should I put in my future
capital and operating budget for software and hardware?

22
Technology Roadmap Legend: Under evaluation, emerging, or needs review
Supported, current, preferredContained (not centrally supported)Not supported, retired, no new development, may still exist
FY2012 FY2013 FY2014 FY2015 FY2016 Last UpdateServer Platforms
HP 04/2012 Migrate to Cisco UCS
IBM 04/2012 Technology refresh FY2013
Datacom 01/2012DMV project to replace Datacom
serversCisco UCS 01/2012 Need to examine lifecycle
Dell 02/2012SQL Server replacements for HP (2‐
vendor solution)Operating Systems‐Server
Windows Server 2003 03/2012 LifecycleWindows Server 2008 04/2012Windows Server 8 03/2012
Linux RedHat 01/2012
IBM AIX 5.3 03/2012End‐of‐life 04/2012
IBM AIX 6.1 04/2012Advantage Upgrade
project
Datacom Datapoint 02/2012DMV project (Garnet) to replace
Datacom Operating Systems‐Desktop
Windows XP 03/2012 LifecycleWindows 7 03/2012
Windows 8 04/2012GA 10/2012; anticipated
deploymentMac O/S 01/2012
Linux 01/2012

23
IT Managers Metrics
• Are the resources adequate for the project?• Are the right resources on the project?• Is the technology being implemented on time and with high
quality?• Are the resources adequately trained to manage the
technology?• Is Operations prepared to implement and maintain the
project?• Are the ITIL processes (Change & Release Management)
being utilized?• Is the Support Plan completed?• Many more issues are covered in this process

24
Project Risk Metrics

25
Key Questions that Need Answered
• What benefits are IT projects adding to our enterprise?
• When will the benefits be delivered?• What is my Return on Investment (ROI)• Are the project delivering on the promised
business case?
In Development

26
ITD Project Portfolio Benefits Ro ITD
Projects
SharePoint 2010 Upgrade
ITD Transition to ICS
Process Projects
Technology Solutions
Data
2012Q1
2012Q2
2012Q3
2012Q4
2013Q1
2013Q2
2013Q3
2013Q4
Benefit Milestone
MilestoneTechnology, GovernanceTechnology, Governance
Transition to statewide emailTransition to statewide email
Project Description
Project DescriptionProject Description
Project DescriptionProject Description
RealizationBenefit Realization
Other
Cost
WorkflowCollaboration, Document Mgt. Workflow
Reduction in resources
Benefit
Cost

27
Shannon BarnesIdaho Transportation
Department
IT Performance MeasuresMoDOT IS Tracker
May 2012
Beth RingInformation Systems Director
Missouri Department of Transportation

History of DivisionPerformance Measures at
MoDOT Division Trackers created in 2006/07
First version of IS Tracker had six measures:– Two help desk measures– Two cost measures (including dial-up costs)– Two availability measures
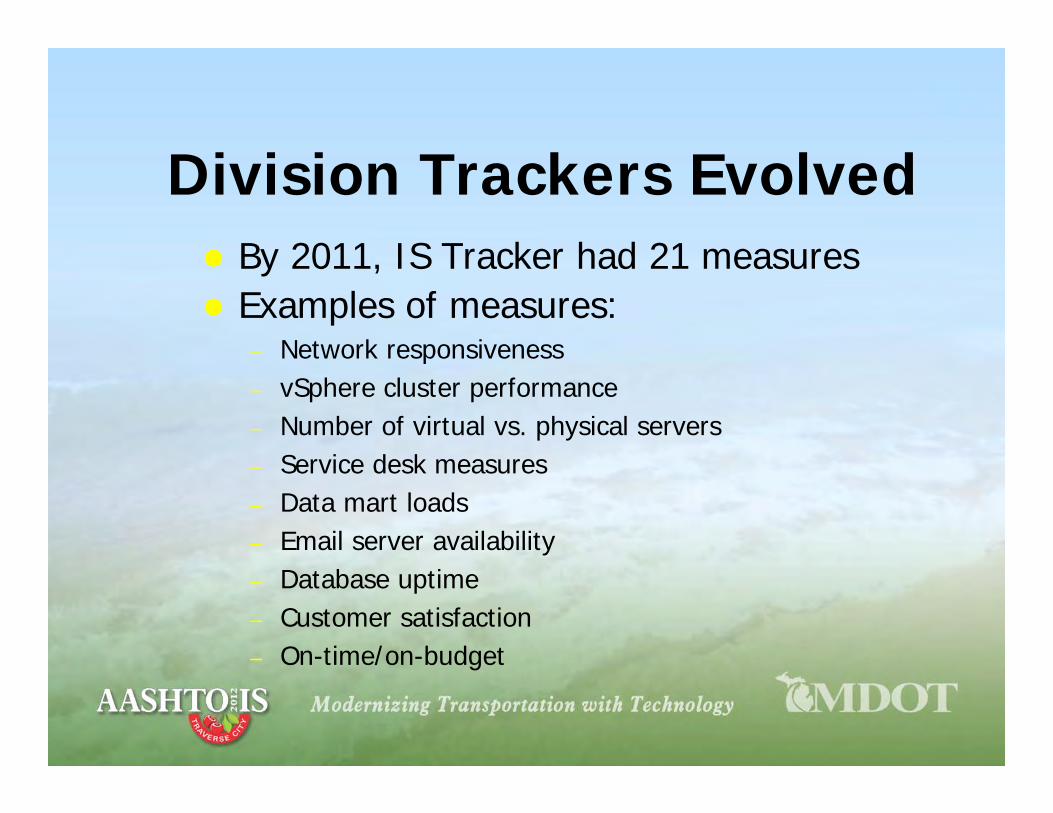
Division Trackers Evolved By 2011, IS Tracker had 21 measures Examples of measures:
– Network responsiveness– vSphere cluster performance– Number of virtual vs. physical servers– Service desk measures– Data mart loads– Email server availability– Database uptime– Customer satisfaction– On-time/on-budget

Revamping the IS Tracker
Make measures more externally focused
Reduce number of measures
Select measures that are easier for non-technical people to understand

Measurement Categories
Equipment counts Service desk measures On-time/on-budget Customer satisfaction Cost measures Staff measures

IS Tracker Measures
# of desktops, laptops & printers Service desk ticket aging – break fixes Service desk ticket resolution # of application priority incidents Cost by key system(under development) On-time delivery On-budget delivery
IS Tracker Measures(cont.)
Work effort delivery satisfaction (under development)
KTDO cost as a % of total cost ITIP discretionary account Cost savings from efficiency
improvements (under development) Total IS staff
Challenges
Survey response rate low Difficulty measuring some:
– Cost by key system– Applications with low usage
“Big Tracker” measures

What’s Next?
Continue to improve performance measures– Is this the right measure?– Is this measure helping me make decisions?– Is this measure important to our customers or
partners?– Is this measure producing a benefit for the cost?

Questions?
For more information, contact: Beth Ring
Missouri Department of Transportation(573) 751-1345