Embed Size (px)
Citation preview
CRP 7 (CGIAR Research Program on Climate
Change, Agriculture and Food Security - CCAFS)
PERFORMANCE MONITORING REPORT 2014
CCAFS is led by the International Center for Tropical Agriculture (CIAT) in collaboration with the following research organisations
Strategic partner
CCAFS ANNUAL REPORT 2014 Page | 2
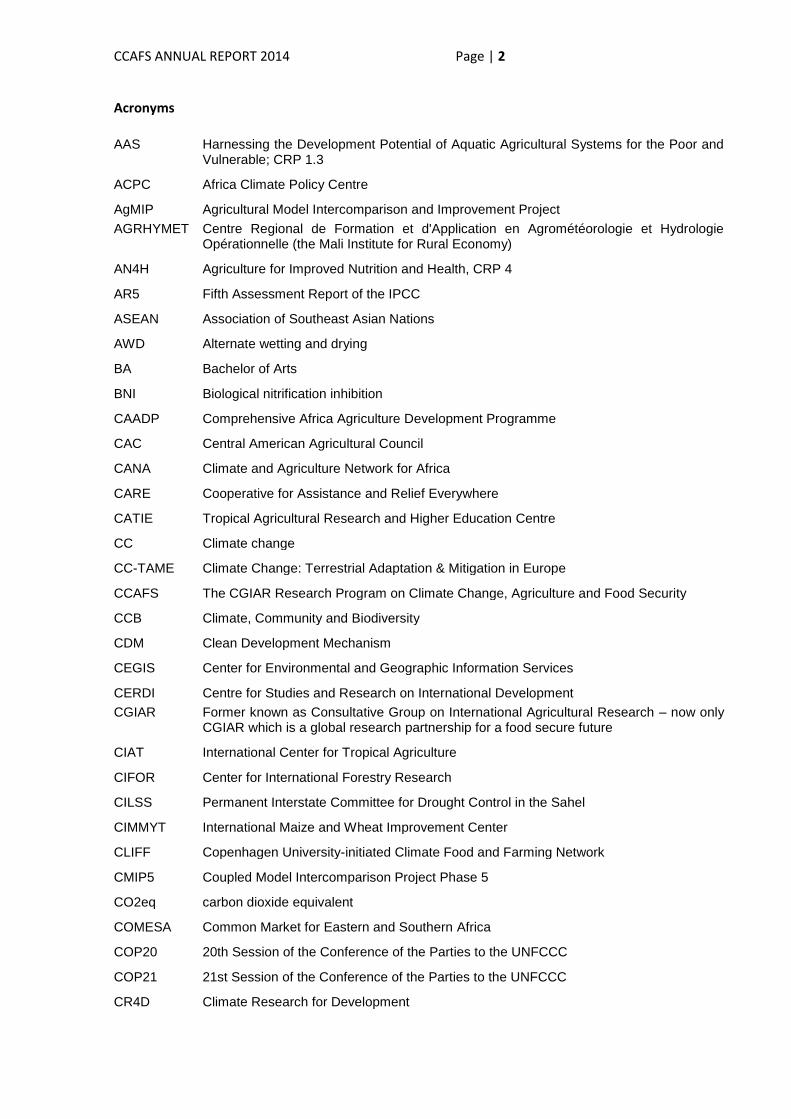
Acronyms AAS Harnessing the Development Potential of Aquatic Agricultural Systems for the Poor and
Vulnerable; CRP 1.3
ACPC Africa Climate Policy Centre
AgMIP Agricultural Model Intercomparison and Improvement Project
AGRHYMET Centre Regional de Formation et d'Application en Agrométéorologie et Hydrologie Opérationnelle (the Mali Institute for Rural Economy)
AN4H Agriculture for Improved Nutrition and Health, CRP 4
AR5 Fifth Assessment Report of the IPCC
ASEAN Association of Southeast Asian Nations
AWD Alternate wetting and drying
BA Bachelor of Arts
BNI Biological nitrification inhibition
CAADP Comprehensive Africa Agriculture Development Programme
CAC Central American Agricultural Council
CANA Climate and Agriculture Network for Africa
CARE Cooperative for Assistance and Relief Everywhere
CATIE Tropical Agricultural Research and Higher Education Centre
CC Climate change
CC-TAME Climate Change: Terrestrial Adaptation & Mitigation in Europe
CCAFS The CGIAR Research Program on Climate Change, Agriculture and Food Security
CCB Climate, Community and Biodiversity
CDM Clean Development Mechanism
CEGIS Center for Environmental and Geographic Information Services
CERDI Centre for Studies and Research on International Development
CGIAR Former known as Consultative Group on International Agricultural Research – now only CGIAR which is a global research partnership for a food secure future
CIAT International Center for Tropical Agriculture
CIFOR Center for International Forestry Research
CILSS Permanent Interstate Committee for Drought Control in the Sahel
CIMMYT International Maize and Wheat Improvement Center
CLIFF Copenhagen University-initiated Climate Food and Farming Network
CMIP5 Coupled Model Intercomparison Project Phase 5
CO2eq carbon dioxide equivalent
COMESA Common Market for Eastern and Southern Africa
COP20 20th Session of the Conference of the Parties to the UNFCCC
COP21 21st Session of the Conference of the Parties to the UNFCCC
CR4D Climate Research for Development
CCAFS ANNUAL REPORT 2014 Page | 3
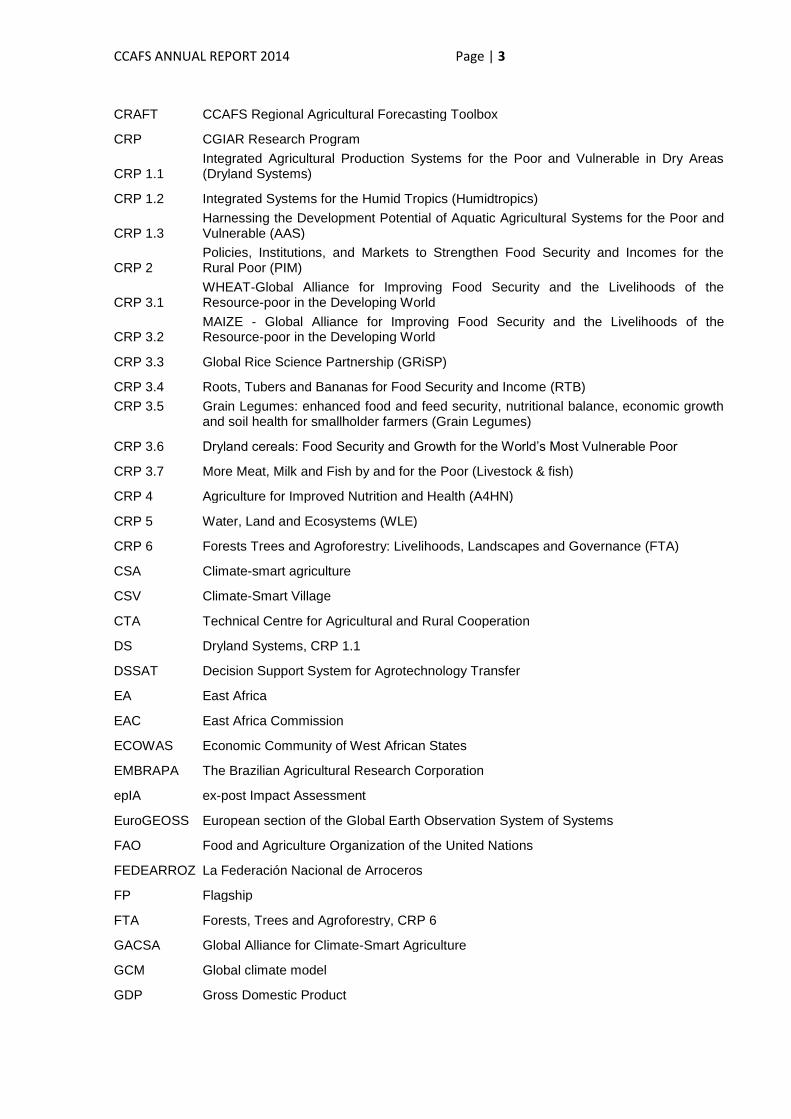
CRAFT CCAFS Regional Agricultural Forecasting Toolbox
CRP CGIAR Research Program
CRP 1.1 Integrated Agricultural Production Systems for the Poor and Vulnerable in Dry Areas (Dryland Systems)
CRP 1.2 Integrated Systems for the Humid Tropics (Humidtropics)
CRP 1.3 Harnessing the Development Potential of Aquatic Agricultural Systems for the Poor and Vulnerable (AAS)
CRP 2 Policies, Institutions, and Markets to Strengthen Food Security and Incomes for the Rural Poor (PIM)
CRP 3.1 WHEAT-Global Alliance for Improving Food Security and the Livelihoods of the Resource-poor in the Developing World
CRP 3.2 MAIZE - Global Alliance for Improving Food Security and the Livelihoods of the Resource-poor in the Developing World
CRP 3.3 Global Rice Science Partnership (GRiSP)
CRP 3.4 Roots, Tubers and Bananas for Food Security and Income (RTB)
CRP 3.5 Grain Legumes: enhanced food and feed security, nutritional balance, economic growth and soil health for smallholder farmers (Grain Legumes)
CRP 3.6 Dryland cereals: Food Security and Growth for the World’s Most Vulnerable Poor
CRP 3.7 More Meat, Milk and Fish by and for the Poor (Livestock & fish)
CRP 4 Agriculture for Improved Nutrition and Health (A4HN)
CRP 5 Water, Land and Ecosystems (WLE)
CRP 6 Forests Trees and Agroforestry: Livelihoods, Landscapes and Governance (FTA)
CSA Climate-smart agriculture
CSV Climate-Smart Village
CTA Technical Centre for Agricultural and Rural Cooperation
DS Dryland Systems, CRP 1.1
DSSAT Decision Support System for Agrotechnology Transfer
EA East Africa
EAC East Africa Commission
ECOWAS Economic Community of West African States
EMBRAPA The Brazilian Agricultural Research Corporation
epIA ex-post Impact Assessment
EuroGEOSS European section of the Global Earth Observation System of Systems
FAO Food and Agriculture Organization of the United Nations
FEDEARROZ La Federación Nacional de Arroceros
FP Flagship
FTA Forests, Trees and Agroforestry, CRP 6
GACSA Global Alliance for Climate-Smart Agriculture
GCM Global climate model
GDP Gross Domestic Product
CCAFS ANNUAL REPORT 2014 Page | 4
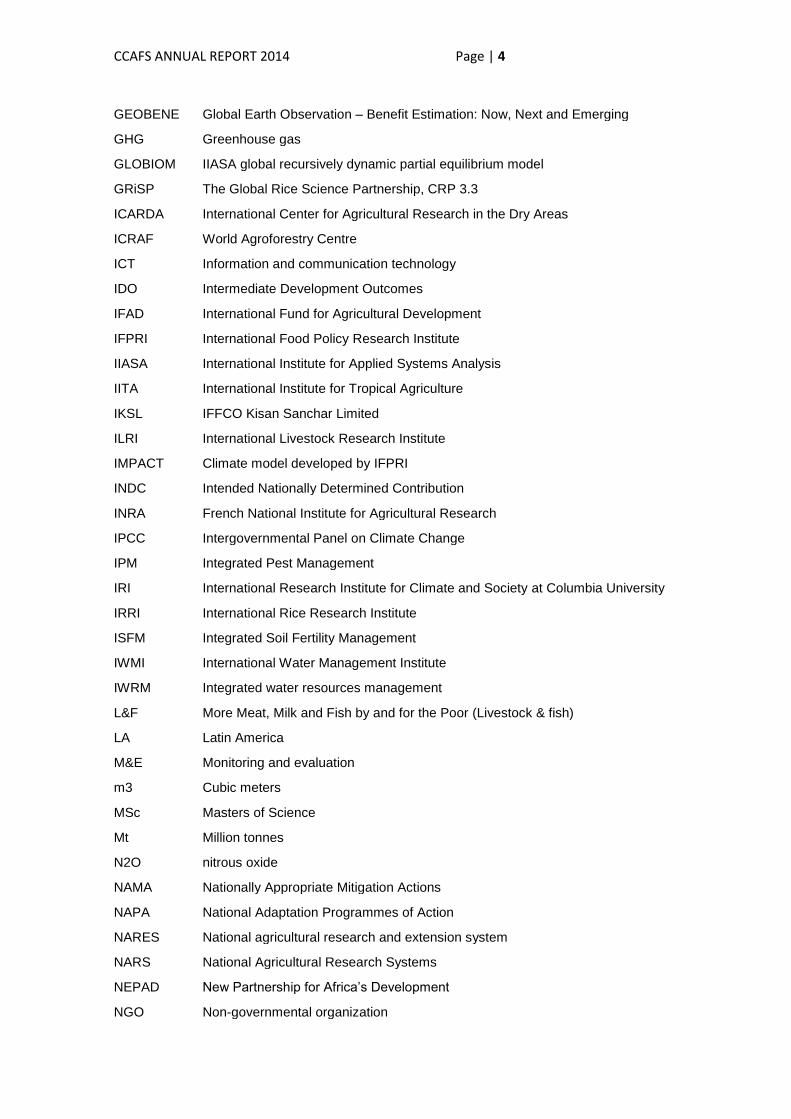
GEOBENE Global Earth Observation – Benefit Estimation: Now, Next and Emerging
GHG Greenhouse gas
GLOBIOM IIASA global recursively dynamic partial equilibrium model
GRiSP The Global Rice Science Partnership, CRP 3.3
ICARDA International Center for Agricultural Research in the Dry Areas
ICRAF World Agroforestry Centre
ICT Information and communication technology
IDO Intermediate Development Outcomes
IFAD International Fund for Agricultural Development
IFPRI International Food Policy Research Institute
IIASA International Institute for Applied Systems Analysis
IITA International Institute for Tropical Agriculture
IKSL IFFCO Kisan Sanchar Limited
ILRI International Livestock Research Institute
IMPACT Climate model developed by IFPRI
INDC Intended Nationally Determined Contribution
INRA French National Institute for Agricultural Research
IPCC Intergovernmental Panel on Climate Change
IPM Integrated Pest Management
IRI International Research Institute for Climate and Society at Columbia University
IRRI International Rice Research Institute
ISFM Integrated Soil Fertility Management
IWMI International Water Management Institute
IWRM Integrated water resources management
L&F More Meat, Milk and Fish by and for the Poor (Livestock & fish)
LA Latin America
M&E Monitoring and evaluation
m3 Cubic meters
MSc Masters of Science
Mt Million tonnes
N2O nitrous oxide
NAMA Nationally Appropriate Mitigation Actions
NAPA National Adaptation Programmes of Action
NARES National agricultural research and extension system
NARS National Agricultural Research Systems
NEPAD New Partnership for Africa’s Development
NGO Non-governmental organization
CCAFS ANNUAL REPORT 2014 Page | 5
NMS National Meteorological Services
NRM Natural Resource Management
NRMC Natural Resource Management Centre
OECD Organisation for Economic Co-operation and Development
PABRA Pan-Africa Bean Research Alliance
PhD Doctor of Philosophy
PHH Post-harvest handling
PIM Policies, Institutions and Markets, CRP 2
POWB Program of Work and Budget
PPCR Pilot Program for Climate Resilience
R4D Research for development
RBM Results-Based Management
REDD+ Reducing emissions from deforestation and forest degradation
REL Reference Emission Level
RTB Roots, Tubers and Bananas for Food Security and Income, CRP 3.4
SA South Asia
SACAU South African Confederation of Agricultural Unions
SAMPLES Standard Assessment of Agricultural Mitigation Potential and Livelihoods
SBSTA Subsidiary Body for Scientific and Technological Advice
SEA Southeast Asia
SHAMBA Smallholder Agriculture Mitigation Benefits Assessment
SPIA Standing Panel on Impact Assessment
TBD To be determined
TORS Terms of Reference
UNECA United Nations Economic Commission for Africa
UNEP WCMC United Nations Environment Programme's World Conservation Monitoring Centre
UNFCCC United Nations Framework Convention on Climate Change
W1 Window 1
W2 Window 2
WA West Africa
WASCAL West African Science Service Center on Climate Change and Adapted Land Use
WFP World Food Programme
WGII Working Group II on impacts and adaptation, a report under the Fifth Assessment Report of the IPCC
WLE Water, Land and Ecosystems, CRP 5
CCAFS ANNUAL REPORT 2014 Page | 6
A. KEY MESSAGES CCAFS has 12 Objectives in four Themes. Each Objective has a 10-year (2020) Outcome Target as defined in the original CCAFS proposal. Progress during 2014 has met or surpassed expectations for nine Objectives, and is behind target for three Objectives (see Table 2 & Lessons Learnt). Progress has been made from global to field level (Table 2). Full center performance summaries can be downloaded at this link. CCAFS and partners helped establish the Global Alliance for Climate-Smart Agriculture (GACSA), with CSA likely to become a major investment area in agriculture; continued to play a role in establishing agriculture as a negotiating topic in the UNFCCC; played a significant role in developing global initiatives on climate information services for farmers; and have been a major contributor to the IPCC AR5 report. At regional level, CCAFS has been actively engaged in major policy initiatives with NEPAD, ECOWAS, COMESA, CAC, ASEAN and OECD. CCAFS science and engagement efforts are helping foster outcomes in national policy processes in about 20 countries.1 CCAFS continues to implement, through partnerships, Climate-Smart Villages (CSVs) in 20 countries – cross-agency and farmer learning platforms with a focus on scaling up and out. Science-based solutions to climate change have been demonstrated with farmers in diverse contexts, e.g. Colombia (saving rice farmers US$ 3.5 million input costs in a single year); India (0.5 million hectares under laser land levelling); Kenya (new seasonal climate forecasts reaching 34,000 farmers). Work on climate-related advisories embraces TV, radio and mobile phones. CCAFS fed science into the reality TV program “Shamba Shape Up” which has a reach of more than 9 million viewers and, through changes in practices, is benefiting Kenya’s GDP by an estimated US$ 24 million. In 2014 CCAFS completed a major overhaul in preparation for the Extension Phase and Phase 2. This involved regional planning meetings with partners, developing targets and indicators for regional impact pathways that cascade into global impact pathways for Flagships, and reorganising the project portfolio so they better focus on outcomes and regional impact pathways. The Results-Based Management (RBM) trial conducted in 2014 has been used to plan the new RBM system. Within CCAFS, cross-Center work is vibrant, and has resulted in CGIAR becoming the “go-to” place for climate change and developing country agriculture, and gaining legitimacy in hosting and leading major global initiatives. One such initiative, cutting across developing and developed countries was the establishment of an aspirational global target for agricultural emissions reductions that does not compromise food security (to be released prior to COP21). But challenges remain, particularly funding stability, and coordination and boundaries among CRPs. Synthesis of the two most significant achievements/success stories 1. Colombian rice farmers use CCAFS informed big data analyses and reduce production losses The competitiveness of the Colombian rice sector is under threat due to climate change impacts, with yields of irrigated rice down from an average of 6 tonnes per hectare to 5 tonnes, according to FEDEARROZ, the national rice growers association representing more than 50,000 farmers and half a million hectares. CIAT undertook “big data” analysis to reveal the importance of climate as a determinant of up to 50% of rice yield outcomes in Colombia and to develop predictive tools to inform seasonal rice farming decisions. In close collaboration with FEDEARROZ, results were disseminated through workshops, trainings and ICT applications to extension agents and local farmers’ groups.
1 Bangladesh, Burkina Faso, Cambodia, Colombia, El Salvador, Ethiopia, Ghana, Guatemala, Honduras, India,
Kenya, Laos, Mali, Nepal, Nicaragua, Niger, Peru, Sénégal, Tanzania, Uganda, Vietnam
CCAFS ANNUAL REPORT 2014 Page | 7
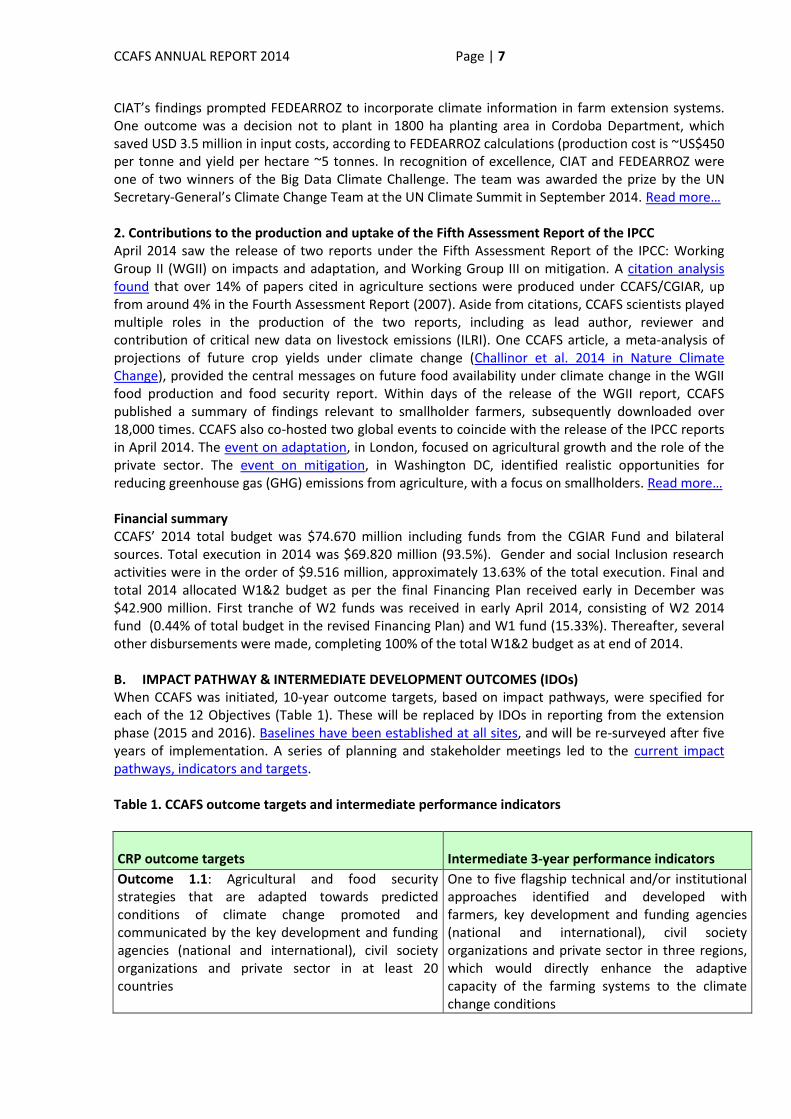
CIAT’s findings prompted FEDEARROZ to incorporate climate information in farm extension systems. One outcome was a decision not to plant in 1800 ha planting area in Cordoba Department, which saved USD 3.5 million in input costs, according to FEDEARROZ calculations (production cost is ~US$450 per tonne and yield per hectare ~5 tonnes. In recognition of excellence, CIAT and FEDEARROZ were one of two winners of the Big Data Climate Challenge. The team was awarded the prize by the UN Secretary-General’s Climate Change Team at the UN Climate Summit in September 2014. Read more… 2. Contributions to the production and uptake of the Fifth Assessment Report of the IPCC April 2014 saw the release of two reports under the Fifth Assessment Report of the IPCC: Working Group II (WGII) on impacts and adaptation, and Working Group III on mitigation. A citation analysis found that over 14% of papers cited in agriculture sections were produced under CCAFS/CGIAR, up from around 4% in the Fourth Assessment Report (2007). Aside from citations, CCAFS scientists played multiple roles in the production of the two reports, including as lead author, reviewer and contribution of critical new data on livestock emissions (ILRI). One CCAFS article, a meta-analysis of projections of future crop yields under climate change (Challinor et al. 2014 in Nature Climate Change), provided the central messages on future food availability under climate change in the WGII food production and food security report. Within days of the release of the WGII report, CCAFS published a summary of findings relevant to smallholder farmers, subsequently downloaded over 18,000 times. CCAFS also co-hosted two global events to coincide with the release of the IPCC reports in April 2014. The event on adaptation, in London, focused on agricultural growth and the role of the private sector. The event on mitigation, in Washington DC, identified realistic opportunities for reducing greenhouse gas (GHG) emissions from agriculture, with a focus on smallholders. Read more… Financial summary CCAFS’ 2014 total budget was $74.670 million including funds from the CGIAR Fund and bilateral sources. Total execution in 2014 was $69.820 million (93.5%). Gender and social Inclusion research activities were in the order of $9.516 million, approximately 13.63% of the total execution. Final and total 2014 allocated W1&2 budget as per the final Financing Plan received early in December was $42.900 million. First tranche of W2 funds was received in early April 2014, consisting of W2 2014 fund (0.44% of total budget in the revised Financing Plan) and W1 fund (15.33%). Thereafter, several other disbursements were made, completing 100% of the total W1&2 budget as at end of 2014. B. IMPACT PATHWAY & INTERMEDIATE DEVELOPMENT OUTCOMES (IDOs) When CCAFS was initiated, 10-year outcome targets, based on impact pathways, were specified for each of the 12 Objectives (Table 1). These will be replaced by IDOs in reporting from the extension phase (2015 and 2016). Baselines have been established at all sites, and will be re-surveyed after five years of implementation. A series of planning and stakeholder meetings led to the current impact pathways, indicators and targets. Table 1. CCAFS outcome targets and intermediate performance indicators
CRP outcome targets
Intermediate 3-year performance indicators
Outcome 1.1: Agricultural and food security strategies that are adapted towards predicted conditions of climate change promoted and communicated by the key development and funding agencies (national and international), civil society organizations and private sector in at least 20 countries
One to five flagship technical and/or institutional approaches identified and developed with farmers, key development and funding agencies (national and international), civil society organizations and private sector in three regions, which would directly enhance the adaptive capacity of the farming systems to the climate change conditions
CCAFS ANNUAL REPORT 2014 Page | 8
CRP outcome targets
Intermediate 3-year performance indicators
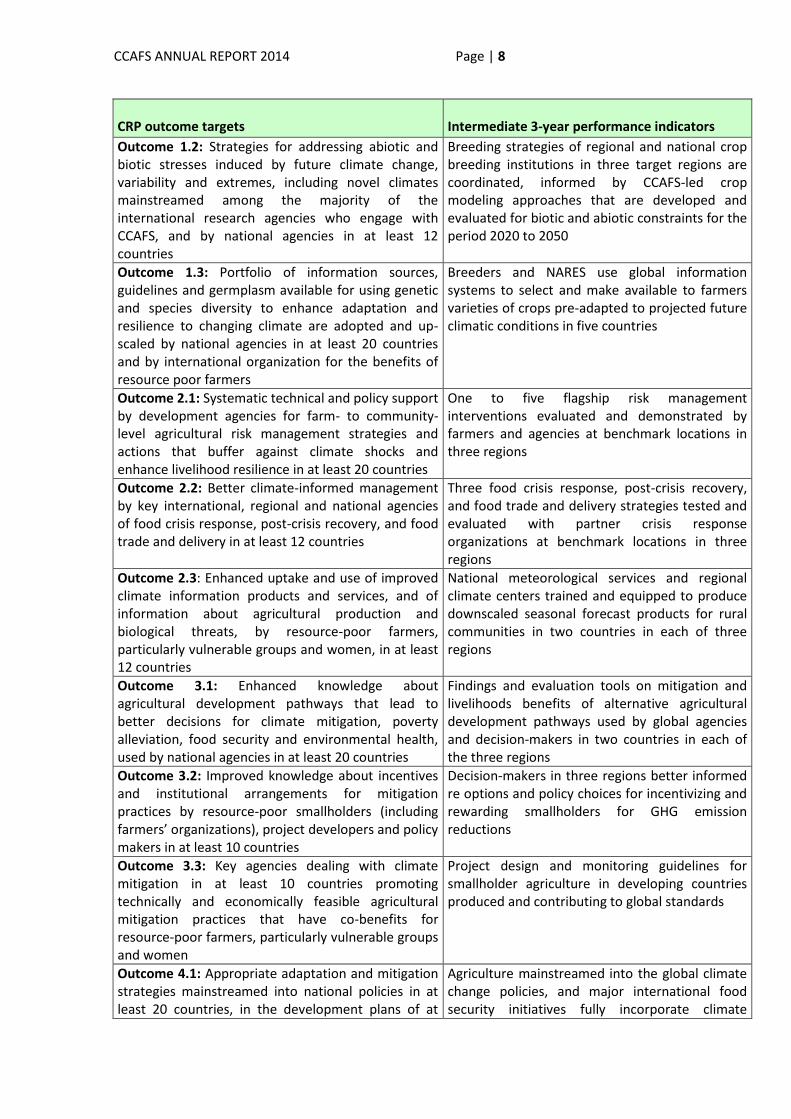
Outcome 1.2: Strategies for addressing abiotic and biotic stresses induced by future climate change, variability and extremes, including novel climates mainstreamed among the majority of the international research agencies who engage with CCAFS, and by national agencies in at least 12 countries
Breeding strategies of regional and national crop breeding institutions in three target regions are coordinated, informed by CCAFS-led crop modeling approaches that are developed and evaluated for biotic and abiotic constraints for the period 2020 to 2050
Outcome 1.3: Portfolio of information sources, guidelines and germplasm available for using genetic and species diversity to enhance adaptation and resilience to changing climate are adopted and up-scaled by national agencies in at least 20 countries and by international organization for the benefits of resource poor farmers
Breeders and NARES use global information systems to select and make available to farmers varieties of crops pre-adapted to projected future climatic conditions in five countries
Outcome 2.1: Systematic technical and policy support by development agencies for farm- to community-level agricultural risk management strategies and actions that buffer against climate shocks and enhance livelihood resilience in at least 20 countries
One to five flagship risk management interventions evaluated and demonstrated by farmers and agencies at benchmark locations in three regions
Outcome 2.2: Better climate-informed management by key international, regional and national agencies of food crisis response, post-crisis recovery, and food trade and delivery in at least 12 countries
Three food crisis response, post-crisis recovery, and food trade and delivery strategies tested and evaluated with partner crisis response organizations at benchmark locations in three regions
Outcome 2.3: Enhanced uptake and use of improved climate information products and services, and of information about agricultural production and biological threats, by resource-poor farmers, particularly vulnerable groups and women, in at least 12 countries
National meteorological services and regional climate centers trained and equipped to produce downscaled seasonal forecast products for rural communities in two countries in each of three regions
Outcome 3.1: Enhanced knowledge about agricultural development pathways that lead to better decisions for climate mitigation, poverty alleviation, food security and environmental health, used by national agencies in at least 20 countries
Findings and evaluation tools on mitigation and livelihoods benefits of alternative agricultural development pathways used by global agencies and decision-makers in two countries in each of the three regions
Outcome 3.2: Improved knowledge about incentives and institutional arrangements for mitigation practices by resource-poor smallholders (including farmers’ organizations), project developers and policy makers in at least 10 countries
Decision-makers in three regions better informed re options and policy choices for incentivizing and rewarding smallholders for GHG emission reductions
Outcome 3.3: Key agencies dealing with climate mitigation in at least 10 countries promoting technically and economically feasible agricultural mitigation practices that have co-benefits for resource-poor farmers, particularly vulnerable groups and women
Project design and monitoring guidelines for smallholder agriculture in developing countries produced and contributing to global standards
Outcome 4.1: Appropriate adaptation and mitigation strategies mainstreamed into national policies in at least 20 countries, in the development plans of at
Agriculture mainstreamed into the global climate change policies, and major international food security initiatives fully incorporate climate
CCAFS ANNUAL REPORT 2014 Page | 9
CRP outcome targets
Intermediate 3-year performance indicators
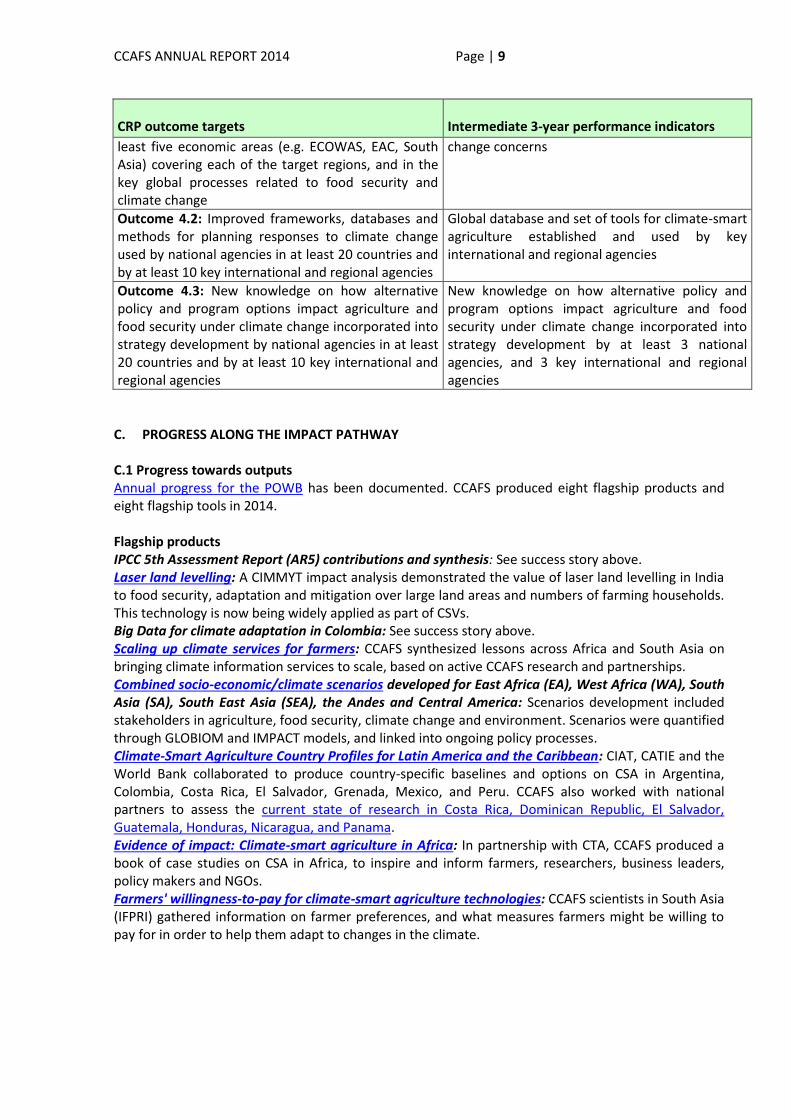
least five economic areas (e.g. ECOWAS, EAC, South Asia) covering each of the target regions, and in the key global processes related to food security and climate change
change concerns
Outcome 4.2: Improved frameworks, databases and methods for planning responses to climate change used by national agencies in at least 20 countries and by at least 10 key international and regional agencies
Global database and set of tools for climate-smart agriculture established and used by key international and regional agencies
Outcome 4.3: New knowledge on how alternative policy and program options impact agriculture and food security under climate change incorporated into strategy development by national agencies in at least 20 countries and by at least 10 key international and regional agencies
New knowledge on how alternative policy and program options impact agriculture and food security under climate change incorporated into strategy development by at least 3 national agencies, and 3 key international and regional agencies
C. PROGRESS ALONG THE IMPACT PATHWAY C.1 Progress towards outputs Annual progress for the POWB has been documented. CCAFS produced eight flagship products and eight flagship tools in 2014. Flagship products IPCC 5th Assessment Report (AR5) contributions and synthesis: See success story above. Laser land levelling: A CIMMYT impact analysis demonstrated the value of laser land levelling in India to food security, adaptation and mitigation over large land areas and numbers of farming households. This technology is now being widely applied as part of CSVs. Big Data for climate adaptation in Colombia: See success story above. Scaling up climate services for farmers: CCAFS synthesized lessons across Africa and South Asia on bringing climate information services to scale, based on active CCAFS research and partnerships. Combined socio-economic/climate scenarios developed for East Africa (EA), West Africa (WA), South Asia (SA), South East Asia (SEA), the Andes and Central America: Scenarios development included stakeholders in agriculture, food security, climate change and environment. Scenarios were quantified through GLOBIOM and IMPACT models, and linked into ongoing policy processes. Climate-Smart Agriculture Country Profiles for Latin America and the Caribbean: CIAT, CATIE and the World Bank collaborated to produce country-specific baselines and options on CSA in Argentina, Colombia, Costa Rica, El Salvador, Grenada, Mexico, and Peru. CCAFS also worked with national partners to assess the current state of research in Costa Rica, Dominican Republic, El Salvador, Guatemala, Honduras, Nicaragua, and Panama. Evidence of impact: Climate-smart agriculture in Africa: In partnership with CTA, CCAFS produced a book of case studies on CSA in Africa, to inspire and inform farmers, researchers, business leaders, policy makers and NGOs. Farmers' willingness-to-pay for climate-smart agriculture technologies: CCAFS scientists in South Asia (IFPRI) gathered information on farmer preferences, and what measures farmers might be willing to pay for in order to help them adapt to changes in the climate.
CCAFS ANNUAL REPORT 2014 Page | 10
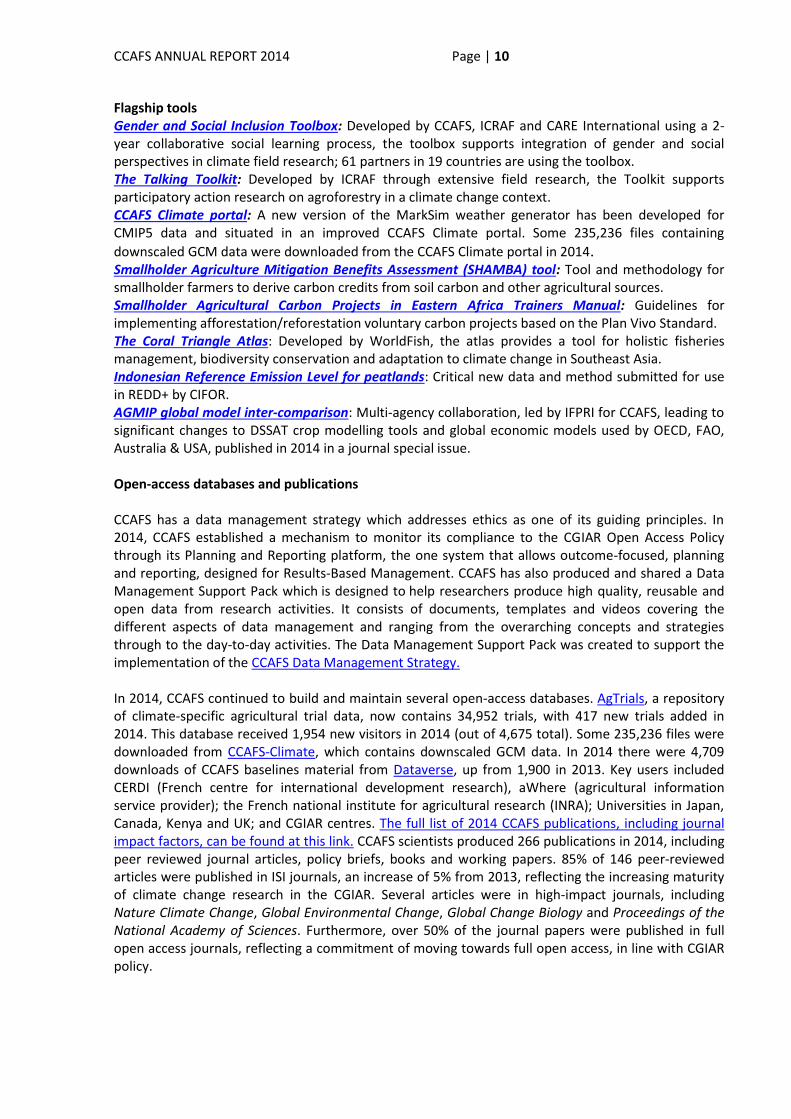
Flagship tools Gender and Social Inclusion Toolbox: Developed by CCAFS, ICRAF and CARE International using a 2-year collaborative social learning process, the toolbox supports integration of gender and social perspectives in climate field research; 61 partners in 19 countries are using the toolbox. The Talking Toolkit: Developed by ICRAF through extensive field research, the Toolkit supports participatory action research on agroforestry in a climate change context. CCAFS Climate portal: A new version of the MarkSim weather generator has been developed for CMIP5 data and situated in an improved CCAFS Climate portal. Some 235,236 files containing
downscaled GCM data were downloaded from the CCAFS Climate portal in 2014. Smallholder Agriculture Mitigation Benefits Assessment (SHAMBA) tool: Tool and methodology for smallholder farmers to derive carbon credits from soil carbon and other agricultural sources. Smallholder Agricultural Carbon Projects in Eastern Africa Trainers Manual: Guidelines for implementing afforestation/reforestation voluntary carbon projects based on the Plan Vivo Standard. The Coral Triangle Atlas: Developed by WorldFish, the atlas provides a tool for holistic fisheries management, biodiversity conservation and adaptation to climate change in Southeast Asia. Indonesian Reference Emission Level for peatlands: Critical new data and method submitted for use in REDD+ by CIFOR. AGMIP global model inter-comparison: Multi-agency collaboration, led by IFPRI for CCAFS, leading to significant changes to DSSAT crop modelling tools and global economic models used by OECD, FAO, Australia & USA, published in 2014 in a journal special issue. Open-access databases and publications CCAFS has a data management strategy which addresses ethics as one of its guiding principles. In 2014, CCAFS established a mechanism to monitor its compliance to the CGIAR Open Access Policy through its Planning and Reporting platform, the one system that allows outcome-focused, planning and reporting, designed for Results-Based Management. CCAFS has also produced and shared a Data Management Support Pack which is designed to help researchers produce high quality, reusable and open data from research activities. It consists of documents, templates and videos covering the different aspects of data management and ranging from the overarching concepts and strategies through to the day-to-day activities. The Data Management Support Pack was created to support the implementation of the CCAFS Data Management Strategy. In 2014, CCAFS continued to build and maintain several open-access databases. AgTrials, a repository of climate-specific agricultural trial data, now contains 34,952 trials, with 417 new trials added in 2014. This database received 1,954 new visitors in 2014 (out of 4,675 total). Some 235,236 files were downloaded from CCAFS-Climate, which contains downscaled GCM data. In 2014 there were 4,709 downloads of CCAFS baselines material from Dataverse, up from 1,900 in 2013. Key users included CERDI (French centre for international development research), aWhere (agricultural information service provider); the French national institute for agricultural research (INRA); Universities in Japan, Canada, Kenya and UK; and CGIAR centres. The full list of 2014 CCAFS publications, including journal impact factors, can be found at this link. CCAFS scientists produced 266 publications in 2014, including peer reviewed journal articles, policy briefs, books and working papers. 85% of 146 peer-reviewed articles were published in ISI journals, an increase of 5% from 2013, reflecting the increasing maturity of climate change research in the CGIAR. Several articles were in high-impact journals, including Nature Climate Change, Global Environmental Change, Global Change Biology and Proceedings of the National Academy of Sciences. Furthermore, over 50% of the journal papers were published in full open access journals, reflecting a commitment of moving towards full open access, in line with CGIAR policy.
CCAFS ANNUAL REPORT 2014 Page | 11
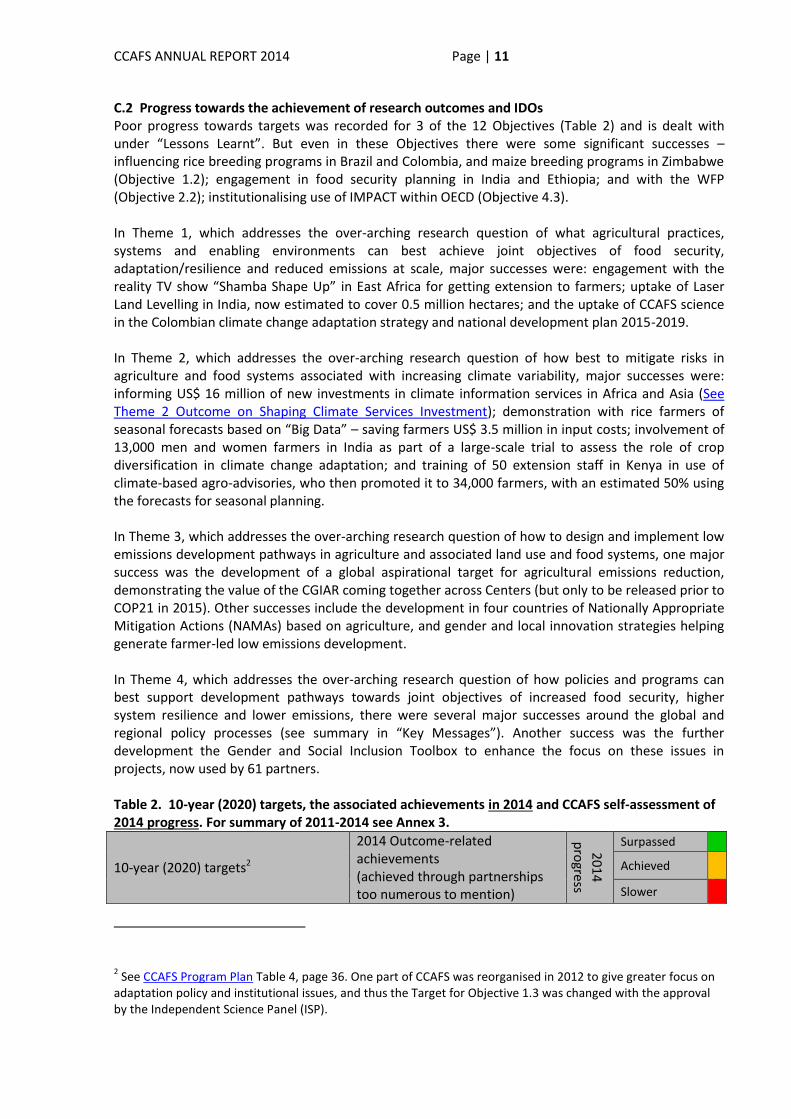
C.2 Progress towards the achievement of research outcomes and IDOs Poor progress towards targets was recorded for 3 of the 12 Objectives (Table 2) and is dealt with under “Lessons Learnt”. But even in these Objectives there were some significant successes – influencing rice breeding programs in Brazil and Colombia, and maize breeding programs in Zimbabwe (Objective 1.2); engagement in food security planning in India and Ethiopia; and with the WFP (Objective 2.2); institutionalising use of IMPACT within OECD (Objective 4.3). In Theme 1, which addresses the over-arching research question of what agricultural practices, systems and enabling environments can best achieve joint objectives of food security, adaptation/resilience and reduced emissions at scale, major successes were: engagement with the reality TV show “Shamba Shape Up” in East Africa for getting extension to farmers; uptake of Laser Land Levelling in India, now estimated to cover 0.5 million hectares; and the uptake of CCAFS science in the Colombian climate change adaptation strategy and national development plan 2015-2019. In Theme 2, which addresses the over-arching research question of how best to mitigate risks in agriculture and food systems associated with increasing climate variability, major successes were: informing US$ 16 million of new investments in climate information services in Africa and Asia (See Theme 2 Outcome on Shaping Climate Services Investment); demonstration with rice farmers of seasonal forecasts based on “Big Data” – saving farmers US$ 3.5 million in input costs; involvement of 13,000 men and women farmers in India as part of a large-scale trial to assess the role of crop diversification in climate change adaptation; and training of 50 extension staff in Kenya in use of climate-based agro-advisories, who then promoted it to 34,000 farmers, with an estimated 50% using the forecasts for seasonal planning. In Theme 3, which addresses the over-arching research question of how to design and implement low emissions development pathways in agriculture and associated land use and food systems, one major success was the development of a global aspirational target for agricultural emissions reduction, demonstrating the value of the CGIAR coming together across Centers (but only to be released prior to COP21 in 2015). Other successes include the development in four countries of Nationally Appropriate Mitigation Actions (NAMAs) based on agriculture, and gender and local innovation strategies helping generate farmer-led low emissions development. In Theme 4, which addresses the over-arching research question of how policies and programs can best support development pathways towards joint objectives of increased food security, higher system resilience and lower emissions, there were several major successes around the global and regional policy processes (see summary in “Key Messages”). Another success was the further development the Gender and Social Inclusion Toolbox to enhance the focus on these issues in projects, now used by 61 partners. Table 2. 10-year (2020) targets, the associated achievements in 2014 and CCAFS self-assessment of 2014 progress. For summary of 2011-2014 see Annex 3.
10-year (2020) targets2
2014 Outcome-related achievements (achieved through partnerships too numerous to mention)
201
4
pro
gress
Surpassed
Achieved
Slower
2 See CCAFS Program Plan Table 4, page 36. One part of CCAFS was reorganised in 2012 to give greater focus on
adaptation policy and institutional issues, and thus the Target for Objective 1.3 was changed with the approval by the Independent Science Panel (ISP).
CCAFS ANNUAL REPORT 2014 Page | 12
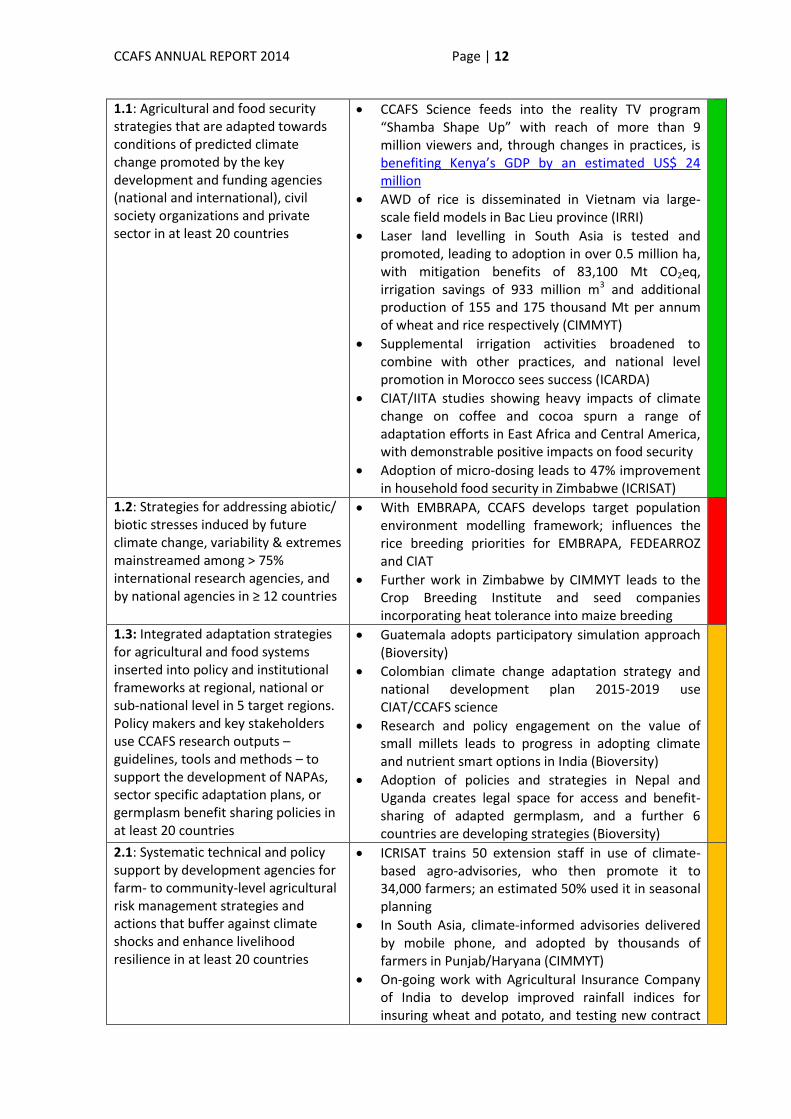
1.1: Agricultural and food security strategies that are adapted towards conditions of predicted climate change promoted by the key development and funding agencies (national and international), civil society organizations and private sector in at least 20 countries
CCAFS Science feeds into the reality TV program “Shamba Shape Up” with reach of more than 9 million viewers and, through changes in practices, is benefiting Kenya’s GDP by an estimated US$ 24 million
AWD of rice is disseminated in Vietnam via large-scale field models in Bac Lieu province (IRRI)
Laser land levelling in South Asia is tested and promoted, leading to adoption in over 0.5 million ha, with mitigation benefits of 83,100 Mt CO2eq, irrigation savings of 933 million m3 and additional production of 155 and 175 thousand Mt per annum of wheat and rice respectively (CIMMYT)
Supplemental irrigation activities broadened to combine with other practices, and national level promotion in Morocco sees success (ICARDA)
CIAT/IITA studies showing heavy impacts of climate change on coffee and cocoa spurn a range of adaptation efforts in East Africa and Central America, with demonstrable positive impacts on food security
Adoption of micro-dosing leads to 47% improvement in household food security in Zimbabwe (ICRISAT)
1.2: Strategies for addressing abiotic/ biotic stresses induced by future climate change, variability & extremes mainstreamed among > 75% international research agencies, and by national agencies in ≥ 12 countries
With EMBRAPA, CCAFS develops target population environment modelling framework; influences the rice breeding priorities for EMBRAPA, FEDEARROZ and CIAT
Further work in Zimbabwe by CIMMYT leads to the Crop Breeding Institute and seed companies incorporating heat tolerance into maize breeding
1.3: Integrated adaptation strategies for agricultural and food systems inserted into policy and institutional frameworks at regional, national or sub-national level in 5 target regions. Policy makers and key stakeholders use CCAFS research outputs – guidelines, tools and methods – to support the development of NAPAs, sector specific adaptation plans, or germplasm benefit sharing policies in at least 20 countries
Guatemala adopts participatory simulation approach (Bioversity)
Colombian climate change adaptation strategy and national development plan 2015-2019 use CIAT/CCAFS science
Research and policy engagement on the value of small millets leads to progress in adopting climate and nutrient smart options in India (Bioversity)
Adoption of policies and strategies in Nepal and Uganda creates legal space for access and benefit-sharing of adapted germplasm, and a further 6 countries are developing strategies (Bioversity)
2.1: Systematic technical and policy support by development agencies for farm- to community-level agricultural risk management strategies and actions that buffer against climate shocks and enhance livelihood resilience in at least 20 countries
ICRISAT trains 50 extension staff in use of climate-based agro-advisories, who then promote it to 34,000 farmers; an estimated 50% used it in seasonal planning
In South Asia, climate-informed advisories delivered by mobile phone, and adopted by thousands of farmers in Punjab/Haryana (CIMMYT)
On-going work with Agricultural Insurance Company of India to develop improved rainfall indices for insuring wheat and potato, and testing new contract
CCAFS ANNUAL REPORT 2014 Page | 13
designs
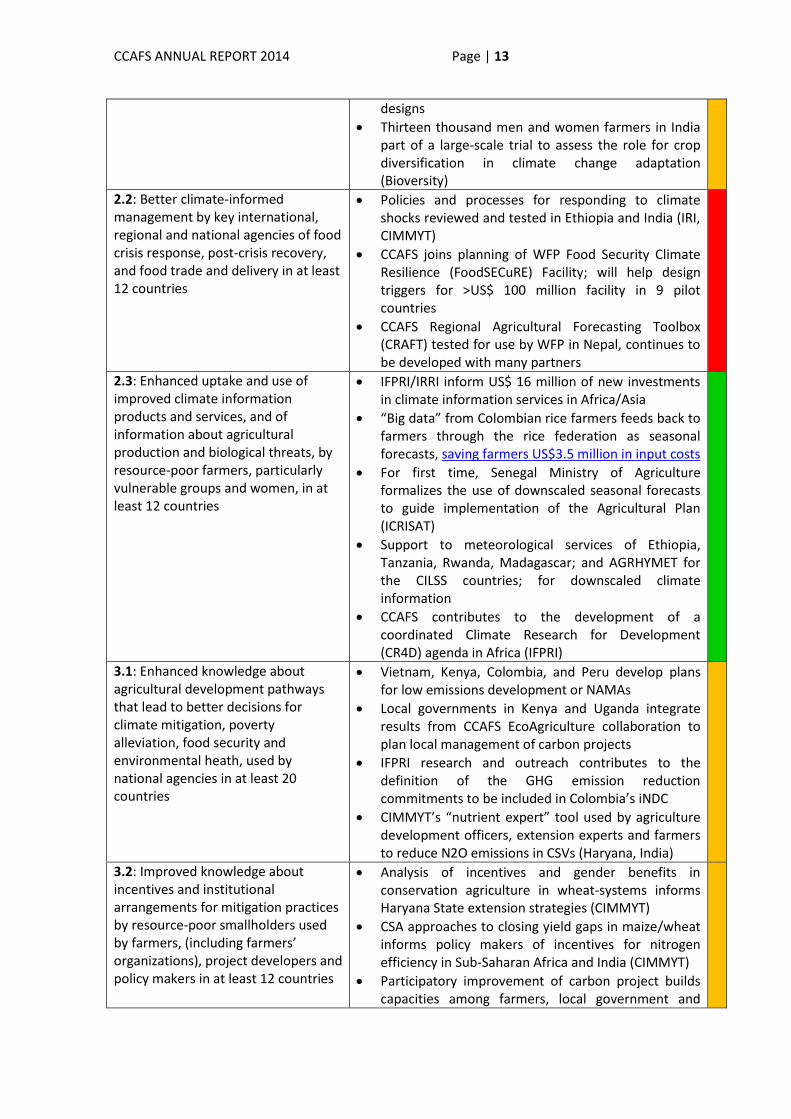
Thirteen thousand men and women farmers in India part of a large-scale trial to assess the role for crop diversification in climate change adaptation (Bioversity)
2.2: Better climate-informed management by key international, regional and national agencies of food crisis response, post-crisis recovery, and food trade and delivery in at least 12 countries
Policies and processes for responding to climate shocks reviewed and tested in Ethiopia and India (IRI, CIMMYT)
CCAFS joins planning of WFP Food Security Climate Resilience (FoodSECuRE) Facility; will help design triggers for >US$ 100 million facility in 9 pilot countries
CCAFS Regional Agricultural Forecasting Toolbox (CRAFT) tested for use by WFP in Nepal, continues to be developed with many partners
2.3: Enhanced uptake and use of improved climate information products and services, and of information about agricultural production and biological threats, by resource-poor farmers, particularly vulnerable groups and women, in at least 12 countries
IFPRI/IRRI inform US$ 16 million of new investments in climate information services in Africa/Asia
“Big data” from Colombian rice farmers feeds back to farmers through the rice federation as seasonal forecasts, saving farmers US$3.5 million in input costs
For first time, Senegal Ministry of Agriculture formalizes the use of downscaled seasonal forecasts to guide implementation of the Agricultural Plan (ICRISAT)
Support to meteorological services of Ethiopia, Tanzania, Rwanda, Madagascar; and AGRHYMET for the CILSS countries; for downscaled climate information
CCAFS contributes to the development of a coordinated Climate Research for Development (CR4D) agenda in Africa (IFPRI)
3.1: Enhanced knowledge about agricultural development pathways that lead to better decisions for climate mitigation, poverty alleviation, food security and environmental heath, used by national agencies in at least 20 countries
Vietnam, Kenya, Colombia, and Peru develop plans for low emissions development or NAMAs
Local governments in Kenya and Uganda integrate results from CCAFS EcoAgriculture collaboration to plan local management of carbon projects
IFPRI research and outreach contributes to the definition of the GHG emission reduction commitments to be included in Colombia’s iNDC
CIMMYT’s “nutrient expert” tool used by agriculture development officers, extension experts and farmers to reduce N2O emissions in CSVs (Haryana, India)
3.2: Improved knowledge about incentives and institutional arrangements for mitigation practices by resource-poor smallholders used by farmers, (including farmers’ organizations), project developers and policy makers in at least 12 countries
Analysis of incentives and gender benefits in conservation agriculture in wheat-systems informs Haryana State extension strategies (CIMMYT)
CSA approaches to closing yield gaps in maize/wheat informs policy makers of incentives for nitrogen efficiency in Sub-Saharan Africa and India (CIMMYT)
Participatory improvement of carbon project builds capacities among farmers, local government and
CCAFS ANNUAL REPORT 2014 Page | 14
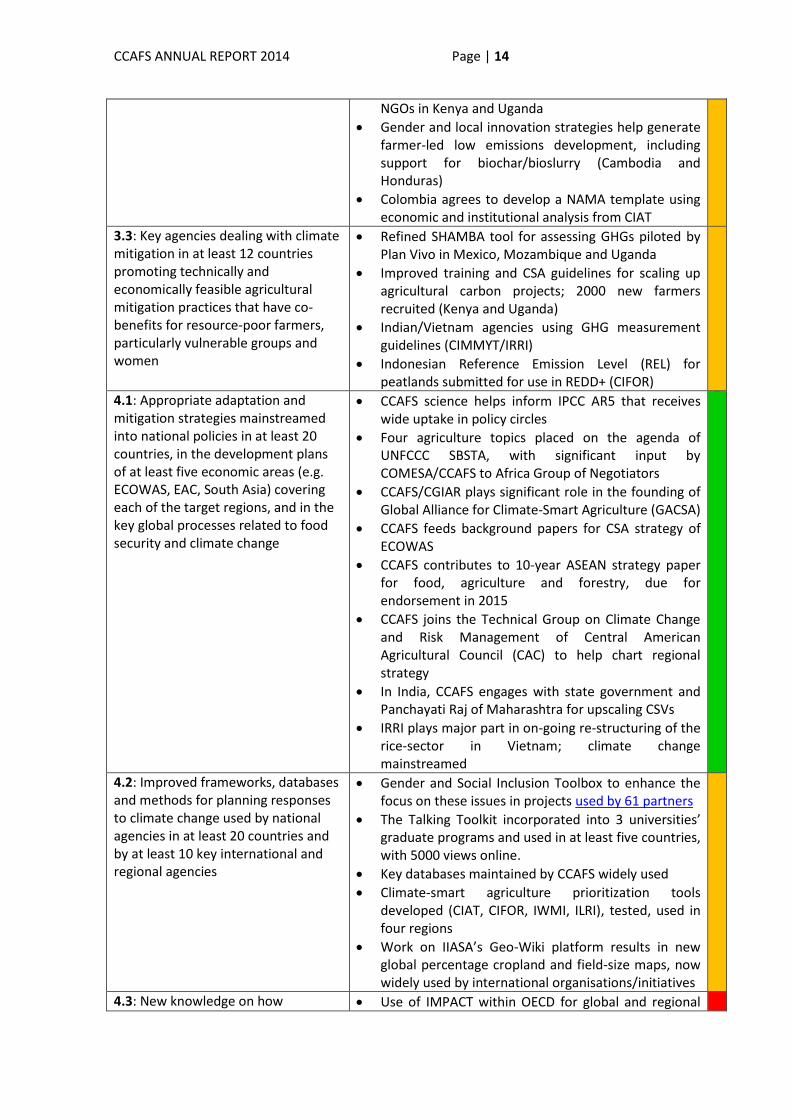
NGOs in Kenya and Uganda
Gender and local innovation strategies help generate farmer-led low emissions development, including support for biochar/bioslurry (Cambodia and Honduras)
Colombia agrees to develop a NAMA template using economic and institutional analysis from CIAT
3.3: Key agencies dealing with climate mitigation in at least 12 countries promoting technically and economically feasible agricultural mitigation practices that have co-benefits for resource-poor farmers, particularly vulnerable groups and women
Refined SHAMBA tool for assessing GHGs piloted by Plan Vivo in Mexico, Mozambique and Uganda
Improved training and CSA guidelines for scaling up agricultural carbon projects; 2000 new farmers recruited (Kenya and Uganda)
Indian/Vietnam agencies using GHG measurement guidelines (CIMMYT/IRRI)
Indonesian Reference Emission Level (REL) for peatlands submitted for use in REDD+ (CIFOR)
4.1: Appropriate adaptation and mitigation strategies mainstreamed into national policies in at least 20 countries, in the development plans of at least five economic areas (e.g. ECOWAS, EAC, South Asia) covering each of the target regions, and in the key global processes related to food security and climate change
CCAFS science helps inform IPCC AR5 that receives wide uptake in policy circles
Four agriculture topics placed on the agenda of UNFCCC SBSTA, with significant input by COMESA/CCAFS to Africa Group of Negotiators
CCAFS/CGIAR plays significant role in the founding of Global Alliance for Climate-Smart Agriculture (GACSA)
CCAFS feeds background papers for CSA strategy of ECOWAS
CCAFS contributes to 10-year ASEAN strategy paper for food, agriculture and forestry, due for endorsement in 2015
CCAFS joins the Technical Group on Climate Change and Risk Management of Central American Agricultural Council (CAC) to help chart regional strategy
In India, CCAFS engages with state government and Panchayati Raj of Maharashtra for upscaling CSVs
IRRI plays major part in on-going re-structuring of the rice-sector in Vietnam; climate change mainstreamed
4.2: Improved frameworks, databases and methods for planning responses to climate change used by national agencies in at least 20 countries and by at least 10 key international and regional agencies
Gender and Social Inclusion Toolbox to enhance the focus on these issues in projects used by 61 partners
The Talking Toolkit incorporated into 3 universities’ graduate programs and used in at least five countries, with 5000 views online.
Key databases maintained by CCAFS widely used
Climate-smart agriculture prioritization tools developed (CIAT, CIFOR, IWMI, ILRI), tested, used in four regions
Work on IIASA’s Geo-Wiki platform results in new global percentage cropland and field-size maps, now widely used by international organisations/initiatives
4.3: New knowledge on how Use of IMPACT within OECD for global and regional
CCAFS ANNUAL REPORT 2014 Page | 15
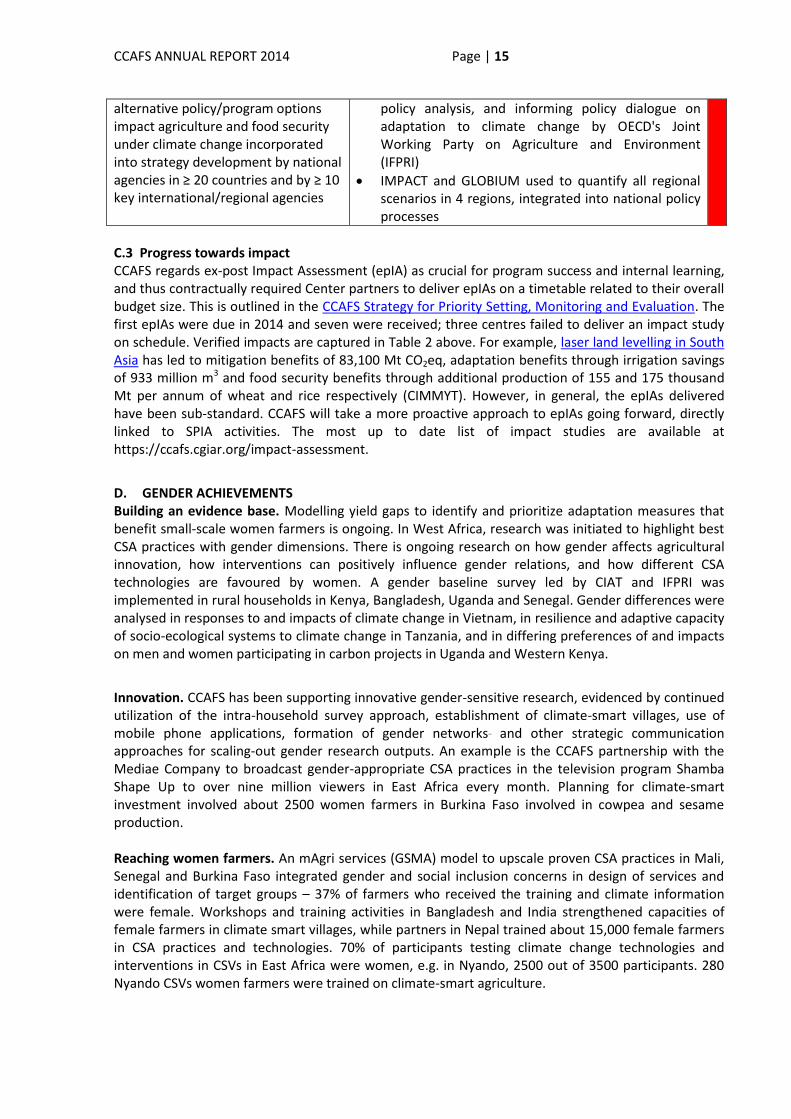
alternative policy/program options impact agriculture and food security under climate change incorporated into strategy development by national agencies in ≥ 20 countries and by ≥ 10 key international/regional agencies
policy analysis, and informing policy dialogue on adaptation to climate change by OECD's Joint Working Party on Agriculture and Environment (IFPRI)
IMPACT and GLOBIUM used to quantify all regional scenarios in 4 regions, integrated into national policy processes
C.3 Progress towards impact CCAFS regards ex-post Impact Assessment (epIA) as crucial for program success and internal learning, and thus contractually required Center partners to deliver epIAs on a timetable related to their overall budget size. This is outlined in the CCAFS Strategy for Priority Setting, Monitoring and Evaluation. The first epIAs were due in 2014 and seven were received; three centres failed to deliver an impact study on schedule. Verified impacts are captured in Table 2 above. For example, laser land levelling in South Asia has led to mitigation benefits of 83,100 Mt CO2eq, adaptation benefits through irrigation savings of 933 million m3 and food security benefits through additional production of 155 and 175 thousand Mt per annum of wheat and rice respectively (CIMMYT). However, in general, the epIAs delivered have been sub-standard. CCAFS will take a more proactive approach to epIAs going forward, directly linked to SPIA activities. The most up to date list of impact studies are available at https://ccafs.cgiar.org/impact-assessment.
D. GENDER ACHIEVEMENTS Building an evidence base. Modelling yield gaps to identify and prioritize adaptation measures that benefit small-scale women farmers is ongoing. In West Africa, research was initiated to highlight best CSA practices with gender dimensions. There is ongoing research on how gender affects agricultural innovation, how interventions can positively influence gender relations, and how different CSA technologies are favoured by women. A gender baseline survey led by CIAT and IFPRI was implemented in rural households in Kenya, Bangladesh, Uganda and Senegal. Gender differences were analysed in responses to and impacts of climate change in Vietnam, in resilience and adaptive capacity of socio-ecological systems to climate change in Tanzania, and in differing preferences of and impacts on men and women participating in carbon projects in Uganda and Western Kenya.
Innovation. CCAFS has been supporting innovative gender-sensitive research, evidenced by continued utilization of the intra-household survey approach, establishment of climate-smart villages, use of mobile phone applications, formation of gender networks_ and other strategic communication approaches for scaling-out gender research outputs. An example is the CCAFS partnership with the Mediae Company to broadcast gender-appropriate CSA practices in the television program Shamba Shape Up to over nine million viewers in East Africa every month. Planning for climate-smart investment involved about 2500 women farmers in Burkina Faso involved in cowpea and sesame production. Reaching women farmers. An mAgri services (GSMA) model to upscale proven CSA practices in Mali, Senegal and Burkina Faso integrated gender and social inclusion concerns in design of services and identification of target groups – 37% of farmers who received the training and climate information were female. Workshops and training activities in Bangladesh and India strengthened capacities of female farmers in climate smart villages, while partners in Nepal trained about 15,000 female farmers in CSA practices and technologies. 70% of participants testing climate change technologies and interventions in CSVs in East Africa were women, e.g. in Nyando, 2500 out of 3500 participants. 280 Nyando CSVs women farmers were trained on climate-smart agriculture.
CCAFS ANNUAL REPORT 2014 Page | 16
Gender and climate change knowledge. Multiple gender analysis toolkits were developed and launched using participatory approaches and are enjoying wide viewership/readership. Most notable is the freely available and much cited CCAFS/CARE/ICRAF Gender and Inclusion Toolbox, which supports partners in taking a gender transformative approach to gender and climate change research and development. Components of the toolbox have been integrated into 5 organizations (ICRAF, FTA, SIA, CARE, Emory University) and prompted gender action-planning across CSV sites in CCAFS Southeast Asia. Country teams and regional partners West Africa, Southeast Asia and Latin
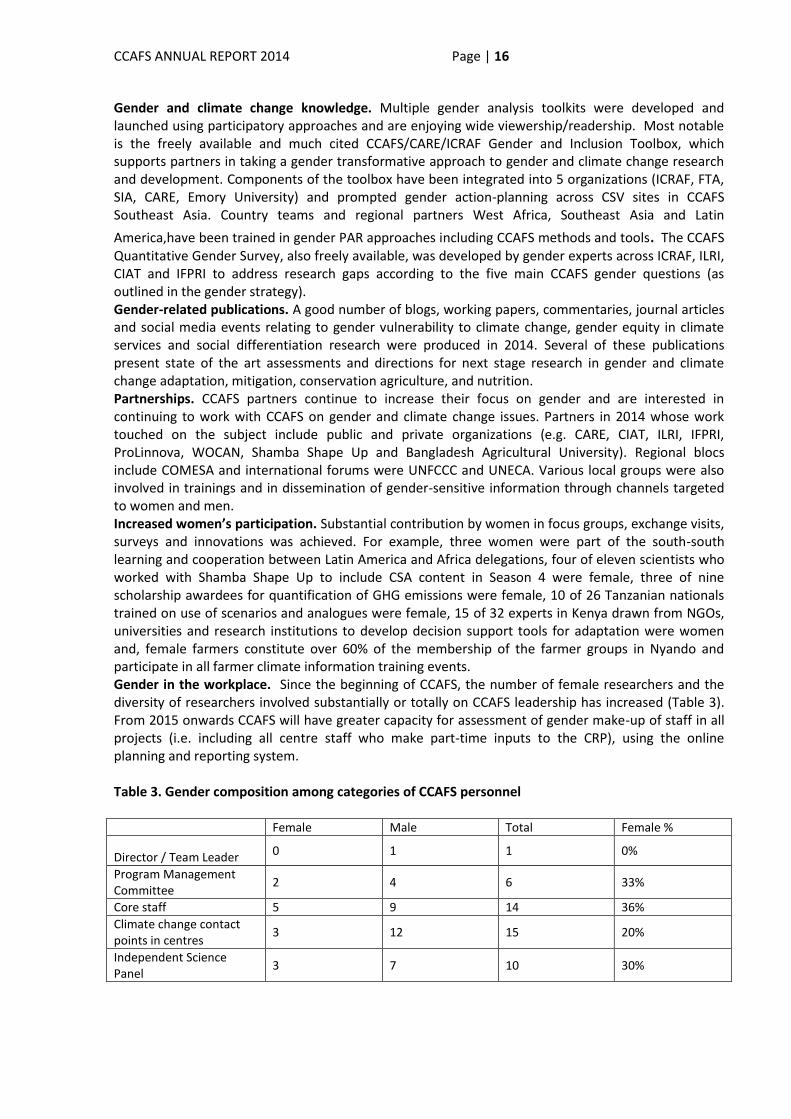
America,have been trained in gender PAR approaches including CCAFS methods and tools. The CCAFS Quantitative Gender Survey, also freely available, was developed by gender experts across ICRAF, ILRI, CIAT and IFPRI to address research gaps according to the five main CCAFS gender questions (as outlined in the gender strategy). Gender-related publications. A good number of blogs, working papers, commentaries, journal articles and social media events relating to gender vulnerability to climate change, gender equity in climate services and social differentiation research were produced in 2014. Several of these publications present state of the art assessments and directions for next stage research in gender and climate change adaptation, mitigation, conservation agriculture, and nutrition. Partnerships. CCAFS partners continue to increase their focus on gender and are interested in continuing to work with CCAFS on gender and climate change issues. Partners in 2014 whose work touched on the subject include public and private organizations (e.g. CARE, CIAT, ILRI, IFPRI, ProLinnova, WOCAN, Shamba Shape Up and Bangladesh Agricultural University). Regional blocs include COMESA and international forums were UNFCCC and UNECA. Various local groups were also involved in trainings and in dissemination of gender-sensitive information through channels targeted to women and men. Increased women’s participation. Substantial contribution by women in focus groups, exchange visits, surveys and innovations was achieved. For example, three women were part of the south-south learning and cooperation between Latin America and Africa delegations, four of eleven scientists who worked with Shamba Shape Up to include CSA content in Season 4 were female, three of nine scholarship awardees for quantification of GHG emissions were female, 10 of 26 Tanzanian nationals trained on use of scenarios and analogues were female, 15 of 32 experts in Kenya drawn from NGOs, universities and research institutions to develop decision support tools for adaptation were women and, female farmers constitute over 60% of the membership of the farmer groups in Nyando and participate in all farmer climate information training events. Gender in the workplace. Since the beginning of CCAFS, the number of female researchers and the diversity of researchers involved substantially or totally on CCAFS leadership has increased (Table 3). From 2015 onwards CCAFS will have greater capacity for assessment of gender make-up of staff in all projects (i.e. including all centre staff who make part-time inputs to the CRP), using the online planning and reporting system. Table 3. Gender composition among categories of CCAFS personnel Female Male Total Female %
Director / Team Leader 0 1 1 0%
Program Management Committee
2 4 6 33%
Core staff 5 9 14 36%
Climate change contact points in centres
3 12 15 20%
Independent Science Panel
3 7 10 30%
CCAFS ANNUAL REPORT 2014 Page | 17
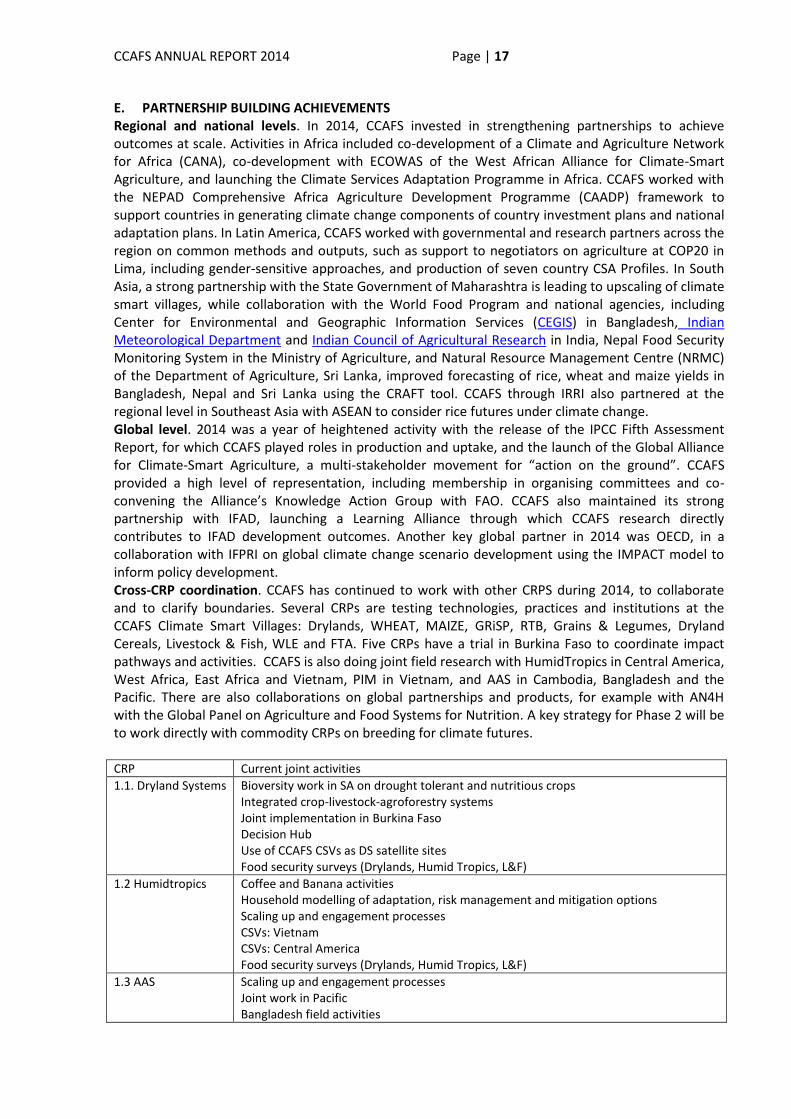
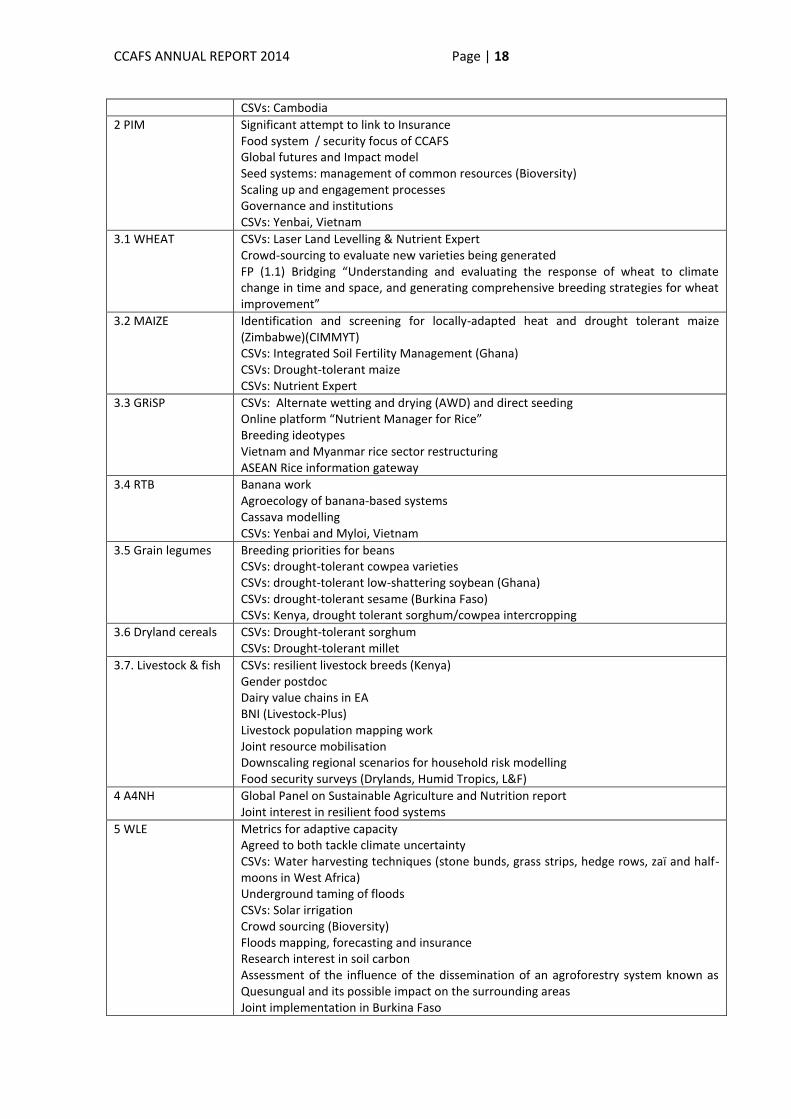
E. PARTNERSHIP BUILDING ACHIEVEMENTS Regional and national levels. In 2014, CCAFS invested in strengthening partnerships to achieve outcomes at scale. Activities in Africa included co-development of a Climate and Agriculture Network for Africa (CANA), co-development with ECOWAS of the West African Alliance for Climate-Smart Agriculture, and launching the Climate Services Adaptation Programme in Africa. CCAFS worked with the NEPAD Comprehensive Africa Agriculture Development Programme (CAADP) framework to support countries in generating climate change components of country investment plans and national adaptation plans. In Latin America, CCAFS worked with governmental and research partners across the region on common methods and outputs, such as support to negotiators on agriculture at COP20 in Lima, including gender-sensitive approaches, and production of seven country CSA Profiles. In South Asia, a strong partnership with the State Government of Maharashtra is leading to upscaling of climate smart villages, while collaboration with the World Food Program and national agencies, including Center for Environmental and Geographic Information Services (CEGIS) in Bangladesh, Indian Meteorological Department and Indian Council of Agricultural Research in India, Nepal Food Security Monitoring System in the Ministry of Agriculture, and Natural Resource Management Centre (NRMC) of the Department of Agriculture, Sri Lanka, improved forecasting of rice, wheat and maize yields in Bangladesh, Nepal and Sri Lanka using the CRAFT tool. CCAFS through IRRI also partnered at the regional level in Southeast Asia with ASEAN to consider rice futures under climate change. Global level. 2014 was a year of heightened activity with the release of the IPCC Fifth Assessment Report, for which CCAFS played roles in production and uptake, and the launch of the Global Alliance for Climate-Smart Agriculture, a multi-stakeholder movement for “action on the ground”. CCAFS provided a high level of representation, including membership in organising committees and co-convening the Alliance’s Knowledge Action Group with FAO. CCAFS also maintained its strong partnership with IFAD, launching a Learning Alliance through which CCAFS research directly contributes to IFAD development outcomes. Another key global partner in 2014 was OECD, in a collaboration with IFPRI on global climate change scenario development using the IMPACT model to inform policy development. Cross-CRP coordination. CCAFS has continued to work with other CRPS during 2014, to collaborate and to clarify boundaries. Several CRPs are testing technologies, practices and institutions at the CCAFS Climate Smart Villages: Drylands, WHEAT, MAIZE, GRiSP, RTB, Grains & Legumes, Dryland Cereals, Livestock & Fish, WLE and FTA. Five CRPs have a trial in Burkina Faso to coordinate impact pathways and activities. CCAFS is also doing joint field research with HumidTropics in Central America, West Africa, East Africa and Vietnam, PIM in Vietnam, and AAS in Cambodia, Bangladesh and the Pacific. There are also collaborations on global partnerships and products, for example with AN4H with the Global Panel on Agriculture and Food Systems for Nutrition. A key strategy for Phase 2 will be to work directly with commodity CRPs on breeding for climate futures. CRP Current joint activities
1.1. Dryland Systems Bioversity work in SA on drought tolerant and nutritious crops Integrated crop-livestock-agroforestry systems Joint implementation in Burkina Faso Decision Hub Use of CCAFS CSVs as DS satellite sites Food security surveys (Drylands, Humid Tropics, L&F)
1.2 Humidtropics Coffee and Banana activities Household modelling of adaptation, risk management and mitigation options Scaling up and engagement processes CSVs: Vietnam CSVs: Central America Food security surveys (Drylands, Humid Tropics, L&F)
1.3 AAS Scaling up and engagement processes Joint work in Pacific Bangladesh field activities
CCAFS ANNUAL REPORT 2014 Page | 18
CSVs: Cambodia
2 PIM Significant attempt to link to Insurance Food system / security focus of CCAFS Global futures and Impact model Seed systems: management of common resources (Bioversity) Scaling up and engagement processes Governance and institutions CSVs: Yenbai, Vietnam
3.1 WHEAT CSVs: Laser Land Levelling & Nutrient Expert Crowd-sourcing to evaluate new varieties being generated FP (1.1) Bridging “Understanding and evaluating the response of wheat to climate change in time and space, and generating comprehensive breeding strategies for wheat improvement”
3.2 MAIZE Identification and screening for locally-adapted heat and drought tolerant maize (Zimbabwe)(CIMMYT) CSVs: Integrated Soil Fertility Management (Ghana) CSVs: Drought-tolerant maize CSVs: Nutrient Expert
3.3 GRiSP CSVs: Alternate wetting and drying (AWD) and direct seeding Online platform “Nutrient Manager for Rice” Breeding ideotypes Vietnam and Myanmar rice sector restructuring ASEAN Rice information gateway
3.4 RTB Banana work Agroecology of banana-based systems Cassava modelling CSVs: Yenbai and Myloi, Vietnam
3.5 Grain legumes Breeding priorities for beans CSVs: drought-tolerant cowpea varieties CSVs: drought-tolerant low-shattering soybean (Ghana) CSVs: drought-tolerant sesame (Burkina Faso) CSVs: Kenya, drought tolerant sorghum/cowpea intercropping
3.6 Dryland cereals CSVs: Drought-tolerant sorghum CSVs: Drought-tolerant millet
3.7. Livestock & fish CSVs: resilient livestock breeds (Kenya) Gender postdoc Dairy value chains in EA BNI (Livestock-Plus) Livestock population mapping work Joint resource mobilisation Downscaling regional scenarios for household risk modelling Food security surveys (Drylands, Humid Tropics, L&F)
4 A4NH Global Panel on Sustainable Agriculture and Nutrition report Joint interest in resilient food systems
5 WLE Metrics for adaptive capacity Agreed to both tackle climate uncertainty CSVs: Water harvesting techniques (stone bunds, grass strips, hedge rows, zaï and half-moons in West Africa) Underground taming of floods CSVs: Solar irrigation Crowd sourcing (Bioversity) Floods mapping, forecasting and insurance Research interest in soil carbon Assessment of the influence of the dissemination of an agroforestry system known as Quesungual and its possible impact on the surrounding areas Joint implementation in Burkina Faso
CCAFS ANNUAL REPORT 2014 Page | 19
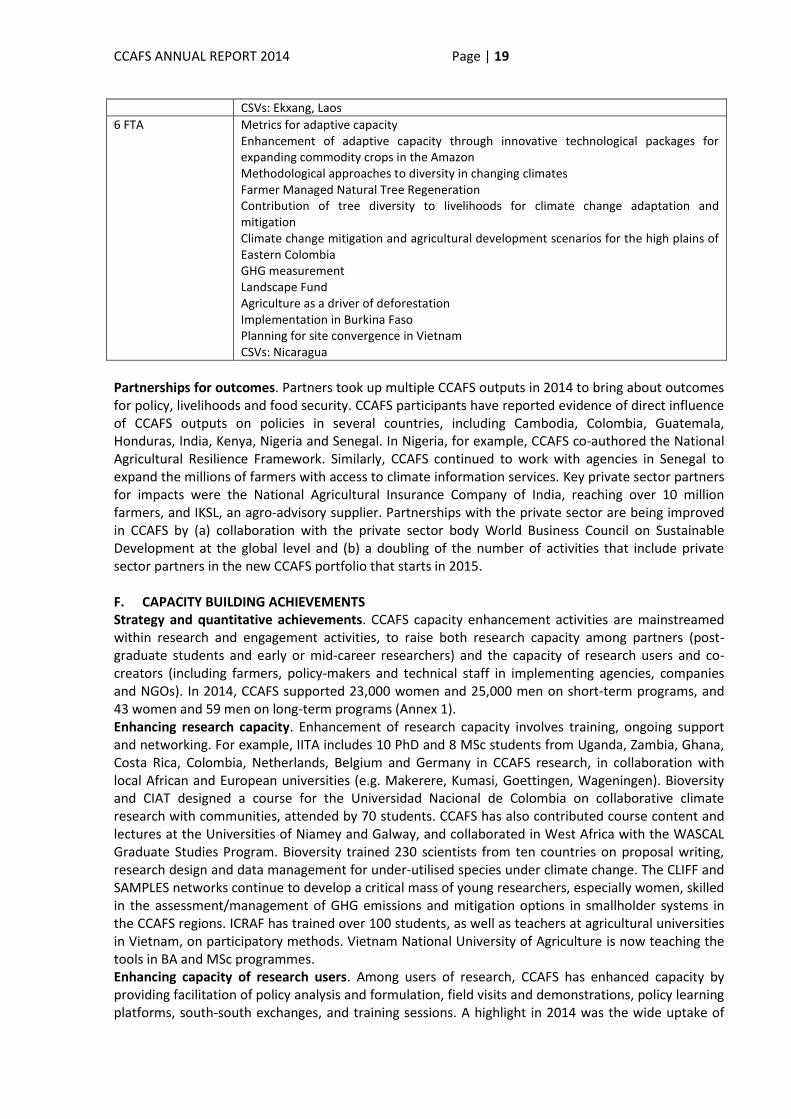
CSVs: Ekxang, Laos
6 FTA Metrics for adaptive capacity Enhancement of adaptive capacity through innovative technological packages for expanding commodity crops in the Amazon Methodological approaches to diversity in changing climates Farmer Managed Natural Tree Regeneration Contribution of tree diversity to livelihoods for climate change adaptation and mitigation Climate change mitigation and agricultural development scenarios for the high plains of Eastern Colombia GHG measurement Landscape Fund Agriculture as a driver of deforestation Implementation in Burkina Faso Planning for site convergence in Vietnam CSVs: Nicaragua
Partnerships for outcomes. Partners took up multiple CCAFS outputs in 2014 to bring about outcomes for policy, livelihoods and food security. CCAFS participants have reported evidence of direct influence of CCAFS outputs on policies in several countries, including Cambodia, Colombia, Guatemala, Honduras, India, Kenya, Nigeria and Senegal. In Nigeria, for example, CCAFS co-authored the National Agricultural Resilience Framework. Similarly, CCAFS continued to work with agencies in Senegal to expand the millions of farmers with access to climate information services. Key private sector partners for impacts were the National Agricultural Insurance Company of India, reaching over 10 million farmers, and IKSL, an agro-advisory supplier. Partnerships with the private sector are being improved in CCAFS by (a) collaboration with the private sector body World Business Council on Sustainable Development at the global level and (b) a doubling of the number of activities that include private sector partners in the new CCAFS portfolio that starts in 2015. F. CAPACITY BUILDING ACHIEVEMENTS Strategy and quantitative achievements. CCAFS capacity enhancement activities are mainstreamed within research and engagement activities, to raise both research capacity among partners (post-graduate students and early or mid-career researchers) and the capacity of research users and co-creators (including farmers, policy-makers and technical staff in implementing agencies, companies and NGOs). In 2014, CCAFS supported 23,000 women and 25,000 men on short-term programs, and 43 women and 59 men on long-term programs (Annex 1). Enhancing research capacity. Enhancement of research capacity involves training, ongoing support and networking. For example, IITA includes 10 PhD and 8 MSc students from Uganda, Zambia, Ghana, Costa Rica, Colombia, Netherlands, Belgium and Germany in CCAFS research, in collaboration with local African and European universities (e.g. Makerere, Kumasi, Goettingen, Wageningen). Bioversity and CIAT designed a course for the Universidad Nacional de Colombia on collaborative climate research with communities, attended by 70 students. CCAFS has also contributed course content and lectures at the Universities of Niamey and Galway, and collaborated in West Africa with the WASCAL Graduate Studies Program. Bioversity trained 230 scientists from ten countries on proposal writing, research design and data management for under-utilised species under climate change. The CLIFF and SAMPLES networks continue to develop a critical mass of young researchers, especially women, skilled in the assessment/management of GHG emissions and mitigation options in smallholder systems in the CCAFS regions. ICRAF has trained over 100 students, as well as teachers at agricultural universities in Vietnam, on participatory methods. Vietnam National University of Agriculture is now teaching the tools in BA and MSc programmes. Enhancing capacity of research users. Among users of research, CCAFS has enhanced capacity by providing facilitation of policy analysis and formulation, field visits and demonstrations, policy learning platforms, south-south exchanges, and training sessions. A highlight in 2014 was the wide uptake of
CCAFS ANNUAL REPORT 2014 Page | 20
CCAFS scenarios as a tool to raise policy capacity under climate change, for example as part of Cambodia’s Action Plan for Agriculture. Facilitation of cooperation between Latin America and Africa continued in 2014, with a Senegalese, Kenyan and Ghanaian delegation visiting Colombia, and institutions in Colombia and Honduras agreeing to replicate the Senegalese model of climate information services in multiple sites. CCAFS Climate Smart Villages (CSVs) grew as a focus for capacity development in all five regions; in South Asia, for example, CSA demonstration plots of rice (20 plots), maize (15 plots) and sugarcane (20 plots) were established and about 3000 farmers (50% of them women) were trained in CSA practices and technologies, spanning 67 CSVs. CIMMYT worked with 300 female and male farmers in Haryana and Bihar on a Farm Budgeting Booklet for Climate Smart Farmers. Similarly CIP worked with 1,175 households in Peru and Bolivia, with 48% female participation, to raise capacities for farm diversification as a response to climate change, with impressive increases in returns from quinoa, dairy and aquaculture. ILRI partnered with the Climate & Clean Air Coalition in Ethiopia not only to improve capacity for policy on manure management but also to train 200 extension workers and biogas technicians on improved techniques. Working with University of Reading, CCAFS also trained 75 agricultural extension officers in Tanzania to effectively communicate climate services with farmers, and meteorologists and agro-meteorologists in Tanzania, Ghana and Senegal to analyze historical climate data and to master new statistical techniques. G. RISK MANAGEMENT In the 2014 update of the CCAFS risk catalogue, the top three risks are: (1) Weak commitment or capacity of Centers to deliver science to CCAFS given the increased number of CRPs (i.e. more fully functioning) and the incorporation of climate change issues in the other CRPs; (2) Centers not allocating bilateral funds to CCAFS; (3) Funding stability from year to year and going into Phase 2. (1) For risk (1), CCAFS will continue to put effort into stimulating interest in CCAFS science and clarifying the boundaries amongst CRPs. Clarifying boundaries will require strong leadership from the Consortium Office. (2) The major overhaul of CCAFS has resulted in a more strategic program, but that has come at the expense of losing some less strategic bilateral projects; the rigorous planning and reporting mechanisms in CCAFS come with costs, so some Centers opt to keep bilateral projects out of CCAFS. To mitigate this risk, CCAFS will reduce the reporting needs (to CCAFS) around bilateral projects and include a variable related to bilateral budgets in the performance-based bonus allocation. (3) CCAFS has put in place a highly strategic program, based on impact pathways with associated targets, through a series of planning meetings (also with external partners) but this planning is undermined by budget cuts during the implementation year and into successive years. CCAFS will need to reduce ambitions (i.e. cut outcome targets, outputs and projects) and to work with key investors to fill budget gaps. H. LESSONS LEARNED Having outcome targets and doing annual assessments has led to a strong outcome focus and much internal learning and re-adjustments, with any major shifts being discussed and approved by the governance structures. Slow progress on three of the Objectives is being addressed as follows. Objective 1.2 (developing breeding strategies for climate change) was implemented through Center activities, but apart from some isolated successes (e.g. CIMMYT with maize; CIAT with cassava) this approach has not worked. In Phase 2 the intention is to work directly with commodity CRPs. Objective 2.2 (managing climate risk in the whole food system) is not an area of strength of the CGIAR, but is critically important for urban and rural food security. There have been a few very important achievements; CCAFS has put in place mechanisms to improve outcomes. Objective 4.3 (refining frameworks for policy analysis) was narrowly defined by the then sub-theme leader, leading to a focus on the IMPACT model. As a result, policy research was up-scaled elsewhere and a decision taken to do away with the sub-Theme in the Extension Phase. Some work with IMPACT will continue, to answer climate-relevant policy questions at the global level, but this will be balanced by broader analysis of policies and governance with NARS and Future Earth partners. In Phase 1, there was a sub-theme of
CCAFS ANNUAL REPORT 2014 Page | 21
Linking Knowledge and Action. This is now mainstreamed as the basic approach of all themes and regions; thus the sub-Theme has been phased out and replaced by a Gender and Social Inclusion Leader to accelerate progress in this cross-cutting area. A more proactive approach to epIAs will be taken going forward linked to SPIA activities, as management has not been satisfied by partner performance in this area. I. CRP FINANCIAL REPORT
There are 7 financial reports:
1. Report L101 – CCAFS CRP7 - Cumulative Financial Summary 2. Report L106 – CCAFS CRP 7-Annual Funding Summary 3. Report L111 – CCAFS CRP 7- Annual Financial Summary 4. Report L121 – CCAFS CRP 7- Expenditure by natural classification 5. Report L131 – CCAFS CRP 7 -Themes Report 6. Report L136 – CCAFS CRP 7- Annual financial summary of gender and Themes 7. Report L211 – CCAFS CRP 7-Partnerships Report
The above listed reports are attached as Appendix to this report.
CCAFS ANNUAL REPORT 2014 Page | 22
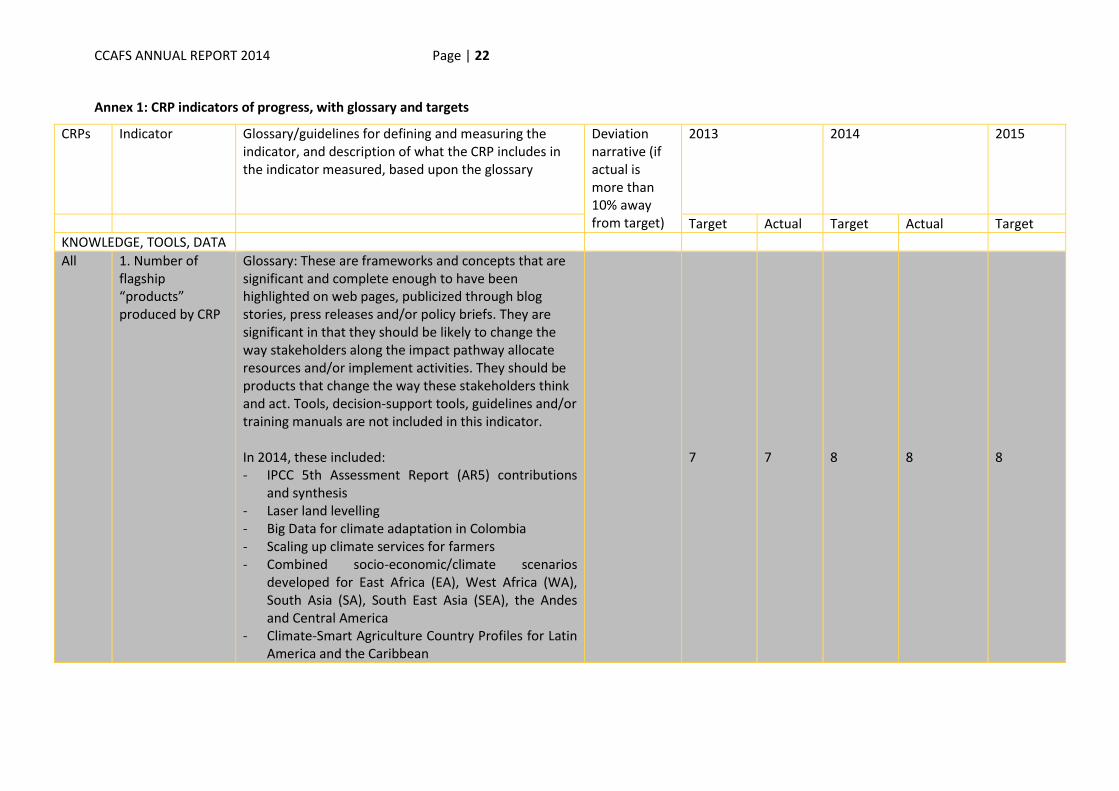
Annex 1: CRP indicators of progress, with glossary and targets
CRPs Indicator Glossary/guidelines for defining and measuring the indicator, and description of what the CRP includes in the indicator measured, based upon the glossary
Deviation narrative (if actual is more than 10% away from target)
2013 2014 2015
Target Actual Target Actual Target
KNOWLEDGE, TOOLS, DATA
All 1. Number of flagship “products” produced by CRP
Glossary: These are frameworks and concepts that are significant and complete enough to have been highlighted on web pages, publicized through blog stories, press releases and/or policy briefs. They are significant in that they should be likely to change the way stakeholders along the impact pathway allocate resources and/or implement activities. They should be products that change the way these stakeholders think and act. Tools, decision-support tools, guidelines and/or training manuals are not included in this indicator. In 2014, these included: - IPCC 5th Assessment Report (AR5) contributions
and synthesis - Laser land levelling - Big Data for climate adaptation in Colombia - Scaling up climate services for farmers - Combined socio-economic/climate scenarios
developed for East Africa (EA), West Africa (WA), South Asia (SA), South East Asia (SEA), the Andes and Central America
- Climate-Smart Agriculture Country Profiles for Latin America and the Caribbean
7 7 8 8 8
CCAFS ANNUAL REPORT 2014 Page | 23
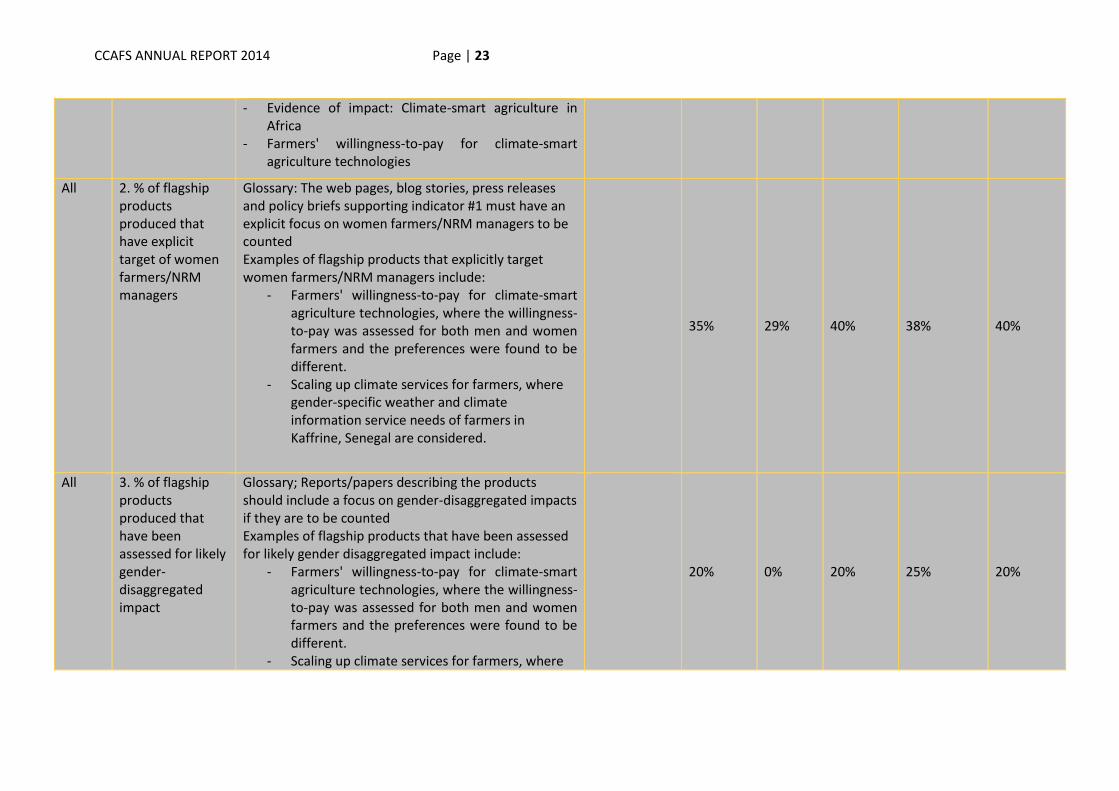
- Evidence of impact: Climate-smart agriculture in Africa
- Farmers' willingness-to-pay for climate-smart agriculture technologies
All 2. % of flagship products produced that have explicit target of women farmers/NRM managers
Glossary: The web pages, blog stories, press releases and policy briefs supporting indicator #1 must have an explicit focus on women farmers/NRM managers to be counted Examples of flagship products that explicitly target women farmers/NRM managers include:
- Farmers' willingness-to-pay for climate-smart agriculture technologies, where the willingness-to-pay was assessed for both men and women farmers and the preferences were found to be different.
- Scaling up climate services for farmers, where gender-specific weather and climate information service needs of farmers in Kaffrine, Senegal are considered.
35% 29% 40% 38% 40%
All 3. % of flagship products produced that have been assessed for likely gender-disaggregated impact
Glossary; Reports/papers describing the products should include a focus on gender-disaggregated impacts if they are to be counted Examples of flagship products that have been assessed for likely gender disaggregated impact include:
- Farmers' willingness-to-pay for climate-smart agriculture technologies, where the willingness-to-pay was assessed for both men and women farmers and the preferences were found to be different.
- Scaling up climate services for farmers, where
20% 0% 20% 25% 20%
CCAFS ANNUAL REPORT 2014 Page | 24
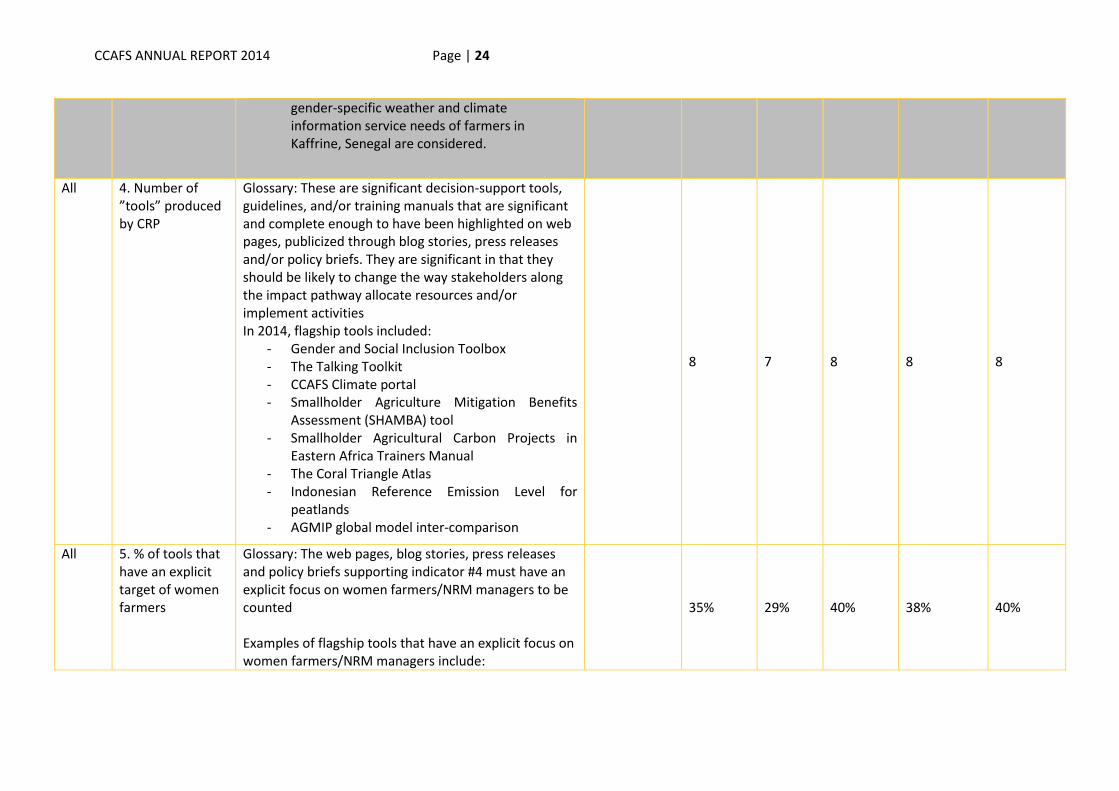
gender-specific weather and climate information service needs of farmers in Kaffrine, Senegal are considered.
All 4. Number of ”tools” produced by CRP
Glossary: These are significant decision-support tools, guidelines, and/or training manuals that are significant and complete enough to have been highlighted on web pages, publicized through blog stories, press releases and/or policy briefs. They are significant in that they should be likely to change the way stakeholders along the impact pathway allocate resources and/or implement activities In 2014, flagship tools included:
- Gender and Social Inclusion Toolbox - The Talking Toolkit - CCAFS Climate portal - Smallholder Agriculture Mitigation Benefits
Assessment (SHAMBA) tool - Smallholder Agricultural Carbon Projects in
Eastern Africa Trainers Manual - The Coral Triangle Atlas - Indonesian Reference Emission Level for
peatlands - AGMIP global model inter-comparison
8 7 8 8 8
All 5. % of tools that have an explicit target of women farmers
Glossary: The web pages, blog stories, press releases and policy briefs supporting indicator #4 must have an explicit focus on women farmers/NRM managers to be counted Examples of flagship tools that have an explicit focus on women farmers/NRM managers include:
35% 29% 40% 38% 40%
CCAFS ANNUAL REPORT 2014 Page | 25
- Gender and Social Inclusion Toolbox - The Talking Toolkit - Smallholder Agricultural Carbon Projects in Eastern
Africa Trainers Manual
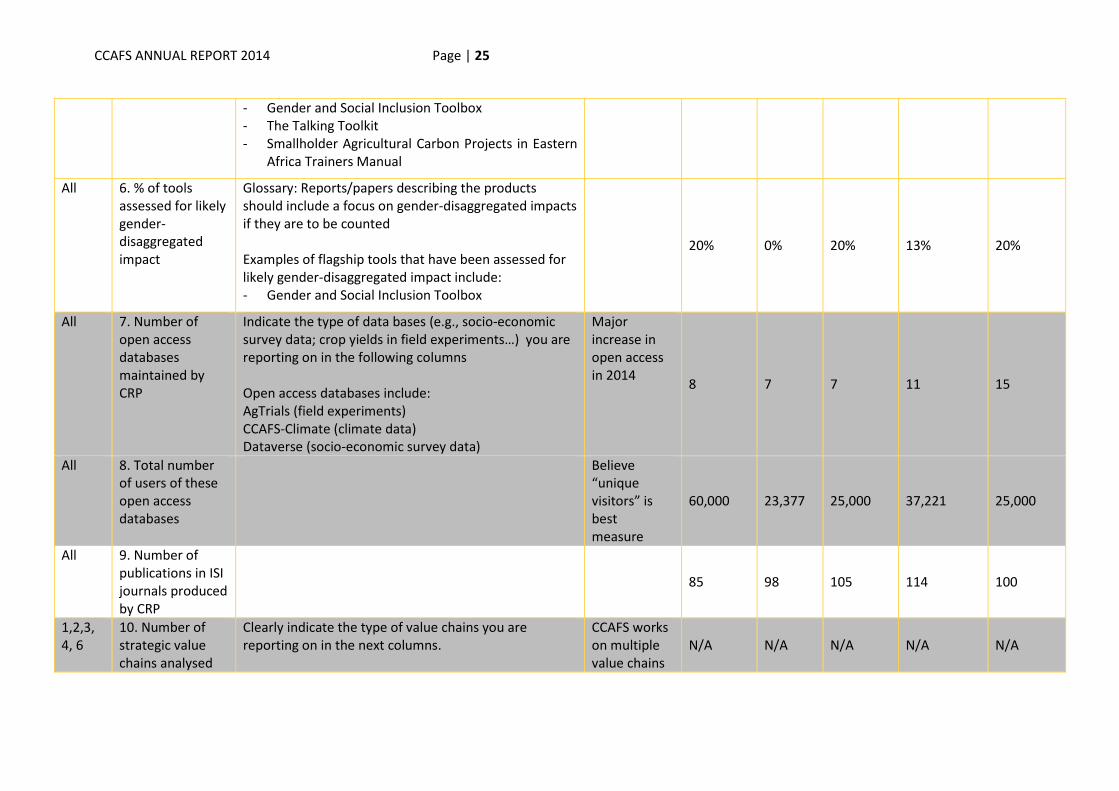
All 6. % of tools assessed for likely gender-disaggregated impact
Glossary: Reports/papers describing the products should include a focus on gender-disaggregated impacts if they are to be counted Examples of flagship tools that have been assessed for likely gender-disaggregated impact include: - Gender and Social Inclusion Toolbox
20% 0% 20% 13% 20%
All 7. Number of open access databases maintained by CRP
Indicate the type of data bases (e.g., socio-economic survey data; crop yields in field experiments…) you are reporting on in the following columns Open access databases include: AgTrials (field experiments) CCAFS-Climate (climate data) Dataverse (socio-economic survey data)
Major increase in open access in 2014
8 7 7 11 15
All 8. Total number of users of these open access databases
Believe “unique visitors” is best measure
60,000 23,377 25,000 37,221 25,000
All 9. Number of publications in ISI journals produced by CRP
85 98 105 114 100
1,2,3, 4, 6
10. Number of strategic value chains analysed
Clearly indicate the type of value chains you are reporting on in the next columns.
CCAFS works on multiple value chains
N/A N/A N/A N/A N/A
CCAFS ANNUAL REPORT 2014 Page | 26
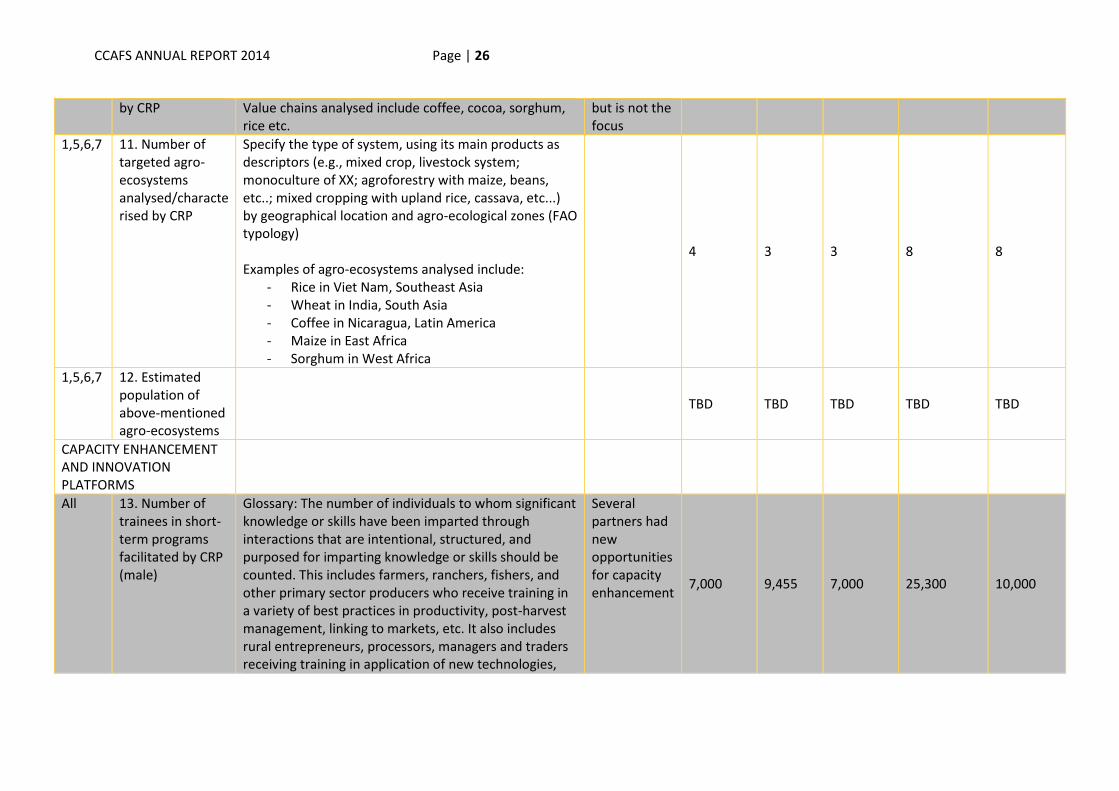
by CRP Value chains analysed include coffee, cocoa, sorghum, rice etc.
but is not the focus
1,5,6,7 11. Number of targeted agro-ecosystems analysed/characterised by CRP
Specify the type of system, using its main products as descriptors (e.g., mixed crop, livestock system; monoculture of XX; agroforestry with maize, beans, etc..; mixed cropping with upland rice, cassava, etc...) by geographical location and agro-ecological zones (FAO typology) Examples of agro-ecosystems analysed include:
- Rice in Viet Nam, Southeast Asia - Wheat in India, South Asia - Coffee in Nicaragua, Latin America - Maize in East Africa - Sorghum in West Africa
4 3 3 8 8
1,5,6,7 12. Estimated population of above-mentioned agro-ecosystems
TBD TBD TBD TBD TBD
CAPACITY ENHANCEMENT AND INNOVATION PLATFORMS
All 13. Number of trainees in short-term programs facilitated by CRP (male)
Glossary: The number of individuals to whom significant knowledge or skills have been imparted through interactions that are intentional, structured, and purposed for imparting knowledge or skills should be counted. This includes farmers, ranchers, fishers, and other primary sector producers who receive training in a variety of best practices in productivity, post-harvest management, linking to markets, etc. It also includes rural entrepreneurs, processors, managers and traders receiving training in application of new technologies,
Several partners had new opportunities for capacity enhancement
7,000 9,455 7,000 25,300 10,000
CCAFS ANNUAL REPORT 2014 Page | 27
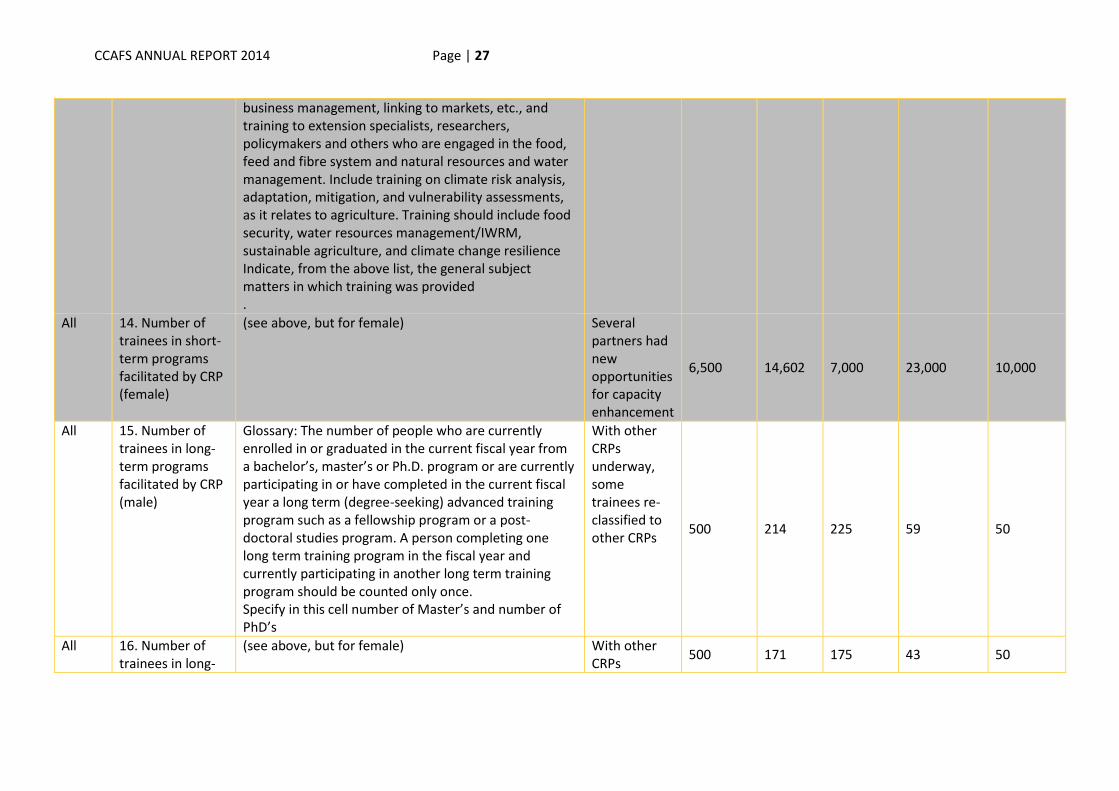
business management, linking to markets, etc., and training to extension specialists, researchers, policymakers and others who are engaged in the food, feed and fibre system and natural resources and water management. Include training on climate risk analysis, adaptation, mitigation, and vulnerability assessments, as it relates to agriculture. Training should include food security, water resources management/IWRM, sustainable agriculture, and climate change resilience Indicate, from the above list, the general subject matters in which training was provided .
All 14. Number of trainees in short-term programs facilitated by CRP (female)
(see above, but for female) Several partners had new opportunities for capacity enhancement
6,500 14,602 7,000 23,000 10,000
All 15. Number of trainees in long-term programs facilitated by CRP (male)
Glossary: The number of people who are currently enrolled in or graduated in the current fiscal year from a bachelor’s, master’s or Ph.D. program or are currently participating in or have completed in the current fiscal year a long term (degree-seeking) advanced training program such as a fellowship program or a post-doctoral studies program. A person completing one long term training program in the fiscal year and currently participating in another long term training program should be counted only once. Specify in this cell number of Master’s and number of PhD’s
With other CRPs underway, some trainees re-classified to other CRPs
500 214 225 59 50
All 16. Number of trainees in long-
(see above, but for female) With other CRPs
500 171 175 43 50
CCAFS ANNUAL REPORT 2014 Page | 28
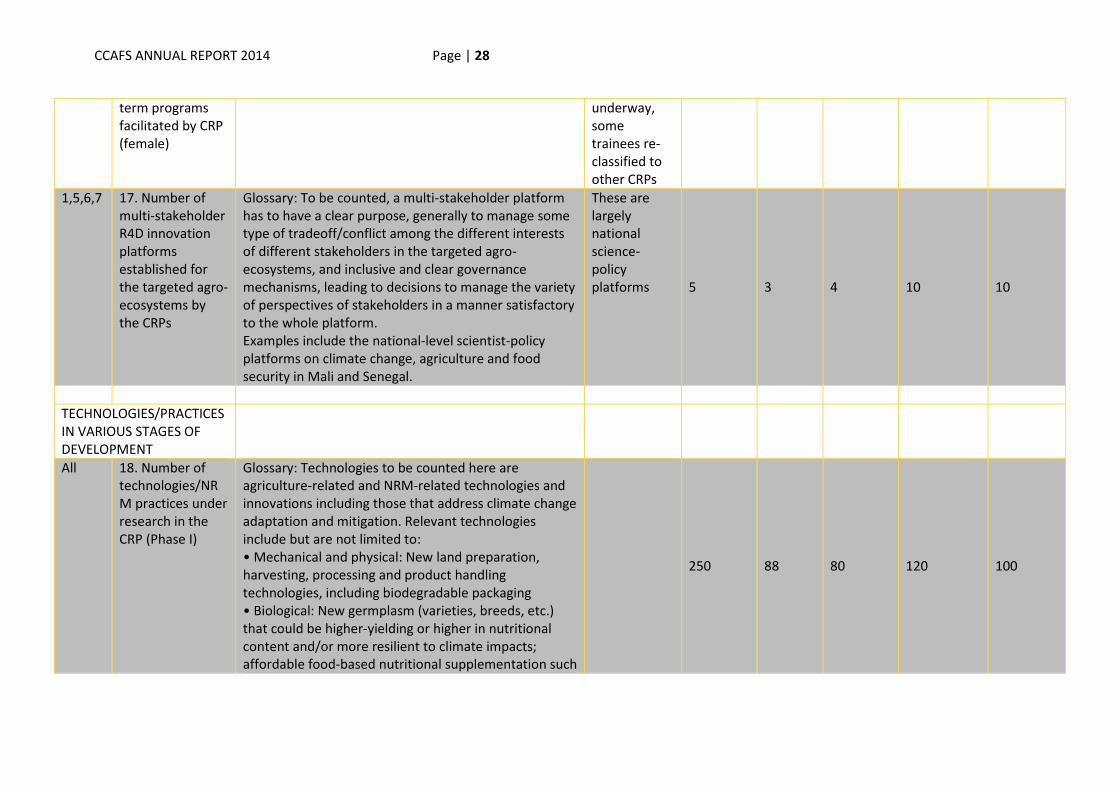
term programs facilitated by CRP (female)
underway, some trainees re-classified to other CRPs
1,5,6,7 17. Number of multi-stakeholder R4D innovation platforms established for the targeted agro-ecosystems by the CRPs
Glossary: To be counted, a multi-stakeholder platform has to have a clear purpose, generally to manage some type of tradeoff/conflict among the different interests of different stakeholders in the targeted agro-ecosystems, and inclusive and clear governance mechanisms, leading to decisions to manage the variety of perspectives of stakeholders in a manner satisfactory to the whole platform. Examples include the national-level scientist-policy platforms on climate change, agriculture and food security in Mali and Senegal.
These are largely national science-policy platforms 5 3 4 10 10
TECHNOLOGIES/PRACTICES IN VARIOUS STAGES OF DEVELOPMENT
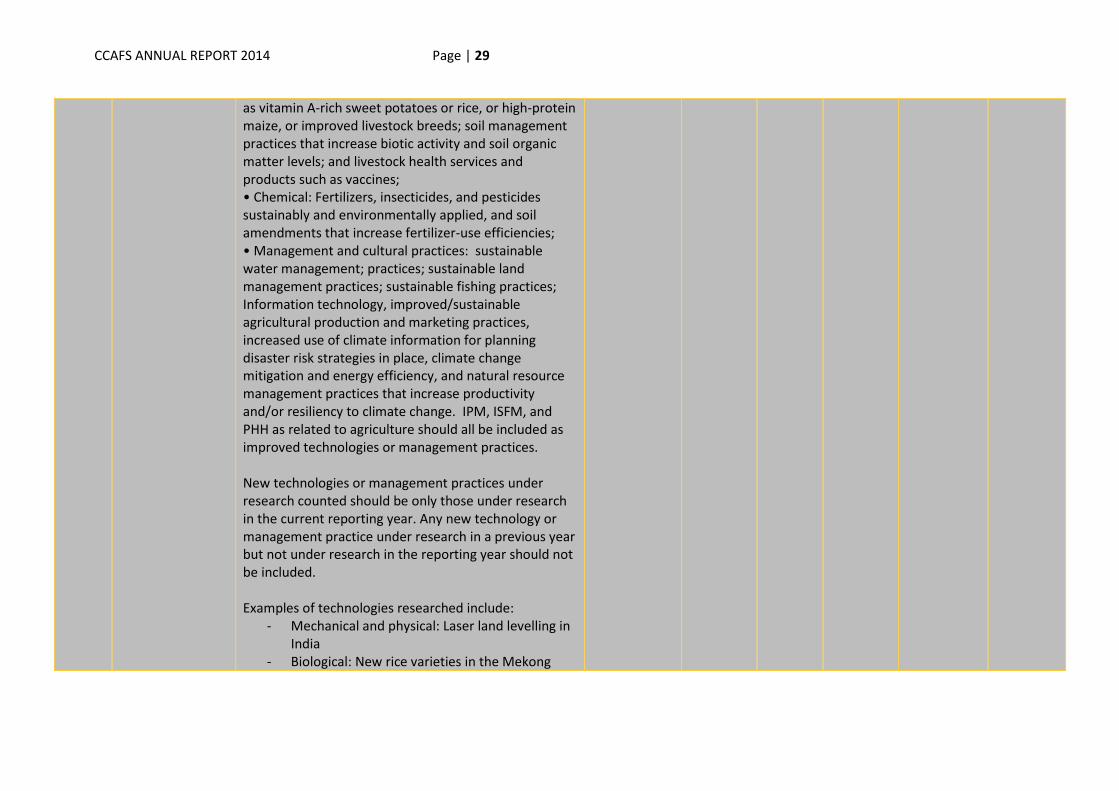
All 18. Number of technologies/NRM practices under research in the CRP (Phase I)
Glossary: Technologies to be counted here are agriculture-related and NRM-related technologies and innovations including those that address climate change adaptation and mitigation. Relevant technologies include but are not limited to: • Mechanical and physical: New land preparation, harvesting, processing and product handling technologies, including biodegradable packaging • Biological: New germplasm (varieties, breeds, etc.) that could be higher-yielding or higher in nutritional content and/or more resilient to climate impacts; affordable food-based nutritional supplementation such
250 88 80 120 100
CCAFS ANNUAL REPORT 2014 Page | 29
as vitamin A-rich sweet potatoes or rice, or high-protein maize, or improved livestock breeds; soil management practices that increase biotic activity and soil organic matter levels; and livestock health services and products such as vaccines; • Chemical: Fertilizers, insecticides, and pesticides sustainably and environmentally applied, and soil amendments that increase fertilizer-use efficiencies; • Management and cultural practices: sustainable water management; practices; sustainable land management practices; sustainable fishing practices; Information technology, improved/sustainable agricultural production and marketing practices, increased use of climate information for planning disaster risk strategies in place, climate change mitigation and energy efficiency, and natural resource management practices that increase productivity and/or resiliency to climate change. IPM, ISFM, and PHH as related to agriculture should all be included as improved technologies or management practices. New technologies or management practices under research counted should be only those under research in the current reporting year. Any new technology or management practice under research in a previous year but not under research in the reporting year should not be included. Examples of technologies researched include:
- Mechanical and physical: Laser land levelling in India
- Biological: New rice varieties in the Mekong
CCAFS ANNUAL REPORT 2014 Page | 30
delta - Chemical: Integrated Soil Fertility Management
in Africa - Management and cultural practices: Coffee
Banana Intercropping in Uganda
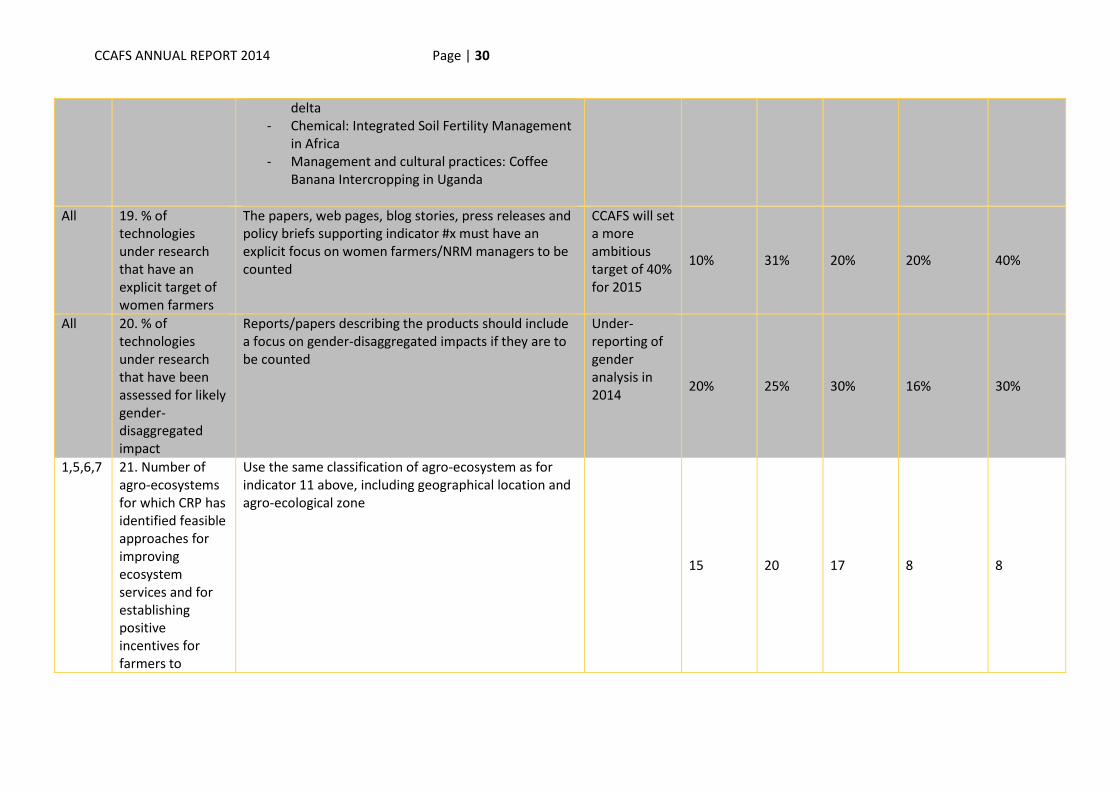
All 19. % of technologies under research that have an explicit target of women farmers
The papers, web pages, blog stories, press releases and policy briefs supporting indicator #x must have an explicit focus on women farmers/NRM managers to be counted
CCAFS will set a more ambitious target of 40% for 2015
10% 31% 20% 20% 40%
All 20. % of technologies under research that have been assessed for likely gender-disaggregated impact
Reports/papers describing the products should include a focus on gender-disaggregated impacts if they are to be counted
Under-reporting of gender analysis in 2014
20% 25% 30% 16% 30%
1,5,6,7 21. Number of agro-ecosystems for which CRP has identified feasible approaches for improving ecosystem services and for establishing positive incentives for farmers to
Use the same classification of agro-ecosystem as for indicator 11 above, including geographical location and agro-ecological zone
15 20 17 8 8
CCAFS ANNUAL REPORT 2014 Page | 31
improve ecosystem functions as per the CRP’s recommendations
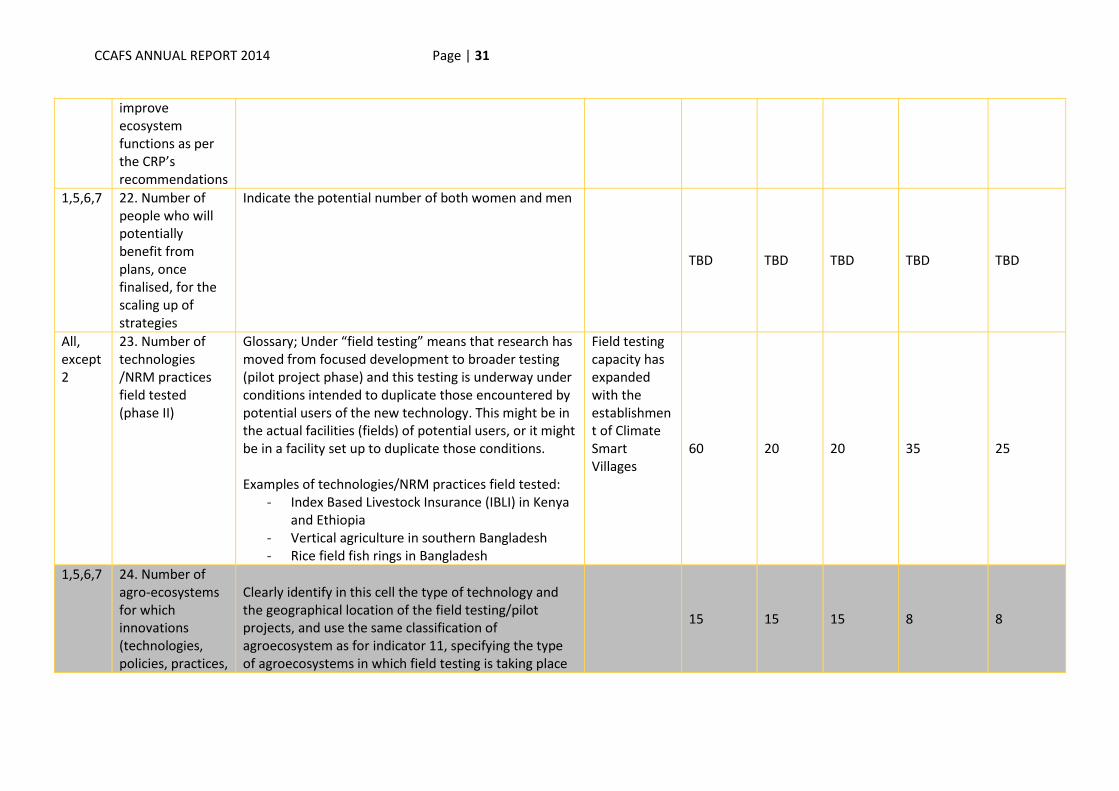
1,5,6,7 22. Number of people who will potentially benefit from plans, once finalised, for the scaling up of strategies
Indicate the potential number of both women and men
TBD TBD TBD TBD TBD
All, except 2
23. Number of technologies /NRM practices field tested (phase II)
Glossary; Under “field testing” means that research has moved from focused development to broader testing (pilot project phase) and this testing is underway under conditions intended to duplicate those encountered by potential users of the new technology. This might be in the actual facilities (fields) of potential users, or it might be in a facility set up to duplicate those conditions. Examples of technologies/NRM practices field tested:
- Index Based Livestock Insurance (IBLI) in Kenya and Ethiopia
- Vertical agriculture in southern Bangladesh - Rice field fish rings in Bangladesh
Field testing capacity has expanded with the establishment of Climate Smart Villages
60 20 20 35 25
1,5,6,7 24. Number of agro-ecosystems for which innovations (technologies, policies, practices,
Clearly identify in this cell the type of technology and the geographical location of the field testing/pilot projects, and use the same classification of agroecosystem as for indicator 11, specifying the type of agroecosystems in which field testing is taking place
15 15 15 8 8
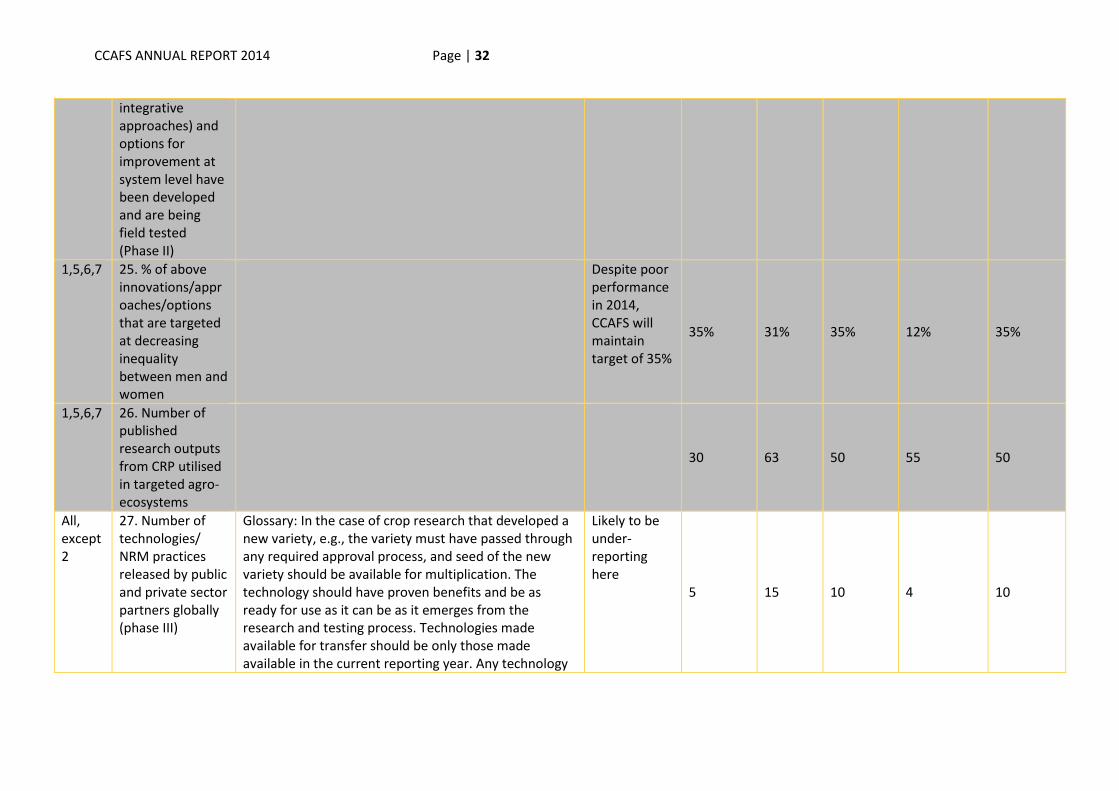
CCAFS ANNUAL REPORT 2014 Page | 32
integrative approaches) and options for improvement at system level have been developed and are being field tested (Phase II)
1,5,6,7 25. % of above innovations/approaches/options that are targeted at decreasing inequality between men and women
Despite poor performance in 2014, CCAFS will maintain target of 35%
35% 31% 35% 12% 35%
1,5,6,7 26. Number of published research outputs from CRP utilised in targeted agro-ecosystems
30 63 50 55 50
All, except 2
27. Number of technologies/ NRM practices released by public and private sector partners globally (phase III)
Glossary: In the case of crop research that developed a new variety, e.g., the variety must have passed through any required approval process, and seed of the new variety should be available for multiplication. The technology should have proven benefits and be as ready for use as it can be as it emerges from the research and testing process. Technologies made available for transfer should be only those made available in the current reporting year. Any technology
Likely to be under-reporting here
5 15 10 4 10
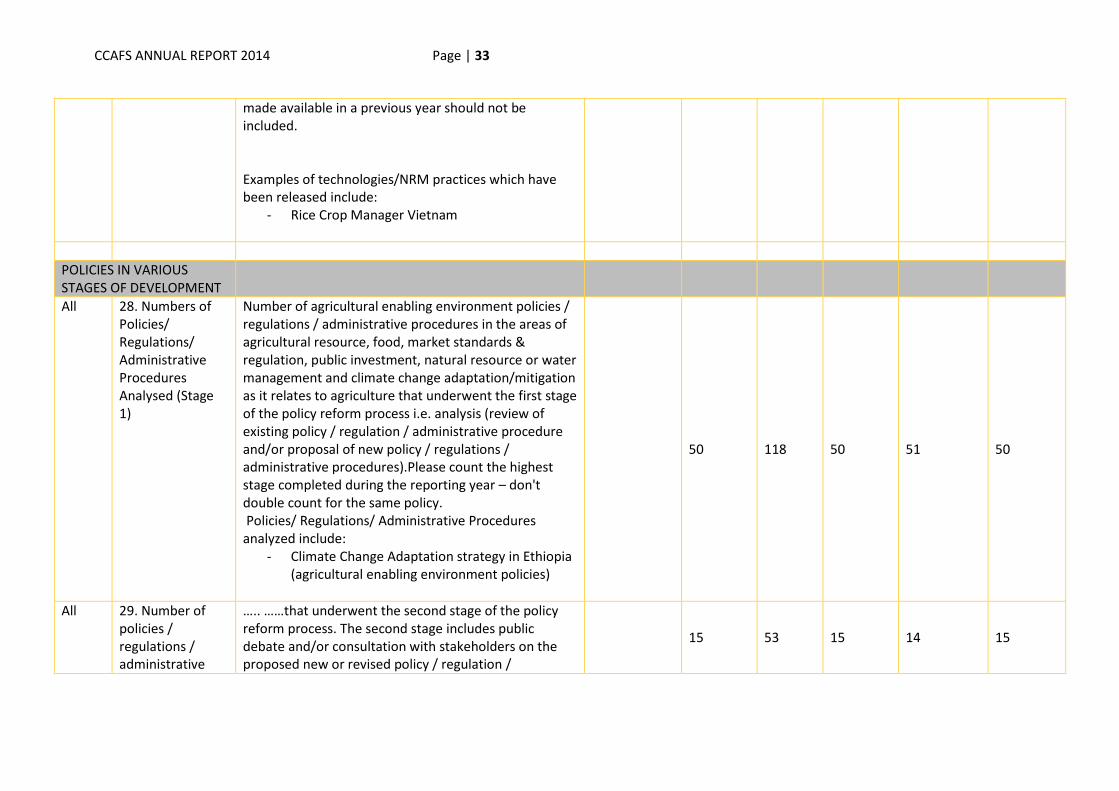
CCAFS ANNUAL REPORT 2014 Page | 33
made available in a previous year should not be included. Examples of technologies/NRM practices which have been released include:
- Rice Crop Manager Vietnam
POLICIES IN VARIOUS STAGES OF DEVELOPMENT
All 28. Numbers of Policies/ Regulations/ Administrative Procedures Analysed (Stage 1)
Number of agricultural enabling environment policies / regulations / administrative procedures in the areas of agricultural resource, food, market standards & regulation, public investment, natural resource or water management and climate change adaptation/mitigation as it relates to agriculture that underwent the first stage of the policy reform process i.e. analysis (review of existing policy / regulation / administrative procedure and/or proposal of new policy / regulations / administrative procedures).Please count the highest stage completed during the reporting year – don't double count for the same policy. Policies/ Regulations/ Administrative Procedures analyzed include:
- Climate Change Adaptation strategy in Ethiopia (agricultural enabling environment policies)
50 118 50 51 50
All 29. Number of policies / regulations / administrative
….. ……that underwent the second stage of the policy reform process. The second stage includes public debate and/or consultation with stakeholders on the proposed new or revised policy / regulation /
15 53 15 14 15
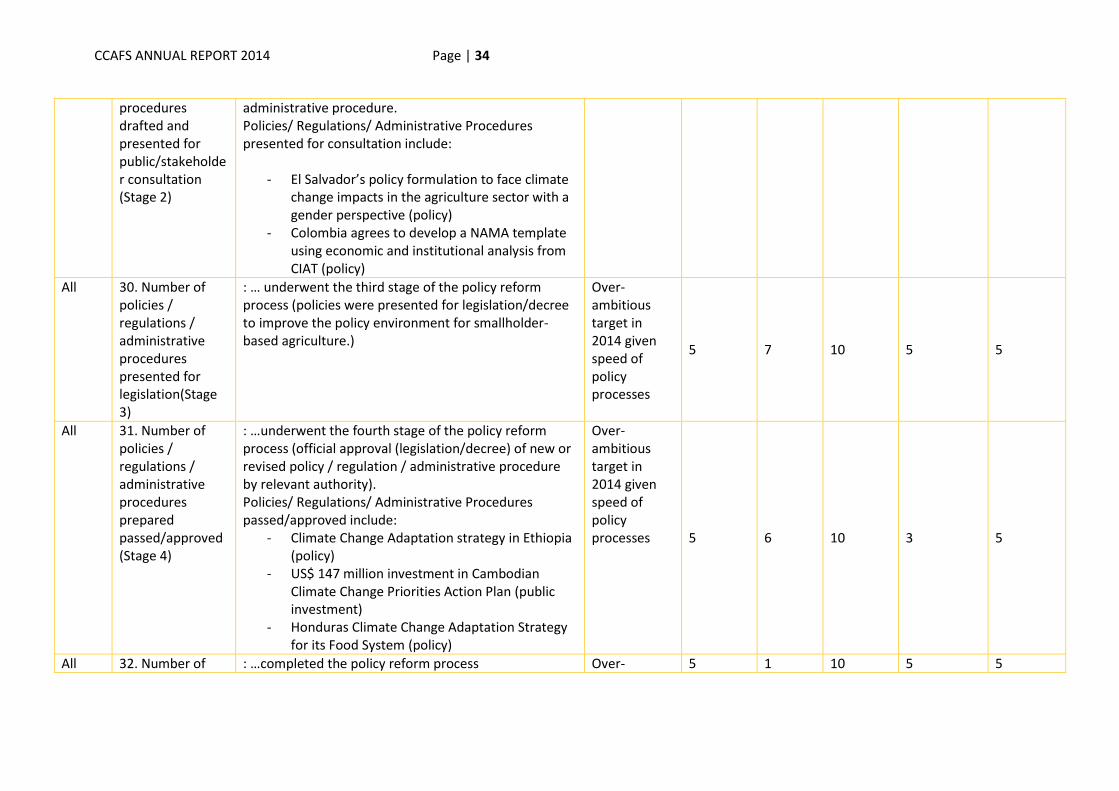
CCAFS ANNUAL REPORT 2014 Page | 34
procedures drafted and presented for public/stakeholder consultation (Stage 2)
administrative procedure. Policies/ Regulations/ Administrative Procedures presented for consultation include:
- El Salvador’s policy formulation to face climate change impacts in the agriculture sector with a gender perspective (policy)
- Colombia agrees to develop a NAMA template using economic and institutional analysis from CIAT (policy)
All 30. Number of policies / regulations / administrative procedures presented for legislation(Stage 3)
: … underwent the third stage of the policy reform process (policies were presented for legislation/decree to improve the policy environment for smallholder-based agriculture.)
Over-ambitious target in 2014 given speed of policy processes
5 7 10 5 5
All 31. Number of policies / regulations / administrative procedures prepared passed/approved (Stage 4)
: …underwent the fourth stage of the policy reform process (official approval (legislation/decree) of new or revised policy / regulation / administrative procedure by relevant authority). Policies/ Regulations/ Administrative Procedures passed/approved include:
- Climate Change Adaptation strategy in Ethiopia (policy)
- US$ 147 million investment in Cambodian Climate Change Priorities Action Plan (public investment)
- Honduras Climate Change Adaptation Strategy for its Food System (policy)
Over-ambitious target in 2014 given speed of policy processes 5 6 10 3 5
All 32. Number of : …completed the policy reform process Over- 5 1 10 5 5
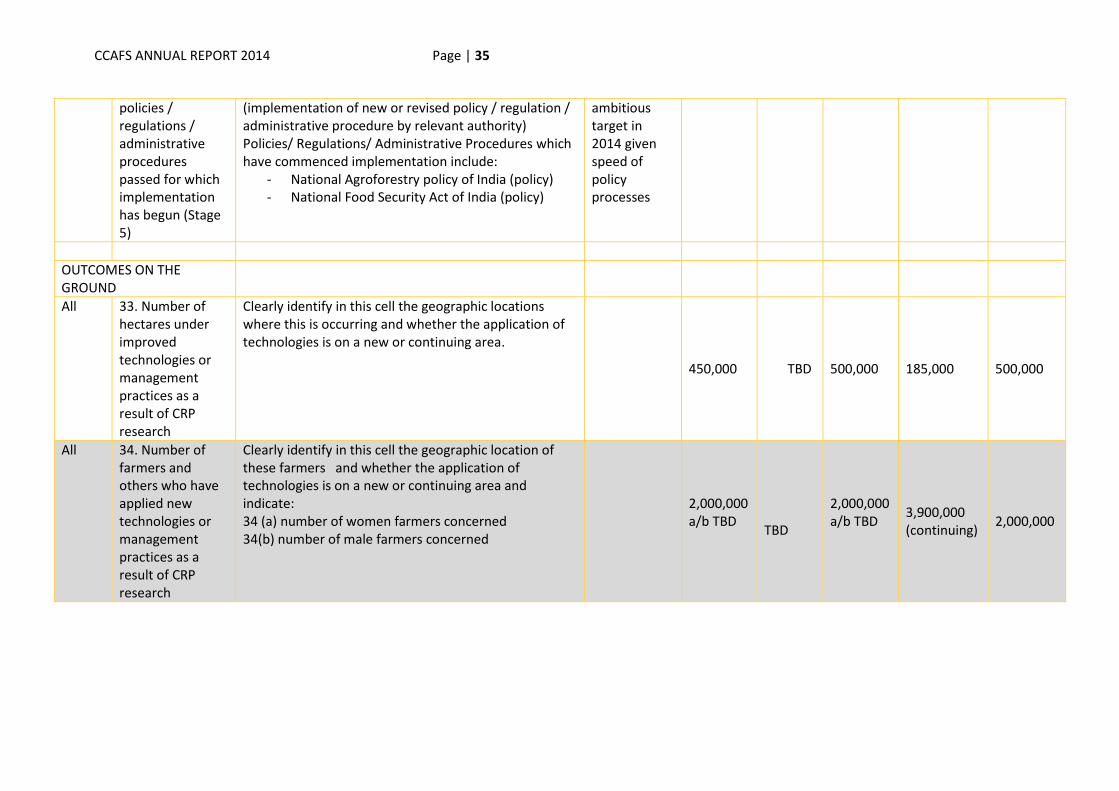
CCAFS ANNUAL REPORT 2014 Page | 35
policies / regulations / administrative procedures passed for which implementation has begun (Stage 5)
(implementation of new or revised policy / regulation / administrative procedure by relevant authority) Policies/ Regulations/ Administrative Procedures which have commenced implementation include:
- National Agroforestry policy of India (policy) - National Food Security Act of India (policy)
ambitious target in 2014 given speed of policy processes
OUTCOMES ON THE GROUND
All 33. Number of hectares under improved technologies or management practices as a result of CRP research
Clearly identify in this cell the geographic locations where this is occurring and whether the application of technologies is on a new or continuing area.
450,000 TBD 500,000 185,000 500,000
All 34. Number of farmers and others who have applied new technologies or management practices as a result of CRP research
Clearly identify in this cell the geographic location of these farmers and whether the application of technologies is on a new or continuing area and indicate: 34 (a) number of women farmers concerned 34(b) number of male farmers concerned
2,000,000 a/b TBD
TBD
2,000,000 a/b TBD
3,900,000 (continuing)
2,000,000
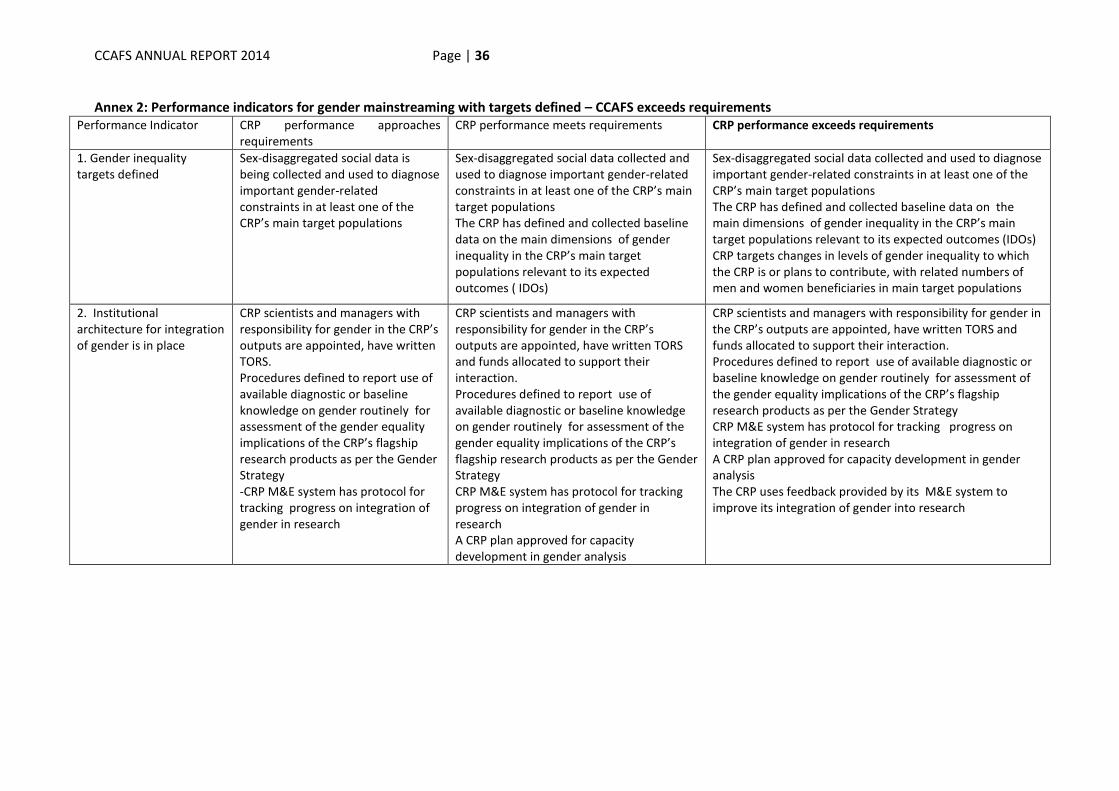
CCAFS ANNUAL REPORT 2014 Page | 36
Annex 2: Performance indicators for gender mainstreaming with targets defined – CCAFS exceeds requirements Performance Indicator CRP performance approaches
requirements CRP performance meets requirements CRP performance exceeds requirements
1. Gender inequality targets defined
Sex-disaggregated social data is being collected and used to diagnose important gender-related constraints in at least one of the CRP’s main target populations
Sex-disaggregated social data collected and used to diagnose important gender-related constraints in at least one of the CRP’s main target populations The CRP has defined and collected baseline data on the main dimensions of gender inequality in the CRP’s main target populations relevant to its expected outcomes ( IDOs)
Sex-disaggregated social data collected and used to diagnose important gender-related constraints in at least one of the CRP’s main target populations The CRP has defined and collected baseline data on the main dimensions of gender inequality in the CRP’s main target populations relevant to its expected outcomes (IDOs) CRP targets changes in levels of gender inequality to which the CRP is or plans to contribute, with related numbers of men and women beneficiaries in main target populations
2. Institutional architecture for integration of gender is in place
CRP scientists and managers with responsibility for gender in the CRP’s outputs are appointed, have written TORS. Procedures defined to report use of available diagnostic or baseline knowledge on gender routinely for assessment of the gender equality implications of the CRP’s flagship research products as per the Gender Strategy -CRP M&E system has protocol for tracking progress on integration of gender in research
CRP scientists and managers with responsibility for gender in the CRP’s outputs are appointed, have written TORS and funds allocated to support their interaction. Procedures defined to report use of available diagnostic or baseline knowledge on gender routinely for assessment of the gender equality implications of the CRP’s flagship research products as per the Gender Strategy CRP M&E system has protocol for tracking progress on integration of gender in research A CRP plan approved for capacity development in gender analysis
CRP scientists and managers with responsibility for gender in the CRP’s outputs are appointed, have written TORS and funds allocated to support their interaction. Procedures defined to report use of available diagnostic or baseline knowledge on gender routinely for assessment of the gender equality implications of the CRP’s flagship research products as per the Gender Strategy CRP M&E system has protocol for tracking progress on integration of gender in research A CRP plan approved for capacity development in gender analysis The CRP uses feedback provided by its M&E system to improve its integration of gender into research
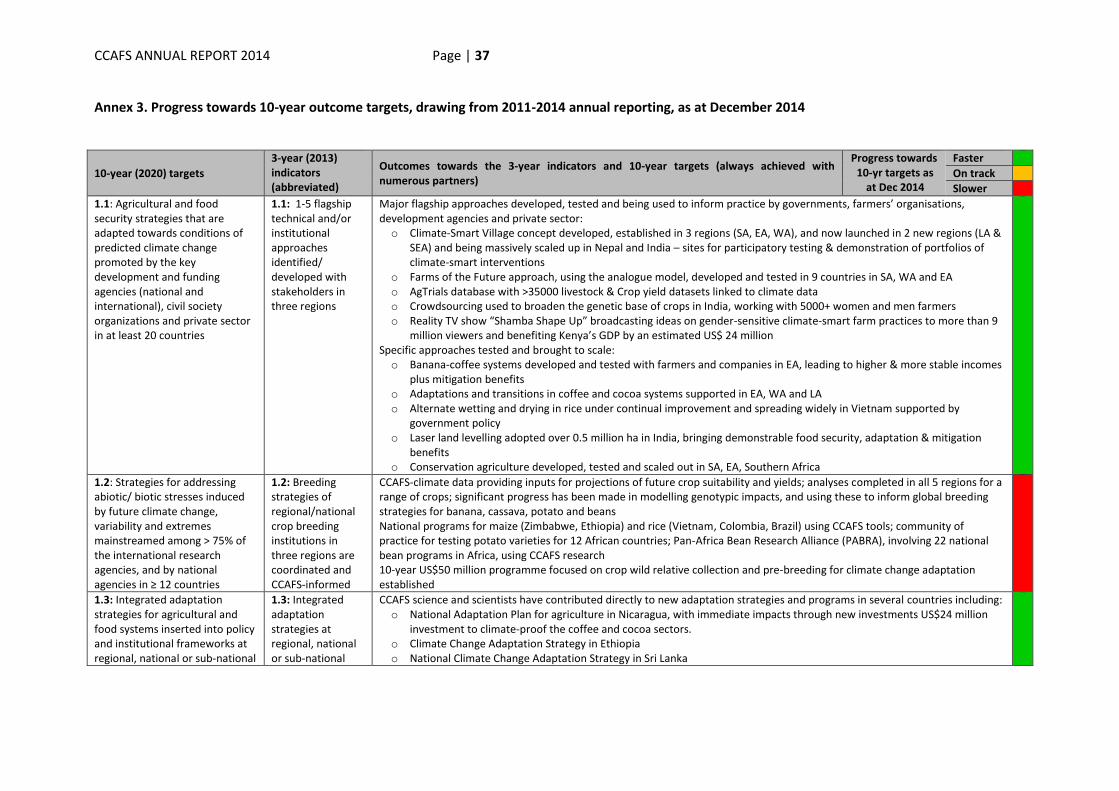
CCAFS ANNUAL REPORT 2014 Page | 37
Annex 3. Progress towards 10-year outcome targets, drawing from 2011-2014 annual reporting, as at December 2014
10-year (2020) targets
3-year (2013) indicators (abbreviated)
Outcomes towards the 3-year indicators and 10-year targets (always achieved with numerous partners)
Progress towards 10-yr targets as
at Dec 2014
Faster
On track
Slower
1.1: Agricultural and food security strategies that are adapted towards conditions of predicted climate change promoted by the key development and funding agencies (national and international), civil society organizations and private sector in at least 20 countries
1.1: 1-5 flagship technical and/or institutional approaches identified/ developed with stakeholders in three regions
Major flagship approaches developed, tested and being used to inform practice by governments, farmers’ organisations, development agencies and private sector: o Climate-Smart Village concept developed, established in 3 regions (SA, EA, WA), and now launched in 2 new regions (LA &
SEA) and being massively scaled up in Nepal and India – sites for participatory testing & demonstration of portfolios of climate-smart interventions
o Farms of the Future approach, using the analogue model, developed and tested in 9 countries in SA, WA and EA o AgTrials database with >35000 livestock & Crop yield datasets linked to climate data o Crowdsourcing used to broaden the genetic base of crops in India, working with 5000+ women and men farmers o Reality TV show “Shamba Shape Up” broadcasting ideas on gender-sensitive climate-smart farm practices to more than 9
million viewers and benefiting Kenya’s GDP by an estimated US$ 24 million Specific approaches tested and brought to scale: o Banana-coffee systems developed and tested with farmers and companies in EA, leading to higher & more stable incomes
plus mitigation benefits o Adaptations and transitions in coffee and cocoa systems supported in EA, WA and LA o Alternate wetting and drying in rice under continual improvement and spreading widely in Vietnam supported by
government policy o Laser land levelling adopted over 0.5 million ha in India, bringing demonstrable food security, adaptation & mitigation
benefits o Conservation agriculture developed, tested and scaled out in SA, EA, Southern Africa
1.2: Strategies for addressing abiotic/ biotic stresses induced by future climate change, variability and extremes mainstreamed among > 75% of the international research agencies, and by national agencies in ≥ 12 countries
1.2: Breeding strategies of regional/national crop breeding institutions in three regions are coordinated and CCAFS-informed
CCAFS-climate data providing inputs for projections of future crop suitability and yields; analyses completed in all 5 regions for a range of crops; significant progress has been made in modelling genotypic impacts, and using these to inform global breeding strategies for banana, cassava, potato and beans National programs for maize (Zimbabwe, Ethiopia) and rice (Vietnam, Colombia, Brazil) using CCAFS tools; community of practice for testing potato varieties for 12 African countries; Pan-Africa Bean Research Alliance (PABRA), involving 22 national bean programs in Africa, using CCAFS research 10-year US$50 million programme focused on crop wild relative collection and pre-breeding for climate change adaptation established
1.3: Integrated adaptation strategies for agricultural and food systems inserted into policy and institutional frameworks at regional, national or sub-national
1.3: Integrated adaptation strategies at regional, national or sub‐national
CCAFS science and scientists have contributed directly to new adaptation strategies and programs in several countries including: o National Adaptation Plan for agriculture in Nicaragua, with immediate impacts through new investments US$24 million
investment to climate-proof the coffee and cocoa sectors. o Climate Change Adaptation Strategy in Ethiopia o National Climate Change Adaptation Strategy in Sri Lanka
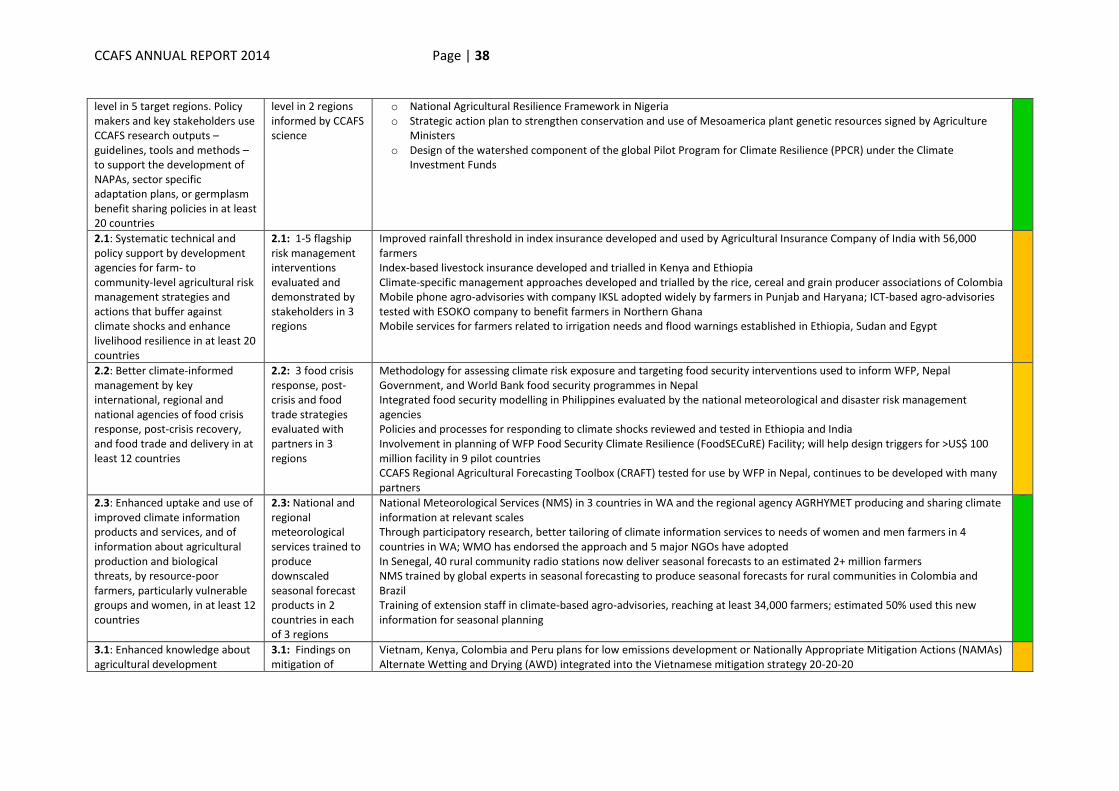
CCAFS ANNUAL REPORT 2014 Page | 38
level in 5 target regions. Policy makers and key stakeholders use CCAFS research outputs – guidelines, tools and methods – to support the development of NAPAs, sector specific adaptation plans, or germplasm benefit sharing policies in at least 20 countries
level in 2 regions informed by CCAFS science
o National Agricultural Resilience Framework in Nigeria o Strategic action plan to strengthen conservation and use of Mesoamerica plant genetic resources signed by Agriculture
Ministers o Design of the watershed component of the global Pilot Program for Climate Resilience (PPCR) under the Climate
Investment Funds
2.1: Systematic technical and policy support by development agencies for farm- to community-level agricultural risk management strategies and actions that buffer against climate shocks and enhance livelihood resilience in at least 20 countries
2.1: 1-5 flagship risk management interventions evaluated and demonstrated by stakeholders in 3 regions
Improved rainfall threshold in index insurance developed and used by Agricultural Insurance Company of India with 56,000 farmers Index-based livestock insurance developed and trialled in Kenya and Ethiopia Climate-specific management approaches developed and trialled by the rice, cereal and grain producer associations of Colombia Mobile phone agro-advisories with company IKSL adopted widely by farmers in Punjab and Haryana; ICT-based agro-advisories tested with ESOKO company to benefit farmers in Northern Ghana Mobile services for farmers related to irrigation needs and flood warnings established in Ethiopia, Sudan and Egypt
2.2: Better climate-informed management by key international, regional and national agencies of food crisis response, post-crisis recovery, and food trade and delivery in at least 12 countries
2.2: 3 food crisis response, post-crisis and food trade strategies evaluated with partners in 3 regions
Methodology for assessing climate risk exposure and targeting food security interventions used to inform WFP, Nepal Government, and World Bank food security programmes in Nepal Integrated food security modelling in Philippines evaluated by the national meteorological and disaster risk management agencies Policies and processes for responding to climate shocks reviewed and tested in Ethiopia and India Involvement in planning of WFP Food Security Climate Resilience (FoodSECuRE) Facility; will help design triggers for >US$ 100 million facility in 9 pilot countries CCAFS Regional Agricultural Forecasting Toolbox (CRAFT) tested for use by WFP in Nepal, continues to be developed with many partners
2.3: Enhanced uptake and use of improved climate information products and services, and of information about agricultural production and biological threats, by resource-poor farmers, particularly vulnerable groups and women, in at least 12 countries
2.3: National and regional meteorological services trained to produce downscaled seasonal forecast products in 2 countries in each of 3 regions
National Meteorological Services (NMS) in 3 countries in WA and the regional agency AGRHYMET producing and sharing climate information at relevant scales Through participatory research, better tailoring of climate information services to needs of women and men farmers in 4 countries in WA; WMO has endorsed the approach and 5 major NGOs have adopted In Senegal, 40 rural community radio stations now deliver seasonal forecasts to an estimated 2+ million farmers NMS trained by global experts in seasonal forecasting to produce seasonal forecasts for rural communities in Colombia and Brazil Training of extension staff in climate-based agro-advisories, reaching at least 34,000 farmers; estimated 50% used this new information for seasonal planning
3.1: Enhanced knowledge about agricultural development
3.1: Findings on mitigation of
Vietnam, Kenya, Colombia and Peru plans for low emissions development or Nationally Appropriate Mitigation Actions (NAMAs) Alternate Wetting and Drying (AWD) integrated into the Vietnamese mitigation strategy 20-20-20
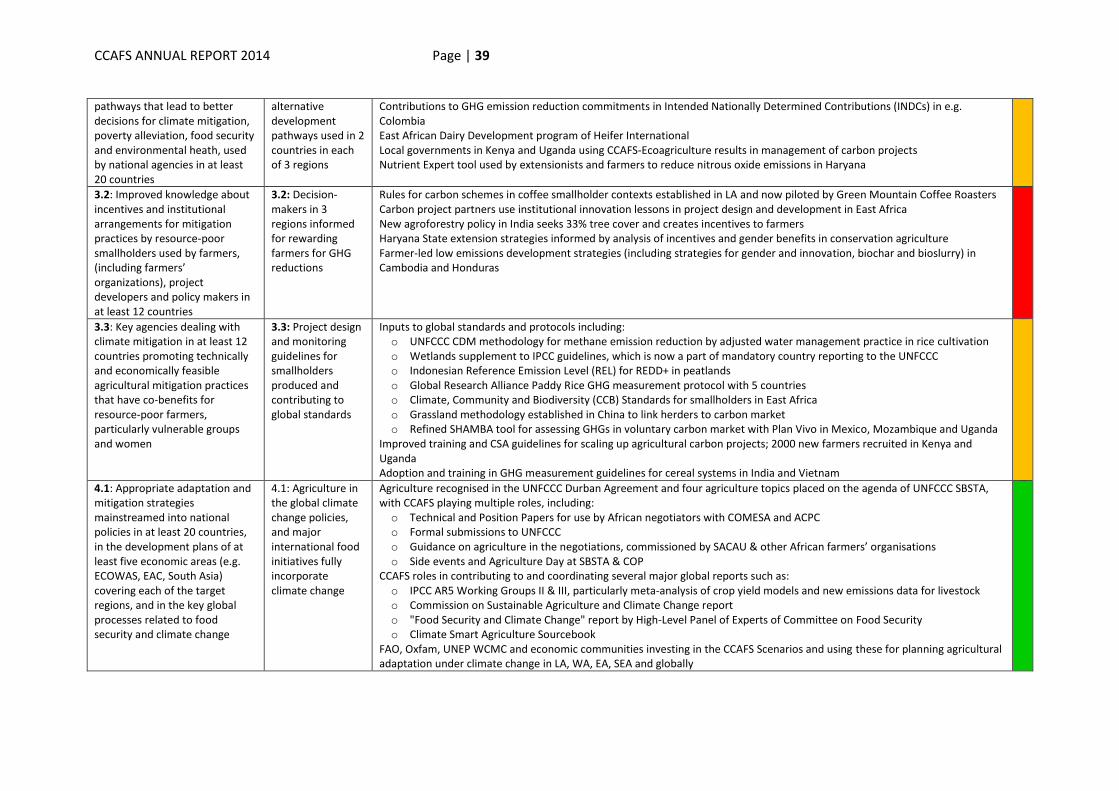
CCAFS ANNUAL REPORT 2014 Page | 39
pathways that lead to better decisions for climate mitigation, poverty alleviation, food security and environmental heath, used by national agencies in at least 20 countries
alternative development pathways used in 2 countries in each of 3 regions
Contributions to GHG emission reduction commitments in Intended Nationally Determined Contributions (INDCs) in e.g. Colombia East African Dairy Development program of Heifer International Local governments in Kenya and Uganda using CCAFS-Ecoagriculture results in management of carbon projects Nutrient Expert tool used by extensionists and farmers to reduce nitrous oxide emissions in Haryana
3.2: Improved knowledge about incentives and institutional arrangements for mitigation practices by resource-poor smallholders used by farmers, (including farmers’ organizations), project developers and policy makers in at least 12 countries
3.2: Decision-makers in 3 regions informed for rewarding farmers for GHG reductions
Rules for carbon schemes in coffee smallholder contexts established in LA and now piloted by Green Mountain Coffee Roasters Carbon project partners use institutional innovation lessons in project design and development in East Africa New agroforestry policy in India seeks 33% tree cover and creates incentives to farmers Haryana State extension strategies informed by analysis of incentives and gender benefits in conservation agriculture Farmer-led low emissions development strategies (including strategies for gender and innovation, biochar and bioslurry) in Cambodia and Honduras
3.3: Key agencies dealing with climate mitigation in at least 12 countries promoting technically and economically feasible agricultural mitigation practices that have co-benefits for resource-poor farmers, particularly vulnerable groups and women
3.3: Project design and monitoring guidelines for smallholders produced and contributing to global standards
Inputs to global standards and protocols including: o UNFCCC CDM methodology for methane emission reduction by adjusted water management practice in rice cultivation o Wetlands supplement to IPCC guidelines, which is now a part of mandatory country reporting to the UNFCCC o Indonesian Reference Emission Level (REL) for REDD+ in peatlands o Global Research Alliance Paddy Rice GHG measurement protocol with 5 countries o Climate, Community and Biodiversity (CCB) Standards for smallholders in East Africa o Grassland methodology established in China to link herders to carbon market o Refined SHAMBA tool for assessing GHGs in voluntary carbon market with Plan Vivo in Mexico, Mozambique and Uganda
Improved training and CSA guidelines for scaling up agricultural carbon projects; 2000 new farmers recruited in Kenya and Uganda Adoption and training in GHG measurement guidelines for cereal systems in India and Vietnam
4.1: Appropriate adaptation and mitigation strategies mainstreamed into national policies in at least 20 countries, in the development plans of at least five economic areas (e.g. ECOWAS, EAC, South Asia) covering each of the target regions, and in the key global processes related to food security and climate change
4.1: Agriculture in the global climate change policies, and major international food initiatives fully incorporate climate change
Agriculture recognised in the UNFCCC Durban Agreement and four agriculture topics placed on the agenda of UNFCCC SBSTA, with CCAFS playing multiple roles, including: o Technical and Position Papers for use by African negotiators with COMESA and ACPC o Formal submissions to UNFCCC o Guidance on agriculture in the negotiations, commissioned by SACAU & other African farmers’ organisations o Side events and Agriculture Day at SBSTA & COP
CCAFS roles in contributing to and coordinating several major global reports such as: o IPCC AR5 Working Groups II & III, particularly meta-analysis of crop yield models and new emissions data for livestock o Commission on Sustainable Agriculture and Climate Change report o "Food Security and Climate Change" report by High-Level Panel of Experts of Committee on Food Security o Climate Smart Agriculture Sourcebook
FAO, Oxfam, UNEP WCMC and economic communities investing in the CCAFS Scenarios and using these for planning agricultural adaptation under climate change in LA, WA, EA, SEA and globally
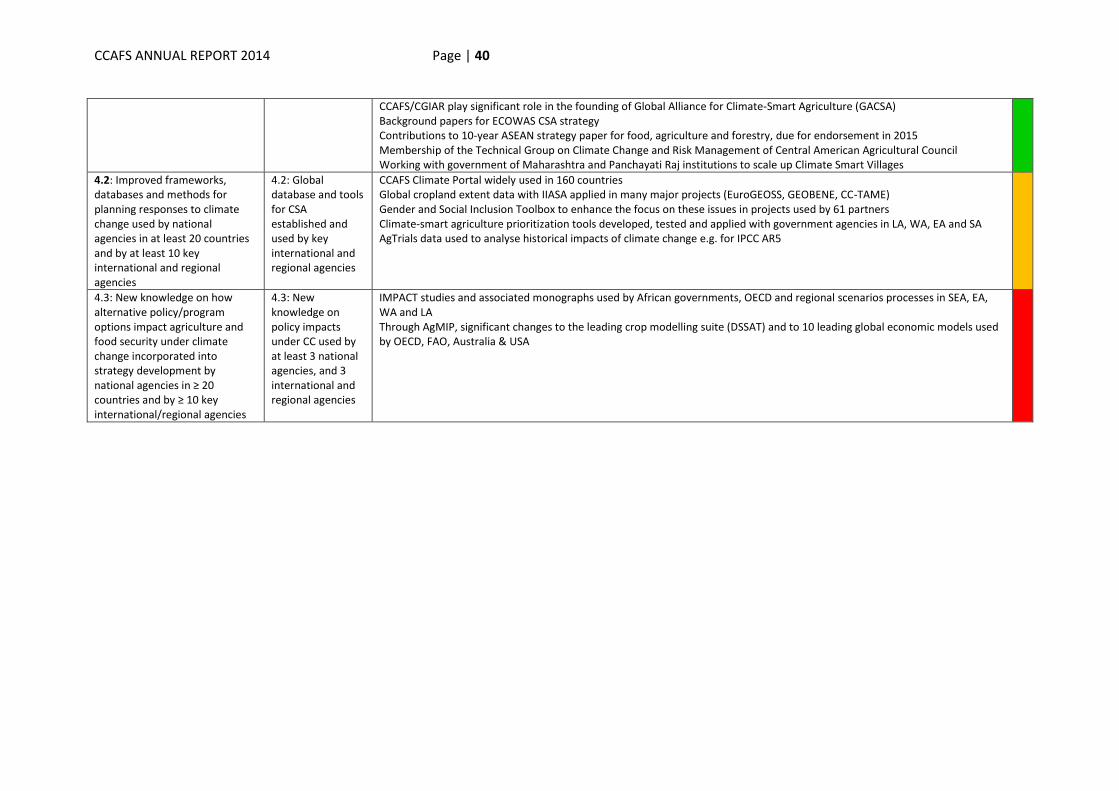
CCAFS ANNUAL REPORT 2014 Page | 40
CCAFS/CGIAR play significant role in the founding of Global Alliance for Climate-Smart Agriculture (GACSA) Background papers for ECOWAS CSA strategy Contributions to 10-year ASEAN strategy paper for food, agriculture and forestry, due for endorsement in 2015 Membership of the Technical Group on Climate Change and Risk Management of Central American Agricultural Council Working with government of Maharashtra and Panchayati Raj institutions to scale up Climate Smart Villages
4.2: Improved frameworks, databases and methods for planning responses to climate change used by national agencies in at least 20 countries and by at least 10 key international and regional agencies
4.2: Global database and tools for CSA established and used by key international and regional agencies
CCAFS Climate Portal widely used in 160 countries Global cropland extent data with IIASA applied in many major projects (EuroGEOSS, GEOBENE, CC-TAME) Gender and Social Inclusion Toolbox to enhance the focus on these issues in projects used by 61 partners Climate-smart agriculture prioritization tools developed, tested and applied with government agencies in LA, WA, EA and SA AgTrials data used to analyse historical impacts of climate change e.g. for IPCC AR5
4.3: New knowledge on how alternative policy/program options impact agriculture and food security under climate change incorporated into strategy development by national agencies in ≥ 20 countries and by ≥ 10 key international/regional agencies
4.3: New knowledge on policy impacts under CC used by at least 3 national agencies, and 3 international and regional agencies
IMPACT studies and associated monographs used by African governments, OECD and regional scenarios processes in SEA, EA, WA and LA Through AgMIP, significant changes to the leading crop modelling suite (DSSAT) and to 10 leading global economic models used by OECD, FAO, Australia & USA
CCAFS ANNUAL REPORT 2014 Page | 41
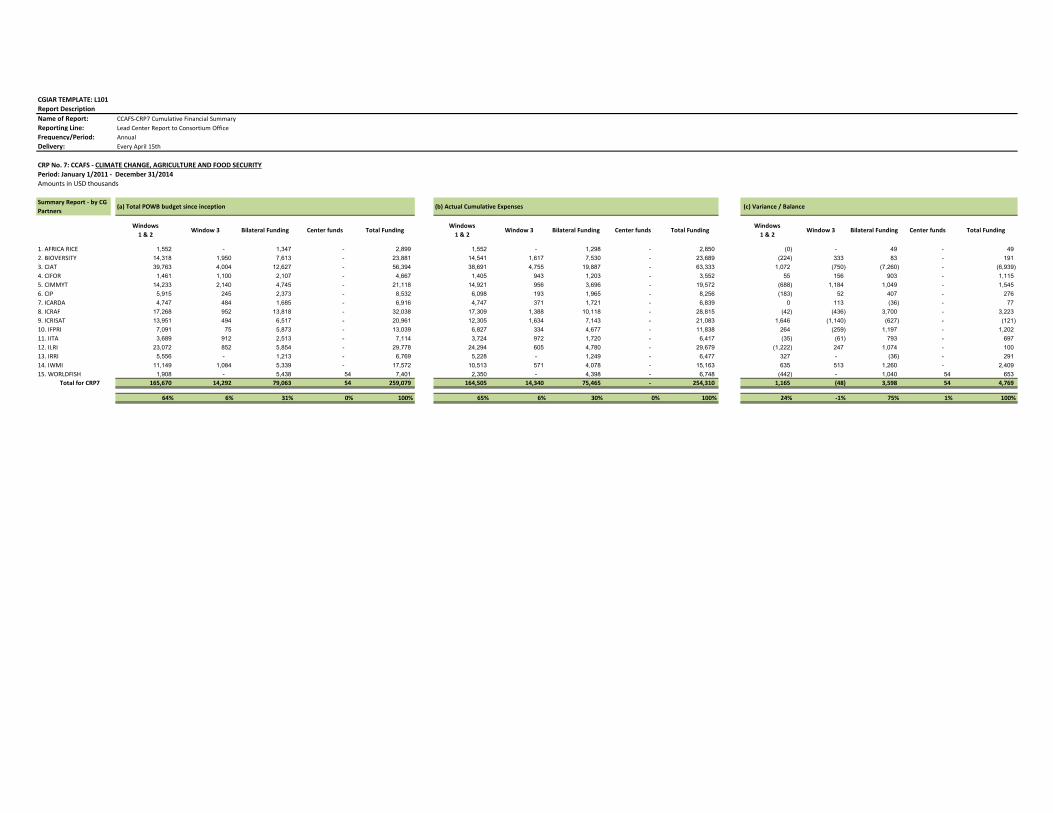
CGIAR TEMPLATE: L101Report DescriptionName of Report: CCAFS-CRP7 Cumulative Financial SummaryReporting Line: Lead Center Report to Consortium OfficeFrequency/Period: AnnualDelivery: Every April 15th
CRP No. 7: CCAFS - CLIMATE CHANGE, AGRICULTURE AND FOOD SECURITYPeriod: January 1/2011 - December 31/2014Amounts in USD thousands
Summary Report - by CG Partners
(a) Total POWB budget since inception (b) Actual Cumulative Expenses (c) Variance / Balance
Windows 1 & 2
Window 3 Bilateral Funding Center funds Total FundingWindows
1 & 2Window 3 Bilateral Funding Center funds Total Funding
Windows 1 & 2
Window 3 Bilateral Funding Center funds Total Funding
1. AFRICA RICE 1,552 - 1,347 - 2,899 1,552 - 1,298 - 2,850 (0) - 49 - 49 2. BIOVERSITY 14,318 1,950 7,613 - 23,881 14,541 1,617 7,530 - 23,689 (224) 333 83 - 191 3. CIAT 39,763 4,004 12,627 - 56,394 38,691 4,755 19,887 - 63,333 1,072 (750) (7,260) - (6,939) 4. CIFOR 1,461 1,100 2,107 - 4,667 1,405 943 1,203 - 3,552 55 156 903 - 1,115 5. CIMMYT 14,233 2,140 4,745 - 21,118 14,921 956 3,696 - 19,572 (688) 1,184 1,049 - 1,545 6. CIP 5,915 245 2,373 - 8,532 6,098 193 1,965 - 8,256 (183) 52 407 - 276 7. ICARDA 4,747 484 1,685 - 6,916 4,747 371 1,721 - 6,839 0 113 (36) - 77 8. ICRAF 17,268 952 13,818 - 32,038 17,309 1,388 10,118 - 28,815 (42) (436) 3,700 - 3,223 9. ICRISAT 13,951 494 6,517 - 20,961 12,305 1,634 7,143 - 21,083 1,646 (1,140) (627) - (121) 10. IFPRI 7,091 75 5,873 - 13,039 6,827 334 4,677 - 11,838 264 (259) 1,197 - 1,202 11. IITA 3,689 912 2,513 - 7,114 3,724 972 1,720 - 6,417 (35) (61) 793 - 697 12. ILRI 23,072 852 5,854 - 29,778 24,294 605 4,780 - 29,679 (1,222) 247 1,074 - 100 13. IRRI 5,556 - 1,213 - 6,769 5,228 - 1,249 - 6,477 327 - (36) - 291 14. IWMI 11,149 1,084 5,339 - 17,572 10,513 571 4,078 - 15,163 635 513 1,260 - 2,409 15. WORLDFISH 1,908 - 5,438 54 7,401 2,350 - 4,398 - 6,748 (442) - 1,040 54 653
Total for CRP7 165,670 14,292 79,063 54 259,079 164,505 14,340 75,465 - 254,310 1,165 (48) 3,598 54 4,769
64% 6% 31% 0% 100% 65% 6% 30% 0% 100% 24% -1% 75% 1% 100%
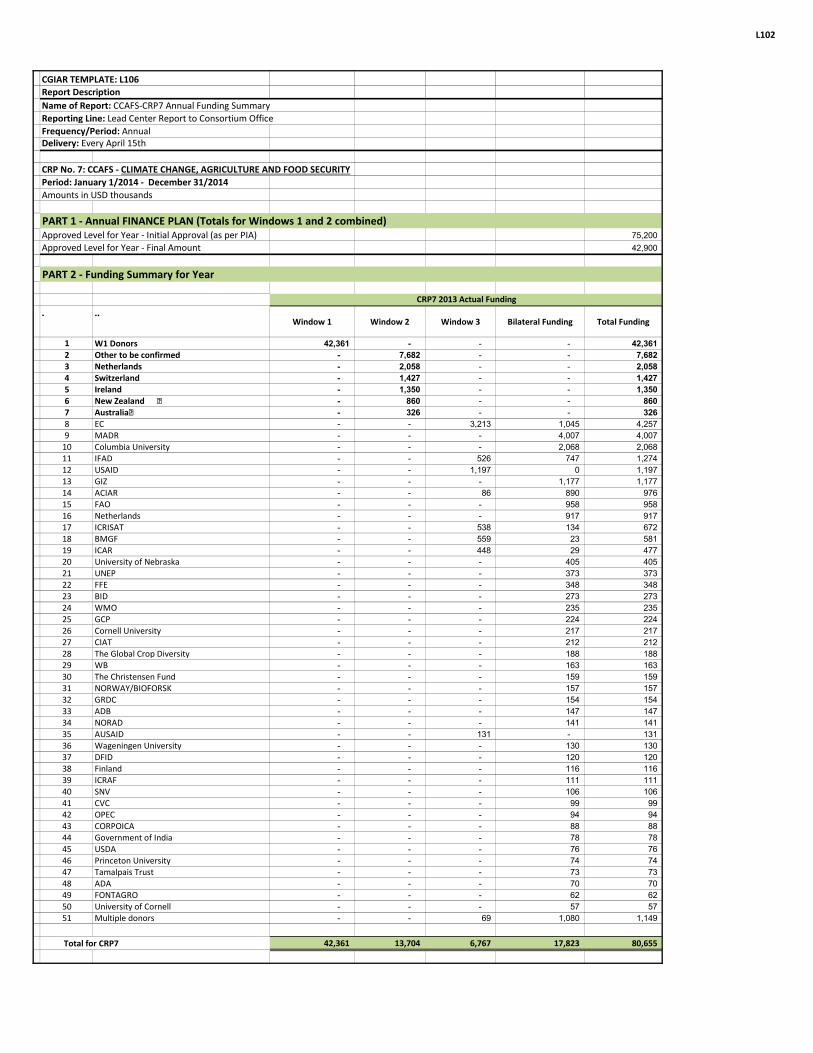
L102
CGIAR TEMPLATE: L106Report DescriptionName of Report: CCAFS-CRP7 Annual Funding SummaryReporting Line: Lead Center Report to Consortium OfficeFrequency/Period: AnnualDelivery: Every April 15th
CRP No. 7: CCAFS - CLIMATE CHANGE, AGRICULTURE AND FOOD SECURITYPeriod: January 1/2014 - December 31/2014Amounts in USD thousands
PART 1 - Annual FINANCE PLAN (Totals for Windows 1 and 2 combined)Approved Level for Year - Initial Approval (as per PIA) 75,200 Approved Level for Year - Final Amount 42,900
PART 2 - Funding Summary for Year
. ..Window 1 Window 2 Window 3 Bilateral Funding Total Funding
1 W1 Donors 42,361 - - - 42,361 2 Other to be confirmed - 7,682 - - 7,682 3 Netherlands - 2,058 - - 2,058 4 Switzerland - 1,427 - - 1,427 5 Ireland - 1,350 - - 1,350 6 EĞǁ��ĞĂůĂŶĚ������� - 860 - - 860 7 �ƵƐƚƌĂůŝĂ� - 326 - - 326 8 EC - - 3,213 1,045 4,257 9 MADR - - - 4,007 4,007
10 Columbia University - - - 2,068 2,068 11 IFAD - - 526 747 1,274 12 USAID - - 1,197 0 1,197 13 GIZ - - - 1,177 1,177 14 ACIAR - - 86 890 976 15 FAO - - - 958 958 16 Netherlands - - - 917 917 17 ICRISAT - - 538 134 672 18 BMGF - - 559 23 581 19 ICAR - - 448 29 477 20 University of Nebraska - - - 405 405 21 UNEP - - - 373 373 22 FFE - - - 348 348 23 BID - - - 273 273 24 WMO - - - 235 235 25 GCP - - - 224 224 26 Cornell University - - - 217 217 27 CIAT - - - 212 212 28 The Global Crop Diversity - - - 188 188 29 WB - - - 163 163 30 The Christensen Fund - - - 159 159 31 NORWAY/BIOFORSK - - - 157 157 32 GRDC - - - 154 154 33 ADB - - - 147 147 34 NORAD - - - 141 141 35 AUSAID - - 131 - 131 36 Wageningen University - - - 130 130 37 DFID - - - 120 120 38 Finland - - - 116 116 39 ICRAF - - - 111 111 40 SNV - - - 106 106 41 CVC - - - 99 99 42 OPEC - - - 94 94 43 CORPOICA - - - 88 88 44 Government of India - - - 78 78 45 USDA - - - 76 76 46 Princeton University - - - 74 74 47 Tamalpais Trust - - - 73 73 48 ADA - - - 70 70 49 FONTAGRO - - - 62 62 50 University of Cornell - - - 57 57 51 Multiple donors - - 69 1,080 1,149
Total for CRP7 42,361 13,704 6,767 17,823 80,655
CRP7 2013 Actual Funding
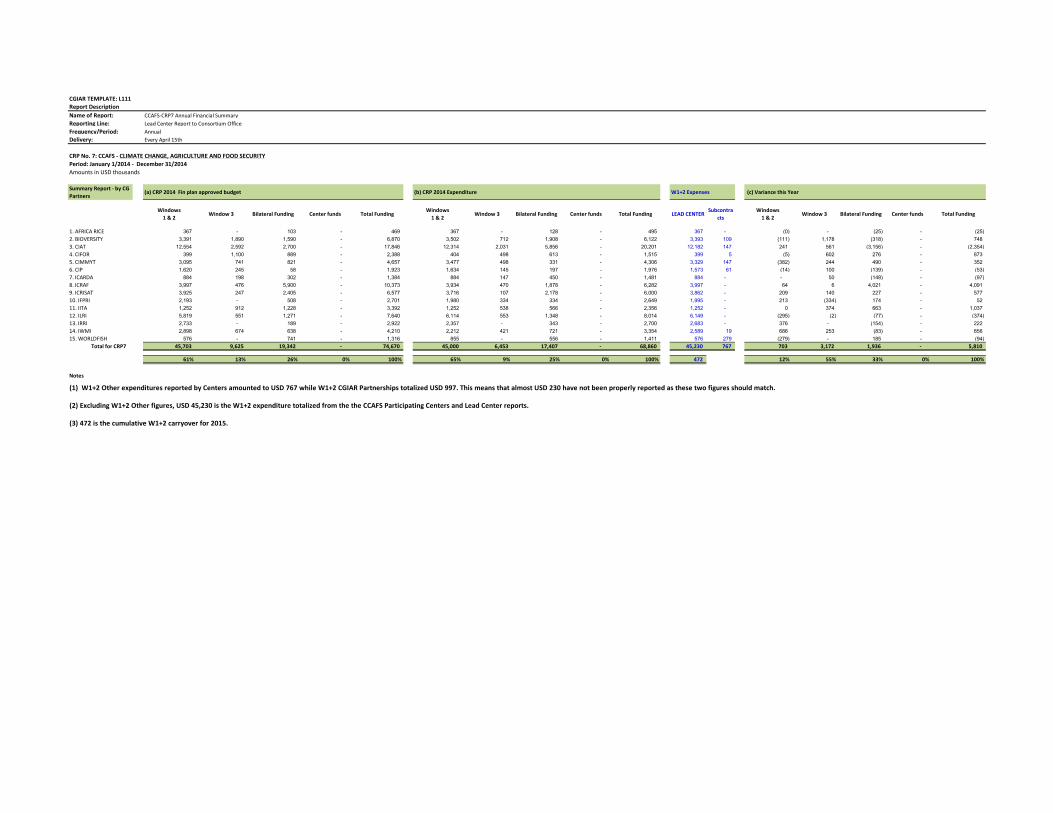
CGIAR TEMPLATE: L111Report DescriptionName of Report: CCAFS-CRP7 Annual Financial SummaryReporting Line: Lead Center Report to Consortium OfficeFrequency/Period: AnnualDelivery: Every April 15th
CRP No. 7: CCAFS - CLIMATE CHANGE, AGRICULTURE AND FOOD SECURITYPeriod: January 1/2014 - December 31/2014Amounts in USD thousands
Summary Report - by CG Partners
(a) CRP 2014 Fin plan approved budget (b) CRP 2014 Expenditure W1+2 Expenses (c) Variance this Year
Windows 1 & 2
Window 3 Bilateral Funding Center funds Total FundingWindows
1 & 2Window 3 Bilateral Funding Center funds Total Funding LEAD CENTER
Subcontracts
Windows 1 & 2
Window 3 Bilateral Funding Center funds Total Funding
1. AFRICA RICE 367 - 103 - 469 367 - 128 - 495 367 - (0) - (25) - (25) 2. BIOVERSITY 3,391 1,890 1,590 - 6,870 3,502 712 1,908 - 6,122 3,393 109 (111) 1,178 (318) - 748 3. CIAT 12,554 2,592 2,700 - 17,846 12,314 2,031 5,856 - 20,201 12,182 147 241 561 (3,156) - (2,354) 4. CIFOR 399 1,100 889 - 2,388 404 498 613 - 1,515 399 5 (5) 602 276 - 873 5. CIMMYT 3,095 741 821 - 4,657 3,477 498 331 - 4,306 3,329 147 (382) 244 490 - 352 6. CIP 1,620 245 58 - 1,923 1,634 145 197 - 1,976 1,573 61 (14) 100 (139) - (53) 7. ICARDA 884 198 302 - 1,384 884 147 450 - 1,481 884 - - 50 (148) - (97) 8. ICRAF 3,997 476 5,900 - 10,373 3,934 470 1,878 - 6,282 3,997 - 64 6 4,021 - 4,091 9. ICRISAT 3,925 247 2,405 - 6,577 3,716 107 2,178 - 6,000 3,862 - 209 140 227 - 577 10. IFPRI 2,193 - 508 - 2,701 1,980 334 334 - 2,649 1,995 - 213 (334) 174 - 52 11. IITA 1,252 912 1,228 - 3,392 1,252 538 566 - 2,356 1,252 - 0 374 663 - 1,037 12. ILRI 5,819 551 1,271 - 7,640 6,114 553 1,348 - 8,014 6,149 - (295) (2) (77) - (374) 13. IRRI 2,733 - 189 - 2,922 2,357 - 343 - 2,700 2,683 - 376 - (154) - 222 14. IWMI 2,898 674 638 - 4,210 2,212 421 721 - 3,354 2,589 19 686 253 (83) - 856 15. WORLDFISH 576 - 741 - 1,316 855 - 556 - 1,411 576 279 (279) - 185 - (94)
Total for CRP7 45,703 9,625 19,342 - 74,670 45,000 6,453 17,407 - 68,860 45,230 767 703 3,172 1,936 - 5,810
61% 13% 26% 0% 100% 65% 9% 25% 0% 100% 472 12% 55% 33% 0% 100%
Notes
(1) W1+2 Other expenditures reported by Centers amounted to USD 767 while W1+2 CGIAR Partnerships totalized USD 997. This means that almost USD 230 have not been properly reported as these two figures should match.
(3) 472 is the cumulative W1+2 carryover for 2015.
(2) Excluding W1+2 Other figures, USD 45,230 is the W1+2 expenditure totalized from the the CCAFS Participating Centers and Lead Center reports.
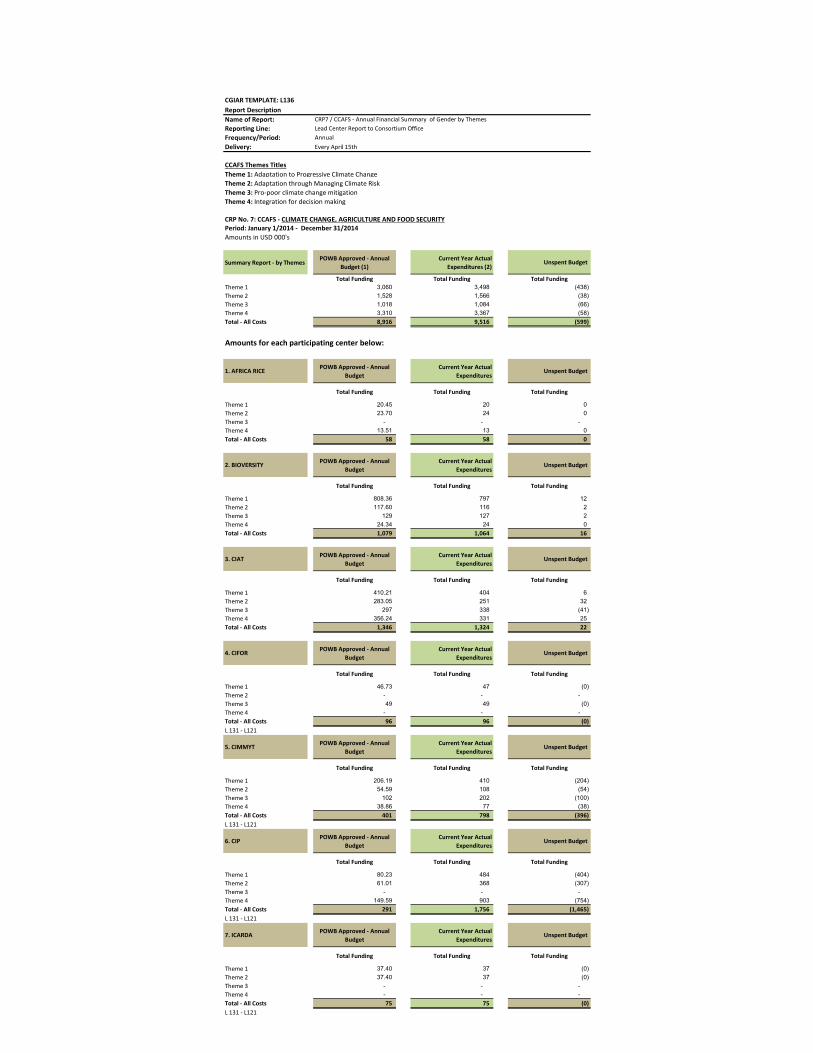
CGIAR TEMPLATE: L136Report DescriptionName of Report: CRP7 / CCAFS - Annual Financial Summary of Gender by ThemesReporting Line: Lead Center Report to Consortium OfficeFrequency/Period: AnnualDelivery: Every April 15th
CCAFS Themes TitlesTheme 1: Adaptation to Progressive Climate Change Theme 2: Adaptation through Managing Climate Risk Theme 3: Pro-poor climate change mitigationTheme 4: Integration for decision making
CRP No. 7: CCAFS - CLIMATE CHANGE, AGRICULTURE AND FOOD SECURITYPeriod: January 1/2014 - December 31/2014Amounts in USD 000's
Summary Report - by ThemesPOWB Approved - Annual
Budget (1)Current Year Actual
Expenditures (2)Unspent Budget
Total Funding Total Funding Total FundingTheme 1 3,060 3,498 (438) Theme 2 1,528 1,566 (38) Theme 3 1,018 1,084 (66) Theme 4 3,310 3,367 (58) Total - All Costs 8,916 9,516 (599)
Amounts for each participating center below:
1. AFRICA RICE POWB Approved - Annual Budget
Current Year Actual Expenditures
Unspent Budget
Total Funding Total Funding Total Funding
Theme 1 20.45 20 0 Theme 2 23.70 24 0 Theme 3 - - - Theme 4 13.51 13 0 Total - All Costs 58 58 0
2. BIOVERSITY POWB Approved - Annual Budget
Current Year Actual Expenditures
Unspent Budget
Total Funding Total Funding Total Funding
Theme 1 808.36 797 12 Theme 2 117.60 116 2 Theme 3 129 127 2 Theme 4 24.34 24 0 Total - All Costs 1,079 1,064 16
3. CIAT POWB Approved - Annual Budget
Current Year Actual Expenditures
Unspent Budget
Total Funding Total Funding Total Funding
Theme 1 410.21 404 6 Theme 2 283.05 251 32 Theme 3 297 338 (41) Theme 4 356.24 331 25 Total - All Costs 1,346 1,324 22
4. CIFOR POWB Approved - Annual Budget
Current Year Actual Expenditures
Unspent Budget
Total Funding Total Funding Total Funding
Theme 1 46.73 47 (0) Theme 2 - - - Theme 3 49 49 (0) Theme 4 - - - Total - All Costs 96 96 (0) L 131 - L121
5. CIMMYT POWB Approved - Annual Budget
Current Year Actual Expenditures
Unspent Budget
Total Funding Total Funding Total Funding
Theme 1 206.19 410 (204) Theme 2 54.59 108 (54) Theme 3 102 202 (100) Theme 4 38.86 77 (38) Total - All Costs 401 798 (396) L 131 - L121
6. CIP POWB Approved - Annual Budget
Current Year Actual Expenditures
Unspent Budget
Total Funding Total Funding Total Funding
Theme 1 80.23 484 (404) Theme 2 61.01 368 (307) Theme 3 - - - Theme 4 149.59 903 (754) Total - All Costs 291 1,756 (1,465) L 131 - L121
7. ICARDA POWB Approved - Annual Budget
Current Year Actual Expenditures
Unspent Budget
Total Funding Total Funding Total Funding
Theme 1 37.40 37 (0) Theme 2 37.40 37 (0) Theme 3 - - - Theme 4 - - - Total - All Costs 75 75 (0) L 131 - L121
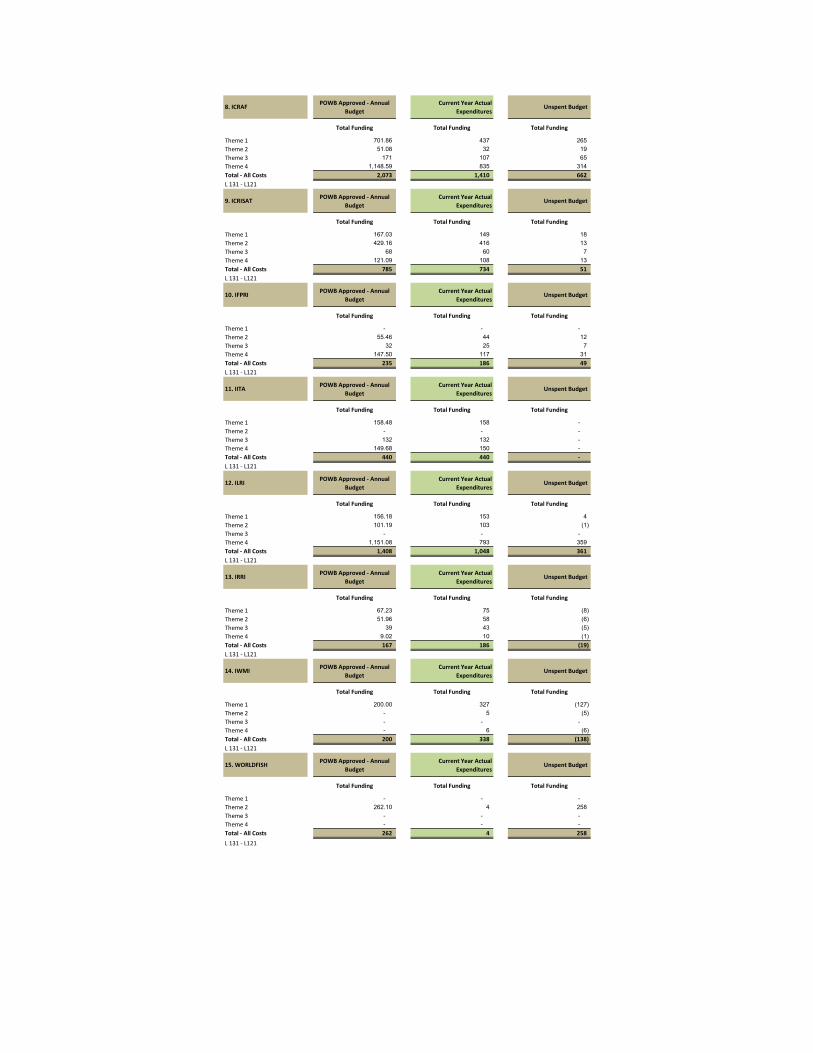
8. ICRAF POWB Approved - Annual Budget
Current Year Actual Expenditures
Unspent Budget
Total Funding Total Funding Total Funding
Theme 1 701.86 437 265 Theme 2 51.08 32 19 Theme 3 171 107 65 Theme 4 1,148.59 835 314 Total - All Costs 2,073 1,410 662 L 131 - L121
9. ICRISAT POWB Approved - Annual Budget
Current Year Actual Expenditures
Unspent Budget
Total Funding Total Funding Total Funding
Theme 1 167.03 149 18 Theme 2 429.16 416 13 Theme 3 68 60 7 Theme 4 121.09 108 13 Total - All Costs 785 734 51 L 131 - L121
10. IFPRI POWB Approved - Annual Budget
Current Year Actual Expenditures
Unspent Budget
Total Funding Total Funding Total Funding
Theme 1 - - - Theme 2 55.46 44 12 Theme 3 32 25 7 Theme 4 147.50 117 31 Total - All Costs 235 186 49 L 131 - L121
11. IITA POWB Approved - Annual Budget
Current Year Actual Expenditures
Unspent Budget
Total Funding Total Funding Total Funding
Theme 1 158.48 158 - Theme 2 - - - Theme 3 132 132 - Theme 4 149.68 150 - Total - All Costs 440 440 - L 131 - L121
12. ILRI POWB Approved - Annual Budget
Current Year Actual Expenditures
Unspent Budget
Total Funding Total Funding Total Funding
Theme 1 156.18 153 4 Theme 2 101.19 103 (1) Theme 3 - - - Theme 4 1,151.08 793 359 Total - All Costs 1,408 1,048 361 L 131 - L121
13. IRRI POWB Approved - Annual Budget
Current Year Actual Expenditures
Unspent Budget
Total Funding Total Funding Total Funding
Theme 1 67.23 75 (8) Theme 2 51.96 58 (6) Theme 3 39 43 (5) Theme 4 9.02 10 (1) Total - All Costs 167 186 (19) L 131 - L121
14. IWMI POWB Approved - Annual Budget
Current Year Actual Expenditures
Unspent Budget
Total Funding Total Funding Total Funding
Theme 1 200.00 327 (127) Theme 2 - 5 (5) Theme 3 - - - Theme 4 - 6 (6) Total - All Costs 200 338 (138) L 131 - L121
15. WORLDFISH POWB Approved - Annual Budget
Current Year Actual Expenditures
Unspent Budget
Total Funding Total Funding Total Funding
Theme 1 - - - Theme 2 262.10 4 258 Theme 3 - - - Theme 4 - - - Total - All Costs 262 4 258 L 131 - L121
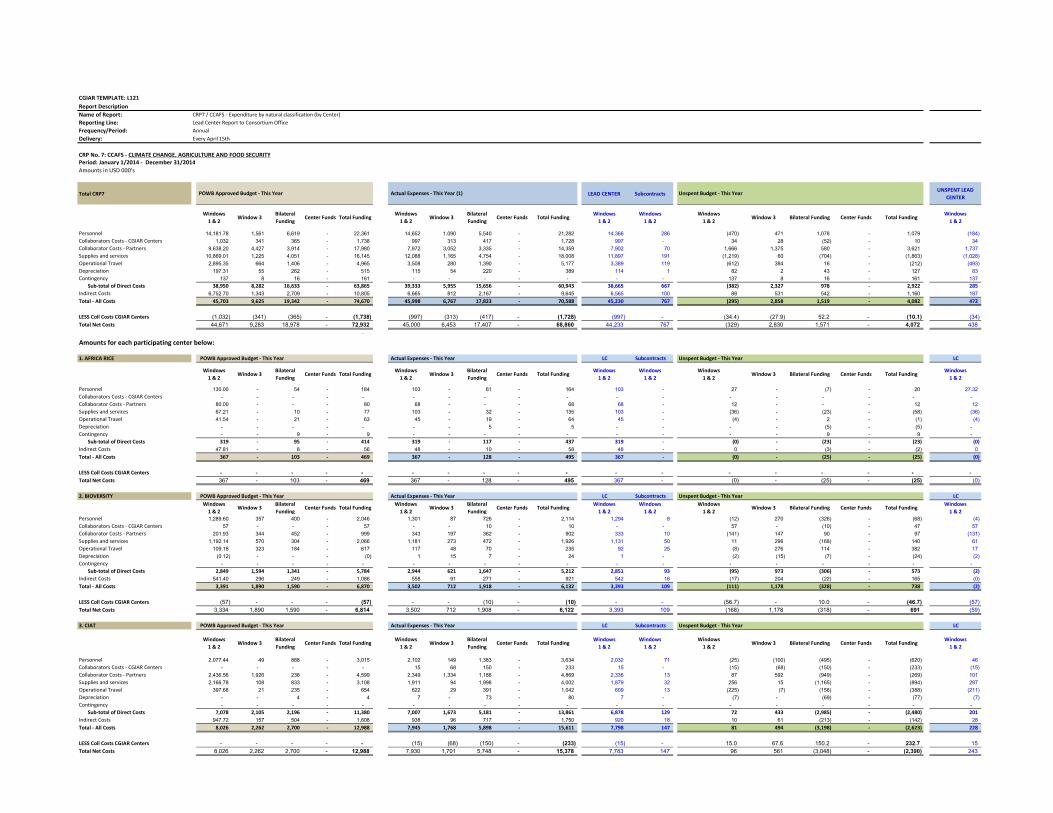
CGIAR TEMPLATE: L121Report DescriptionName of Report: CRP7 / CCAFS - Expenditure by natural classification (by Center)Reporting Line: Lead Center Report to Consortium OfficeFrequency/Period: AnnualDelivery: Every April 15th
CRP No. 7: CCAFS - CLIMATE CHANGE, AGRICULTURE AND FOOD SECURITYPeriod: January 1/2014 - December 31/2014Amounts in USD 000's
Total CRP7 POWB Approved Budget - This Year Actual Expenses - This Year (1) LEAD CENTER Subcontracts Unspent Budget - This Year UNSPENT LEAD CENTER
Windows 1 & 2
Window 3Bilateral Funding
Center Funds Total FundingWindows
1 & 2 Window 3
Bilateral Funding
Center Funds Total FundingWindows
1 & 2Windows
1 & 2Windows
1 & 2Window 3 Bilateral Funding Center Funds Total Funding
Windows1 & 2
Personnel 14,181.78 1,561 6,619 - 22,361 14,652 1,090 5,540 - 21,282 14,366 286 (470) 471 1,078 - 1,079 (184) Collaborators Costs - CGIAR Centers 1,032 341 365 - 1,738 997 313 417 - 1,728 997 - 34 28 (52) - 10 34 Collaborator Costs - Partners 9,638.20 4,427 3,914 - 17,980 7,972 3,052 3,335 - 14,359 7,902 70 1,666 1,375 580 - 3,621 1,737 Supplies and services 10,869.01 1,225 4,051 - 16,145 12,088 1,165 4,754 - 18,008 11,897 191 (1,219) 60 (704) - (1,863) (1,028) Operational Travel 2,895.35 664 1,406 - 4,965 3,508 280 1,390 - 5,177 3,389 119 (612) 384 16 - (212) (493) Depreciation 197.31 55 262 - 515 115 54 220 - 389 114 1 82 2 43 - 127 83 Contingency 137 8 16 - 161 - - - - - - - 137 8 16 - 161 137 Sub-total of Direct Costs 38,950 8,282 16,633 - 63,865 39,333 5,955 15,656 - 60,943 38,665 667 (382) 2,327 978 - 2,922 285 Indirect Costs 6,752.70 1,343 2,709 - 10,805 6,665 812 2,167 - 9,645 6,565 100 88 531 542 - 1,160 187 Total - All Costs 45,703 9,625 19,342 - 74,670 45,998 6,767 17,823 - 70,588 45,230 767 (295) 2,858 1,519 - 4,082 472
LESS Coll Costs CGIAR Centers (1,032) (341) (365) - (1,738) (997) (313) (417) - (1,728) (997) - (34.4) (27.9) 52.2 - (10.1) (34) Total Net Costs 44,671 9,283 18,978 - 72,932 45,000 6,453 17,407 - 68,860 44,233 767 (329) 2,830 1,571 - 4,072 438
-
Amounts for each participating center below:
1. AFRICA RICE POWB Approved Budget - This Year Actual Expenses - This Year LC Subcontracts Unspent Budget - This Year LC
Windows 1 & 2
Window 3Bilateral Funding
Center Funds Total FundingWindows
1 & 2Window 3
Bilateral Funding
Center Funds Total FundingWindows
1 & 2Windows
1 & 2Windows
1 & 2Window 3 Bilateral Funding Center Funds Total Funding
Windows1 & 2
Personnel 130.00 - 54 - 184 103 - 61 - 164 103 - 27 - (7) - 20 27.32 Collaborators Costs - CGIAR Centers - - - - - - - - - - - - - - - - - - Collaborator Costs - Partners 80.00 - - - 80 68 - - - 68 68 - 12 - - - 12 12 Supplies and services 67.21 - 10 - 77 103 - 32 - 135 103 - (36) - (23) - (58) (36) Operational Travel 41.54 - 21 - 63 45 - 19 - 64 45 - (4) - 2 - (1) (4) Depreciation - - - - - - - 5 - 5 - - - - (5) - (5) - Contingency - - 9 - 9 - - - - - - - - - 9 - 9 - Sub-total of Direct Costs 319 - 95 - 414 319 - 117 - 437 319 - (0) - (23) - (23) (0) Indirect Costs 47.81 - 8 - 56 48 - 10 - 58 48 - 0 - (3) - (2) 0 Total - All Costs 367 - 103 - 469 367 - 128 - 495 367 - (0) - (25) - (25) (0)
LESS Coll Costs CGIAR Centers - - - - - - - - - - - - - - - - - - Total Net Costs 367 - 103 - 469 367 - 128 - 495 367 - (0) - (25) - (25) (0)
2. BIOVERSITY POWB Approved Budget - This Year Actual Expenses - This Year LC Subcontracts Unspent Budget - This Year LCWindows
1 & 2Window 3
Bilateral Funding
Center Funds Total FundingWindows
1 & 2Window 3
Bilateral Funding
Center Funds Total FundingWindows
1 & 2Windows
1 & 2Windows
1 & 2Window 3 Bilateral Funding Center Funds Total Funding
Windows1 & 2
Personnel 1,289.60 357 400 - 2,046 1,301 87 726 - 2,114 1,294 8 (12) 270 (326) - (68) (4) Collaborators Costs - CGIAR Centers 57 - - - 57 - - 10 - 10 - - 57 - (10) - 47 57 Collaborator Costs - Partners 201.93 344 452 - 999 343 197 362 - 902 333 10 (141) 147 90 - 97 (131) Supplies and services 1,192.14 570 304 - 2,066 1,181 273 472 - 1,926 1,131 50 11 296 (168) - 140 61 Operational Travel 109.18 323 184 - 617 117 48 70 - 235 92 25 (8) 276 114 - 382 17 Depreciation (0.12) - - - (0) 1 15 7 - 24 1 - (2) (15) (7) - (24) (2) Contingency - - - - - - - - - - - - - - - - - - Sub-total of Direct Costs 2,849 1,594 1,341 - 5,784 2,944 621 1,647 - 5,212 2,851 93 (95) 973 (306) - 573 (2) Indirect Costs 541.40 296 249 - 1,086 558 91 271 - 921 542 16 (17) 204 (22) - 165 (0) Total - All Costs 3,391 1,890 1,590 - 6,870 3,502 712 1,918 - 6,132 3,393 109 (111) 1,178 (328) - 738 (2)
LESS Coll Costs CGIAR Centers (57) - - - (57) - - (10) - (10) - - (56.7) - 10.0 - (46.7) (57) Total Net Costs 3,334 1,890 1,590 - 6,814 3,502 712 1,908 - 6,122 3,393 109 (168) 1,178 (318) - 691 (59)
3. CIAT POWB Approved Budget - This Year Actual Expenses - This Year LC Subcontracts Unspent Budget - This Year LC
Windows 1 & 2
Window 3Bilateral Funding
Center Funds Total FundingWindows
1 & 2Window 3
Bilateral Funding
Center Funds Total FundingWindows
1 & 2Windows
1 & 2Windows
1 & 2Window 3 Bilateral Funding Center Funds Total Funding
Windows1 & 2
Personnel 2,077.44 49 888 - 3,015 2,102 149 1,383 - 3,634 2,032 71 (25) (100) (495) - (620) 46 Collaborators Costs - CGIAR Centers - - - - - 15 68 150 - 233 15 - (15) (68) (150) - (233) (15) Collaborator Costs - Partners 2,436.56 1,926 236 - 4,599 2,349 1,334 1,186 - 4,869 2,336 13 87 592 (949) - (269) 101 Supplies and services 2,166.78 108 833 - 3,108 1,911 94 1,998 - 4,002 1,879 32 256 15 (1,165) - (894) 287 Operational Travel 397.68 21 235 - 654 622 29 391 - 1,042 609 13 (225) (7) (156) - (388) (211) Depreciation - - 4 - 4 7 - 73 - 80 7 - (7) - (69) - (77) (7) Contingency - - - - - - - - - - - - - - - - - - Sub-total of Direct Costs 7,078 2,105 2,196 - 11,380 7,007 1,673 5,181 - 13,861 6,878 129 72 433 (2,985) - (2,480) 201 Indirect Costs 947.72 157 504 - 1,608 938 96 717 - 1,750 920 18 10 61 (213) - (142) 28 Total - All Costs 8,026 2,262 2,700 - 12,988 7,945 1,768 5,898 - 15,611 7,798 147 81 494 (3,198) - (2,623) 228
LESS Coll Costs CGIAR Centers - - - - - (15) (68) (150) - (233) (15) - 15.0 67.6 150.2 - 232.7 15 Total Net Costs 8,026 2,262 2,700 - 12,988 7,930 1,701 5,748 - 15,378 7,783 147 96 561 (3,048) - (2,390) 243
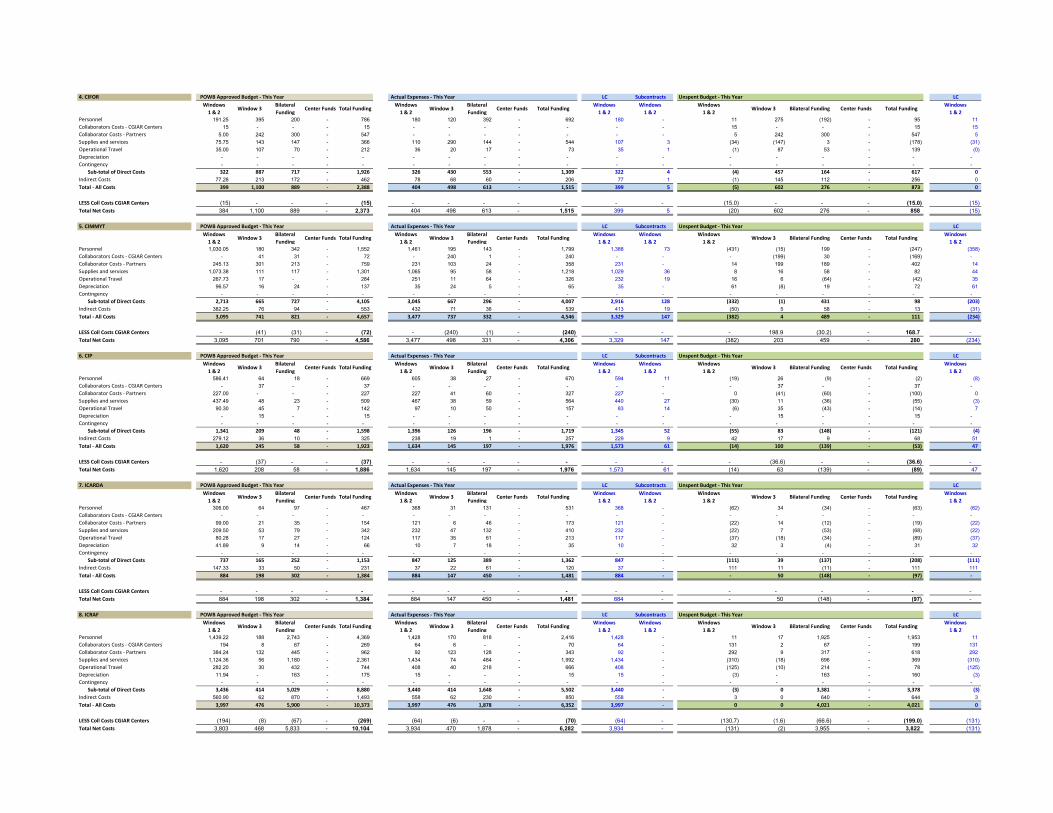
4. CIFOR POWB Approved Budget - This Year Actual Expenses - This Year LC Subcontracts Unspent Budget - This Year LCWindows
1 & 2Window 3
Bilateral Funding
Center Funds Total FundingWindows
1 & 2Window 3
Bilateral Funding
Center Funds Total FundingWindows
1 & 2Windows
1 & 2Windows
1 & 2Window 3 Bilateral Funding Center Funds Total Funding
Windows1 & 2
Personnel 191.25 395 200 - 786 180 120 392 - 692 180 - 11 275 (192) - 95 11 Collaborators Costs - CGIAR Centers 15 - - - 15 - - - - - - - 15 - - - 15 15 Collaborator Costs - Partners 5.00 242 300 - 547 - - - - - - - 5 242 300 - 547 5 Supplies and services 75.75 143 147 - 366 110 290 144 - 544 107 3 (34) (147) 3 - (178) (31) Operational Travel 35.00 107 70 - 212 36 20 17 - 73 35 1 (1) 87 53 - 139 (0) Depreciation - - - - - - - - - - - - - - - - - - Contingency - - - - - - - - - - - - - - - - - - Sub-total of Direct Costs 322 887 717 - 1,926 326 430 553 - 1,309 322 4 (4) 457 164 - 617 0 Indirect Costs 77.28 213 172 - 462 78 68 60 - 206 77 1 (1) 145 112 - 256 0 Total - All Costs 399 1,100 889 - 2,388 404 498 613 - 1,515 399 5 (5) 602 276 - 873 0
LESS Coll Costs CGIAR Centers (15) - - - (15) - - - - - - - (15.0) - - - (15.0) (15) Total Net Costs 384 1,100 889 - 2,373 404 498 613 - 1,515 399 5 (20) 602 276 - 858 (15)
5. CIMMYT POWB Approved Budget - This Year Actual Expenses - This Year LC Subcontracts Unspent Budget - This Year LCWindows
1 & 2Window 3
Bilateral Funding
Center Funds Total FundingWindows
1 & 2Window 3
Bilateral Funding
Center Funds Total FundingWindows
1 & 2Windows
1 & 2Windows
1 & 2Window 3 Bilateral Funding Center Funds Total Funding
Windows1 & 2
Personnel 1,030.05 180 342 - 1,552 1,461 195 143 - 1,799 1,388 73 (431) (15) 199 - (247) (358) Collaborators Costs - CGIAR Centers - 41 31 - 72 - 240 1 - 240 - - - (199) 30 - (169) - Collaborator Costs - Partners 245.13 301 213 - 759 231 103 24 - 358 231 - 14 199 189 - 402 14 Supplies and services 1,073.38 111 117 - 1,301 1,065 95 58 - 1,218 1,029 36 8 16 58 - 82 44 Operational Travel 267.73 17 - - 284 251 11 64 - 326 232 19 16 6 (64) - (42) 35 Depreciation 96.57 16 24 - 137 35 24 5 - 65 35 - 61 (8) 19 - 72 61 Contingency - - - - - - - - - - - - - - - - - - Sub-total of Direct Costs 2,713 665 727 - 4,105 3,045 667 296 - 4,007 2,916 128 (332) (1) 431 - 98 (203) Indirect Costs 382.25 76 94 - 553 432 71 36 - 539 413 19 (50) 5 58 - 13 (31) Total - All Costs 3,095 741 821 - 4,657 3,477 737 332 - 4,546 3,329 147 (382) 4 489 - 111 (234)
LESS Coll Costs CGIAR Centers - (41) (31) - (72) - (240) (1) - (240) - - - 198.9 (30.2) - 168.7 - Total Net Costs 3,095 701 790 - 4,586 3,477 498 331 - 4,306 3,329 147 (382) 203 459 - 280 (234)
6. CIP POWB Approved Budget - This Year Actual Expenses - This Year LC Subcontracts Unspent Budget - This Year LCWindows
1 & 2Window 3
Bilateral Funding
Center Funds Total FundingWindows
1 & 2Window 3
Bilateral Funding
Center Funds Total FundingWindows
1 & 2Windows
1 & 2Windows
1 & 2Window 3 Bilateral Funding Center Funds Total Funding
Windows1 & 2
Personnel 586.41 64 18 - 669 605 38 27 - 670 594 11 (19) 26 (9) - (2) (8) Collaborators Costs - CGIAR Centers - 37 - - 37 - - - - - - - - 37 - - 37 - Collaborator Costs - Partners 227.00 - - - 227 227 41 60 - 327 227 - 0 (41) (60) - (100) 0 Supplies and services 437.49 48 23 - 509 467 38 59 - 564 440 27 (30) 11 (36) - (55) (3) Operational Travel 90.30 45 7 - 142 97 10 50 - 157 83 14 (6) 35 (43) - (14) 7 Depreciation - 15 - - 15 - - - - - - - - 15 - - 15 - Contingency - - - - - - - - - - - - - - - - - - Sub-total of Direct Costs 1,341 209 48 - 1,598 1,396 126 196 - 1,719 1,345 52 (55) 83 (148) - (121) (4) Indirect Costs 279.12 36 10 - 325 238 19 1 - 257 229 9 42 17 9 - 68 51 Total - All Costs 1,620 245 58 - 1,923 1,634 145 197 - 1,976 1,573 61 (14) 100 (139) - (53) 47
LESS Coll Costs CGIAR Centers - (37) - - (37) - - - - - - - - (36.6) - - (36.6) - Total Net Costs 1,620 208 58 - 1,886 1,634 145 197 - 1,976 1,573 61 (14) 63 (139) - (89) 47
7. ICARDA POWB Approved Budget - This Year Actual Expenses - This Year LC Subcontracts Unspent Budget - This Year LCWindows
1 & 2Window 3
Bilateral Funding
Center Funds Total FundingWindows
1 & 2Window 3
Bilateral Funding
Center Funds Total FundingWindows
1 & 2Windows
1 & 2Windows
1 & 2Window 3 Bilateral Funding Center Funds Total Funding
Windows1 & 2
Personnel 306.00 64 97 - 467 368 31 131 - 531 368 - (62) 34 (34) - (63) (62) Collaborators Costs - CGIAR Centers - - - - - - - - - - - - - - - - - - Collaborator Costs - Partners 99.00 21 35 - 154 121 6 46 - 173 121 - (22) 14 (12) - (19) (22) Supplies and services 209.50 53 79 - 342 232 47 132 - 410 232 - (22) 7 (53) - (68) (22) Operational Travel 80.28 17 27 - 124 117 35 61 - 213 117 - (37) (18) (34) - (89) (37) Depreciation 41.89 9 14 - 66 10 7 18 - 35 10 - 32 3 (4) - 31 32 Contingency - - - - - - - - - - - - - - - - - - Sub-total of Direct Costs 737 165 252 - 1,153 847 125 389 - 1,362 847 - (111) 39 (137) - (208) (111) Indirect Costs 147.33 33 50 - 231 37 22 61 - 120 37 - 111 11 (11) - 111 111 Total - All Costs 884 198 302 - 1,384 884 147 450 - 1,481 884 - - 50 (148) - (97) -
LESS Coll Costs CGIAR Centers - - - - - - - - - - - - - - - - - - Total Net Costs 884 198 302 - 1,384 884 147 450 - 1,481 884 - - 50 (148) - (97) -
8. ICRAF POWB Approved Budget - This Year Actual Expenses - This Year LC Subcontracts Unspent Budget - This Year LCWindows
1 & 2Window 3
Bilateral Funding
Center Funds Total FundingWindows
1 & 2Window 3
Bilateral Funding
Center Funds Total FundingWindows
1 & 2Windows
1 & 2Windows
1 & 2Window 3 Bilateral Funding Center Funds Total Funding
Windows1 & 2
Personnel 1,439.22 188 2,743 - 4,369 1,428 170 818 - 2,416 1,428 - 11 17 1,925 - 1,953 11 Collaborators Costs - CGIAR Centers 194 8 67 - 269 64 6 - - 70 64 - 131 2 67 - 199 131 Collaborator Costs - Partners 384.24 132 445 - 962 92 123 128 - 343 92 - 292 9 317 - 618 292 Supplies and services 1,124.36 56 1,180 - 2,361 1,434 74 484 - 1,992 1,434 - (310) (18) 696 - 369 (310) Operational Travel 282.20 30 432 - 744 408 40 218 - 666 408 - (125) (10) 214 - 78 (125) Depreciation 11.94 - 163 - 175 15 - - - 15 15 - (3) - 163 - 160 (3) Contingency - - - - - - - - - - - - - - - - - - Sub-total of Direct Costs 3,436 414 5,029 - 8,880 3,440 414 1,648 - 5,502 3,440 - (3) 0 3,381 - 3,378 (3) Indirect Costs 560.90 62 870 - 1,493 558 62 230 - 850 558 - 3 0 640 - 644 3 Total - All Costs 3,997 476 5,900 - 10,373 3,997 476 1,878 - 6,352 3,997 - 0 0 4,021 - 4,021 0
LESS Coll Costs CGIAR Centers (194) (8) (67) - (269) (64) (6) - - (70) (64) - (130.7) (1.6) (66.6) - (199.0) (131) Total Net Costs 3,803 468 5,833 - 10,104 3,934 470 1,878 - 6,282 3,934 - (131) (2) 3,955 - 3,822 (131)
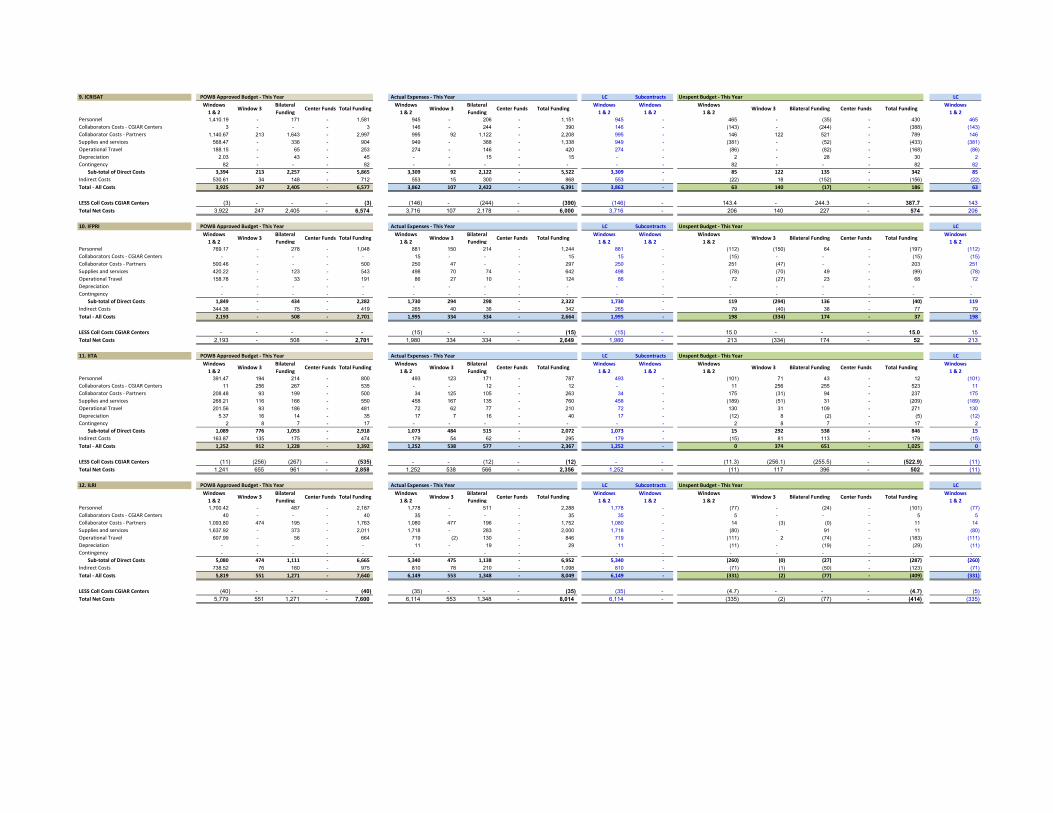
9. ICRISAT POWB Approved Budget - This Year Actual Expenses - This Year LC Subcontracts Unspent Budget - This Year LCWindows
1 & 2Window 3
Bilateral Funding
Center Funds Total FundingWindows
1 & 2Window 3
Bilateral Funding
Center Funds Total FundingWindows
1 & 2Windows
1 & 2Windows
1 & 2Window 3 Bilateral Funding Center Funds Total Funding
Windows1 & 2
Personnel 1,410.19 - 171 - 1,581 945 - 206 - 1,151 945 - 465 - (35) - 430 465 Collaborators Costs - CGIAR Centers 3 - - - 3 146 - 244 - 390 146 - (143) - (244) - (388) (143) Collaborator Costs - Partners 1,140.67 213 1,643 - 2,997 995 92 1,122 - 2,208 995 - 146 122 521 - 789 146 Supplies and services 568.47 - 336 - 904 949 - 388 - 1,338 949 - (381) - (52) - (433) (381) Operational Travel 188.15 - 65 - 253 274 - 146 - 420 274 - (86) - (82) - (168) (86) Depreciation 2.03 - 43 - 45 - - 15 - 15 - - 2 - 28 - 30 2 Contingency 82 - - - 82 - - - - - - - 82 - - - 82 82 Sub-total of Direct Costs 3,394 213 2,257 - 5,865 3,309 92 2,122 - 5,522 3,309 - 85 122 135 - 342 85 Indirect Costs 530.61 34 148 - 712 553 15 300 - 868 553 - (22) 18 (152) - (156) (22) Total - All Costs 3,925 247 2,405 - 6,577 3,862 107 2,422 - 6,391 3,862 - 63 140 (17) - 186 63
LESS Coll Costs CGIAR Centers (3) - - - (3) (146) - (244) - (390) (146) - 143.4 - 244.3 - 387.7 143 Total Net Costs 3,922 247 2,405 - 6,574 3,716 107 2,178 - 6,000 3,716 - 206 140 227 - 574 206
10. IFPRI POWB Approved Budget - This Year Actual Expenses - This Year LC Subcontracts Unspent Budget - This Year LCWindows
1 & 2Window 3
Bilateral Funding
Center Funds Total FundingWindows
1 & 2Window 3
Bilateral Funding
Center Funds Total FundingWindows
1 & 2Windows
1 & 2Windows
1 & 2Window 3 Bilateral Funding Center Funds Total Funding
Windows1 & 2
Personnel 769.17 - 278 - 1,048 881 150 214 - 1,244 881 - (112) (150) 64 - (197) (112) Collaborators Costs - CGIAR Centers - - - - - 15 - - - 15 15 - (15) - - - (15) (15) Collaborator Costs - Partners 500.46 - - - 500 250 47 - - 297 250 - 251 (47) - - 203 251 Supplies and services 420.22 - 123 - 543 498 70 74 - 642 498 - (78) (70) 49 - (99) (78) Operational Travel 158.78 - 33 - 191 86 27 10 - 124 86 - 72 (27) 23 - 68 72 Depreciation - - - - - - - - - - - - - - - - - - Contingency - - - - - - - - - - - - - - - - - - Sub-total of Direct Costs 1,849 - 434 - 2,282 1,730 294 298 - 2,322 1,730 - 119 (294) 136 - (40) 119 Indirect Costs 344.38 - 75 - 419 265 40 36 - 342 265 - 79 (40) 38 - 77 79 Total - All Costs 2,193 - 508 - 2,701 1,995 334 334 - 2,664 1,995 - 198 (334) 174 - 37 198
LESS Coll Costs CGIAR Centers - - - - - (15) - - - (15) (15) - 15.0 - - - 15.0 15 Total Net Costs 2,193 - 508 - 2,701 1,980 334 334 - 2,649 1,980 - 213 (334) 174 - 52 213
11. IITA POWB Approved Budget - This Year Actual Expenses - This Year LC Subcontracts Unspent Budget - This Year LCWindows
1 & 2Window 3
Bilateral Funding
Center Funds Total FundingWindows
1 & 2Window 3
Bilateral Funding
Center Funds Total FundingWindows
1 & 2Windows
1 & 2Windows
1 & 2Window 3 Bilateral Funding Center Funds Total Funding
Windows1 & 2
Personnel 391.47 194 214 - 800 493 123 171 - 787 493 - (101) 71 43 - 12 (101) Collaborators Costs - CGIAR Centers 11 256 267 - 535 - - 12 - 12 - - 11 256 255 - 523 11 Collaborator Costs - Partners 208.48 93 199 - 500 34 125 105 - 263 34 - 175 (31) 94 - 237 175 Supplies and services 268.21 116 166 - 550 458 167 135 - 760 458 - (189) (51) 31 - (209) (189) Operational Travel 201.56 93 186 - 481 72 62 77 - 210 72 - 130 31 109 - 271 130 Depreciation 5.37 16 14 - 35 17 7 16 - 40 17 - (12) 8 (2) - (5) (12) Contingency 2 8 7 - 17 - - - - - - - 2 8 7 - 17 2 Sub-total of Direct Costs 1,089 776 1,053 - 2,918 1,073 484 515 - 2,072 1,073 - 15 292 538 - 846 15 Indirect Costs 163.87 135 175 - 474 179 54 62 - 295 179 - (15) 81 113 - 179 (15) Total - All Costs 1,252 912 1,228 - 3,392 1,252 538 577 - 2,367 1,252 - 0 374 651 - 1,025 0
LESS Coll Costs CGIAR Centers (11) (256) (267) - (535) - - (12) - (12) - - (11.3) (256.1) (255.5) - (522.9) (11) Total Net Costs 1,241 655 961 - 2,858 1,252 538 566 - 2,356 1,252 - (11) 117 396 - 502 (11)
12. ILRI POWB Approved Budget - This Year Actual Expenses - This Year LC Subcontracts Unspent Budget - This Year LCWindows
1 & 2Window 3
Bilateral Funding
Center Funds Total FundingWindows
1 & 2Window 3
Bilateral Funding
Center Funds Total FundingWindows
1 & 2Windows
1 & 2Windows
1 & 2Window 3 Bilateral Funding Center Funds Total Funding
Windows1 & 2
Personnel 1,700.42 - 487 - 2,187 1,778 - 511 - 2,288 1,778 - (77) - (24) - (101) (77) Collaborators Costs - CGIAR Centers 40 - - - 40 35 - - - 35 35 - 5 - - - 5 5 Collaborator Costs - Partners 1,093.80 474 195 - 1,763 1,080 477 196 - 1,752 1,080 - 14 (3) (0) - 11 14 Supplies and services 1,637.92 - 373 - 2,011 1,718 - 283 - 2,000 1,718 - (80) - 91 - 11 (80) Operational Travel 607.99 - 56 - 664 719 (2) 130 - 846 719 - (111) 2 (74) - (183) (111) Depreciation - - - - - 11 - 19 - 29 11 - (11) - (19) - (29) (11) Contingency - - - - - - - - - - - - - - - - - - Sub-total of Direct Costs 5,080 474 1,111 - 6,665 5,340 475 1,138 - 6,952 5,340 - (260) (0) (27) - (287) (260) Indirect Costs 738.52 76 160 - 975 810 78 210 - 1,098 810 - (71) (1) (50) - (123) (71) Total - All Costs 5,819 551 1,271 - 7,640 6,149 553 1,348 - 8,049 6,149 - (331) (2) (77) - (409) (331)
LESS Coll Costs CGIAR Centers (40) - - - (40) (35) - - - (35) (35) - (4.7) - - - (4.7) (5) Total Net Costs 5,779 551 1,271 - 7,600 6,114 553 1,348 - 8,014 6,114 - (335) (2) (77) - (414) (335)
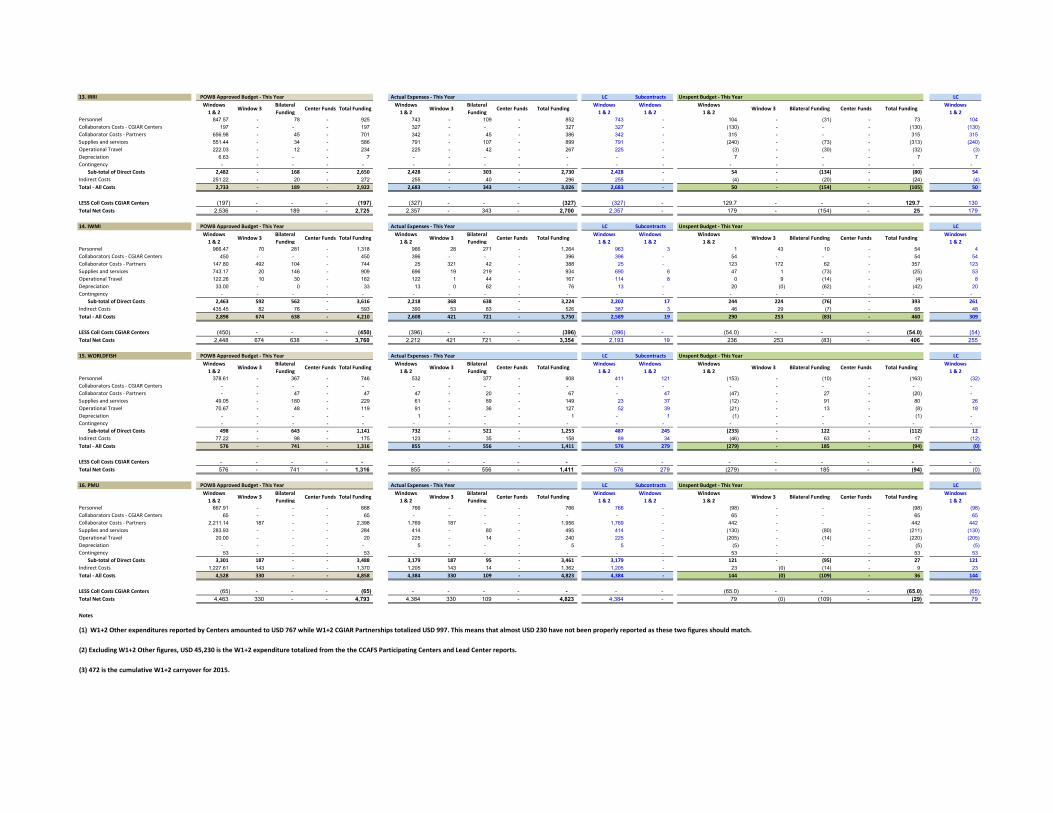
13. IRRI POWB Approved Budget - This Year Actual Expenses - This Year LC Subcontracts Unspent Budget - This Year LCWindows
1 & 2Window 3
Bilateral Funding
Center Funds Total FundingWindows
1 & 2Window 3
Bilateral Funding
Center Funds Total FundingWindows
1 & 2Windows
1 & 2Windows
1 & 2Window 3 Bilateral Funding Center Funds Total Funding
Windows1 & 2
Personnel 847.57 - 78 - 925 743 - 109 - 852 743 - 104 - (31) - 73 104 Collaborators Costs - CGIAR Centers 197 - - - 197 327 - - - 327 327 - (130) - - - (130) (130) Collaborator Costs - Partners 656.98 - 45 - 701 342 - 45 - 386 342 - 315 - - - 315 315 Supplies and services 551.44 - 34 - 586 791 - 107 - 899 791 - (240) - (73) - (313) (240) Operational Travel 222.03 - 12 - 234 225 - 42 - 267 225 - (3) - (30) - (32) (3) Depreciation 6.63 - - - 7 - - - - - - - 7 - - - 7 7 Contingency - - - - - - - - - - - - - - - - - - Sub-total of Direct Costs 2,482 - 168 - 2,650 2,428 - 303 - 2,730 2,428 - 54 - (134) - (80) 54 Indirect Costs 251.22 - 20 - 272 255 - 40 - 296 255 - (4) - (20) - (24) (4) Total - All Costs 2,733 - 189 - 2,922 2,683 - 343 - 3,026 2,683 - 50 - (154) - (105) 50
LESS Coll Costs CGIAR Centers (197) - - - (197) (327) - - - (327) (327) - 129.7 - - - 129.7 130 Total Net Costs 2,536 - 189 - 2,725 2,357 - 343 - 2,700 2,357 - 179 - (154) - 25 179
14. IWMI POWB Approved Budget - This Year Actual Expenses - This Year LC Subcontracts Unspent Budget - This Year LCWindows
1 & 2Window 3
Bilateral Funding
Center Funds Total FundingWindows
1 & 2Window 3
Bilateral Funding
Center Funds Total FundingWindows
1 & 2Windows
1 & 2Windows
1 & 2Window 3 Bilateral Funding Center Funds Total Funding
Windows1 & 2
Personnel 966.47 70 281 - 1,318 966 28 271 - 1,264 963 3 1 43 10 - 54 4 Collaborators Costs - CGIAR Centers 450 - - - 450 396 - - - 396 396 - 54 - - - 54 54 Collaborator Costs - Partners 147.80 492 104 - 744 25 321 42 - 388 25 - 123 172 62 - 357 123 Supplies and services 743.17 20 146 - 909 696 19 219 - 934 690 6 47 1 (73) - (25) 53 Operational Travel 122.26 10 30 - 162 122 1 44 - 167 114 8 0 9 (14) - (4) 8 Depreciation 33.00 - 0 - 33 13 0 62 - 76 13 - 20 (0) (62) - (42) 20 Contingency - - - - - - - - - - - - - - - - - - Sub-total of Direct Costs 2,463 592 562 - 3,616 2,218 368 638 - 3,224 2,202 17 244 224 (76) - 393 261 Indirect Costs 435.45 82 76 - 593 390 53 83 - 526 387 3 46 29 (7) - 68 48 Total - All Costs 2,898 674 638 - 4,210 2,608 421 721 - 3,750 2,589 19 290 253 (83) - 460 309
LESS Coll Costs CGIAR Centers (450) - - - (450) (396) - - - (396) (396) - (54.0) - - - (54.0) (54) Total Net Costs 2,448 674 638 - 3,760 2,212 421 721 - 3,354 2,193 19 236 253 (83) - 406 255
15. WORLDFISH POWB Approved Budget - This Year Actual Expenses - This Year LC Subcontracts Unspent Budget - This Year LCWindows
1 & 2Window 3
Bilateral Funding
Center Funds Total FundingWindows
1 & 2Window 3
Bilateral Funding
Center Funds Total FundingWindows
1 & 2Windows
1 & 2Windows
1 & 2Window 3 Bilateral Funding Center Funds Total Funding
Windows1 & 2
Personnel 378.61 - 367 - 746 532 - 377 - 908 411 121 (153) - (10) - (163) (32) Collaborators Costs - CGIAR Centers - - - - - - - - - - - - - - - - - - Collaborator Costs - Partners - - 47 - 47 47 - 20 - 67 - 47 (47) - 27 - (20) - Supplies and services 49.05 - 180 - 229 61 - 89 - 149 23 37 (12) - 91 - 80 26 Operational Travel 70.67 - 48 - 119 91 - 36 - 127 52 39 (21) - 13 - (8) 18 Depreciation - - - - - 1 - - - 1 - 1 (1) - - - (1) - Contingency - - - - - - - - - - - - - - - - - - Sub-total of Direct Costs 498 - 643 - 1,141 732 - 521 - 1,253 487 245 (233) - 122 - (112) 12 Indirect Costs 77.22 - 98 - 175 123 - 35 - 158 89 34 (46) - 63 - 17 (12) Total - All Costs 576 - 741 - 1,316 855 - 556 - 1,411 576 279 (279) - 185 - (94) (0)
LESS Coll Costs CGIAR Centers - - - - - - - - - - - - - - - - - - Total Net Costs 576 - 741 - 1,316 855 - 556 - 1,411 576 279 (279) - 185 - (94) (0)
16. PMU POWB Approved Budget - This Year Actual Expenses - This Year LC Subcontracts Unspent Budget - This Year LCWindows
1 & 2Window 3
Bilateral Funding
Center Funds Total FundingWindows
1 & 2Window 3
Bilateral Funding
Center Funds Total FundingWindows
1 & 2Windows
1 & 2Windows
1 & 2Window 3 Bilateral Funding Center Funds Total Funding
Windows1 & 2
Personnel 667.91 - - - 668 766 - - - 766 766 - (98) - - - (98) (98) Collaborators Costs - CGIAR Centers 65 - - - 65 - - - - - - - 65 - - - 65 65 Collaborator Costs - Partners 2,211.14 187 - - 2,398 1,769 187 - - 1,956 1,769 - 442 - - - 442 442 Supplies and services 283.93 - - - 284 414 - 80 - 495 414 - (130) - (80) - (211) (130) Operational Travel 20.00 - - - 20 225 - 14 - 240 225 - (205) - (14) - (220) (205) Depreciation - - - - - 5 - - - 5 5 - (5) - - - (5) (5) Contingency 53 - - - 53 - - - - - - - 53 - - - 53 53 Sub-total of Direct Costs 3,301 187 - - 3,488 3,179 187 95 - 3,461 3,179 - 121 - (95) - 27 121 Indirect Costs 1,227.61 143 - - 1,370 1,205 143 14 - 1,362 1,205 - 23 (0) (14) - 9 23 Total - All Costs 4,528 330 - - 4,858 4,384 330 109 - 4,823 4,384 - 144 (0) (109) - 36 144
LESS Coll Costs CGIAR Centers (65) - - - (65) - - - - - - - (65.0) - - - (65.0) (65) Total Net Costs 4,463 330 - - 4,793 4,384 330 109 - 4,823 4,384 - 79 (0) (109) - (29) 79
Notes
(3) 472 is the cumulative W1+2 carryover for 2015.
(2) Excluding W1+2 Other figures, USD 45,230 is the W1+2 expenditure totalized from the the CCAFS Participating Centers and Lead Center reports.
(1) W1+2 Other expenditures reported by Centers amounted to USD 767 while W1+2 CGIAR Partnerships totalized USD 997. This means that almost USD 230 have not been properly reported as these two figures should match.
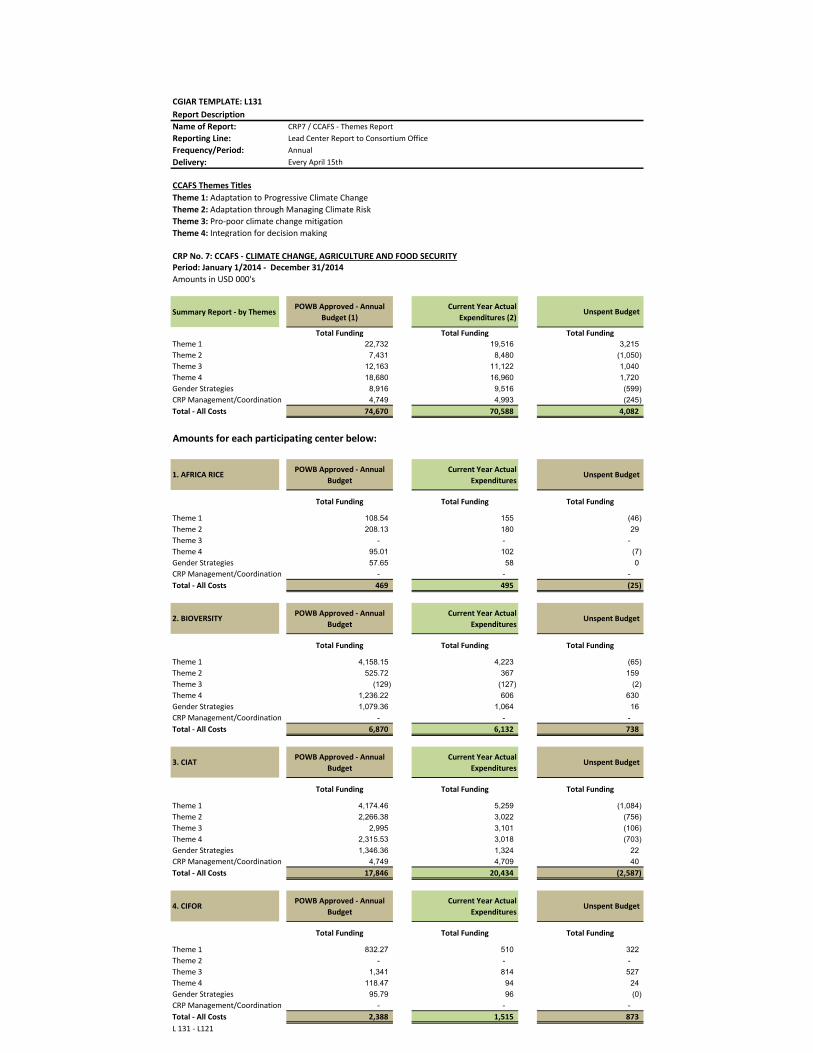
CGIAR TEMPLATE: L131Report DescriptionName of Report: CRP7 / CCAFS - Themes ReportReporting Line: Lead Center Report to Consortium OfficeFrequency/Period: AnnualDelivery: Every April 15th
CCAFS Themes TitlesTheme 1: Adaptation to Progressive Climate Change Theme 2: Adaptation through Managing Climate Risk Theme 3: Pro-poor climate change mitigationTheme 4: Integration for decision making
CRP No. 7: CCAFS - CLIMATE CHANGE, AGRICULTURE AND FOOD SECURITYPeriod: January 1/2014 - December 31/2014Amounts in USD 000's
Summary Report - by ThemesPOWB Approved - Annual
Budget (1)Current Year Actual
Expenditures (2)Unspent Budget
Total Funding Total Funding Total FundingTheme 1 22,732 19,516 3,215 Theme 2 7,431 8,480 (1,050) Theme 3 12,163 11,122 1,040 Theme 4 18,680 16,960 1,720 Gender Strategies 8,916 9,516 (599) CRP Management/Coordination 4,749 4,993 (245) Total - All Costs 74,670 70,588 4,082
Amounts for each participating center below:
1. AFRICA RICE POWB Approved - Annual Budget
Current Year Actual Expenditures
Unspent Budget
Total Funding Total Funding Total Funding
Theme 1 108.54 155 (46) Theme 2 208.13 180 29 Theme 3 - - - Theme 4 95.01 102 (7) Gender Strategies 57.65 58 0 CRP Management/Coordination - - - Total - All Costs 469 495 (25)
2. BIOVERSITY POWB Approved - Annual Budget
Current Year Actual Expenditures
Unspent Budget
Total Funding Total Funding Total Funding
Theme 1 4,158.15 4,223 (65) Theme 2 525.72 367 159 Theme 3 (129) (127) (2) Theme 4 1,236.22 606 630 Gender Strategies 1,079.36 1,064 16 CRP Management/Coordination - - - Total - All Costs 6,870 6,132 738
3. CIAT POWB Approved - Annual Budget
Current Year Actual Expenditures
Unspent Budget
Total Funding Total Funding Total Funding
Theme 1 4,174.46 5,259 (1,084) Theme 2 2,266.38 3,022 (756) Theme 3 2,995 3,101 (106) Theme 4 2,315.53 3,018 (703) Gender Strategies 1,346.36 1,324 22 CRP Management/Coordination 4,749 4,709 40 Total - All Costs 17,846 20,434 (2,587)
4. CIFOR POWB Approved - Annual Budget
Current Year Actual Expenditures
Unspent Budget
Total Funding Total Funding Total Funding
Theme 1 832.27 510 322 Theme 2 - - - Theme 3 1,341 814 527 Theme 4 118.47 94 24 Gender Strategies 95.79 96 (0) CRP Management/Coordination - - - Total - All Costs 2,388 1,515 873 L 131 - L121
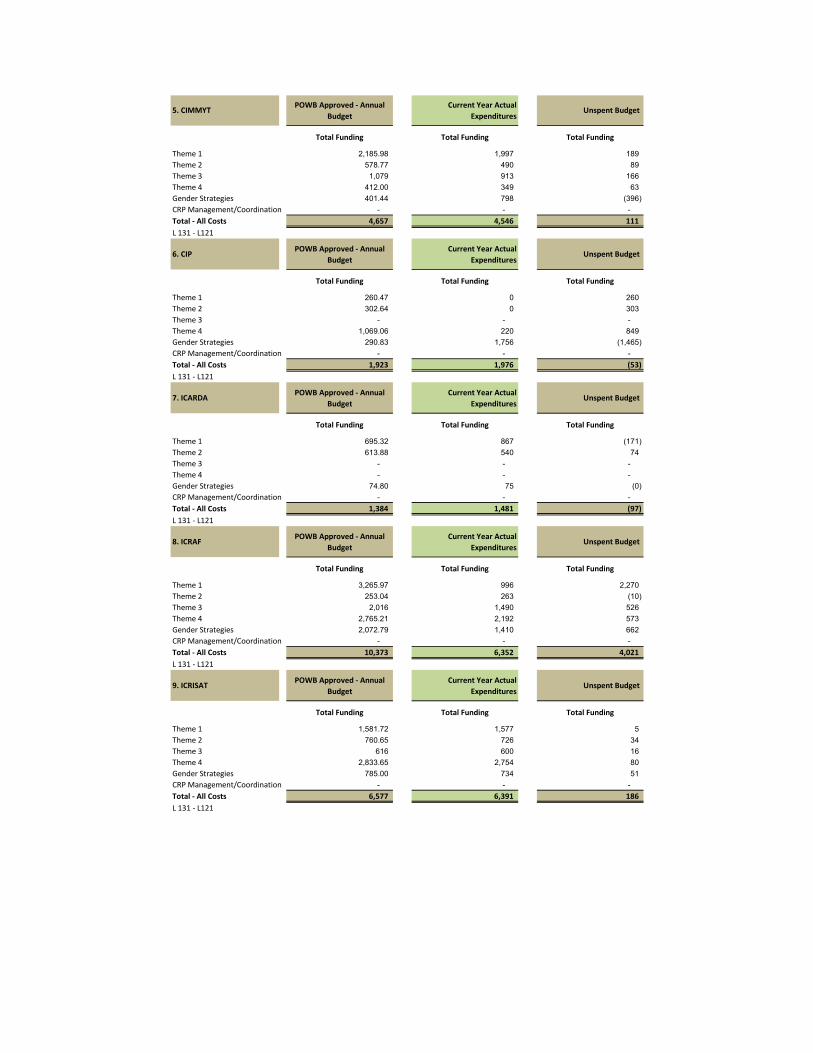
5. CIMMYT POWB Approved - Annual Budget
Current Year Actual Expenditures
Unspent Budget
Total Funding Total Funding Total Funding
Theme 1 2,185.98 1,997 189 Theme 2 578.77 490 89 Theme 3 1,079 913 166 Theme 4 412.00 349 63 Gender Strategies 401.44 798 (396) CRP Management/Coordination - - - Total - All Costs 4,657 4,546 111 L 131 - L121
6. CIP POWB Approved - Annual Budget
Current Year Actual Expenditures
Unspent Budget
Total Funding Total Funding Total Funding
Theme 1 260.47 0 260 Theme 2 302.64 0 303 Theme 3 - - - Theme 4 1,069.06 220 849 Gender Strategies 290.83 1,756 (1,465) CRP Management/Coordination - - - Total - All Costs 1,923 1,976 (53) L 131 - L121
7. ICARDA POWB Approved - Annual Budget
Current Year Actual Expenditures
Unspent Budget
Total Funding Total Funding Total Funding
Theme 1 695.32 867 (171) Theme 2 613.88 540 74 Theme 3 - - - Theme 4 - - - Gender Strategies 74.80 75 (0) CRP Management/Coordination - - - Total - All Costs 1,384 1,481 (97) L 131 - L121
8. ICRAF POWB Approved - Annual Budget
Current Year Actual Expenditures
Unspent Budget
Total Funding Total Funding Total Funding
Theme 1 3,265.97 996 2,270 Theme 2 253.04 263 (10) Theme 3 2,016 1,490 526 Theme 4 2,765.21 2,192 573 Gender Strategies 2,072.79 1,410 662 CRP Management/Coordination - - - Total - All Costs 10,373 6,352 4,021 L 131 - L121
9. ICRISAT POWB Approved - Annual Budget
Current Year Actual Expenditures
Unspent Budget
Total Funding Total Funding Total Funding
Theme 1 1,581.72 1,577 5 Theme 2 760.65 726 34 Theme 3 616 600 16 Theme 4 2,833.65 2,754 80 Gender Strategies 785.00 734 51 CRP Management/Coordination - - - Total - All Costs 6,577 6,391 186 L 131 - L121
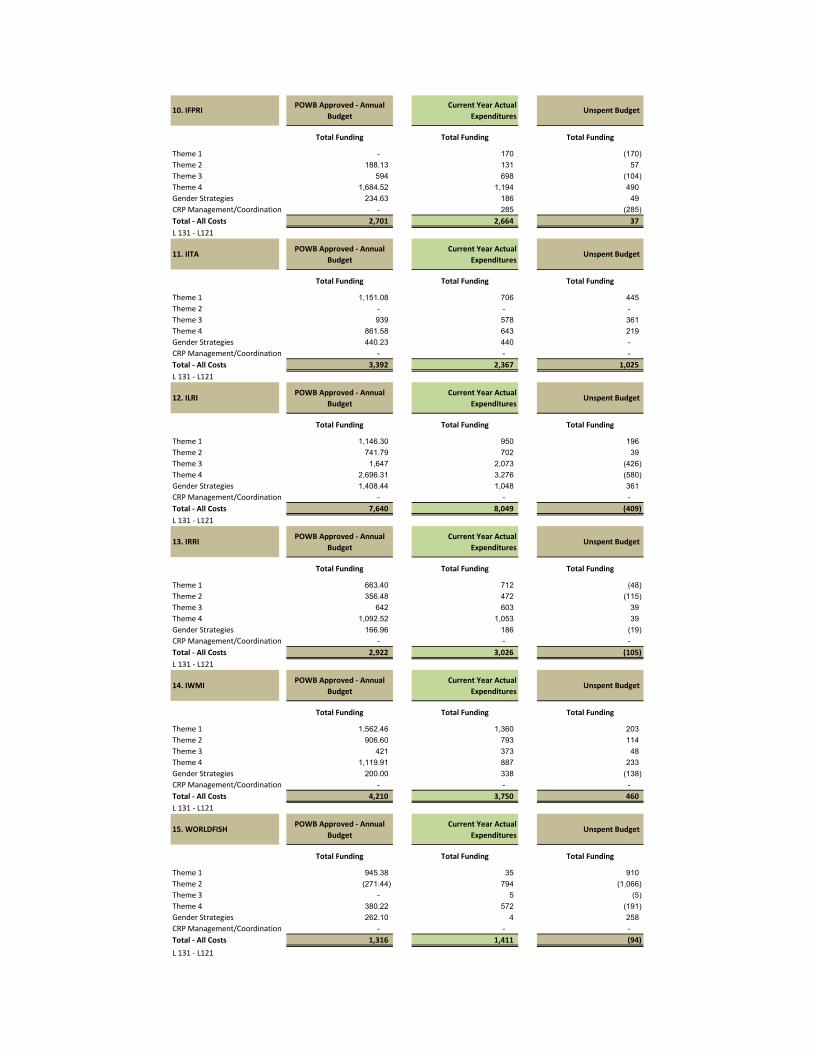
10. IFPRI POWB Approved - Annual Budget
Current Year Actual Expenditures
Unspent Budget
Total Funding Total Funding Total Funding
Theme 1 - 170 (170) Theme 2 188.13 131 57 Theme 3 594 698 (104) Theme 4 1,684.52 1,194 490 Gender Strategies 234.63 186 49 CRP Management/Coordination - 285 (285) Total - All Costs 2,701 2,664 37 L 131 - L121
11. IITA POWB Approved - Annual Budget
Current Year Actual Expenditures
Unspent Budget
Total Funding Total Funding Total Funding
Theme 1 1,151.08 706 445 Theme 2 - - - Theme 3 939 578 361 Theme 4 861.58 643 219 Gender Strategies 440.23 440 - CRP Management/Coordination - - - Total - All Costs 3,392 2,367 1,025 L 131 - L121
12. ILRI POWB Approved - Annual Budget
Current Year Actual Expenditures
Unspent Budget
Total Funding Total Funding Total Funding
Theme 1 1,146.30 950 196 Theme 2 741.79 702 39 Theme 3 1,647 2,073 (426) Theme 4 2,696.31 3,276 (580) Gender Strategies 1,408.44 1,048 361 CRP Management/Coordination - - - Total - All Costs 7,640 8,049 (409) L 131 - L121
13. IRRI POWB Approved - Annual Budget
Current Year Actual Expenditures
Unspent Budget
Total Funding Total Funding Total Funding
Theme 1 663.40 712 (48) Theme 2 356.48 472 (115) Theme 3 642 603 39 Theme 4 1,092.52 1,053 39 Gender Strategies 166.96 186 (19) CRP Management/Coordination - - - Total - All Costs 2,922 3,026 (105) L 131 - L121
14. IWMI POWB Approved - Annual Budget
Current Year Actual Expenditures
Unspent Budget
Total Funding Total Funding Total Funding
Theme 1 1,562.46 1,360 203 Theme 2 906.60 793 114 Theme 3 421 373 48 Theme 4 1,119.91 887 233 Gender Strategies 200.00 338 (138) CRP Management/Coordination - - - Total - All Costs 4,210 3,750 460 L 131 - L121
15. WORLDFISH POWB Approved - Annual Budget
Current Year Actual Expenditures
Unspent Budget
Total Funding Total Funding Total Funding
Theme 1 945.38 35 910 Theme 2 (271.44) 794 (1,066) Theme 3 - 5 (5) Theme 4 380.22 572 (191) Gender Strategies 262.10 4 258 CRP Management/Coordination - - - Total - All Costs 1,316 1,411 (94) L 131 - L121
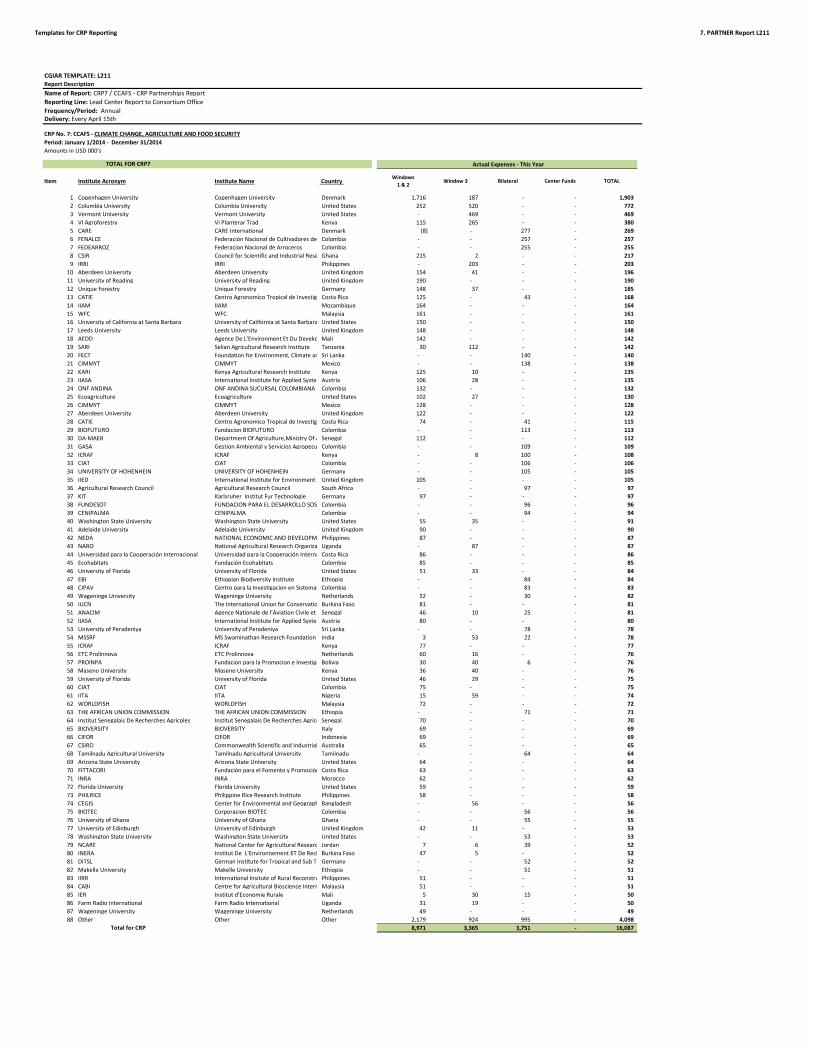
Templates for CRP Reporting 7. PARTNER Report L211
CGIAR TEMPLATE: L211Report DescriptionName of Report: CRP7 / CCAFS - CRP Partnerships ReportReporting Line: Lead Center Report to Consortium OfficeFrequency/Period: AnnualDelivery: Every April 15th
CRP No. 7: CCAFS - CLIMATE CHANGE, AGRICULTURE AND FOOD SECURITYPeriod: January 1/2014 - December 31/2014Amounts in USD 000's
Item Institute Acronym Institute Name Country Windows 1 & 2
Window 3 Bilateral Center Funds TOTAL
1 Copenhagen University Copenhagen University Denmark 1,716 187 - - 1,903 2 Columbia University Columbia University United States 252 520 - - 772 3 Vermont University Vermont University United States - 469 - - 469 4 VI Agroforestry Vi Planterar Trad Kenya 115 265 - - 380 5 CARE CARE International Denmark (8) - 277 - 269 6 FENALCE Federación Nacional de Cultivadores de Colombia - - 257 - 257 7 FEDEARROZ Federacion Nacional de Arroceros Colombia - - 255 - 255 8 CSIR Council for Scientific and Industrial Rese Ghana 215 2 - - 217 9 IRRI IRRI Philippines - 203 - - 203
10 Aberdeen University Aberdeen University United Kingdom 154 41 - - 196 11 University of Reading University of Reading United Kingdom 190 - - - 190 12 Unique Forestry Unique Forestry Germany 148 37 - - 185 13 CATIE Centro Agronomico Tropical de Investiga Costa Rica 125 - 43 - 168 14 IIAM IIAM Mozambique 164 - - - 164 15 WFC WFC Malaysia 161 - - - 161 16 University of California at Santa Barbara University of California at Santa Barbara United States 150 - - - 150 17 Leeds University Leeds University United Kingdom 148 - - - 148 18 AEDD Agence De L'Environment Et Du Deveko Mali 142 - - - 142 19 SARI Selian Agricultural Research Institute Tanzania 30 112 - - 142 20 FECT Foundation for Environment, Climate an Sri Lanka - - 140 - 140 21 CIMMYT CIMMYT Mexico - - 138 - 138 22 KARI Kenya Agricultural Research Institute Kenya 125 10 - - 135 23 IIASA International Institute for Applied System Austria 106 28 - - 135 24 ONF ANDINA ONF ANDINA SUCURSAL COLOMBIANA D Colombia 132 - - - 132 25 Ecoagriculture Ecoagriculture United States 102 27 - - 130 26 CIMMYT CIMMYT Mexico 128 - - - 128 27 Aberdeen University Aberdeen University United Kingdom 122 - - - 122 28 CATIE Centro Agronomico Tropical de Investiga Costa Rica 74 - 41 - 115 29 BIOFUTURO Fundacion BIOFUTURO Colombia - - 113 - 113 30 DA-MAER Department Of Agriculture,Ministry Of A Senegal 112 - - - 112 31 GASA Gestion Ambiental y Servicios Agropecu Colombia - - 109 - 109 32 ICRAF ICRAF Kenya - 8 100 - 108 33 CIAT CIAT Colombia - - 106 - 106 34 UNIVERSITY OF HOHENHEIN UNIVERSITY OF HOHENHEIN Germany - - 105 - 105 35 IIED International Institute for Environment a United Kingdom 105 - - - 105 36 Agricultural Research Council Agricultural Research Council South Africa - - 97 - 97 37 KIT Karlsruher Institut Fur Technologie Germany 97 - - - 97 38 FUNDESOT FUNDACION PARA EL DESARROLLO SOST Colombia - - 96 - 96 39 CENIPALMA CENIPALMA Colombia - - 94 - 94 40 Washington State University Washington State University United States 55 35 - - 91 41 Adelaide University Adelaide University United Kingdom 90 - - - 90 42 NEDA NATIONAL ECONOMIC AND DEVELOPM Philippines 87 - - - 87 43 NARO National Agricultural Research Organizat Uganda - 87 - - 87 44 Universidad para la Cooperación Internacional Universidad para la Cooperación Interna Costa Rica 86 - - - 86 45 Ecohabitats Fundación Ecohabitats Colombia 85 - - - 85 46 University of Florida University of Florida United States 51 33 - - 84 47 EBI Ethiopian Biodiversity Institute Ethiopia - - 84 - 84 48 CIPAV Centro para la Investigacion en Sistemas Colombia - - 83 - 83 49 Wageninge University Wageninge University Netherlands 52 - 30 - 82 50 IUCN The International Union for Conservatio Burkina Faso 81 - - - 81 51 ANACIM Agence Nationale de l’Aviation Civile et d Senegal 46 10 25 - 81 52 IIASA International Institute for Applied System Austria 80 - - - 80 53 University of Peradeniya University of Peradeniya Sri Lanka - - 78 - 78 54 MSSRF MS Swaminathan Research Foundation India 3 53 22 - 78 55 ICRAF ICRAF Kenya 77 - - - 77 56 ETC Prolinnova ETC Prolinnova Netherlands 60 16 - - 76 57 PROINPA Fundacion para la Promocion e Investiga Bolivia 30 40 6 - 76 58 Maseno University Maseno University Kenya 36 40 - - 76 59 University of Florida University of Florida United States 46 29 - - 75 60 CIAT CIAT Colombia 75 - - - 75 61 IITA IITA Nigeria 15 59 - - 74 62 WORLDFISH WORLDFISH Malaysia 72 - - - 72 63 THE AFRICAN UNION COMMISSION THE AFRICAN UNION COMMISSION Ethiopia - - 71 - 71 64 Institut Senegalais De Recherches Agricoles Institut Senegalais De Recherches Agrico Senegal 70 - - - 70 65 BIOVERSITY BIOVERSITY Italy 69 - - - 69 66 CIFOR CIFOR Indonesia 69 - - - 69 67 CSIRO Commonwealth Scientific and Industrial Australia 65 - - - 65 68 Tamilnadu Agricultural University Tamilnadu Agricultural University Tamilnadu - - 64 - 64 69 Arizona State University Arizona State University United States 64 - - - 64 70 FITTACORI Fundación para el Fomento y Promoción Costa Rica 63 - - - 63 71 INRA INRA Morocco 62 - - - 62 72 Florida University Florida University United States 59 - - - 59 73 PHILRICE Philippine Rice Research Institute Philippines 58 - - - 58 74 CEGIS Center for Environmental and Geograph Bangladesh - 56 - - 56 75 BIOTEC Corporacion BIOTEC Colombia - - 56 - 56 76 University of Ghana University of Ghana Ghana - - 55 - 55 77 University of Edinburgh University of Edinburgh United Kingdom 42 11 - - 53 78 Washington State University Washington State University United States - - 53 - 53 79 NCARE National Center for Agricultural Researc Jordan 7 6 39 - 52 80 INERA Institut De L'Environnement ET De Rech Burkina Faso 47 5 - - 52 81 DITSL German Institute for Tropical and Sub Tr Germany - - 52 - 52 82 Makelle University Makelle University Ethiopia - - 51 - 51 83 IIRR International Insitute of Rural Reconstru Philippines 51 - - - 51 84 CABI Centre for Agricultural Bioscience Intern Malaysia 51 - - - 51 85 IER Institut d'Economie Rurale Mali 5 30 15 - 50 86 Farm Radio International Farm Radio International Uganda 31 19 - - 50 87 Wageninge University Wageninge University Netherlands 49 - - - 49 88 Other Other Other 2,179 924 995 - 4,098
8,971 3,365 3,751 - 16,087
TOTAL FOR CRP7 Actual Expenses - This Year
Total for CRP
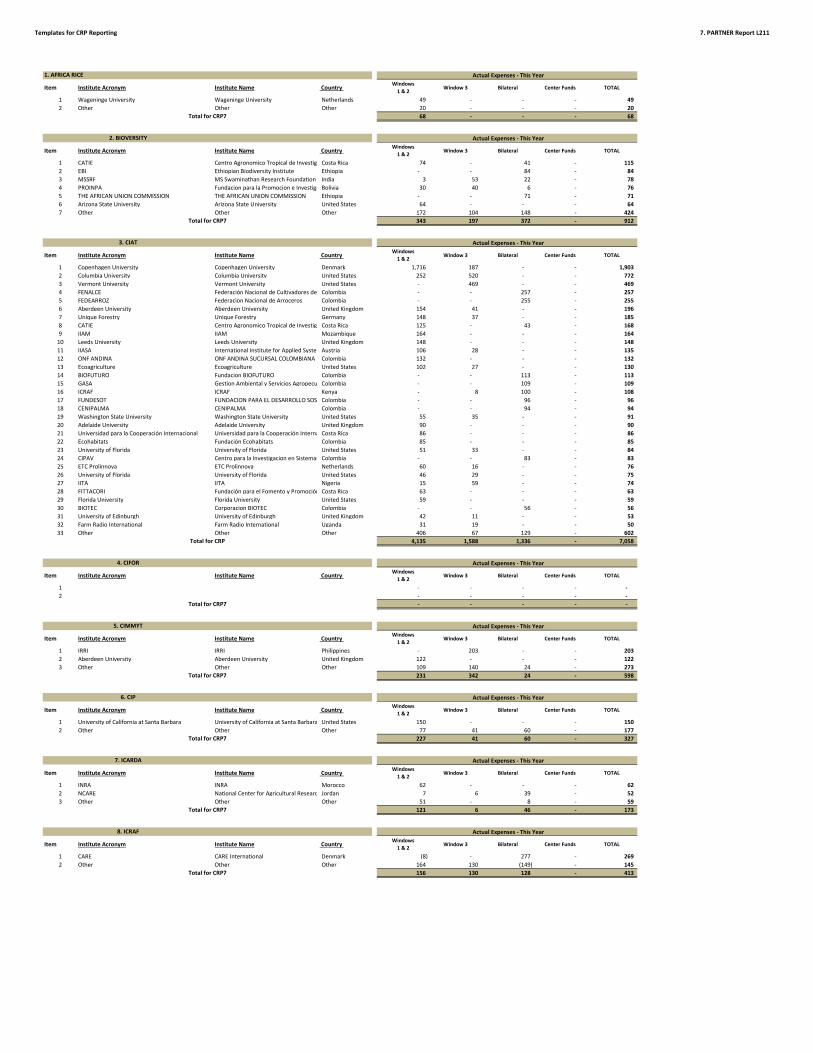
Templates for CRP Reporting 7. PARTNER Report L211
Item Institute Acronym Institute Name Country Windows 1 & 2
Window 3 Bilateral Center Funds TOTAL
1 Wageninge University Wageninge University Netherlands 49 - - - 49 2 Other Other Other 20 - - - 20
68 - - - 68
Item Institute Acronym Institute Name Country Windows 1 & 2
Window 3 Bilateral Center Funds TOTAL
1 CATIE Centro Agronomico Tropical de Investiga Costa Rica 74 - 41 - 115 2 EBI Ethiopian Biodiversity Institute Ethiopia - - 84 - 84 3 MSSRF MS Swaminathan Research Foundation India 3 53 22 - 78 4 PROINPA Fundacion para la Promocion e Investiga Bolivia 30 40 6 - 76 5 THE AFRICAN UNION COMMISSION THE AFRICAN UNION COMMISSION Ethiopia - - 71 - 71 6 Arizona State University Arizona State University United States 64 - - - 64 7 Other Other Other 172 104 148 - 424
343 197 372 - 912
Item Institute Acronym Institute Name Country Windows 1 & 2
Window 3 Bilateral Center Funds TOTAL
1 Copenhagen University Copenhagen University Denmark 1,716 187 - - 1,903 2 Columbia University Columbia University United States 252 520 - - 772 3 Vermont University Vermont University United States - 469 - - 469 4 FENALCE Federación Nacional de Cultivadores de Colombia - - 257 - 257 5 FEDEARROZ Federacion Nacional de Arroceros Colombia - - 255 - 255 6 Aberdeen University Aberdeen University United Kingdom 154 41 - - 196 7 Unique Forestry Unique Forestry Germany 148 37 - - 185 8 CATIE Centro Agronomico Tropical de Investiga Costa Rica 125 - 43 - 168 9 IIAM IIAM Mozambique 164 - - - 164
10 Leeds University Leeds University United Kingdom 148 - - - 148 11 IIASA International Institute for Applied System Austria 106 28 - - 135 12 ONF ANDINA ONF ANDINA SUCURSAL COLOMBIANA D Colombia 132 - - - 132 13 Ecoagriculture Ecoagriculture United States 102 27 - - 130 14 BIOFUTURO Fundacion BIOFUTURO Colombia - - 113 - 113 15 GASA Gestion Ambiental y Servicios Agropecu Colombia - - 109 - 109 16 ICRAF ICRAF Kenya - 8 100 - 108 17 FUNDESOT FUNDACION PARA EL DESARROLLO SOST Colombia - - 96 - 96 18 CENIPALMA CENIPALMA Colombia - - 94 - 94 19 Washington State University Washington State University United States 55 35 - - 91 20 Adelaide University Adelaide University United Kingdom 90 - - - 90 21 Universidad para la Cooperación Internacional Universidad para la Cooperación Interna Costa Rica 86 - - - 86 22 Ecohabitats Fundación Ecohabitats Colombia 85 - - - 85 23 University of Florida University of Florida United States 51 33 - - 84 24 CIPAV Centro para la Investigacion en Sistemas Colombia - - 83 - 83 25 ETC Prolinnova ETC Prolinnova Netherlands 60 16 - - 76 26 University of Florida University of Florida United States 46 29 - - 75 27 IITA IITA Nigeria 15 59 - - 74 28 FITTACORI Fundación para el Fomento y Promoción Costa Rica 63 - - - 63 29 Florida University Florida University United States 59 - - - 59 30 BIOTEC Corporacion BIOTEC Colombia - - 56 - 56 31 University of Edinburgh University of Edinburgh United Kingdom 42 11 - - 53 32 Farm Radio International Farm Radio International Uganda 31 19 - - 50 33 Other Other Other 406 67 129 - 602
4,135 1,588 1,336 - 7,058
Item Institute Acronym Institute Name Country Windows 1 & 2
Window 3 Bilateral Center Funds TOTAL
1 - - - - - 2 - - - - -
- - - - -
Item Institute Acronym Institute Name Country Windows 1 & 2
Window 3 Bilateral Center Funds TOTAL
1 IRRI IRRI Philippines - 203 - - 203 2 Aberdeen University Aberdeen University United Kingdom 122 - - - 122 3 Other Other Other 109 140 24 - 273
231 342 24 - 598
Item Institute Acronym Institute Name Country Windows 1 & 2
Window 3 Bilateral Center Funds TOTAL
1 University of California at Santa Barbara University of California at Santa Barbara United States 150 - - - 150 2 Other Other Other 77 41 60 - 177
227 41 60 - 327
Item Institute Acronym Institute Name Country Windows 1 & 2
Window 3 Bilateral Center Funds TOTAL
1 INRA INRA Morocco 62 - - - 62 2 NCARE National Center for Agricultural Researc Jordan 7 6 39 - 52 3 Other Other Other 51 - 8 - 59
121 6 46 - 173
Item Institute Acronym Institute Name Country Windows 1 & 2
Window 3 Bilateral Center Funds TOTAL
1 CARE CARE International Denmark (8) - 277 - 269 2 Other Other Other 164 130 (149) - 145
156 130 128 - 413
3. CIAT Actual Expenses - This Year
1. AFRICA RICE Actual Expenses - This Year
Total for CRP7
2. BIOVERSITY Actual Expenses - This Year
Total for CRP7
7. ICARDA Actual Expenses - This Year
Total for CRP
4. CIFOR Actual Expenses - This Year
Total for CRP7
5. CIMMYT Actual Expenses - This Year
Total for CRP7
6. CIP Actual Expenses - This Year
Total for CRP7
Total for CRP7
8. ICRAF Actual Expenses - This Year
Total for CRP7
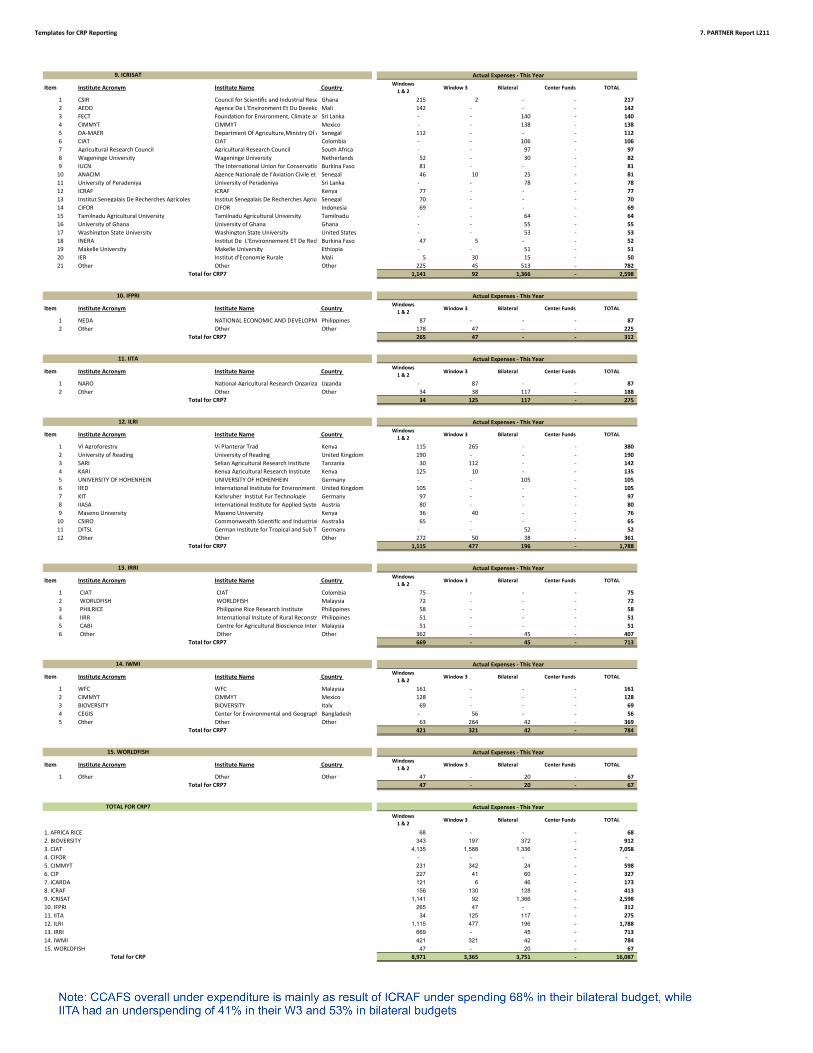
Templates for CRP Reporting 7. PARTNER Report L211
Item Institute Acronym Institute Name Country Windows 1 & 2
Window 3 Bilateral Center Funds TOTAL
1 CSIR Council for Scientific and Industrial Rese Ghana 215 2 - - 217 2 AEDD Agence De L'Environment Et Du Deveko Mali 142 - - - 142 3 FECT Foundation for Environment, Climate an Sri Lanka - - 140 - 140 4 CIMMYT CIMMYT Mexico - - 138 - 138 5 DA-MAER Department Of Agriculture,Ministry Of A Senegal 112 - - - 112 6 CIAT CIAT Colombia - - 106 - 106 7 Agricultural Research Council Agricultural Research Council South Africa - - 97 - 97 8 Wageninge University Wageninge University Netherlands 52 - 30 - 82 9 IUCN The International Union for Conservatio Burkina Faso 81 - - - 81
10 ANACIM Agence Nationale de l’Aviation Civile et d Senegal 46 10 25 - 81 11 University of Peradeniya University of Peradeniya Sri Lanka - - 78 - 78 12 ICRAF ICRAF Kenya 77 - - - 77 13 Institut Senegalais De Recherches Agricoles Institut Senegalais De Recherches Agrico Senegal 70 - - - 70 14 CIFOR CIFOR Indonesia 69 - - - 69 15 Tamilnadu Agricultural University Tamilnadu Agricultural University Tamilnadu - - 64 - 64 16 University of Ghana University of Ghana Ghana - - 55 - 55 17 Washington State University Washington State University United States - - 53 - 53 18 INERA Institut De L'Environnement ET De Rech Burkina Faso 47 5 - - 52 19 Makelle University Makelle University Ethiopia - - 51 - 51 20 IER Institut d'Economie Rurale Mali 5 30 15 - 50 21 Other Other Other 225 45 513 - 782
1,141 92 1,366 - 2,598
Item Institute Acronym Institute Name Country Windows 1 & 2
Window 3 Bilateral Center Funds TOTAL
1 NEDA NATIONAL ECONOMIC AND DEVELOPM Philippines 87 - - - 87 2 Other Other Other 178 47 - - 225
265 47 - - 312
Item Institute Acronym Institute Name Country Windows 1 & 2
Window 3 Bilateral Center Funds TOTAL
1 NARO National Agricultural Research Organizat Uganda - 87 - - 87 2 Other Other Other 34 38 117 - 188
34 125 117 - 275
Item Institute Acronym Institute Name Country Windows 1 & 2
Window 3 Bilateral Center Funds TOTAL
1 VI Agroforestry Vi Planterar Trad Kenya 115 265 - - 380 2 University of Reading University of Reading United Kingdom 190 - - - 190 3 SARI Selian Agricultural Research Institute Tanzania 30 112 - - 142 4 KARI Kenya Agricultural Research Institute Kenya 125 10 - - 135 5 UNIVERSITY OF HOHENHEIN UNIVERSITY OF HOHENHEIN Germany - - 105 - 105 6 IIED International Institute for Environment a United Kingdom 105 - - - 105 7 KIT Karlsruher Institut Fur Technologie Germany 97 - - - 97 8 IIASA International Institute for Applied System Austria 80 - - - 80 9 Maseno University Maseno University Kenya 36 40 - - 76
10 CSIRO Commonwealth Scientific and Industrial Australia 65 - - - 65 11 DITSL German Institute for Tropical and Sub Tr Germany - - 52 - 52 12 Other Other Other 272 50 38 - 361
1,115 477 196 - 1,788
Item Institute Acronym Institute Name Country Windows 1 & 2
Window 3 Bilateral Center Funds TOTAL
1 CIAT CIAT Colombia 75 - - - 75 2 WORLDFISH WORLDFISH Malaysia 72 - - - 72 3 PHILRICE Philippine Rice Research Institute Philippines 58 - - - 58 4 IIRR International Insitute of Rural Reconstr Philippines 51 - - - 51 5 CABI Centre for Agricultural Bioscience Intern Malaysia 51 - - - 51 6 Other Other Other 362 - 45 - 407
669 - 45 - 713
Item Institute Acronym Institute Name Country Windows 1 & 2
Window 3 Bilateral Center Funds TOTAL
1 WFC WFC Malaysia 161 - - - 161 2 CIMMYT CIMMYT Mexico 128 - - - 128 3 BIOVERSITY BIOVERSITY Italy 69 - - - 69 4 CEGIS Center for Environmental and Geograph Bangladesh - 56 - - 56 5 Other Other Other 63 264 42 - 369
421 321 42 - 784
Item Institute Acronym Institute Name Country Windows 1 & 2
Window 3 Bilateral Center Funds TOTAL
1 Other Other Other 47 - 20 - 67 47 - 20 - 67
Windows 1 & 2
Window 3 Bilateral Center Funds TOTAL
1. AFRICA RICE 68 - - - 68 2. BIOVERSITY 343 197 372 - 912 3. CIAT 4,135 1,588 1,336 - 7,058 4. CIFOR - - - - - 5. CIMMYT 231 342 24 - 598 6. CIP 227 41 60 - 327 7. ICARDA 121 6 46 - 173 8. ICRAF 156 130 128 - 413 9. ICRISAT 1,141 92 1,366 - 2,598 10. IFPRI 265 47 - - 312 11. IITA 34 125 117 - 275 12. ILRI 1,115 477 196 - 1,788 13. IRRI 669 - 45 - 713 14. IWMI 421 321 42 - 784 15. WORLDFISH 47 - 20 - 67
8,971 3,365 3,751 - 16,087
11. IITA Actual Expenses - This Year
9. ICRISAT Actual Expenses - This Year
Total for CRP7
10. IFPRI Actual Expenses - This Year
Total for CRP7
15. WORLDFISH Actual Expenses - This Year
Total for CRP7
12. ILRI Actual Expenses - This Year
Total for CRP7
13. IRRI Actual Expenses - This Year
Total for CRP7
14. IWMI Actual Expenses - This Year
Total for CRP7
Total for CRP7
TOTAL FOR CRP7 Actual Expenses - This Year
Total for CRP