Embed Size (px)
Citation preview

Performance of Bridge Columns Under Long Duration Ground Motions (Shake Table Tests)
1
Presented by :Mohammed Saeed Mohammed
David Sanders and Ian Buckle
Research Assistant, PhD StudentDept. of Civil and Environmental Engineering
ProfessorsDept. of Civil and Environmental Engineering
University of Nevada, Reno

2
Presented by :
Mohammed Saeed Mohammed
David Sanders and Ian Buckle
Research Assistant, PhD StudentDept. of Civil and Environmental Engineering
ProfessorsDept. of Civil and Environmental Engineering
University of Nevada, Reno
Performance of Bridge Columns Under Long Duration Ground Motions (Shake Table Tests)

3
Presented by :Mohammed Saeed Mohammed
David Sanders and Ian Buckle
Research Assistant, PhD StudentDept. of Civil and Environmental Engineering
ProfessorsDept. of Civil and Environmental Engineering
University of Nevada, Reno
Performance of Bridge Columns Under Long Duration Ground Motions (Shake Table Tests)

4
Presented by :Mohammed Saeed Mohammed
David Sanders and Ian Buckle
Research Assistant, PhD StudentDept. of Civil and Environmental Engineering
ProfessorsDept. of Civil and Environmental Engineering
University of Nevada, Reno
Performance of Bridge Columns Under Long Duration Ground Motions (Shake Table Tests)

5
Presented by :Mohammed Saeed Mohammed
David Sanders and Ian Buckle
Research Assistant, PhD StudentDept. of Civil and Environmental Engineering
ProfessorsDept. of Civil and Environmental Engineering
University of Nevada, Reno
Performance of Bridge Columns Under Long Duration Ground Motions (Shake Table Tests)

Performance of Bridge Columns Under Long Duration Ground Motions (Shake Table Tests)
6
Presented by :Mohammed Saeed Mohammed
David Sanders and Ian Buckle
Research Assistant, PhD StudentDept. of Civil and Environmental Engineering
ProfessorsDept. of Civil and Environmental Engineering
University of Nevada, Reno

Problem Statement and Objectives
7
• The 2010 M8.8 Chile and 2011 M9.0 Tohoku, Japanearthquakes are a reminder of the importance of theeffect of ground motion duration on structural response.
• Comparing these ground motion durations with otherearthquakes in California which has typically lasted lessthan 30 seconds, shows that the durations of the Chile andthe Tohoku earthquakes are very long.
• Chile Earthquake Ruptured over ~ 500 kmDuration ~ 20-90 seconds
• Tohoku Earthquake Fault size ~ 500 km x 210 kmDuration ~ 40-110 seconds
Why Long Duration ?

Problem Statement and Objectives
8
• Current seismic design codes do not consider durationeffects and they are mainly based on the peak response.
The big differences in conclusions of previous researchwith regard to the effect of strong ground motionduration on structural performance.
AND THIS IS DUE TO :
The lack of the available long duration ground motionrecords which made the researchers to conduct theirstudies using simulated records.
Why Long Duration ?
Problem Statement and Objectives
9
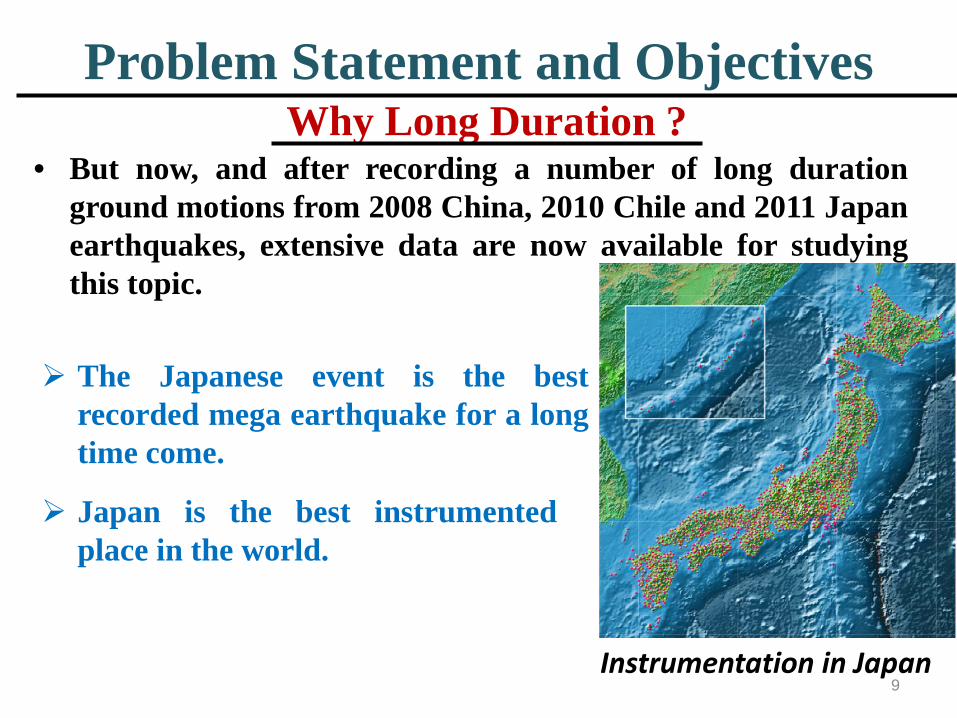
• But now, and after recording a number of long durationground motions from 2008 China, 2010 Chile and 2011 Japanearthquakes, extensive data are now available for studyingthis topic.
Instrumentation in Japan
The Japanese event is the bestrecorded mega earthquake for a longtime come.
Why Long Duration ?
Japan is the best instrumentedplace in the world.

Problem Statement and Objectives
10
• What makes this study even more important is thepossibility of occurrence of another large magnitude longduration subduction earthquake along the PacificNorthwest coast of the United States which lies near theCASCADIA SUBDUCTION ZONE.
More than twice the lengthof the Tohoku fault.
From the literature, there aresome similarities between theJapan and the CascadiaSubduction Zone.
Why Long Duration ?

Research Questions
11
• Should the current seismic codes be modified totake the effect of ground motion durations intoaccount?
• How do we characterize the difference in damagebetween a short and long duration earthquake?

Ground Motion Duration Definitions
12
• Bracketed Duration
0.05g or 0.1gThresholds
Bracketed Duration
• More than 30 definitions of ground motion duration in theliterature.
0.05g
0.05g
The measure of the time interval between the first and lastexceedance of an absolute acceleration threshold

Ground Motion Duration Definitions
13
• Significant Duration (5-95% of the Arias Intensity)
Recommended by Jack Baker and Greg Deierlein (2012)

14
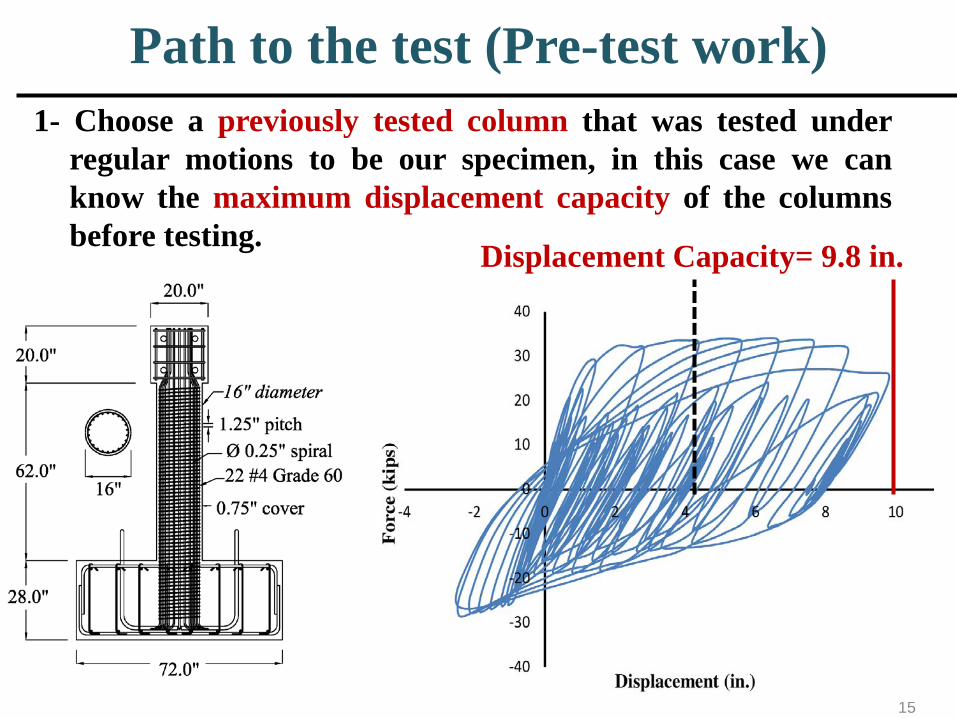
Path to the test (Pre-test work)1- Choose a previously tested column that was tested under
regular motions to be our specimen, in this case we canknow the maximum displacement capacity of the columnsbefore testing.
Vu and Saiidi (2005) - Rinaldi - 1/3 scale
• Design Code: AASHTO• L/D= 4.5 (flexural behavior)• Axial Load ratio= 8.0%• Long. steel ratio= 2.2%• Trans. steel ratio= 1.1%
15
1- Choose a previously tested column that was tested underregular motions to be our specimen, in this case we canknow the maximum displacement capacity of the columnsbefore testing. Displacement Capacity= 9.8 in.
Path to the test (Pre-test work)
16
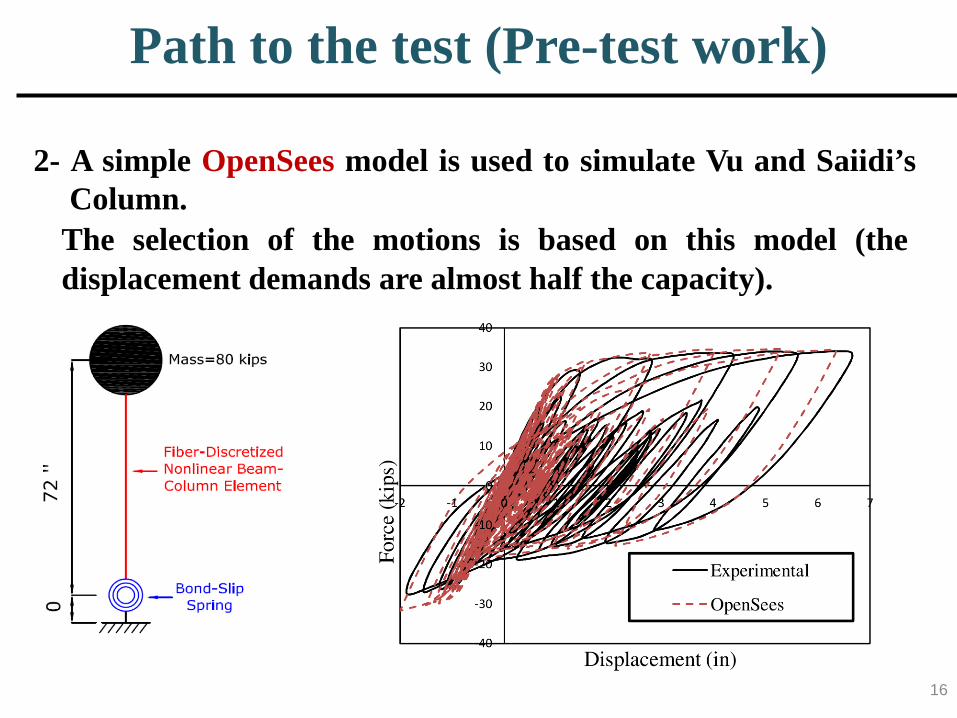
2- A simple OpenSees model is used to simulate Vu and Saiidi’sColumn.
The selection of the motions is based on this model (thedisplacement demands are almost half the capacity).
Path to the test (Pre-test work)

17
3- Two identical specimens are tested :
Long duration motion from the Japan 2011 Earthquake Short duration motion from Loma Prieta 1989 Earthquake
0
0.5
1
1.5
2
2.5
3
3.5
0 0.5 1 1.5 2 2.5 3 3.5 4
Acc.
(g)
Period
2475 Years Response Spectra (USGS)(Site Class D)
Crescent City (California)
NewPort (Oregon)
Port Angeles (Washington)
Eureka (California)
Path to the test (Pre-test work)

18
3- Two identical specimens are tested :
Long duration motion from the Japan 2011 Earthquake Short duration motion from Loma Prieta 1989 Earthquake
0
0.5
1
1.5
2
2.5
3
3.5
0 0.5 1 1.5 2 2.5 3 3.5 4
Acc.
(g)
Period
2475 Years Response Spectra (USGS)(Site Class D)
Crescent City (California)
NewPort (Oregon)
Port Angeles (Washington)
Eureka (California)
The two motions are modified to match the response spectrum of Crescent City (2475 years)
Path to the test (Pre-test work)
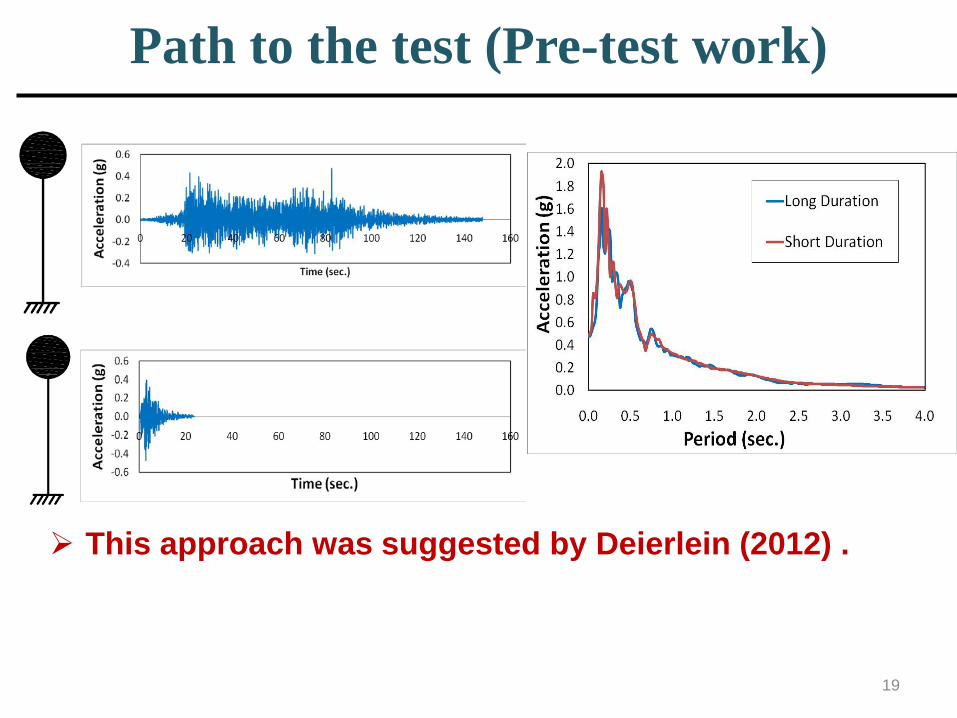
19
This approach was suggested by Deierlein (2012) .
Path to the test (Pre-test work)

20
1) Japan, Tohoku 2011 /Station: FKSH20 (N-S)
0
0.5
1
1.5
2
2.5
3
0 1 2 3 4
Acc.
(g)
Period (sec)
Japan Modified
Japan Original
Crescent City 2475
Significant Duration = 88.3 seconds
Path to the test (Pre-test work)

21
2) Loma Prieta 1989/Station: Bran 00
Significant Duration = 9.0 seconds
0
0.5
1
1.5
2
2.5
3
0 1 2 3 4
Acc.
(g)
Period
Short Modified
Short Original
Crescent City 2475
Path to the test (Pre-test work)

22
Final Motions
0
0.5
1
1.5
2
2.5
3
0 1 2 3 4
Acc.
(g)
Period
Japan Modified
Short Modified
0
0.5
1
1.5
2
2.5
3
0 1 2 3 4
Acc.
(g)
Period
Japan Modified
Short ModifiedPeriod
Column 1
Japan, TohokuSig. Dur. (Prototype)
= 88.3 secSig. Dur. (Specimen)
= 50.9 sec
Column 2
Short, Loma PrietaSig. Dur. (Prototype)
= 9.0 secSig. Dur. (Specimen)
= 5.2 sec
Prototype Model
Period
Path to the test (Pre-test work)
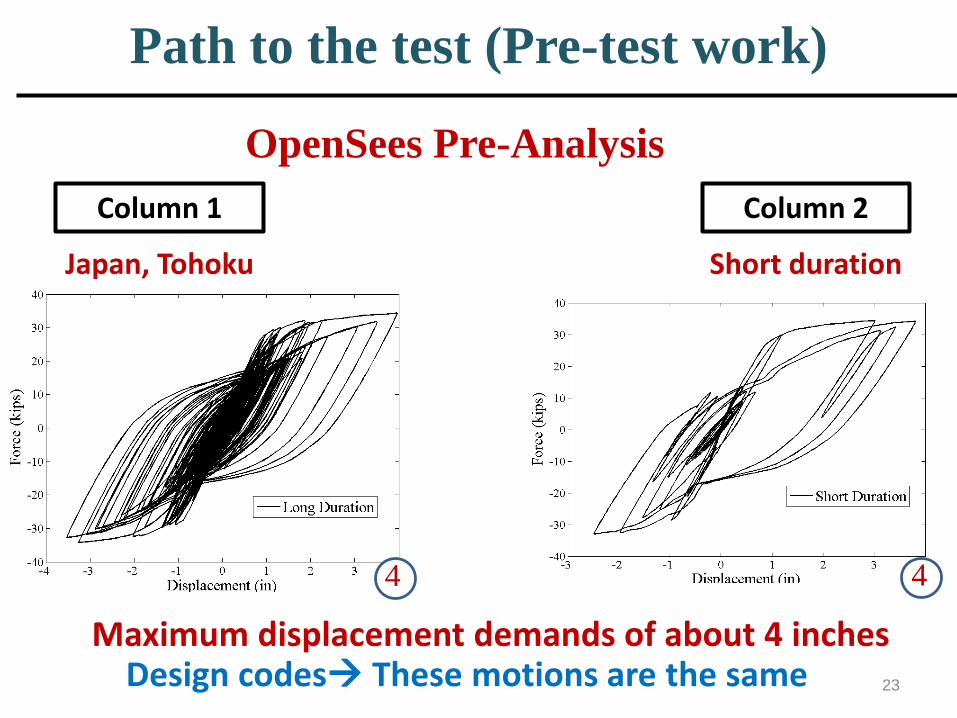
OpenSees Pre-AnalysisColumn 1 Column 2
Japan, Tohoku Short duration
Maximum displacement demands of about 4 inches23
4 4
Design codes These motions are the same
Path to the test (Pre-test work)

Earthquake Engineering Laboratory
24

Test Setup
25
Axial Load

Test Setup
26
Axial Load
Specimen
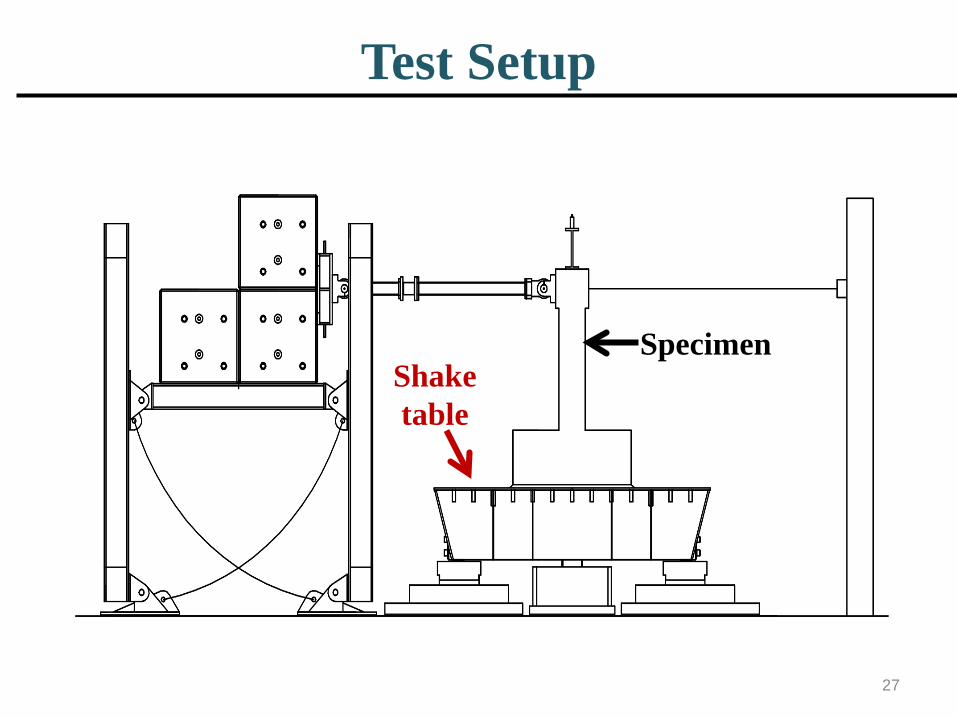
Test Setup
27
Axial Load
Shake table
Specimen

Test Setup
28
Axial Load
Mass Rig System
Shake table
Specimen

Test Setup
29
Axial Load
Mass Rig System Lateral
Load cell
Shake table
Specimen

Test Setup
30
Axial Load
Mass Rig System Lateral
Load cell
Axial Load cell
Shake table
Specimen

Test Setup
31
Axial Load
Mass Rig System Lateral
Load cell
Axial Load cell
Rigid frame
String pots
Shake table
Specimen

Test Setup
32
Mass Rig
Shake Table
Rigid Frame
Axial Load

Test Setup
33
Instrumentation• 48 Strain Gages• LVDT’s
• String Potentiometers• HD and Go-Pro cameras
LVDT’s
Go-Pro camera in each corner
String pots connected to the rigid frame
• Accelerometers

Loading Protocol
34
100% of GM +
AfterShock+
125% of GM+
150% of GM+
etc………
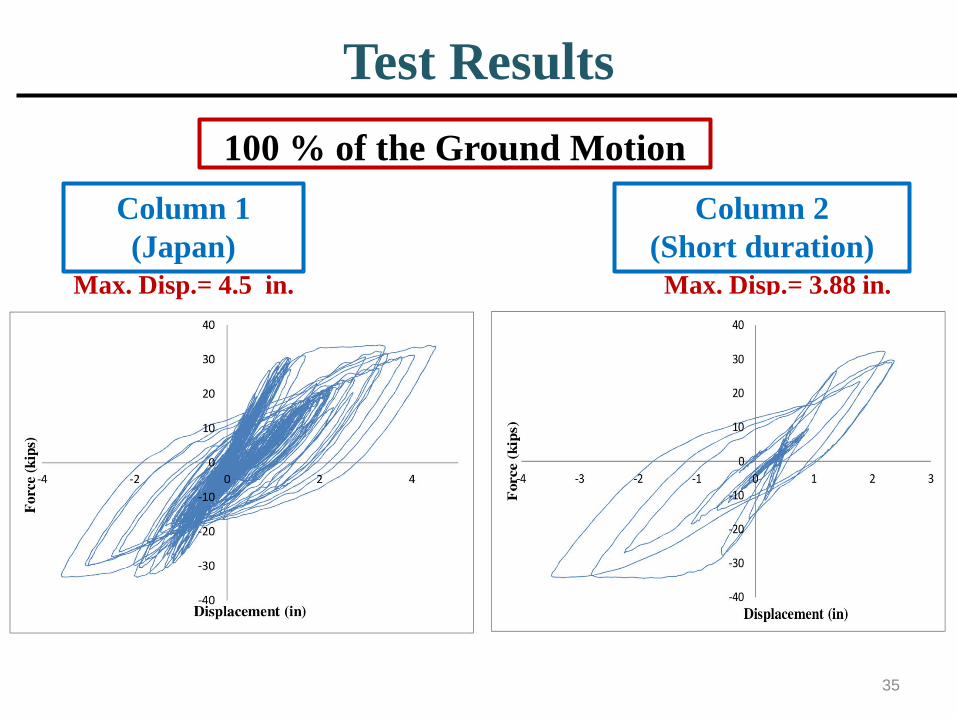
Test Results
35
100 % of the Ground MotionColumn 1(Japan)
Column 2(Short duration)
Max. Disp.= 4.5 in. Max. Disp.= 3.88 in.

Test Results
36
100 % of the Ground Motion
Max. Disp.= 4.5” Max. Disp.= 3.88”
South
• 4.4” spalling• Spirals ExposedNorth
• 3.0” spalling• Spirals Exposed
South
• Cracks (max width= 0.4mm)
North
• 4.5” spalling• No RFT. Exposed
Column 1(Japan)
Column 2(Short duration)
0
0.5
1
1.5
2
2.5
3
0 1 2 3 4
Acc.
(g)
Period
JapanModifiedShortModified

Test Results
37
125 % of the Ground Motion
Max. Disp.= 4.98” Max. Disp.= 4.8”
South
• 8.5” spalling• 4 Bars fracturedNorth
• 6.4” spalling• Core Damage
South
North
• 4.5” spalling• Spirals exposed
• 4.5” spalling• Spirals exposed
Column 1(Japan)
Column 2(Short duration)

Test Results
38
150 % of the Ground MotionN
ot A
pplic
able
Max. Disp.= 7.3”
South
North
• 6” spalling• Spirals exposed
• 9” spalling• Spirals exposed
Bar
s Fra
ctur
edat
12
5%Column 1(Japan)
Column 2(Short duration)
Test Results
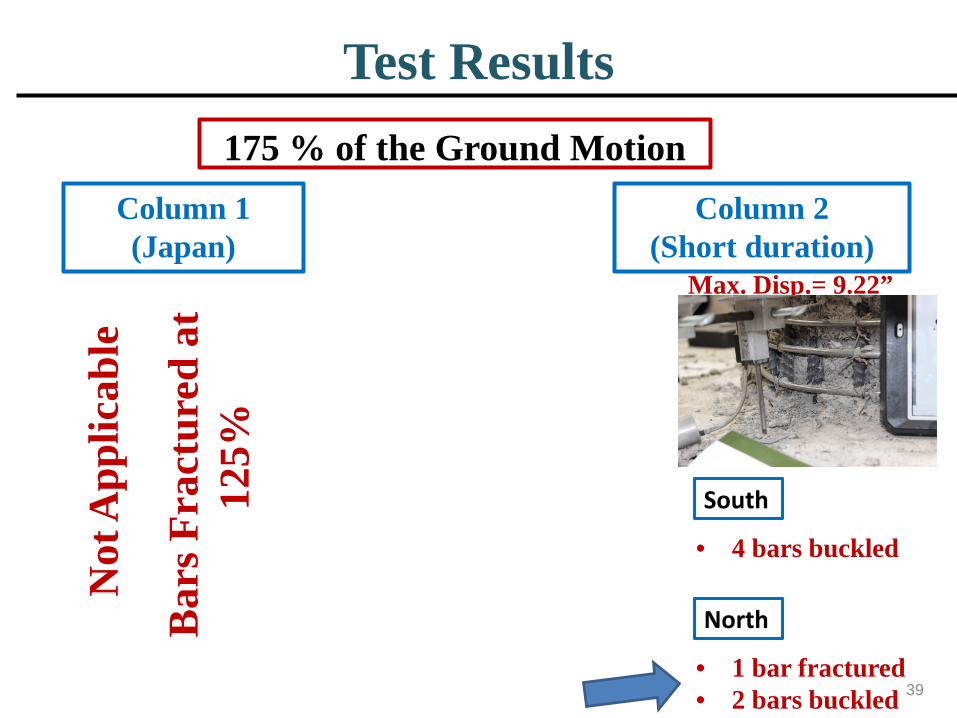
39
175 % of the Ground Motion
Max. Disp.= 9.22”
South
North
• 1 bar fractured• 2 bars buckled
• 4 bars buckled
Column 1(Japan)
Column 2(Short duration)
Not
App
licab
le
Bar
s Fra
ctur
edat
12
5%

Test Results
40
Force-Displacement Comparison
4 Bars Fractured
1 Bar Fractured

Test Results
41
Strain Comparison (100%of GM)
4 in. above the footing

Response Spectra Comparison
42
Response Spectra at final damage state

Testing Extension
43
• Three more columns were tested under long duration motions from the Chile 2010 and Japan 2011 events.
0
0.2
0.4
0.6
0.8
1
1.2
1.4
1.6
1.8
2
0 0.5 1 1.5 2 2.5 3
Acc.
(g)
Period (sec)
Japan, MYG006 E-W
0
0.5
1
1.5
2
2.5
3
0 0.5 1 1.5 2 2.5 3
Acc.
(g)
Period (sec)
Chile, ConcepcionLong. (200%)
• Two of the motions were used without modifications and real aftershocks were also used.

Work in Progress
44
Extensive Analytical WorkLong Duration Ground Motion Set
• 1985 Valparaiso, Chile M7.8• 1985 Michoacan, Mexico M8.1• 2003 Hokaido (Tokachi-Oki), M8.0• 2005 Off Miyagi Prefecture, M7.2• 2010 Maule, Chile M8.8• 2011 Tohoku, Japan M9.0• 2012 Kamaishi, Japan M7.3•2014 Chile, M8.1
• 1999 Chi-Chi, Taiwan M7.6• 2004 Niigata, Japan M6.6• 2004 Southeast of Kii Peninsula, M7.4• 2007 Chuetsu, Japan M6.5• 2008 Iwate Eastern Honshu, M6.9• 2008 Wenchuan, China M8.0• 2010 El Mayor Cucapah M7.2• 2011 Fukashima Hamadori, M6.7
SUBDUCTION EARTHQUAKES CRUSTAL EARTHQUAKES
Two sources of long duration ground motion
Long RuptureSite Effects

Modified Park-Ang Damage Index
45
•δ max = maximum displacement demand during the ground motion
•δ u =ultimate displacement capacity (taken 9.8 in. from Vu and Saiidi’s test)
•β = constant (taken 0.15 for concrete structures)
•Eh = hysteretic energy
•Fy = Force causing yield
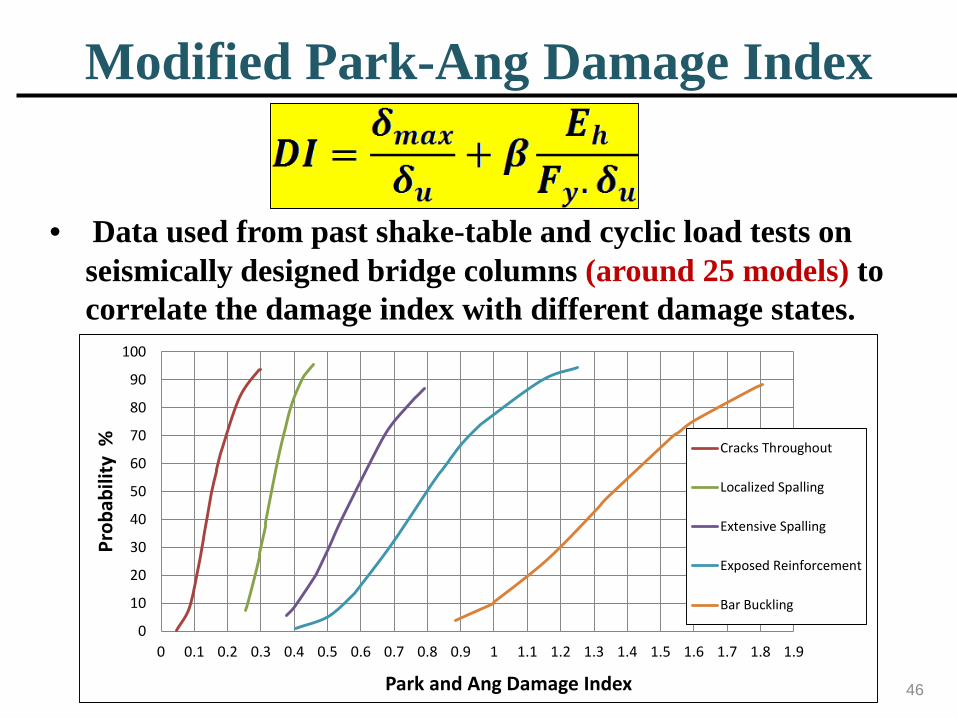
Modified Park-Ang Damage Index
46
0
10
20
30
40
50
60
70
80
90
100
0 0.1 0.2 0.3 0.4 0.5 0.6 0.7 0.8 0.9 1 1.1 1.2 1.3 1.4 1.5 1.6 1.7 1.8 1.9
Prob
abili
ty %
Park and Ang Damage Index
Cracks Throughout
Localized Spalling
Extensive Spalling
Exposed Reinforcement
Bar Buckling
• Data used from past shake-table and cyclic load tests on seismically designed bridge columns (around 25 models) to correlate the damage index with different damage states.
Modified Park-Ang Damage Index
47
0102030405060708090
100
0 0.1 0.2 0.3 0.4 0.5 0.6 0.7 0.8 0.9 1 1.1 1.2 1.3 1.4 1.5 1.6 1.7 1.8 1.9
Prob
abili
ty %
Park and Ang Damage Index
Cracks Throughout
Localized Spalling
Extensive Spalling
ExposedReinforcementBar Buckling
Column 2
Column 3
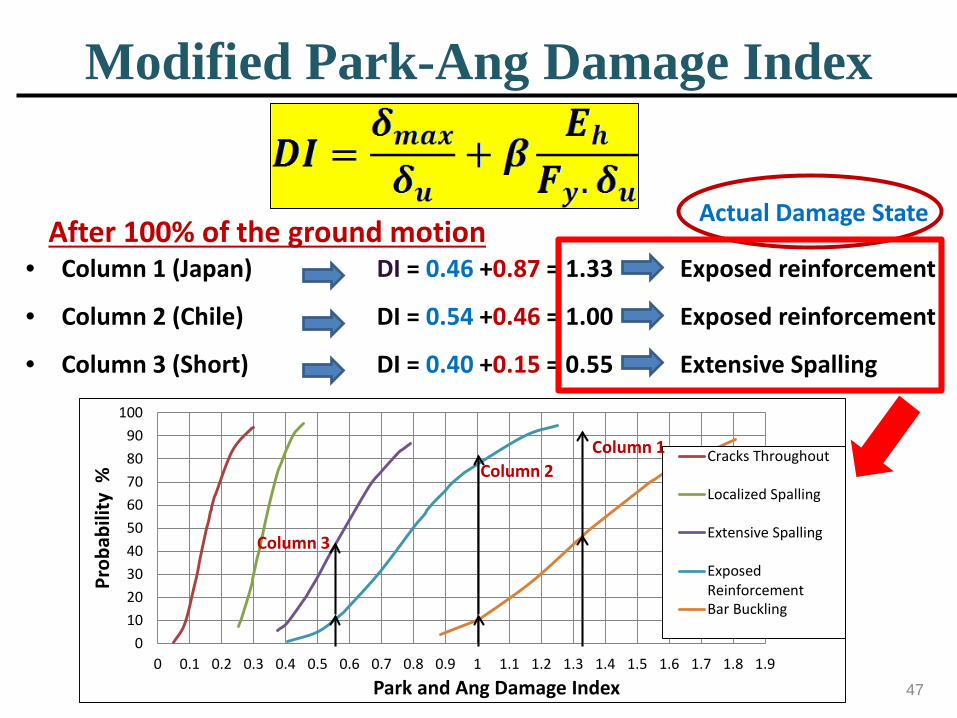
After 100% of the ground motion• Column 1 (Japan) DI = 0.46 +0.87 = 1.33
• Column 2 (Chile) DI = 0.54 +0.46 = 1.00
• Column 3 (Short) DI = 0.40 +0.15 = 0.55
Exposed reinforcement
Exposed reinforcement
Extensive Spalling
Actual Damage State
Column 1

Preliminary Conclusions
48
• Ground motion duration has a significant effect on the collapse capacity of bridge columns.

Preliminary Conclusions
49
• Ground motion duration has a significant effect on the collapse capacity of bridge columns.
• Reduction in the displacement capacity of about 50% is observed in case of long duration motions compared to the short duration ones.

Preliminary Conclusions
50
• Ground motion duration has a significant effect on the collapse capacity of bridge columns.
• Reduction in the displacement capacity of about 50% is observed in case of long duration motions compared to the short duration ones.
• A significant reduction in the response spectrum at collapse (about 40%) of long duration motions with respect to short duration ones.

Preliminary Conclusions
51
• Ground motion duration has a significant effect on the collapse capacity of bridge columns.
• Seismic design provisions are recommended take the effect of ground motion duration into account, not only design response spectra.
• Reduction in the displacement capacity of about 50% is observed in case of long duration motions compared to the short duration ones.
• A significant reduction in the response spectrum at collapse (about 40%) of long duration motions with respect to short duration ones.

Preliminary Conclusions
52
• Ground motion duration has a significant effect on the collapse capacity of bridge columns.
• Seismic design provisions are recommended take the effect of ground motion duration into account, not only design response spectra.
• Ground motion duration is an important parameter when selecting ground motions for nonlinear analysis of structures.
• Reduction in the displacement capacity of about 50% is observed in case of long duration motions compared to the short duration ones.
• A significant reduction in the response spectrum at collapse (about 40%) of long duration motions with respect to short duration ones.

53

54
Thank you

55
Questions ?

Modified Park-Ang Damage Index
56
•δ max = maximum displacement demand during the ground motion
•δ u =ultimate displacement capacity (taken 9.8 in. from Vu and Saiidi’s test)
•β = constant (taken 0.15 for concrete structures)
•Eh = hysteretic energy
•Fy = Force causing yield
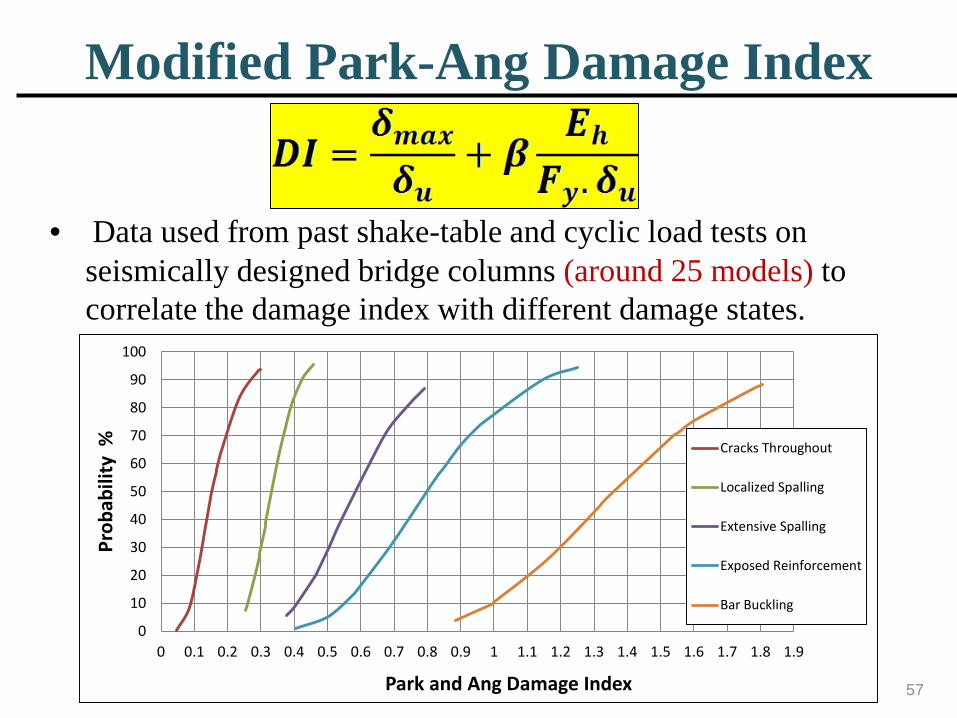
Modified Park-Ang Damage Index
57
0
10
20
30
40
50
60
70
80
90
100
0 0.1 0.2 0.3 0.4 0.5 0.6 0.7 0.8 0.9 1 1.1 1.2 1.3 1.4 1.5 1.6 1.7 1.8 1.9
Prob
abili
ty %
Park and Ang Damage Index
Cracks Throughout
Localized Spalling
Extensive Spalling
Exposed Reinforcement
Bar Buckling
• Data used from past shake-table and cyclic load tests on seismically designed bridge columns (around 25 models) to correlate the damage index with different damage states.

Modified Park-Ang Damage Index
58
0102030405060708090
100
0 0.1 0.2 0.3 0.4 0.5 0.6 0.7 0.8 0.9 1 1.1 1.2 1.3 1.4 1.5 1.6 1.7 1.8 1.9
Prob
abili
ty %
Park and Ang Damage Index
Cracks Throughout
Localized Spalling
Extensive Spalling
Exposed Reinforcement
Bar Buckling
Column 2
Column 3
After 100% of the ground motion• Column 1 (Japan) DI = 0.46 +0.87 = 1.33
• Column 2 (Chile) DI = 0.54 +0.46 = 1.00
• Column 3 (Short) DI = 0.40 +0.15 = 0.55
Exposed reinforcement
Exposed reinforcement
Extensive Spalling
Actual Damage State
Column 1

Modified Park-Ang Damage Index
59
0102030405060708090
100
0 0.1 0.2 0.3 0.4 0.5 0.6 0.7 0.8 0.9 1 1.1 1.2 1.3 1.4 1.5 1.6 1.7 1.8 1.9
Prob
abili
ty %
Park and Ang Damage Index
Cracks Throughout
Localized Spalling
Extensive Spalling
Exposed Reinforcement
Bar Buckling
Column 2
Column 3
After 100% of the ground motion• Column 1 (Japan) DI = 0.46 +0.87 = 1.33
• Column 2 (Short) DI = 0.40 +0.15 = 0.55
Exposed reinforcement
Extensive Spalling
Actual Damage State
Column 1
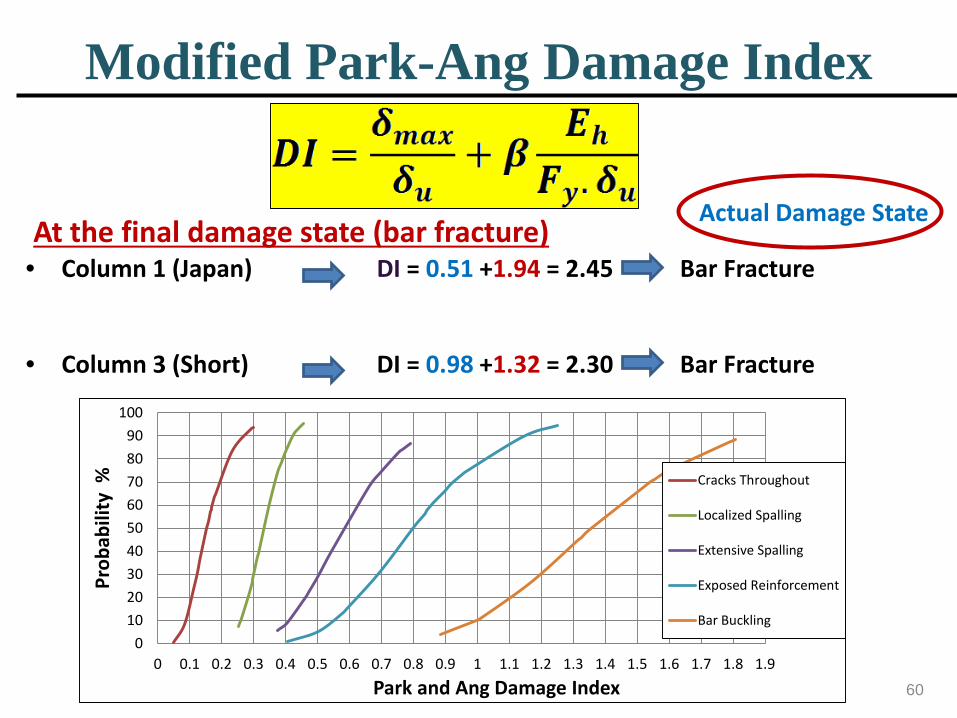
Modified Park-Ang Damage Index
60
0102030405060708090
100
0 0.1 0.2 0.3 0.4 0.5 0.6 0.7 0.8 0.9 1 1.1 1.2 1.3 1.4 1.5 1.6 1.7 1.8 1.9
Prob
abili
ty %
Park and Ang Damage Index
Cracks Throughout
Localized Spalling
Extensive Spalling
Exposed Reinforcement
Bar Buckling
At the final damage state (bar fracture)• Column 1 (Japan) DI = 0.51 +1.94 = 2.45
• Column 3 (Short) DI = 0.98 +1.32 = 2.30
Bar Fracture
Bar Fracture
Actual Damage State