Embed Size (px)
Citation preview
Performance of Load-Bearing
Cold-Formed Steel Wall Systems with
Web-Perforated Studs
Subjected to Standard Fire
by
Shijun Yang
A thesis
presented to the University of Waterloo
in fulfillment of the
thesis requirement for the degree of
Doctor of Philosophy
in
Civil Engineering
Waterloo, Ontario, Canada, 2017
© Shijun Yang 2017

ii
AUTHOR'S DECLARATION
I hereby declare that I am the sole author of this thesis. This is a true copy of the thesis, including any
required final revisions, as accepted by my examiners.
I understand that my thesis may be made electronically available to the public.
iii
Abstract
Load-bearing cold-formed steel (CFS) wall systems are commonly constructed with CFS C-shape studs
with one or two layers of fire-rated sheathing attached to both sides. In practice, perforations are placed
in stud webs to accommodate the passage of utilities or installation of intermediate braces. These walls
may fail by local buckling at the web perforations, combined with studs bending towards the furnace,
as demonstrated by several full-scale fire tests. Current understanding of fire performance of such walls
with web-perforated studs remains relatively limited, and the effect of web perforations on the fire
resistance have not yet been accounted for in current design methods.
Finite element analysis (FEA) using the software ABAQUS, an alternative to full-scale fire tests,
was employed to investigate the heat transfer and structural responses of CFS walls. Three-dimensional
heat transfer models were developed and validated with full-scale fire tests. Parametric studies
demonstrate that for insulated CFS walls, web perforations induce a larger temperature gradient in
perforated cross sections than in the solid ones along the stud length; however, for non-insulated CFS
walls, the effect of web perforations on the temperature distributions in stud cross sections is negligible.
Sequentially uncoupled 3D FE thermal-stress models were developed to evaluate the fire
performance of load-bearing CFS walls with web-perforated studs. These walls were partially insulated,
sheathed by double layers of MgO board or Type C gypsum board, and by mixed Type X and MgO
board. Unlike in previous studies, temperature distributions incorporated into the structural model were
obtained from heat transfer analysis so as to include the difference in temperature distributions caused
by web perforations. Three models were developed: (1) a CFS wall stud model, as in previous studies.
The predicted failure time is acceptable when compared with that of full-scale fire testing. (2) a CFS
wall frame model. Stiffness and force interactions among the CFS wall studs were considered. The
middle few studs of the wall frame may bear higher loads than that applied to a single stud,
demonstrating that the single stud model may overestimate fire resistance. Thus, the stiffness and force
interactions should be considered in the FEA to achieve better accuracy. (3) a CFS wall system model.
Sheathing, attached to CFS wall framing, may enhance the load carrying capacity of walls. Such an
increase in load carrying capacity is permitted and can be evaluated in the design of CFS walls at
ambient temperature. However, the effect of using sheathing to brace to wall studs has not been
investigated at elevated temperature. Modelling sheathing using shell element, in addition to the CFS
iv
wall frame, provides more realistic prediction of the structural response of full-scale fire tests than the
above-mentioned two models.
A simplified design method is extended for CFS web-perforated studs in walls, subjected to standard
fire, based on effective width method as stated in the North American Specification for the Design of
Cold-Formed Steel Structural Members (AISI S100). CFS wall studs are subjected to combined
compression and bending due to neutral axis shift, thermal bowing and their magnification effects. A
plate buckling coefficient, accounting for the web perforation length and width, is introduced to
characterize the nominal axial strength. The effect of web perforations on the nominal flexural bending
is ignored, as is consistent with AISI S100 (2012) at room temperature and parametric study results at
elevated temperature. The limit of web perforation length is extended from the 114 mm, specified in
AISI S100 at room temperature, to 130 mm at both room and elevated temperatures. The accuracy of
the proposed design equations is acceptable when considering the complexity of the problem being
dealt with and the simplicity of the calculation.

v
Acknowledgements
Many wonderful people have supported me these four years. Bofu made the journey more purpose-
driven, joyful, and passionate. He always had confidence in me and encouraged me to challenge myself.
My parents and brother are consistently my greatest support, deepest love. I would achieve nothing if
they were not behind me.
I would like to express my sincere gratitude to my supervisor, Professor Lei Xu, for his guidance,
encouragement, continuous support, and unselfish investment of time to discuss my research progress.
This study would not have been successful to this level without such assistance. I also appreciate the
opportunity he gave me to study at the University of Waterloo.
I would like to extend my gratitude to Professors Elizabeth Weckman, John Straube and Mahesh
Pandey, for serving as my thesis committee members, and for their comments and constructive
suggestions on my research. Special thanks to Professor Ben Schafer of John Hopkins University for
serving as the external examiner.
Professor Elizabeth Weckman played an important role in my first-year PhD program. Courses
taught by her and others organized by her research group contributed greatly to my research background
in fire. Other than her brilliant expertise in fire, her devotion to work, generosity and genuine desire to
help has inspired me and will remain in my memories.
Ms. Mary McPherson of the Writing Centre is such an excellent writing specialist, who has helped
with my thesis, reports and publications throughout my PhD program. Working with her is always a
pleasure.
My fellow graduate students in Waterloo and dear friends both in Canada and overseas helped me
adapt to the new life and survive the negative feelings. I feel grateful to be around all these lovely
people.
vi
TO
My family and Bofu

vii
Table of Contents
AUTHOR'S DECLARATION ............................................................................................................... ii
Abstract ................................................................................................................................................. iii
Acknowledgements ................................................................................................................................ v
Table of Contents ................................................................................................................................. vii
List of Tables .......................................................................................................................................... x
List of Figures ....................................................................................................................................... xi
Chapter 1 Introduction ............................................................................................................................ 1
1.1 Background................................................................................................................................... 1
1.2 Research objective and scope ....................................................................................................... 3
1.3 Thesis organization ....................................................................................................................... 3
Chapter 2 Literature Review .................................................................................................................. 5
2.1 Experimental research .................................................................................................................. 5
2.2 Thermal modelling ....................................................................................................................... 7
2.2.1 Analytical thermal modelling ................................................................................................ 7
2.2.2 Finite element heat transfer analysis ..................................................................................... 8
2.3 Finite element structural modelling .............................................................................................. 9
Chapter 3 Behaviour of Web-Perforated CFS C-shape Studs at Ambient and Elevated Temperatures
.............................................................................................................................................................. 12
3.1 Introduction ................................................................................................................................ 12
3.2 Behaviour of CFS C-shape stub columns at ambient temperature ............................................. 13
3.2.1 Stub column tests ................................................................................................................. 13
3.2.2 Comparison with DSM approach ........................................................................................ 18
3.3 Finite element modelling of CFS C-shape columns at ambient and uniform elevated
temperatures ..................................................................................................................................... 21
3.3.1 Stub column tests ................................................................................................................. 21
3.3.2 Finite element modelling and analysis ................................................................................ 24
3.4 Behaviour of web-perforated CFS wall studs subjected to non-uniform cross-sectional
elevated temperature ......................................................................................................................... 28
3.4.1 Non-uniform cross-sectional temperature distribution ........................................................ 29

viii
3.4.2 Finite element structural analysis ........................................................................................ 31
3.4.3 Results and discussions ....................................................................................................... 34
3.5 Conclusions ................................................................................................................................ 38
Chapter 4 Thermal Modelling and Analysis of CFS Walls with Web-Perforated Studs Subjected to
Standard Fire ........................................................................................................................................ 39
4.1 Introduction ................................................................................................................................ 39
4.2 Thermal modelling ..................................................................................................................... 40
4.2.1 Full-scale fire tests .............................................................................................................. 40
4.2.2 Assumptions ........................................................................................................................ 42
4.2.3 Finite element type and mesh .............................................................................................. 42
4.2.4 Thermal boundary conditions ............................................................................................. 44
4.2.5 Thermal properties .............................................................................................................. 46
4.3 Comparison with test results ...................................................................................................... 48
4.4 Effect of web perforations .......................................................................................................... 51
4.4.1 Parameters ........................................................................................................................... 51
4.4.2 Results and discussions ....................................................................................................... 52
4.5 Conclusions ................................................................................................................................ 60
Chapter 5 Structural Modelling and Analysis of CFS Walls with Web-Perforated Studs Subjected
to Standard Fire .................................................................................................................................... 61
5.1 Introduction ................................................................................................................................ 61
5.2 Full-scale fire tests ..................................................................................................................... 62
5.3 Sequentially uncoupled thermal-stress analysis ......................................................................... 67
5.3.1 Finite element thermal model ............................................................................................. 67
5.3.2 Thermal properties .............................................................................................................. 69
5.4 Finite element structural model of CFS wall stud ...................................................................... 74
5.4.1 Mechanical properties ......................................................................................................... 75
5.4.2 Residual stresses and initial geometric imperfection .......................................................... 77
5.4.3 Results and discussion ........................................................................................................ 78
5.5 Finite element structural model of CFS wall frame ................................................................... 84

ix
5.5.1 Results and discussions ....................................................................................................... 88
5.6 Finite element structural model of CFS wall system .................................................................. 96
5.6.1 FEA results and discussions ................................................................................................ 99
5.7 Conclusions .............................................................................................................................. 105
Chapter 6 Extended Design Method Based on AISI S100 ................................................................. 107
6.1 Introduction .............................................................................................................................. 107
6.2 Parametric study ....................................................................................................................... 107
6.2.1 Parameters of single CFS stud model ................................................................................ 108
6.2.2 Results and discussions ..................................................................................................... 108
6.3 Extended design equations based on AISI S100 ...................................................................... 112
6.3.1 Nominal axial strength ...................................................................................................... 112
6.3.2 Nominal flexural strength .................................................................................................. 113
6.3.3 Combined compression and bending ................................................................................. 116
6.4 Comparison of results between extended design method and FEA.......................................... 119
6.5 Conclusions .............................................................................................................................. 122
Chapter 7 Conclusions and Future Research ...................................................................................... 123
7.1 Conclusions .............................................................................................................................. 123
7.1.1 Web-perforated CFS C-shape studs at ambient and elevated temperatures ...................... 123
7.1.2 Finite element thermal modelling and analysis ................................................................. 124
7.1.3 Finite element structural modelling and analysis .............................................................. 124
7.1.4 Extended design method based on AISI S100 ................................................................... 125
7.2 Future research ......................................................................................................................... 126
Bibliography ....................................................................................................................................... 128
Appendices ......................................................................................................................................... 134
Appendix A Comparison of gypsum board surface temperature on the ambient side between FEA
and full-scale fire tests .................................................................................................................... 134
Appendix B FEA results for parametric study (section 6.2) .......................................................... 138
Appendix C Design example using extended design method ........................................................ 142
Appendix D Calculation results using extended design method .................................................... 155

x
List of Tables
Table 3.1 Specimen dimensions (Xu, 2014) ........................................................................................ 15
Table 3.2 Mechanical properties from tensile coupon tests (Xu, 2014) .............................................. 15
Table 3.3 Comparison of test results with DSM approach .................................................................. 21
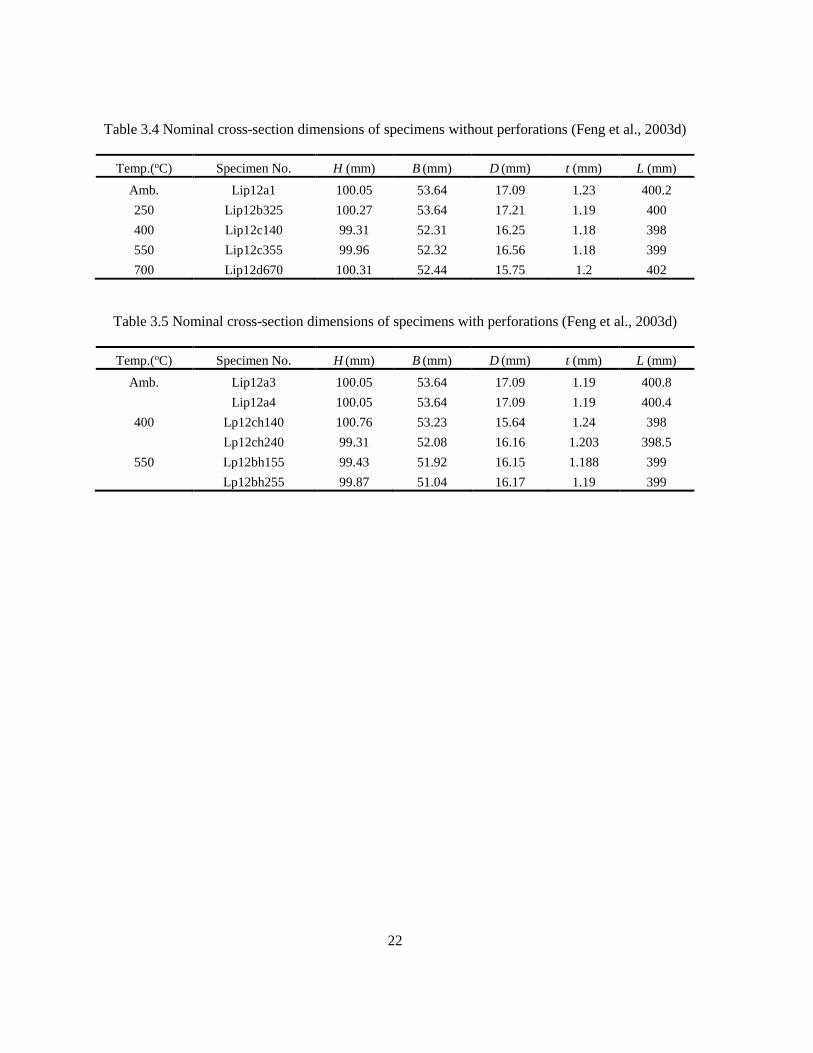
Table 3.4 Nominal cross-section dimensions of specimens without perforations (Feng et al., 2003d) 22
Table 3.5 Nominal cross-section dimensions of specimens with perforations (Feng et al., 2003d) .... 22
Table 3.6 Mechanical properties at ambient temperature .................................................................... 23
Table 3.7 Sensitivity study of element sizes ........................................................................................ 25
Table 3.8 Comparison of compressive strength between FEA and test results ................................... 27
Table 3.9 Applied load at ambient temperature (Step-1) ..................................................................... 32
Table 4.1 Full-scale fire tests (Kolarkar, 2010) ................................................................................... 41
Table 4.2 Thermal properties (Gunawan, 2011) .................................................................................. 46
Table 4.3 CFS walls with web-perforated studs in parametric study................................................... 52
Table 5.1 Load-bearing CFS wall fire tests (Xu, 2011) ....................................................................... 64
Table 5.2 Thermal properties of gypsum board at ambient temperature (Clancy, 1999) .................... 70
Table 5.3 Coefficients for thermal properties of MgO board .............................................................. 72
Table 5.4 Reduction factor for cold-formed steel based on EC 3 Part 1.2 (2005) ............................... 76
Table 5.5 Comparison of failure time between FEA and test results ................................................... 83
Table 6.1 Failure criteria for calculating nominal flexural strength (Feng &Wang, 2005) ............... 115

xi
List of Figures
Figure 1.1 Behaviour of CFS wall studs exposed to fire from one side ................................................. 2
Figure 2.1 CFS wall systems with exterior insulation (Kolarkar, 2010) ................................................ 6
Figure 2.2 CFS wall systems with exterior insulation (Chen & Ye, 2013) ............................................ 7
Figure 2.3 Non-uniform temperature distributions in CFS wall studs for FE modelling ..................... 10
Figure 3.1 Specimen profiles (Xu, 2014) ............................................................................................. 14
Figure 3.2 Experimental setup (Xu, 2014) ........................................................................................... 16
Figure 3.3 Specimen failure modes (Xu, 2014) .................................................................................... 17
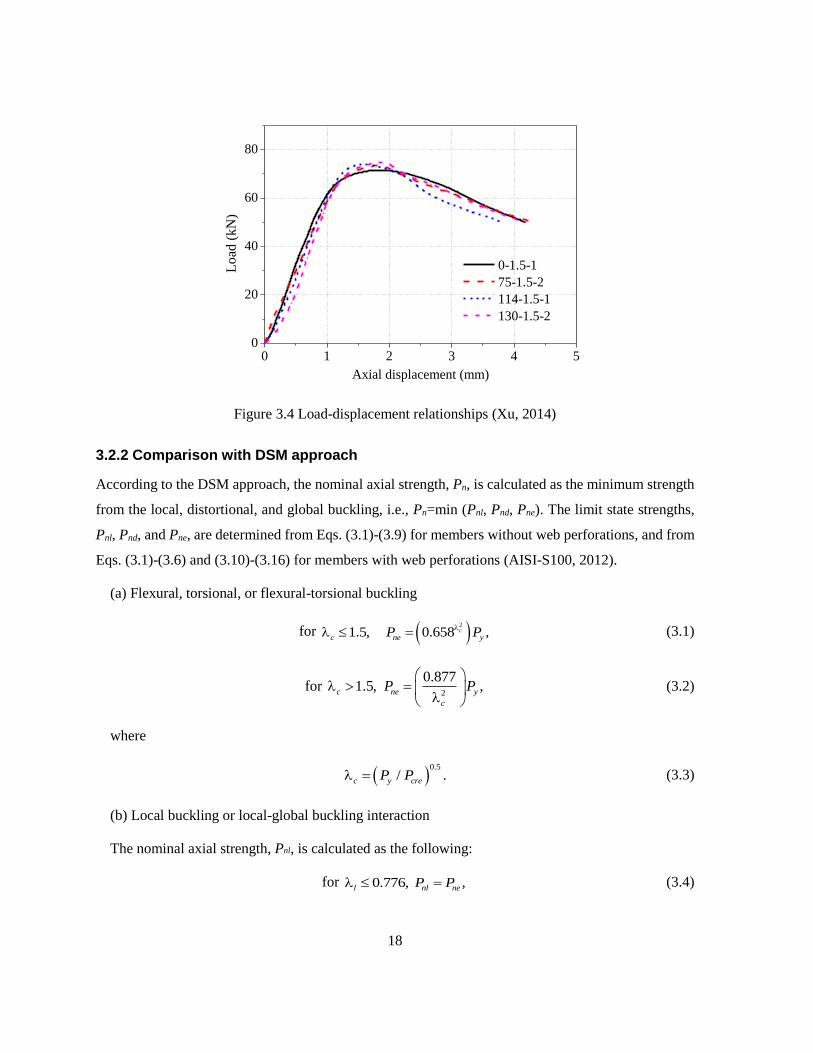
Figure 3.4 Load-displacement relationships (Xu, 2014) ...................................................................... 18
Figure 3.5 Stress-strain relationship of steel at ambient temperature ................................................... 23
Figure 3.6 Stress-strain relationship of steel at elevated temperature .................................................. 24
Figure 3.7 FE mesh and boundary conditions for specimen 100×54×15×1.2 ...................................... 25
Figure 3.8 Failure modes of columns without perforations .................................................................. 26
Figure 3.9 Failure modes of columns with perforations ....................................................................... 26
Figure 3.10 Comparison of compressive strength between FEA and test results................................. 27
Figure 3.11 Configuration of CFS wall section .................................................................................... 29
Figure 3.12 Temperature contour (Lh =380 mm): (a) CFS wall and (b) C-shape column .................... 30
Figure 3.13 Stress-strain relationship of cold-formed steel at elevated temperature ............................ 32
Figure 3.14 Load and boundary conditions in structural analysis ........................................................ 33
Figure 3.15 Initial global geometric imperfection (L/1000) ................................................................. 33
Figure 3.16 Time-end reaction force curve (Lh=380 mm, R=0.9) ........................................................ 34
Figure 3.17 Time-axial deformation curve (Lh=380 mm, R=0.9) ........................................................ 35
Figure 3.18 Failure mode (Lh=380 mm, R=0.9) ................................................................................... 36
Figure 3.19 Effect of web perforation lengths on failure time ............................................................. 37
xii
Figure 3.20 Effect of web perforation lengths on temperature distribution ......................................... 37
Figure 4.1 Temperature simplifications in CFS wall stud without web perforations .......................... 40
Figure 4.2 Experimental set-up (Kolarkar, 2010) ................................................................................ 41
Figure 4.3 Equivalent wall width for determining temperature distribution........................................ 42
Figure 4.4 Finite element meshes of CFS wall segments .................................................................... 43
Figure 4.5 Heat transfer mechanism in CFS walls ............................................................................... 45
Figure 4.6 Thermal properties of gypsum board (Gunawan, 2011) ..................................................... 47
Figure 4.7 Thermal properties of cold-formed steel (Gunawan, 2011) ............................................... 48
Figure 4.8 Thermal conductivity of glass fibre (Gunawan, 2011) ....................................................... 48
Figure 4.9 Comparison of time-temperature profiles between FEA and tests by Kolarkar (2010) ..... 50
Figure 4.10 Configuration of CFS walls with web-perforated studs ................................................... 51
Figure 4.11 Temperature contour of insulated CFS walls at mid-height cross section........................ 53
Figure 4.12 Temperature contour of insulated CFS wall frames at 104 minutes ................................. 53
Figure 4.13 Temperature contour of non-insulated CFS walls at mid-height cross section ................ 54
Figure 4.14 Non-uniform temperature distributions in insulated CFS wall studs at 104 minutes ....... 55
Figure 4.15 Non-uniform temperature distributions in non-insulated CFS wall studs at 120 minutes 55
Figure 4.16 Stud depth-temperature profiles ....................................................................................... 56
Figure 4.17 Comparison of stud temperatures for insulated CFS walls (Lh=530 mm) ........................ 58
Figure 4.18 Comparison of stud temperatures for insulated CFS walls (Lh =130 mm) ....................... 58
Figure 4.19 Comparison of stud temperatures for non-insulated CFS walls (Lh =530 mm) ................ 59
Figure 4.20 Comparison of stud temperatures for non-insulated CFS walls (Lh =130 mm) ................ 59
Figure 5.1. Configuration of load-bearing CFS wall specimens (Xu, 2011) ....................................... 66
Figure 5.2. Experimental setup (Xu, 2011) .......................................................................................... 67
Figure 5.3. Finite element mesh of CFS walls ..................................................................................... 68

xiii
Figure 5.4 Thermal properties of Type C and X gypsum board (Mehaffey et al., 1994) ..................... 71
Figure 5.5 Thermal properties of MgO board (Chen et al., 2013) ........................................................ 73
Figure 5.6 Loading and boundary conditions of single CFS stud model ............................................. 74
Figure 5.7 True stress-strain relationship of CFS stud at elevated temperature ................................... 77
Figure 5.8 Reduction factor of CFS stud at elevated temperature ........................................................ 77
Figure 5.9 Time-reaction force curve (LBW-E1(a)) ............................................................................ 79
Figure 5.10 Time-axial deformation curve (LBW-E1(a)) .................................................................... 79
Figure 5.11 Mises stress contour of FEA results for single stud model (LBW-E1(a)) ........................ 80
Figure 5.12 U3 of FEA results for single stud model (LBW-E1(a)) .................................................... 80
Figure 5.13 Temperature contour of Stud 4 at failure time (LBW-E1(a)) ........................................... 81
Figure 5.14 Cross-sectional temperature contours of Stud 4 for all specimens at failure time ............ 83
Figure 5.15 FE mesh of CFS wall frame model ................................................................................... 85
Figure 5.16 Interactions and constraints of CFS wall frame model ..................................................... 86
Figure 5.17 Boundary and loading conditions of CFS wall frame model ............................................ 87
Figure 5.18 Failure mode of CFS wall frame model (LBW-E1(a)) ..................................................... 89
Figure 5.19 Failure mode of CFS wall frame model (LBW-3) ............................................................ 90
Figure 5.20 Time-average axial displacement relationships at stud top end ........................................ 91
Figure 5.21 Time-reaction force relationships at stud bottom end ....................................................... 93
Figure 5.22 Failure mode of CFS wall frame model (LBW-3) (friction coefficient=0.3) ................... 95
Figure 5.23 Time-reaction force relationships at stud bottom support (friction coefficient=0.3) ........ 96
Figure 5.24 Sheathing modelled using shell element S4R ................................................................... 97
Figure 5.25 Interaction and constraint between sheathing and studs ................................................... 98
Figure 5.26. Stress-strain relationship of sheathing ............................................................................. 99
Figure 5.27. Structural response of CFS frame at 60 minutes ............................................................ 101
xiv
Figure 5.28. Temperature distribution within CFS frames at 60 minutes .......................................... 101
Figure 5.29. Out-of-plane deformation (UZ) versus time (min) curve .............................................. 102
Figure 5.30. Stress distributions within gypsum boards at 60 minutes .............................................. 104
Figure 6.1 Cross-sectional temperature profiles of studs with different perforation lengths ............. 109
Figure 6.2 Time-temperature curve of stud flange-web junctions ..................................................... 110
Figure 6.3 Comparison of normalized cross-sectional yield strength ................................................ 110
Figure 6.4 Comparison of normalized cross-sectional elastic modulus ............................................. 111
Figure 6.5 Failure time-applied load relationship predicted by FEA ................................................. 111
Figure 6.6 Neutral axis shift, thermal bowing and magnification effects .......................................... 118
Figure 6.7 Calculated ultimate compression strength at mid-height and at support .......................... 120
Figure 6.8 Comparison of interaction of compression and bending .................................................. 120
Figure 6.9 Comparison of axial strength based on extended design method ..................................... 121
1
Chapter 1 Introduction
1.1 Background
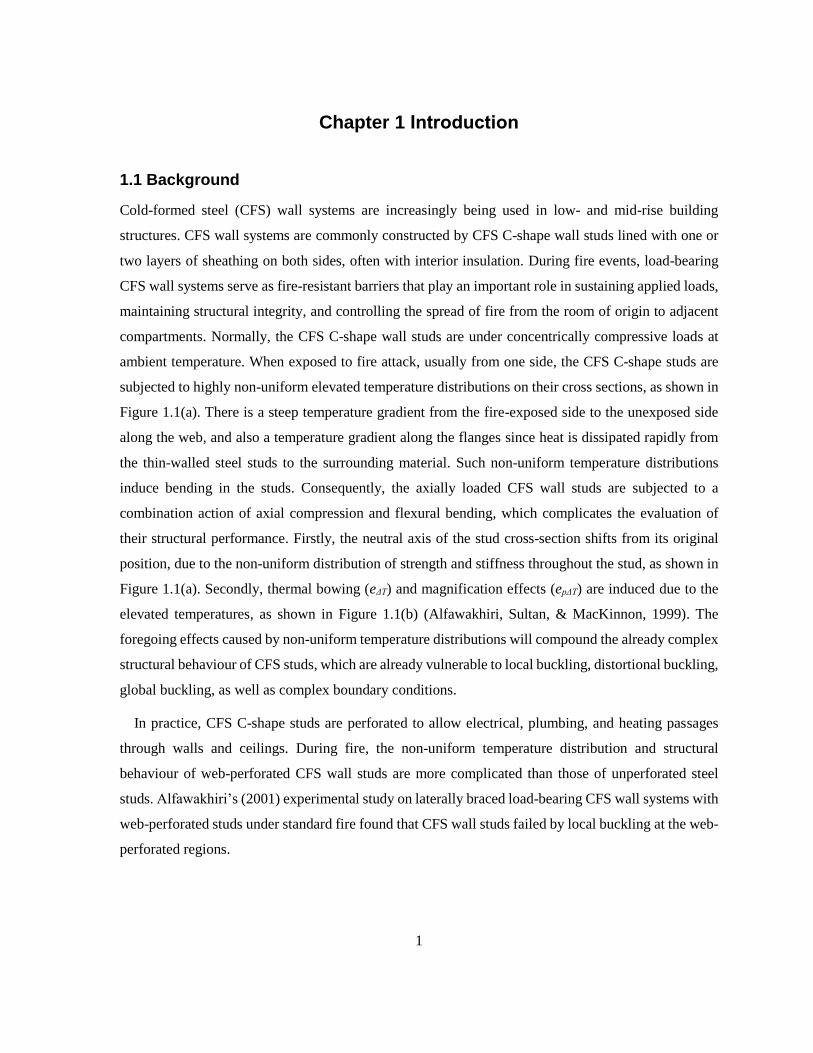
Cold-formed steel (CFS) wall systems are increasingly being used in low- and mid-rise building
structures. CFS wall systems are commonly constructed by CFS C-shape wall studs lined with one or
two layers of sheathing on both sides, often with interior insulation. During fire events, load-bearing
CFS wall systems serve as fire-resistant barriers that play an important role in sustaining applied loads,
maintaining structural integrity, and controlling the spread of fire from the room of origin to adjacent
compartments. Normally, the CFS C-shape wall studs are under concentrically compressive loads at
ambient temperature. When exposed to fire attack, usually from one side, the CFS C-shape studs are
subjected to highly non-uniform elevated temperature distributions on their cross sections, as shown in
Figure 1.1(a). There is a steep temperature gradient from the fire-exposed side to the unexposed side
along the web, and also a temperature gradient along the flanges since heat is dissipated rapidly from
the thin-walled steel studs to the surrounding material. Such non-uniform temperature distributions
induce bending in the studs. Consequently, the axially loaded CFS wall studs are subjected to a
combination action of axial compression and flexural bending, which complicates the evaluation of
their structural performance. Firstly, the neutral axis of the stud cross-section shifts from its original
position, due to the non-uniform distribution of strength and stiffness throughout the stud, as shown in
Figure 1.1(a). Secondly, thermal bowing (eΔT) and magnification effects (epΔT) are induced due to the
elevated temperatures, as shown in Figure 1.1(b) (Alfawakhiri, Sultan, & MacKinnon, 1999). The
foregoing effects caused by non-uniform temperature distributions will compound the already complex
structural behaviour of CFS studs, which are already vulnerable to local buckling, distortional buckling,
global buckling, as well as complex boundary conditions.
In practice, CFS C-shape studs are perforated to allow electrical, plumbing, and heating passages
through walls and ceilings. During fire, the non-uniform temperature distribution and structural
behaviour of web-perforated CFS wall studs are more complicated than those of unperforated steel
studs. Alfawakhiri’s (2001) experimental study on laterally braced load-bearing CFS wall systems with
web-perforated studs under standard fire found that CFS wall studs failed by local buckling at the web-
perforated regions.

2
(a) Temperature distribution simplification proposed by (Feng,
Wang, & Davies, 2003c) and neutral axis shift (eΔE) (b) Thermal bowing (eΔT)
and magnification effects (epΔT)
Figure 1.1 Behaviour of CFS wall studs exposed to fire from one side
Two approaches may be used to demonstrate structural fire safety of CFS walls: (1) prescriptive
approach, in which fire resistance rating of CFS walls (45 min., 1 hr., 1.5 hr. or 2 hr.,etc.) is primarily
based on specifying the number of layers and thickness in each layer of fire protection sheathing, and
the percent of design load. (2) performance-based approach; that is, the behaviour of the CFS walls in
fire is explicitly assessed. But challenges exist in the latter one, such as more realistic fire models; more
accurate thermal properties; three-dimensional heat transfer models including detailed wall components;
verified coupled thermo-mechanical models at system level; performance-based design method; etc.
(Abreu, Vieira, Abu-Hamd, & Schafer, 2014).
Although the performance-based fire resistance design guidelines for hot-rolled steel members are
well-established, they are not applicable to CFS wall studs that are susceptible to various buckling.
Several fire design recommendations based on effective width method (EWM) are proposed for CFS
wall studs without web perforations, subjected to non-uniform temperature distributions under standard
fire. These recommendations have been adopted for the American Iron and Steel Institute (AISI) design
provisions (Gerlich, Collier, & Buchanan, 1996; Klippstein, 1980), Eurocode 3 (Feng & Wang, 2005;
Kaitila, 2002; Ranby, 1999; Zhao et al., 2005) and Canadian cold-formed steel design rules
Higher
temperature
Original
centroid
Centroid with non-
uniform temperature
distribution
Lower
temperature
Temperature
distribution
Axial load
Fire side Ambient
side
eΔT epΔT
Stud
Fire side
Ambient side

3
(Alfawakhiri, 2002). Unlike the abovementioned design method, Shahbazian’s (2013) equations is
based on direct strength method (DSM). However, little research has been undertaken to investigate
the performance of load-bearing CFS walls with web-perforated studs subjected to standard fire. In
addition, only limited research is exploring the behaviour of perforated CFS wall studs at both ambient
and elevated temperatures.
1.2 Research objective and scope
The research described in this thesis is undertaken to clarify the thermal and structural performance of
CFS walls with web-perforated studs under standard fire. The ultimate goal is to propose a simplified
design method to evaluate the fire resistance of steel studs with web perforations in CFS walls exposed
to standard fire from one side. The scopes of this research are as follows:
investigating the effect of web perforations on the compressive strength of C-shape CFS stub
columns at ambient temperature, and accessing the applicability of DSM for calculating the
ultimate strength of CFS studs with web perforations;
evaluating the effect of web perforation length and load ratio on the failure time of steel studs in
CFS wall segment exposed to standard fire from one side using finite element analysis;
investigating the temperature distributions of steel studs with varying web perforation length in
CFS wall segment exposed to standard fire from one side using finite element analysis;
developing sequentially uncoupled thermal-stress finite element models, featuring heat transfer
and stress analysis, for load-bearing CFS walls with web-perforated studs under standard fire;
three models, i.e., single CFS stud mode, CFS wall frame model and CFS wall system model,
are discussed;
proposing design equations, accounting for the presence of web perforations, for evaluating the
fire resistance of web-perforated studs in CFS walls exposed to standard fire from one side.
1.3 Thesis organization
This thesis includes the development of sequentially uncoupled finite element thermal and structural
analysis and proposes design equations for evaluating the behaviour of CFS walls with web-perforated
studs subjected to standard fire. The thesis is organized into seven chapters as follows:
4
Chapter 2 reviews selected previous studies on the performance of CFS wall systems subjected to
standard fire.
Chapter 3 investigates the effect of web perforations on the behaviour of C-shape studs at ambient
temperature, and uniform and non-uniform cross-sectional elevated temperatures.
Chapter 4 conducts a three-dimensional finite element analysis to trace the heat transfer process of
CFS walls with web-perforated CFS studs subjected to standard fire. The thermal models of CFS
walls are validated using data from full-scale fire tests. The temperature distribution within CFS
studs of varying web perforation lengths are investigated.
Chapter 5 investigates the thermal and structural performance of CFS load-bearing walls with C-
shape studs with web perforations subjected to standard fire. Sequentially uncoupled 3D FE
thermal-stress analysis is carried out, in which the heat transfer analysis is conducted to obtain the
temperature distribution of an entire CFS wall. In the subsequent structural analysis, a CFS wall
frame rather than a single stud is modeled to achieve system-level structural responses.
Additionally, sheathing, modelled using both shell element and in-plane lateral restraint, is
discussed. The finite element analysis results are compared with those from full-scale fire tests.
Chapter 6 develops a simple method for quantifying thermal performance and proposes design
equations based on AISI S100 to evaluate the fire resistance of web-perforated studs in fully
insulated CFS walls exposed to standard fire;
Chapter 7 concludes the thesis, and provides recommendations for future research.

5
Chapter 2 Literature Review
Presented in this chapter is a literature review that covers a range of the must-relevant research papers,
reports and theses on the fire performance of CFS wall systems.
2.1 Experimental research
In this section, some of previous experimental studies of full-scale load-bearing CFS walls under
standard fire conditions are presented in chronological order.
Gerlich (1995), Gerlich, Collier, and Buchanan (1996) conducted three tests on non-insulated load-
bearing CFS wall specimens exposed to ISO 834 fire (1975). All the test specimens generally failed by
buckling of the compression flange of steel studs on the ambient side of the wall systems. A model to
predict the failure time was proposed. The process of the prediction consisted of a heat transfer analysis
of using computer software TASEF (Sterner & Wickstorm, 1990) and a structural analysis using self-
developed spreadsheets.
Kodur and Sultan (2001) studied the effect of various factors influencing fire resistance of laterally
braced load-bearing CFS wall systems with 14 full-scale CFS wall specimens. All the tests were
performed based on the standard procedures stipulated in CAN/ULC S101-M89 (1989). The results
showed that CFS wall specimens failed structurally as a result of local or overall buckling, and the
insulation type and stud-spacing significantly influence the fire resistance of steel stud wall systems.
Alfawakhiri (2002) conducted three standard fire resistance tests of laterally braced load-bearing
CFS wall specimens. The effects of cavity insulation, resilient channels, and stud spacing on the fire
resistance of CFS wall systems were investigated. All the CFS wall specimens exhibited structural
failure as a result of overall buckling of wall studs at elevated temperature. The dominant failure mode
of the studs for non-insulated walls was the buckling of the flange exposed to ambient temperature near
mid-height and bending towards the furnace, while the failure of studs for insulated walls was the
buckling of the flange exposed to elevated temperature at the location of the bottom web perforation
and bending away from the furnace for insulated walls. This was because the existence of cavity
insulation changed the temperature gradient across the stud sections in the wall thickness direction.
Similar to that was found by Kodur and Sultan (2001), Alfawakhiri also concluded that the cavity
insulation was detrimental to the fire resistance of load-bearing CFS walls. In Alfawakhiri’s study, each
6
stud had four web perforations, and the studs failed by local buckling at the locations of web
perforations.
Feng (2004) carried out eight full-scale tests of load-bearing CFS wall systems, of which two were
at ambient temperature and six were exposed to the standard fire condition from one side. Load ratios
of 0.2, 0.4, and 0.7 were considered in this study. The temperature development in the steel studs was
found to be independent on the applied loads in the CFS wall systems. The failure mode of the CFS
wall studs for all the tests was global buckling about the major axis with some torsion on the fire-
exposed side, except for one test failed by local buckling at the top. This was mainly because the
unexposed gypsum boards were able to prevent lateral restraint for CFS wall studs about the minor axis
during the whole fire tests. The failure times of CFS wall systems with thinner thickness of steel studs
was found to be less than those of wall systems with thicker studs.
Sultan (2010) conducted 41 full-scale wall fire resistance tests in accordance with ULC-S101
standard fire exposure at the National Research Council of Canada. These tests, including CFS stud
walls and timber stud walls, aimed to determine the gypsum board fall-off temperature criterion, which
was based on the sudden temperature rise measured on the back side of the fire-exposed gypsum board
caused by its falling-off or sagging. Little difference in the fall-off temperatures was observed for wall
systems with a single layer or double layers of gypsum boards, with and without insulation in wall
cavity and with different screw spacing.
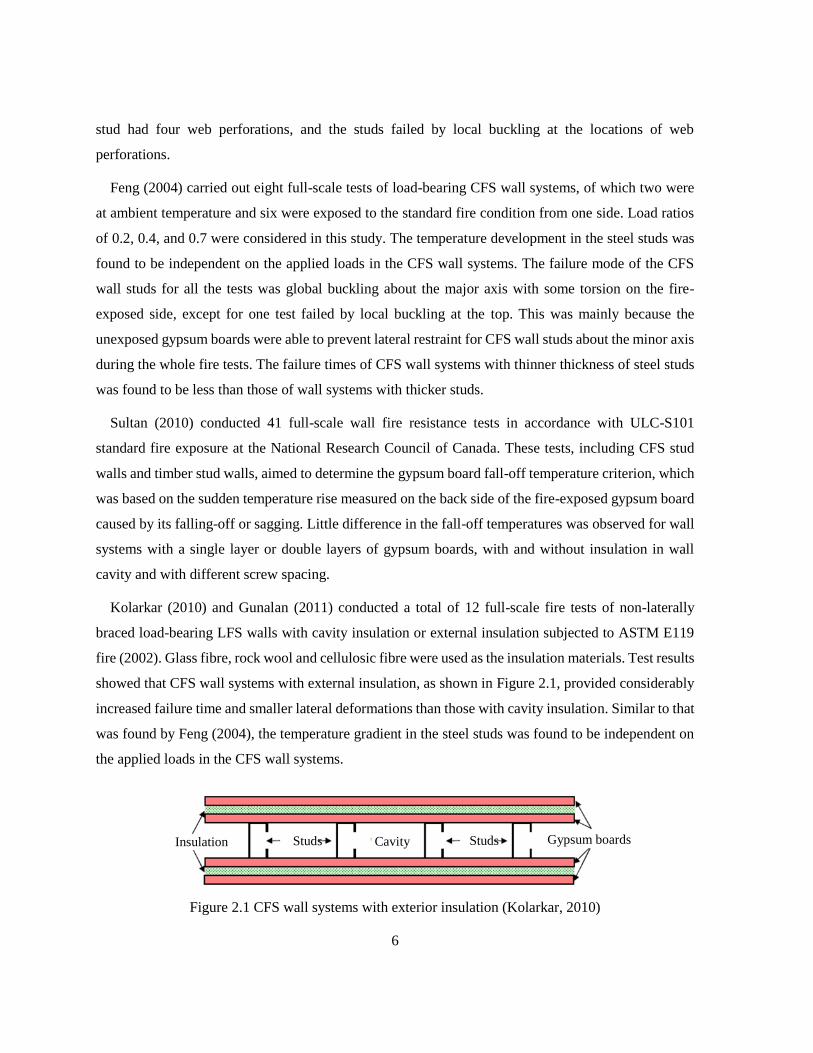
Kolarkar (2010) and Gunalan (2011) conducted a total of 12 full-scale fire tests of non-laterally
braced load-bearing LFS walls with cavity insulation or external insulation subjected to ASTM E119
fire (2002). Glass fibre, rock wool and cellulosic fibre were used as the insulation materials. Test results
showed that CFS wall systems with external insulation, as shown in Figure 2.1, provided considerably
increased failure time and smaller lateral deformations than those with cavity insulation. Similar to that
was found by Feng (2004), the temperature gradient in the steel studs was found to be independent on
the applied loads in the CFS wall systems.
Figure 2.1 CFS wall systems with exterior insulation (Kolarkar, 2010)
Insulation Studs Cavity Studs Gypsum boards

7
Xu (2011) conducted 16 full-scale tests of laterally braced load-bearing CFS wall systems with
perforated studs subjected to ISO 834 fire (1999). The objective of these tests was to investigate for the
application of laterally braced load-bearing CFS walls with web-perforated studs in mid-rise buildings.
The effects of various lining materials, such as MgO boards and gypsum boards (Type C and Type X),
on the fire resistance were also studied. In particular, fire test specimens with lining material mainly
composed of MgO board, diamon lath and stucco with wine mesh on the fire-exposed side or both sides
were investigated.
Chen and Ye (2013) carried out six full-scale CFS wall specimens with double layers of lining
materials on both sides, of which the insulation material of Aluminum silicate wool was used as external
insulation on the fire-exposed side while no external insulation was used on the ambient side. Five
types of lining materials were used in the experiments, including gypsum board, bolivian magnesium
board, oriented standard board (OSB), autoclaved light weight concrete (ALC) board, and rock wool
board. Similar to Kolarkar (2010) and Gunalan (2011), test results showed that the failure time of load-
bearing CFS wall systems was greatly increased due to external insulation. Results also demonstrated
that the CFS walls attached with bolivian magnesium boards or ALC boards had superior fire
performance to those attached with gypsum boards or OSB boards in mid-rise buildings.
Figure 2.2 CFS wall systems with exterior insulation (Chen & Ye, 2013)
2.2 Thermal modelling
Since the temperature distributions in the steel studs are independent with the applied axial loads; thus,
the developed analytical and finite element heat transfer models can be used to predict the temperature
distributions of both non-load-bearing and load-bearing CFS wall systems.
2.2.1 Analytical thermal modelling
Klippstein (1978, 1980) first proposed an analytical method to predict the time of structural failure for
load-bearing CFS walls subjected to standard fire. One-dimensional heat transfer models were
developed to predict the temperature distribution across the steel studs of CFS wall systems without
External insulation Studs Cavity Studs Lining materials

8
cavity insulation (Collier, 1996; Sultan, 1996) and with cavity insulation (Kodur & Sultan, 2001;
Shahbazian & Wang, 2014). Chen and Ye (2013) improved the convergence of the one-dimensional
thermal response models by using the Gauss-Seidel method to solve the governing equation. In all the
above proposed models, except for Shahbazian and Wang’s model (2014), the presence of the thin-
walled CFS steel frame was neglected because the argument that the CFS frame plays a minor role in
the heat transfer mechanism.
2.2.2 Finite element heat transfer analysis
Gerlich (1995), Alfawakhiri (2001) and Gunawan (2011) performed heat transfer analyses to predict
the temperature distributions associated with time variation for CFS wall systems exposed to standard
fire conditions using computer programs TASEF (Sterner & Wickstrom, 1990), TRACE (Alfawakhiri,
2001) and SAFIR (2004). Good accuracy was reported based on the results obtained from the programs.
Jones (2001) investigated the performance of CFS and light timber frame wall assemblies lined with
gypsum boards subjected to real building fires using SAFIR.
Feng et al. (2003c) conducted heat transfer analyses of non-load-bearing small-scale CFS stud wall
systems by using the finite element software ABAQUS. A parametric study was also carried out to
examine the thermal performance of different steel stud systems. This study assumed a uniform
temperature distribution along the stud length and perfect contact between the interior insulation and
the steel sections. Feng, et al. (2003c) concluded that ABAQUS could be used to simulate the
temperature distributions in CFS wall systems under standard fire conditions provided there was no
integrity failure of the gypsum boards, including cavity radiation, by adopting appropriate thermal
boundary conditions and thermal properties. It was also found that the temperature profiles of steel stud
wall systems were not affected much by the shape of the CFS cross section. The effect of lips on
temperature distribution can be ignored when the flange width is small. It was found that the thermal
performance of CFS wall system was not significantly affected by the types of interior insulation and
the shape of the CFS cross section. Temperatures of the steel section of a CFS stud panel system depend
primarily on insulation panels on the fire-exposed side. However, it was noticed that cavity insulation
was beneficial to the fire resistance of load-bearing CFS walls, which contradicted the conclusion that
is found by Kodur and Sultan (2001) and Alfawakhiri (2001).
Zhao et al. (2001) investigated the validity of different computer programs such as ABAQUS,
ANSYS, FLUENT. The results obtained from the programs are in consistency with a good accuracy.
9
It was concluded that all the computer programs were capable for heat transfer analysis once one of
them is validated against tests. In this investigation, it was assumed that conduction is the primary heat
transfer mechanism in the steel studs and gypsum boards. Convection and radiation acted essentially
for heat transfer from fire to gypsum boards. For the reason of simplicity, radiation effects within the
gypsum boards were neglected. In numerical models, nonlinearity due to temperature dependency of
material properties and boundary conditions were taken into account. The height and the cross-section
size of the stud were considered as parameters affecting the thermal behaviour. However, the mass
transfer in materials such as moisture movement was not simulated.
2.3 Finite element structural modelling
Finite element analysis has been carried out to investigate the structural behaviour of load-bearing CFS
wall systems under fire conditions and to determine their fire resistance rating using ABAQUS by many
researchers. The FEAs of CFS wall studs under fire conditions were conducted under two conditions,
namely steady state condition (Feng et al., 2003c; Gunalan & Mahendran, 2013) and transient state
condition (Feng et al., 2003c; Gunalan & Mahendran, 2013; Kaitila, 2002; Zhao et al., 2005). In
modelling steady state, the non-uniform temperature distributions in CFS cross section were raised to
the target levels and maintained. An external axial load was then applied to the stud in increments until
failure. In modelling transient state, the target load was first applied based on the specified load ratio,
after that the measured time-dependent non-uniform temperature distributions in the stud were
incorporated.
Kaitila (2002), Feng et al. (2003c), and Gunalan and Mahendran (2013) used a rigid plate at each
end of the stud to simulate pinned support conditions. The reference point for the rigid plate was the
original centroid of the gross cross section. Zhao et al. (2005) considered two support conditions. In the
first case pinned support condition was assumed for both ends, whereas in the second case fixed support
condition was used in one end while pinned support condition was used at the other end. The connection
of CFS stud to gypsum boards was simulated by restraining the lateral displacement of both flanges at
screw spacing intervals along the length of the stud. That is, gypsum boards on both sides of the CFS
wall stud were assumed to be effective in restraining the stud from flexural buckling about the minor
axis and torsional buckling until failure. This assumption was adopted by other researchers as well
(Feng et al., 2003c; Gunalan & Mahendran, 2013; Kaitila, 2002; Zhao et al., 2005).
10
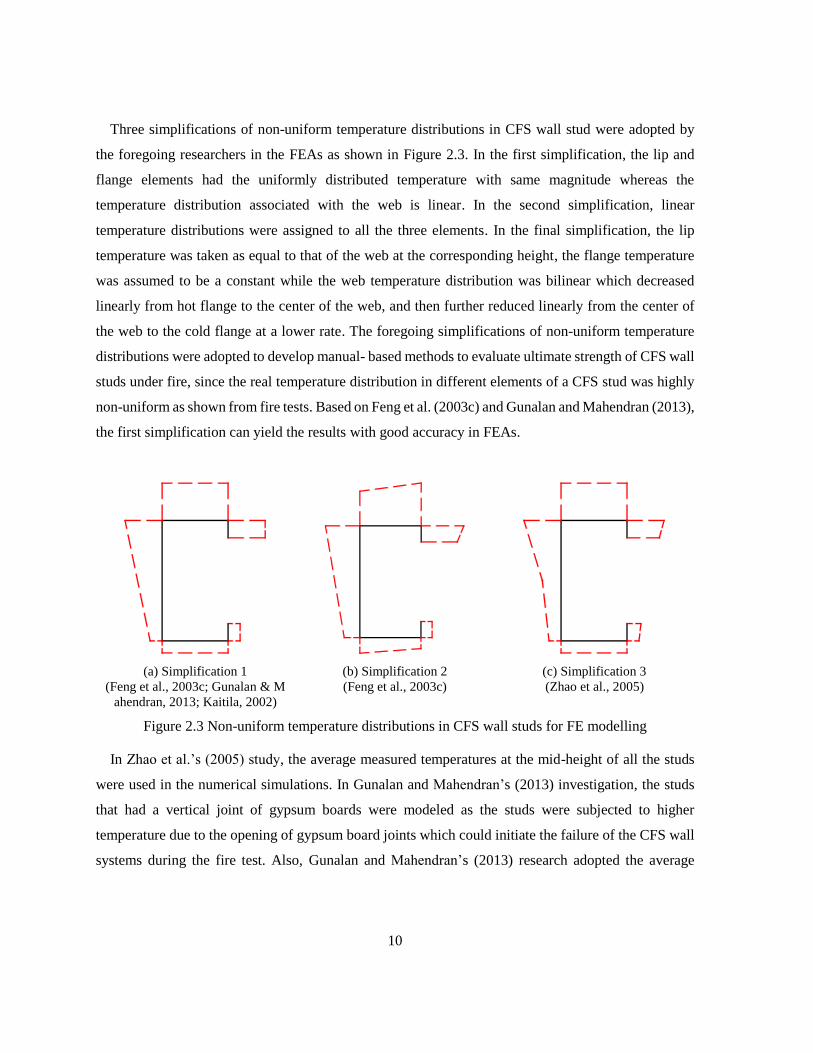
Three simplifications of non-uniform temperature distributions in CFS wall stud were adopted by
the foregoing researchers in the FEAs as shown in Figure 2.3. In the first simplification, the lip and
flange elements had the uniformly distributed temperature with same magnitude whereas the
temperature distribution associated with the web is linear. In the second simplification, linear
temperature distributions were assigned to all the three elements. In the final simplification, the lip
temperature was taken as equal to that of the web at the corresponding height, the flange temperature
was assumed to be a constant while the web temperature distribution was bilinear which decreased
linearly from hot flange to the center of the web, and then further reduced linearly from the center of
the web to the cold flange at a lower rate. The foregoing simplifications of non-uniform temperature
distributions were adopted to develop manual- based methods to evaluate ultimate strength of CFS wall
studs under fire, since the real temperature distribution in different elements of a CFS stud was highly
non-uniform as shown from fire tests. Based on Feng et al. (2003c) and Gunalan and Mahendran (2013),
the first simplification can yield the results with good accuracy in FEAs.
(a) Simplification 1
(Feng et al., 2003c; Gunalan & M
ahendran, 2013; Kaitila, 2002)
(b) Simplification 2
(Feng et al., 2003c)
(c) Simplification 3
(Zhao et al., 2005)
Figure 2.3 Non-uniform temperature distributions in CFS wall studs for FE modelling
In Zhao et al.’s (2005) study, the average measured temperatures at the mid-height of all the studs
were used in the numerical simulations. In Gunalan and Mahendran’s (2013) investigation, the studs
that had a vertical joint of gypsum boards were modeled as the studs were subjected to higher
temperature due to the opening of gypsum board joints which could initiate the failure of the CFS wall
systems during the fire test. Also, Gunalan and Mahendran’s (2013) research adopted the average
11
measured temperatures at three different height locations (top, mid and bottom) of each single critical
stud. This could eliminate the sharp rise and fall in deformation-time curves of the stud.
The initial geometrical imperfection does not have any noticeable effect on the behaviour of studs
due to the dominance of thermal bowing according to Feng et al. (2003c), and Gunalan and Mahendran
(2013). The residual stresses in steel studs were found to be unimportant in the FEAs under fire
conditions by all the researchers (Feng et al., 2003c; Gunalan & Mahendran, 2013; Kaitila, 2002; Zhao
et al., 2005).
The FE models of CFS wall studs developed by Zhao et al. (2005), and Gunalan and Mahendran
(2013) were validated with test results and shown a good accuracy. However, Kaitila (2002) and Feng
et al.’s (2003c) models for CFS wall studs under transient conditions were not validated against relevant
experimental results. Though the accuracy of these two models could not be validated, the failure time
and deformation curves obtained from these FEAs were found to be in a good consistency with the
FEA results obtained by Zhao et al. (2005) and Gunalan and Mahendran (2013).

12
Chapter 3 Behaviour of Web-Perforated CFS C-shape Studs at
Ambient and Elevated Temperatures
3.1 Introduction
For ambient temperature, load-bearing CFS wall stud design in the North American is generally based
on AISI S100 (2012) provisions. In the main specification of AISI S100 (2012), the width and length
of a perforation are limited to be no more than 63.5 mm and 114 mm, respectively; and the strength
determination of a stiffened element (e.g., the web of a C-section) with noncircular perforations is based
on the traditional effective-width based method, that is, considering members as assemblages of
individual elements often subject to local buckling. In Appendix 1 of AISI S100 (2012), the Direct
Strength Method (DSM) provides an alternative procedure for determining the strength of CFS
members, and extends the limits on the perforation size, shape and spacing. The DSM based approach
utilizes finite strip analysis which accounts for the influence of perforations on predicting the elastic
buckling loads of a stud, and then substitutes the obtained elastic buckling loads into a set of
compressive strength prediction equations to determine the stud strength. However, only a limited
number of tests have been carried out to validate the accuracy and generality of the DSM equations in
AISI S100 (2012).
Used as wall studs, cold-formed steel (CFS) C-shape studs are often enclosed with insulation in the
wall cavity and protected by gypsum boards on both sides. Pre-punched web perforations in studs
accommodate the passage of utilities and installation of intermediate braces in practice. A CFS C-shape
stud in a CFS wall is subjected to non-uniform cross-sectional distribution of elevated temperature
when the wall assembly is exposed to fire attack from one side. Consequently, the stud fail by a
combination of axial compression and bending actions due to thermal bowing, magnification effects
and neutral axis shift. Due to the existence of web perforations, the non-uniform temperature
distributions and structural behaviour of CFS wall studs become more complicated than those of steel
studs without perforations at elevated temperatures during fire events. The complexity associated with
perforation shape, size, and spacing has created a challenge in determining the compressive strength of
CFS C-shape studs with web perforations. Currently, research on the behaviour of web-perforated CFS
wall studs at elevated temperatures is limited.
13
Presented in this chapter are experimental and finite element studies on web-perforated CFS wall
studs under various conditions. First, at ambient temperature, the experimental investigation of CFS C-
shape stub columns with web perforations at varying lengths (Xu, 2014) are reported. The efficiency
and accuracy of DSM in predicting the ultimate compressive strength of such columns is verified
through a comparison with test data (Xu, 2014). Second, finite element analysis (FEA) is carried out to
investigate the behaviour of CFS C-shape stub columns with web perforations at uniform cross-
sectional distribution of elevated temperatures, and the applicability of FEA is validated by tests (Feng,
Wang, & Davies, 2003d). Finally, finite element analysis is performed to investigate the effect of web
perforations on the behaviour of CFS C-shape wall studs subjected to non-uniform cross-sectional
distribution of elevated temperatures. Sequentially uncoupled thermal-stress analysis is carried out
under transient state condition. The non-uniform cross-sectional distributions of elevated temperature
are obtained from the thermal analysis of insulated CFS walls. CFS C-shape wall studs subjected to the
concentrically axial load with different ratios are investigated.
3.2 Behaviour of CFS C-shape stub columns at ambient temperature
This section aims to investigate the effect of the length of web perforations on the behaviour of CFS C-
shape columns. The compressive strength from CFS C-shape stub column tests (Xu, 2014) are
compared with that calculated using the DSM approach.
3.2.1 Stub column tests
3.2.1.1 Stub column specimens
To study the effect of web perforations on the compressive strength of CFS C-shape columns, a total
of 18 stub columns were tested, six being solid sections without a web perforation, and 12 having pre-
punched web perforations. The parameters investigated were the nominal thickness of steel, t, and the
length of web perforation, Lh. The nominal thicknesses of steel were 1.2 mm and 1.5 mm, and the
lengths of the web perforations ranged from 0 to 130 mm. The details of specimens and perforation
dimensions are shown in Figure 3.1 and Table 3.1, in which the first number of the designation denotes
the length of web perforation, the second and third digits represent the steel thickness, and the number
of the specimen in a column group, respectively.
The specimens were fabricated with cold-formed galvanized steel. The length for all the specimens
was selected as 490 mm for the following reasons: (i) to minimize the influence of global buckling; and

14
(ii) to ensure enough clear distance from the perforation to the end of the specimen, avoiding possible
end effects. Both ends of the specimen were milled flat to ensure full contact between the specimen and
the steel bearing plates. A slotted perforation, located in the center of the web, had a constant width, dh
of 38 mm. The lengths of the perforations, Lh, were 0, 75, 114 and 130 mm. The nominal thickness of
the specimen, t, were 1.2 and 1.5 mm. For each column group, three identical specimens were tested.
Mechanical properties for the specimens were based on the tensile coupon tests as per the Chinese
standard (GB/T228, 2010), which were tested at the Chang’an University, China. Three tensile coupons
were cut longitudinally from the web of a randomly selected C-shape CFS specimen for each thickness.
The average material properties are listed in Table 3.2, where fy, fu, Es and ν are the steel yield stress,
tensile strength, Young’s modulus of elasticity and Possion’s ratio, respectively.
Figure 3.1 Specimen profiles (Xu, 2014)
15
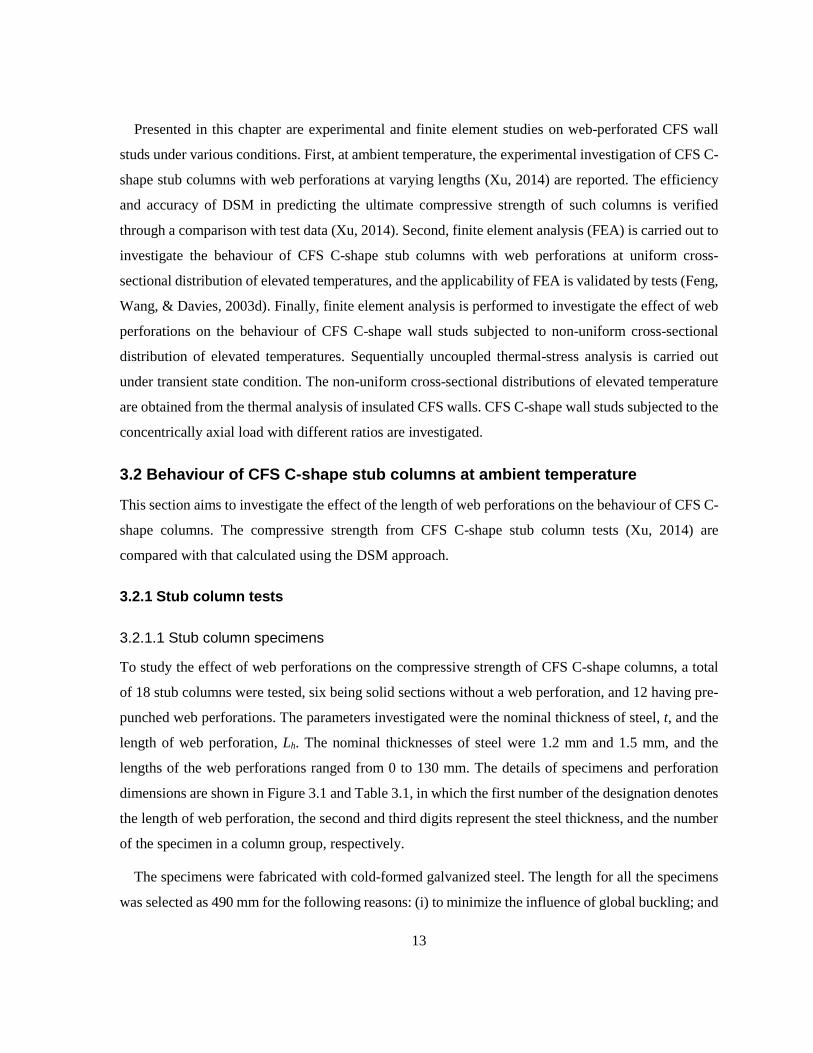
Table 3.1 Specimen dimensions (Xu, 2014)
Specimen No. L (mm) H (mm) B (mm) D (mm) t (mm) R (mm) dh (mm) Lh (mm)
0-1.5-1
490 150 40 15 1.5 3.0 38 0 0-1.5-2
0-1.5-3
75-1.5-1
490 150 40 15 1.5 3.0 38 75 75-1.5-2
75-1.5-3
114-1.5-1
490 150 40 15 1.5 3.0 38 114 114-1.5-2
114-1.5-3
130-1.5-1
490 150 40 15 1.5 3.0 38 130 130-1.5-2
130-1.5-3
114-1.2-1
490 150 40 15 1.2 2.4 38 114 114-1.2-2
114-1.2-3
130-1.2-1
490 150 40 15 1.2 2.4 38 130 130-1.2-2
130-1.2-3
Table 3.2 Mechanical properties from tensile coupon tests (Xu, 2014)
t (mm) Es (N/mm2) fy (N/mm2) fu (N/mm2) ν
1.2 2.03×10⁵ 235 400 0.3
1.5 2.03×10⁵ 385 510 0.3
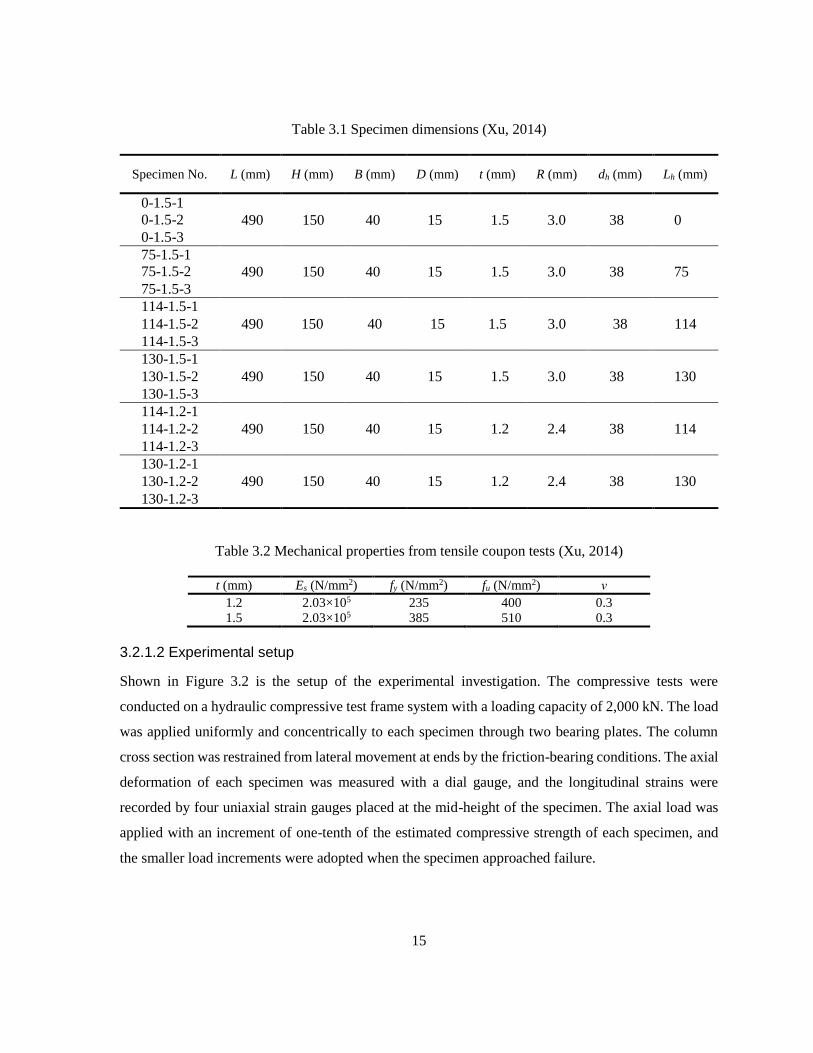
3.2.1.2 Experimental setup
Shown in Figure 3.2 is the setup of the experimental investigation. The compressive tests were
conducted on a hydraulic compressive test frame system with a loading capacity of 2,000 kN. The load
was applied uniformly and concentrically to each specimen through two bearing plates. The column
cross section was restrained from lateral movement at ends by the friction-bearing conditions. The axial
deformation of each specimen was measured with a dial gauge, and the longitudinal strains were
recorded by four uniaxial strain gauges placed at the mid-height of the specimen. The axial load was
applied with an increment of one-tenth of the estimated compressive strength of each specimen, and
the smaller load increments were adopted when the specimen approached failure.
16
Figure 3.2 Experimental setup (Xu, 2014)
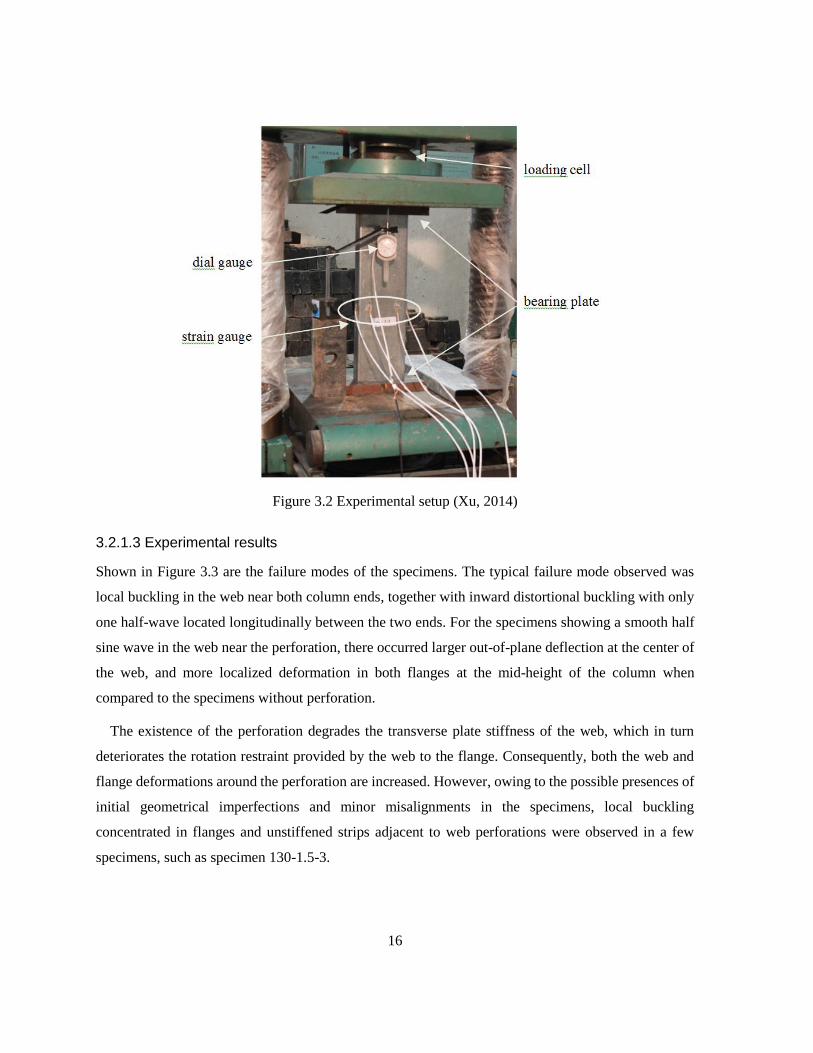
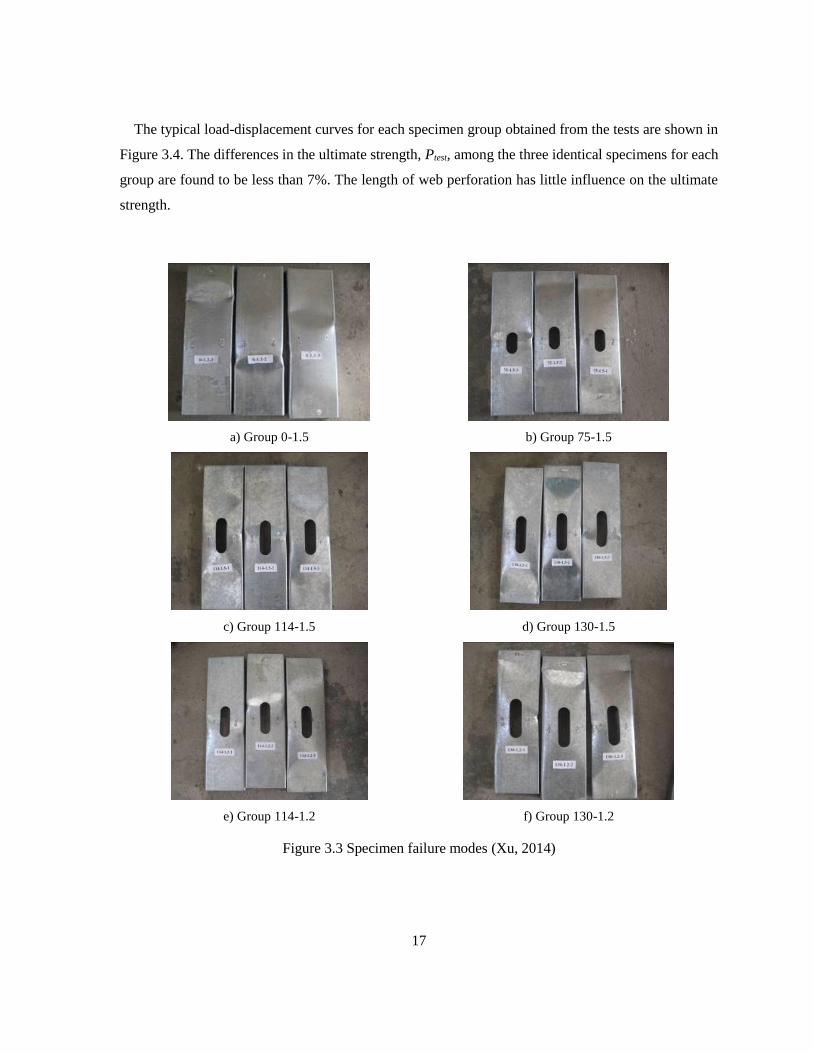
3.2.1.3 Experimental results
Shown in Figure 3.3 are the failure modes of the specimens. The typical failure mode observed was
local buckling in the web near both column ends, together with inward distortional buckling with only
one half-wave located longitudinally between the two ends. For the specimens showing a smooth half
sine wave in the web near the perforation, there occurred larger out-of-plane deflection at the center of
the web, and more localized deformation in both flanges at the mid-height of the column when
compared to the specimens without perforation.
The existence of the perforation degrades the transverse plate stiffness of the web, which in turn
deteriorates the rotation restraint provided by the web to the flange. Consequently, both the web and
flange deformations around the perforation are increased. However, owing to the possible presences of
initial geometrical imperfections and minor misalignments in the specimens, local buckling
concentrated in flanges and unstiffened strips adjacent to web perforations were observed in a few
specimens, such as specimen 130-1.5-3.
17
The typical load-displacement curves for each specimen group obtained from the tests are shown in
Figure 3.4. The differences in the ultimate strength, Ptest, among the three identical specimens for each
group are found to be less than 7%. The length of web perforation has little influence on the ultimate
strength.
a) Group 0-1.5 b) Group 75-1.5
c) Group 114-1.5 d) Group 130-1.5
e) Group 114-1.2 f) Group 130-1.2
Figure 3.3 Specimen failure modes (Xu, 2014)
18
Figure 3.4 Load-displacement relationships (Xu, 2014)
3.2.2 Comparison with DSM approach
According to the DSM approach, the nominal axial strength, Pn, is calculated as the minimum strength
from the local, distortional, and global buckling, i.e., Pn=min (Pnl, Pnd, Pne). The limit state strengths,
Pnl, Pnd, and Pne, are determined from Eqs. (3.1)-(3.9) for members without web perforations, and from
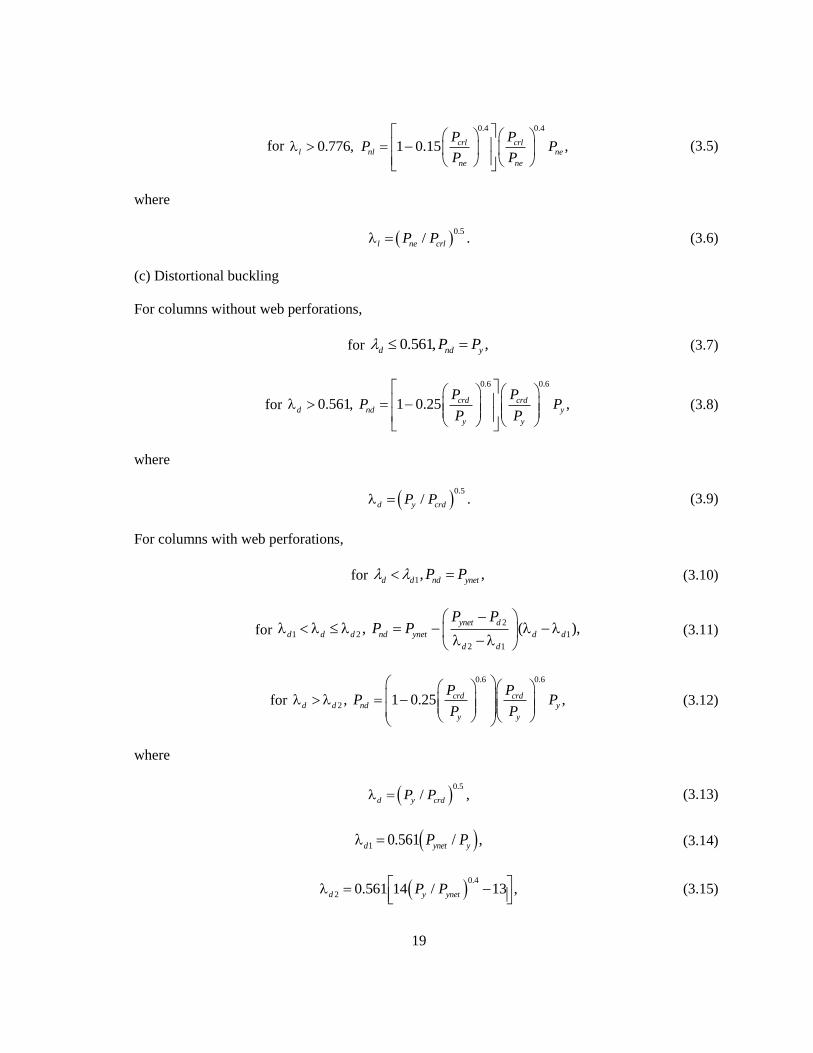
Eqs. (3.1)-(3.6) and (3.10)-(3.16) for members with web perforations (AISI-S100, 2012).
(a) Flexural, torsional, or flexural-torsional buckling
for 2
1.5, 0.658 ,c
c ne yP P
(3.1)
for 2
0.8771.5, ,c ne y
c
P P
(3.2)
where
0.5
/ .c y creP P (3.3)
(b) Local buckling or local-global buckling interaction
The nominal axial strength, Pnl, is calculated as the following:
for 0.776, ,l nl neP P (3.4)
0 1 2 3 4 50
20
40
60
80
Lo
ad (
kN
)
Axial displacement (mm)
0-1.5-1
75-1.5-2
114-1.5-1
130-1.5-2
19
for
0.4 0.4
0.776, 1 0.15 ,crl crll nl ne
ne ne
P PP P
P P
(3.5)
where
0.5
/ .l ne crlP P (3.6)
(c) Distortional buckling
For columns without web perforations,
for 0.561, ,d nd yP P (3.7)
for
0.6 0.6
0.561, 1 0.25 ,crd crdd nd y
y y
P PP P
P P
(3.8)
where
0.5
/ .d y crdP P (3.9)
For columns with web perforations,
for 1, ,d d nd ynetP P (3.10)
for 2
1 2 1
2 1
, ( ),ynet d
d d d nd ynet d d
d d
P PP P
(3.11)
for
0.6 0.6
2 , 1 0.25 ,crd crdd d nd y
y y
P PP P
P P
(3.12)
where
0.5
/ ,d y crdP P (3.13)
1 0.561 / ,d ynet yP P (3.14)
0.4
2 0.561 14 / 13 ,d y ynetP P
(3.15)
20
1.2 1.2
2
2 2
1 11 0.25 .d y
d d
P P
(3.16)
In the foregoing equations, λc, λl and λd are the slenderness ratios; Py and Pnet are the column squash
loads associated with gross and net sections, respectively; and Pcre, Pcrl and Pcrd are the elastic global,
local and distortional buckling loads, respectively.
Due to the relatively short length of the specimens, global buckling (i.e., flexural, torsional, or
flexural-torsional buckling) does not occur; thus, only the elastic buckling loads associated with local
and distortional buckling modes, Pcrl and Pcrd, were investigated by finite strip analysis with CUFSM
software (Schafer & Ádány, 2006). For members without web perforations, Pcrl and Pcrd are obtained
from the two local minimums of the elastic buckling curve (Li & Schafer, 2010). For members with
web perforations, Pcrl and Pcrd can be determined based on the method of Moen and Schafer (2009),
which accounts for the influence of web perforations.
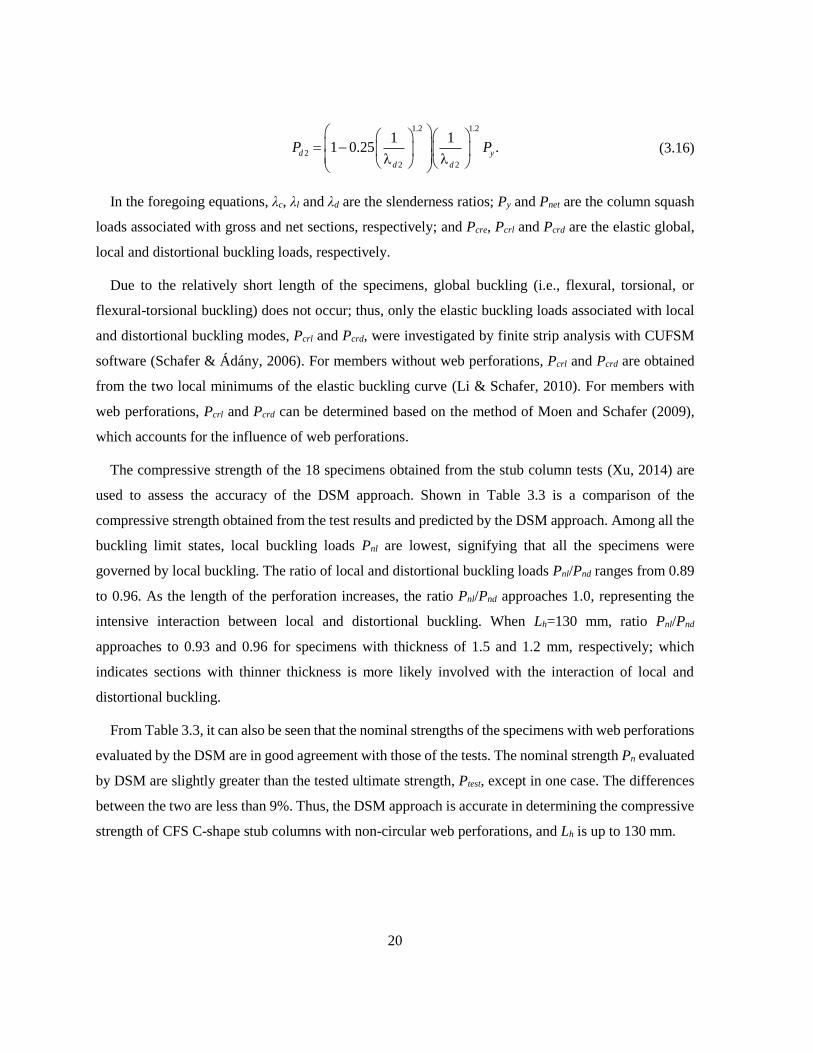
The compressive strength of the 18 specimens obtained from the stub column tests (Xu, 2014) are
used to assess the accuracy of the DSM approach. Shown in Table 3.3 is a comparison of the
compressive strength obtained from the test results and predicted by the DSM approach. Among all the
buckling limit states, local buckling loads Pnl are lowest, signifying that all the specimens were
governed by local buckling. The ratio of local and distortional buckling loads Pnl/Pnd ranges from 0.89
to 0.96. As the length of the perforation increases, the ratio Pnl/Pnd approaches 1.0, representing the
intensive interaction between local and distortional buckling. When Lh=130 mm, ratio Pnl/Pnd
approaches to 0.93 and 0.96 for specimens with thickness of 1.5 and 1.2 mm, respectively; which
indicates sections with thinner thickness is more likely involved with the interaction of local and
distortional buckling.
From Table 3.3, it can also be seen that the nominal strengths of the specimens with web perforations
evaluated by the DSM are in good agreement with those of the tests. The nominal strength Pn evaluated
by DSM are slightly greater than the tested ultimate strength, Ptest, except in one case. The differences
between the two are less than 9%. Thus, the DSM approach is accurate in determining the compressive
strength of CFS C-shape stub columns with non-circular web perforations, and Lh is up to 130 mm.

21
Table 3.3 Comparison of test results with DSM approach
Specimen
No.
Ag
(mm2)
Anet
(mm2)
Ptest
(kN)
Pne
(kN)
Pnl
(kN)
Pnd
(kN)
Pn
(kN) Pn/Ptest
0-1.5-1
374 317
76.0
131.40 71.52 80.64 71.52
1.06
0-1.5-2 73.0 1.02
0-1.5-3 74.0 1.03
75-1.5-1
374 317
70.0
131.34 71.50 78.80 71.50
0.98
75-1.5-2 75.0 1.05
75-1.5-3 74.0 1.03
114-1.5-1
374 317
75.0
131.26 71.47 77.60 71.47
1.05
114-1.5-2 76.0 1.06
114-1.5-3 73.0 1.02
130-1.5-1
374 317
73.0
131.23 71.46 77.10 71.46
1.02
130-1.5-2 76.0 1.06
130-1.5-3 78.0 1.09
114-1.2-1
299 254
42.0
66.48 39.43 41.09 39.43
1.07
114-1.2-2 40.0 1.01
114-1.2-3 40.0 1.01
130-1.2-1
299 254
43.0
66.46 39.43 40.87 39.43
1.09
130-1.2-2 43.0 1.09
130-1.2-3 43.0 1.09
3.3 Finite element modelling of CFS C-shape columns at ambient and uniform
elevated temperatures
Finite element analysis is performed to simulate the behaviour of CFS C-shape columns with and
without web perforations at both ambient and elevated temperatures using ABAQUS (2012). In total,
52 steady-state tests on CFS C-shape columns both at ambient and uniform elevated temperatures were
conducted by Feng, Wang, & Davies (2003d). In this current study, 11 of those 52 specimens, from the
Lipped channel 100×54×15×1.2 series (CFS C-shape sections), are used to develop and verify the finite
element model. The temperature distribution of CFS columns is considered to be uniform in the cross
section at a given temperature.
3.3.1 Stub column tests
Shown in Table 3.4 and Table 3.5 are the measured dimensions of the specimens exposed to different
uniform temperatures throughout the tests. The notations included in these two tables and the specimen
profiles are presented in Figure 3.1. The uniform temperatures range from 22 oC to 700 oC. The nominal
length of the specimens is 400 mm. The dh and Lh are 40 mm and 100 mm, respectively.
22
Table 3.4 Nominal cross-section dimensions of specimens without perforations (Feng et al., 2003d)
Temp.(oC) Specimen No. H (mm) B (mm) D (mm) t (mm) L (mm)
Amb. Lip12a1 100.05 53.64 17.09 1.23 400.2
250 Lip12b325 100.27 53.64 17.21 1.19 400
400 Lip12c140 99.31 52.31 16.25 1.18 398
550 Lip12c355 99.96 52.32 16.56 1.18 399
700 Lip12d670 100.31 52.44 15.75 1.2 402
Table 3.5 Nominal cross-section dimensions of specimens with perforations (Feng et al., 2003d)
Temp.(oC) Specimen No. H (mm) B (mm) D (mm) t (mm) L (mm)
Amb. Lip12a3 100.05 53.64 17.09 1.19 400.8
Lip12a4 100.05 53.64 17.09 1.19 400.4
400 Lp12ch140 100.76 53.23 15.64 1.24 398
Lp12ch240 99.31 52.08 16.16 1.203 398.5
550 Lp12bh155 99.43 51.92 16.15 1.188 399
Lp12bh255 99.87 51.04 16.17 1.19 399

23
Tensile coupon tests for S350GD+Z steel at ambient temperature were conducted by Feng et al.
(2003d). The material properties are shown in Table 3.6. The measured stress-strain relationship
indicates that cold-formed steel exhibits a gradual yielding behaviour followed by a considerable period
of strain hardening, which is quite different from that of hot-rolled steel. Plotted in Figure 3.5 is the
stress-strain curve at ambient temperature. The elastic stress-strain behaviour is represented by a linear
segment up to a limit stress fp = 0.7fy, where fy is the 0.2% proof stress. The slope of this linear segment
equals the measured elastic modulus. The gradual yield behaviour is idealised by using a bilinear
representation with the tangent moduli E1 and E2 between the proportional limit fp and the yield strength
fy with an intermediate point at a stress of 0.875fy. The strain-hardening behaviour is represented by a
linear segment with a tangent modulus E3. The value of E1, E2 and E3 are 80000 N/mm2, 20000 N/mm2
and 1/200E1. The stress-strain relationship at elevated temperatures is derived based on Eurocode 3
Part 1.2 (BS EN 1993-1-2, 2005) as shown in Figure 3.6.
Table 3.6 Mechanical properties at ambient temperature
Cross-section fy (N/mm2) fu (N/mm2) E (N/mm2)
100×54×15×1.2 410.58 526.02 186950
Figure 3.5 Stress-strain relationship of steel at ambient temperature
σ
fy=measured value
fp=0.7fy
Eε
0.875fy E1
E2
E3
E=measure value
E1=80000MPa
E2=20000MPa
E3=E/200
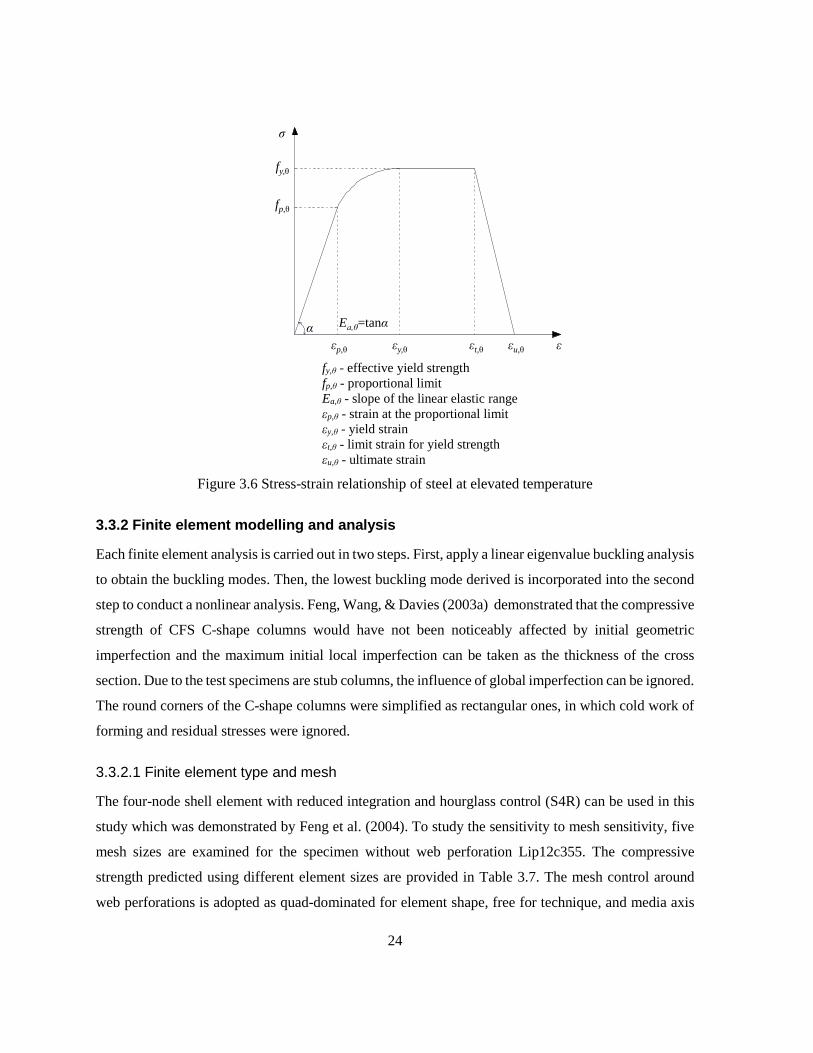
24
fy,θ - effective yield strength
fp,θ - proportional limit
Ea,θ - slope of the linear elastic range
εp,θ - strain at the proportional limit
εy,θ - yield strain
εt,θ - limit strain for yield strength
εu,θ - ultimate strain
Figure 3.6 Stress-strain relationship of steel at elevated temperature
3.3.2 Finite element modelling and analysis
Each finite element analysis is carried out in two steps. First, apply a linear eigenvalue buckling analysis
to obtain the buckling modes. Then, the lowest buckling mode derived is incorporated into the second
step to conduct a nonlinear analysis. Feng, Wang, & Davies (2003a) demonstrated that the compressive
strength of CFS C-shape columns would have not been noticeably affected by initial geometric
imperfection and the maximum initial local imperfection can be taken as the thickness of the cross
section. Due to the test specimens are stub columns, the influence of global imperfection can be ignored.
The round corners of the C-shape columns were simplified as rectangular ones, in which cold work of
forming and residual stresses were ignored.
3.3.2.1 Finite element type and mesh
The four-node shell element with reduced integration and hourglass control (S4R) can be used in this
study which was demonstrated by Feng et al. (2004). To study the sensitivity to mesh sensitivity, five
mesh sizes are examined for the specimen without web perforation Lip12c355. The compressive
strength predicted using different element sizes are provided in Table 3.7. The mesh control around
web perforations is adopted as quad-dominated for element shape, free for technique, and media axis
σ
εp,θ
fy,θ
fp,θ
α Ea,θ=tanα
εy,θ εt,θ εu,θ ε

25
for algorithm. The element size of 7.5 mm×7.5 mm (length by width) ratio (Figure 3.7(a)) provides
adequate accuracy with minimum computational time. For C-shape columns with web perforation, a
finer mesh size of 5 mm×5mm (Figure 3.7(b)) is required to guarantee the accuracy.
Table 3.7 Sensitivity study of element sizes
Lip12c355 Compressive strength Ptest=23 kN
Mesh size 2.5mm 5mm×5mm 7.5mm×7.5mm 10mm×10mm 15mm×15mm
FFEA (kN) 25.53 25.73 25.90 26.61 26.75
(FFEA-Ptest)/Ptest 0.11 0.12 0.13 0.16 0.16
3.3.2.2 Boundary conditions and displacement application
The ends of the columns were fixed against all degrees of freedom except for the axial displacement at
the loaded end (Z direction), and the displacement was applied at each node of the loaded end to
simulate the experimental boundary conditions (Figure 3.7(c)). The RIKS method is used to predict the
post-buckling behaviour.
(a) mesh (without perforation) (b) mesh (with perforation) (c) boundary conditions
Figure 3.7 FE mesh and boundary conditions for specimen 100×54×15×1.2

26
3.3.2.3 Validation of finite element model
The finite element model is validated by the experiments conducted by Feng et al. (2003d). Compared
in Figure 3.8 and Figure 3.9 are the failure modes of specimens without and with web perforation
between test and FEA results, respectively. The FEA results show that the specimens failed with a
combination of local buckling and distortional buckling, which agrees well with the tests.
Test 1 2 Test 1 2
(a) Lip12c140 at 400 oC (b) Lip12d670 at 700 oC
Figure 3.8 Failure modes of columns without perforations
Test 1 Test 1
(a) Lip12a3 at ambient temperature (b) Lip12a4 at ambient temperature
Figure 3.9 Failure modes of columns with perforations
Presented in Table 3.8 and Figure 3.10 are the comparison between test compressive strength and
FEA results. The mean values of the Ptest/PFEA ratio are 0.91 and 0.95 for CFS C-shape columns without
perforation and with perforation, and the standard deviations of the Ptest/PFEA ratio are 0.09 and 0.07,
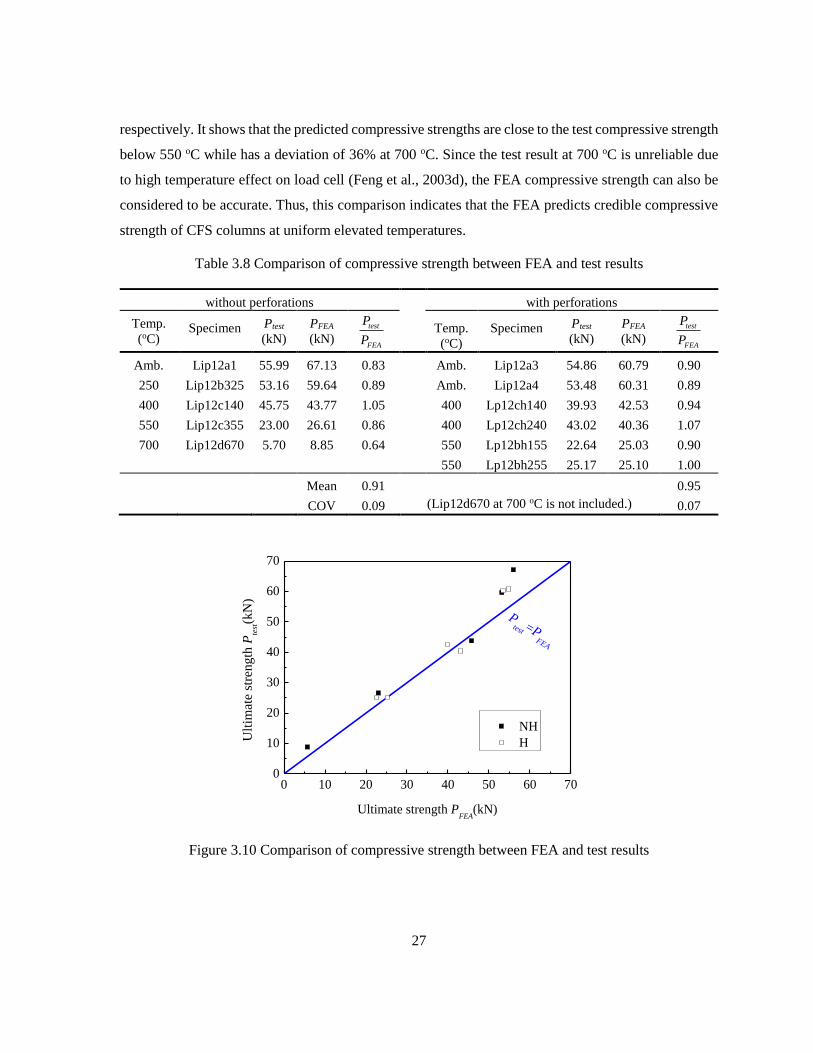
27
respectively. It shows that the predicted compressive strengths are close to the test compressive strength
below 550 oC while has a deviation of 36% at 700 oC. Since the test result at 700 oC is unreliable due
to high temperature effect on load cell (Feng et al., 2003d), the FEA compressive strength can also be
considered to be accurate. Thus, this comparison indicates that the FEA predicts credible compressive
strength of CFS columns at uniform elevated temperatures.
Table 3.8 Comparison of compressive strength between FEA and test results
without perforations with perforations
Temp.
(oC) Specimen
Ptest
(kN)
PFEA
(kN) test
FEA
P
P
Temp.
(oC)
Specimen
Ptest
(kN)
PFEA
(kN) test
FEA
P
P
Amb. Lip12a1 55.99 67.13 0.83 Amb. Lip12a3 54.86 60.79 0.90
250 Lip12b325 53.16 59.64 0.89 Amb. Lip12a4 53.48 60.31 0.89
400 Lip12c140 45.75 43.77 1.05 400 Lp12ch140 39.93 42.53 0.94
550 Lip12c355 23.00 26.61 0.86 400 Lp12ch240 43.02 40.36 1.07
700 Lip12d670 5.70 8.85 0.64 550 Lp12bh155 22.64 25.03 0.90
550 Lp12bh255 25.17 25.10 1.00
Mean 0.91 0.95
COV 0.09 (Lip12d670 at 700 oC is not included.) 0.07
0 10 20 30 40 50 60 700
10
20
30
40
50
60
70
Ult
imat
e st
ren
gth
Pte
st(k
N)
Ultimate strength PFEA
(kN)
NH
H
Ptest =P
FEA
Figure 3.10 Comparison of compressive strength between FEA and test results

28
3.4 Behaviour of web-perforated CFS wall studs subjected to non-uniform
cross-sectional elevated temperature
Presented in this section is an FEA on the effect of web perforations on the behaviour of cold-formed
steel C-shape studs subjected to non-uniform cross-sectional distribution of elevated temperature with
use of finite element analysis. The length of web perforations investigated varies from 0 mm to 630
mm (25 in.). The non-uniform cross-sectional distributions of elevated temperature obtained from finite
element thermal analysis of insulated CFS walls in standard fire for up to 105 minutes were employed.
Sequentially uncoupled thermal-stress analyses were carried out under a transient state condition.
Concentrically loaded cold-formed steel C-shape studs with load ratios of 0.6, 0.7, 0.8 and 0.9 are
investigated.
Using ABAQUS (2012), the FEA procedure commenced a thermal analysis to obtain the non-
uniform cross-sectional distributions of elevated temperature of a CFS column from a 600mm wide
CFS wall section, followed by a structural analysis to investigate the behaviour of the column at
elevated temperature. The nodal temperature at the elevated temperature obtained from the thermal
analysis were applied as a predefined boundary condition of the FE model in the structural analysis.
Illustrated in Figure 3.11 are the cross-section of the CFS wall segment modelled in FEA and the
nominal cross-sectional dimensions of the CFS C-shape column at the location of web perforation. The
modelled CFS wall segment, 600 mm in width and 3200 mm in height, consists of a CFS C-shape
column (150 mm ×40 mm×15 mm×1.5 mm) sheathed with a double layer of 12 mm thick gypsum
board on both sides. The 150 mm deep wall cavities are filled with glass fibre. Five web perforations
are evenly spaced 640 mm o.c. along the height of the column. The Lh varies from 0 mm to 630 mm,
whereas dh remains constant at 38 mm (1.5 in.). Six different Lh, i.e., 0 mm (0 in.), 130 mm (5 in.), 250
mm (10 in.), 380 mm (15 in.), 510 mm (20 in.) and 630 mm (25 in.) are investigated. The ambient
temperature is defined as 20 oC. The CFS walls are exposed to the standard fire curve defined by ISO
834 (1999) for up to 105 minutes.
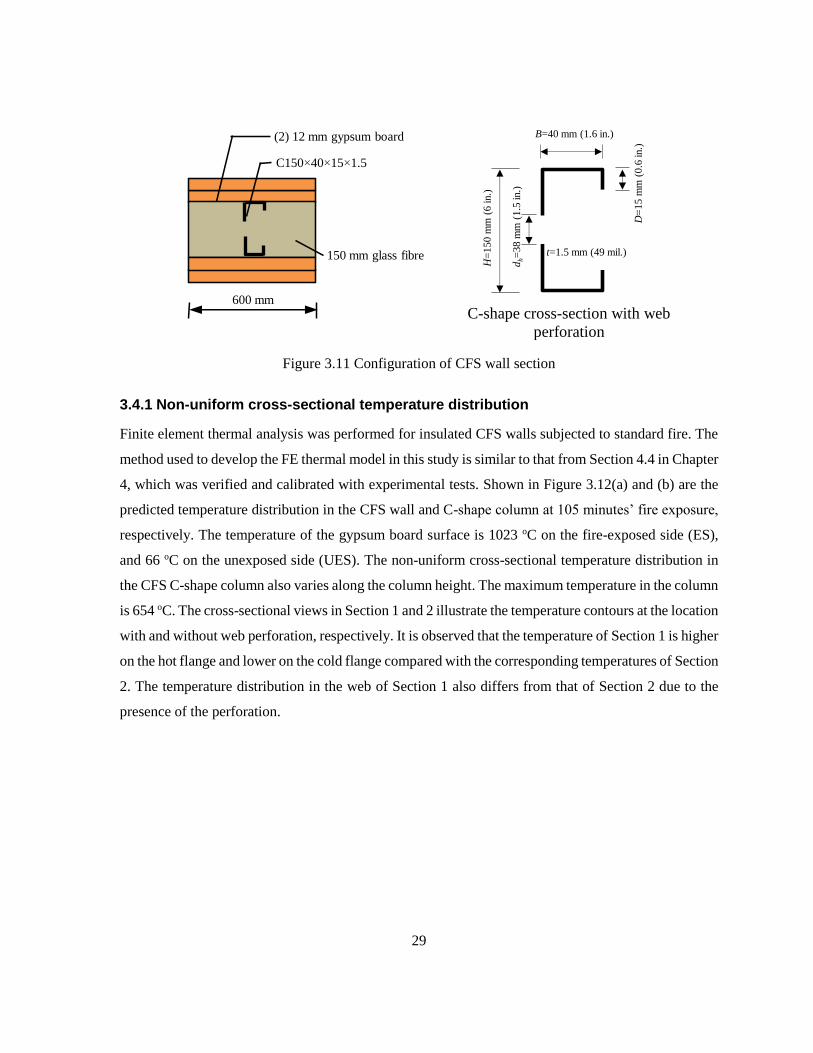
29
Figure 3.11 Configuration of CFS wall section
3.4.1 Non-uniform cross-sectional temperature distribution
Finite element thermal analysis was performed for insulated CFS walls subjected to standard fire. The
method used to develop the FE thermal model in this study is similar to that from Section 4.4 in Chapter
4, which was verified and calibrated with experimental tests. Shown in Figure 3.12(a) and (b) are the
predicted temperature distribution in the CFS wall and C-shape column at 105 minutes’ fire exposure,
respectively. The temperature of the gypsum board surface is 1023 oC on the fire-exposed side (ES),
and 66 oC on the unexposed side (UES). The non-uniform cross-sectional temperature distribution in
the CFS C-shape column also varies along the column height. The maximum temperature in the column
is 654 oC. The cross-sectional views in Section 1 and 2 illustrate the temperature contours at the location
with and without web perforation, respectively. It is observed that the temperature of Section 1 is higher
on the hot flange and lower on the cold flange compared with the corresponding temperatures of Section
2. The temperature distribution in the web of Section 1 also differs from that of Section 2 due to the
presence of the perforation.
C-shape cross-section with web
perforation
C150 40 15 1.5
600 mm
(2) 12 mm gypsum board
150 mm glass fibre
dh=
38 m
m (
1.5
in.)
H=
15
0 m
m (
6 in.)
B=40 mm (1.6 in.)
D=
15
mm
(0
.6 in.)
t=1.5 mm (49 mil.)

30
(a) CFS wall
(b) C-shape column
Figure 3.12 Temperature contour (Lh =380 mm): (a) CFS wall and (b) C-shape column
Section 2 Section 1
31
3.4.2 Finite element structural analysis
The FE structural analysis was performed under a transient state condition in two steps. First, a pre-
determined axial compression load was applied as Step 1. After that, the temperature distributions
obtained from the heat transfer analysis were incorporated in the analysis as Step-2.
In the structural analysis, the CFS C-shape column is modeled with a rigid plate (150 mm×40 mm)
attached to each end as shown in Figure 3.14. The reference point of the rigid plate coincides with the
centroid of the cross section of the column. The element type and mesh of the CFS C-shape column are
the same as those of the heat transfer model, for which correlations are required to import the
temperature from the heat transfer analysis. A global mesh size of 15 mm is used to discretize the rigid
plate. The time period of Step 2 is specified as 6300, which corresponds to 105 minutes. In the Step 2,
the maximum number of time increments is 500; the initial increment size is 30; and the minimum and
maximum increment sizes are 1×10⁻⁹ and 300, respectively. The CFS column and rigid plate are
modeled with a 4-node shell element with reduced integration (S4R) and rigid bilinear quadrilateral
elements (R3D4), respectively.
When it is exposed to elevated temperature, the mechanical properties of steel deteriorate rapidly,
consequently reducing the stiffness and strength of CFS columns. The yield strength, elastic modulus
and Poisson’s ratio of steel at ambient temperature are taken as 345 MPa, 203 GPa and 0.3, respectively.
Presented in Figure 3.13 is the nominal stress-strain relationship of cold-formed steel at elevated
temperatures, which is derived base on EC 3 Part 1.2 (2005). Steel expands considerably when exposed
to elevated temperature. Therefore, thermal bowing will be developed due to the presence of non-
uniform temperature distributions across the cross section. Hence, the thermal expansion coefficient,
αT, of CFS at different temperatures needs to be determined for the structural analysis of CFS wall
systems at elevated temperature. In this study, αT of CFS stipulated in Eurocode 3 Part 1.2 (2005) is
adopted, and is the same as that of hot-rolled steel.
Illustrated in Figure 3.14 is the load and boundary condition of the modelled CFS column. The
column is simply supported by translational displacements; i.e., UX, UY and UZ at the lower end and
UX and UY at the upper end are restrained. Twisting about the Z axis (URZ) is restrained at both ends.
A target axial load is applied first via the reference node of the rigid plate at the upper end. The load
ratio (R), i.e., the ratio of the applied load at the fire limit state and the ultimate compressive strength
of the CFS column at ambient temperature, ranges from 0.6 to 0.9. Shown in Table 3.9 is the applied

32
axial load of CFS C-shape studs in the FE structural model. At ambient temperature, the ultimate
compressive strength drops gradually as the perforation length increases. For example, with length of
wen perforation Lh=630 mm, the ultimate strength of the CFS C-shape column is only about 60% that
of a column without perforations. Initial global geometrical imperfection is accounted for through
eigenvalue buckling analysis. The first mode shape and a magnitude of one thousandth of the column
length (L/1000) is adopted (Figure 3.15). The time dependent nodal temperature obtained from the
thermal analysis (Figure 3.12(b)) are incorporated into the structural model as a predefined boundary
condition. The ambient temperature is assumed to be 20 oC.
Figure 3.13 Stress-strain relationship of cold-formed steel at elevated temperature
Table 3.9 Applied load at ambient temperature (Step-1)
Lh (mm) Applied load (kN)
R=0.9 R=0.8 R=0.7 R=0.6 R=0.5
0 14.8 13.2 11.5 9.9 8.2
130 13.3 11.8 10.3 8.9 7.4
250 12.4 11.1 9.7 8.3 6.9
380 12.1 10.7 9.4 8.0 6.7
510 11.2 10.0 8.7 7.5 6.2
630 9.0 8.0 7.0 6.0 5.0
0.000 0.005 0.010 0.015 0.020 0.0250
50
100
150
200
250
300
350
400
No
min
al s
tres
s (N
/mm
2)
Nominal strain
20 oC
100 oC
200 oC
300 oC
400 oC
500 oC
600 oC
700 oC
800 oC
900 oC
1000 oC
1100 oC
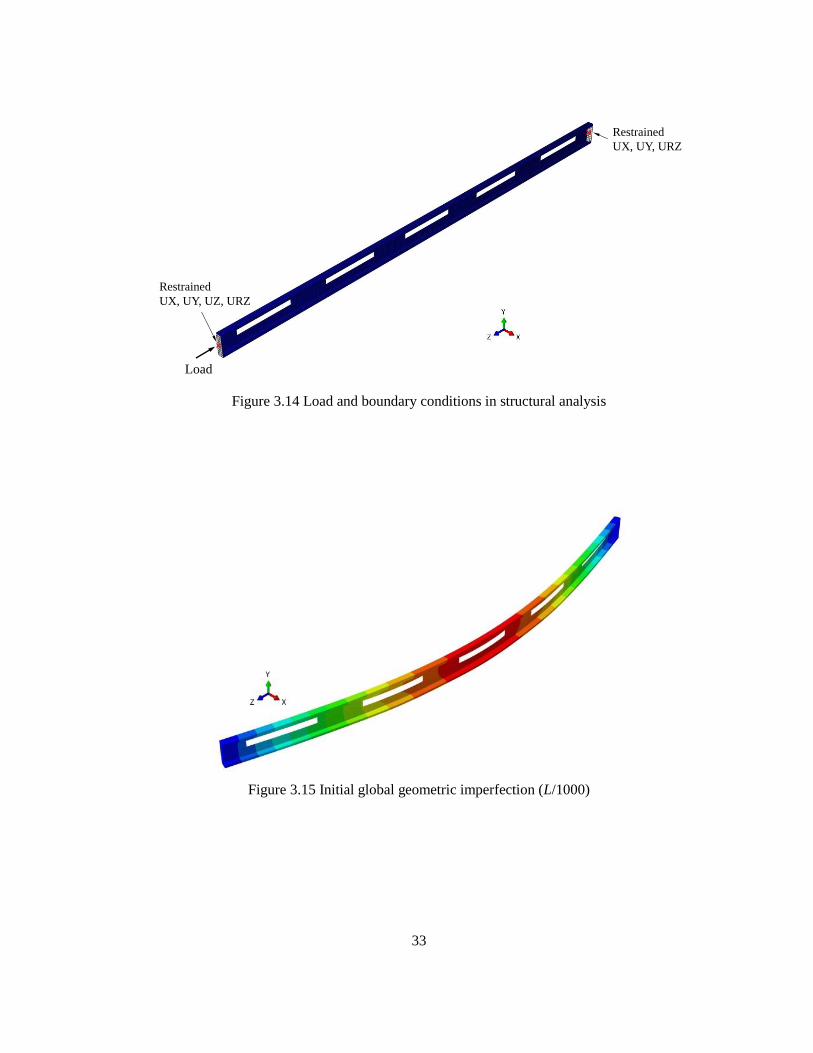
33
Figure 3.14 Load and boundary conditions in structural analysis
Figure 3.15 Initial global geometric imperfection (L/1000)
Load
Restrained
UX, UY, UZ, URZ
Restrained
UX, UY, URZ
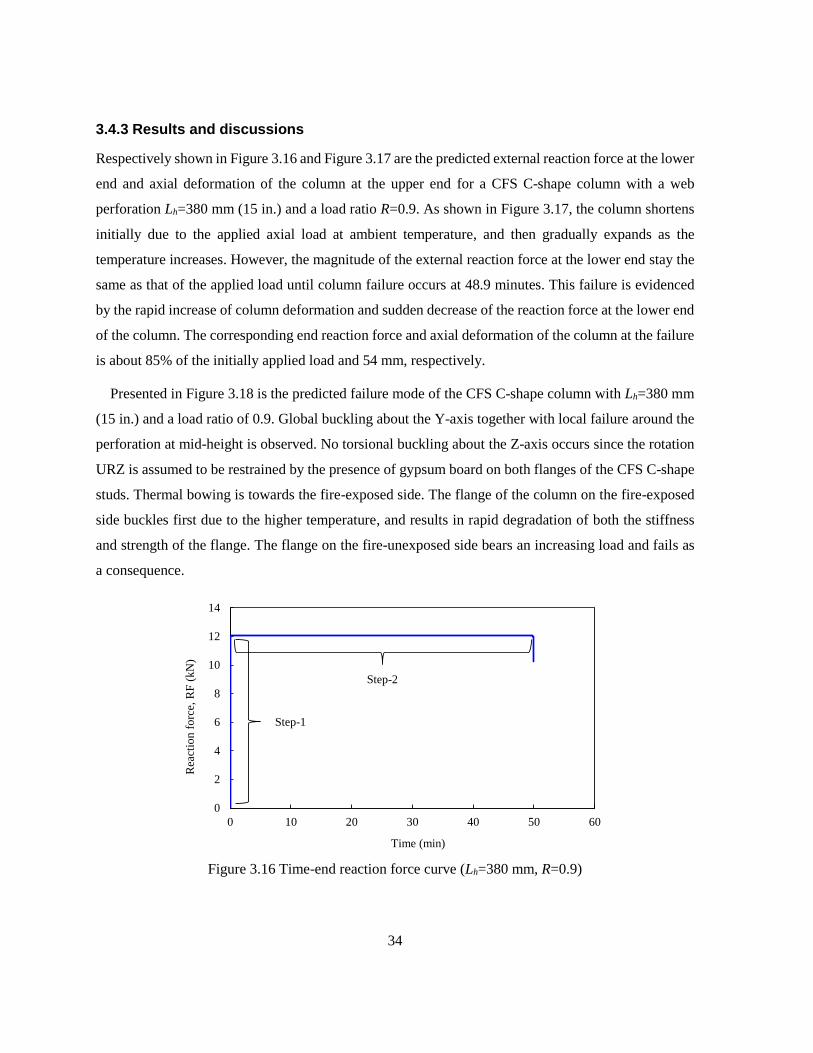
34
3.4.3 Results and discussions
Respectively shown in Figure 3.16 and Figure 3.17 are the predicted external reaction force at the lower
end and axial deformation of the column at the upper end for a CFS C-shape column with a web
perforation Lh=380 mm (15 in.) and a load ratio R=0.9. As shown in Figure 3.17, the column shortens
initially due to the applied axial load at ambient temperature, and then gradually expands as the
temperature increases. However, the magnitude of the external reaction force at the lower end stay the
same as that of the applied load until column failure occurs at 48.9 minutes. This failure is evidenced
by the rapid increase of column deformation and sudden decrease of the reaction force at the lower end
of the column. The corresponding end reaction force and axial deformation of the column at the failure
is about 85% of the initially applied load and 54 mm, respectively.
Presented in Figure 3.18 is the predicted failure mode of the CFS C-shape column with Lh=380 mm
(15 in.) and a load ratio of 0.9. Global buckling about the Y-axis together with local failure around the
perforation at mid-height is observed. No torsional buckling about the Z-axis occurs since the rotation
URZ is assumed to be restrained by the presence of gypsum board on both flanges of the CFS C-shape
studs. Thermal bowing is towards the fire-exposed side. The flange of the column on the fire-exposed
side buckles first due to the higher temperature, and results in rapid degradation of both the stiffness
and strength of the flange. The flange on the fire-unexposed side bears an increasing load and fails as
a consequence.
Figure 3.16 Time-end reaction force curve (Lh=380 mm, R=0.9)
0
2
4
6
8
10
12
14
0 10 20 30 40 50 60
Rea
ctio
n f
orc
e, R
F (
kN
)
Time (min)
Step-1
Step-2
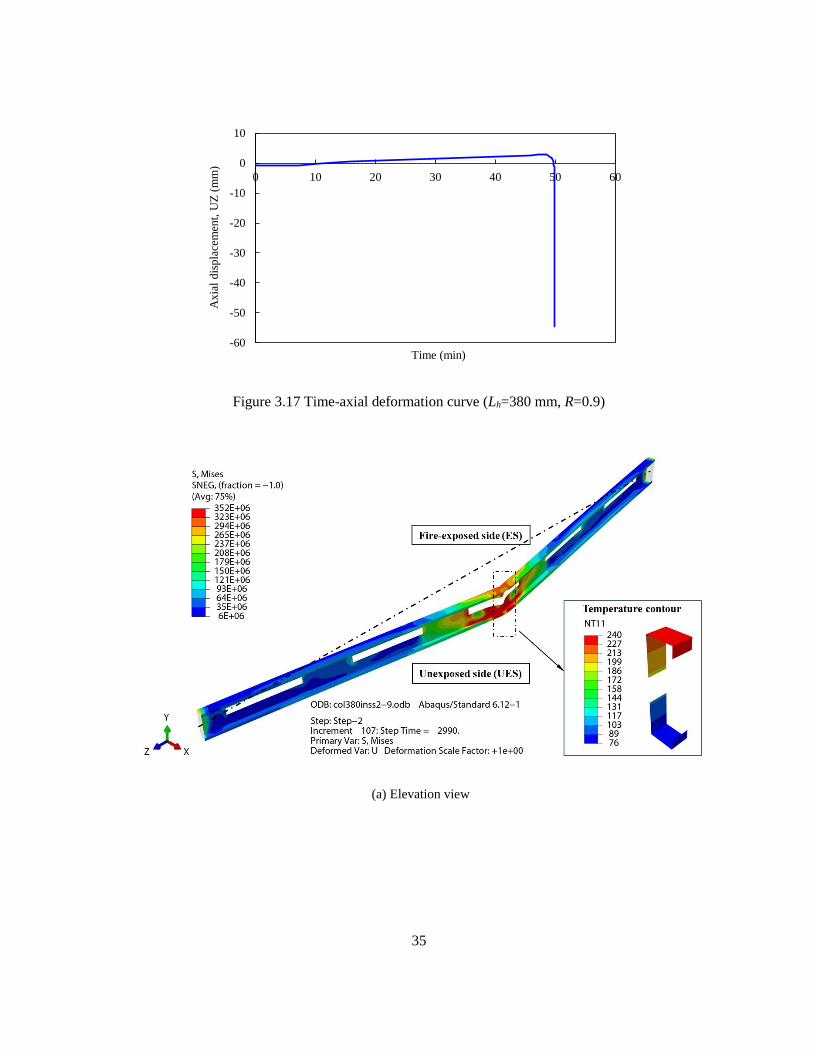
35
Figure 3.17 Time-axial deformation curve (Lh=380 mm, R=0.9)
(a) Elevation view
-60
-50
-40
-30
-20
-10
0
10
0 10 20 30 40 50 60
Axia
l d
isp
lace
men
t, U
Z (
mm
)
Time (min)
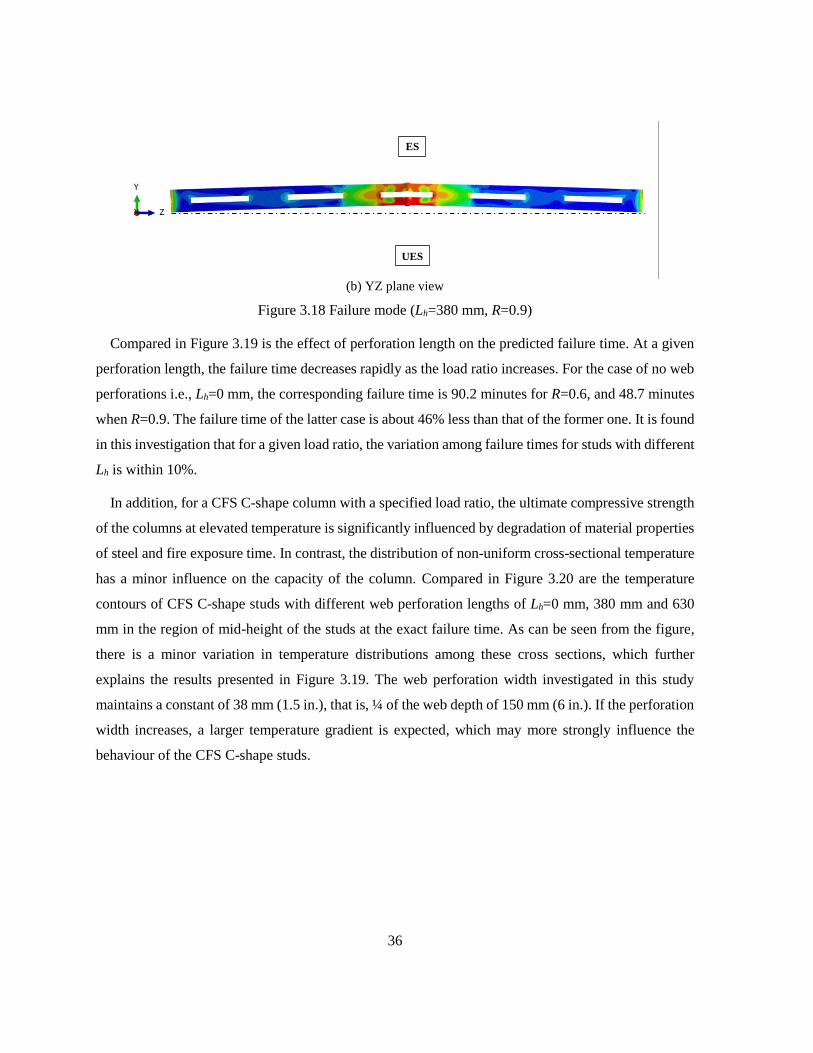
36
(b) YZ plane view
Figure 3.18 Failure mode (Lh=380 mm, R=0.9)
Compared in Figure 3.19 is the effect of perforation length on the predicted failure time. At a given
perforation length, the failure time decreases rapidly as the load ratio increases. For the case of no web
perforations i.e., Lh=0 mm, the corresponding failure time is 90.2 minutes for R=0.6, and 48.7 minutes
when R=0.9. The failure time of the latter case is about 46% less than that of the former one. It is found
in this investigation that for a given load ratio, the variation among failure times for studs with different
Lh is within 10%.
In addition, for a CFS C-shape column with a specified load ratio, the ultimate compressive strength
of the columns at elevated temperature is significantly influenced by degradation of material properties
of steel and fire exposure time. In contrast, the distribution of non-uniform cross-sectional temperature
has a minor influence on the capacity of the column. Compared in Figure 3.20 are the temperature
contours of CFS C-shape studs with different web perforation lengths of Lh=0 mm, 380 mm and 630
mm in the region of mid-height of the studs at the exact failure time. As can be seen from the figure,
there is a minor variation in temperature distributions among these cross sections, which further
explains the results presented in Figure 3.19. The web perforation width investigated in this study
maintains a constant of 38 mm (1.5 in.), that is, ¼ of the web depth of 150 mm (6 in.). If the perforation
width increases, a larger temperature gradient is expected, which may more strongly influence the
behaviour of the CFS C-shape studs.
ES
UES
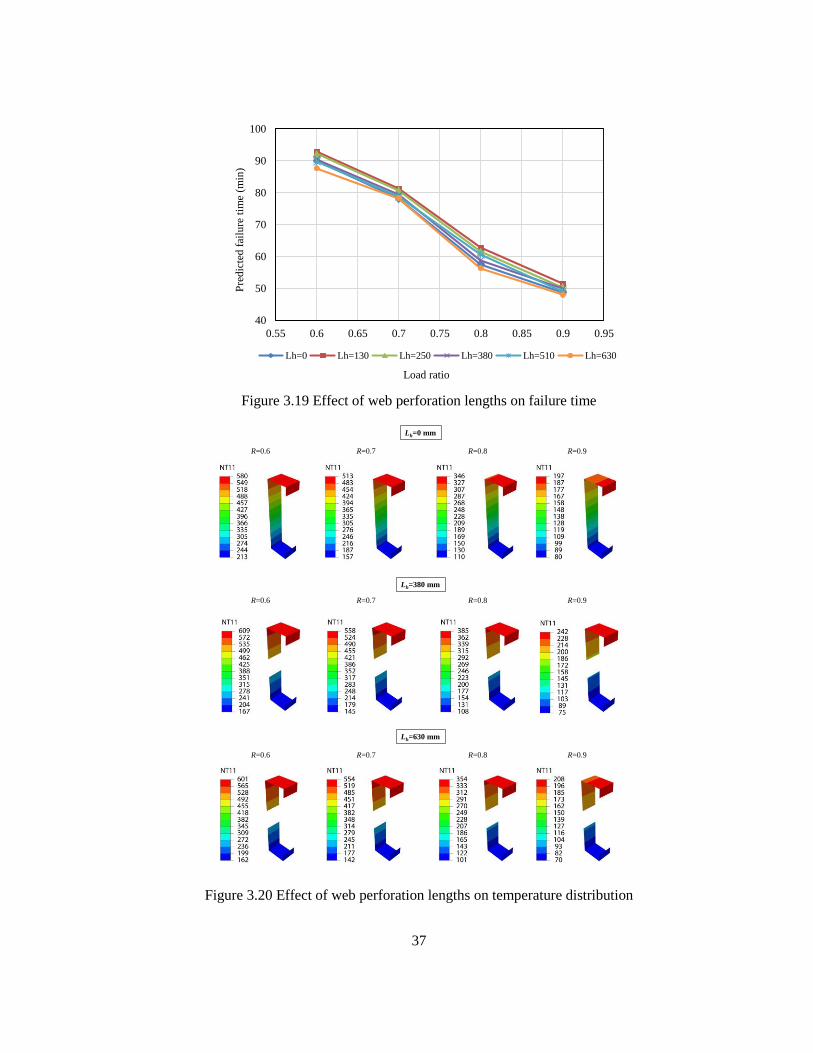
37
Figure 3.19 Effect of web perforation lengths on failure time
Figure 3.20 Effect of web perforation lengths on temperature distribution
40
50
60
70
80
90
100
0.55 0.6 0.65 0.7 0.75 0.8 0.85 0.9 0.95
Lh=0 Lh=130 Lh=250 Lh=380 Lh=510 Lh=630
Load ratio
Pre
dic
ted
fail
ure
tim
e (m
in)
Lh=380 mm
Lh=0 mm
Lh=630 mm
R=0.9R=0.8R=0.7R=0.6
R=0.9R=0.8R=0.7R=0.6
R=0.9R=0.8R=0.7R=0.6

38
3.5 Conclusions
In this chapter, the behaviour of CFS C-shape stub columns at both ambient and uniform elevated
temperatures are investigated. Based on the heat transfer analysis in Chapter 4, the structural analysis
of CFS C-shape wall studs subjected to non-uniform cross-sectional distributions of elevated
temperature is also carried out. The following conclusions can be drawn:
Stub column tests (Xu, 2014) found that the length of web perforations has slight effect on the
ultimate compressive strength of CFS C-shape stub columns at ambient temperature. In this study,
the comparison of the ultimate strength obtained from the tests and predicted by the DSM
approach demonstrates that the DSM approach accurately assesses the compressive strength of
C-shape CFS stub columns with web perforations.
Finite element structural model is developed using ABAQUS to investigate the behaviour of CFS
C-shape columns at ambient temperature and uniform cross-sectional distribution of elevated
temperature ranging from 22 oC to 700 oC. The accuracy of this model is validated based on the
stub column tests with web perforations (Feng et al., 2003d).
The effects of web perforations on the behaviour of CFS C-shape slender columns subjected to
non-uniform cross-sectional distribution of elevated temperatures are also investigated. The FEA
results demonstrate that the web perforation can affect the temperature distribution in the stud
cross sections, but the temperature gradient within a cross section is hardly associated with the
web perforation length. The differences in failure times among the CFS C-shape studs with
different web perforation lengths at a given load ratio are within 10%.
39
Chapter 4 Thermal Modelling and Analysis of CFS Walls with Web-
Perforated Studs Subjected to Standard Fire
4.1 Introduction
As growing interest in performance-based fire safety design, engineering professionals and researchers
are increasingly exploring verified fire resistance models. The temperature distributions in CFS walls
under fire have been investigated numerically using 1D and 2D models by other researchers. Several
1D numerical models were proposed to estimate the temperature history through the cross sections of
non-insulated CFS walls (Chen, Ye, Bai, & Zhao, 2013; Collier, 1996; Sultan, 1996) and insulated CFS
walls (Shahbazian & Wang, 2013; Shahbazian & Wang, 2014; Sultan, Alfawakhiri, & Benichou, 2001).
The thermal gradients along the length and width of the CFS walls were ignored. The quantity of heat
transfer via conduction or radiation by the CFS steel frame was neglected, except in Shahbazian and
Wang’s model (Shahbazian & Wang, 2013; Shahbazian & Wang, 2014; Sultan et al., 2001). Moreover,
2D finite element (FE) thermal modelling was established for CFS walls, in which uniform temperature
distribution along the stud length was assumed (Feng, Wang, & Davies, 2003b; Gunawan, 2011;
Keerthan & Mahendran, 2012; Keerthan & Mahendran, 2013; Shahbazian & Wang, 2013). To develop
manual-based methods for evaluating the ultimate strength of CFS wall studs under fire, simplified
non-uniform temperature distributions through stud cross sections, as shown in Figure 4.1, were
adopted (Feng et al., 2003c; Gunalan & Mahendran, 2013; Shahbazian & Wang, 2011). For example,
it is found that it is acceptable to assume that the temperature varies linearly throughout the web while
remaining constant in the flanges and lips (Shahbazian & Wang, 2011). However, neither 1D nor 2D
models can be used to investigate the effect of web perforation of CFS stud on temperature distributions
in the wall assemblies.
Presented in this chapter are the FE thermal analyses to trace the heat transfer process of CFS wall
systems under standard fire conditions. The FE models were developed for both the CFS walls with or
without cavity insulation. These models were first validated by the standard fire resistance tests of CFS
wall systems conducted at the Queensland University of Technology (Kolarkar, 2010), and then a
parametric study was carried out to investigate the effects of stud perforations on the thermal
performance of CFS wall systems.

40
(a) simplification 1 (b) simplification 2 (c) simplification 3
Figure 4.1 Temperature simplifications in CFS wall stud without web perforations
4.2 Thermal modelling
4.2.1 Full-scale fire tests
Shown in Table 4.1 are information of two fire tests conducted by Kolarkar (2010), representing non-
insulated and insulated CFS walls, which were designated as test specimen 3 and 4, respectively. The
test specimens were lined with double layers of 16 mm thick Type X gypsum board. The CFS frames,
with overall dimensions of 2400 mm by 2400 mm, were not laterally braced with either cross bracing
or horizontal bridging. The CFS studs and tracks were fabricated from G500 galvanized steel sheets
with a nominal base metal thickness of 1.15 mm. The C-shape section steel studs (90 mm×40 mm×15
mm) were evenly spaced 600 mm o.c.. Shown in Figure 4.2 is the experimental set-up of the fire tests.
The test specimens were not restrained at their perimeters. A constant axial compression load of 15
kN/stud was first applied and maintained throughout the test based on a load ratio of 0.2, that is, 0.2
times the unfactored ultimate compressive capacity of each steel stud at ambient temperature. A custom
designed gas furnace was then used to expose one side of the wall to the standard temperature-time fire
curve AS 1530.4 (Australian Standard, 2005). K type thermocouple wires were installed to measure the
temperature history during testing. The tests were stopped when one or more of the steel studs could
no longer sustain the applied load. The specimen 3 and 4 failed after 111 and 101 minutes’ fire
exposure, respectively, due to structural instability. Further details of the fire tests can be found in
(Kolarkar, 2010).

41
Table 4.1 Full-scale fire tests (Kolarkar, 2010)
Test Specimen Configuration Insulation Failure time Failure mode
3
None 111 min.
Structural failure
4
Glass Fibre 101 min.
Figure 4.2 Experimental set-up (Kolarkar, 2010)
In this study, as shown in Figure 4.3, 600 mm wide CFS wall sections of the specimen 3 and 4 were
modeled to validate proposed 3D finite element analyses (FEAs). Such modelling was viable for two
reasons. First, the heat transfer from the fire to the exposed surface at any point was assumed to be
uniform, since minor temperature variation associated with the ventilation and heat sink characteristics
of the furnace were negligible; second, the heat transfer is extensive between the steel flanges and the
adjacent materials within the equivalent wall width, We, which can be expressed as
45 0.85 ( )e fW b mm (4.1)
where bf is the width of the stud flange. The equivalent wall width is largely affected by the flange

42
width and no greater than 300 mm based on (Shahbazian & Wang, 2013). Outside the equivalent wall
width, the temperature distribution within CFS walls becomes uniform.
Figure 4.3 Equivalent wall width for determining temperature distribution
4.2.2 Assumptions
In this study, similar to that of the other researchers (Feng et al., 2003b; Gunawan, 2011; Keerthan &
Mahendran, 2012; Keerthan & Mahendran, 2013; Shahbazian & Wang, 2013), no thermal contact
resistance between adjacent elements was assumed. In addition, the effects of ablation, shrinkage and
cracking of gypsum board were taken into account through the modification of thermal properties of
materials as shown in Table 4.2 (Gunawan, 2011). The heat loss to the cavity was neglected. Moisture
migration across the cavity and gypsum boards, which is highly dependent on the moisture content of
the gypsum board, was neglected due to its complexity. However, moisture migration through the
gypsum boards was considered by the specific heat of the material. The gypsum boards on both fire-
exposed and unexposed sides remained in place until failure during the fire tests (Kolarkar, 2010). Thus,
the gypsum board fall-off was not included in the models. The foregoing assumptions yield smaller
temperature gradient within CFS walls than that in the fire tests.
4.2.3 Finite element type and mesh
When modelling the wall assembly with software ABAQUS, the gypsum boards and insulation were
modeled using 8-node continuum solid elements (DC3D8). The steel studs were simulated with 4-node
shell elements (DS4). The geometry of 16 mm thick gypsum board, 90 mm thick Type X insulation,
and CFS stud (90 mm×40 mm×15 mm) were defined by creating parts in the software. The part instance
(a usage of a part within the assembly) of gypsum board was patterned four times to simulate the four
layers of gypsum boards. All the part instances (gypsum boards, insulation, CFS studs) were positioned
accurately to model the CFS wall. The part instances for double layers of gypsum boards on both sides
We
600 mm
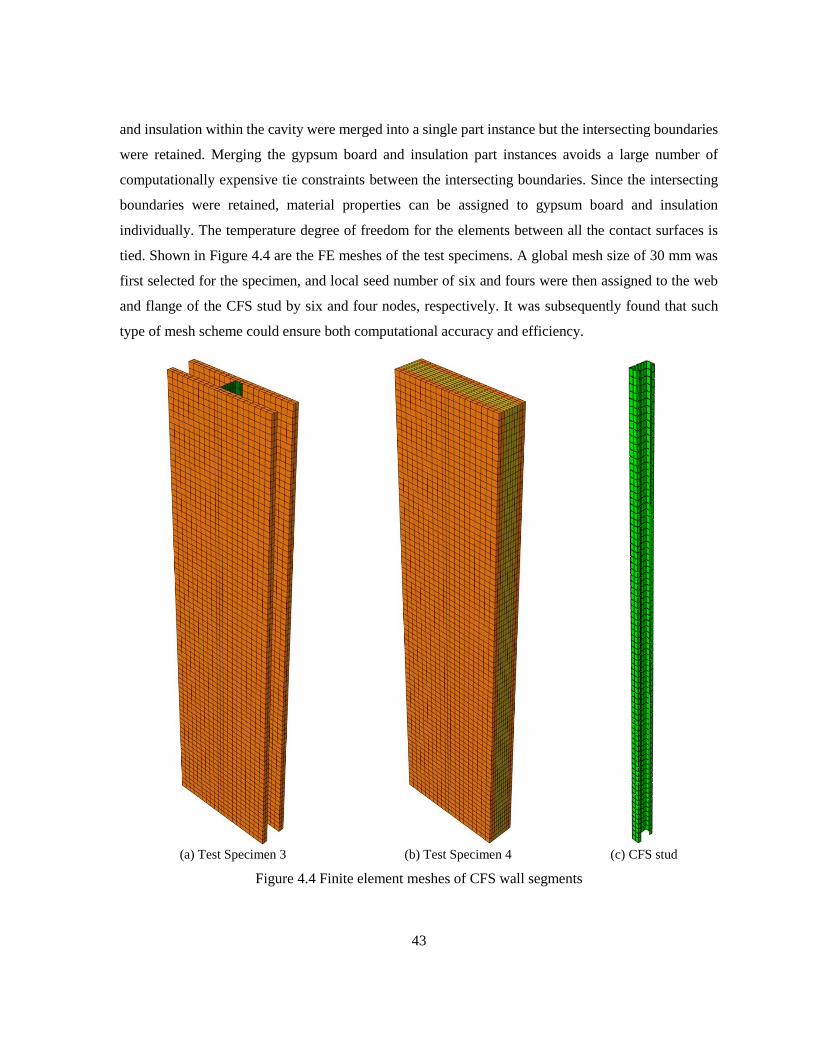
43
and insulation within the cavity were merged into a single part instance but the intersecting boundaries
were retained. Merging the gypsum board and insulation part instances avoids a large number of
computationally expensive tie constraints between the intersecting boundaries. Since the intersecting
boundaries were retained, material properties can be assigned to gypsum board and insulation
individually. The temperature degree of freedom for the elements between all the contact surfaces is
tied. Shown in Figure 4.4 are the FE meshes of the test specimens. A global mesh size of 30 mm was
first selected for the specimen, and local seed number of six and fours were then assigned to the web
and flange of the CFS stud by six and four nodes, respectively. It was subsequently found that such
type of mesh scheme could ensure both computational accuracy and efficiency.
(a) Test Specimen 3 (b) Test Specimen 4 (c) CFS stud
Figure 4.4 Finite element meshes of CFS wall segments
44
4.2.4 Thermal boundary conditions
Heat is transferred via conduction, convection and radiation between physical systems. Shown in Figure
4.5 are the heat transfer mechanisms from the fire side to the ambient side through the CFS wall
systems, where Gb denotes the gypsum board. For instance, the heat transfer modes for Test Specimen
3 shown in Figure 4.5 (a) can be illustrated as follows:
• heat transfer from the fire to the exposed surface by radiation and convection;
• heat transfer through the gypsum boards on the exposed side by conduction;
• heat transfer from exposed side gypsum board surface to the wall cavity by radiation and
convection;
• heat transfer through the steel studs within the wall cavity by conduction;
• heat transfer from the wall cavity to the unexposed side gypsum surface by radiation and
convection;
• heat transfer through the gypsum boards on the unexposed side by conduction;
• heat transfer from the unexposed surface to ambient by radiation and convection.
The heat flux at the boundary on the fire-exposed and unexposed sides is represented by:
4 4
0 0z zq h
(4.2)
where q is the heat flux to the unit surface area (W/m2), σ is the Stefan-Boltzmann constant (5.67×10-
8 W/m2/K4), and ε is the relative emissivity, which is the relative ability of its surface to gain from or
lose energy by radiation. In general, it depends on the emissivity of the combustion gas and the wall
surface. Both the exposed and unexposed surfaces were regarded as a gray body and ε =0.9. θ is the
measured temperaure at the point on the surface, θz is the absolute zero temperature (273.16 K) and θ0
is a reference sink temperature. θ0 was taken as the gas temperature according to the standard cellulosic
curve on the exposed side and 20 °C on the ambient side. h is the convective heat transfer coefficient
(W/m2K), and 25 W/m2K and 10 W/m2K were adopted on the fire-exposed side and the unexposed side
respectivley.
The existence of cavities induced a complex problem of cavity radiation. In the cavity, the conduction
in the steel studs was taken into account; for simplicity, the radiation was considered and the grey body

45
radiation was assumed in the cavity, while the convection within the gypsum boards was neglected
(Mecozzi & Zhao, 2005). The emissivity was taken as 0.9 for gypsum board and 0.6 for steel studs on
the wall cavity surfaces (Gunawan, 2011).
(a) Test specimen 3 (non cavity insulation)
(b) Test specimen 4 (glass fibre as cavity insulation)
Figure 4.5 Heat transfer mechanism in CFS walls

46
4.2.5 Thermal properties
Thermal properties govern heat transfer and thermal deformations. The latter is ignored in the
uncoupled thermal analysis. The measured thermal properties reported by (Kolarkar, 2010) were used
in the FEAs, as shown in Table 4.2 and from Figure 4.6 to Figure 4.8. The parameters, including thermal
conductivity k, specific heat Cp, and density D, vary as functions of temperature T are defined.
Table 4.2 Thermal properties (Gunawan, 2011)
Material T (°C) Cp (J/kg/oC) T (°C) k (W/m/K) T (°C) D (kg/m3)
Gypsum
board
0-20 950 0-140 0.25 0-120 729
20-100 950 140-150 1.93-0.012T 120-170 904-1.458T
100-140 413.75T-40425 150-300 0.13 170-1500 656
140-156 -312.5T+61250 300-800 0.1+0.0001T
156-170 35.714T+6928.6
170-200 -401.67T+81283
200-660 950
660-670 205T-134350
670-680 -205T+140350
≥680 950
Steel
20-600 425+7.73×10⁻¹T-1.69
×10-3T2+2.22×10⁻⁶T3 20-800 54-3.33×10⁻²T 0-1200 7850
600-735 666+13002/(738-T) 800-1200 27.3
735-900 545+17820/(T-731)
900-1200 650
Glass
fibre 0-800 1200
0-600 0.5+0.0002T
0-800 15.42 600-700 -7.8+0.014T
700-800 99.98T-69984
0 200 400 600 800 1000 12000
4000
8000
12000
16000
20000
Sp
ecif
ic h
eat
(J/k
g/o
C)
Temperature (oC)
(a) Specific heat of gypsum boards
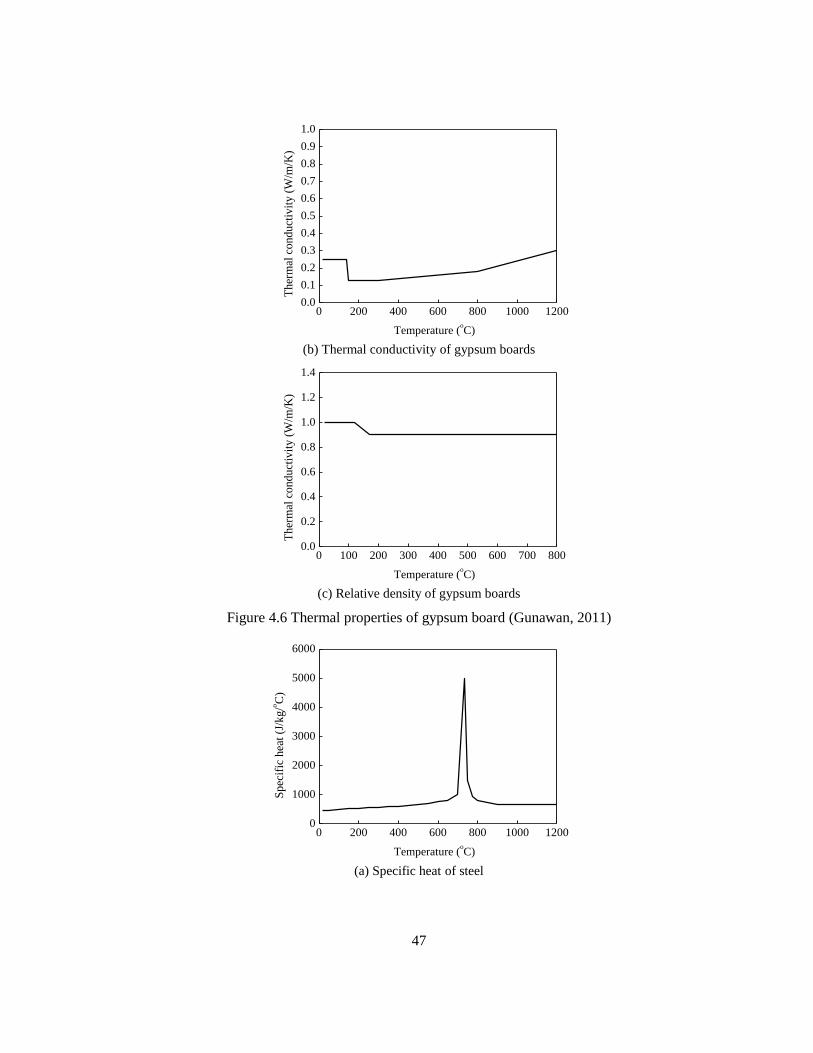
47
0 200 400 600 800 1000 12000.0
0.1
0.2
0.3
0.4
0.5
0.6
0.7
0.8
0.9
1.0
Th
erm
al c
on
du
ctiv
ity
(W
/m/K
)
Temperature (oC)
(b) Thermal conductivity of gypsum boards
0 100 200 300 400 500 600 700 8000.0
0.2
0.4
0.6
0.8
1.0
1.2
1.4
Ther
mal
conduct
ivit
y (
W/m
/K)
Temperature (oC)
(c) Relative density of gypsum boards
Figure 4.6 Thermal properties of gypsum board (Gunawan, 2011)
0 200 400 600 800 1000 12000
1000
2000
3000
4000
5000
6000
Sp
ecif
ic h
eat
(J/k
g/o
C)
Temperature (oC)
(a) Specific heat of steel

48
0 200 400 600 800 1000 12000
10
20
30
40
50
60
Ther
mal
conduct
ivit
y (
W/m
/K)
Temperature (oC)
(b) Thermal conductivity of cold-formed steel
Figure 4.7 Thermal properties of cold-formed steel (Gunawan, 2011)
0 200 400 600 8000.0
0.5
1.0
1.5
2.0
2.5
3.0
3.5
4.0
Th
erm
al c
on
du
ctiv
ity
(W
/m/K
)
Temperature (oC)
Figure 4.8 Thermal conductivity of glass fibre (Gunawan, 2011)
4.3 Comparison with test results
The measured time-temperature profiles from the tests are used for validation of the proposed 3D FE
modelling. Compared in Figure 4.9 are the time-temperature profiles of the gypsum boards at different
surfaces obtained from the FEAs in this study with those reported by (Kolarkar, 2010). The symbols
ES, Gb1, Gb2, Gb3, Gb4 and UES are defined in Figure 4.5.

49
4.3.1.1 Test specimen 3
As shown in Figure 4.9(a), the time-temperature profiles obtained from the FEA and the fire test
followed the same general trends on each surface. Both the temperature profiles for the interface Gb1
and Gb2 showed three phases. Initially, the temperature at the interface rose rapidly from the ambient
temperature to approximately 100 oC within 10 minutes of starting the test. After that, the interface
temperature increased gradually, and the heat in this phase was primarily consumed in the physical and
chemical process of the gypsum board, that is, the process of free water evaporation and chemically
bound water release. In the final phase, the temperature abruptly rose first and then increased slowly
until the end of the test. The temperature profiles for the interfaces at the cavity surfaces Gb2-Cav and
Cav-Gb3 from FEA coincided well but were slightly larger than those from the test results, which was
probably resulted from that the radiation could not be simulated accurately in FEAs. The temperature
profiles for interfaces Gb3-Gb4 and Gb4-UES obtained from FEAs and the tests were in good
agreement which almost overlapped.
4.3.1.2 Test specimen 4
As shown in Figure 4.9(b), the temperature profiles of the FEA and the fire test for each interface also
matched well, except for the interface Cav-Gb3. The temperature profile of the interface Cav-Gb3
obtained from FEA was considerably lower than that measured from the test. This might be resulted
from that the glass fibre had gradually melted and the insulation in the cavity almost burnt out on the
exposed surface in the test. The melting and burning of the insulation eventually resulted in the heat
transferring faster across the cavity. Unfortunately, the melting and burning process of glass fibre could
not be accounted for in the FEAs.
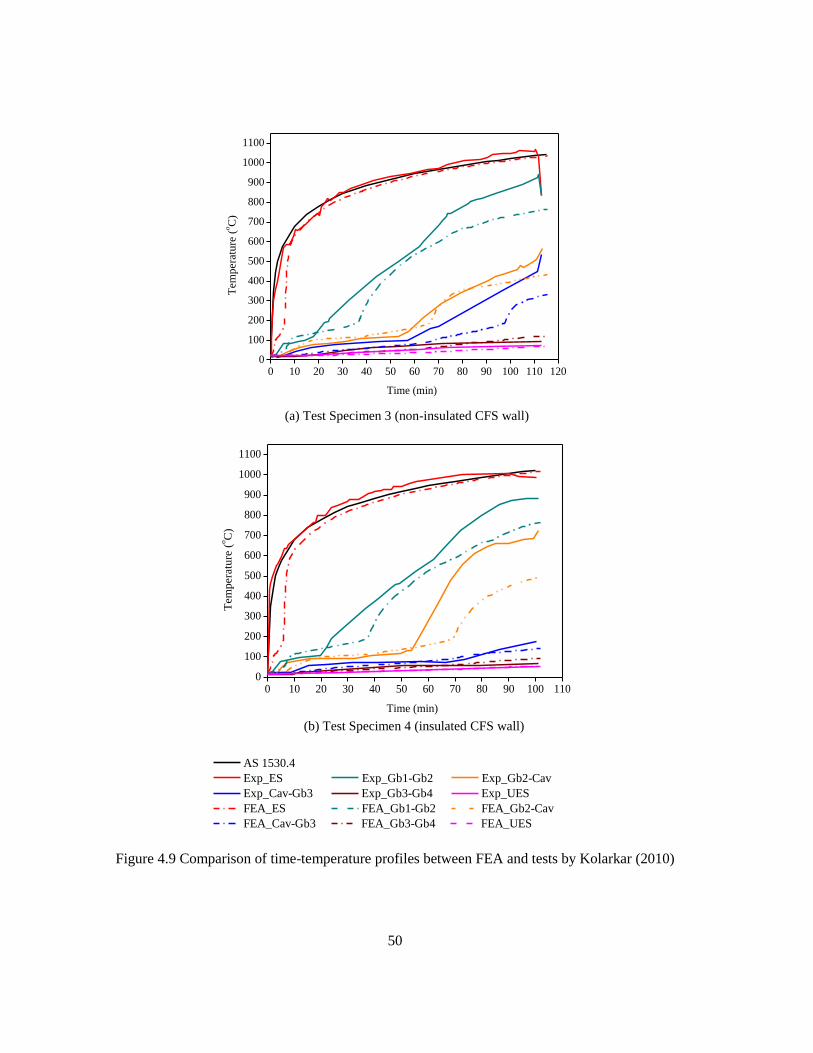
50
0 10 20 30 40 50 60 70 80 90 100 110 1200
100
200
300
400
500
600
700
800
900
1000
1100
Tem
pera
ture
(oC
)
Time (min)
(a) Test Specimen 3 (non-insulated CFS wall)
0 10 20 30 40 50 60 70 80 90 100 1100
100
200
300
400
500
600
700
800
900
1000
1100
Tem
pera
ture
(oC
)
Time (min)
(b) Test Specimen 4 (insulated CFS wall)
Figure 4.9 Comparison of time-temperature profiles between FEA and tests by Kolarkar (2010)
a
0 10 20 30 40 50 60 70 80 90 1001101200
100
200
300
400
500
600
700
800
900
1000
1100
Tem
per
atu
re (
oC
)
Time (min)
b
0 10 20 30 40 50 60 70 80 90 100 1100
100
200
300
400
500
600
700
800
900
1000
1100
Tem
per
atu
re (
oC
)
Time (min)
0 10 20 30 40 50 60 70 80 90 100 110 120 1300
100
200
300
400
500
600
700
800
900
1000
1100
Tem
per
atu
re (
oC
)
Time (min)
AS 1530.4
Exp_ES Exp_Gb1-Gb2 Exp_Gb2-Cav
Exp_Cav-Gb3 Exp_Gb3-Gb4 Exp_UES
FEA_ES FEA_Gb1-Gb2 FEA_Gb2-Cav
FEA_Cav-Gb3 FEA_Gb3-Gb4 FEA_UES

51
4.4 Effect of web perforations
4.4.1 Parameters
To investigate the effect of stud web perforation on time-dependent temperature distributions for CFS
walls under fire, extensive FEAs were carried out based on the previously validated 3D FE models.
Shown in Figure 4.10 and Table 4.3 are the CFS walls investigated in the parametric study. The CFS
walls are lined with double layers of 12 mm Type X gypsum board on both sides. The CFS frame
fabricated from G500 galvanized steel C-shape and track sections is built to a height of 3200 mm and
a width of 3550 mm. Seven CFS C-shaped studs are evenly spaced 600 mm o.c. All the CFS studs (150
mm×40 mm×1.5 mm) are connected to the top and bottom CFS tracks (150 mm×50 mm×1.5 mm). Five
slotted web perforations are evenly spaced 640 mm o.c. along the length of each steel stud. The length
of web perforations, Lh, varies from 130 mm to 530 mm as shown in Table 4.3 and Figure 4.12, whereas
the width of web perforations remains at 38 mm. For the purpose of comparison, two CFS walls without
web perforations, with and without insulation, are also investigated.
Figure 4.10 Configuration of CFS walls with web-perforated studs
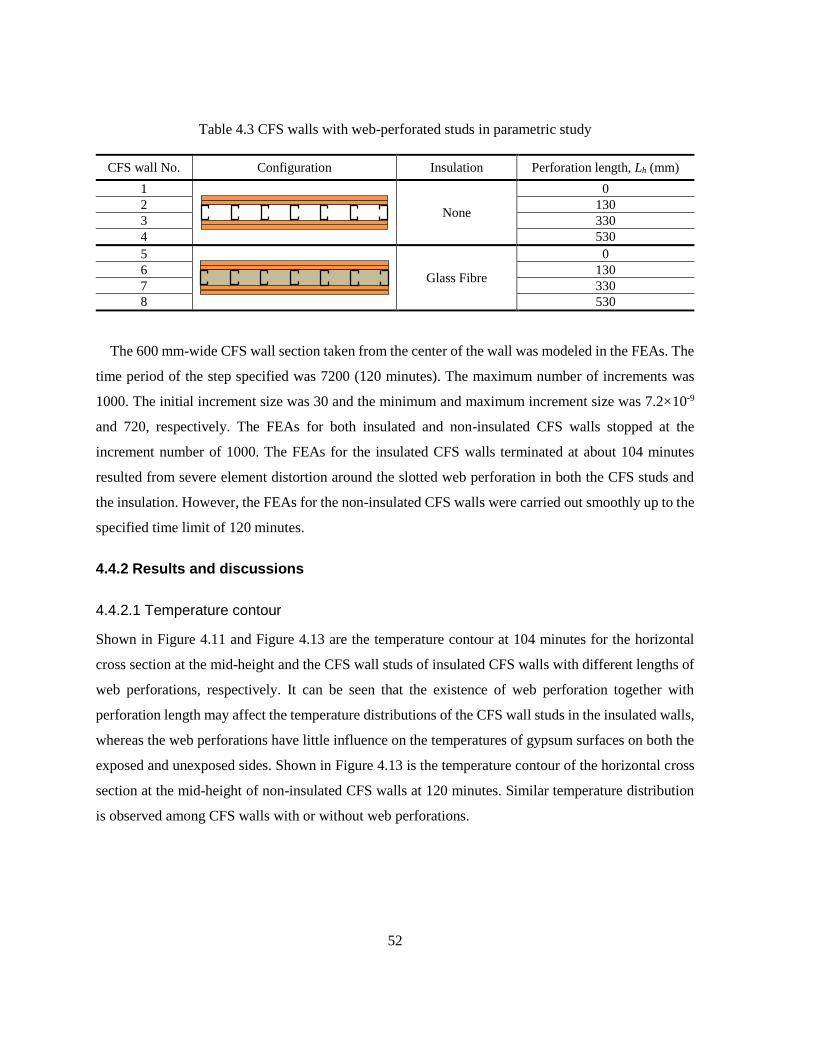
52
Table 4.3 CFS walls with web-perforated studs in parametric study
CFS wall No. Configuration Insulation Perforation length, Lh (mm)
1
None
0
2 130
3 330
4 530
5
Glass Fibre
0
6 130
7 330
8 530
The 600 mm-wide CFS wall section taken from the center of the wall was modeled in the FEAs. The
time period of the step specified was 7200 (120 minutes). The maximum number of increments was
1000. The initial increment size was 30 and the minimum and maximum increment size was 7.2×10⁻⁹
and 720, respectively. The FEAs for both insulated and non-insulated CFS walls stopped at the
increment number of 1000. The FEAs for the insulated CFS walls terminated at about 104 minutes
resulted from severe element distortion around the slotted web perforation in both the CFS studs and
the insulation. However, the FEAs for the non-insulated CFS walls were carried out smoothly up to the
specified time limit of 120 minutes.
4.4.2 Results and discussions
4.4.2.1 Temperature contour
Shown in Figure 4.11 and Figure 4.13 are the temperature contour at 104 minutes for the horizontal
cross section at the mid-height and the CFS wall studs of insulated CFS walls with different lengths of
web perforations, respectively. It can be seen that the existence of web perforation together with
perforation length may affect the temperature distributions of the CFS wall studs in the insulated walls,
whereas the web perforations have little influence on the temperatures of gypsum surfaces on both the
exposed and unexposed sides. Shown in Figure 4.13 is the temperature contour of the horizontal cross
section at the mid-height of non-insulated CFS walls at 120 minutes. Similar temperature distribution
is observed among CFS walls with or without web perforations.

53
(a) Lh =0 mm (b) Lh =130 mm
(c) Lh =330 mm (d) Lh =530 mm
Figure 4.11 Temperature contour of insulated CFS walls at mid-height cross section
a) Lh =0 mm (b) Lh =130 mm (c) Lh =330 mm (d) Lh =530 mm
Figure 4.12 Temperature contour of insulated CFS wall frames at 104 minutes
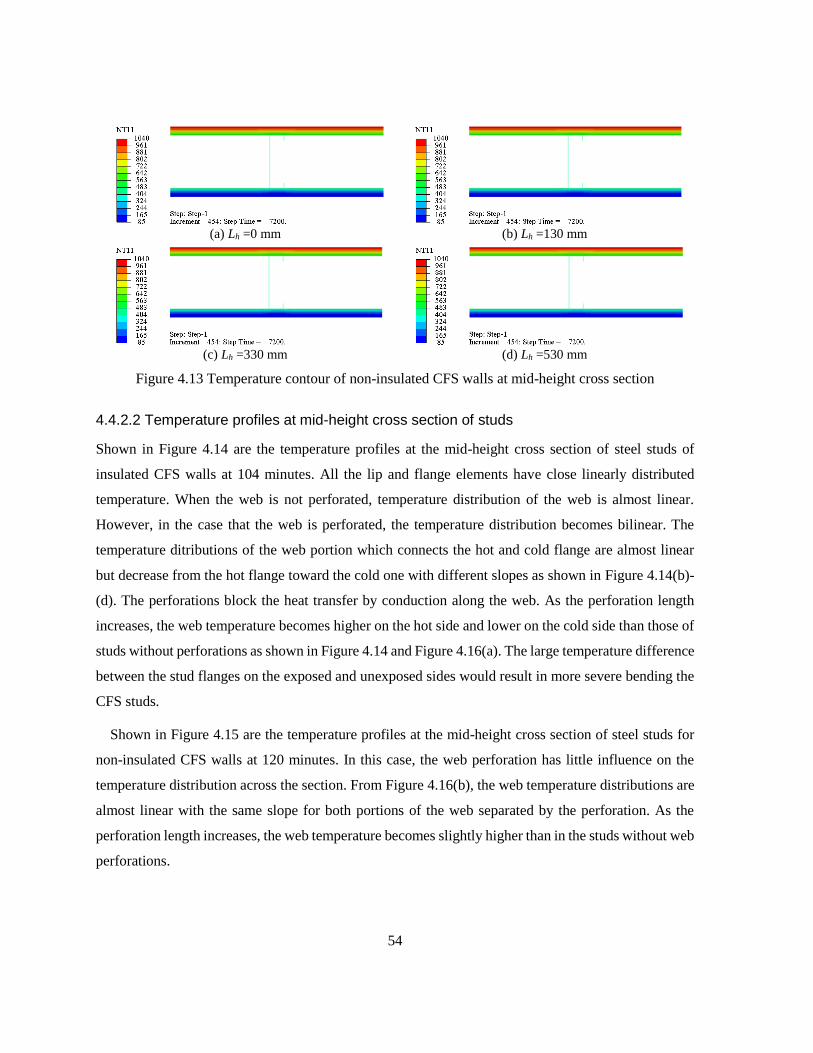
54
(a) Lh =0 mm (b) Lh =130 mm
(c) Lh =330 mm (d) Lh =530 mm
Figure 4.13 Temperature contour of non-insulated CFS walls at mid-height cross section
4.4.2.2 Temperature profiles at mid-height cross section of studs
Shown in Figure 4.14 are the temperature profiles at the mid-height cross section of steel studs of
insulated CFS walls at 104 minutes. All the lip and flange elements have close linearly distributed
temperature. When the web is not perforated, temperature distribution of the web is almost linear.
However, in the case that the web is perforated, the temperature distribution becomes bilinear. The
temperature ditributions of the web portion which connects the hot and cold flange are almost linear
but decrease from the hot flange toward the cold one with different slopes as shown in Figure 4.14(b)-
(d). The perforations block the heat transfer by conduction along the web. As the perforation length
increases, the web temperature becomes higher on the hot side and lower on the cold side than those of
studs without perforations as shown in Figure 4.14 and Figure 4.16(a). The large temperature difference
between the stud flanges on the exposed and unexposed sides would result in more severe bending the
CFS studs.
Shown in Figure 4.15 are the temperature profiles at the mid-height cross section of steel studs for
non-insulated CFS walls at 120 minutes. In this case, the web perforation has little influence on the
temperature distribution across the section. From Figure 4.16(b), the web temperature distributions are
almost linear with the same slope for both portions of the web separated by the perforation. As the
perforation length increases, the web temperature becomes slightly higher than in the studs without web
perforations.
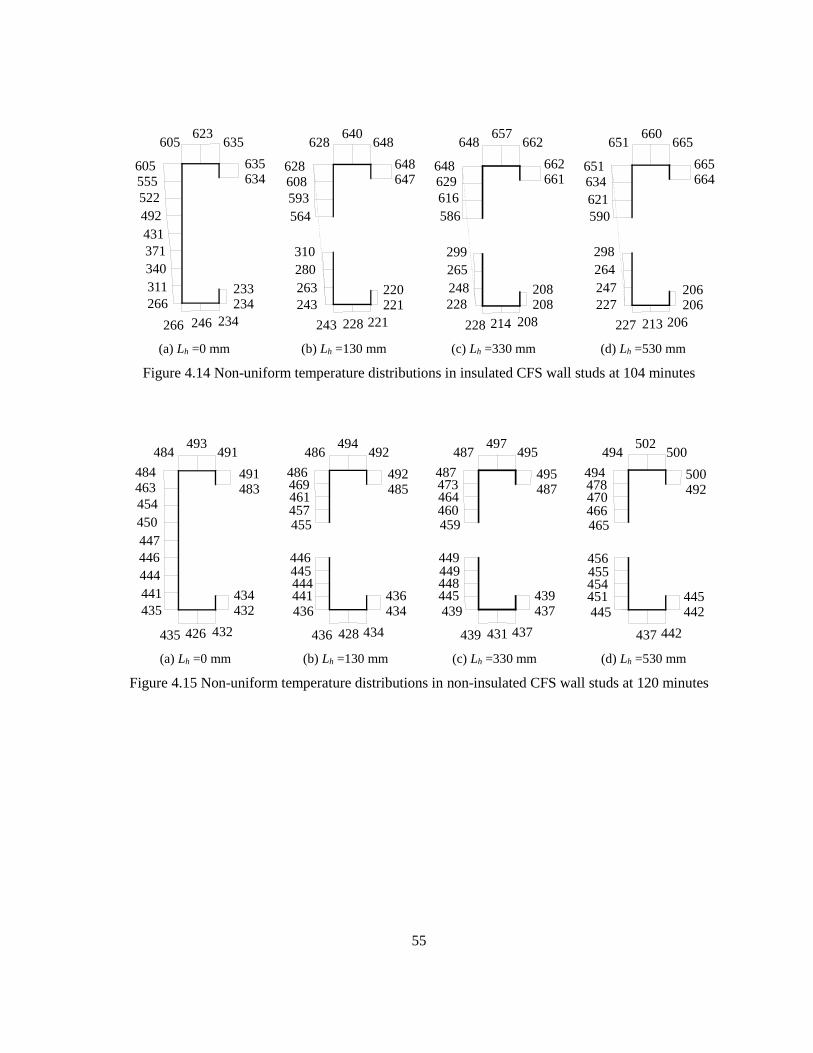
55
(a) Lh =0 mm (b) Lh =130 mm (c) Lh =330 mm (d) Lh =530 mm
Figure 4.14 Non-uniform temperature distributions in insulated CFS wall studs at 104 minutes
(a) Lh =0 mm (b) Lh =130 mm (c) Lh =330 mm (d) Lh =530 mm
Figure 4.15 Non-uniform temperature distributions in non-insulated CFS wall studs at 120 minutes
635634
522
555605
492
431
371
340
311
266
635605623
234266 246
233234
648647
593
608628
564
310
280
263
243
648628640
221243 228
220221
662661
616
629648
586
228
662648657
208228 214
208208
299
265
248
665664
621
634651
590
298
264
247
227
665651660
206227 213
206206
491483
454
463484
450
447
446
444
441
435
491484493
432435 426
434432
492485
461469486
455
446445444441
492486494
434436 428
436434
457
436
495487
464473487
459
449449448445
495487497
437439 431
439437
460
439
500492
470478494
465
456455454451
500494502
442437
445442
466
445
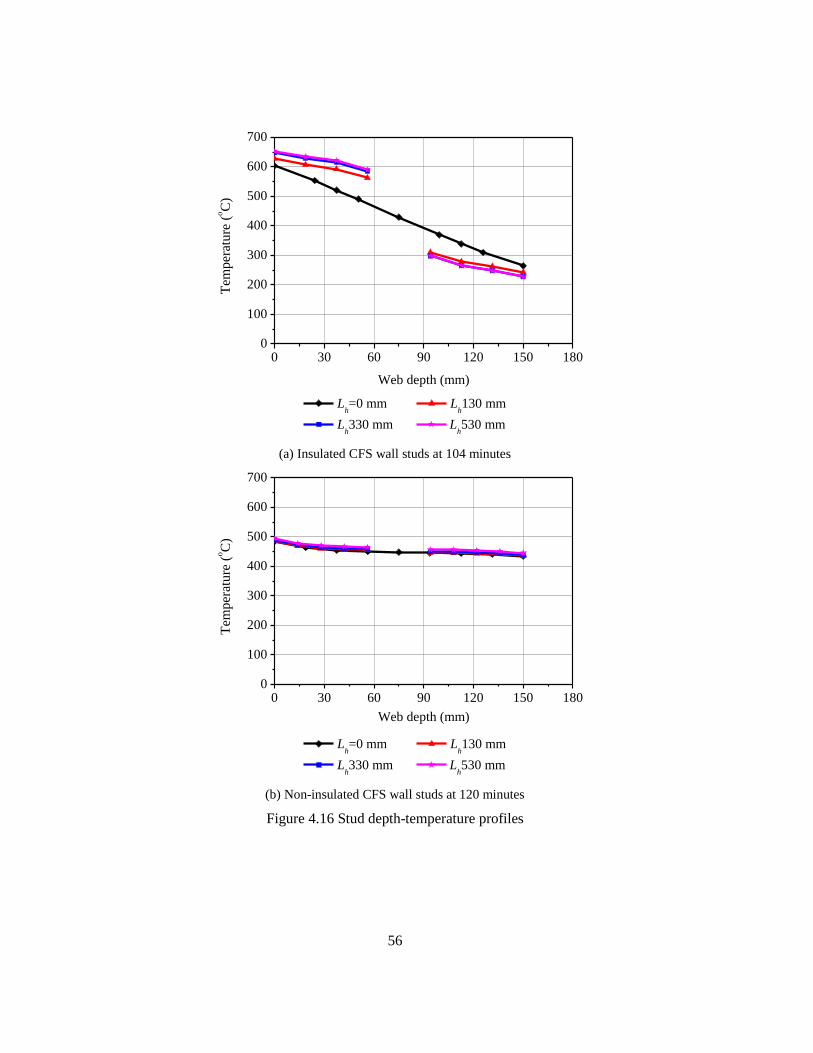
56
(a) Insulated CFS wall studs at 104 minutes
(b) Non-insulated CFS wall studs at 120 minutes
Figure 4.16 Stud depth-temperature profiles
0 30 60 90 120 150 1800
100
200
300
400
500
600
700
Tem
per
ature
(oC
)
Web depth (mm)
Lh=0 mm L
h130 mm
Lh330 mm L
h530 mm
0 30 60 90 120 150 1800
100
200
300
400
500
600
700
Tem
per
ature
(oC
)
Web depth (mm)
Lh=0 mm L
h130 mm
Lh330 mm L
h530 mm

57
4.4.2.3 Temperatures at flange-web junctions of studs
Compared in Figure 4.17 are the temperatures at location A of the flange-web junction of steel studs
inside the insulated CFS walls with 530 mm long web perforations and without web perforations,
respectively. Sections (i) and (ii) are the horizontal cross sections of CFS studs corresponding to the
center of the stud web perforations and at the center between the two web perforations. Section (iii)
represents the horizontal cross section at mid height for CFS walls without stud web perforations. At
fire exposure of 104 minutes, it is found that the temperatures at section (i) are 8% higher on the exposed
side (ES) and 15% lower on the unexposed side (UES) than those at section (iii). However, the
temperatures at section (ii) are only 2% higher on the exposed side and 4% lower on the unexposed
side than those at section (iii). Thus, the temperature gradient between two perforations decreases
gradually along the stud. Similar trend can be also found for the case 130 hL mm as shown in Figure
4.18. From Figure 4.17, it can be seen that as the perforation length decreases from 530 mm to 130 mm,
the temperature differences between sections (i) and (iii) reduce to 4% from 8% on the exposed side
and to 8% from 15% on the unexposed side; the temperature-time curves for sections (ii) and (iii) are
almost the same on both sides. The results indicate that the temperature distribution between two
perforations in the studs changes gradually. The temperature gradient in the studs reaches to the highest
value at the center of the perforations, resulting in that the strength and stiffness at this cross section
could be the lowest along the stud length. Thus, local buckling may be induced around the web
perforations, which is detrimental to the stability of CFS studs and consequently to the integrity of the
walls. Therefore, it may be non-conservative and inappropriate to neglect the existence of web
perforations in CFS wall studs while evaluating the wall performance at elevated temperatures.
Compared in Figure 4.19 are the temperatures at location B of the flange-web junction of steel studs
inside the non-insulated CFS walls with 530 mm long web perforations and without web perforations,
respectively. In this case, the temperature at section (i) is slightly higher than that at section (iii) on the
exposed sides. The temperature at section (ii) becomes slightly lower first and then higher than that at
section (iii) on the unexposed sides due to cavity radiation. When the perforation length reduces to 130
mm, as shown in Figure 4.20, the temperature curves of all the three sections are almost overlapped.
From Figure 4.19 and Figure 4.20, it can be seen that the temperature distribution along steel studs is
much more uniform for the non-insulated CFS walls than that for insulated CFS walls. The absence of
insulation in the cavity equalizes the temperatures across the stud cross sections more rapidly through
radiation than that of the insulated CFS walls.

58
(a) flange-web junction on the exposed side (b) flange-web junction on the unexposed side
Figure 4.17 Comparison of stud temperatures for insulated CFS walls (Lh=530 mm)
(a) flange-web junction on the exposed side (b) flange-web junction on the unexposed side
Figure 4.18 Comparison of stud temperatures for insulated CFS walls (Lh =130 mm)
0 20 40 60 80 100 1200
100
200
300
400
500
600
700T
emper
ature
(oC
)
Time (min)
(i)
(ii)
(iii)
A A A
(i) (ii) (iii)
ES
UES
0 20 40 60 80 100 1200
50
100
150
200
250
300
Tem
per
ature
(oC
)
Time (min)
(i)
(ii)
(iii)
B B B
(i) (ii) (iii)
ES
UES
0 20 40 60 80 100 1200
100
200
300
400
500
600
700
Tem
per
ature
(oC
)
Time (min)
(i)
(ii)
(iii)
A A A
(i) (ii) (iii)
ES
UES
0 20 40 60 80 100 1200
50
100
150
200
250
300T
emper
ature
(oC
)
Time (min)
(i)
(ii)
(iii)
B B B
(i) (ii) (iii)
ES
UES

59
(a) flange-web junction on the exposed side (b) flange-web junction on the unexposed side
Figure 4.19 Comparison of stud temperatures for non-insulated CFS walls (Lh =530 mm)
(a) flange-web junction on the exposed side (b) flange-web junction on the unexposed side
Figure 4.20 Comparison of stud temperatures for non-insulated CFS walls (Lh =130 mm)
0 20 40 60 80 100 1200
100
200
300
400
500T
emper
ature
(oC
)
Time (min)
(i)
(ii)
(iii)
A A A
(i) (ii) (iii)
ES
UES
0 20 40 60 80 100 1200
100
200
300
400
500
Tem
per
ature
(oC
)
Time (min)
(i)
(ii)
(iii)
B B B
(i) (ii) (iii)
ES
UES
0 20 40 60 80 100 1200
100
200
300
400
500
Tem
per
ature
(oC
)
Time (min)
(i)
(ii)
(iii)
A A A
(i) (ii) (iii)
ES
UES
0 20 40 60 80 100 1200
100
200
300
400
500
Tem
per
ature
(oC
)
Time (min)
(i)
(ii)
(iii)
B B B
(i) (ii) (iii)
ES
UES
60
4.5 Conclusions
Presented in this chapter is a numerical investigation on thermal performance of CFS load-bearing walls
subjected to standard fire conditions. 3D FE thermal models of CFS walls with perforated studs were
proposed and validated with the results from fire tests (Kolarkar, 2010). Parametric studies were carried
out to evaluate the effect of web perforations on the temperature distribution within CFS walls. The
following conclusions can be drawn based on the investigation:
3D FE thermal models of CFS walls have been developed and validated using full-scale fire tests
on CFS load-bearing walls. The 3D models can be used to investigate the effect of stud web
perforations on the temperature distributions of studs in CFS walls subjected to standard fire.
Such investigation cannot be accomplished using the 1D and 2D FE models.
For non-insulated and insulated CFS walls, the web perforations in CFS studs have little
influence on the temperature distributions for gypsum board surfaces on both fire-exposed and
unexposed sides.
For non-insulated CFS walls, the stud web perforation has negligible influence on the
temperature distribution through the cross sections and as well as along the stud length. The heat
transfer via radiation within the cavity far overweighs that blocked by conduction via web
perforations.
For insulated CFS walls with web perforations, the temperature distribution is no longer linear
but almost bilinear along the web depth. The largest temperature gradient in the CFS studs occurs
at the cross section located in the center of the web perforation along the stud length, perhaps
induce local bending at web perforations. Therefore, it may be non-conservative if the web
perforations in CFS studs are neglected when evaluating the fire resistance of CFS walls.

61
Chapter 5 Structural Modelling and Analysis of CFS Walls with
Web-Perforated Studs Subjected to Standard Fire
5.1 Introduction
Fire resistance rating of load-bearing CFS walls under standard fire conditions is often governed by the
structural failure of one or more studs. In order to understand the structural behaviour of CFS walls
under fire conditions, it is important to simulate the complete loading history based on transient-state
fire conditions. FE structural modelling of CFS walls under fire has been successfully developed by
(Feng & Wang, 2005; Gunalan & Mahendran, 2013; Kaitila, 2002). In the foregoing studies, simplified
temperature distributions across the CFS wall studs were obtained first based on the measured average
time-temperature curves of CFS wall studs from the fire tests. Then the temperature distributions were
input into the FE structural models as thermal boundary conditions. However, the simplified
temperature distribution method is not applicable for modelling the CFS wall tests conducted by Xu
(2011) for the following two reasons. First, the time-temperature curves of CFS wall studs were not
measured during the fire tests. Second, the temperature distributions across and along the studs cannot
be represented by the simplified temperature distribution shown in Figure 4.1 due to the existence of
web perforations. The temperatures of the studs for FEAs, obtained by the uncoupled heat transfer
analysis discussed in Chapter 4, were input into the sequential stress analysis as a predefined field.
The use of finite element modelling to characterize the structural responses of CFS load-bearing
walls with non-perforated C-shape studs has been validated by full-scale fire tests (Gunalan &
Mahendran, 2013; Zhao et al., 2005). The CFS walls were simplified using a single stud model for
stress analysis, and the temperature distributions used in the analysis were obtained from tests.
Although the structural responses obtained from the single stud model appeared to be acceptable, the
system effect, such as the possible redistribution of loading among studs was not considered. It is also
noted that the above-mentioned investigations assumed temperature distributions to be bilinear or linear
along the web depth, as shown in Figure 4.1. For CFS walls with web-perforated C-shape studs, the
validity of such simplification is yet to be investigated.
Also, it is well known that the sheathing which is fastened to the CFS wall framing may enhance the
load carrying capacity of the wall by providing lateral braces to the wall studs. Such increase of load
carrying capacity is permitted and can be evaluated in the design of the wall at ambient temperature.

62
However, the effect of sheathing bracing on the wall studs has not been investigated in the case of
elevated temperature. As it is difficult to identify the effect of sheathing bracing in a fire test, a
numerical investigation is carried out using FEA. The investigation results are presented in this section.
The modelling of FEA to simulate the CFS wall framing employed in this investigation has been
validated in previous investigations (Xu, 2011; Yang & Xu, 2016). The effect of sheathing bracing on
the fire performance of load-bearing CFS walls was investigated by incorporating the sheathing into
the FE model of stress analysis, accounting for different sheathing stiffnesses at elevated temperature.
With the growing demand for more-accurate assessment of CFS building safety under fire, the
outcomes of this investigation would certainly benefit design practitioners by providing better
understanding of sheathing’s effect on the behaviour of load-bearing CFS walls subjected to elevated
temperature.
In this chapter, three finite element models, including CFS single stud model, CFS wall frame model
and CFS wall system model, are developed to investigate the fire performance of load-bearing CFS
walls with web-perforated studs subjected to standard fire. Sequentially uncoupled 3D FE thermal-
stress analysis is carried out in which heat transfer analysis is conducted to obtain the temperature
distribution of an entire CFS wall. In the subsequent structural analysis, a CFS wall frame assembly
rather than a single stud is modelled, to achieve system-level structural responses. The FEA results are
compared with those from full-scale fire tests.
5.2 Full-scale fire tests
Shown in Table 5.1 are the configuration details and test results of the full-scale fire tests on seven
load-bearing CFS walls conducted by Xu (2011). The test results, including the fire duration,
temperature and failure mode, are also summarized in this table.
Illustrated in Figure 5.1 are the specimen configurations. The overall dimension is 3,550 mm by
3,000 mm for specimens 1-5 and 3,550 mm by 3,200 mm for specimens 6-7. The specimens are
sheathed with one or two layers of Type X, Type C gypsum board or MgO board on both sides. The
150 mm deep wall cavities are filled with 90 mm thick glass fibre on the fire side. Seven C-shape CFS
studs (150 mm×40 mm×15 mm×1.5 mm) are evenly spaced 600 mm o.c., except for the rightmost stud
which is spaced 550 mm o.c. Three slotted web perforations (Lh=75 mm, dh=38 mm) and five slotted
web perforations (Lh=130 mm, dh=38 mm) are along the length of each stud for specimens 1-5 and
specimens 6-7, respectively. An additional CFS stud is placed on each end of the CFS frame to eliminate
63
the gap between the specimen and the test frame in which the specimen is mounted so as to prevent
lateral sway. The top and bottom ends of these studs are connected with U-shape CFS track (150
mm×50 mm×1.5 mm). The CFS frames are laterally braced with a horizontal bridge (38 mm×13
mm×1.5 mm) at mid-height. The CFS studs, tracks and bridging are fabricated from cold-formed
galvanized steel sheets. The yield stress of the CFS studs and tracks are 345 N/mm2, and of the bridging,
228 N/mm2.
Shown in Figure 5.2 is the experimental setup. The target load was applied first and maintained
throughout the fire test. A target load was applied axially to the specimens through ten jacks and
maintained throughout the testing. The applied load ratio varied from 0.8 to 1.0. These jacks were
connected to the same hydraulic pump and were spaced 310 mm along a 3470 mm long loading beam.
A propane-fired gas furnace was used to expose one side of the wall to the ISO 834 time-temperature
fire curve (1999). Eight type K thermocouples were installed to measure the temperature development
of the sheathing surface on the ambient side. A comparison of the gypsum board surface temperature
on the ambient side between FEA and test are shown in Appendix A.

64
Table 5.1 Load-bearing CFS wall fire tests (Xu, 2011)
No. Specimen
Wall systems (Wall height=3.0 m) Load (kN/m) Result Temperature Comment
Fire-exposed
side
Sheathing
Wall stud
Fire-unexposed
Side
Sheathing
Calculated Applied
Fire
Duration
(minute)
Initial
(oC)
Max
(oC) Failure mode
1 LBW-E1(a) (2) 12 mm
MgO board
150×40×15×1.5mm
stud at 600 mm o.c.
w/ three 75×38
punched holes
(2) 12 mm
MgO board 33.02
28.07
@ 85% 155 13
79.6
@ #2
Failed at cracked
vertical joint
at center line
2 LBW-E1a(b) (2) 12 mm
MgO board
150×40×15×1.5mm
stud at 600 mm o.c.
w/ three 75×38
punched holes
(2) 12 mm
MgO board 33.02
33.02
@100% 153 15
136.8
@ #4
Failed at cracked
vertical joint
at center line,
multiple horizont
al cracks also
shown at mid-up
per location
3 LBW-G1(a)
(2) 12 mm
Type C
Gypsum Board
150×40×15×1.5mm
stud at 600 mm o.c.
w/ three 75×38
punched holes
(2) 12 mm
Type C
Gypsum Board
33.06 29.75
@ 90% 100 15
93.8
@ #4
Failed at cracked
vertical joint
at center line
4 LBW-E2
(1) 12 mm
MgO board
+ (1) 9 mm
MgO Board
150×40×15×1.5mm
stud at 600 mm o.c.
w/ three 75×38
punched holes
(1) 12 mm
MgO board
+ (1) 9 mm
MgO Board
33.19 33.19
@ 100% 117 8.5
78.5
@ #2
Failed by structur
al integrity cause
d by a horizontal
crack
5 LBW-E5
(1) 12 mm
MgO board
+ 12 mm
Type X
Gypsum Board
150×40×15×1.5mm
stud at 600 mm o.c.
w/ three 75x38 punc
hed holes
(1) 12 mm
MgO board
+ (1) 12 mm
Type X
Gypsum Board
33.13 31.47
@ 95% 100 8.6
83.2
@ # 10
Failed by fire
escaped from
a rear crack

65
Table 5.1 Load-bearing CFS wall fire tests (Xu, 2011)
No. Specimen
Wall systems (Wall height=3.2 m) Load (kN/m) Result Temperature Comment
Fire-exposed
side
Sheathing
Wall stud
Fire-unexposed
Side
Sheathing
Calculated Applied
Fire
Duration
(minute)
Intial
(oC)
Max
(oC) Failure mode
6 LBW-2
(1) 12 mm
MgO board
+ (1) 12 mm
Type X
Gypsum Board
150×40×15×1.5mm
stud at 600 mm o.c.
w/ five 130×38
punched holes
(1) 12 mm
MgO board
+ (1) 12 mm
Type X
Gypsum Board
33.02 26.5
@ 80% 68 23
82.3
@ #5
Structural failure
associated with
130×38 punched
holes
7 LBW-3
(2) 12 mm
Type C
Gypsum Board
150×40×15×1.5m
stud at 600 mm o.c.
w/ five 130×38
punched holes
(2) 12 mm
Type C
Gypsum Board
33.06 26.5
@ 80% 83 21
136.8
@ #4
Structural failure
associated with
130×38 punched
holes
Note:
1. For Specimen 1-5: wall height=3.0 m; for Specimen 6-7: wall height=3.2 m.
2. Cavity was filled with 90 mm fibre glass.
3. Initial temperature: ambient temperature; max temperature: maximum temperature measured by thermocouple as shown in Figure 5.2.
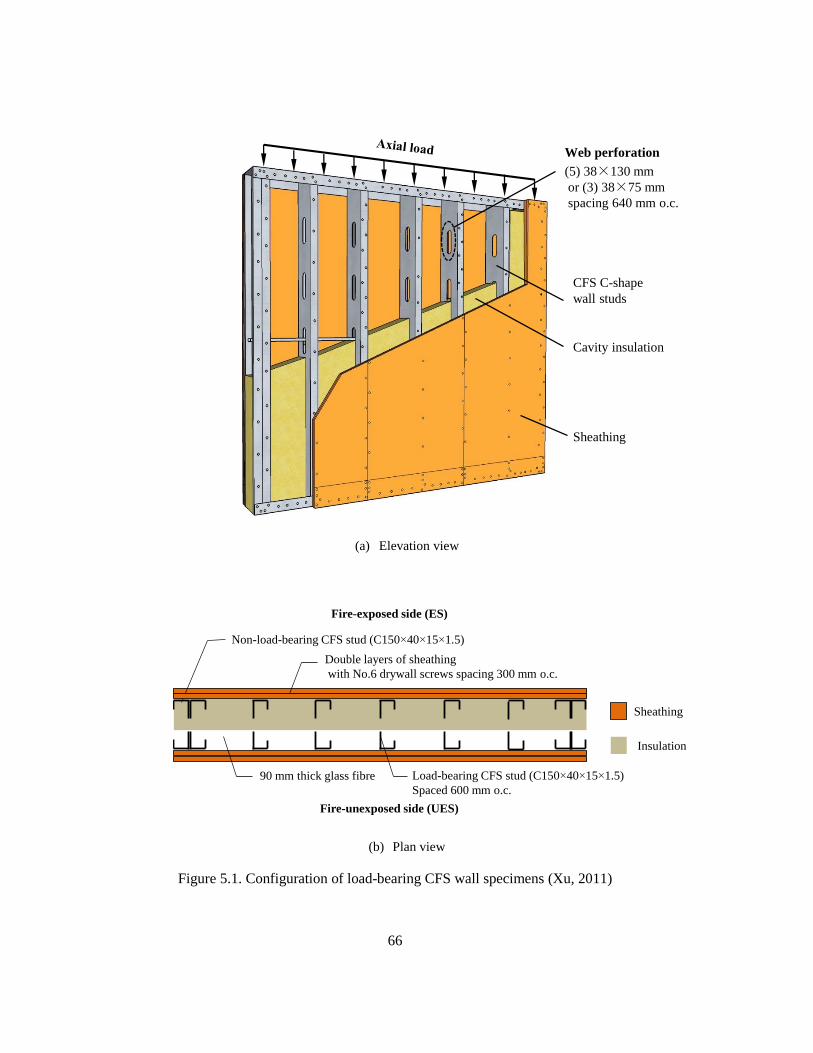
66
(a) Elevation view
(b) Plan view
Figure 5.1. Configuration of load-bearing CFS wall specimens (Xu, 2011)
Sheathing
Cavity insulation
CFS C-shape
wall studs
Web perforation
(5) 38×130 mm
or (3) 38×75 mm
spacing 640 mm o.c.
Fire-unexposed side (UES)
Fire-exposed side (ES)
Double layers of sheathing
with No.6 drywall screws spacing 300 mm o.c.
90 mm thick glass fibre Load-bearing CFS stud (C150 40 15 1.5)
Spaced 600 mm o.c.
Non-load-bearing CFS stud (C150 40 15 1.5)
Sheathing
Insulation
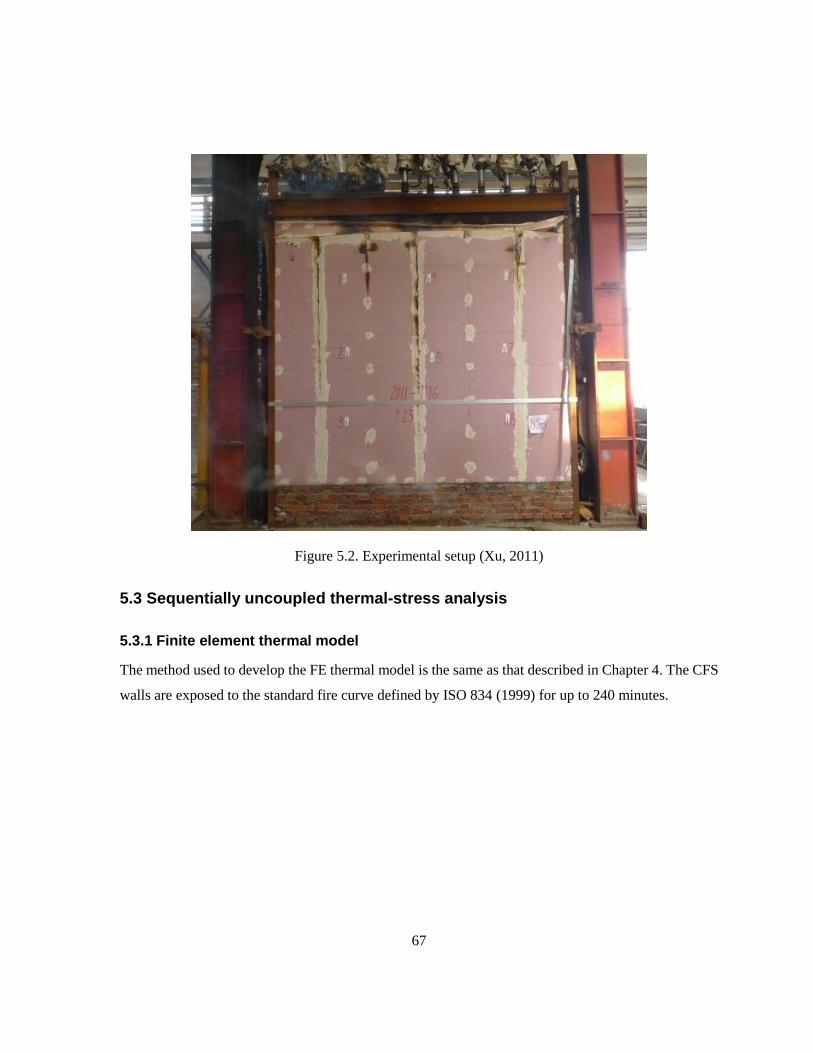
67
Figure 5.2. Experimental setup (Xu, 2011)
5.3 Sequentially uncoupled thermal-stress analysis
5.3.1 Finite element thermal model
The method used to develop the FE thermal model is the same as that described in Chapter 4. The CFS
walls are exposed to the standard fire curve defined by ISO 834 (1999) for up to 240 minutes.

68
(a) sheathing and glass fibre
(b) CFS frame
Figure 5.3. Finite element mesh of CFS walls

69
5.3.2 Thermal properties
The thermal properties of materials are critical for heat transfer analysis, and indirectly influence the
structural response of the wall system. The parameters, including thermal conductivity, specific heat,
and density, vary as functions of temperature are defined.
The thermal properties of cold-formed steel and glass fibre reported by Keerthan & Mahendran (2012)
are adopted, as shown in Table 4.2 and from Figure 4.6 to Figure 4.8. The density of the cold-formed
steel remains 7,850 kg/m3 at elevated temperatures.
5.3.2.1 Type C and X Gypsum board
Gypsum board consists of a noncombustible core, covered with thick sheets of paper. The sheets of
paper, before burning out, maintain the integrity of the core. The core is primarily gypsum
(CaSO4·2H2O), containing about 21% by weight of chemically bound water and a small amount of
free water. Type X gypsum board is generic fire-rated to provide 45 or 60 minutes protection to a load-
bearing wood or steel frame with a lining thickness of 12.7 or 15.9 mm, respectively. Type X contains
glass fibres in the core for enhanced fire performance and may have other additives to improve fire
performance. Type C is manufactured to provide better fire resistance or to meet other performance
needs, and meets all the requirements of the Type X board and is further enhanced with additional glass
fibres, more core ingredients and greater gypsum core density.
Different gypsum boards may have scattered thermal properties, perhaps resulting from chemical
composition and testing conditions. Shown in Table 5.2, from Clancy (1999), are the thermal properties
at ambient temperature published by gypsum board manufacturers around the world. The thermal
properties of Type X have been reported by Sultan (1996) and Mehaffey (1994), and those of Type C
only by Mehaffey (1994). To ensure Type C has relatively higher fire performance than Type X, the
data obtained from (Mehaffey et al., 1994) are selected for the FEA in this study. At ambient
temperature, the densities of the Type C and Type X gypsum boards are 732 kg/m3 and 648 kg/m3,
respectively; and the thermal conductivity of both types is approximately 0.24 W/m·oC.
The thermal properties of gypsum board at elevated temperature reported by Mehaffey et al. (1994)
are plotted in Figure 5.4. The dehydration (removal of free water) initiates at about 80 oC. The
calcination of chemically bound water is complete at about 200 oC. During the dehydration and
calcination processes, the temperature rise through gypsum board is effectively delayed. The density
and thermal conductivity of gypsum board drop considerably, and the specific heat rises to a peak and

70
then decreases. After the completion of calcination, the paper sheets outside of the noncombustible core
burn out, causing an increase of the thermal conductivity until 800 oC. After that, a higher thermal
conductivity is used to include the effect of ablation and cracking.
Table 5.2 Thermal properties of gypsum board at ambient temperature (Clancy, 1999)
Country Reference Density
(kg/m3)
Specific Heat
(J/kg·oC)
Conductivity
(W/m·oC)
Canada Mehaffey (1994)-Type C
-Type X
732
648
950
950
0.24
0.24
Canada Westrock heavy, regular 578 600 0.2
Canada Sultan (1996) -Type X 698 1500 0.25
United states Gypsum Assoc. (1993) 0.16
Europe
Konig et al (2000)
Nordic-Type F
-Type GN (regular)
825
700
0.25
0.25
United Kingdom British Gypsum Glasroc 1000 0.288
United Kingdom British Gypsum Fireline 800 0.2
United Kingdom Knauf Plasterboards 800 0.2
Australia Boral (1997) Firestop 810 0.17
Australia CSR Gyprock (1997)
New Zealand
Winstone Wallboards ltd
-GIB® Fyreline
-Standard
730-880
690

71
(a) Specific heat (J/kgoC)
(b) Relative density (%)
(c) Thermal conductivity (W/moC)
Figure 5.4 Thermal properties of Type C and X gypsum board (Mehaffey et al., 1994)
0 200 400 600 800 1000 12000
2000
4000
6000
8000
10000
12000
14000
16000
Sp
ecif
ic h
eat
(J/k
goC
)
Temperature (oC)
Type C
Type X
0 200 400 600 800 1000 1200
40
50
60
70
80
90
100
Rel
ativ
e d
ensi
ty (
%)
Temperature (oC)
Type C
Type X
0 200 400 600 800 1000 12000.0
0.1
0.2
0.3
0.4
0.5
0.6
0.7
0.8
0.9
Conduct
ivit
y (
W/m
oC
)
Temperature (oC)
Type C&X
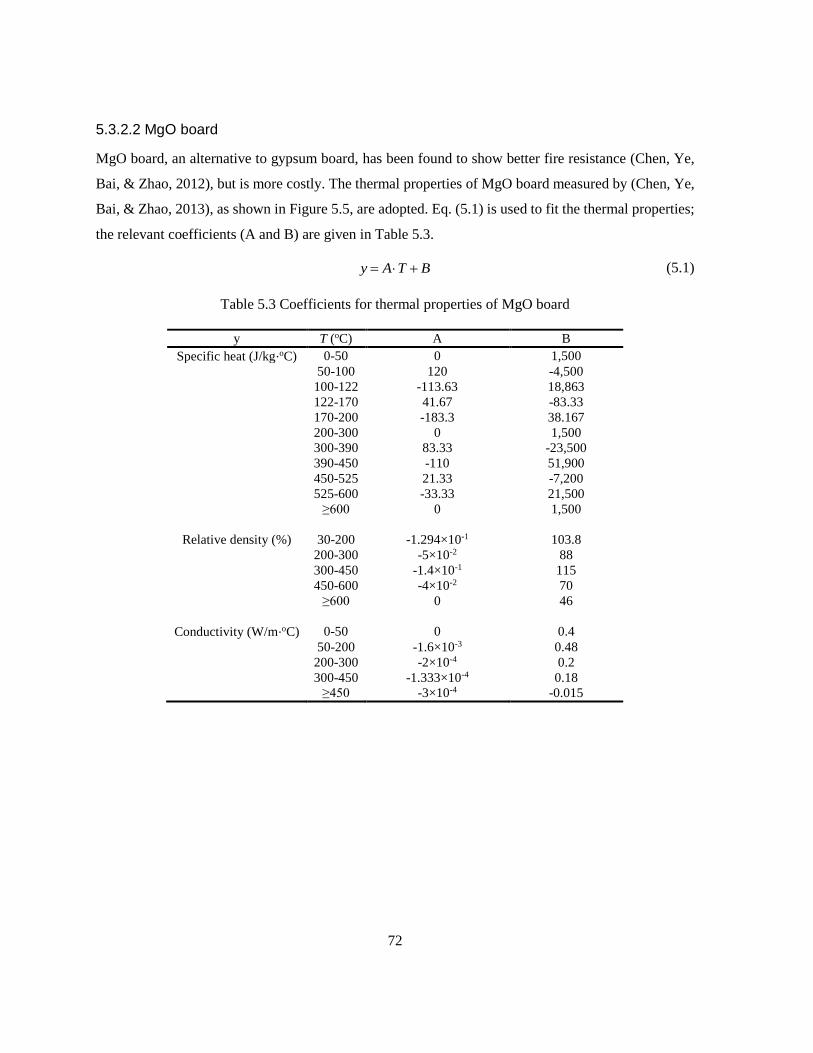
72
5.3.2.2 MgO board
MgO board, an alternative to gypsum board, has been found to show better fire resistance (Chen, Ye,
Bai, & Zhao, 2012), but is more costly. The thermal properties of MgO board measured by (Chen, Ye,
Bai, & Zhao, 2013), as shown in Figure 5.5, are adopted. Eq. (5.1) is used to fit the thermal properties;
the relevant coefficients (A and B) are given in Table 5.3.
y A T B (5.1)
Table 5.3 Coefficients for thermal properties of MgO board
y T (oC) A B
Specific heat (J/kg⋅oC) 0-50 0 1,500
50-100 120 -4,500
100-122 -113.63 18,863
122-170 41.67 -83.33
170-200 -183.3 38.167
200-300 0 1,500
300-390 83.33 -23,500
390-450 -110 51,900
450-525 21.33 -7,200
525-600 -33.33 21,500
≥600 0 1,500
Relative density (%) 30-200 -1.294×10⁻¹ 103.8
200-300 -5×10⁻² 88
300-450 -1.4×10⁻¹ 115
450-600 -4×10⁻² 70
≥600 0 46
Conductivity (W/m⋅oC) 0-50 0 0.4
50-200 -1.6×10⁻³ 0.48
200-300 -2×10⁻⁴ 0.2
300-450 -1.333×10⁻⁴ 0.18
≥450 -3×10⁻⁴ -0.015

73
(a) Specific heat (J/kgoC)
(b) Relative density (%)
(c) Thermal conductivity (W/moC)
Figure 5.5 Thermal properties of MgO board (Chen et al., 2013)
0 200 400 600 800 1000 12000
1000
2000
3000
4000
5000
6000
7000
8000
9000
10000
Sp
ecif
ic h
eat
(J/k
goC
)
Temperature (oC)
Specific heat
0 200 400 600 800 1000 1200
40
50
60
70
80
90
100
Rel
ativ
e den
sity
(%
)
Temperature (oC)
Relative density
0 200 400 600 800 1000 12000.0
0.1
0.2
0.3
0.4
0.5
Co
nd
uct
ivit
y (
W/m
oC
)
Temperature (oC)
Conductivity
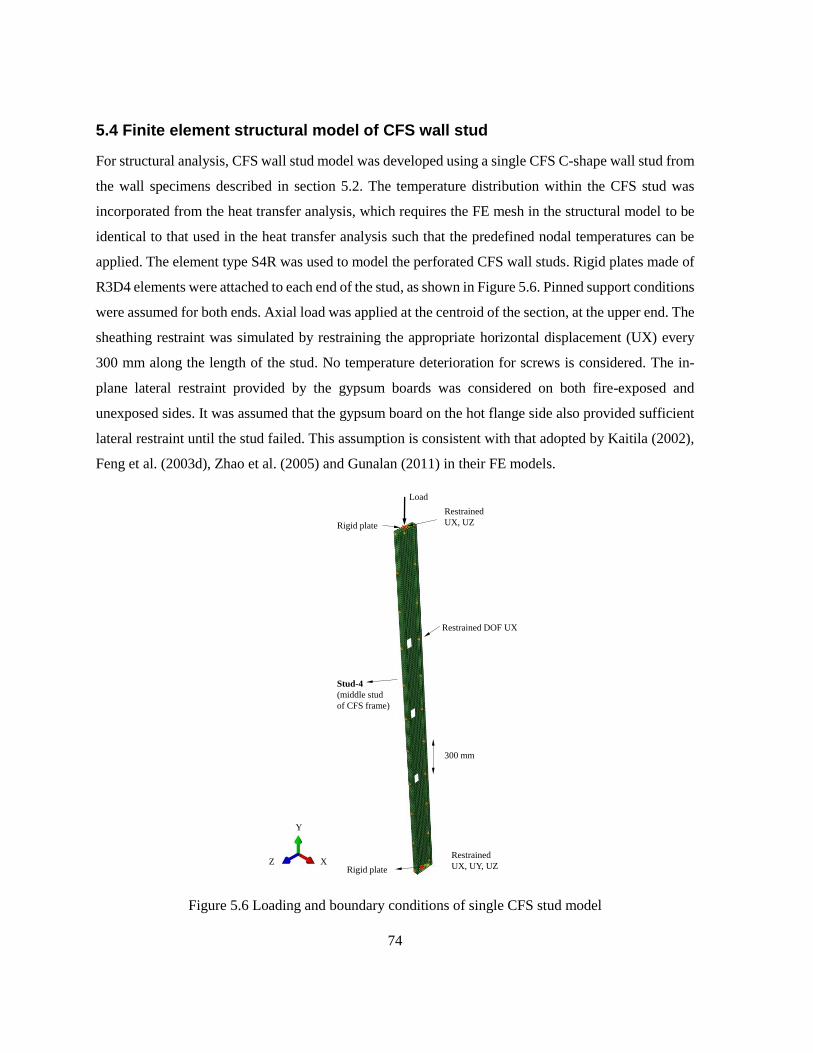
74
5.4 Finite element structural model of CFS wall stud
For structural analysis, CFS wall stud model was developed using a single CFS C-shape wall stud from
the wall specimens described in section 5.2. The temperature distribution within the CFS stud was
incorporated from the heat transfer analysis, which requires the FE mesh in the structural model to be
identical to that used in the heat transfer analysis such that the predefined nodal temperatures can be
applied. The element type S4R was used to model the perforated CFS wall studs. Rigid plates made of
R3D4 elements were attached to each end of the stud, as shown in Figure 5.6. Pinned support conditions
were assumed for both ends. Axial load was applied at the centroid of the section, at the upper end. The
sheathing restraint was simulated by restraining the appropriate horizontal displacement (UX) every
300 mm along the length of the stud. No temperature deterioration for screws is considered. The in-
plane lateral restraint provided by the gypsum boards was considered on both fire-exposed and
unexposed sides. It was assumed that the gypsum board on the hot flange side also provided sufficient
lateral restraint until the stud failed. This assumption is consistent with that adopted by Kaitila (2002),
Feng et al. (2003d), Zhao et al. (2005) and Gunalan (2011) in their FE models.
Figure 5.6 Loading and boundary conditions of single CFS stud model
Load
Restrained
UX, UY, UZ
Restrained
UX, UZ
Stud-4
(middle stud
of CFS frame)
300 mm
Restrained DOF UX
Rigid plate
Rigid plateX
Y
Z
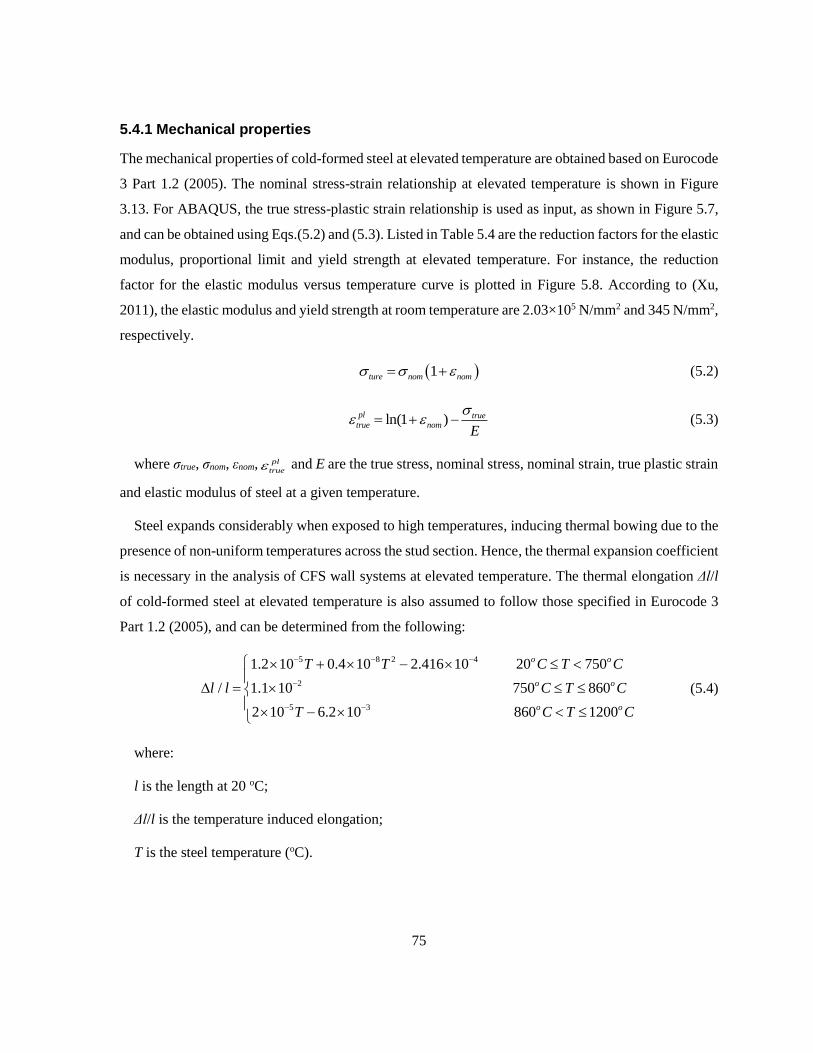
75
5.4.1 Mechanical properties
The mechanical properties of cold-formed steel at elevated temperature are obtained based on Eurocode
3 Part 1.2 (2005). The nominal stress-strain relationship at elevated temperature is shown in Figure
3.13. For ABAQUS, the true stress-plastic strain relationship is used as input, as shown in Figure 5.7,
and can be obtained using Eqs.(5.2) and (5.3). Listed in Table 5.4 are the reduction factors for the elastic
modulus, proportional limit and yield strength at elevated temperature. For instance, the reduction
factor for the elastic modulus versus temperature curve is plotted in Figure 5.8. According to (Xu,
2011), the elastic modulus and yield strength at room temperature are 2.03×10⁵ N/mm2 and 345 N/mm2,
respectively.
1ture nom nom (5.2)
ln(1 )pl truetrue nom
E
(5.3)
where σtrue, σnom, εnom, pl
true and E are the true stress, nominal stress, nominal strain, true plastic strain
and elastic modulus of steel at a given temperature.
Steel expands considerably when exposed to high temperatures, inducing thermal bowing due to the
presence of non-uniform temperatures across the stud section. Hence, the thermal expansion coefficient
is necessary in the analysis of CFS wall systems at elevated temperature. The thermal elongation Δl/l
of cold-formed steel at elevated temperature is also assumed to follow those specified in Eurocode 3
Part 1.2 (2005), and can be determined from the following:
5 8 2 4
2
5 3
1.2 10 0.4 10 2.416 10 20 750
/ 1.1 10 750 860
2 10 6.2 10 860 1200
o o
o o
o o
T T C T C
l l C T C
T C T C
(5.4)
where:
l is the length at 20 oC;
Δl/l is the temperature induced elongation;
T is the steel temperature (oC).
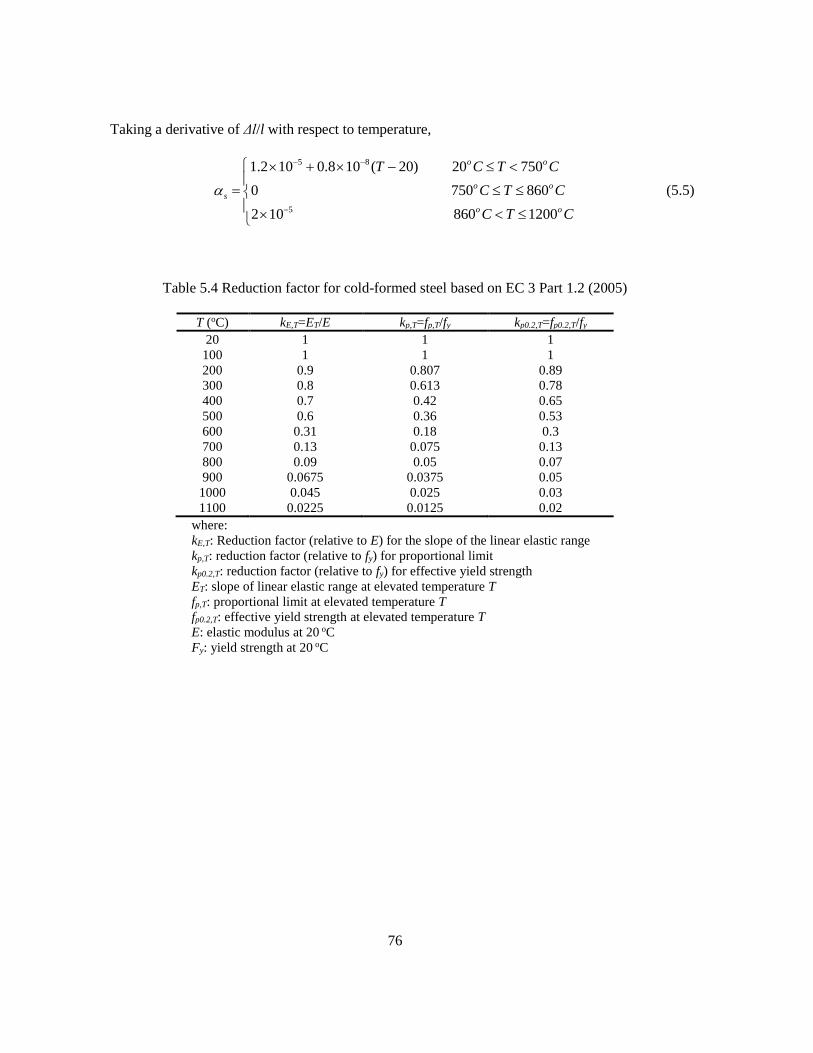
76
Taking a derivative of Δl/l with respect to temperature,
5 8
5
1.2 10 0.8 10 ( 20) 20 750
0 750 860
2 10 860 1200
o o
o o
s
o o
T C T C
C T C
C T C
(5.5)
Table 5.4 Reduction factor for cold-formed steel based on EC 3 Part 1.2 (2005)
T (oC) kE,T=ET/E kp,T=fp,T/fy kp0.2,T=fp0.2,T/fy
20 1 1 1
100 1 1 1
200 0.9 0.807 0.89
300 0.8 0.613 0.78
400 0.7 0.42 0.65
500 0.6 0.36 0.53
600 0.31 0.18 0.3
700 0.13 0.075 0.13
800 0.09 0.05 0.07
900 0.0675 0.0375 0.05
1000 0.045 0.025 0.03
1100 0.0225 0.0125 0.02
where:
kE,T: Reduction factor (relative to E) for the slope of the linear elastic range
kp,T: reduction factor (relative to fy) for proportional limit
kp0.2,T: reduction factor (relative to fy) for effective yield strength
ET: slope of linear elastic range at elevated temperature T
fp,T: proportional limit at elevated temperature T
fp0.2,T: effective yield strength at elevated temperature T
E: elastic modulus at 20 oC
Fy: yield strength at 20 oC

77
Figure 5.7 True stress-strain relationship of CFS stud at elevated temperature
Figure 5.8 Reduction factor of CFS stud at elevated temperature
5.4.2 Residual stresses and initial geometric imperfection
With increasing temperatures, the residual stresses in studs decrease rapidly (Lee, 2004). Therefore, the
residual stresses were not considered in this study, an omission in line with that of other researchers
(Feng et al., 2003d; Gunalan & Mahendran, 2013; Kaitila, 2002). Due to the thermal bowing effect, the
initial geometric imperfection becomes insignificant on the ultimate strength of CFS wall studs
subjected to non-uniform elevated temperature distributions (Gunalan & Mahendran, 2013); hence,
initial geometric imperfection was also not considered in this study.
0.000 0.005 0.010 0.015 0.020 0.0250
50
100
150
200
250
300
350
400
Tru
e st
ress
(N
/mm
2)
Plastic strain
20 oC
100 oC
200 oC
300 oC
400 oC
500 oC
600 oC
700 oC
800 oC
900 oC
1000 oC
1100 oC
0 200 400 600 800 1000 12000.0
0.1
0.2
0.3
0.4
0.5
0.6
0.7
0.8
0.9
1.0
1.1
Red
uct
ion
fac
tor,
kE
,T (
k p0
.2,T)
Temperature (oC)
kE,T
=Ea,T
/Ea
kp0.2,T
=fp0.2,T
/fyb

78
5.4.3 Results and discussion
The results obtained from the FE structural model based on a single stud model for the seven tested
specimens, shown in Table 5.1, are analyzed. All the studs fails in a similar way. The failure mode of
studs is found to have little difference associated with the web perforation length (Lh=75 mm or 130
mm). Detailed FEA results, for instance, Stud-4 of specimen LBW-E1(a) are discussed below.
Shown in Figure 5.9 is the predicted time-reaction force (RF2) curve at the bottom end of the CFS
stud. For the single stud, RF2 equals the applied load at the top end. At point A, the target load is
applied at room temperature. At point B, the applied load starts to decrease. At point C, the applied
load reduces to 85% of the applied load. The RF2 of Stud-4 of specimen LBW-E1(a) remains constant
until failure occurs at about 96 minutes.
Plotted in Figure 5.10 is the time-axial deformation curve at the top end. The stud shortens initially,
due to the applied axial load at room temperature; then gradually expands as temperature increases; and
finally shortens again since the stud can no longer sustain the applied load. The failure of the stud is
evidenced by the rapid increase of column deformation and sudden decrease of the reaction force at the
lower end of the column.
Presented in Figure 5.11 and Figure 5.12 are respectively the predicted stress contour (Mises) and
out-of-plane movement (U3) with respect to the phase designated as point A, B and C. Global bending
about the X-axis, combed with local failure at the top end, can be observed. However, no failure
associated with the web perforation is observed. Thermal bowing is observed as the stud bends towards
the fire-exposed side. The flange of the column on the fire-exposed side buckles first due to the higher
temperature, and results in rapid degradation of both the stiffness and strength of the flange. The flange
on the fire-unexposed side bears an increasing load and fails as a consequence.
Illustrated in Figure 5.13 is the temperature contour at phase Point C. Section 1 and 2 represent the
cross section located at the center of a web perforation region and between two web perforations,
respectively. The temperature within the stud ranging from 363 oC to 721 oC. According to Table 5.4,
at 363 oC, the elastic modulus and yield stress of cold-formed steel decreases to approximately 75%
and 70% of those at room temperature, respectively; and at 721 oC, the elastic modulus and yield stress
both drop to about 13% that at room temperature. As a result, a large stress gradient exists in the stud.
Plotted in Figure 5.14 are the cross-sectional temperature distributions at Section 1 and 2 for all the
specimens at failure time, obtained from the heat transfer analysis.

79
Presented in Table 5.5 is a comparison of failure times between FEA and test results. According to
(Xu, 2011), specimen LBW-2 failed prematurely due to the failure of the specimen’s sheathing joints
in the fire test. The difference in failure time between the predicted FEA and test results, excluding
specimen LWB-2, is within 11%, which illustrates that the single CFS stud model provides results with
good accuracy and can be used for parametric study to investigate the effect of web perforation.
Figure 5.9 Time-reaction force curve (LBW-E1(a))
Figure 5.10 Time-axial deformation curve (LBW-E1(a))
0 30 60 90 120 150 1800
2
4
6
8
10
12
14
16
18
Rea
ctio
n f
orc
e at
bott
om
(kN
)
Time (min)
Step-2
Step-1
A B
C
0 30 60 90 120 150 180-5
0
5
10
15
20
25
Ax
ial
dis
pla
cem
ent
at t
op
(m
m)
Time (min)
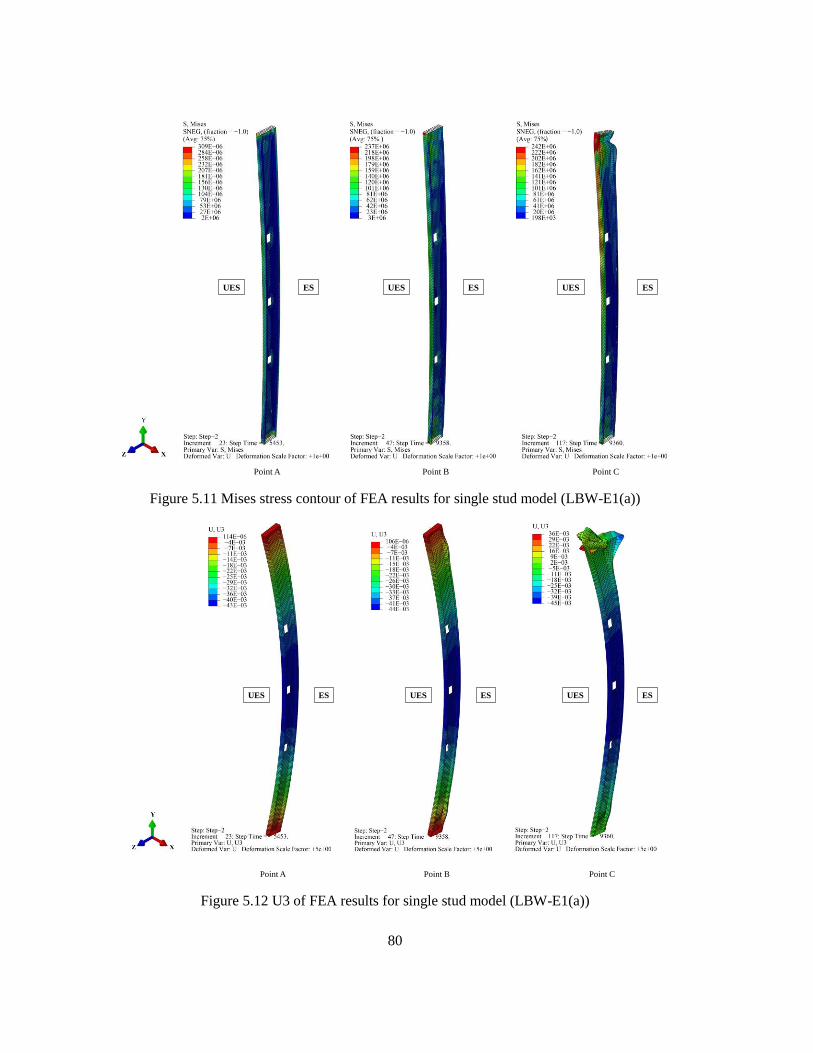
80
Figure 5.11 Mises stress contour of FEA results for single stud model (LBW-E1(a))
Figure 5.12 U3 of FEA results for single stud model (LBW-E1(a))
Point A Point B Point C
UES ES UES ES UES ES
Point A Point B Point C
UES ES UES ES UES ES
81
Figure 5.13 Temperature contour of Stud 4 at failure time (LBW-E1(a))
(a) LBW-E1(a) (b) LBW-E1a(b)
Section 2 Section 1
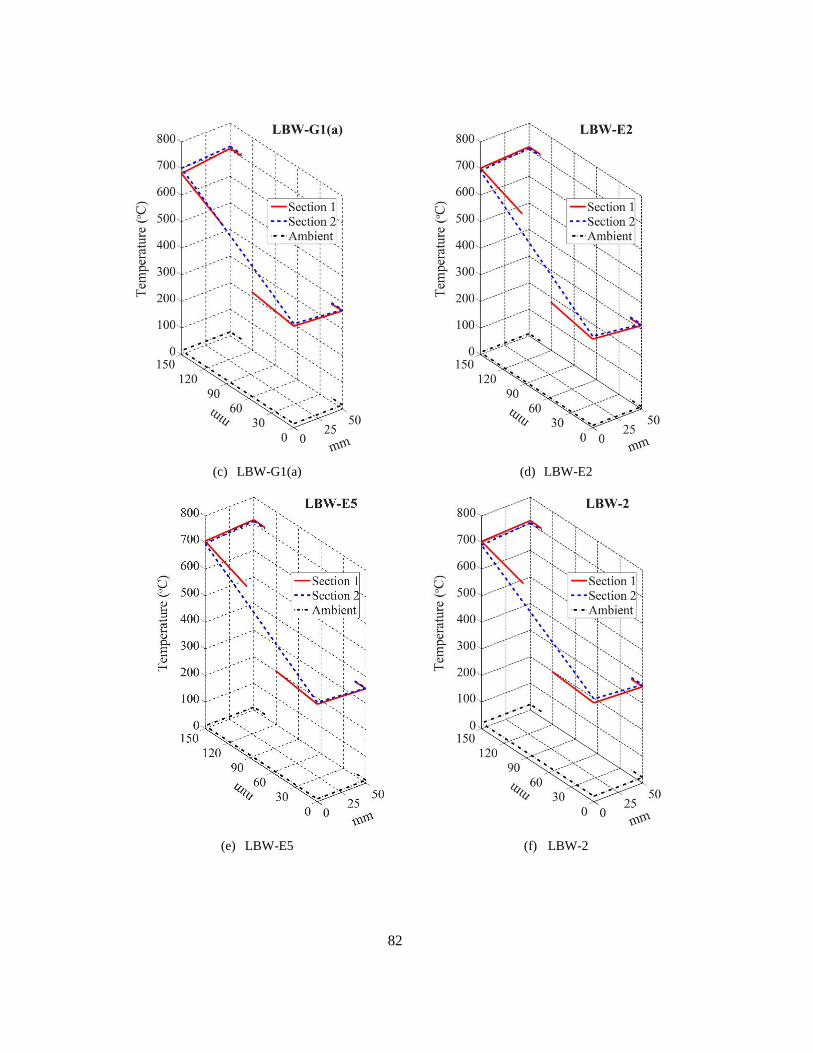
82
(c) LBW-G1(a) (d) LBW-E2
(e) LBW-E5 (f) LBW-2

83
(g) LBW-3
Figure 5.14 Cross-sectional temperature contours of Stud 4 for all specimens at failure time
Table 5.5 Comparison of failure time between FEA and test results
No. Specimen tFEA (min) tTest (min) (tFEA-tTest)/tTest×100%
1 LBW-E1(a) 156.01 155 0.65%
2 LBW-E1a(b) 139.28 153 -8.97%
3 LBW-G1(a) 89.19 100 -10.81%
4 LBW-E2 118.21 117 1.03%
5 LBW-E5 108.82 100 8.82%
6 LBW-2 108.10 68 58.97% (premature failure)
7 LBW-3 92.86 83 11.88%
Average 4%
Standard Deviation (STDEV)
(excluding LBW-2)
0.091

84
5.5 Finite element structural model of CFS wall frame
Unlike the FE modelling using a single CFS stud discussed in Section 5.4, the system-level FE model
of the CFS wall frame developed in this study is presented in this section. Modelling of the tested wall
frames can simulate possible stress redistribution within the CFS studs. The FE model includes all the
steel components of a CFS frame except for the bottom track, as shown in Figure 5.15. By excluding
the bottom track, the reaction force at the bottom end of each stud, a key parameter in the FE result
analysis, can be extracted from the output database (.odb) file of ABAQUS. Similar to that of the single
CFS stud model, the restraints associated with sheathing are modelled by restraining the horizontal
displacement (UX) at the locations of screws. As to interior glass fibre insulation, its contribution of
delay to the temperature rise is modeled in the thermal analysis, but the effect of glass fibre swelling is
disregarded in the stress analysis. In this study, swelling of glass fibre does not have much effect on
CFS studs of the tested wall frames as there is about 50 mm space in the wall cavities since the stud
depth is 150 mm but the thickness of glass fibre is only 90 mm. In addition, swelling of glass fibre was
not observed in the tests.
The CFS frame is modelled using S4R element. To incorporate nodal temperature into sequential
stress analysis, the location of each node in the FE mesh should be consistent with that of the thermal
analysis. The finite element meshes of the structural model are the same as those of the heat transfer
model, for which correlation is required to import the heat transfer results. The time period of the step
specified is 14400 (240 minutes). The maximum number of increments is 200. The initial increment
size is 30, whereas the minimum and maximum increment sizes are 1×10⁻⁹ and 300, respectively.
Shown in Figure 5.16 are the interactions and constraints between all the components of the CFS
wall frame. The contact interaction between the webs of the two studs on each end of the CFS frame is
hypothesized to be frictionless, and the hard contact is selected for the normal direction behaviour. The
tie interaction is defined to model the contacted surfaces between the loading beam and top track of the
CFS frame, and the locations of nodes are where screws are placed. The spring/dashpots are defined to
simulate the contact relationship between the track web and stud ends.
Presented in Figure 5.17 are the boundary and loading conditions. All three translational
displacements associated with the bottom end of the stud, i.e. UX, UY and UZ, are restrained. The
horizontal displacements of the web of the top track, UZ, are restrained. The axial loads are applied
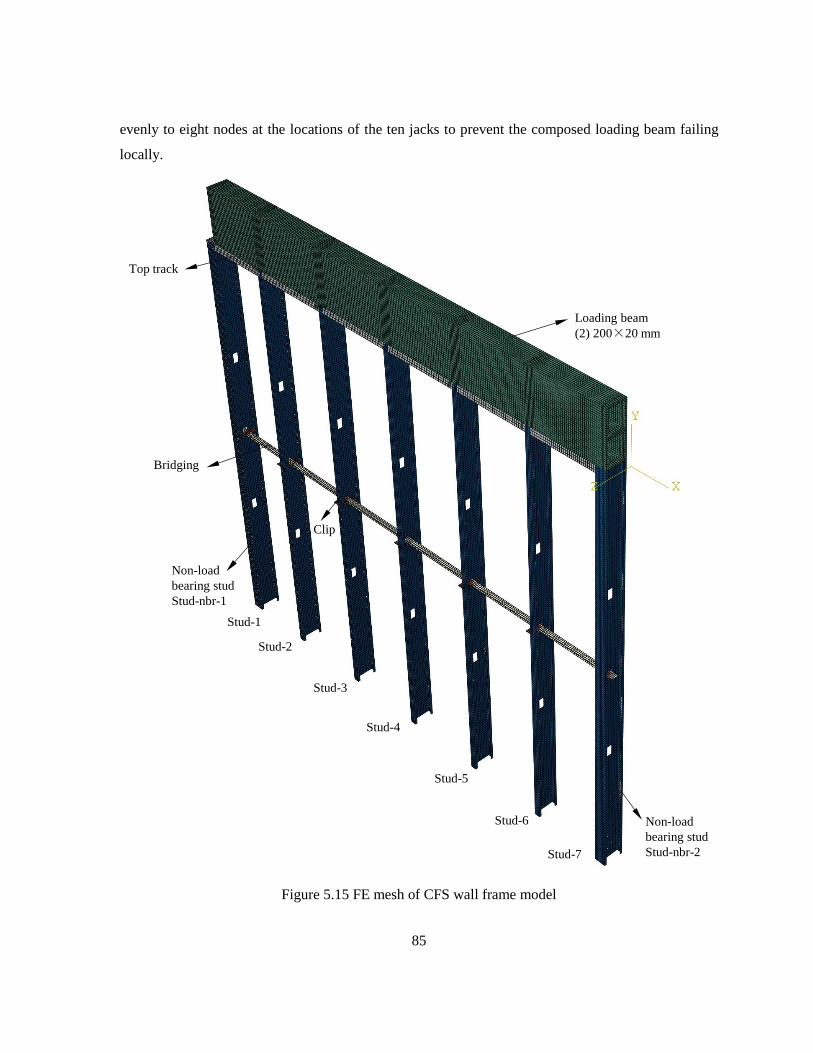
85
evenly to eight nodes at the locations of the ten jacks to prevent the composed loading beam failing
locally.
Figure 5.15 FE mesh of CFS wall frame model
Loading beam
(2) 200×20 mm
Bridging
Stud-1
Stud-2
Stud-3
Stud-4
Stud-5
Stud-6
Stud-7
Non-load
bearing stud
Stud-nbr-1
Non-load
bearing stud
Stud-nbr-2
Top track
Clip

86
Figure 5.16 Interactions and constraints of CFS wall frame model
+
+
Spring+tieSurface contact +tie
Surface contact +tie
Tie

87
Figure 5.17 Boundary and loading conditions of CFS wall frame model
Restrained DOF UX, UY, UZ
Restrained DOF UZ
Load/jack
Restrained DOF UX
Spacing 300 mm o.c.
(modelling in-plane
lateral restraint provided
by sheathing)
X
Y
Z

88
5.5.1 Results and discussions
The results obtained from the FE structural model based on the CFS wall frame model are analyzed.
The failure mode of the CFS walls with a wall height of 3.0 m and 3.2 m are illustrated using specimens
LBW-E1(a) and LBW-3, respectively. Shown in Figure 5.18 and Figure 5.19 are the failure modes of
the two specimens obtained from the CFS wall frame model. Both CFS studs of the specimens bend
towards the furnace and both ends of the studs deform considerably, corresponding to local failure at
the ends. The wall height for specimens LBW-E1(a) and LBW-3 are 3.0 m and 3.2 m, respectively. In
addition, the length and number of web perforations are different, as shown in Table 5.1. Local failure
is associated with the web perforation near ends of the studs for specimen LBW-3, but not for specimen
LBW-E1(a), perhaps because the web perforation length is greater and the bearing height associated
the with the perforation at the end is much shorter than that of specimen LBW-E1(a).
Shown in Figure 5.20 is the time-average axial displacement curve. The average axial displacement
is obtained based on all the loaded nodes of the loading beam. The frame is shortened at ambient
temperature when the load is applied but subsequently elongated at elevated temperature due to thermal
expansion. But unlike shown in Figure 5.10 for the single CFS stud model, there is no abrupt axial
shortening is observed at the time of failure and after failure for both specimens. Due to the local failures
at the web perforation and ends of the studs, the computer program terminates when the local failures
occurred.
Presented in Figure 5.21 are the time-reaction force relationships at the bottom ends of the studs for
all the specimens. Unlike a sudden drop in reaction force and axial deformation for single CFS stud
model as illustrated in Figure 5.9 and Figure 5.10, there are force and stiffness interactions among the
CFS studs. For all seven specimens, at the first phase, the loads in the interior studs initially increase
as the temperature increases but the loads in end studs are reduced. This may be caused by the
deformation of the loading beam. However, as the further increase of the temperature, the loads in the
interior studs reached to their peak values. The loads were started to shift to the end studs. In the second
phase, the loads in the interior studs decreases as the increase of the temperature. At the meantime, the
loads in the end studs increase considerably. For the CFS wall frame model, the failure time of the
specimens cannot be identified.

89
Figure 5.18 Failure mode of CFS wall frame model (LBW-E1(a))
At top
Detail 1
At mid-height
Detail 2
At bottom
Detail 3
LBW-E1(a)
Web perforation: (3) 38×75 mm
Detail 1
Detail 2
Detail 3

90
Figure 5.19 Failure mode of CFS wall frame model (LBW-3)
LBW-3
Web perforation: (5) 38×130 mm
Detail 1
Detail 2
Detail 3
At top
Detail 1
At mid-height
Detail 2
At bottom
Detail 3
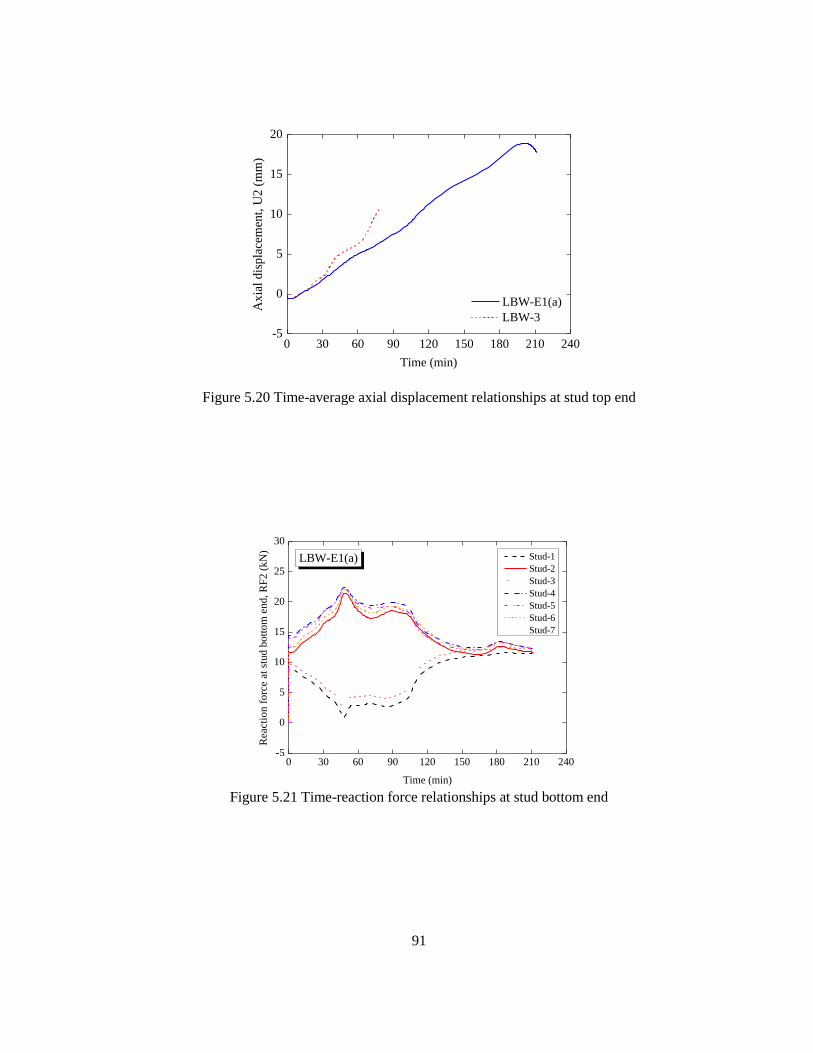
91
Figure 5.20 Time-average axial displacement relationships at stud top end
Figure 5.21 Time-reaction force relationships at stud bottom end
0 30 60 90 120 150 180 210 240-5
0
5
10
15
20
LBW-E1(a)
LBW-3
Axia
l dis
pla
cem
ent,
U2 (
mm
)
Time (min)
0 30 60 90 120 150 180 210 240-5
0
5
10
15
20
25
30
Rea
ctio
n f
orc
e at
stu
d b
ott
om
en
d,
RF
2 (
kN
)
Time (min)
Stud-1
Stud-2
Stud-3
Stud-4
Stud-5
Stud-6
Stud-7
LBW-E1(a)
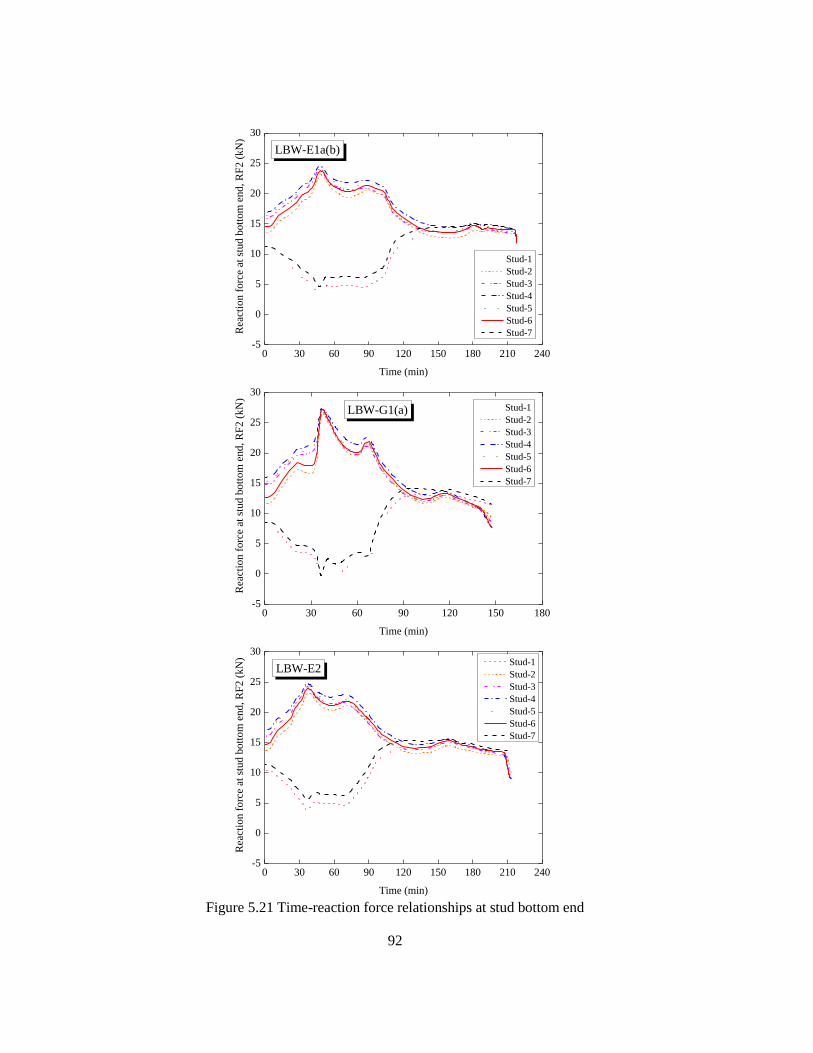
92
Figure 5.21 Time-reaction force relationships at stud bottom end
0 30 60 90 120 150 180 210 240-5
0
5
10
15
20
25
30
Rea
ctio
n f
orc
e at
stu
d b
ott
om
en
d,
RF
2 (
kN
)
Time (min)
Stud-1
Stud-2
Stud-3
Stud-4
Stud-5
Stud-6
Stud-7
LBW-E1a(b)
0 30 60 90 120 150 180-5
0
5
10
15
20
25
30
Rea
ctio
n f
orc
e at
stu
d b
ott
om
en
d,
RF
2 (
kN
)
Time (min)
Stud-1
Stud-2
Stud-3
Stud-4
Stud-5
Stud-6
Stud-7
LBW-G1(a)
0 30 60 90 120 150 180 210 240-5
0
5
10
15
20
25
30
Rea
ctio
n f
orc
e at
stu
d b
ott
om
en
d,
RF
2 (
kN
)
Time (min)
Stud-1
Stud-2
Stud-3
Stud-4
Stud-5
Stud-6
Stud-7
LBW-E2
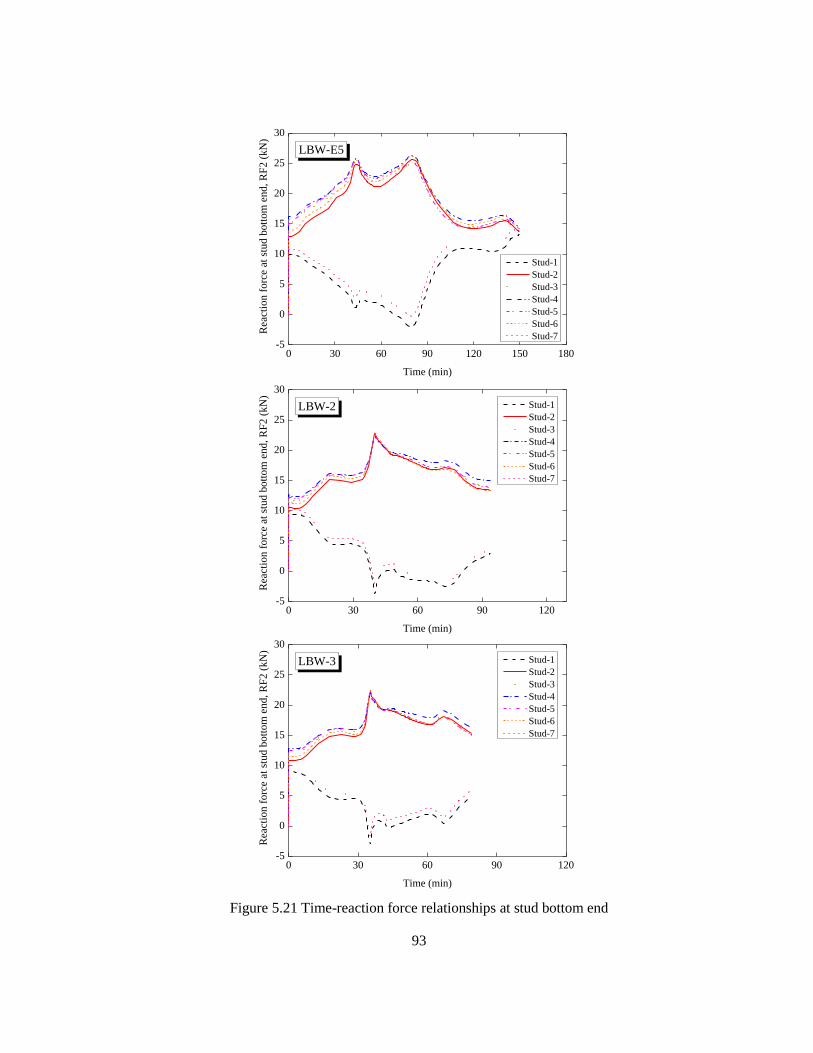
93
Figure 5.21 Time-reaction force relationships at stud bottom end
0 30 60 90 120 150 180-5
0
5
10
15
20
25
30
Rea
ctio
n f
orc
e at
stu
d b
ott
om
en
d,
RF
2 (
kN
)
Time (min)
Stud-1
Stud-2
Stud-3
Stud-4
Stud-5
Stud-6
Stud-7
LBW-E5
0 30 60 90 120-5
0
5
10
15
20
25
30
Rea
ctio
n f
orc
e at
stu
d b
ott
om
end, R
F2 (
kN
)
Time (min)
Stud-1
Stud-2
Stud-3
Stud-4
Stud-5
Stud-6
Stud-7
LBW-2
0 30 60 90 120-5
0
5
10
15
20
25
30
Rea
ctio
n f
orc
e at
stu
d b
ott
om
en
d,
RF
2 (
kN
)
Time (min)
Stud-1
Stud-2
Stud-3
Stud-4
Stud-5
Stud-6
Stud-7
LBW-3

94
From Figure 5.21, it is found that axial forces in end studs, Stud-1 and Stud-7, are in tension for a
certain period of time in all the modelled specimens. Intuitively, it is expected that all the studs of the
CFS wall frame are in compression due to the applied load and elevated temperature. A thorough
examination on modelling of CFS wall frame was conducted, and it was found that the tension forces
in the end studs was resulted from adopting the tie interaction to simulate the surface contact condition
between the hot-rolled structural loading beam and the top track of CFS wall frame. In the FE model
of CFS wall frame, the loading beam is assumed to be remained at ambient temperature throughout the
fire event. Thus, there is no thermal expansion in the loading beam. Due to the compatibility of
deformation, the possible thermal expansion of the top track of the CFS wall frame is restrained by the
loading beam when tie interaction is specified, which results in tension forces in Stud-1 and Stud-7.
Evidently, when the tie interaction between the loading beam and the top track of CFS wall frame is
replaced with friction interaction, the end studs are no longer in tension in any time during the fire
duration.
Presented in Figure 5.22 is the failure mode of a CFS wall frame (LBW-3) with the height of 3.2 m
and web perforations of 38 mm ×130 mm, in which the surface contact condition between the loading
beam and the top track of CFS wall frame was simulated with friction interaction. Considering there is
no available information on the friction coefficient between hot-rolled structural steel and galvanized
cold-formed steel at elevated temperature, the friction coefficient of 0.3 was adopted in the investigation.
The CFS wall frame, shown Figure 5.22, failed in a similar way to the case when the tie interaction was
specified (Figure 5.19). The FE simulation associated with Figure 5.22 terminated early at 75.5 minutes
instead of 79.2 minutes as that of Figure 5.19. Differential horizontal movement at the contact surface
between the loading beam and the top track of CFS wall frame was also observed, as illustrated in
Figure 5.22.
Shown in Figure 5.23 is the time-reaction force relationships of stud bottom support corresponding
to the frame shown in Figure 5.22. It can be seen from Figure 5.23 that all the wall studs of the frame
are in compression throughout the fire duration. Therefore, it appears that the friction interaction is
more realistic than the tie interaction. However, convergence issues were encountered when adopting
the friction interaction for simulating the wall specimens with height of 3.0 m and shorter web
perforation length. Thus, there is a need in future research to further explore appropriate boundary
conditions between the loading beam and the top track of CFS wall frame at elevated temperature to
achieve more realistic and accurate simulations.
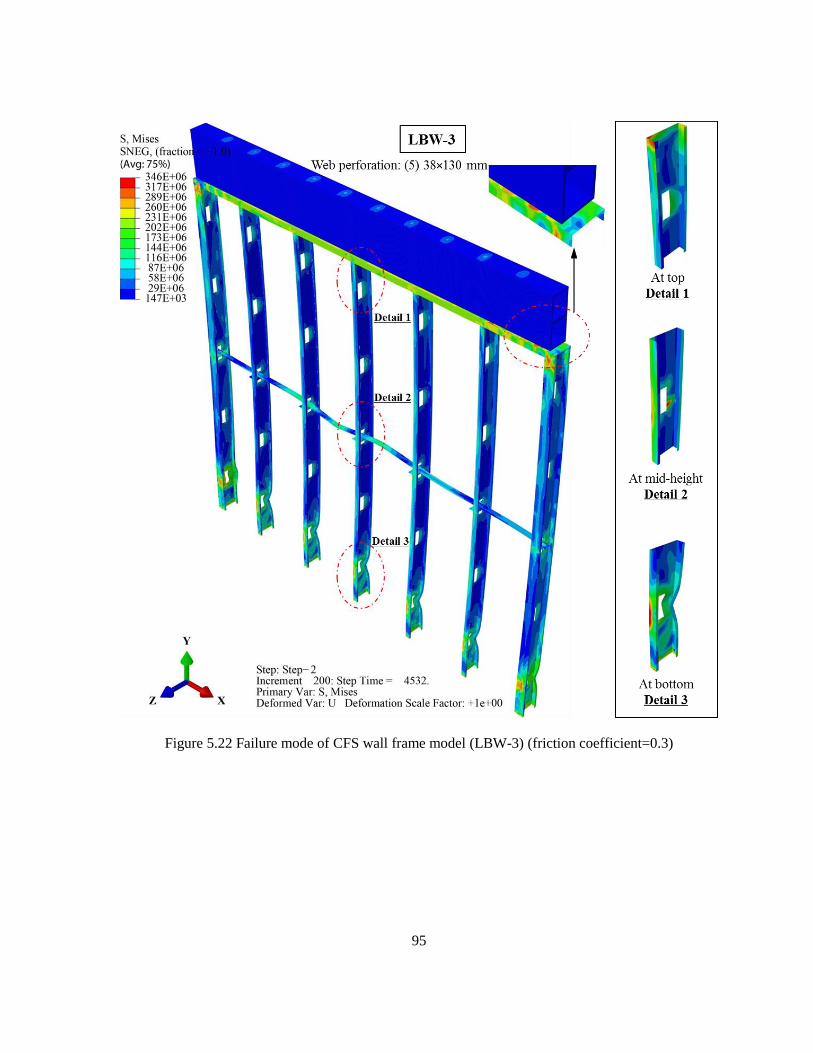
95
Figure 5.22 Failure mode of CFS wall frame model (LBW-3) (friction coefficient=0.3)
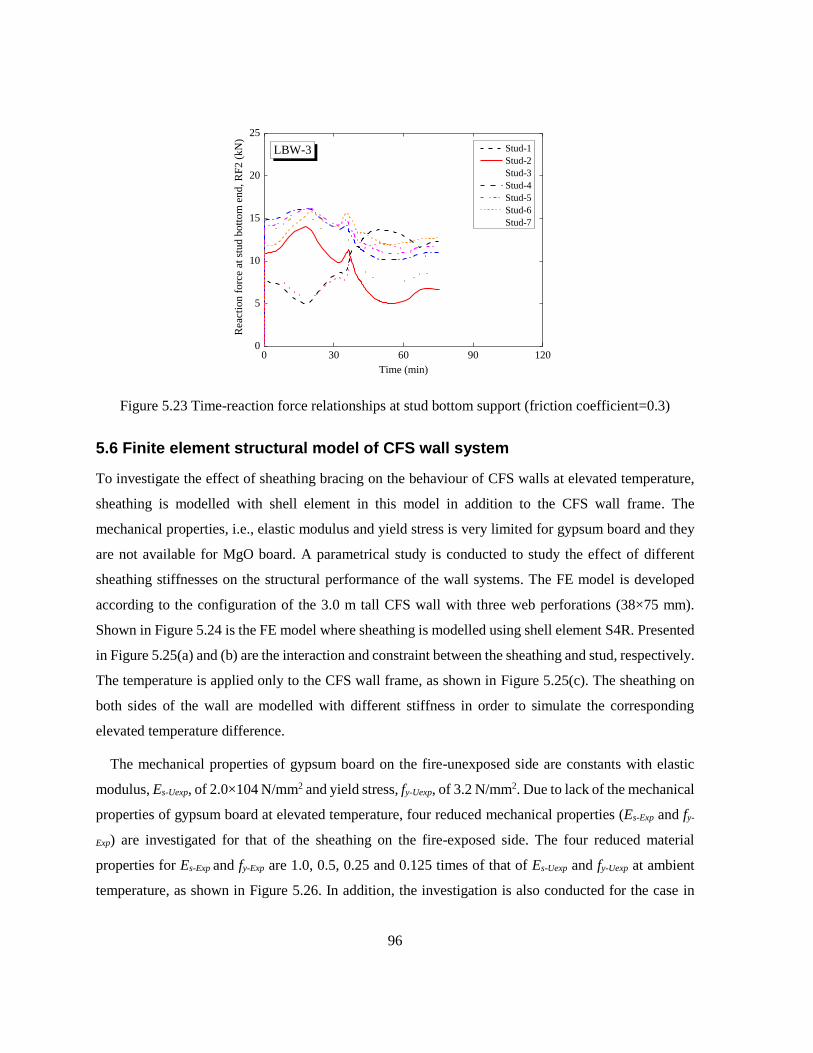
96
Figure 5.23 Time-reaction force relationships at stud bottom support (friction coefficient=0.3)
5.6 Finite element structural model of CFS wall system
To investigate the effect of sheathing bracing on the behaviour of CFS walls at elevated temperature,
sheathing is modelled with shell element in this model in addition to the CFS wall frame. The
mechanical properties, i.e., elastic modulus and yield stress is very limited for gypsum board and they
are not available for MgO board. A parametrical study is conducted to study the effect of different
sheathing stiffnesses on the structural performance of the wall systems. The FE model is developed
according to the configuration of the 3.0 m tall CFS wall with three web perforations (38×75 mm).
Shown in Figure 5.24 is the FE model where sheathing is modelled using shell element S4R. Presented
in Figure 5.25(a) and (b) are the interaction and constraint between the sheathing and stud, respectively.
The temperature is applied only to the CFS wall frame, as shown in Figure 5.25(c). The sheathing on
both sides of the wall are modelled with different stiffness in order to simulate the corresponding
elevated temperature difference.
The mechanical properties of gypsum board on the fire-unexposed side are constants with elastic
modulus, Es-Uexp, of 2.0×10⁴ N/mm2 and yield stress, fy-Uexp, of 3.2 N/mm2. Due to lack of the mechanical
properties of gypsum board at elevated temperature, four reduced mechanical properties (Es-Exp and fy-
Exp) are investigated for that of the sheathing on the fire-exposed side. The four reduced material
properties for Es-Exp and fy-Exp are 1.0, 0.5, 0.25 and 0.125 times of that of Es-Uexp and fy-Uexp at ambient
temperature, as shown in Figure 5.26. In addition, the investigation is also conducted for the case in
0 30 60 90 1200
5
10
15
20
25
Rea
ctio
n f
orc
e at
stu
d b
ott
om
en
d,
RF
2 (
kN
)
Time (min)
Stud-1
Stud-2
Stud-3
Stud-4
Stud-5
Stud-6
Stud-7
LBW-3
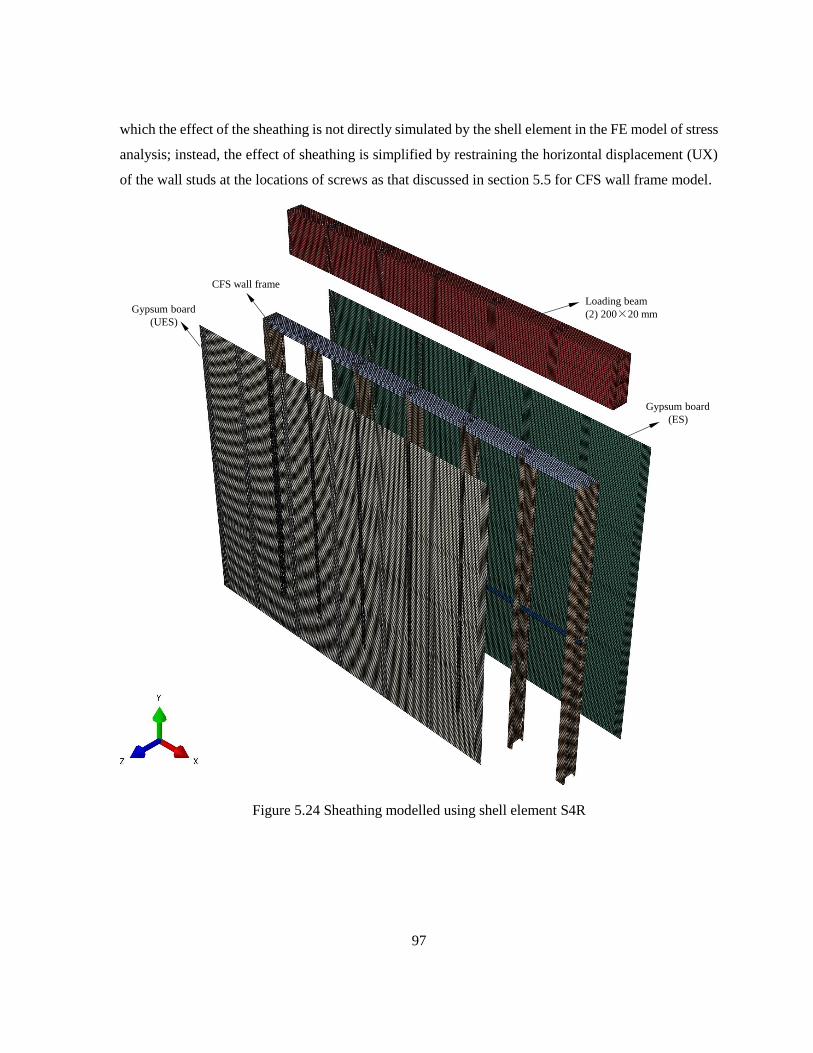
97
which the effect of the sheathing is not directly simulated by the shell element in the FE model of stress
analysis; instead, the effect of sheathing is simplified by restraining the horizontal displacement (UX)
of the wall studs at the locations of screws as that discussed in section 5.5 for CFS wall frame model.
Figure 5.24 Sheathing modelled using shell element S4R
Loading beam
(2) 200×20 mm
Gypsum board
(ES)
CFS wall frame
Gypsum board
(UES)

98
(a) Surface contact (b) Tie interaction
(c) Incorporate nodal temperature
Figure 5.25 Interaction and constraint between sheathing and studs
CFS wall frame:
Incorporate nodal
temperature
obtained from
heat transfer analysis
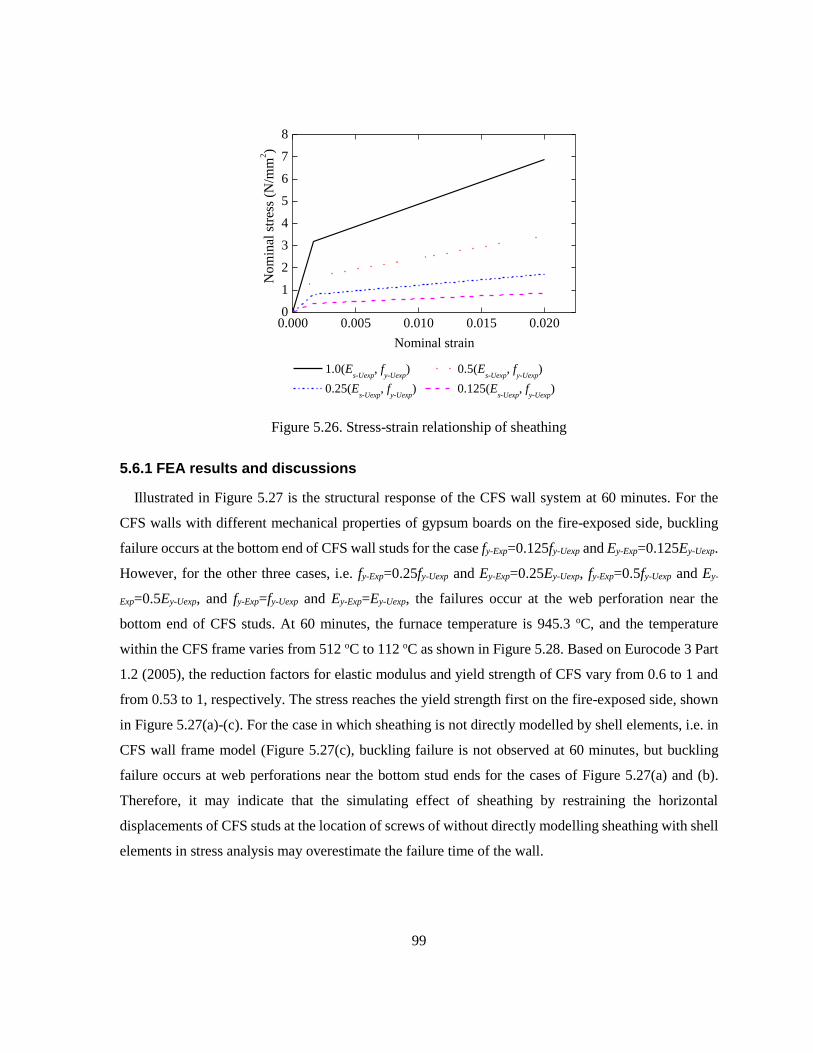
99
Figure 5.26. Stress-strain relationship of sheathing
5.6.1 FEA results and discussions
Illustrated in Figure 5.27 is the structural response of the CFS wall system at 60 minutes. For the
CFS walls with different mechanical properties of gypsum boards on the fire-exposed side, buckling
failure occurs at the bottom end of CFS wall studs for the case fy-Exp=0.125fy-Uexp and Ey-Exp=0.125Ey-Uexp.
However, for the other three cases, i.e. fy-Exp=0.25fy-Uexp and Ey-Exp=0.25Ey-Uexp, fy-Exp=0.5fy-Uexp and Ey-
Exp=0.5Ey-Uexp, and fy-Exp=fy-Uexp and Ey-Exp=Ey-Uexp, the failures occur at the web perforation near the
bottom end of CFS studs. At 60 minutes, the furnace temperature is 945.3 oC, and the temperature
within the CFS frame varies from 512 oC to 112 oC as shown in Figure 5.28. Based on Eurocode 3 Part
1.2 (2005), the reduction factors for elastic modulus and yield strength of CFS vary from 0.6 to 1 and
from 0.53 to 1, respectively. The stress reaches the yield strength first on the fire-exposed side, shown
in Figure 5.27(a)-(c). For the case in which sheathing is not directly modelled by shell elements, i.e. in
CFS wall frame model (Figure 5.27(c), buckling failure is not observed at 60 minutes, but buckling
failure occurs at web perforations near the bottom stud ends for the cases of Figure 5.27(a) and (b).
Therefore, it may indicate that the simulating effect of sheathing by restraining the horizontal
displacements of CFS studs at the location of screws of without directly modelling sheathing with shell
elements in stress analysis may overestimate the failure time of the wall.
0.000 0.005 0.010 0.015 0.0200
1
2
3
4
5
6
7
8
Nom
inal
str
ess
(N/m
m2)
Nominal strain
1.0(Es-Uexp
, fy-Uexp
) 0.5(Es-Uexp
, fy-Uexp
)
0.25(Es-Uexp
, fy-Uexp
) 0.125(Es-Uexp
, fy-Uexp
)

100
(a) CFS frame (fy-Exp=0.125fy-Uexp)
(b) CFS frame (fy-Exp=0.25fy-Uexp)

101
(c) CFS frame (restrain UX at screw locations)
Figure 5.27. Structural response of CFS frame at 60 minutes
Figure 5.28. Temperature distribution within CFS frames at 60 minutes
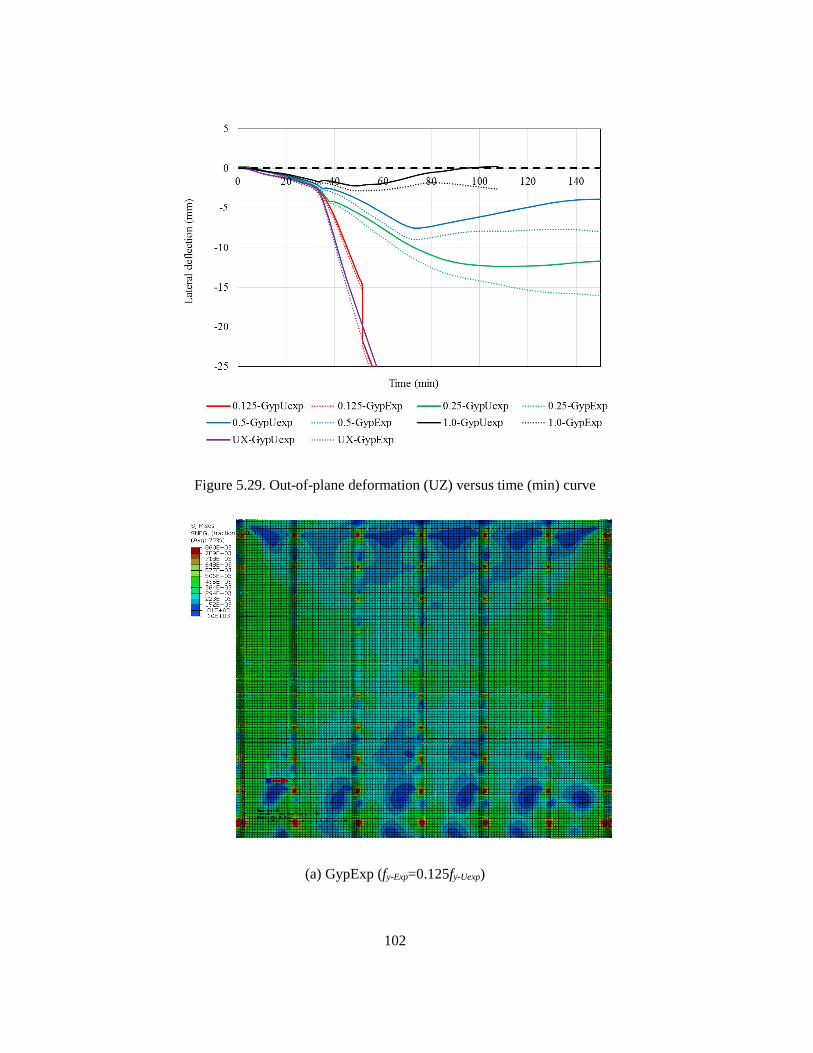
102
Figure 5.29. Out-of-plane deformation (UZ) versus time (min) curve
(a) GypExp (fy-Exp=0.125fy-Uexp)
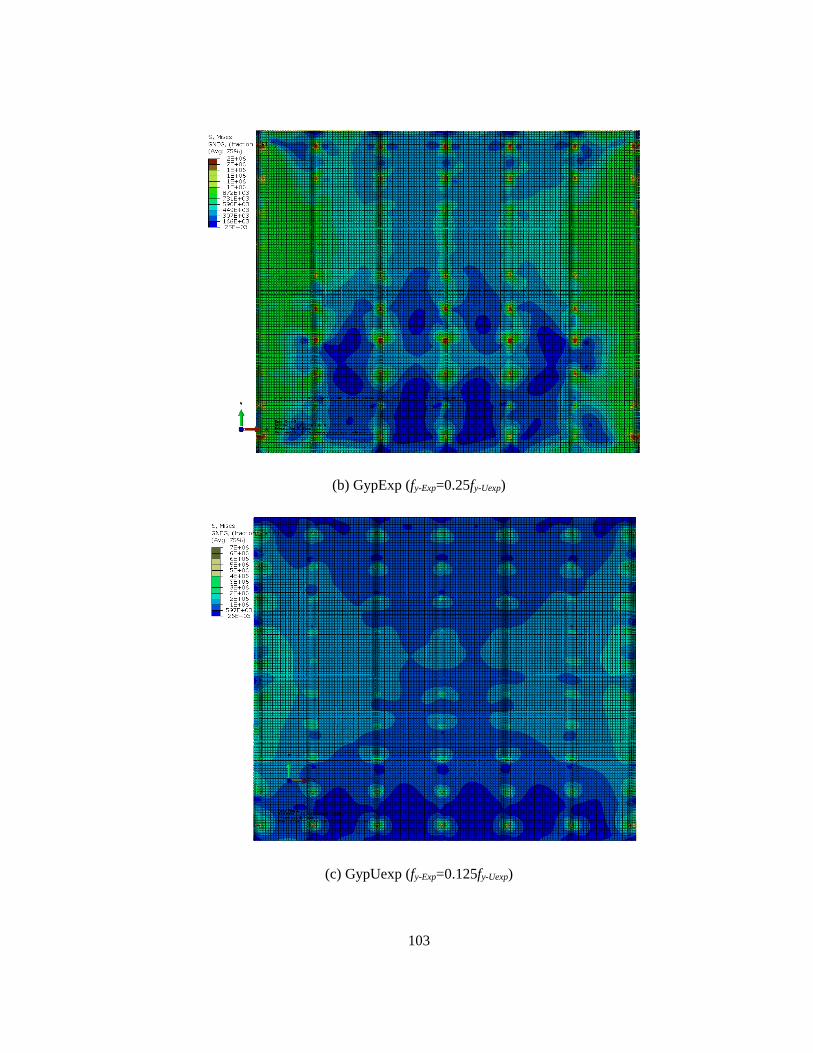
103
(b) GypExp (fy-Exp=0.25fy-Uexp)
(c) GypUexp (fy-Exp=0.125fy-Uexp)
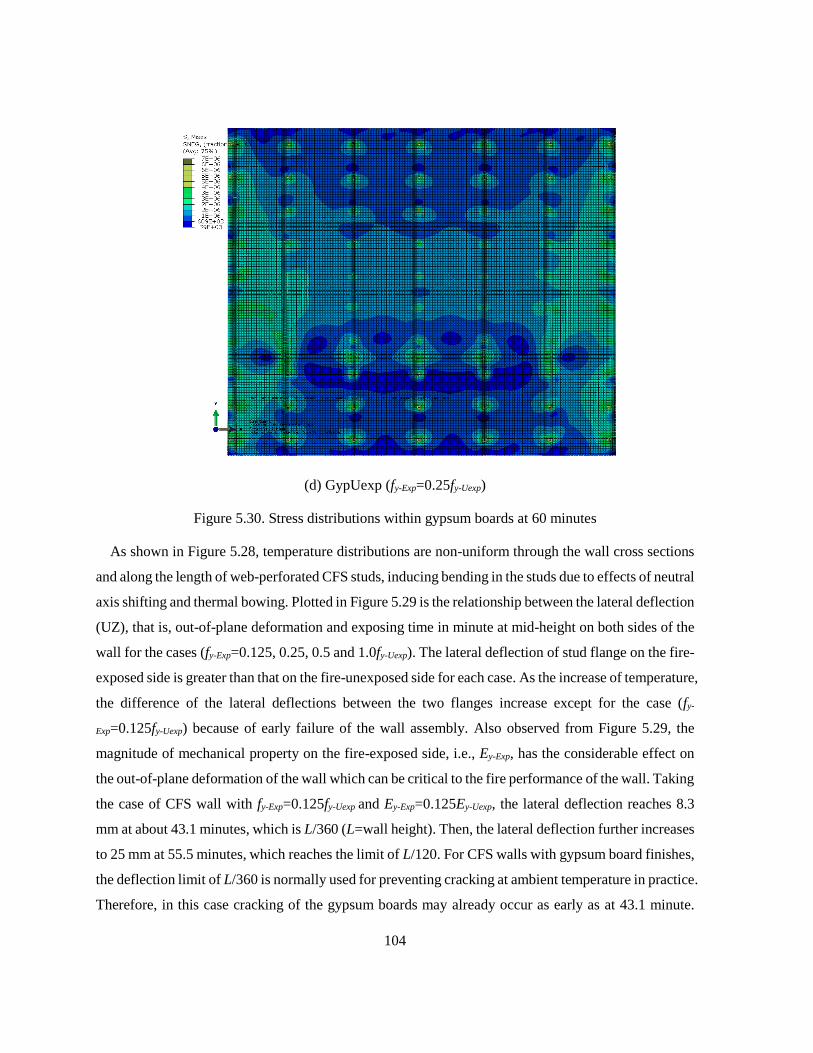
104
(d) GypUexp (fy-Exp=0.25fy-Uexp)
Figure 5.30. Stress distributions within gypsum boards at 60 minutes
As shown in Figure 5.28, temperature distributions are non-uniform through the wall cross sections
and along the length of web-perforated CFS studs, inducing bending in the studs due to effects of neutral
axis shifting and thermal bowing. Plotted in Figure 5.29 is the relationship between the lateral deflection
(UZ), that is, out-of-plane deformation and exposing time in minute at mid-height on both sides of the
wall for the cases (fy-Exp=0.125, 0.25, 0.5 and 1.0fy-Uexp). The lateral deflection of stud flange on the fire-
exposed side is greater than that on the fire-unexposed side for each case. As the increase of temperature,
the difference of the lateral deflections between the two flanges increase except for the case (fy-
Exp=0.125fy-Uexp) because of early failure of the wall assembly. Also observed from Figure 5.29, the
magnitude of mechanical property on the fire-exposed side, i.e., Ey-Exp, has the considerable effect on
the out-of-plane deformation of the wall which can be critical to the fire performance of the wall. Taking
the case of CFS wall with fy-Exp=0.125fy-Uexp and Ey-Exp=0.125Ey-Uexp, the lateral deflection reaches 8.3
mm at about 43.1 minutes, which is L/360 (L=wall height). Then, the lateral deflection further increases
to 25 mm at 55.5 minutes, which reaches the limit of L/120. For CFS walls with gypsum board finishes,
the deflection limit of L/360 is normally used for preventing cracking at ambient temperature in practice.
Therefore, in this case cracking of the gypsum boards may already occur as early as at 43.1 minute.
105
Once cracks developed in the sheathing, the fire may penetrate from the fire-exposed side to the fire-
unexposed side, the failure of the wall can system be imminent. It is also observed the lateral deflection
of the case without directly modelling sheathing (i.e., CFS wall frame model) in stress analysis and
case fy-Exp=0.125fy-Uexp and Ey-Exp=0.125Ey-Uexp are similar and they are considerably different from that
of other cases, which illustrates that the effect of sheathing is not realistically simulated in the CFS wall
frame model.
Shown in Figure 5.30 are the stress distributions within the gypsum boards on the fire-exposed side
(GypExp) and unexposed side (GypExp) at 60 minutes. In the horizontal direction, the stress on the left
and right sides of the sheathing are higher than that at the central region. This is because the wall is
similar to a four edges simply-supported one-way plate subjected to a uniformly distributed load in
which the left and right sides are experienced the larger curvature gradients. Additionally, from Figure
5.30, due to the stiffness of the wall system in the transverse direction of the studs is considerably less
than that of the longitudinal direction, the stress with the sheathing is higher in the region near buckling
failure than that in the other regions on the fire-exposed side due to large deformation of CFS studs,
whereas the stress has a small difference on the fire-unexposed side.
5.7 Conclusions
A sequentially uncoupled 3D FE thermal-stress analysis is proposed for evaluating the performance of
load-bearing CFS walls with C-shape web-perforated studs subjected to the standard fire. The predicted
temperature profiles and the failure time are compared with the tests. It can be concluded in the
following:
Simulating CFS wall fire tests using a single stud model is acceptable. The difference in the
failure time predicted by the single stud model and seven fire tests is within 11%. The nodal
temperature obtained from the heat transfer analysis is critical to the structural response.
Modelling the load-bearing fire wall tests using CFS wall frame can obtained the system-level
response; however, the failure criteria are yet to be determined. From the FEA results obtained
from the CFS wall frame model, it is found that the middle few studs may bear higher loads than
that applied to a single stud and then there are stiffness and force interactions among the CFS
wall studs. Consequently, the single stud model may overestimate the failure time. Thus, the
stiffness and force interactions should be considered in FEA in order to achieve better accuracy.

106
For laterally braced CFS walls, modelling the restraint provided by sheathing by restraining in-
plane lateral displacement is acceptable in case no credible mechanical properties of specific
sheathing materials at elevated temperature. However, in case the mechanical properties are
available, modelling the sheathing using shell element provides more realistic prediction on the
structural response demonstrated in load-bearing wall fire tests. The interaction of force and
stiffness among wall studs found in CFS wall frame model are verified by the CFS wall system
model. Moreover, the failure time cannot be identified in the CFS wall system model.

107
Chapter 6 Extended Design Method Based on AISI S100
6.1 Introduction
Presented in this chapter is a design method to account for the effect of web perforation length on the
fire resistance of studs in load-bearing CFS walls. At elevated temperature, CFS wall studs are
subjected to combined compression and bending. Design calculations should check both cross sections
at the mid-height and at the support of the column. At the mid-height of the column, the bending
moment about the major axis (x-x) is a result of the thermal bowing, neutral axis shift and magnification
effect (P-Δ effect). At the support, the bending moment about the strong axis is caused by a neutral axis
shift only. In previous studies, investigation of the effect of web perforations on the ultimate strength
and failure time of CFS studs at non-uniform temperature is very limited.
The following are included in this chapter:
Investigating the effect of web perforation on the ultimate strength of studs using FEA;
Determining an applicable and simple non-uniform cross-sectional temperature distribution for
CFS studs with web-perforated studs for design purposes;
Proposing a design method based on AISI S100 (2012) that accounts for the effect of web
perforation;
Presenting a design example;
Comparing results between extended design method and FEA.
6.2 Parametric study
A parametric study has been performed to investigate the effect of web perforation length on the
ultimate strength of CFS studs with web perforations in walls subjected to standard fire from one side.
The temperature distribution of CFS wall studs are obtained from heat transfer analysis based on a 600
mm wide CFS wall segment. The segment is sheathed by double layers of 12 mm MgO board on both
sides, and fully insulated by 150 mm thick glass fibre in the cavity. The development of the heat transfer
model and structural model are similar to those in sections 3.4 and 5.4, respectively. The material
properties, including thermal and mechanical properties are the same as in sections 5.3.2 and 5.4.1.

108
6.2.1 Parameters of single CFS stud model
The parameters adopted in this FE study are:
Stud section: C-shape section (150×40×15×1.5);
Length of studs: 3000 mm;
Web perforations: three web perforations spaced 600 mm o.c. along the stud length;
dh=38 mm, Lh = 0, 75, 114, 130, 250, and 380 mm;
Screw spacing: 300 mm o.c.;
Applied axial load: varying from 12 kN to 82 kN
6.2.2 Results and discussions
Shown in Figure 6.1 are the cross-sectional temperature profiles of studs with varying perforation
lengths. The effect of web perforation length on the temperature profiles is consistent with that
discussed in section 4.4.2. Small temperature variations exist within the flange and lip on both hot and
cold sides, but can be assumed to be uniform. The temperature distributions of cross-sections with web
perforations are slightly higher on the hot side and lower on the cold side when compared with solid
sections. As Lh increases, the temperature distribution on the cold side reduces slightly. Plotted in Figure
6.2 is the time dependent temperature curve of the flange-web junctions of the studs (Lh=0 mm). The
temperature gradient within the stud cross section increases with the fire-exposure time.
Illustrated in Figure 6.3 and Figure 6.4 are the comparisons of the cross-sectional yield strength and
elastic modulus for the stud (Lh=0 mm) at elevated temperatures, respectively. The symbols Fy,HF and
Fy,CF are the yield strength of the hot flange and cold flange at elevated temperature; EHF and ECF are
the elastic modulus of the hot flange and cold flange at elevated temperature.
Presented in Figure 6.5 is the fie-exposure time-applied load relationship predicted by the FEA. The
detailed failure times corresponding to the applied axial load can be seen in Appendix B. At a given
applied axial load, the failure time of studs decreases as Lh increases. For studs with Lh=250 and 380
mm, the drop in failure time is much larger when compared with the cases when Lh≤130 mm. For all
the studs with varying Lh, as the applied load reduces, the difference in failure time caused by Lh drops
gradually and eventually diminishes. For instance, when 0 mm<Lh≤130 mm, the following can be
drawn according to Figure 6.5:
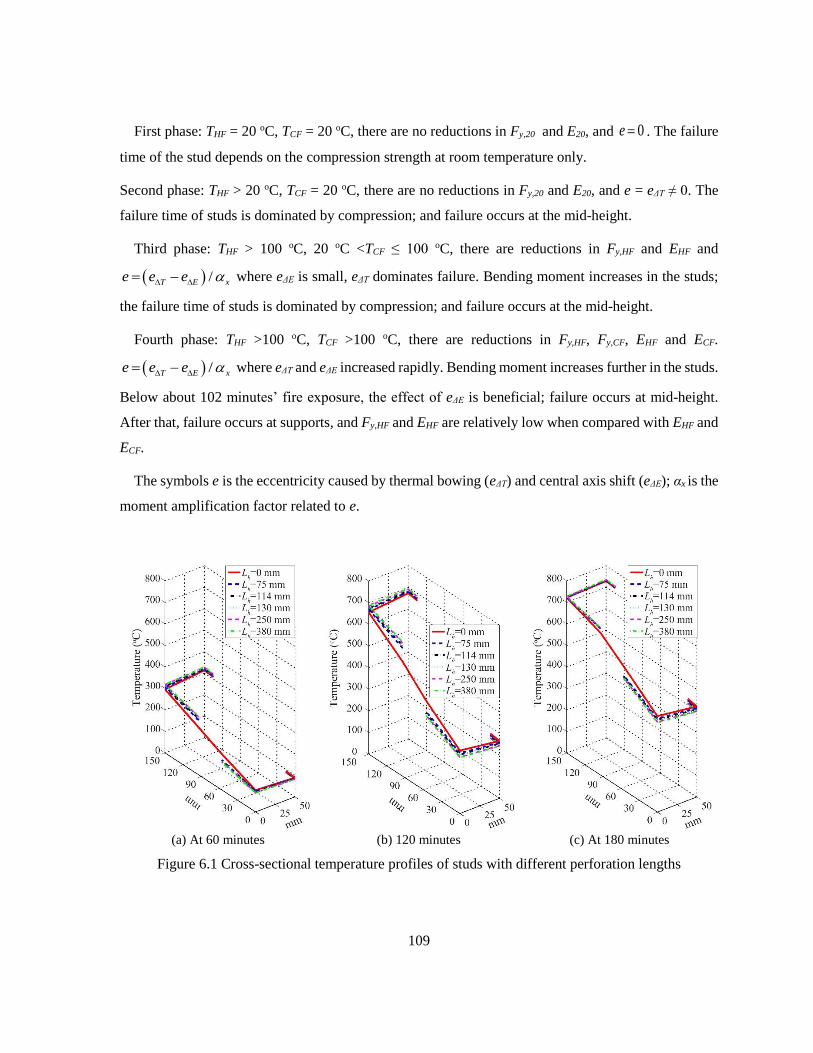
109
First phase: THF = 20 oC, TCF = 20 oC, there are no reductions in Fy,20 and E20, and 0e . The failure
time of the stud depends on the compression strength at room temperature only.
Second phase: THF > 20 oC, TCF = 20 oC, there are no reductions in Fy,20 and E20, and e = eΔT ≠ 0. The
failure time of studs is dominated by compression; and failure occurs at the mid-height.
Third phase: THF > 100 oC, 20 oC <TCF ≤ 100 oC, there are reductions in Fy,HF and EHF and
/T E xe e e where eΔE is small, eΔT dominates failure. Bending moment increases in the studs;
the failure time of studs is dominated by compression; and failure occurs at the mid-height.
Fourth phase: THF >100 oC, TCF >100 oC, there are reductions in Fy,HF, Fy,CF, EHF and ECF.
/T E xe e e where eΔT and eΔE increased rapidly. Bending moment increases further in the studs.
Below about 102 minutes’ fire exposure, the effect of eΔE is beneficial; failure occurs at mid-height.
After that, failure occurs at supports, and Fy,HF and EHF are relatively low when compared with EHF and
ECF.
The symbols e is the eccentricity caused by thermal bowing (eΔT) and central axis shift (eΔE); αx is the
moment amplification factor related to e.
(a) At 60 minutes (b) 120 minutes (c) At 180 minutes
Figure 6.1 Cross-sectional temperature profiles of studs with different perforation lengths

110
Figure 6.2 Time-temperature curve of stud flange-web junctions
Figure 6.3 Comparison of normalized cross-sectional yield strength
CF
HF
0 50 100 150 2000
100
200
300
400
500
600
700
800
900
1000
1100
1200
THF
(oC)
TCF
(oC)
ISO-834
Tem
per
atu
re, T
HF o
r T
CF
Time (min)
Lh=0 mm
Time (min)
0 50 100 150 2000.0
0.2
0.4
0.6
0.8
1.0
Fy,CF
/Fy,20
Fy,HF
/Fy,20
Fy,CF
/Fy,HF
0
1
2
3
4
5
6
7
Fy,
CF/F
y,20 (
or
Fy,
HF/F
y,20)
Fy,
CF/F
y,H
F

111
Figure 6.4 Comparison of normalized cross-sectional elastic modulus
Figure 6.5 Failure time-applied load relationship predicted by FEA
Time (min)
0 50 100 150 2000.0
0.2
0.4
0.6
0.8
1.0
ECF
/E20
EHF
/E20
ECF
/EHF
0
1
2
3
4
5
6
7
EC
F/E
20
(o
r E
HF/E
20)
EC
F/E
HF
Time (min)
0 50 100 150 2000
10
20
30
40
50
60
70
80
90
Cro
ss-s
ecti
onal
tem
per
ature
(oC
)
Com
pre
ssiv
e st
rength
(kN
)
PT,L
h=0,FEA
PT,L
h=75,FEA
PT,L
h=114,FEA
PT,L
h=130,FEA
PT,L
h=250,FEA
PT,L
h=380,FEA
THF
TCF
0
100
200
300
400
500
600
700
800

112
6.3 Extended design equations based on AISI S100
6.3.1 Nominal axial strength
Using the same type of approach as in AISI S100 (2012) for cold-formed steel members at room
temperature, the nominal axial strength, Pn, is calculated in accordance with Eq. (6.1).
n e nP A F (6.1)
The symbol Ae is the effective area assuming uniform compression at elevated temperature and
calculated at buckling stress Fn. The value Ae is the summation of the effective width of all compression
elements calculated at buckling stress Fn, in accordance with Clauses B1 to B4. The average yield stress
for each element at elevated temperature is used to calculate the effective width. For cross sections
without web perforation, the web is considered as a uniformly compressed stiffened element, and the
plate buckling coefficient, k, is taken to be 4 (Clause B2.1(a)). For cross sections with web perforation,
the web is assumed to consist of two unstiffened strips A and B, adjacent to the perforations. The
effective width of each unstiffened strip are determined in accordance with B2.1(a), except that plate
buckling coefficient, k, is be taken to be 0.43, regardless of web perforation length. However, the
presence of web perforations can either decrease or increase the critical buckling stress (El-Sawy &
Nazmy, 2001; Komur & Sonmez, 2008; Maiorana, Pellegrino, & Modena, 2009). The influence of the
length of web perforation and width of the unstiffened strip on k are accounted for in (Moen & Schafer,
2009). The value ki for unstiffened strips A and B are approximated by Eqs. (6.2) and (6.3). The value
ki varies from 0.425 to 0.925. At a given unstiffened strip width, k increases as web perforation length
decreases.
0.95
0.2for / 1, 0.425
/ 0.6h i i
h i
L h kL h
(6.2)
for / 1, 0.925, and or .h i iL h k i A B (6.3)
To better fit the FE results in section 6.2, Eq. (6.2) is modified as in Eq. (6.4).
0.95
0.2for / 1, 0.425
/ ( 2.5 ) 0.6h i i
h i
L h kL h t
(6.4)
where t is the thickness of the web.

113
Correspondingly, the effective width of the unstiffened strip on each side is calculated using Eq.(6.5).
2.5 ; oreffi id h t i A B (6.5)
The buckling stress Fn is calculated as below:
For 1.5c (6.6)
2
,0.658 cy TnF F
(6.7)
For 1.5c (6.8)
,2
0.877y Tn
c
F F
(6.9)
where
,y T
c
e
F
F (6.10)
Fe = minimum of flexural and flexural-torsional buckling stresses calculated in accordance with
Clauses C4.1.1 and C4.1.2, using the weighted average mechanical properties ( ,y TF , TE and TG ) at
elevated temperatures.
,y TF = weighted average yield stress of cross section at elevated temperature.
6.3.2 Nominal flexural strength
In accordance with Clause B2.4, C-Section webs with perforations under stress gradient at room
temperature ignores the effect of Lh and only accounts for dh/h (h=web depth). The effective width of
web can be determined as below:
When dh/h<0.38, the effective widths shall be determined in accordance with Section B2.3(a)
by assuming no hole exists in the web.
When dh/h≥0.38, the effective width shall be determined in accordance with Clause B3.1(a),
assuming the compression portion of the web consists of an unstiffened element adjacent to the
hole.

114
However, at elevated temperature, the bending strength for a cross section with perforations is
associated with both dh and Lh. As discussed in section 6.2.2, for Lh≤130 mm, the effect of web
perforation on the fire resistance of the CFS studs weakens as the cross-sectional temperature increases.
At higher temperature, the bending moment caused by thermal bowing, central axis shift and
magnification effect increase, which relatively reduces the weight of nominal axial strength. However,
for Lh =250 and 380 mm, the fire resistance is largely reduced by the presence of web perforations; thus,
the effect of web perforation should be accounted for. In this study, the extended design equations deal
with Lh≤130 mm only. To simplify calculations, the CFS cross section is assumed to be solid, neglecting
the effect of web perforation.
The CFS wall studs are subjected to combined compression and bending at non-uniform elevated
temperature. The effect on strength of bending moment about the minor axis (y-y axis) caused by
neutral axis shift (eΔE) is small (Zhao et al., 2005), and ignored, as in (Klippstein, 1980; Gerlich et al.,
1996; Ranby, 1999; Kaitila, 2002; Zhao et al., 2005, Gunalan, 2013). Thus, the bending moment about
major axis (x-x axis) is considered only.
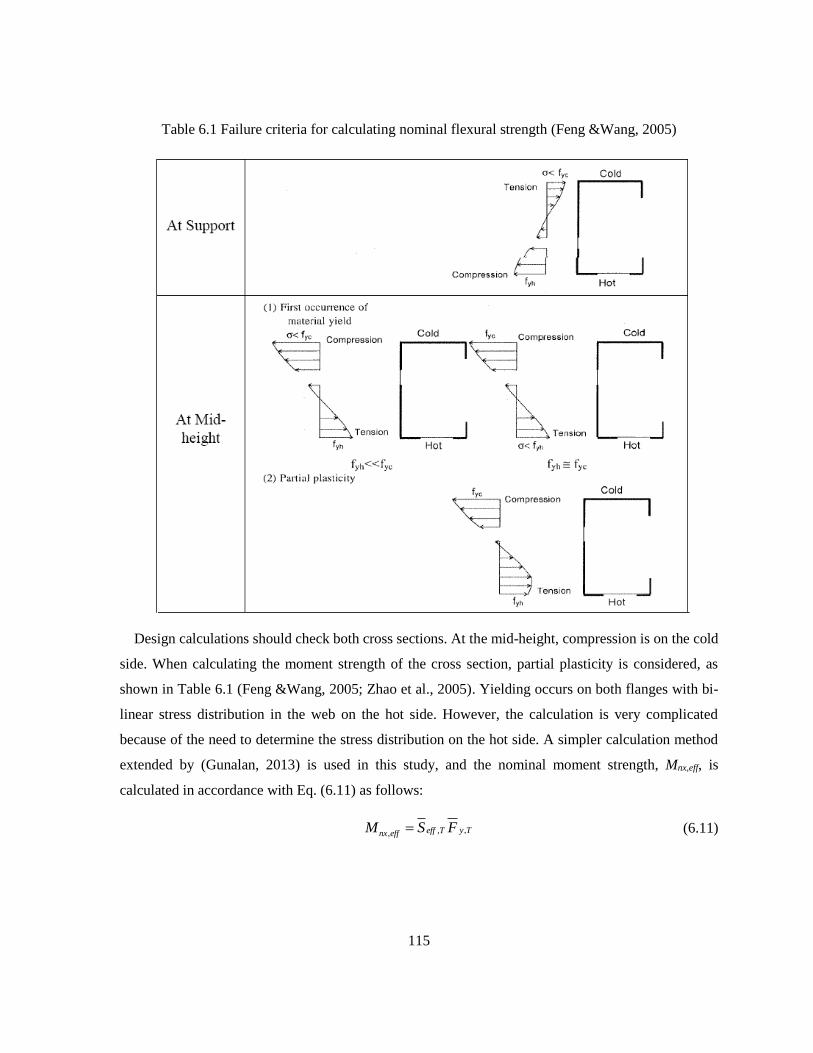
115
Table 6.1 Failure criteria for calculating nominal flexural strength (Feng &Wang, 2005)
Design calculations should check both cross sections. At the mid-height, compression is on the cold
side. When calculating the moment strength of the cross section, partial plasticity is considered, as
shown in Table 6.1 (Feng &Wang, 2005; Zhao et al., 2005). Yielding occurs on both flanges with bi-
linear stress distribution in the web on the hot side. However, the calculation is very complicated
because of the need to determine the stress distribution on the hot side. A simpler calculation method
extended by (Gunalan, 2013) is used in this study, and the nominal moment strength, Mnx,eff, is
calculated in accordance with Eq. (6.11) as follows:
,,, y Teff Tnx effM S F (6.11)

116
At the supports, the hot flange is in compression whereby the first yield of the compression flange is
adopted (Feng and Wang, 2005; Zhao et al., 2005; Gunalan, 2013). Mnx,eff is calculated in accordance
with Eq. (6.12) as follows:
,, ,eff Tnx eff y HFM S F (6.12)
where ,y TF is the weighted average yield stress of the cross section; Fy,HF is the yield stress of the
hot flange; and ,eff TS is the weighted elastic section modulus of the effective section calculated based
on pure bending in accordance with Eq. (6.13), in which ,eff TI and ymax are the weighted average moment
of inertia and maximum distance from the extreme fibre of the flange to the centroid of the cross section.
,
,
max
eff Teff T
IS
y (6.13)
6.3.3 Combined compression and bending
At elevated temperature, the CFS wall studs are subjected to combined compression and bending. The
bending moment about the major axis (x-x axis) is considered only. Based on AISI S100 (2012) for
cold-formed steel structural members at room temperature, the required strengths (factored force and
moments) P and xM are determined using second-order analysis and must satisfy the following
interaction Eq.(6.14):
,
1.0xmx
c n b nx eff x
C MP
P M (6.14)
where
P = required compressive axial strength;
nP = nominal axial resistance;
xM = required flexural strength with respect to centroidal axis;
,nx effM = nominal flexural resistance about centroidal axis;
,c b = resistance factors whose values are taken to be 1 in this case;

117
x = moment amplification factor and can be calculated using 1x
Ex
P
P at elevated temperature,
in whichExP is the elastic buckling load
2
2
xEx
x x
EIP
K L
, where Ix is the moment of inertia of full
unreduced cross section about the x-x axis, Lx is the unbraced length for bending about x-axis, and Kx
is the effective length factor for buckling about the x-x axis; and the detailed calculation forx can be
seen in Appendix C;
Cmx is the coefficient for unequal end moments; for members whose ends are unrestrained, Cmx=1.0.
Design calculations should check both cross sections at the mid-height and at the support of the
column. At the mid-height of the column, the bending moment about the major axis (x-x) is a result of
the thermal bowing, neutral axis shift and magnification effect (P-Δ effect). At the supports, the bending
moment about the strong axis is caused by a neutral axis shift only. The total moment strength xM , due
to thermal bowing, neutral axis shift and their magnification effects, is given by Eqs. (6.15) and (6.16).
At the mid-height:
1
mx T Emxx
x
Ex
C P e eC PeM
P
P
(6.15)
At the supports:
1
mx mx Ex
x
Ex
C Pe C PeM
P
P
(6.16)
where e is the total eccentricity due to neutral axis shift, thermal bowing and their magnification
effects; eΔE is the neutral axis shift in the x-x axis, and eΔT is the thermal bowing at the mid-height
(shown in Figure 6.6). For a simply supported column, eΔT is calculated in accordance with Eq.(6.17)
as follows:
2( )
8
s HF CFT
w
T T Le
b
(6.17)
where L is the column length; THF and TCF are the average temperatures of the hot and cold sides of the
cross section, respectively; αs is the thermal expansion coefficient of steel, taken as in Eurocode 3 Part
1.2 (2005); and bw is the overall depth of the cross section.
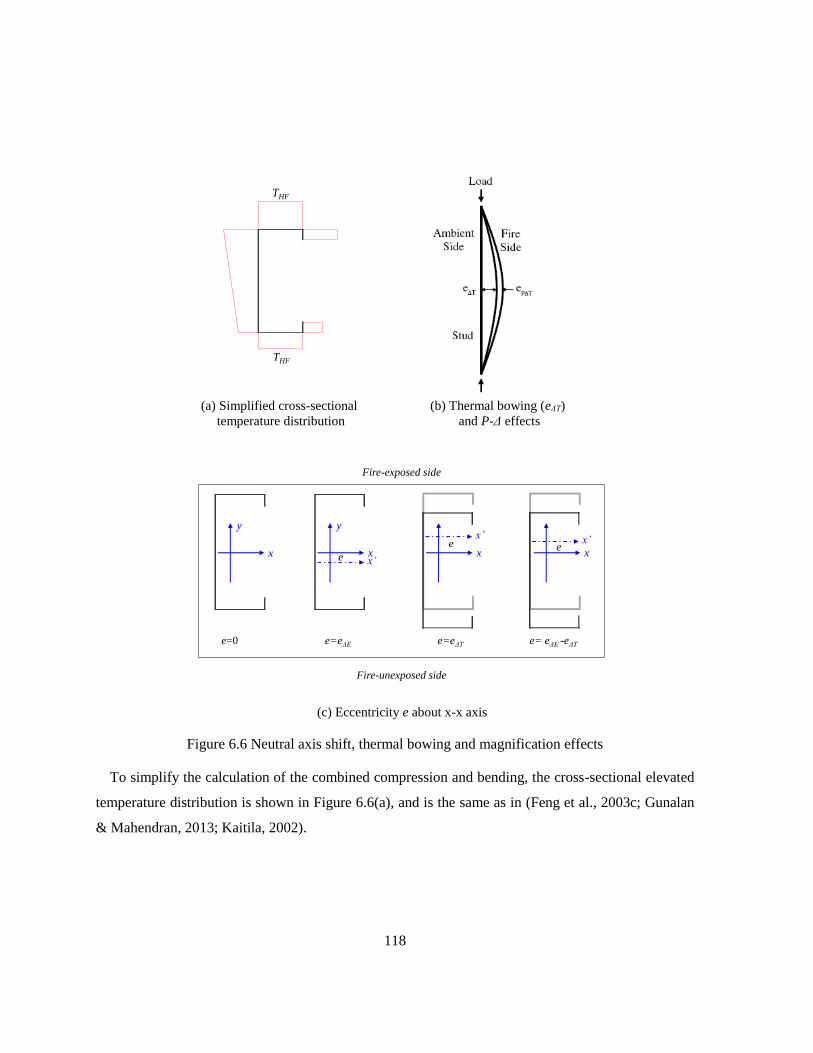
118
(a) Simplified cross-sectional
temperature distribution
(b) Thermal bowing (eΔT)
and P-Δ effects
(c) Eccentricity e about x-x axis
Figure 6.6 Neutral axis shift, thermal bowing and magnification effects
To simplify the calculation of the combined compression and bending, the cross-sectional elevated
temperature distribution is shown in Figure 6.6(a), and is the same as in (Feng et al., 2003c; Gunalan
& Mahendran, 2013; Kaitila, 2002).
THF
THF
x
y
x’
x’ x’
x
y
e=0
x xe
e e
e=eΔE e=eΔT e= eΔE -eΔT
Fire-exposed side
Fire-unexposed side

119
6.4 Comparison of results between extended design method and FEA
When applying the extended calculation method, the compressive strength is calculated based on a
given cross-sectional temperature distribution. This temperature distribution can be determined using
the hot and cold flange temperatures of CFS studs without web perforations, obtained from heat transfer
analysis. A detailed design example is presented in Appendix C, and detailed calculation results
obtained from using the extended design method can be seen in Appendix D. Shown in Figure 6.7 is
an example of the calculated axial strength of the studs at the mid-height and at the support, using the
extended design method. The calculated axial strength equals the minimum of these two values. The
intersection point in this figure separates the studs failing at the mid-height and at the support.
Shown in Figure 6.8 is a comparison of the interaction of compression and bending for the studs
obtained using the extended design method. / _n hP P L i is the ratio of the calculated ultimate axial
strength over the nominal compression strength for the studs with Lh=i mm, i=0, 75, 114 and 130 mm;
and ,( / ) / _x x nx eff hM M L i is the ratio of calculated ultimate flexural strength, considering
magnification effects, over the nominal flexural strength for studs with Lh=i mm. The trend for the
interaction of compression and bending is consistent with that discussed in section 6.2.2. The effect of
web perforation length on the calculated ultimate strength also agrees well with that predicted by the
FEA, as shown in Figure 6.5.
Presented in Figure 6.9 are the stud normalized compressive strengths calculated using the extended
design method with the applied axial loads used in the FEA to obtain the stud failure times. The symbols
, ,hT L i proposedP and , ,hT L i FEAP represent the calculated nominal axial strength or the applied axial load in
the FEA for studs without or with web perforations (i=0, 75, 114 and 130 mm) at 20 oC or elevated
temperature. 20, 0,hL AISIP is the nominal axial strength of the studs without web perforations at 20 oC,
calculated using AISI S100 (2012). 20, 0, ( 73.1 )hL AISIP N is about 9% times lower than
20, 0, ( 82.7 )hL FEAP N , since the former has included the effect of initial geometric imperfection,
eccentricity, residual stress, etc. Thus, the calculated or predicted axial strength is normalized using
20, 0,hL AISIP and 20, 0,hL FEAP , respectively. By doing this, the trends for calculated and predicted results
are comparable. By accounting for the reduction caused by web perforation length in the extended
method, the calculated ultimate strength for studs with perforations is always lower than that for studs

120
without web perforations. For design purposes, this level of accuracy is considered acceptable by
accounting for the complexity of the problem being dealt with and the simplicity of the extended design
method.
Figure 6.7 Calculated ultimate compression strength at mid-height and at support
Figure 6.8 Comparison of interaction of compression and bending
P/P
n_
Lh=
i
_
0 50 100 150 2000.0
0.2
0.4
0.6
0.8
1.0
1.2
At mid-height At support
Time (min)
Lh=130 mm
0 50 100 150 2000.0
0.2
0.4
0.6
0.8
1.0
1.2
P/Pn_L
h=130 M
x/M
nx,eff_L
h=130
P/Pn_L
h=0 M
x/M
nx,eff_L
h=0
Time (min)
Lh=130 mm

121
Figure 6.9 Comparison of axial strength based on extended design method
Time (min)0 50 100 150 200
0.0
0.2
0.4
0.6
0.8
1.0
1.2
0
100
200
300
400
500
600
700
800
FEA, P/Pn_L
h=0 FEA, P/P
n_L
h=75 FEA, P/P
n_L
h=114 FEA, P/P
n_L
h=130
Cal, P/Pn_L
h=0 Cal, P/P
n_L
h=75 Cal, P/P
n_L
h=114 Cal, P/P
n_L
h=130
THF
TCF
Ap
pli
ed a
xia
l lo
ad r
atio
(k
N)
Cro
ss-s
ecti
on
al t
emp
erat
ure
(oC
)
Time (min)
0 10 20 30 40 500.6
0.7
0.8
0.9
1.0
1.1
0
100
200
300
400
500
600
700
800
Detailed view
122
6.5 Conclusions
In this chapter, a design method is extended based on AISI S100 (2012) to evaluate the ultimate strength
for CFS studs in walls subjected to standard fire. Conclusions can be drawn as follows:
The reduction caused by web perforation length is accounted for in the extended method, which
ensures that the calculated ultimate strength for studs with perforations is always lower than that
for studs without web perforations. A plate buckling coefficient, accounting for the web
perforation length and width is introduced to characterize the nominal axial strength. The effect
of web perforation on the nominal flexural bending at elevated temperature is ignored, as is
consistent with AISI S100 (2012) at room temperature. The accuracy is acceptable considering
the complexity of the problem being dealt with and the simplicity of the calculation.
In the extended design equations, the limit of web perforation length is extended from the 114
mm, specified in AISI S100 at room temperature, to 130 mm at non-uniform cross-sectional
elevated temperature. For Lh ≤ 130 mm, the non-uniform cross-sectional temperature distribution
of studs can be adopted as the case of studs without web perforations. The temperature in the
stud web can be assumed to be linear and to have the same slope for the unstiffened strips on
both hot and cold sides. For Lh larger than 250 mm, the effect of web perforation on the ultimate
strength of studs at elevated temperature is amplified when compared with that for studs with Lh
≤ 130 mm.

123
Chapter 7 Conclusions and Future Research
7.1 Conclusions
Cold-formed steel (CFS) load-bearing wall systems are commonly constructed with CFS studs, have a
CFS track connecting their top and bottom, and are lined with one or two layers of sheathing on both
sides. In practice, the CFS studs are perforated in the web to install intermediate braces, or to allow the
passage of electrical, plumbing, and heating service. With the growing interest in performance-based
fire safety design, coupled with the costly and time consuming nature of full-scale testing, engineering
professionals and researchers are increasingly exploring validated fire resistance models and simple
design equations. Several contributions have been made in this study:
7.1.1 Web-perforated CFS C-shape studs at ambient and elevated temperatures
The behaviour of CFS C-shape stub columns at both ambient, uniform and non-uniform elevated
temperatures have been investigated.
The effects of web perforations on the failure mode and ultimate strength of CFS C-shape stub
columns were investigated at ambient temperature. The results show that a web perforation length of
less than 130 mm has negligible effect on the ultimate compressive strength. Thus, the limitation on
the length of web perforations not to exceed 114 mm stated in the effective width method in AISI-S100
(2012) may be extended to 130 mm. Additionally, the DSM approach in AISI S100 (2012) accurately
assesses the compressive strength of the stub column specimens.
Finite element structural models for web-perforated CFS C-shape columns at ambient and
uniform elevated temperature (22 oC to 700 oC) have been developed, with validity of this model
validated by stub columns tests. A parametric study of CFS C-shape slender columns with non-
uniform cross-sectional temperatures distribution found that the length of web perforations has
small effect on failure time.
124
7.1.2 Finite element thermal modelling and analysis
Heat transfer analysis has been conducted to investigate the thermal performance of CFS walls with
web-perforated CFS studs under standard fire. Both cavity insulated and non-insulated CFS walls were
considered. The extended 3D finite element thermal models were validated using data from full-scale
fire tests. Unlike 1D and 2D models adopted by previous studies, the 3D models can simulate the
temperature variation within the stud cross section and along the stud length caused by web
perforations.
For non-insulated CFS walls, web perforations in the CFS studs have negligible influence on the
temperature distribution through the cross sections and along the stud length. The heat transfer
within the cavity dominates by radiation, far overweighing that by conduction, and is blocked by
web perforations.
For insulated CFS walls with web perforations, the temperature distribution is no longer linear
but almost bilinear along the web depth. The largest temperature gradient in the CFS studs occurs
at the cross section located in the center of the web perforation along the stud length. The larger
temperature gradient may induce local bending around web perforations, which can be
detrimental to the stability of the studs and integrity of the CFS walls. Therefore, it may be non-
conservative to neglect the web perforations in CFS wall studs when evaluating wall
performance at elevated temperature.
7.1.3 Finite element structural modelling and analysis
A sequentially uncoupled 3D FE thermal-stress analysis has been extended for evaluating the
performance of load-bearing CFS walls with C-shape web-perforated studs subjected to the standard
fire.
Simulating CFS wall fire tests using a single stud model is acceptable. The difference in the
failure time predicted by the single stud model and seven fire tests is within 11%. The nodal
temperature obtained from the heat transfer analysis is critical to the structural response.
Modelling the load-bearing fire wall tests using a CFS wall frame can obtain a system-level
response; however, the failure criteria are yet to be determined. From the FEA results obtained
from the CFS wall frame model, it is found that the middle few studs may bear much higher
loads than that applied to a single stud, due to stiffness and force interactions among the CFS
125
wall studs. Consequently, the single stud model may overestimate the failure time. Thus, stiffness
and force interactions should be considered in FEA so as to achieve better accuracy. For laterally
braced CFS walls, modelling the restraint provided by sheathing by restraining in-plane lateral
displacement is acceptable, if no credible mechanical properties exist for specific sheathing
materials at elevated temperature. However, if the mechanical properties are available, modelling
the sheathing using shell element provides more realistic prediction of the structural response
demonstrated in load-bearing wall fire tests. The interaction of force and stiffness among wall
studs found in the CFS wall frame model have been verified by the CFS wall system model. The
failure time cannot be identified in this model.
7.1.4 Extended design method based on AISI S100
Design calculations should check both cross sections at mid-height and at supports of the column. At
the mid-height of the column, the bending moment about the major axis (x-x) is a result of the thermal
bowing, neutral axis shift and magnification effect (P-Δ effect). At the support, the bending moment
about the strong axis is caused by neutral axis shift only.
A parametric study using FEA is conducted to investigate the effect of web perforation on the
ultimate strength of studs. The effect of web perforations longer than 250 mm on the ultimate
strength of studs at elevated temperature is amplified when compared with that for studs of
Lh≤130 mm.
For design purposes, when Lh≤130 mm, the non-uniform cross-sectional temperature distribution
of studs can be adopted, just as in the case of studs without web perforations. The temperature
in the stud web can be assumed to be linear and have the same slope for the unstiffened strips on
both hot and cold sides.
The reduction caused by web perforation length is accounted for in the extended method, which
ensures that the calculated ultimate strength for studs with perforations is always lower than that
for studs without web perforations. A design method has been extended based on the effective
width method in AISI S100 (2012) to evaluate the ultimate strength of CFS studs in walls
subjected to standard fire. A plate buckling coefficient, associated with web perforation length
and width, has been introduced to characterize the nominal axial strength. The effect of web
perforation on the nominal flexural bending at elevated temperature is ignored, an approach
consistent with that stipulated in AISI S100 (2012) at room temperature. The accuracy is

126
acceptable considering the complexity of the problem being dealt with and the simplicity of the
calculation. In the extended design equations, the limit of web perforation length is extended
from 114 mm, specified in AISI S100 at room temperature, to 130 mm at non-uniform cross-
sectional elevated temperature.
7.2 Future research
Several interesting future research topics arose from the experiments, sequentially uncoupled finite
element thermal-stress analysis, and design method extended in this thesis. The major points for future
study, organized by research topic, are listed below.
Web-perforated CFS C-shape studs at ambient and elevated temperatures (Chapter 3)
Conducting experimental studies of web-perforated C-shape studs at uniform and non-uniform
elevated temperatures to study their structural responses.
Thermal modelling and analysis (Chapter 4)
Improving the accuracy of heat transfer analysis by quantifying the thermal properties of
sheathing materials, i.e., gypsum board (Type X and Type C) and MgO board via lab testing;
Improving accuracy by simulating the effect of screws, sheathing joints, gypsum board cracking
and spalling on temperature distributions of CFS walls;
Investigating how a variety of web perforation sizes (widths, lengths), shapes, arrangements, etc.,
in CFS studs affect the structural performance of load-bearing CFS walls;
Developing a simplified numerical heat transfer model to predict the cross-sectional temperature
distribution of studs in CFS walls for engineering practice.
127
Finite element structural modelling and analysis (Chapter 5)
Performing additional validation of the CFS wall stud model, CFS wall frame model and CFS
wall system model using academically oriented full-scale fire tests on load-bearing CFS walls
with web-perforated studs;
Determining the failure criteria of the CFS wall frame model and CFS wall system model by
further investigating the stiffness and force interactions among the CFS wall studs;
Improving the accuracy of the CFS wall system model by quantifying the mechanical properties
of sheathing materials, i.e., gypsum board (Type X and Type C) and MgO board via lab testing;
Improving the accuracy of the CFS wall system model by modelling the effects of screws,
sheathing joints, gypsum board cracking and spalling, and boundary conditions between loading
beam and top track on the structural response of CFS walls;
Investigating how a variety of web perforation sizes (widths, lengths), shapes, arrangements, etc.,
in CFS studs affect the structural performance of load-bearing CFS walls.
Extended design method based on AISI S100 (Chapter 6)
Validating the extended design method in this study with a variety of full-scale fire test results;
Extending the extended design method to account for a variety of web perforation sizes, both by
width and length;
Incorporating a coefficient into the extended equations by considering how stiffness and force
interactions among the CFS wall studs affect the ultimate strength and failure time of CFS walls;
Proposing a design method based on DSM approach, in addition to EWM method in this study,
for CFS studs with non-uniform cross-sectional elevated temperature distribution.
128
Bibliography
ABAQUS (2012). ABAQUS/standard (Version 6.12 ed.), ABAQUS Inc., http://www.simulia.com/,
Providence, RI.
AISI-S100. (2012). North American Specification for the Design of Cold-formed Steel Structural
Members, American Iron and Steel Institute, Washington, D.C., United States.
Alfawakhiri, F. (2002). Behaviour of cold-formed-steel-framed walls and floors in standard fire
resistance tests (Doctoral dissertation), Carleton University, Ottawa, Canada.
Alfawakhiri, F., Sultan, M. A., & MacKinnon, D. H. (1999). Fire resistance of loadbearing steel-stud
walls protected with gypsum board: A review. Fire Technology, 35(4), 308-335.
Abreu, J. C. B., Vieira, L. M., Abu-Hamd, M. H., & Schafer, B. W. (2014). Review: Development of
performance-based fire design for cold-formed steel. Fire Science Reviews, 3(1).
AS 1530.4. (2005). Methods for fire tests on building materials, components and structures. Part 4:
Fire-resistance test of elements of construction, Australian Standard, Sydney, Australia.
BS EN 1993-1-2. (2005). Design of steel structures - Part 1-2: General rules - Structural fire design,
European Committee for Standardization, Brussels, Belgium.
Chen, W., Ye, J., Bai, Y., & Zhao, X. L. (2013). Thermal and mechanical modeling of load-bearing
cold-formed steel wall systems in fire. Journal of Structural Engineering, 140(8), A4013002-1-
A4013002-13.

129
Chen, W., Ye, J., Bai, Y., & Zhao, X. (2012). Full-scale fire experiments on load-bearing cold-formed
steel walls lined with different panels. Journal of Constructional Steel Research, 79, 242-254.
Clancy, P. (1999). Time and probability of failure of timber framed walls in fire (Doctoral dissertation),
Victoria University of Technology, Melbourne, Australia.
Collier, P. (1996). A model for predicting the fire-resisting performance of small-scale cavity walls in
realistic fires. Fire Technology, 32(2), 120-136.
El-Sawy, K. M., & Nazmy, A. S. (2001). Effect of aspect ratio on the elastic buckling of uniaxially
loaded plates with eccentric holes. Thin-Walled Structures, 39(12), 983-998.
Feng, M., Wang, Y. C., & Davies, J. M. (2003a). Structural behaviour of cold-formed thin-walled short
steel channel columns at elevated temperatures. Part 2: Design calculations and numerical analysis.
Thin-Walled Structures, 41(6), 571-594.
Feng, M., Wang, Y. C., & Davies, J. M. (2003b). Thermal performance of cold-formed thin-walled
steel panel systems in fire. Fire Safety Journal, 38(4), 365-394.
Feng, M., Wang, Y. C., & Davies, J. M. (2003c). Axial strength of cold-formed thin-walled steel
channels under non-uniform temperatures in fire. Fire Safety Journal, 38(8), 679-707.
Feng, M., Wang, Y., & Davies, J. (2003d). Structural behaviour of cold-formed thin-walled short steel
channel columns at elevated temperatures. Part 1: Experiments. Thin-Walled Structures, 41(6),
543-570.

130
Feng, M., Wang, Y. C., & Davies, J. M. (2004). A numerical imperfection sensitivity study of cold-
formed thin-walled tubular steel columns at uniform elevated temperatures. Thin-Walled
Structures, 42(4), 533-555.
Feng, M., & Wang, Y. C. (2005). An analysis of the structural behaviour of axially loaded full-scale
cold-formed thin-walled steel structural panels tested under fire conditions. Thin-Walled
Structures, 43(2), 291-332.
GB/T228. (2010). Metallic materials. Tensile testing. Part 1: Method of test at room temperature,
Standardization Administration of the People’s Republic of China, Beijing, China.
Gerlich, J. T., Collier, P. C. R., & Buchanan, A. H. (1996). Design of light steel-framed walls for fire
resistance. Fire and Materials, 20(2), 79-96.
Gunalan, S., & Mahendran, M. (2013). Finite element modelling of load bearing cold-formed steel wall
systems under fire conditions. Engineering Structures, 56, 1007-1027.
Gunawan, L. (2011). Numerical models to simulate the thermal performance of LSF wall panels
(Master's thesis), Queensland University of Technology, Brisbane, Australia.
ISO 834-1 (1999). Fire-resistance tests - Elements of building construction - Part 1: General
requirements, International Standard Organization.
Kaitila, O. (2002). Finite element modelling of cold-formed steel members at high temperatures
(Licentiate thesis), Helsinki University of Technology, Espoo, Finland.
131
Keerthan, P., & Mahendran, M. (2012). Numerical modelling of non-load-bearing light gauge cold-
formed steel frame walls under fire conditions. Journal of Fire Sciences, 0(0), 1-29.
Keerthan, P., & Mahendran, M. (2013). Thermal performance of composite panels under fire conditions
using numerical studies: Plasterboards, rockwool, glass fibre and cellulose insulations. Fire
Technology, 49(2), 329-356.
Klippstein, K. H. (1980). Behavior of cold-formed steel studs in fire tests, American Iron and Steel
Institute, Washington, D.C., United States.
Kodur, V. R., & Sultan, M. A. (2001). Factors governing fire resistance of loadbearing steel stud walls.
Proceedings of 5th AOSFST International Conference, Newcastle, Australia, 1-2.
Kolarkar, P. (2010). Structural and thermal performance of cold-formed steel stud wall systems under
fire conditions (Doctoral dissertation), Queensland University of Technology, Brisbane, Australia.
Komur, M. A., & Sonmez, M. (2008). Elastic buckling of rectangular plates under linearly varying in-
plane normal load with a circular cutout. Mechanics Research Communications, 35(6), 361-371.
Li, Z., & Schafer, B. (2010). Application of the finite strip method in cold-formed steel member design.
Journal of Constructional Steel Research, 66(8), 971-980.
Maiorana, E., Pellegrino, C., & Modena, C. (2009). Elastic stability of plates with circular and
rectangular holes subjected to axial compression and bending moment. Thin-Walled Structures,
47(3), 241-255.
132
Mecozzi, E., & Zhao, B. (2005). Development of stress-strain relationships of cold-formed lightweight
steel at elevated temperatures. Proceedings of the Eurosteel Conference, Maastricht, The
Netherlands, 41-49.
Mehaffey, J., Cuerrier, P., & Carisse, G. (1994). A model for predicting heat transfer through gypsum‐
board/wood‐stud walls exposed to fire. Fire and Materials, 18(5), 297-305.
Moen, C. D., & Schafer, B. W. (2009). Elastic buckling of cold-formed steel columns and beams with
holes. Engineering Structures, 31(12), 2812-2824.
Ranby, A. (1999). Structural fire design of thin walled steel sections (Licentiate thesis), Lulea
University of Technology, Stockholm, Sweden.
Schafer, B., & Ádány, S. (2006). Buckling analysis of cold-formed steel members using CUFSM:
Conventional and constrained finite strip methods. Eighteenth International Specialty Conference
on Cold-Formed Steel Structures, Orlando, Florida, United States. 39-54.
Shahbazian, A., & Wang, Y. C. (2011). Calculating the global buckling resistance of thin-walled steel
members with uniform and non-uniform elevated temperatures under axial compression. Thin-
Walled Structures, 49(11), 1415-1428.
Shahbazian, A., & Wang, Y. C. (2013). A simplified approach for calculating temperatures in axially
loaded cold-formed thin-walled steel studs in wall panel assemblies exposed to fire from one side.
Thin-Walled Structures, 64, 60-72.
Shahbazian, A., & Wang, Y. C. (2014). A fire resistance design method for thin-walled steel studs in
wall panel constructions exposed to parametric fires. Thin-Walled Structures, 77, 67-76.
133
Sultan, M. A. (1996). A model for predicting heat transfer through noninsulated unloaded steel-stud
gypsum board wall assemblies exposed to fire. Fire Technology, 32(3), 239-259.
Sultan, M. A., Alfawakhiri, F., & Benichou, N. (2001). A model for predicting heat transfer through
insulated steel-stud wall assemblies exposed to fire. Fire and Materials 2001 International
Conference, San Francisco, 495-506.
Xu, L. (2011). Internal report of W-IBS system load bearing wall fire test, Worthington construction
group, Cleveland, United States.
Xu, L., Shi, Y., &Yang, S. (2014). Compressive Strength of Cold-formed Steel C-shape Columns with
Slotted Holes. Proceedings of 22nd Specialty Conference on Cold-Formed Steel Structures, St
Louis, United States.
Yang, S., & Xu, L. (2016). 3D FEA of load-bearing cold-formed steel wall systems with web-perforated
studs subjected to standard fire. Proceeding of 9th International Conference on Structures in Fire,
Princeton, New Jersey, United States, 400-407.
Yu, C., & Schafer, B. W. (2007). Effect of longitudinal stress gradients on elastic buckling of thin plates.
Journal of Engineering Mechanics, 133(4), 452-463.
Moen, C. D., & Schafer, B. W. (2009). Elastic buckling of thin plates with holes in compression or
bending. Thin-Walled Structures, 47(12), 1597-1607.
Zhao, B., Kruppa, J., Renaud, C., O'Connor, M., Mecozzi, E., Apiazu, W., . . . Salmi, P. (2005).
Calculation rules of lightweight steel sections in fire situations (No. 21426), European
Commission, Luxembourg.
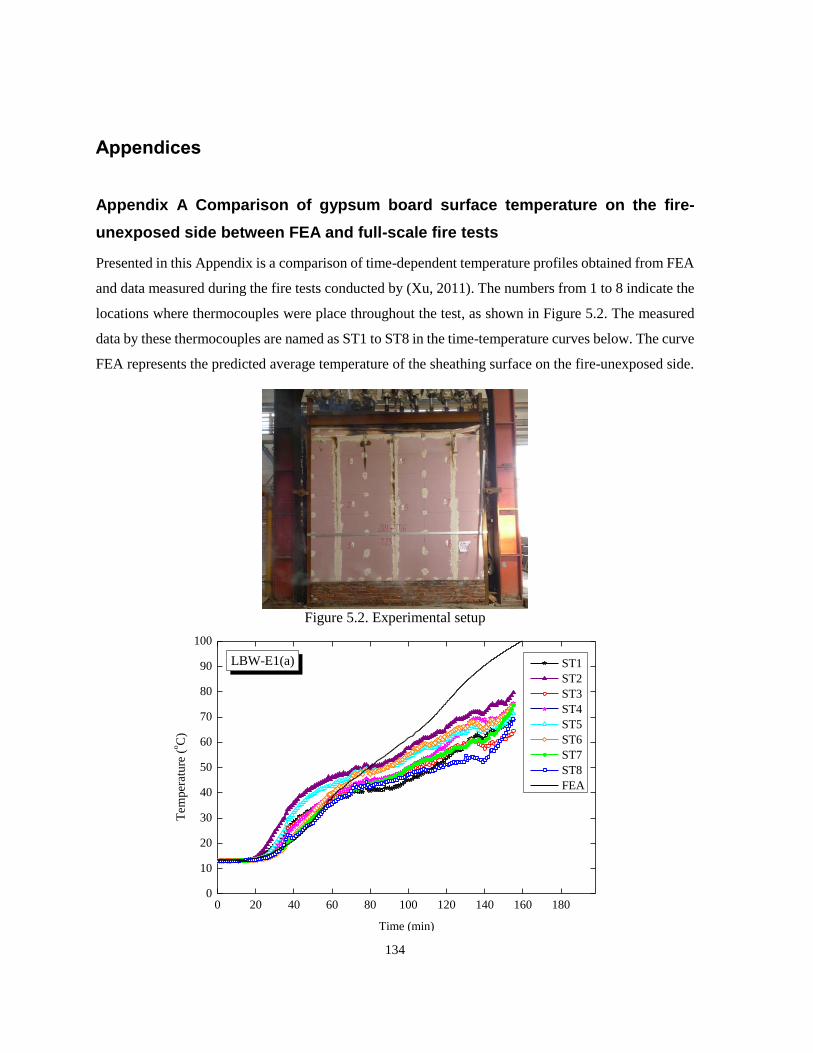
134
Appendices
Appendix A Comparison of gypsum board surface temperature on the fire-
unexposed side between FEA and full-scale fire tests
Presented in this Appendix is a comparison of time-dependent temperature profiles obtained from FEA
and data measured during the fire tests conducted by (Xu, 2011). The numbers from 1 to 8 indicate the
locations where thermocouples were place throughout the test, as shown in Figure 5.2. The measured
data by these thermocouples are named as ST1 to ST8 in the time-temperature curves below. The curve
FEA represents the predicted average temperature of the sheathing surface on the fire-unexposed side.
Figure 5.2. Experimental setup
0 20 40 60 80 100 120 140 160 1800
10
20
30
40
50
60
70
80
90
100
Tem
per
ature
(oC
)
Time (min)
ST1
ST2
ST3
ST4
ST5
ST6
ST7
ST8
FEA
LBW-E1(a)
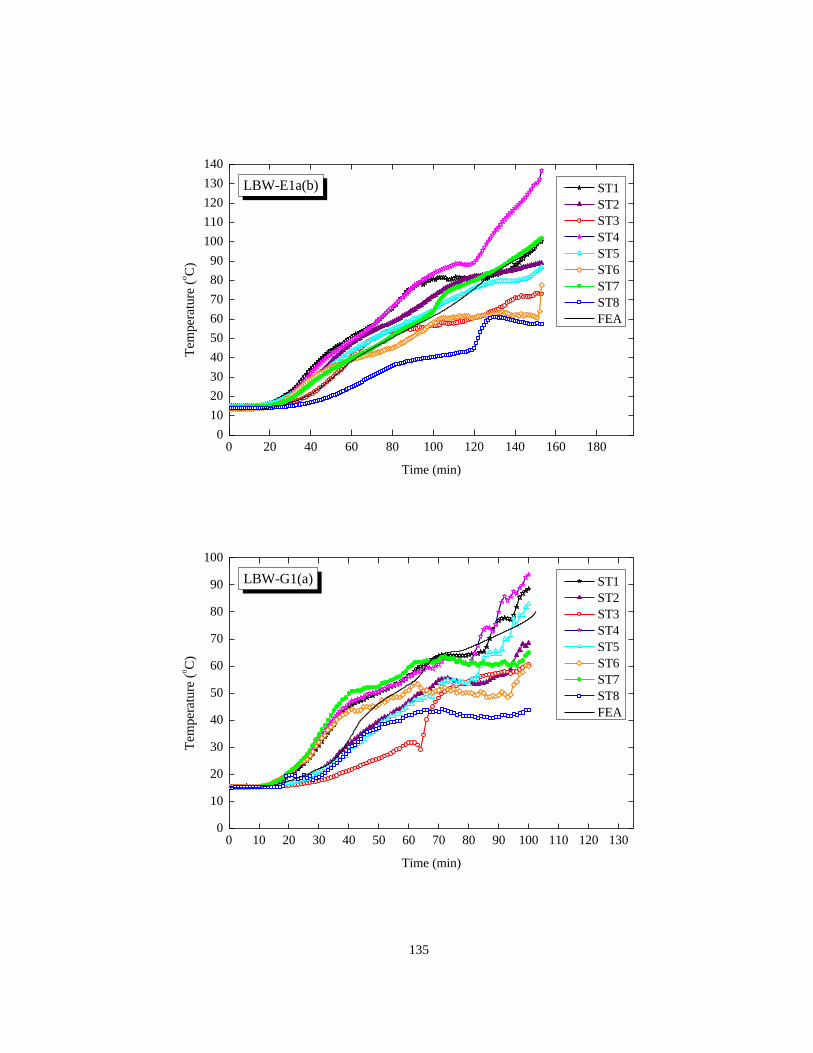
135
0 20 40 60 80 100 120 140 160 1800
10
20
30
40
50
60
70
80
90
100
110
120
130
140
Tem
per
ature
(oC
)
Time (min)
ST1
ST2
ST3
ST4
ST5
ST6
ST7
ST8
FEA
LBW-E1a(b)
0 10 20 30 40 50 60 70 80 90 100 110 120 1300
10
20
30
40
50
60
70
80
90
100
Tem
per
ature
(oC
)
Time (min)
ST1
ST2
ST3
ST4
ST5
ST6
ST7
ST8
FEA
LBW-G1(a)
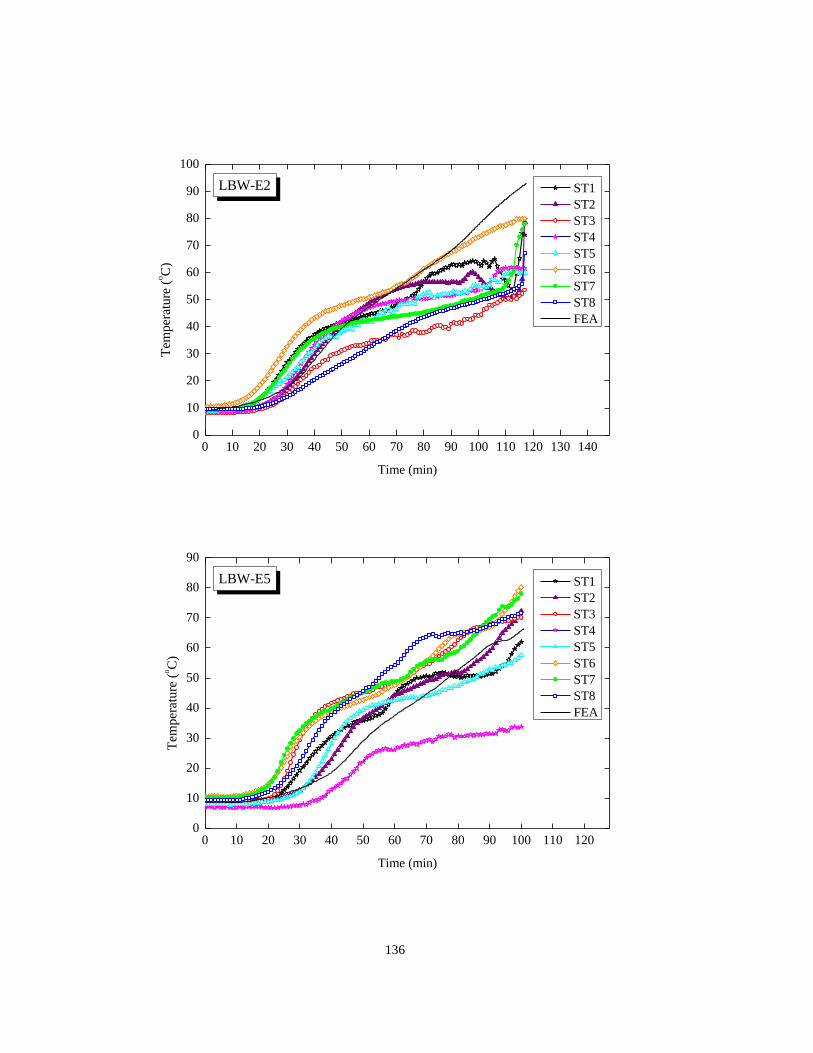
136
0 10 20 30 40 50 60 70 80 90 100 110 120 130 1400
10
20
30
40
50
60
70
80
90
100
Tem
per
ature
(oC
)
Time (min)
ST1
ST2
ST3
ST4
ST5
ST6
ST7
ST8
FEA
LBW-E2
0 10 20 30 40 50 60 70 80 90 100 110 1200
10
20
30
40
50
60
70
80
90
Tem
per
ature
(oC
)
Time (min)
ST1
ST2
ST3
ST4
ST5
ST6
ST7
ST8
FEA
LBW-E5

137
0 10 20 30 40 50 60 70 80
20
30
40
50
60
70
80
Tem
per
ature
(oC
)
Time (min)
ST1
ST2
ST3
ST4
ST5
ST6
ST7
ST8
FEA
LBW-2
0 10 20 30 40 50 60 70 80 90 100
20
30
40
50
60
70
80
90
Tem
per
ature
(oC
)
Time (min)
ST1
ST2
ST3
ST4
ST5
ST6
ST7
ST8
FEA
LBW-3
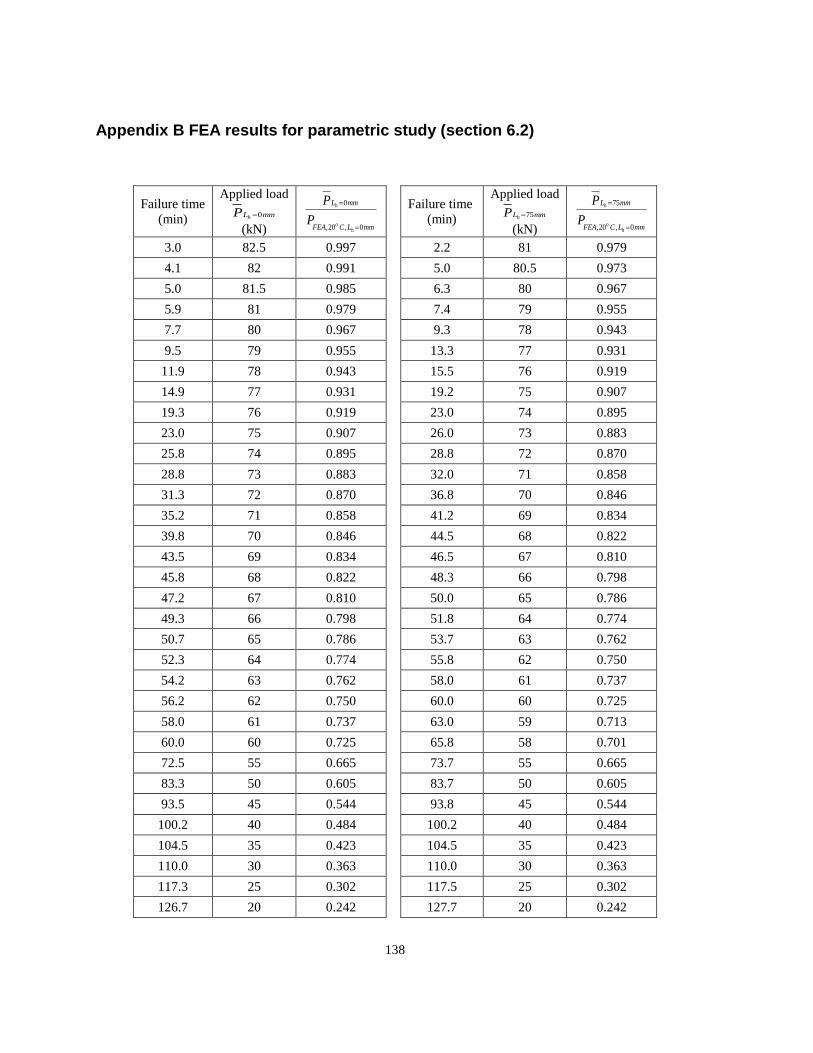
138
Appendix B FEA results for parametric study (section 6.2)
Failure time
(min)
Applied load
0hL mmP
(kN)
0
,20 , 0
h
oh
L mm
FEA C L mm
P
P
Failure time
(min)
Applied load
75hL mmP
(kN)
75
,20 , 0
h
oh
L mm
FEA C L mm
P
P
3.0 82.5 0.997 2.2 81 0.979
4.1 82 0.991 5.0 80.5 0.973
5.0 81.5 0.985 6.3 80 0.967
5.9 81 0.979 7.4 79 0.955
7.7 80 0.967 9.3 78 0.943
9.5 79 0.955 13.3 77 0.931
11.9 78 0.943 15.5 76 0.919
14.9 77 0.931 19.2 75 0.907
19.3 76 0.919 23.0 74 0.895
23.0 75 0.907 26.0 73 0.883
25.8 74 0.895 28.8 72 0.870
28.8 73 0.883 32.0 71 0.858
31.3 72 0.870 36.8 70 0.846
35.2 71 0.858 41.2 69 0.834
39.8 70 0.846 44.5 68 0.822
43.5 69 0.834 46.5 67 0.810
45.8 68 0.822 48.3 66 0.798
47.2 67 0.810 50.0 65 0.786
49.3 66 0.798 51.8 64 0.774
50.7 65 0.786 53.7 63 0.762
52.3 64 0.774 55.8 62 0.750
54.2 63 0.762 58.0 61 0.737
56.2 62 0.750 60.0 60 0.725
58.0 61 0.737 63.0 59 0.713
60.0 60 0.725 65.8 58 0.701
72.5 55 0.665 73.7 55 0.665
83.3 50 0.605 83.7 50 0.605
93.5 45 0.544 93.8 45 0.544
100.2 40 0.484 100.2 40 0.484
104.5 35 0.423 104.5 35 0.423
110.0 30 0.363 110.0 30 0.363
117.3 25 0.302 117.5 25 0.302
126.7 20 0.242 127.7 20 0.242

139
129.0 19 0.230 130.2 19 0.230
131.5 18 0.218 133.0 18 0.218
134.8 17 0.206 137.2 17 0.206
140.0 16 0.193 143.5 16 0.193
147.8 15 0.181 153.2 15 0.181
160.5 14 0.169 166.7 14 0.169
178.3 13 0.157 185.0 13 0.157
Failure time
(min)
Applied load
114hL mmP
(kN)
114
,20 , 0
h
oh
L mm
FEA C L mm
P
P
Time (min)
Applied load
130hL mmP
(kN)
130
,20 , 0
h
oh
L mm
FEA C L mm
P
P
3.0 82.5 0.997 2.2 81 0.979
4.1 82 0.991 5.0 80.5 0.973
5.0 81.5 0.985 6.3 80 0.967
5.9 81 0.979 7.4 79 0.955
7.7 80 0.967 9.3 78 0.943
9.5 79 0.955 13.3 77 0.931
11.9 78 0.943 15.5 76 0.919
14.9 77 0.931 19.2 75 0.907
19.3 76 0.919 23.0 74 0.895
23.0 75 0.907 26.0 73 0.883
25.8 74 0.895 28.8 72 0.870
28.8 73 0.883 32.0 71 0.858
31.3 72 0.870 36.8 70 0.846
35.2 71 0.858 41.2 69 0.834
39.8 70 0.846 44.5 68 0.822
43.5 69 0.834 46.5 67 0.810
45.8 68 0.822 48.3 66 0.798
47.2 67 0.810 50.0 65 0.786
49.3 66 0.798 51.8 64 0.774
50.7 65 0.786 53.7 63 0.762
52.3 64 0.774 55.8 62 0.750
54.2 63 0.762 58.0 61 0.737
56.2 62 0.750 60.0 60 0.725
58.0 61 0.737 63.0 59 0.713
60.0 60 0.725 65.8 58 0.701
72.5 55 0.665 73.7 55 0.665

140
83.3 50 0.605 83.7 50 0.605
93.5 45 0.544 93.8 45 0.544
100.2 40 0.484 100.2 40 0.484
104.5 35 0.423 104.5 35 0.423
110.0 30 0.363 110.0 30 0.363
117.3 25 0.302 117.5 25 0.302
126.7 20 0.242 127.7 20 0.242
129.0 19 0.230 130.2 19 0.230
131.5 18 0.218 133.0 18 0.218
134.8 17 0.206 137.2 17 0.206
140.0 16 0.193 143.5 16 0.193
147.8 15 0.181 153.2 15 0.181
160.5 14 0.169 166.7 14 0.169
178.3 13 0.157 185.0 13 0.157
Failure time
(min)
Applied load
250hL mmP
(kN)
250
,20 , 0
h
oh
L mm
FEA C L mm
P
P
Failure time
(min)
Applied load
380hL mmP
(kN)
380
,20 , 0
h
oh
L mm
FEA C L mm
P
P
4.4 71 0.858 2.18 66 0.798
7.3 70 0.846 5.35 65 0.786
10.0 69 0.834 7.63 64 0.774
13.5 68 0.822 10.18 63 0.762
18.3 67 0.810 13.78 62 0.750
23.3 66 0.798 18.83 61 0.737
26.8 65 0.786 23.83 60 0.725
30.2 64 0.774 27.50 59 0.713
34.7 63 0.762 30.83 58 0.701
40.0 62 0.750 35.67 57 0.689
43.8 61 0.737 40.83 56 0.677
46.2 60 0.725 44.17 55 0.665
48.3 59 0.713 46.50 54 0.653
50.3 58 0.701 48.67 53 0.641
52.5 57 0.689 50.83 52 0.629
54.8 56 0.677 53.17 51 0.617
57.3 55 0.665 55.67 50 0.605
60.2 54 0.653 58.50 49 0.592
63.2 53 0.641 61.50 48 0.580

141
66.7 52 0.629 65.00 47 0.568
70.2 51 0.617 68.67 46 0.556
73.2 50 0.605 72.00 45 0.544
76.0 49 0.592 74.67 44 0.532
78.5 48 0.580 77.50 43 0.520
80.7 47 0.568 79.83 42 0.508
82.7 46 0.556 82.00 41 0.496
85.2 45 0.544 84.33 40 0.484
87.0 44 0.532 96.33 35 0.423
89.7 43 0.520 99.17 34 0.411
92.0 42 0.508 102.50 33 0.399
95.2 41 0.496 105.33 32 0.387
98.0 40 0.484 108.17 31 0.375
101.2 39 0.472 111.50 30 0.363
105.3 36 0.435 112.67 29 0.351
106.2 35 0.423 115.33 27 0.326
107.0 34 0.411 118.50 25 0.302
109.2 32 0.387 120.17 24 0.290
111.2 30 0.363 123.83 22 0.266
112.5 29 0.351 127.83 20 0.242
113.8 28 0.339 151.33 15 0.181
115.3 27 0.326 164.83 14 0.169
118.3 25 0.302 183.33 13 0.157
120.2 24 0.290
123.8 22 0.266
128.0 20 0.242
151.2 15 0.181
164.5 14 0.169
203.3 12 0.145
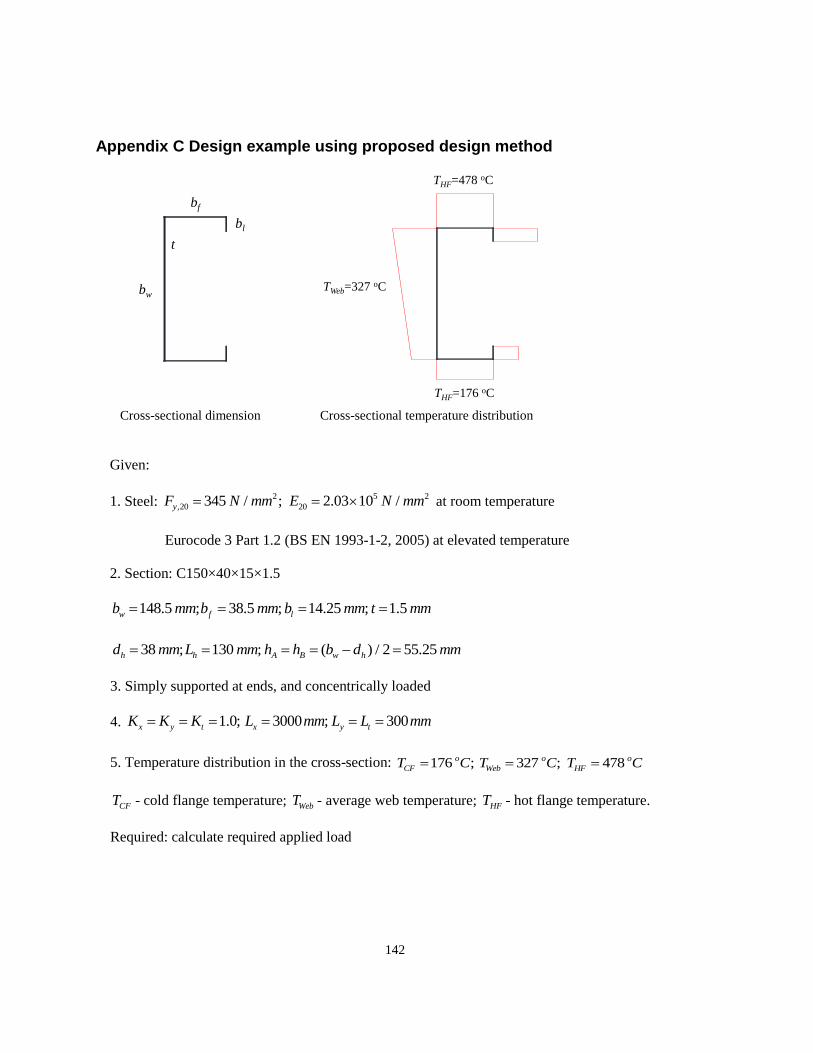
142
Appendix C Design example using proposed design method
Cross-sectional dimension
Cross-sectional temperature distribution
Given:
1. Steel: 5
,20 20
2 2345 / ; /2.03 10y N mm N mmF E at room temperature
Eurocode 3 Part 1.2 (BS EN 1993-1-2, 2005) at elevated temperature
2. Section: C150×40×15×1.5
148.5 ; 38.5 ; 14.25 ; 1.5w f lb mm b mm b mm t mm
38 ; 130 ; ( ) / 2 55.25h h A B w hd mm L mm h h b d mm
3. Simply supported at ends, and concentrically loaded
4. 1.0; 3000 ; 300x y t x y tK K K L mm L L mm
5. Temperature distribution in the cross-section: 176 ; 327 ; 478o o o
CF Web HFT C T C T C
CFT - cold flange temperature; WebT - average web temperature; HFT - hot flange temperature.
Required: calculate required applied load
bw
bl
bf
t
THF=478 oC
THF=176 oC
TWeb=327 oC

143
1. Sectional properties of full section (using software CUFSM)
2381gA mm
41239448.5xI mm 481138.6yI mm
10.156cgx mm 74.25cgy mm
6371990314wC mm 4285.75J mm
27.276ox mm 0.00oy mm
/ 57.036x x gr I A mm
/ 14.593y y gr I A mm
2 2 2 2 64.885o x x o or r r x y mm
2 2 2
,176 ,327 ,478294.395 / ; 193.507 / ; 128.754 /y y yF N mm F N mm F N mm
2 2 2
176 327 478187572 / ; 156919 / ; 126266 /E N mm E N mm E N mm
2, ,176 ,327 ,478( ) ( ) / 201.012 /y T y f l y w y f l gF F b b t F b t F b b t A N mm
2
176 327 478( ) ( ) / 156919 /T f l w f l gE E b b t E b t E b b t A N mm
215691960353.462 /
2(1 ) 2(1 0.3)
TT
EG N mm
2. Nominal axial strength, Pn
a) Check flexural buckling.
1.0 300052.598
57.04
x x
x
K L
r
1.0 30020.557
14.59
y y
y
K L
r

144
Since , Euler buckling about the x axis will control.y y x x
y x
K L K L
r r
222
2 2
156919559.804 /
/ 1.0 3000 / 57.04
T
e
x x x
EF N mm
K L r
b) Check flexural-torsional buckling.
21
42
e ex t ex t ex tF
2 2
1 / 1 27.276 / 64.885 0.823o ox r
222
2 2
156919559.804 /
/ 1.0 3000 / 57.04
T
ex
x x x
EN mm
K L r
2
22
2
2 2
2
1
156919 371990314160353.462 285.75
381 64.885 1.0 300
4001.440 /
T wTt
g o t t
E CG J
A r K L
N mm
2
2
1559.804 4001.444 559.804 4001.444 4 0.823 559.804 4001.444
2 0.823
544.640 /
eF
N mm
c) Determine controlling buckling mode.
2 2544.640 / 559.804 / , therefore flexural-torsional buckling governsN mm N mm
2544.640 /eF N mm
, 201.0120.608 1.5; therefore,
544.640
y T
c
e
F
F
2
2
,
0.608 2
0.658
0.658 201.012 172.240 /
cy TnF F
N mm

145
d) Compute effective area at 2172.240 /nf F N mm
Hot flange: uniformly compressed element with an edge stiffener.
38.5w mm
/ 38.5 /1.5 25.667w t
4781.28 /
1.28 126266 /172.240 34.657
S E f
therefore, / 0.328 Check effective width of flangew t S
Compute flange k based on stiffener lip properties
4 4
34 4
4 4 4
/ /399 0.328 3 115 5
38.5 /1.5 38.5 /1.5399 1.5 0.328 1.5 115 5
34.657 34.657
141.880 456.480 ; therefore, 141.880
a
a
w t w tI t t
S S
mm mm I mm
14.25d mm
90 degrees
3 2
3 2 4
sin /12
14.25 1.5 sin 90 /12 361.705
s
o
I d t
mm
/ 1
361.705 /141.880 2.549 1; therefore, 1.0
I s a
I
R I I
R
/ 15 / 38.5 0.390D w
0.25 / 0.8; therefore,D w
54.82 0.43 4
5 154.82 1.0 0.43 3.302 4 OK
38.5
n
I
n
Dk R
w
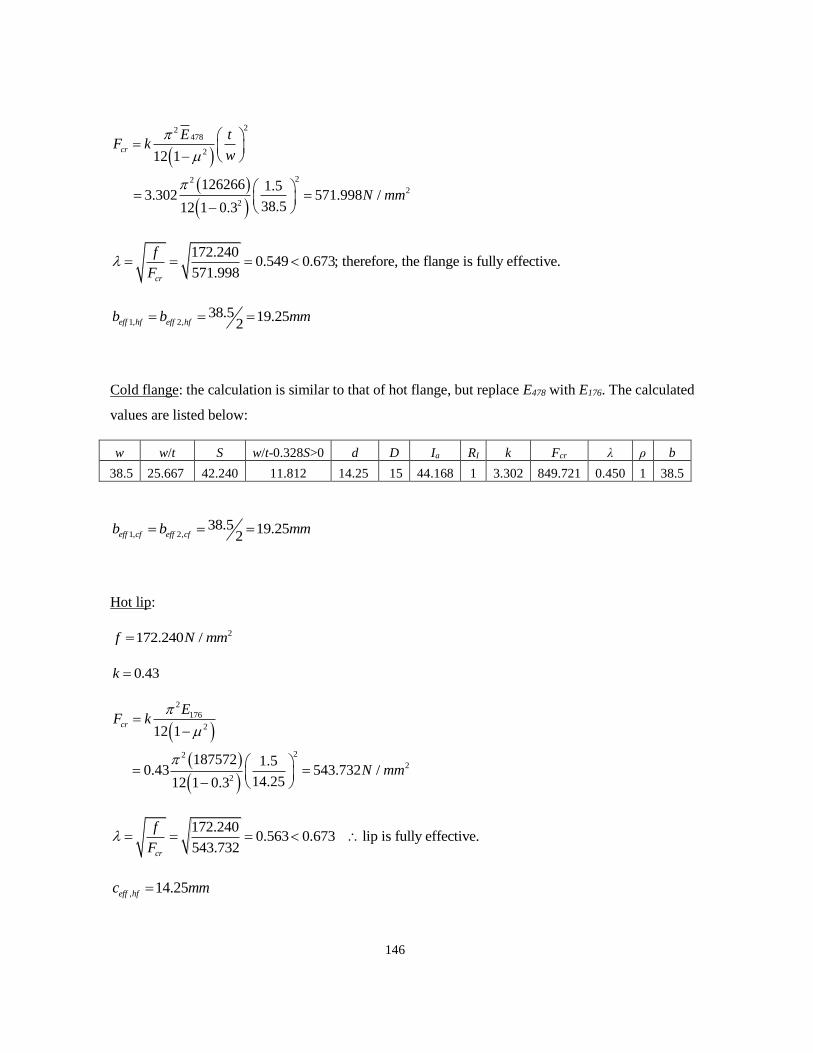
146
22478
2
22
2
2
12 1
126266 1.53.302 571.998 /
38.512 1 0.3
cr
E tF k
w
N mm
172.2400.549 0.673; therefore, the flange is fully effective.
571.998cr
f
F
1, 2,38.5 19.25
2eff hf eff hfb b mm
Cold flange: the calculation is similar to that of hot flange, but replace E478 with E176. The calculated
values are listed below:
w w/t S w/t-0.328S>0 d D Ia RI k Fcr λ ρ b
38.5 25.667 42.240 11.812 14.25 15 44.168 1 3.302 849.721 0.450 1 38.5
1, 2,38.5 19.25
2eff cf eff cfb b mm
Hot lip:
2172.240 /f N mm
0.43k
2
176
2
22
2
2
12 1
187572 1.50.43 543.732 /
14.2512 1 0.3
cr
EF k
N mm
172.2400.563 0.673 lip is fully effective.
543.732cr
f
F
, 14.25eff hfc mm

147
Cold lip: the calculation is similar to that for the hot flange, but E478 is replaced with E176. The
calculated values are listed below:
d k Fcr λ ρ ds' ds ,eff cfc
14.25 0.43 807.730 0.462 1.0 14.25 14.25 14.25
Web with perforation:
130 ; 38h hL mm d mm
or i A B
148.5 38
2.5 1.5 51.52
ih mm
0.95
0.20.425 if / 1
/ 0.6
0.925 if / 1
h i
h ii
h i
L hL hk
L h
130/ 2.524 1; therefore,
51.5h iL h
0.95
0.20.425 0.535
2.524 0.6ik
22
327
2
22
2
2
12 1
156919 1.50.535 64.428 /
51.512 1 0.3
cri
E tF k
w
N mm
172.2401.635 0.673
64.428cri
f
F
1 0.22 / /
1 0.22 /1.635 /1.635 0.529
2.5 0.529 51.5 2.5 1.5 31.010effi id h t mm

148
2224.21eA mm
Sum of the effective widths of the elements
Element l (mm)
effAd 31.010
effBd 31.010
1,eff cfb
19.25
1,eff hfb
19.25
2,eff cfb
19.25
2,eff hfb
19.25
,eff cfc
14.25
,eff hfc
14.25
sum 167.52
Effective area of pure compression member at elevated temperature eA
21.5 167.52 251.28eA t l mm
Nominal axial strength nP
251.280 172.240 43280.145n e nP A F N
beff1,cf beff2,cf
deffA
deffB
beff1,hf beff2,hf
ceff,hf
ceff,cf

149
Thermal bowing ΔTe
Thermal expansion coefficient T
327 o
avgT C
5 8
5
5
1.2 10 0.8 10 ( 20) 20 750
0 750 860
2 10 860 1200
1.446 10 ( )
o o
o o
T
o o
avg
T C T C
C T C
C T C
T T
2
25
( )
8
1.446 10 (478 176) 300033.074
8 148.5
T HF CFT
w
T T Le
b
mm
Neutral axis shift about the major axis ΔEe
176 , , 176 2, 176 1,
327 1 1 327 2 2
478 , ,
/ 2
/ 2 / 2 /
/ 2
187572 14.25 1.5 148.5 14.25 / 2 187572 19.25 1.5 148.5
187572 19.2
eff cf w eff cf eff cf w eff cf w
e Teff eff w eff eff eff
eff hf eff hf
E c t b c E b tb E b tb
Y E d t b d E d td A E
E c tc
5 1.5 148.5 156919 31.010 1.5 148.5 31.010 / 2 / 224.21 156919
156919 31.010 1.5 31.010 / 2 126266 14.25 1.5 14.25 / 2
82.503mm
/ 2 82.503 148.5 / 2 8.253E eff we Y b mm

150
3. Nominal flexural strength, Mnx
The web perforation in the cross-section is not accounted for when calculating the effective widths
under pure bending.
Effective area at elevated temperature for pure bending
Web: under stress gradient
2172.240 /nf F N mm
148.5 ; / 148.5 /1.5 99w mm w t
1
3
4 2 1 2 1 24k
2 2222
2 2
156919 1.524 347.291 /
12(1 ) 12(1 0.3 ) 148.5
Webcr
E tF k N mm
w
172.2400.704 0.673
347.291cr
f
F
(1 0.22 / ) /
(1 0.22 / 0.704) / 0.704 0.976
0.976 148.5 144.990eb w mm
/ 150 / 40 3.750 4.0; therefore,o oh b
1 / (3 ) 144.990 / (3 1) 36.248eb b mm
2 efor 0.236, b =b /2=144.990/2=72.496mm
1 2 36.248 72.496 108.745
/ 2 74.250 ; therefore, the web is fully effective.
b b mm
w mm
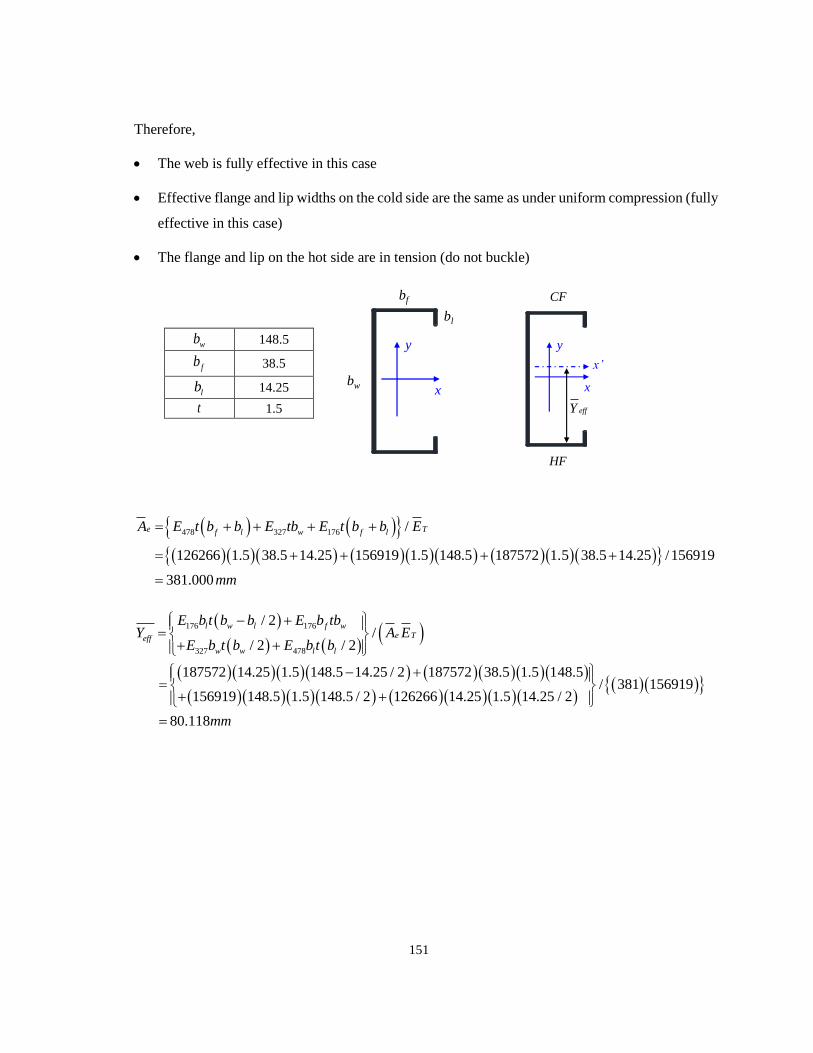
151
Therefore,
The web is fully effective in this case
Effective flange and lip widths on the cold side are the same as under uniform compression (fully
effective in this case)
The flange and lip on the hot side are in tension (do not buckle)
wb 148.5
fb 38.5
lb 14.25
t 1.5
478 327 176 /
126266 1.5 38.5 14.25 156919 1.5 148.5 187572 1.5 38.5 14.25 /156919
381.000
e Tf l w f lA E t b b E tb E t b b E
mm
176 176
327 478
/ 2/
/ 2 / 2
187572 14.25 1.5 148.5 14.25 / 2 187572 38.5 1.5 148.5/ 381 156919
156919 148.5 1.5 148.5 / 2 126266 14.25 1.5 14.25 / 2
80.118
l w l f we Teff
w w l l
E b t b b E b tbY A E
E b t b E b t b
mm
x
y
bw
bl
bf
x
y
CF
effY
x’
HF
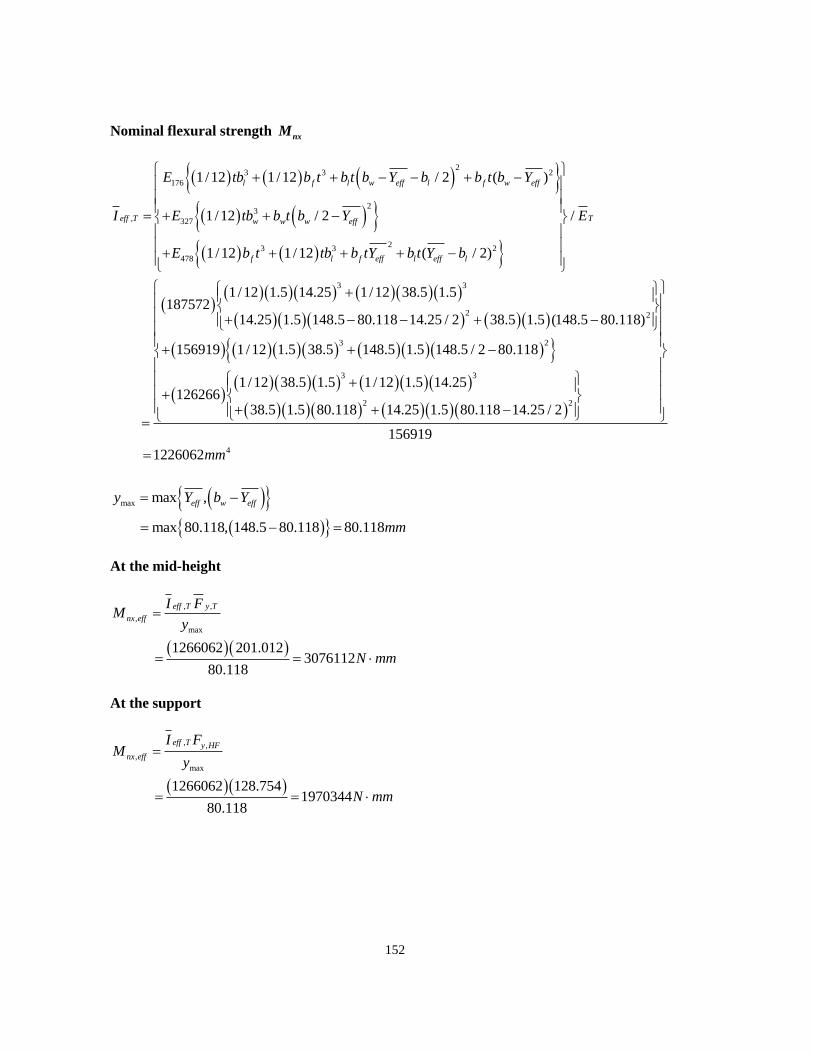
152
Nominal flexural strength nxM
23 3 2
176
23
, 327
23 3 2
478
3 3
1/12 1/12 / 2 ( )
1 /12 / 2 /
1 /12 1/12 ( / 2)
1 /12 1.5 14.25 1/12 38.5 1.5187572
14.25 1.5 148.
l f l w eff l f w eff
eff T Tw w w eff
f l f eff l eff l
E tb b t b t b Y b b t b Y
I E tb b t b Y E
E b t tb b tY b t Y b
2 2
3 2
3 3
2 2
5 80.118 14.25 / 2 38.5 1.5 (148.5 80.118)
156919 1/12 1.5 38.5 148.5 1.5 148.5 / 2 80.118
1/12 38.5 1.5 1 /12 1.5 14.25126266
38.5 1.5 80.118 14.25 1.5 80.118 14.25 / 2
156
4
919
1226062mm
max max ,
max 80.118, 148.5 80.118 80.118
eff w effy Y b Y
mm
At the mid-height
, ,
,
max
1266062 201.0123076112
80.118
eff T y T
nx eff
I FM
y
N mm
At the support
, ,
,
max
1266062 128.7541970344
80.118
eff T y HF
nx eff
I FM
y
N mm

153
Euler buckling load ExP
176 176 1 2
3 4 478
7 5/ 2
4 8 4 8/
3/ 2
4 8 4 8
187572 14.25 1.5 148.5 14.25 / 2 187572 38.5 1.5 148.5
7 148.5 5 148148.5 148.5179908.75 1.5 164582.25 1.5
4 8 4
w w w wl w l f w w w
Tg
w w w ww w l l
b b b bE b t b b E b tb E t E t
Y A Eb b b b
E t E t E b t b
.5
8/ 381 156919
3 148.5 148.5148.5 148.5149255.75 1.5 133929.25 1.5
4 8 4 8
126266 14.25 1.5 14.25 / 2
82.768
l
mm
2 23 3
23
1
23
2
2 23 3
3 4
23 3
1/12 / 2 1/12
1/12 / 4 / 4 / 8
1/12 / 4 / 4 3 / 8
1/12 / 4 / 4 3 / 8 1/12 / 4 / 4 / 8
1/12 / 2 1/12
T CF l l w l f f w
w w w w w
w w w w w
w w w w w w w w
HF l l l f f
E I E tb b t b Y b b t b t b Y
E t b b t b Y b
E t b b t b Y b
E t b b t Y b E t b b t Y b
E tb b t Y b b t b t
2
3 2
3 2
3 2
3
1/12 1.5 14.25 14.25 1.5 148.5 82.768 14.25 / 2187572
1/12 38.5 1.5 38.5 1.5 148.5 82.768
179908.75 1/12 1.5 148.5 / 4 148.5 / 4 1.5 148.5 82.768 148.5 / 8
164582.25 1/12 1.5 148.5 / 4 148.5 / 4 1.5 148.5 82.76
Y
2
23
3 2
3 2
3
8 3 148.5 / 8
149255.75 1/12 1.5 148.5 / 4 148.5 / 4 1.5 82.768 3 148.5 / 8
133929.25 1/12 1.5 148.5 / 4 148.5 / 4 1.5 82.768 148.5 / 8
1/12 1.5 14.25 14.25 1.5 82.768 14.25 / 2126266 1.88
1/12 38.5 1.5 38.5 1.5 82.768
11 45 10 mm
2 112
2 2
1.885 10206671.913
3000
TEx
E IP N
L
d/4
d/4
d/4
d/4
Ew1
Ew2
Ew3
Ew4
1 7/8( )
2 5/8( )
3 3/8( )
4 1/8( )
HF CF CF
HF CF CF
HF CF CF
HF CF CF
w T T T
w T T T
w T T T
w T T T
E E
E E
E E
E E

154
Interaction of compression and bending
At mid-height
33.074 8.253 24.821T Ee e e mm
1mxC
Assuming 0 for initial stepP
01 1 1
206671.913x
Ex
P
P
,
1 24.8211
206671.913 1 3076112
mx
Ex x nx eff
C PeP P P
P M
By iteration, the solution converges to:
30679P N
At support
8.253Ee e mm 1mxC
Assuming 0 for initial stepP
01 1 1
206671.913x
Ex
P
P
,
1 8.2531
206671.913 1 1970344
mx
Ex x nx eff
C PeP P P
P M
By iteration, the solution converges to:
35496P N
Therefore, the ultimate strength of CFS stud in walls under standard fire =30.679 kN. The
failure occurs at the mid-height.

155
Appendix D Calculation results using proposed design method
Studs (Lh=0 mm)
Results: 0 min( at mid-height, at support)hL mmP P P
o,20 , 0 nomimal axial strength calculated at 20 C under pure compression for studs without web perforationo
hn C L mmP
mid-height support mid-height support Results
Time
(min)
THF
(oC)
TCF
(oC)
eΔT
(mm)
eΔE
(mm) (eΔT -eΔE)/ αx
Pn
(kN)
PEx
(kN)
Mnx,eff
(kN.m)
Mnx,eff
(kN·m) P
(kN)
xM
(kN·m) P
(kN)
xM
(kN·m) P
(kN)
0
,20 , 0
h
oh
L mm
n C L mm
P
P
0.0 20 20 0.000 0.000 0.000 73 261 5.76 5.76 73.12 0.00 73.12 0.00 73.12 1.00
0.5 20 20 0.000 0.000 0.000 73 261 5.76 5.76 73.12 0.00 73.12 0.00 73.12 1.00
0.6 20 20 0.000 0.000 0.000 73 261 5.76 5.76 73.12 0.00 73.12 0.00 73.12 1.00
0.8 20 20 0.000 0.000 0.000 73 261 5.76 5.76 73.12 0.00 73.12 0.00 73.12 1.00
0.9 20 20 0.000 0.000 0.000 73 261 5.76 5.76 73.12 0.00 73.12 0.00 73.12 1.00
1.0 20 20 0.000 0.000 0.000 73 261 5.76 5.76 73.12 0.00 73.12 0.00 73.12 1.00
1.1 20 20 0.000 0.000 0.000 73 261 5.76 5.76 73.12 0.00 73.12 0.00 73.12 1.00
1.3 20 20 0.000 0.000 0.000 73 261 5.76 5.76 73.12 0.00 73.12 0.00 73.12 1.00
1.4 20 20 0.000 0.000 0.000 73 261 5.76 5.76 73.12 0.00 73.12 0.00 73.12 1.00
1.6 20 20 0.000 0.000 0.000 73 261 5.76 5.76 73.12 0.00 73.12 0.00 73.12 1.00
1.8 21 20 0.091 0.000 0.126 73 261 5.76 5.76 73.01 0.01 73.12 0.00 73.01 1.00
2.3 21 20 0.091 0.000 0.126 73 261 5.76 5.76 73.01 0.01 73.12 0.00 73.01 1.00
4.0 25 20 0.455 0.000 0.630 73 261 5.76 5.76 72.54 0.05 73.12 0.00 72.54 0.99
4.5 26 20 0.547 0.000 0.756 73 261 5.76 5.76 72.43 0.05 73.12 0.00 72.43 0.99
7.2 36 21 1.371 0.000 1.887 73 261 5.76 5.76 71.41 0.13 73.12 0.00 71.41 0.98
9.7 47 23 2.204 0.000 3.016 73 261 5.76 5.76 70.43 0.21 73.12 0.00 70.43 0.96
15.0 66 28 3.517 0.000 4.777 73 261 5.76 5.76 68.94 0.33 73.12 0.00 68.94 0.94

156
19.7 80 33 4.377 0.000 5.916 73 261 5.76 5.76 68.01 0.40 73.12 0.00 68.01 0.93
20.8 83 34 4.569 0.000 6.170 73 261 5.76 5.76 67.81 0.42 73.12 0.00 67.81 0.93
26.0 103 40 5.924 0.066 7.857 73 261 5.74 5.72 66.42 0.52 73.12 0.01 66.42 0.91
34.7 142 54 8.416 0.933 9.973 72 256 5.58 5.22 63.96 0.64 70.94 0.09 63.96 0.87
38.4 155 60 9.140 1.230 10.505 71 254 5.49 5.06 62.79 0.66 69.70 0.12 62.79 0.86
43.3 174 68 10.285 1.671 11.368 70 251 5.34 4.84 60.88 0.69 67.70 0.15 60.88 0.83
46.4 193 73 11.731 2.120 12.594 69 248 5.20 4.61 58.85 0.74 65.80 0.19 58.85 0.80
49.8 221 80 13.933 2.798 14.445 67 244 5.00 4.28 55.92 0.81 62.99 0.24 55.92 0.76
52.6 243 86 15.648 3.344 15.842 65 240 4.84 4.03 53.70 0.85 60.75 0.27 53.70 0.73
54.0 253 89 16.410 3.596 16.444 64 239 4.77 3.91 52.72 0.87 59.71 0.29 52.72 0.72
55.4 263 91 17.273 3.850 17.166 64 237 4.70 3.79 51.71 0.89 58.71 0.30 51.71 0.71
56.8 273 94 18.046 4.108 17.769 63 235 4.62 3.68 50.74 0.90 57.66 0.31 50.74 0.69
59.6 293 100 19.610 4.631 18.975 62 232 4.48 3.45 48.85 0.93 55.56 0.34 48.85 0.67
64.4 322 110 21.791 5.180 20.834 59 226 4.24 3.12 45.90 0.96 52.52 0.35 45.90 0.63
70.1 349 123 23.504 5.627 22.221 57 221 4.01 2.82 43.21 0.96 49.57 0.36 43.21 0.59
71.9 357 127 24.004 5.759 22.617 56 219 3.94 2.73 42.42 0.96 48.67 0.36 42.42 0.58
73.6 365 132 24.409 5.871 22.921 55 218 3.87 2.65 41.63 0.95 47.76 0.36 41.63 0.57
75.4 374 136 25.026 6.034 23.412 54 216 3.79 2.55 40.76 0.95 46.76 0.36 40.76 0.56
77.2 383 141 25.549 6.176 23.811 54 214 3.71 2.45 39.89 0.95 45.73 0.36 39.89 0.55
78.9 393 145 26.288 6.372 24.396 53 212 3.63 2.34 38.94 0.95 44.61 0.36 38.94 0.53
81.6 410 152 27.536 6.710 25.383 51 209 3.51 2.23 37.46 0.95 43.00 0.36 37.46 0.51
84.2 432 159 29.376 7.211 26.859 50 204 3.37 2.14 35.71 0.96 41.23 0.37 35.71 0.49
86.8 454 166 31.244 7.727 28.332 48 200 3.23 2.06 34.01 0.96 39.49 0.38 34.01 0.47
90.2 478 176 33.074 8.253 29.718 47 195 3.08 1.97 32.17 0.96 37.57 0.38 32.17 0.44
93.5 501 187 34.711 8.800 30.847 45 190 2.91 1.88 30.42 0.94 35.64 0.39 30.42 0.42
96.8 523 200 36.049 10.567 30.315 43 180 2.66 1.62 28.70 0.87 31.87 0.41 28.70 0.39
100.1 546 214 37.425 12.535 29.613 40 169 2.40 1.37 26.89 0.80 27.89 0.42 26.89 0.37
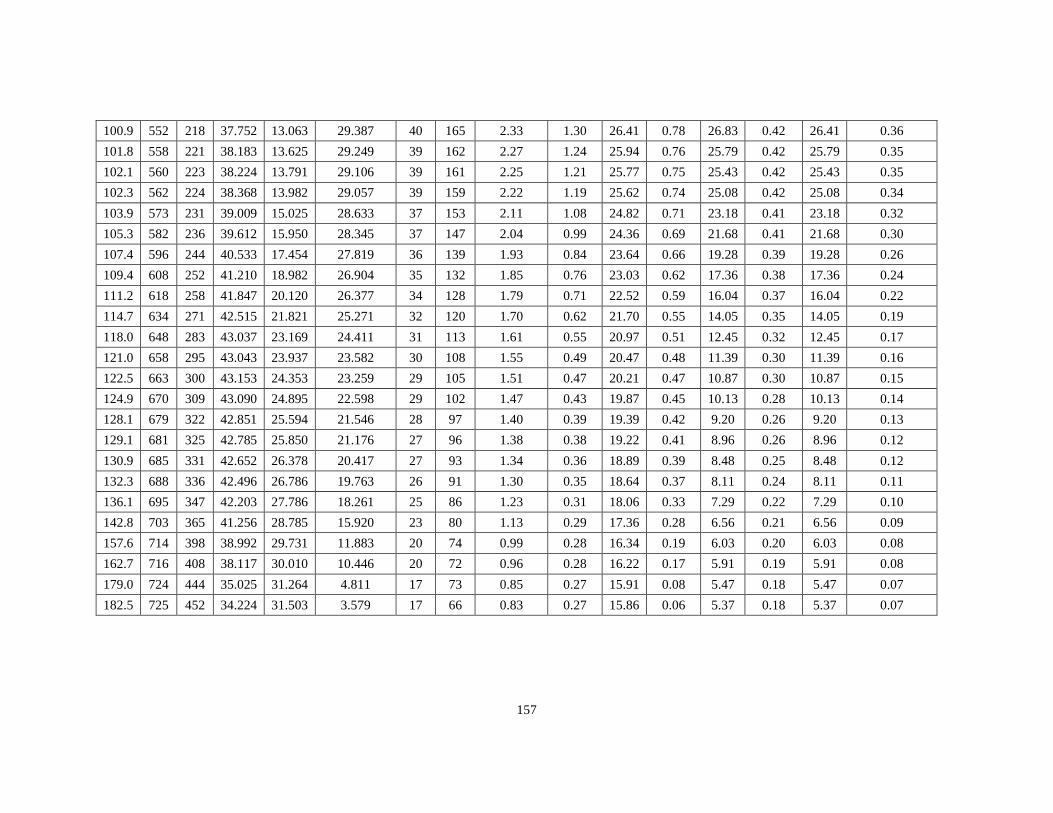
157
100.9 552 218 37.752 13.063 29.387 40 165 2.33 1.30 26.41 0.78 26.83 0.42 26.41 0.36
101.8 558 221 38.183 13.625 29.249 39 162 2.27 1.24 25.94 0.76 25.79 0.42 25.79 0.35
102.1 560 223 38.224 13.791 29.106 39 161 2.25 1.21 25.77 0.75 25.43 0.42 25.43 0.35
102.3 562 224 38.368 13.982 29.057 39 159 2.22 1.19 25.62 0.74 25.08 0.42 25.08 0.34
103.9 573 231 39.009 15.025 28.633 37 153 2.11 1.08 24.82 0.71 23.18 0.41 23.18 0.32
105.3 582 236 39.612 15.950 28.345 37 147 2.04 0.99 24.36 0.69 21.68 0.41 21.68 0.30
107.4 596 244 40.533 17.454 27.819 36 139 1.93 0.84 23.64 0.66 19.28 0.39 19.28 0.26
109.4 608 252 41.210 18.982 26.904 35 132 1.85 0.76 23.03 0.62 17.36 0.38 17.36 0.24
111.2 618 258 41.847 20.120 26.377 34 128 1.79 0.71 22.52 0.59 16.04 0.37 16.04 0.22
114.7 634 271 42.515 21.821 25.271 32 120 1.70 0.62 21.70 0.55 14.05 0.35 14.05 0.19
118.0 648 283 43.037 23.169 24.411 31 113 1.61 0.55 20.97 0.51 12.45 0.32 12.45 0.17
121.0 658 295 43.043 23.937 23.582 30 108 1.55 0.49 20.47 0.48 11.39 0.30 11.39 0.16
122.5 663 300 43.153 24.353 23.259 29 105 1.51 0.47 20.21 0.47 10.87 0.30 10.87 0.15
124.9 670 309 43.090 24.895 22.598 29 102 1.47 0.43 19.87 0.45 10.13 0.28 10.13 0.14
128.1 679 322 42.851 25.594 21.546 28 97 1.40 0.39 19.39 0.42 9.20 0.26 9.20 0.13
129.1 681 325 42.785 25.850 21.176 27 96 1.38 0.38 19.22 0.41 8.96 0.26 8.96 0.12
130.9 685 331 42.652 26.378 20.417 27 93 1.34 0.36 18.89 0.39 8.48 0.25 8.48 0.12
132.3 688 336 42.496 26.786 19.763 26 91 1.30 0.35 18.64 0.37 8.11 0.24 8.11 0.11
136.1 695 347 42.203 27.786 18.261 25 86 1.23 0.31 18.06 0.33 7.29 0.22 7.29 0.10
142.8 703 365 41.256 28.785 15.920 23 80 1.13 0.29 17.36 0.28 6.56 0.21 6.56 0.09
157.6 714 398 38.992 29.731 11.883 20 74 0.99 0.28 16.34 0.19 6.03 0.20 6.03 0.08
162.7 716 408 38.117 30.010 10.446 20 72 0.96 0.28 16.22 0.17 5.91 0.19 5.91 0.08
179.0 724 444 35.025 31.264 4.811 17 73 0.85 0.27 15.91 0.08 5.47 0.18 5.47 0.07
182.5 725 452 34.224 31.503 3.579 17 66 0.83 0.27 15.86 0.06 5.37 0.18 5.37 0.07
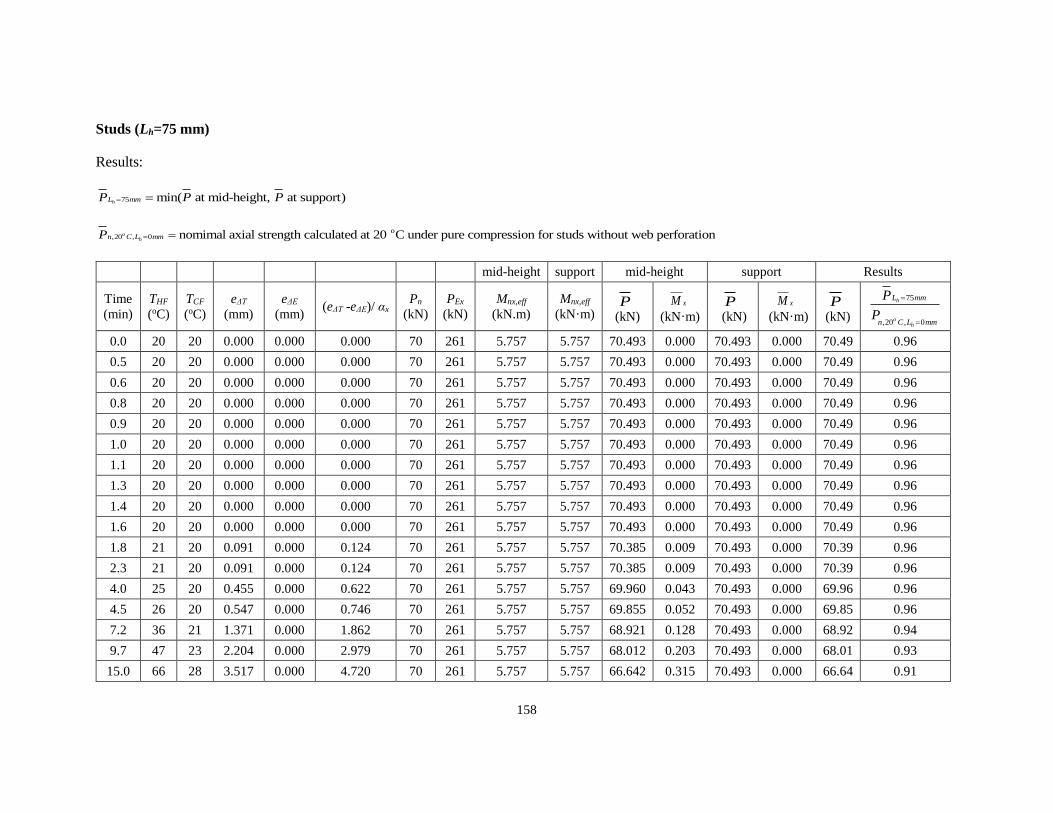
158
Studs (Lh=75 mm)
Results:
75 min( at mid-height, at support)hL mmP P P
o,20 , 0 nomimal axial strength calculated at 20 C under pure compression for studs without web perforationo
hn C L mmP
mid-height support mid-height support Results
Time
(min)
THF
(oC)
TCF
(oC)
eΔT
(mm)
eΔE
(mm) (eΔT -eΔE)/ αx
Pn
(kN)
PEx
(kN)
Mnx,eff
(kN.m)
Mnx,eff
(kN·m) P
(kN)
xM
(kN·m) P
(kN)
xM
(kN·m) P
(kN)
75
,20 , 0
h
oh
L mm
n C L mm
P
P
0.0 20 20 0.000 0.000 0.000 70 261 5.757 5.757 70.493 0.000 70.493 0.000 70.49 0.96
0.5 20 20 0.000 0.000 0.000 70 261 5.757 5.757 70.493 0.000 70.493 0.000 70.49 0.96
0.6 20 20 0.000 0.000 0.000 70 261 5.757 5.757 70.493 0.000 70.493 0.000 70.49 0.96
0.8 20 20 0.000 0.000 0.000 70 261 5.757 5.757 70.493 0.000 70.493 0.000 70.49 0.96
0.9 20 20 0.000 0.000 0.000 70 261 5.757 5.757 70.493 0.000 70.493 0.000 70.49 0.96
1.0 20 20 0.000 0.000 0.000 70 261 5.757 5.757 70.493 0.000 70.493 0.000 70.49 0.96
1.1 20 20 0.000 0.000 0.000 70 261 5.757 5.757 70.493 0.000 70.493 0.000 70.49 0.96
1.3 20 20 0.000 0.000 0.000 70 261 5.757 5.757 70.493 0.000 70.493 0.000 70.49 0.96
1.4 20 20 0.000 0.000 0.000 70 261 5.757 5.757 70.493 0.000 70.493 0.000 70.49 0.96
1.6 20 20 0.000 0.000 0.000 70 261 5.757 5.757 70.493 0.000 70.493 0.000 70.49 0.96
1.8 21 20 0.091 0.000 0.124 70 261 5.757 5.757 70.385 0.009 70.493 0.000 70.39 0.96
2.3 21 20 0.091 0.000 0.124 70 261 5.757 5.757 70.385 0.009 70.493 0.000 70.39 0.96
4.0 25 20 0.455 0.000 0.622 70 261 5.757 5.757 69.960 0.043 70.493 0.000 69.96 0.96
4.5 26 20 0.547 0.000 0.746 70 261 5.757 5.757 69.855 0.052 70.493 0.000 69.85 0.96
7.2 36 21 1.371 0.000 1.862 70 261 5.757 5.757 68.921 0.128 70.493 0.000 68.92 0.94
9.7 47 23 2.204 0.000 2.979 70 261 5.757 5.757 68.012 0.203 70.493 0.000 68.01 0.93
15.0 66 28 3.517 0.000 4.720 70 261 5.757 5.757 66.642 0.315 70.493 0.000 66.64 0.91

159
19.7 83 34 4.569 0.000 6.100 70 261 5.757 5.757 65.594 0.400 70.493 0.000 65.59 0.90
20.8 103 40 5.924 0.066 7.772 70 261 5.745 5.718 64.301 0.500 70.348 0.006 64.30 0.88
26.0 142 54 8.416 0.933 9.867 70 256 5.582 5.217 61.952 0.611 68.407 0.087 61.95 0.85
34.7 155 60 9.140 1.230 10.391 69 255 5.490 5.061 60.829 0.632 67.219 0.112 60.83 0.83
38.4 174 68 10.285 1.671 11.239 67 253 5.343 4.838 58.998 0.663 65.306 0.147 59.00 0.81
43.3 193 73 11.731 2.120 12.448 66 250 5.204 4.614 57.056 0.710 63.488 0.180 57.06 0.78
46.4 221 80 13.933 2.798 14.272 64 247 5.001 4.284 54.252 0.774 60.803 0.226 54.25 0.74
49.8 243 86 15.648 3.344 15.646 63 244 4.840 4.026 52.120 0.815 58.658 0.258 52.12 0.71
52.6 253 89 16.410 3.596 16.239 62 243 4.767 3.910 51.174 0.831 57.667 0.272 51.17 0.70
54.0 263 91 17.273 3.850 16.949 61 241 4.696 3.793 50.206 0.851 56.705 0.285 50.21 0.69
55.4 273 94 18.046 4.108 17.542 61 240 4.622 3.678 49.282 0.865 55.707 0.298 49.28 0.67
56.8 293 100 19.610 4.631 18.727 59 237 4.476 3.447 47.463 0.889 53.699 0.321 47.46 0.65
59.6 322 110 21.791 5.180 20.561 57 232 4.243 3.121 44.614 0.917 50.771 0.337 44.61 0.61
64.4 349 123 23.504 5.627 21.930 55 227 4.012 2.822 42.006 0.921 47.918 0.342 42.01 0.57
70.1 357 127 24.004 5.759 22.320 54 226 3.943 2.733 41.235 0.920 47.055 0.342 41.23 0.56
71.9 365 132 24.409 5.871 22.621 53 224 3.869 2.646 40.469 0.915 46.172 0.341 40.47 0.55
73.6 374 136 25.026 6.034 23.105 52 223 3.794 2.547 39.624 0.916 45.209 0.342 39.62 0.54
75.4 383 141 25.549 6.176 23.498 51 221 3.714 2.449 38.772 0.911 44.216 0.341 38.77 0.53
77.2 393 145 26.288 6.372 24.075 51 219 3.633 2.339 37.856 0.911 43.140 0.342 37.86 0.52
78.9 410 152 27.536 6.710 25.048 49 216 3.509 2.225 36.427 0.912 41.583 0.346 36.43 0.50
81.6 432 159 29.376 7.211 26.502 48 212 3.371 2.142 34.740 0.921 39.888 0.354 34.74 0.48
84.2 454 166 31.244 7.727 27.953 46 209 3.235 2.059 33.095 0.925 38.212 0.361 33.10 0.45
86.8 478 176 33.074 8.253 29.316 45 204 3.076 1.970 31.314 0.918 36.360 0.365 31.31 0.43
90.2 501 187 34.711 8.800 30.424 43 200 2.915 1.878 29.619 0.901 34.493 0.367 29.62 0.41
93.5 523 200 36.049 10.567 29.864 41 190 2.663 1.623 27.934 0.834 30.899 0.390 27.93 0.38
96.8 546 214 37.425 12.535 29.132 38 180 2.403 1.366 26.172 0.762 27.103 0.400 26.17 0.36
100.1 552 218 37.752 13.063 28.898 38 176 2.335 1.301 25.698 0.743 26.097 0.400 25.70 0.35
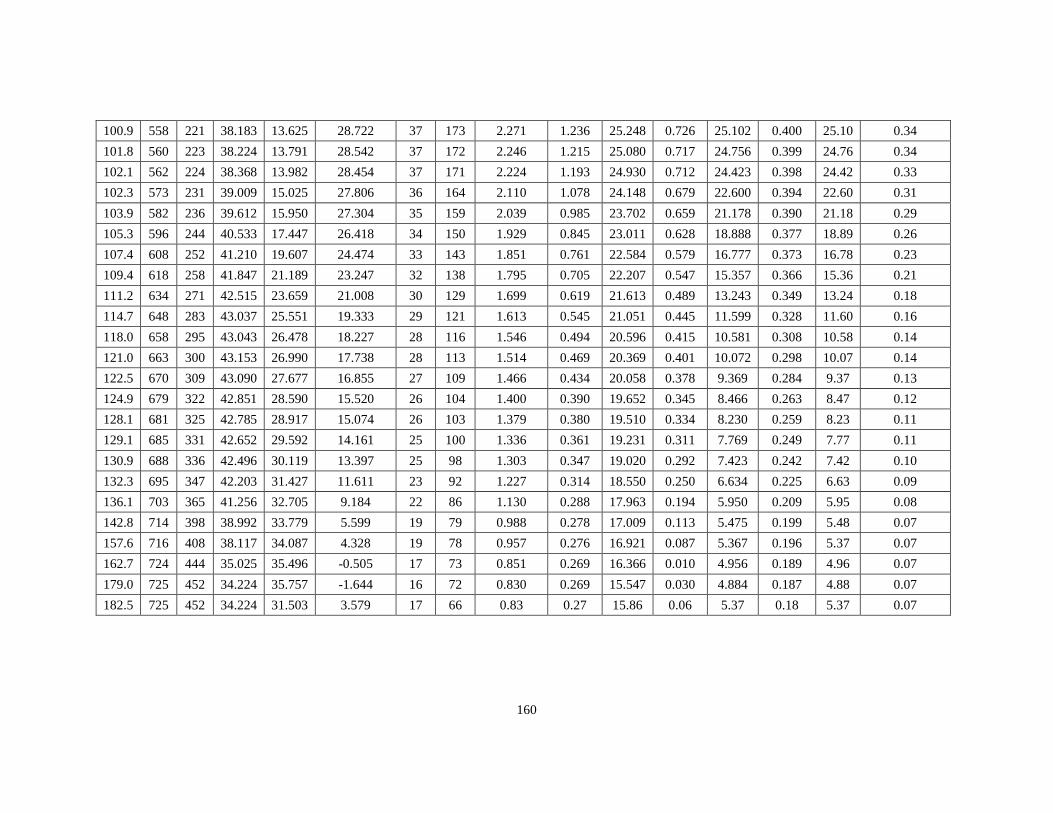
160
100.9 558 221 38.183 13.625 28.722 37 173 2.271 1.236 25.248 0.726 25.102 0.400 25.10 0.34
101.8 560 223 38.224 13.791 28.542 37 172 2.246 1.215 25.080 0.717 24.756 0.399 24.76 0.34
102.1 562 224 38.368 13.982 28.454 37 171 2.224 1.193 24.930 0.712 24.423 0.398 24.42 0.33
102.3 573 231 39.009 15.025 27.806 36 164 2.110 1.078 24.148 0.679 22.600 0.394 22.60 0.31
103.9 582 236 39.612 15.950 27.304 35 159 2.039 0.985 23.702 0.659 21.178 0.390 21.18 0.29
105.3 596 244 40.533 17.447 26.418 34 150 1.929 0.845 23.011 0.628 18.888 0.377 18.89 0.26
107.4 608 252 41.210 19.607 24.474 33 143 1.851 0.761 22.584 0.579 16.777 0.373 16.78 0.23
109.4 618 258 41.847 21.189 23.247 32 138 1.795 0.705 22.207 0.547 15.357 0.366 15.36 0.21
111.2 634 271 42.515 23.659 21.008 30 129 1.699 0.619 21.613 0.489 13.243 0.349 13.24 0.18
114.7 648 283 43.037 25.551 19.333 29 121 1.613 0.545 21.051 0.445 11.599 0.328 11.60 0.16
118.0 658 295 43.043 26.478 18.227 28 116 1.546 0.494 20.596 0.415 10.581 0.308 10.58 0.14
121.0 663 300 43.153 26.990 17.738 28 113 1.514 0.469 20.369 0.401 10.072 0.298 10.07 0.14
122.5 670 309 43.090 27.677 16.855 27 109 1.466 0.434 20.058 0.378 9.369 0.284 9.37 0.13
124.9 679 322 42.851 28.590 15.520 26 104 1.400 0.390 19.652 0.345 8.466 0.263 8.47 0.12
128.1 681 325 42.785 28.917 15.074 26 103 1.379 0.380 19.510 0.334 8.230 0.259 8.23 0.11
129.1 685 331 42.652 29.592 14.161 25 100 1.336 0.361 19.231 0.311 7.769 0.249 7.77 0.11
130.9 688 336 42.496 30.119 13.397 25 98 1.303 0.347 19.020 0.292 7.423 0.242 7.42 0.10
132.3 695 347 42.203 31.427 11.611 23 92 1.227 0.314 18.550 0.250 6.634 0.225 6.63 0.09
136.1 703 365 41.256 32.705 9.184 22 86 1.130 0.288 17.963 0.194 5.950 0.209 5.95 0.08
142.8 714 398 38.992 33.779 5.599 19 79 0.988 0.278 17.009 0.113 5.475 0.199 5.48 0.07
157.6 716 408 38.117 34.087 4.328 19 78 0.957 0.276 16.921 0.087 5.367 0.196 5.37 0.07
162.7 724 444 35.025 35.496 -0.505 17 73 0.851 0.269 16.366 0.010 4.956 0.189 4.96 0.07
179.0 725 452 34.224 35.757 -1.644 16 72 0.830 0.269 15.547 0.030 4.884 0.187 4.88 0.07
182.5 725 452 34.224 31.503 3.579 17 66 0.83 0.27 15.86 0.06 5.37 0.18 5.37 0.07
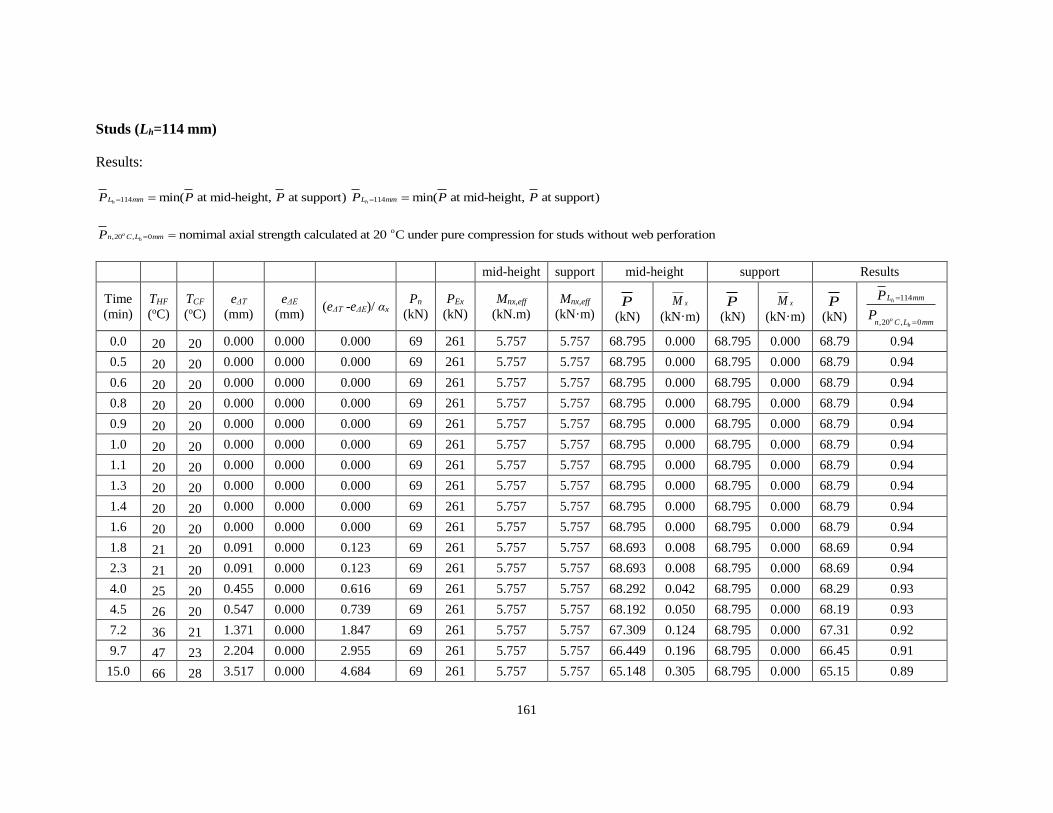
161
Studs (Lh=114 mm)
Results:
114 min( at mid-height, at support)hL mmP P P 114 min( at mid-height, at support)
hL mmP P P
o,20 , 0 nomimal axial strength calculated at 20 C under pure compression for studs without web perforationo
hn C L mmP
mid-height support mid-height support Results
Time
(min)
THF
(oC)
TCF
(oC)
eΔT
(mm)
eΔE
(mm) (eΔT -eΔE)/ αx
Pn
(kN)
PEx
(kN)
Mnx,eff
(kN.m)
Mnx,eff
(kN·m) P
(kN)
xM
(kN·m) P
(kN)
xM
(kN·m) P
(kN)
114
,20 , 0
h
oh
L mm
n C L mm
P
P
0.0 20 20 0.000 0.000 0.000 69 261 5.757 5.757 68.795 0.000 68.795 0.000 68.79 0.94
0.5 20 20 0.000 0.000 0.000 69 261 5.757 5.757 68.795 0.000 68.795 0.000 68.79 0.94
0.6 20 20 0.000 0.000 0.000 69 261 5.757 5.757 68.795 0.000 68.795 0.000 68.79 0.94
0.8 20 20 0.000 0.000 0.000 69 261 5.757 5.757 68.795 0.000 68.795 0.000 68.79 0.94
0.9 20 20 0.000 0.000 0.000 69 261 5.757 5.757 68.795 0.000 68.795 0.000 68.79 0.94
1.0 20 20 0.000 0.000 0.000 69 261 5.757 5.757 68.795 0.000 68.795 0.000 68.79 0.94
1.1 20 20 0.000 0.000 0.000 69 261 5.757 5.757 68.795 0.000 68.795 0.000 68.79 0.94
1.3 20 20 0.000 0.000 0.000 69 261 5.757 5.757 68.795 0.000 68.795 0.000 68.79 0.94
1.4 20 20 0.000 0.000 0.000 69 261 5.757 5.757 68.795 0.000 68.795 0.000 68.79 0.94
1.6 20 20 0.000 0.000 0.000 69 261 5.757 5.757 68.795 0.000 68.795 0.000 68.79 0.94
1.8 21 20 0.091 0.000 0.123 69 261 5.757 5.757 68.693 0.008 68.795 0.000 68.69 0.94
2.3 21 20 0.091 0.000 0.123 69 261 5.757 5.757 68.693 0.008 68.795 0.000 68.69 0.94
4.0 25 20 0.455 0.000 0.616 69 261 5.757 5.757 68.292 0.042 68.795 0.000 68.29 0.93
4.5 26 20 0.547 0.000 0.739 69 261 5.757 5.757 68.192 0.050 68.795 0.000 68.19 0.93
7.2 36 21 1.371 0.000 1.847 69 261 5.757 5.757 67.309 0.124 68.795 0.000 67.31 0.92
9.7 47 23 2.204 0.000 2.955 69 261 5.757 5.757 66.449 0.196 68.795 0.000 66.45 0.91
15.0 66 28 3.517 0.000 4.684 69 261 5.757 5.757 65.148 0.305 68.795 0.000 65.15 0.89

162
20.8 80 33 4.377 0.000 5.806 69 261 5.757 5.757 64.332 0.373 68.795 0.000 64.33 0.88
26.0 83 34 4.569 0.000 6.055 69 261 5.757 5.757 64.153 0.388 68.795 0.000 64.15 0.88
34.7 103 40 5.924 0.066 7.718 69 261 5.745 5.718 62.921 0.486 68.656 0.006 62.92 0.86
38.4 142 54 8.416 0.933 9.802 68 256 5.582 5.217 60.659 0.595 66.791 0.084 60.66 0.83
43.3 155 60 9.140 1.230 10.324 67 255 5.490 5.061 59.568 0.615 65.641 0.109 59.57 0.81
46.4 174 68 10.285 1.671 11.169 66 253 5.343 4.838 57.786 0.645 63.787 0.143 57.79 0.79
49.8 193 73 11.731 2.120 12.374 64 250 5.204 4.614 55.901 0.692 62.025 0.175 55.90 0.76
52.6 221 80 13.933 2.798 14.192 63 247 5.001 4.284 53.178 0.755 59.423 0.219 53.18 0.73
54.0 243 86 15.648 3.344 15.564 61 244 4.840 4.026 51.104 0.795 57.344 0.251 51.10 0.70
55.4 253 89 16.410 3.596 16.155 60 243 4.767 3.910 50.184 0.811 56.383 0.264 50.18 0.69
56.8 263 91 17.273 3.850 16.864 60 241 4.696 3.793 49.242 0.830 55.450 0.277 49.24 0.67
59.6 273 94 18.046 4.108 17.456 59 240 4.622 3.678 48.343 0.844 54.483 0.290 48.34 0.66
64.4 283 97 18.825 4.368 18.048 58 239 4.549 3.562 47.451 0.856 53.510 0.301 47.45 0.65
70.1 293 100 19.610 4.631 18.639 58 237 4.476 3.447 46.568 0.868 52.533 0.313 46.57 0.64
71.9 322 110 21.791 5.180 20.471 56 232 4.243 3.121 43.791 0.896 49.687 0.327 43.79 0.60
73.6 349 123 23.504 5.627 21.840 53 227 4.012 2.822 41.241 0.901 46.907 0.333 41.24 0.56
75.4 357 127 24.004 5.759 22.230 52 226 3.943 2.733 40.487 0.900 46.067 0.333 40.49 0.55
77.2 365 132 24.409 5.871 22.531 52 224 3.869 2.646 39.737 0.895 45.206 0.332 39.74 0.54
78.9 374 136 25.026 6.034 23.015 51 223 3.794 2.547 38.911 0.896 44.267 0.333 38.91 0.53
81.6 383 141 21.269 5.185 19.465 48 217 3.525 2.474 37.665 0.733 42.317 0.273 37.67 0.52
84.2 393 145 26.288 6.372 23.986 49 219 3.633 2.339 37.181 0.892 42.251 0.334 37.18 0.51
86.8 410 152 27.536 6.710 24.958 48 216 3.509 2.225 35.778 0.893 40.733 0.337 35.78 0.49
90.2 432 159 29.376 7.211 26.412 47 212 3.371 2.142 34.137 0.902 39.083 0.345 34.14 0.47
93.5 454 166 31.009 7.664 27.673 45 209 3.244 2.067 32.664 0.904 37.584 0.351 32.66 0.45
96.8 478 176 33.074 8.253 29.227 44 204 3.076 1.970 30.787 0.900 35.642 0.356 30.79 0.42
100.1 501 187 34.711 8.800 30.336 42 200 2.915 1.878 29.125 0.884 33.818 0.358 29.13 0.40
100.9 523 200 36.049 10.567 29.779 40 190 2.663 1.623 27.469 0.818 30.327 0.381 27.47 0.38

163
101.8 546 214 37.425 12.535 29.049 37 180 2.403 1.366 25.736 0.748 26.635 0.392 25.74 0.35
102.1 552 218 37.752 13.063 28.816 37 176 2.335 1.301 25.270 0.728 25.655 0.392 25.27 0.35
102.3 558 221 38.183 13.625 28.642 36 173 2.271 1.236 24.828 0.712 24.687 0.392 24.69 0.34
103.9 560 223 38.224 13.791 28.463 36 172 2.246 1.215 24.663 0.703 24.349 0.391 24.35 0.33
105.3 562 224 38.368 13.982 28.377 36 171 2.224 1.193 24.516 0.698 24.025 0.391 24.03 0.33
107.4 573 231 39.009 15.025 27.738 35 164 2.110 1.078 23.746 0.666 22.255 0.387 22.25 0.30
109.4 582 236 39.612 15.950 27.242 34 159 2.039 0.985 23.308 0.646 20.864 0.383 20.86 0.29
111.2 596 244 40.533 17.447 26.367 33 150 1.929 0.845 22.631 0.615 18.633 0.371 18.63 0.25
114.7 608 252 41.210 19.607 24.433 32 143 1.851 0.761 22.198 0.568 16.564 0.367 16.56 0.23
118.0 618 258 41.847 21.189 23.212 31 138 1.795 0.705 21.817 0.535 15.171 0.361 15.17 0.21
121.0 634 271 42.515 23.659 20.981 30 129 1.699 0.619 21.216 0.479 13.094 0.345 13.09 0.18
122.5 648 283 43.037 25.551 19.311 28 121 1.613 0.545 20.653 0.435 11.478 0.324 11.48 0.16
124.9 658 295 43.043 26.478 18.210 27 116 1.546 0.494 20.199 0.405 10.478 0.305 10.48 0.14
128.1 663 300 43.153 26.990 17.722 27 113 1.514 0.469 19.974 0.392 9.974 0.295 9.97 0.14
129.1 670 309 43.090 27.677 16.841 26 109 1.466 0.434 19.662 0.369 9.282 0.281 9.28 0.13
130.9 679 322 42.851 28.590 15.508 25 104 1.400 0.390 19.255 0.337 8.389 0.261 8.39 0.11
132.3 681 325 42.785 28.917 15.063 25 103 1.379 0.380 19.114 0.326 8.159 0.256 8.16 0.11
136.1 685 331 42.652 29.592 14.151 24 100 1.336 0.361 18.834 0.303 7.704 0.247 7.70 0.11
142.8 688 336 42.496 30.119 13.387 24 98 1.303 0.347 18.622 0.285 7.362 0.240 7.36 0.10
157.6 695 347 42.203 31.427 11.604 23 92 1.227 0.314 18.149 0.243 6.582 0.223 6.58 0.09
162.7 703 365 41.256 32.705 9.179 21 86 1.130 0.288 17.556 0.188 5.905 0.207 5.91 0.08
179.0 714 398 38.992 33.779 5.596 19 79 0.988 0.278 16.598 0.109 5.433 0.197 5.43 0.07
182.5 716 408 38.117 34.087 4.326 18 78 0.957 0.276 16.500 0.084 5.325 0.195 5.33 0.07
179.0 724 444 35.025 35.496 -0.504 16 73 0.851 0.269 15.923 0.010 4.917 0.187 4.92 0.07
182.5 725 452 34.224 35.757 -1.643 16 72 0.830 0.269 15.140 0.029 4.845 0.186 4.85 0.07

164
Studs (Lh=130 mm)
Results:
130 min( at mid-height, at support)hL mmP P P
o,20 , 0 nomimal axial strength calculated at 20 C under pure compression for studs without web perforationo
hn C L mmP
mid-height support mid-height support Results
Time
(min)
THF
(oC)
TCF
(oC)
eΔT
(mm)
eΔE
(mm) (eΔT -eΔE)/ αx
Pn
(kN)
PEx
(kN)
Mnx,eff
(kN.m)
Mnx,eff
(kN·m) P
(kN)
xM
(kN·m) P
(kN)
xM
(kN·m) P
(kN)
130
,20 , 0
h
oh
L mm
n C L mm
P
P
0.0 20 20 0.000 0.000 0.000 68 261 5.757 5.757 68.456 0.000 68.456 0.000 68.46 0.94
0.5 20 20 0.000 0.000 0.000 68 261 5.757 5.757 68.456 0.000 68.456 0.000 68.46 0.94
0.6 20 20 0.000 0.000 0.000 68 261 5.757 5.757 68.456 0.000 68.456 0.000 68.46 0.94
0.8 20 20 0.000 0.000 0.000 68 261 5.757 5.757 68.456 0.000 68.456 0.000 68.46 0.94
0.9 20 20 0.000 0.000 0.000 68 261 5.757 5.757 68.456 0.000 68.456 0.000 68.46 0.94
1.0 20 20 0.000 0.000 0.000 68 261 5.757 5.757 68.456 0.000 68.456 0.000 68.46 0.94
1.1 20 20 0.000 0.000 0.000 68 261 5.757 5.757 68.456 0.000 68.456 0.000 68.46 0.94
1.3 20 20 0.000 0.000 0.000 68 261 5.757 5.757 68.456 0.000 68.456 0.000 68.46 0.94
1.4 20 20 0.000 0.000 0.000 68 261 5.757 5.757 68.456 0.000 68.456 0.000 68.46 0.94
1.6 20 20 0.000 0.000 0.000 68 261 5.757 5.757 68.456 0.000 68.456 0.000 68.46 0.94
1.8 21 20 0.091 0.000 0.123 68 261 5.757 5.757 68.355 0.008 68.456 0.000 68.36 0.93
2.3 21 20 0.091 0.000 0.123 68 261 5.757 5.757 68.355 0.008 68.456 0.000 68.36 0.93
4.0 25 20 0.455 0.000 0.615 68 261 5.757 5.757 67.958 0.042 68.456 0.000 67.96 0.93
4.5 26 20 0.547 0.000 0.738 68 261 5.757 5.757 67.860 0.050 68.456 0.000 67.86 0.93
7.2 36 21 1.371 0.000 1.844 68 261 5.757 5.757 66.987 0.124 68.456 0.000 66.99 0.92
9.7 47 23 2.204 0.000 2.951 68 261 5.757 5.757 66.168 0.195 68.456 0.000 66.17 0.90
15.0 66 28 3.517 0.000 4.677 68 261 5.757 5.757 64.849 0.303 68.456 0.000 64.85 0.89

165
19.7 80 33 4.377 0.000 5.797 68 261 5.757 5.757 64.041 0.371 68.456 0.000 64.04 0.88
20.8 83 34 4.569 0.000 6.046 68 261 5.757 5.757 63.864 0.386 68.456 0.000 63.86 0.87
26.0 103 40 5.924 0.066 7.707 68 261 5.745 5.718 62.644 0.483 68.318 0.006 62.64 0.86
34.7 142 54 8.416 0.933 9.789 68 256 5.582 5.217 60.399 0.591 66.468 0.084 60.40 0.83
38.4 155 60 9.140 1.230 10.310 67 255 5.490 5.061 59.314 0.612 65.325 0.108 59.31 0.81
43.3 174 68 10.285 1.671 11.155 65 253 5.343 4.838 57.543 0.642 63.483 0.142 57.54 0.79
46.4 193 73 11.731 2.120 12.359 64 250 5.204 4.614 55.669 0.688 61.732 0.174 55.67 0.76
49.8 221 80 13.933 2.798 14.176 62 247 5.001 4.284 52.956 0.751 59.151 0.218 52.96 0.72
52.6 243 86 15.648 3.344 15.549 61 244 4.840 4.026 50.918 0.792 57.087 0.249 50.92 0.70
54.0 253 89 16.410 3.596 16.139 60 243 4.767 3.910 49.991 0.807 56.125 0.263 49.99 0.68
55.4 263 91 17.273 3.850 16.764 60 246 4.696 3.793 49.087 0.823 55.220 0.274 49.09 0.67
56.8 273 94 18.046 4.108 17.440 59 240 4.622 3.678 48.160 0.840 57.087 0.308 48.16 0.66
59.6 293 100 19.610 4.631 18.622 57 237 4.476 3.447 46.393 0.864 52.301 0.311 46.39 0.63
64.4 322 110 21.791 5.180 20.453 55 232 4.243 3.121 43.625 0.892 49.469 0.326 43.62 0.60
70.1 349 123 23.504 5.627 21.823 53 227 4.012 2.822 41.096 0.897 46.701 0.331 41.10 0.56
71.9 357 127 24.004 5.759 22.213 52 226 3.943 2.733 40.340 0.896 45.865 0.331 40.34 0.55
73.6 365 132 24.409 5.871 22.513 51 224 3.869 2.646 39.589 0.891 45.011 0.331 39.59 0.54
75.4 374 136 25.026 6.034 22.997 51 223 3.794 2.547 38.767 0.892 44.078 0.332 38.77 0.53
77.2 383 141 25.549 6.176 23.391 50 221 3.714 2.449 37.941 0.887 43.116 0.331 37.94 0.52
78.9 393 145 26.288 6.372 23.968 49 219 3.633 2.339 37.045 0.888 42.073 0.332 37.05 0.51
81.6 410 152 27.536 6.710 24.941 48 216 3.509 2.225 35.654 0.889 40.564 0.335 35.65 0.49
84.2 432 159 29.376 7.211 26.394 46 212 3.371 2.142 34.014 0.898 38.921 0.344 34.01 0.47
86.8 454 166 31.244 7.727 27.844 45 209 3.235 2.059 32.411 0.902 37.290 0.351 32.41 0.44
90.2 478 176 33.074 8.253 29.208 43 204 3.076 1.970 30.676 0.896 35.494 0.355 30.68 0.42
93.5 501 187 34.711 8.800 30.318 42 200 2.915 1.878 29.025 0.880 33.681 0.357 29.03 0.40
96.8 523 200 36.049 10.567 29.762 39 190 2.663 1.623 27.374 0.815 30.211 0.379 27.37 0.37
100.1 546 214 37.425 12.535 29.032 37 180 2.403 1.366 25.648 0.745 26.540 0.390 25.65 0.35

166
100.9 552 218 37.752 13.063 28.799 37 176 2.335 1.301 25.183 0.725 25.566 0.391 25.18 0.34
101.8 558 221 38.183 13.625 28.652 36 173 2.271 1.236 24.743 0.709 24.603 0.391 24.60 0.34
102.1 560 223 38.224 13.791 28.507 36 172 2.246 1.215 24.578 0.701 24.267 0.390 24.27 0.33
102.3 562 224 38.368 13.982 28.458 36 171 2.224 1.193 24.443 0.696 23.945 0.389 23.94 0.33
103.9 573 231 39.009 15.025 28.016 35 164 2.110 1.078 23.663 0.663 22.177 0.385 22.18 0.30
105.3 582 236 39.612 15.950 27.717 34 159 2.039 0.985 23.229 0.644 20.801 0.382 20.80 0.28
107.4 596 244 40.533 17.447 27.179 33 150 1.929 0.845 22.553 0.613 18.580 0.370 18.58 0.25
109.4 608 252 41.210 19.607 25.557 32 143 1.851 0.761 22.126 0.565 16.527 0.366 16.53 0.23
111.2 618 258 41.847 21.189 24.524 31 138 1.795 0.705 21.738 0.533 15.133 0.360 15.13 0.21
114.7 634 271 42.515 23.659 22.541 29 129 1.699 0.619 21.137 0.476 13.059 0.344 13.06 0.18
118.0 648 283 43.037 25.551 21.053 28 121 1.613 0.545 20.572 0.433 11.453 0.323 11.45 0.16
121.0 658 295 43.043 26.478 20.040 27 116 1.546 0.494 20.118 0.403 10.455 0.304 10.45 0.14
122.5 663 300 43.153 26.990 19.602 27 113 1.514 0.469 19.893 0.390 9.954 0.295 9.95 0.14
124.9 670 309 43.090 27.677 18.770 26 109 1.466 0.434 19.582 0.368 9.264 0.280 9.26 0.13
128.1 679 322 42.851 28.590 17.473 25 104 1.400 0.390 19.175 0.335 8.375 0.260 8.38 0.11
129.1 681 325 42.785 28.917 17.018 25 103 1.379 0.380 19.033 0.324 8.144 0.256 8.14 0.11
130.9 685 331 42.652 29.592 16.079 24 100 1.336 0.361 18.753 0.302 7.690 0.247 7.69 0.11
132.3 688 336 42.496 30.119 15.281 24 98 1.303 0.347 18.541 0.283 7.350 0.239 7.35 0.10
136.1 695 347 42.203 31.427 13.399 23 92 1.227 0.314 18.067 0.242 6.572 0.222 6.57 0.09
142.8 703 365 41.256 32.705 10.721 21 86 1.130 0.288 17.474 0.187 5.896 0.207 5.90 0.08
157.6 714 398 38.992 33.779 6.581 19 79 0.988 0.278 16.514 0.109 5.424 0.197 5.42 0.07
162.7 716 408 38.117 34.087 5.107 18 78 0.957 0.276 16.415 0.084 5.317 0.195 5.32 0.07
179.0 724 444 35.025 35.496 -0.601 16 73 0.851 0.269 15.833 0.010 4.908 0.187 4.91 0.07