Embed Size (px)
Citation preview
Performance Ratings: A Distribution Analysis
Fiscal Years 2010-2014
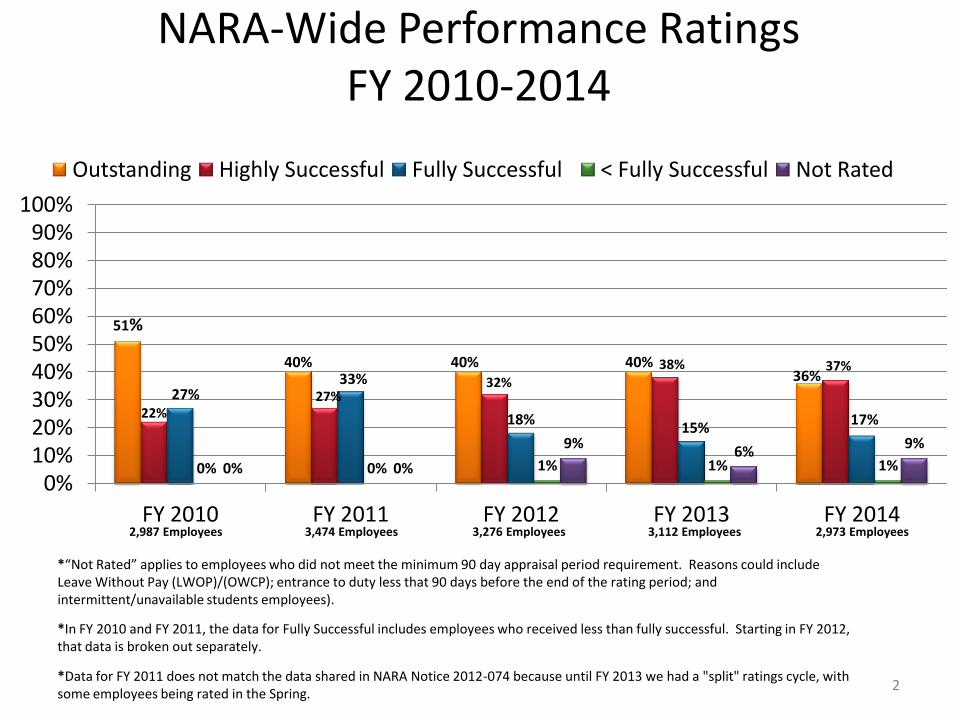
NARA-Wide Performance Ratings FY 2010-2014
51%
40% 40% 40% 36%
22% 27%
32% 38% 37%
27% 33%
18% 15%
17%
0% 0% 1% 1% 1% 0% 0%
9% 6%
9%
0% 10% 20% 30% 40% 50% 60% 70% 80% 90%
100%
FY 2010 FY 2011 FY 2012 FY 2013 FY 2014
Outstanding Highly Successful Fully Successful < Fully Successful Not Rated
2
2,987 Employees 3,474 Employees 3,276 Employees 3,112 Employees 2,973 Employees
*In FY 2010 and FY 2011, the data for Fully Successful includes employees who received less than fully successful. Starting in FY 2012, that data is broken out separately.
*“Not Rated” applies to employees who did not meet the minimum 90 day appraisal period requirement. Reasons could include Leave Without Pay (LWOP)/(OWCP); entrance to duty less that 90 days before the end of the rating period; and intermittent/unavailable students employees).
*Data for FY 2011 does not match the data shared in NARA Notice 2012-074 because until FY 2013 we had a "split" ratings cycle, with some employees being rated in the Spring.
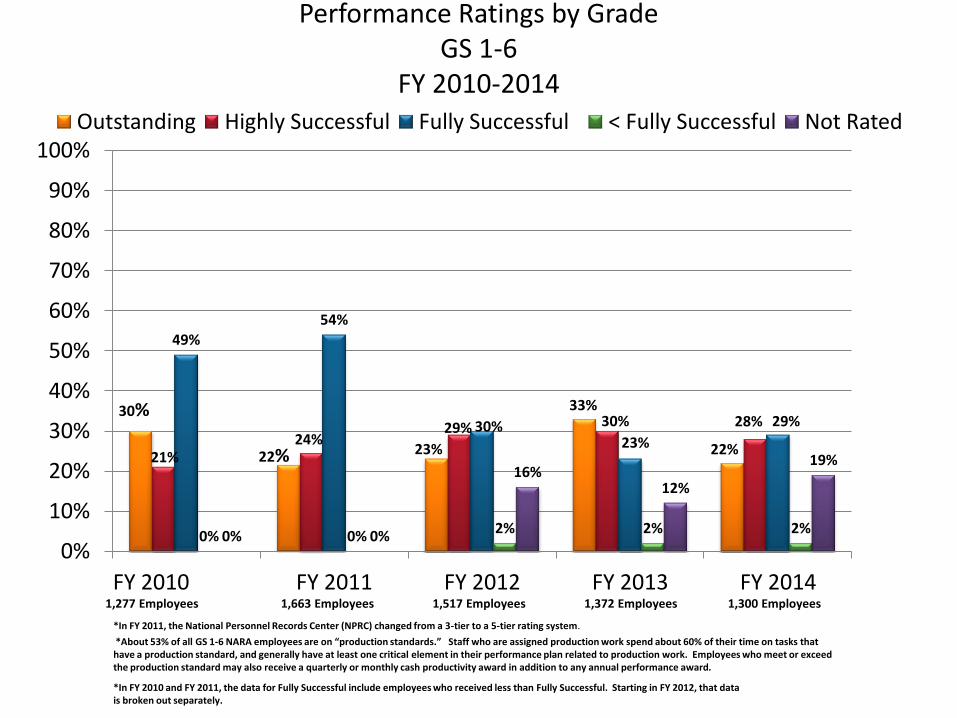
Performance Ratings by Grade GS 1-6
FY 2010-2014
30%
22% 23%
33%
22% 21% 24%
29% 30% 28%
49%
54%
30% 23%
29%
0% 0% 2% 2% 2%
0% 0%
16% 12%
19%
0%
10%
20%
30%
40%
50%
60%
70%
80%
90%
100%
FY 2010 FY 2011 FY 2012 FY 2013 FY 2014
Outstanding Highly Successful Fully Successful < Fully Successful Not Rated
1,277 Employees 1,517 Employees 1,372 Employees 1,300 Employees 1,663 Employees
*In FY 2011, the National Personnel Records Center (NPRC) changed from a 3-tier to a 5-tier rating system.
*In FY 2010 and FY 2011, the data for Fully Successful include employees who received less than Fully Successful. Starting in FY 2012, that data is broken out separately.
*About 53% of all GS 1-6 NARA employees are on “production standards.” Staff who are assigned production work spend about 60% of their time on tasks that have a production standard, and generally have at least one critical element in their performance plan related to production work. Employees who meet or exceed the production standard may also receive a quarterly or monthly cash productivity award in addition to any annual performance award.
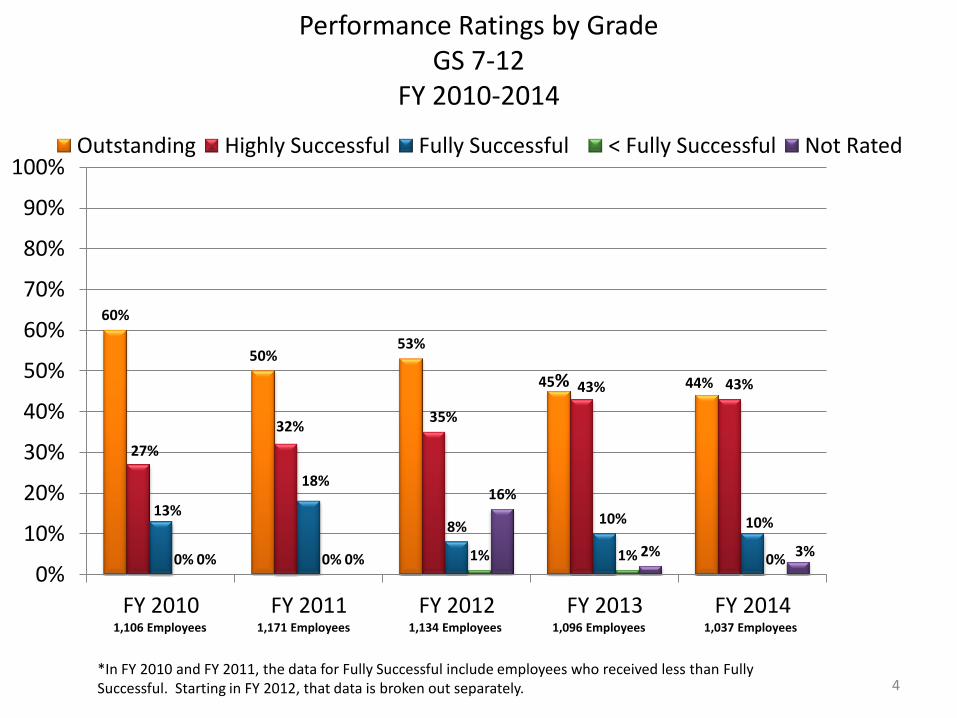
Performance Ratings by Grade GS 7-12
FY 2010-2014
60%
50% 53%
45% 44%
27%
32% 35%
43% 43%
13%
18%
8% 10% 10%
0% 0% 1% 1% 0% 0% 0%
16%
2% 3%
0%
10%
20%
30%
40%
50%
60%
70%
80%
90%
100%
FY 2010 FY 2011 FY 2012 FY 2013 FY 2014
Outstanding Highly Successful Fully Successful < Fully Successful Not Rated
4
1,106 Employees 1,171 Employees 1,134 Employees 1,096 Employees 1,037 Employees
*In FY 2010 and FY 2011, the data for Fully Successful include employees who received less than Fully Successful. Starting in FY 2012, that data is broken out separately.
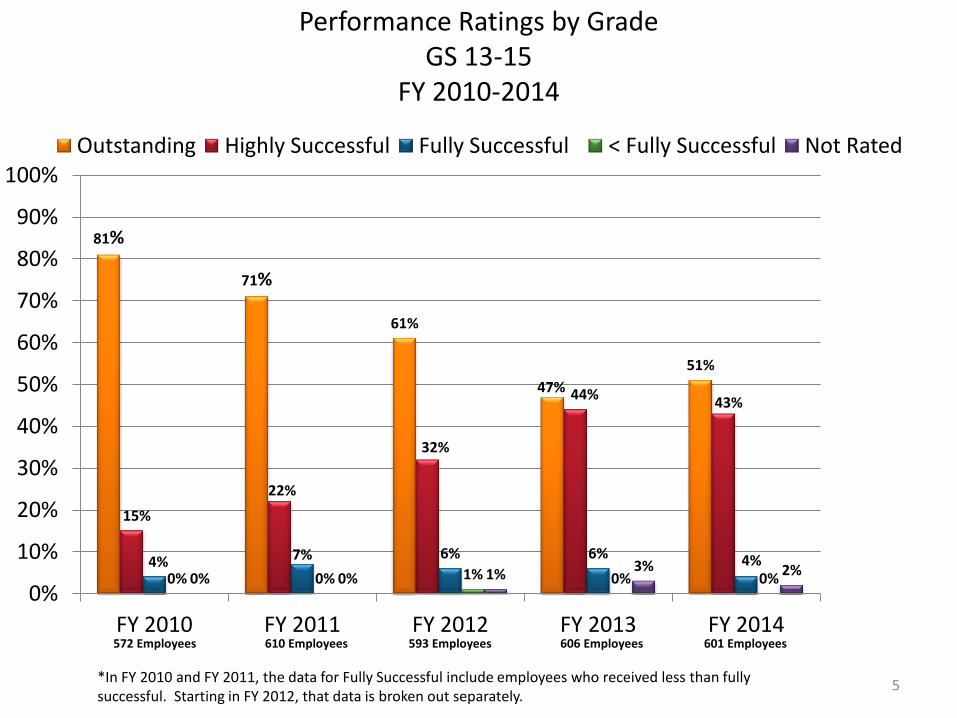
Performance Ratings by Grade GS 13-15
FY 2010-2014
81%
71%
61%
47%
51%
15%
22%
32%
44% 43%
4% 7% 6% 6% 4% 0% 0% 1% 0% 0% 0% 0% 1%
3% 2%
0%
10%
20%
30%
40%
50%
60%
70%
80%
90%
100%
FY 2010 FY 2011 FY 2012 FY 2013 FY 2014
Outstanding Highly Successful Fully Successful < Fully Successful Not Rated
5
572 Employees 610 Employees 593 Employees 606 Employees 601 Employees
*In FY 2010 and FY 2011, the data for Fully Successful include employees who received less than fully successful. Starting in FY 2012, that data is broken out separately.
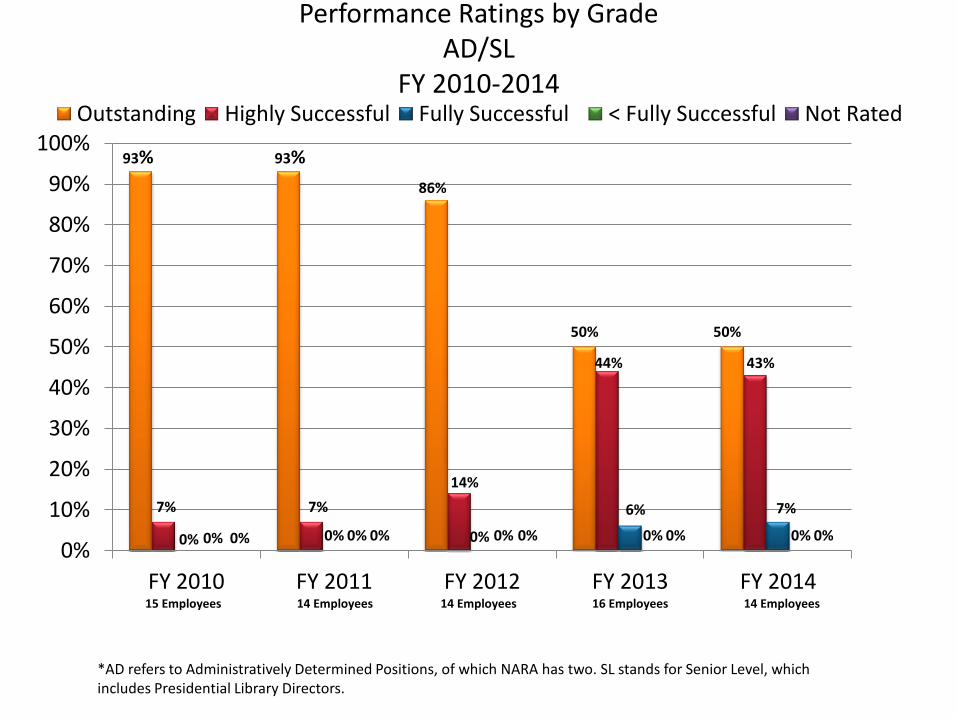
Performance Ratings by Grade AD/SL
FY 2010-2014
93% 93%
86%
50% 50%
7% 7%
14%
44% 43%
0% 0% 0%
6% 7%
0% 0% 0% 0% 0% 0% 0% 0% 0% 0% 0%
10%
20%
30%
40%
50%
60%
70%
80%
90%
100%
FY 2010 FY 2011 FY 2012 FY 2013 FY 2014
Outstanding Highly Successful Fully Successful < Fully Successful Not Rated
15 Employees 14 Employees 14 Employees 16 Employees 14 Employees
*AD refers to Administratively Determined Positions, of which NARA has two. SL stands for Senior Level, which includes Presidential Library Directors.
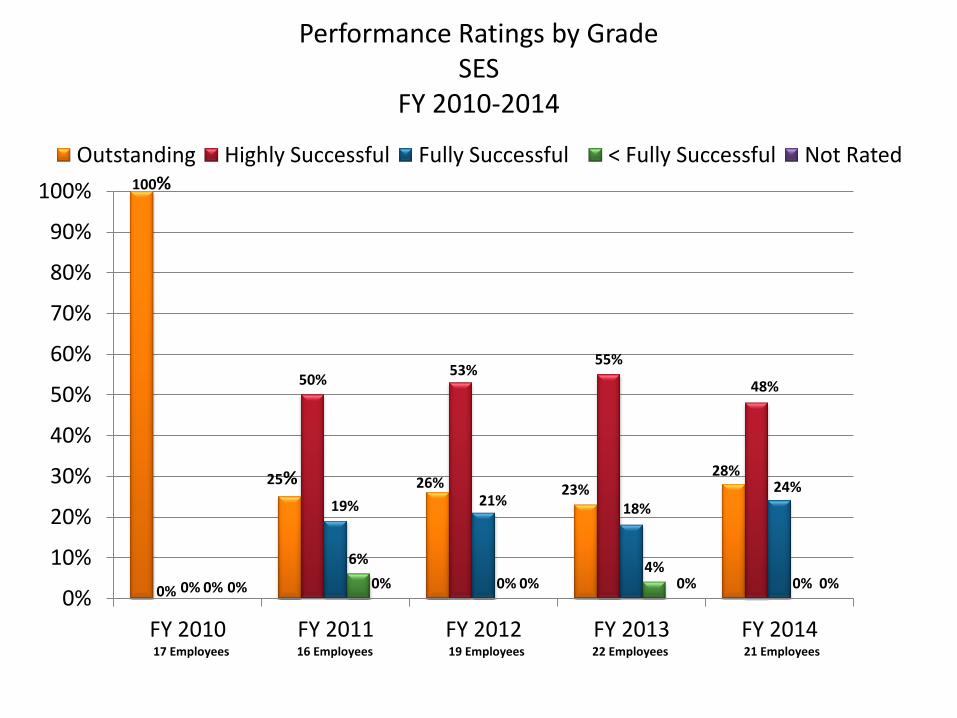
Performance Ratings by Grade SES
FY 2010-2014
100%
25% 26% 23% 28%
0%
50% 53%
55%
48%
0%
19% 21% 18%
24%
0%
6%
0% 4%
0% 0% 0% 0% 0% 0% 0%
10%
20%
30%
40%
50%
60%
70%
80%
90%
100%
FY 2010 FY 2011 FY 2012 FY 2013 FY 2014
Outstanding Highly Successful Fully Successful < Fully Successful Not Rated
17 Employees 21 Employees 22 Employees 19 Employees 16 Employees
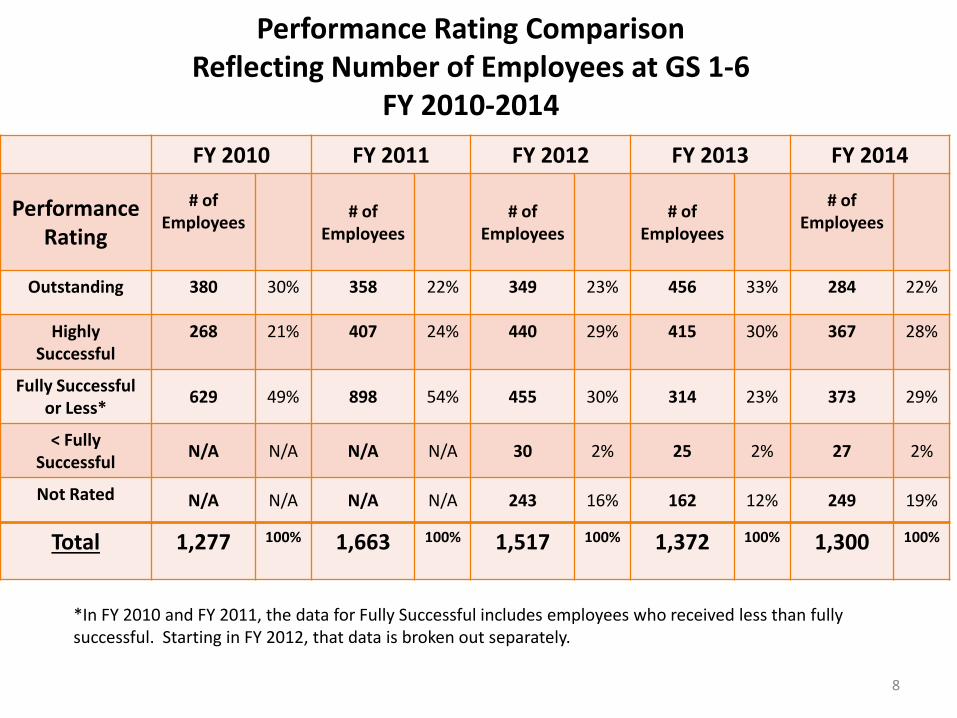
Performance Rating Comparison
Reflecting Number of Employees at GS 1-6 FY 2010-2014
FY 2010 FY 2011 FY 2012 FY 2013 FY 2014
Performance Rating
# of Employees
# of Employees
# of Employees
# of Employees
# of Employees
Outstanding 380 30% 358 22% 349 23% 456 33% 284 22%
Highly Successful
268 21% 407 24% 440 29% 415 30% 367 28%
Fully Successful or Less*
629 49% 898 54% 455 30% 314 23% 373 29%
< Fully Successful
N/A N/A N/A N/A 30 2% 25 2% 27 2%
Not Rated N/A N/A N/A N/A 243 16% 162 12% 249 19%
Total 1,277 100% 1,663 100% 1,517 100% 1,372 100% 1,300 100%
8
*In FY 2010 and FY 2011, the data for Fully Successful includes employees who received less than fully successful. Starting in FY 2012, that data is broken out separately.
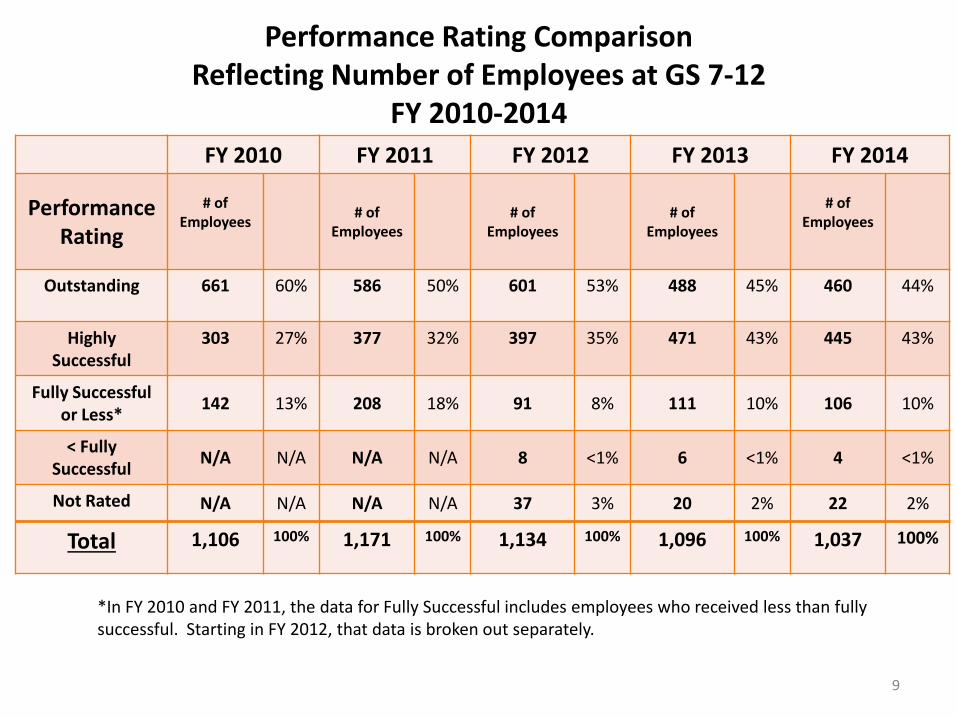
Performance Rating Comparison
Reflecting Number of Employees at GS 7-12 FY 2010-2014
FY 2010 FY 2011 FY 2012 FY 2013 FY 2014
Performance Rating
# of Employees
# of Employees
# of Employees
# of Employees
# of Employees
Outstanding 661 60% 586 50% 601 53% 488 45% 460 44%
Highly Successful
303 27% 377 32% 397 35% 471 43% 445 43%
Fully Successful or Less*
142 13% 208 18% 91 8% 111 10% 106 10%
< Fully Successful
N/A N/A N/A N/A 8 <1% 6 <1% 4 <1%
Not Rated N/A N/A N/A N/A 37 3% 20 2% 22 2%
Total 1,106 100% 1,171 100% 1,134 100% 1,096 100% 1,037 100%
9
*In FY 2010 and FY 2011, the data for Fully Successful includes employees who received less than fully successful. Starting in FY 2012, that data is broken out separately.
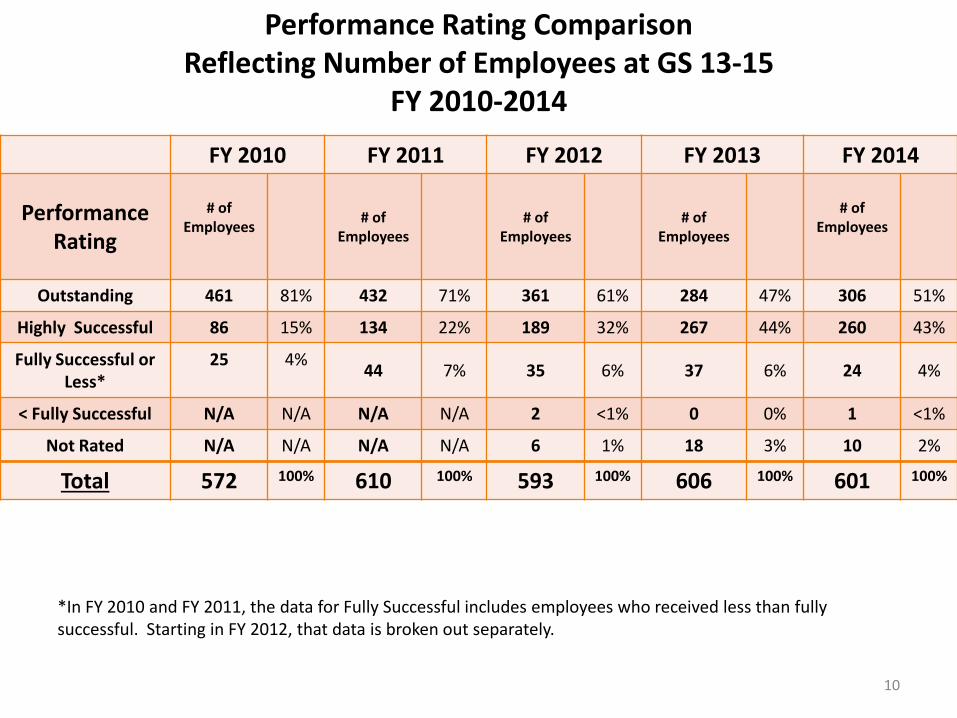
Performance Rating Comparison
Reflecting Number of Employees at GS 13-15 FY 2010-2014
FY 2010 FY 2011 FY 2012 FY 2013 FY 2014
Performance Rating
# of Employees
# of Employees
# of Employees
# of Employees
# of Employees
Outstanding 461 81% 432 71% 361 61% 284 47% 306 51%
Highly Successful 86 15% 134 22% 189 32% 267 44% 260 43%
Fully Successful or Less*
25 4% 44 7% 35 6% 37 6% 24 4%
< Fully Successful N/A N/A N/A N/A 2 <1% 0 0% 1 <1%
Not Rated N/A N/A N/A N/A 6 1% 18 3% 10 2%
Total 572 100% 610 100% 593 100% 606 100% 601 100%
10
*In FY 2010 and FY 2011, the data for Fully Successful includes employees who received less than fully successful. Starting in FY 2012, that data is broken out separately.
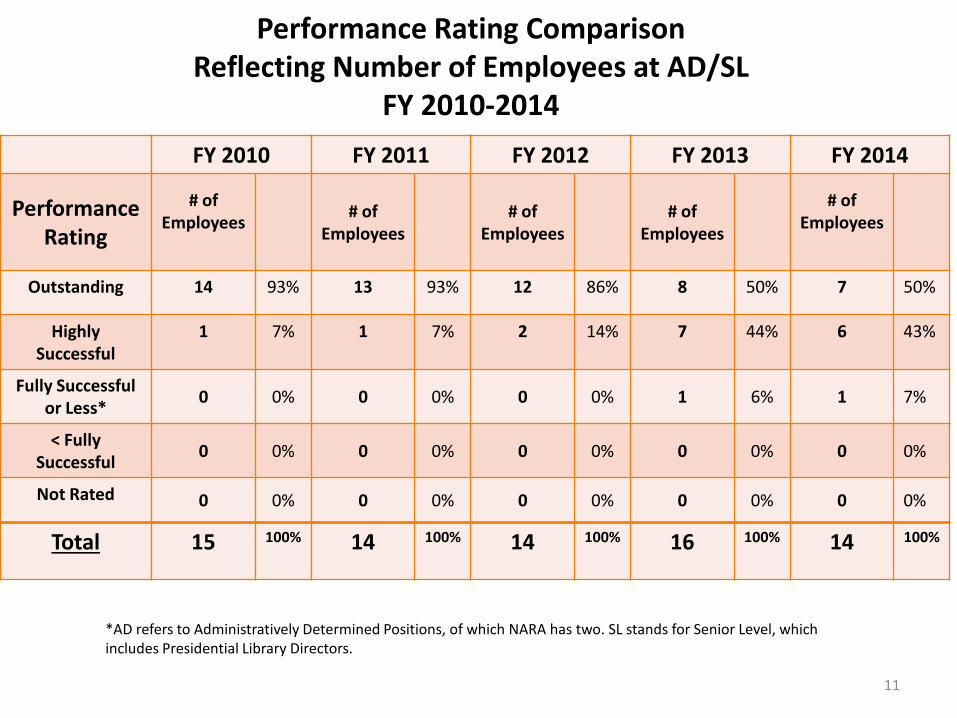
Performance Rating Comparison
Reflecting Number of Employees at AD/SL FY 2010-2014
FY 2010 FY 2011 FY 2012 FY 2013 FY 2014
Performance Rating
# of Employees
# of Employees
# of Employees
# of Employees
# of Employees
Outstanding 14 93% 13 93% 12 86% 8 50% 7 50%
Highly Successful
1 7% 1 7% 2 14% 7 44% 6 43%
Fully Successful or Less*
0 0% 0 0% 0 0% 1 6% 1 7%
< Fully Successful
0 0% 0 0% 0 0% 0 0% 0 0%
Not Rated 0 0% 0 0% 0 0% 0 0% 0 0%
Total 15 100% 14 100% 14 100% 16 100% 14 100%
11
*AD refers to Administratively Determined Positions, of which NARA has two. SL stands for Senior Level, which includes Presidential Library Directors.

Performance Rating Comparison
Reflecting Number of Employees at SES FY 2010-2014
FY 2010 FY 2011 FY 2012 FY 2013 FY 2014
Performance Rating
# of Employees
# of Employees
# of Employees
# of Employees
# of Employees
Outstanding 17 100% 4 25% 5 26% 5 23% 6 28%
Highly Successful
0 0% 8 50% 10 53% 12 55% 10 48%
Fully Successful or
Less* 0 0% 3 19% 4 21% 4 18% 5 24%
< Fully Successful
0 0% 1 6% 0 0% 1 4% 0 0%
Not Rated 0 0% 0 0% 0 0% 0 0% 0 0%
Total 17 100% 16 100% 19 100% 22 100% 21 100%
12