Embed Size (px)
Citation preview
July 2015
QUALITY GUIDELINES FOR ENERGY SYSTEM STUDIES
Performing a Techno-economic Analysis for Power Generation Plants
DOE/NETL-2010/???? DOE/NETL-2015/1726

Techno-economic Analysis Reports Quality Guidelines for Energy System Studies
July 2015
Disclaimer This report was prepared as an account of work sponsored by an agency of the United States Government. Neither the United States Government nor any agency thereof, nor any of their employees, makes any warranty, express or implied, or assumes any legal liability or responsibility for the accuracy, completeness, or usefulness of any information, apparatus, product, or process disclosed or represents that its use would not infringe privately owned rights. Reference therein to any specific commercial product, process, or service by trade name, trademark, manufacturer, or otherwise does not necessarily constitute or imply its endorsement, recommendation, or favoring by the United States Government or any agency thereof. The views and opinions of authors expressed therein do not necessarily state or reflect those of the United States Government or any agency thereof.
National Energy Technology Laboratory Office of Program Performance and Benefits
2
Techno-economic Analysis Reports Quality Guidelines for Energy System Studies
July 2015
Quality Guidelines for Energy System Studies Performing a Techno-economic Analysis for Power
Generation Plants
DOE/NETL-341/020915
Final Report
June 30, 2015
NETL Contact:
James Fisher General Engineer
Office of Program Performance & Benefits, Performance Division
National Energy Technology Laboratory www.netl.doe.gov
National Energy Technology Laboratory Office of Program Performance and Benefits
3
Techno-economic Analysis Reports Quality Guidelines for Energy System Studies
July 2015
Prepared by:
Energy Sector Planning and Analysis
Alex Zoelle Booz Allen Hamilton, Inc.
Marc J. Turner Booz Allen Hamilton, Inc.
Vince Chou Booz Allen Hamilton, Inc.
DOE Contract Number DE-FE0004001
National Energy Technology Laboratory Office of Program Performance and Benefits
4
Techno-economic Analysis Reports Quality Guidelines for Energy System Studies
July 2015
Acknowledgments
This report was prepared by Energy Sector Planning and Analysis (ESPA) for the United States Department of Energy (DOE), National Energy Technology Laboratory (NETL). This work was completed under DOE NETL Contract Number DE-FE0004001. This work was performed under ESPA Task 341.03.01.
The authors wish to acknowledge the excellent guidance, contributions, and cooperation of the NETL staff, particularly—
James C. Fisher II, General Engineer Travis Shultz, Director, Performance Division
Kristin Gerdes, Director, Office of Program Performance and Benefits James Black, General Engineer, Office of Research and Development
Michael Matuszewski, formerly NETL
National Energy Technology Laboratory Office of Program Performance and Benefits
5

Techno-economic Analysis Reports Quality Guidelines for Energy System Studies
July 2015
This page intentionally left blank.
National Energy Technology Laboratory Office of Program Performance and Benefits
6
Techno-economic Analysis Reports Quality Guidelines for Energy System Studies
July 2015
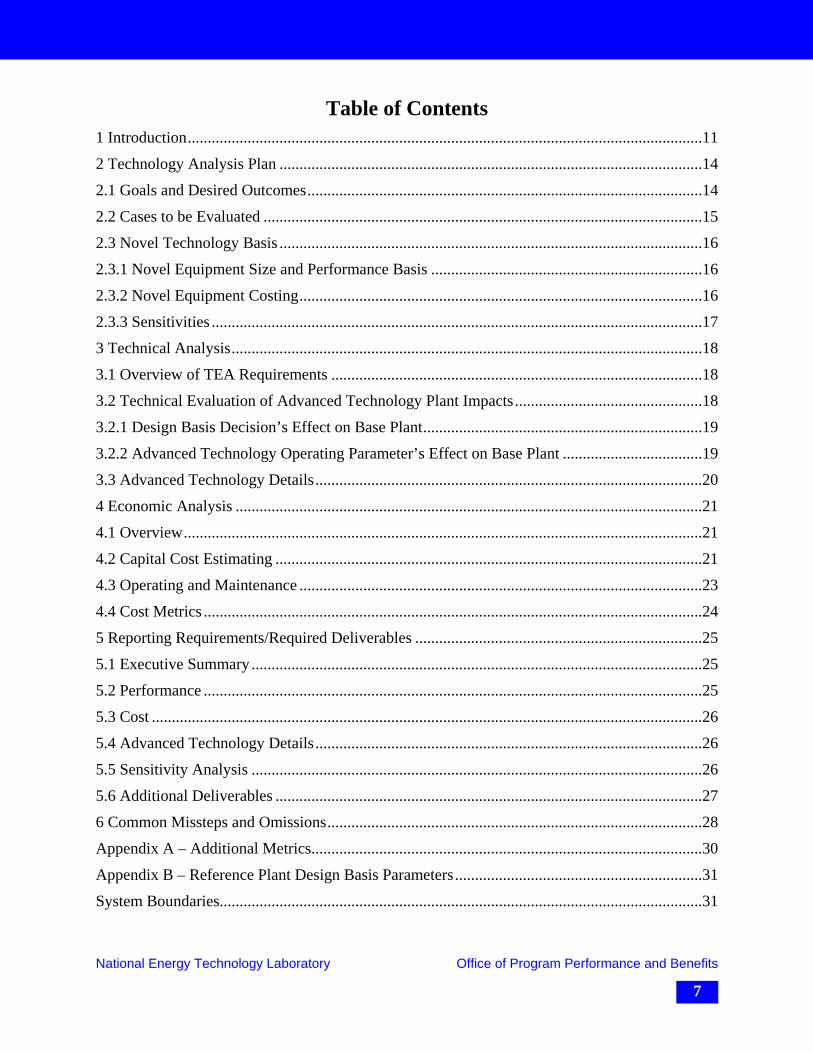
Table of Contents 1 Introduction .................................................................................................................................11
2 Technology Analysis Plan ..........................................................................................................14
2.1 Goals and Desired Outcomes ...................................................................................................14
2.2 Cases to be Evaluated ..............................................................................................................15
2.3 Novel Technology Basis ..........................................................................................................16
2.3.1 Novel Equipment Size and Performance Basis ....................................................................16
2.3.2 Novel Equipment Costing .....................................................................................................16
2.3.3 Sensitivities ...........................................................................................................................17
3 Technical Analysis ......................................................................................................................18
3.1 Overview of TEA Requirements .............................................................................................18
3.2 Technical Evaluation of Advanced Technology Plant Impacts ...............................................18
3.2.1 Design Basis Decision’s Effect on Base Plant ......................................................................19
3.2.2 Advanced Technology Operating Parameter’s Effect on Base Plant ...................................19
3.3 Advanced Technology Details .................................................................................................20
4 Economic Analysis .....................................................................................................................21
4.1 Overview ..................................................................................................................................21
4.2 Capital Cost Estimating ...........................................................................................................21
4.3 Operating and Maintenance .....................................................................................................23
4.4 Cost Metrics .............................................................................................................................24
5 Reporting Requirements/Required Deliverables ........................................................................25
5.1 Executive Summary .................................................................................................................25
5.2 Performance .............................................................................................................................25
5.3 Cost ..........................................................................................................................................26
5.4 Advanced Technology Details .................................................................................................26
5.5 Sensitivity Analysis .................................................................................................................26
5.6 Additional Deliverables ...........................................................................................................27
6 Common Missteps and Omissions ..............................................................................................28
Appendix A – Additional Metrics ..................................................................................................30
Appendix B – Reference Plant Design Basis Parameters ..............................................................31
System Boundaries.........................................................................................................................31
National Energy Technology Laboratory Office of Program Performance and Benefits
7
Techno-economic Analysis Reports Quality Guidelines for Energy System Studies
July 2015
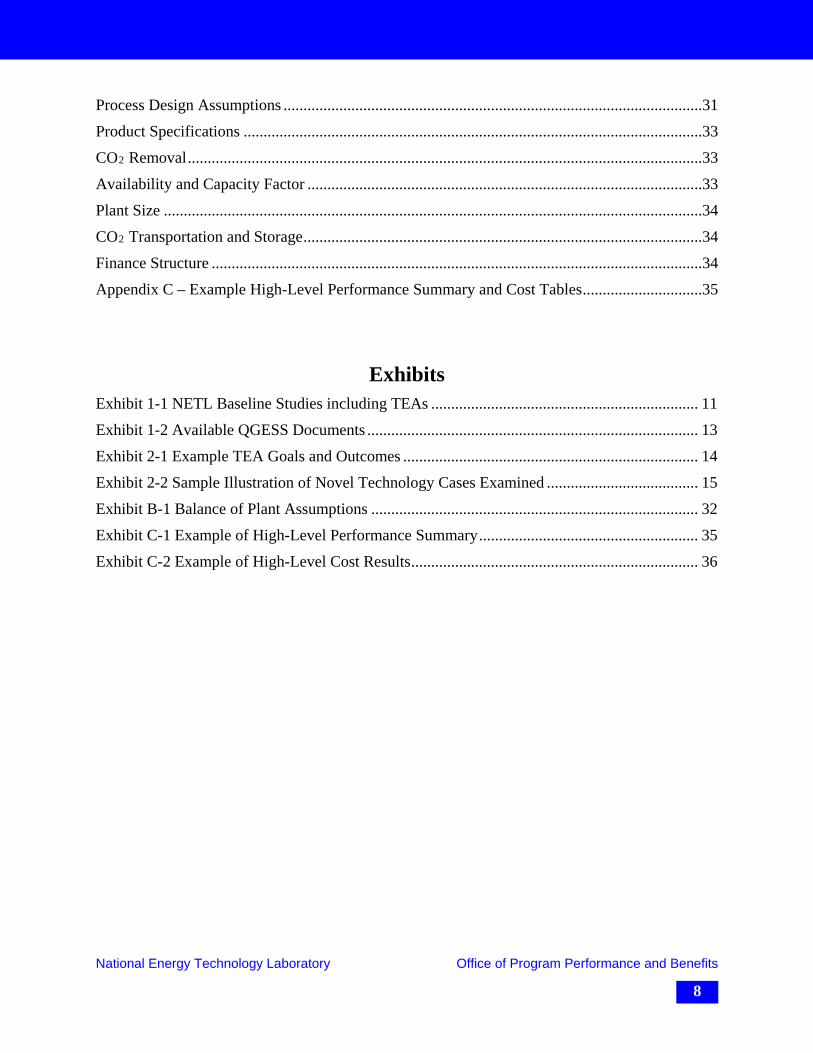
Process Design Assumptions .........................................................................................................31
Product Specifications ...................................................................................................................33
CO2 Removal .................................................................................................................................33
Availability and Capacity Factor ...................................................................................................33
Plant Size .......................................................................................................................................34
CO2 Transportation and Storage ....................................................................................................34
Finance Structure ...........................................................................................................................34
Appendix C – Example High-Level Performance Summary and Cost Tables ..............................35
Exhibits Exhibit 1-1 NETL Baseline Studies including TEAs ................................................................... 11
Exhibit 1-2 Available QGESS Documents ................................................................................... 13
Exhibit 2-1 Example TEA Goals and Outcomes .......................................................................... 14
Exhibit 2-2 Sample Illustration of Novel Technology Cases Examined ...................................... 15
Exhibit B-1 Balance of Plant Assumptions .................................................................................. 32
Exhibit C-1 Example of High-Level Performance Summary ....................................................... 35
Exhibit C-2 Example of High-Level Cost Results ........................................................................ 36
National Energy Technology Laboratory Office of Program Performance and Benefits
8
Techno-economic Analysis Reports Quality Guidelines for Energy System Studies
July 2015
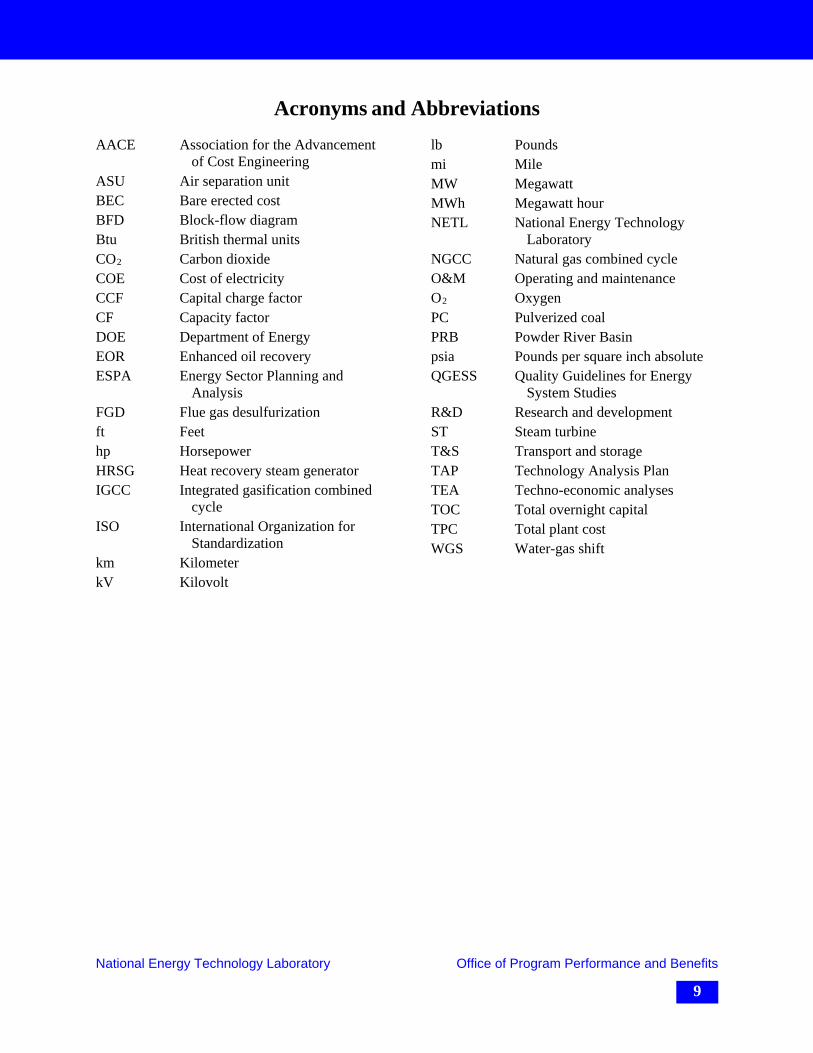
Acronyms and Abbreviations AACE Association for the Advancement
of Cost Engineering ASU Air separation unit BEC Bare erected cost BFD Block-flow diagram Btu British thermal units CO2 Carbon dioxide COE Cost of electricity CCF Capital charge factor CF Capacity factor DOE Department of Energy EOR Enhanced oil recovery ESPA Energy Sector Planning and
Analysis FGD Flue gas desulfurization ft Feet hp Horsepower HRSG Heat recovery steam generator IGCC Integrated gasification combined
cycle ISO International Organization for
Standardization km Kilometer kV Kilovolt
lb Pounds mi Mile MW Megawatt MWh Megawatt hour NETL National Energy Technology
Laboratory NGCC Natural gas combined cycle O&M Operating and maintenance O2 Oxygen PC Pulverized coal PRB Powder River Basin psia Pounds per square inch absolute QGESS Quality Guidelines for Energy
System Studies R&D Research and development ST Steam turbine T&S Transport and storage TAP Technology Analysis Plan TEA Techno-economic analyses TOC Total overnight capital TPC Total plant cost WGS Water-gas shift
National Energy Technology Laboratory Office of Program Performance and Benefits
9

Techno-economic Analysis Reports Quality Guidelines for Energy System Studies
July 2015
This page intentionally left blank.
National Energy Technology Laboratory Office of Program Performance and Benefits
10
Techno-economic Analysis Reports Quality Guidelines for Energy System Studies
July 2015
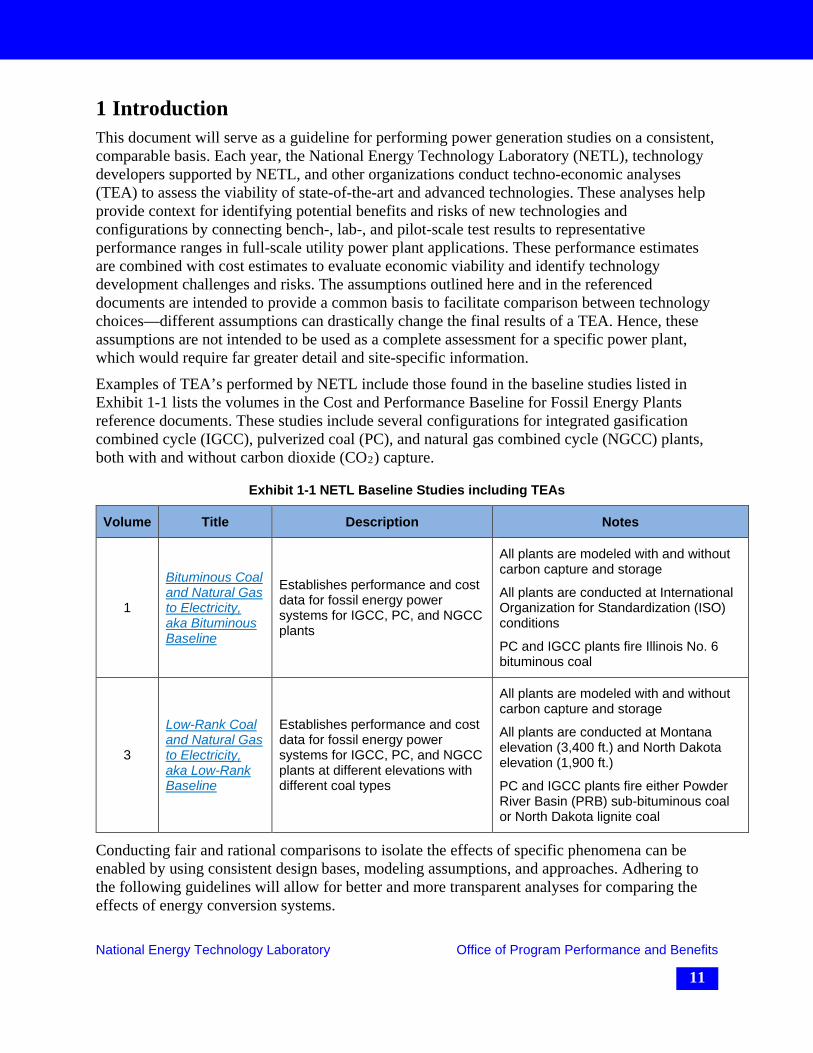
1 Introduction This document will serve as a guideline for performing power generation studies on a consistent, comparable basis. Each year, the National Energy Technology Laboratory (NETL), technology developers supported by NETL, and other organizations conduct techno-economic analyses (TEA) to assess the viability of state-of-the-art and advanced technologies. These analyses help provide context for identifying potential benefits and risks of new technologies and configurations by connecting bench-, lab-, and pilot-scale test results to representative performance ranges in full-scale utility power plant applications. These performance estimates are combined with cost estimates to evaluate economic viability and identify technology development challenges and risks. The assumptions outlined here and in the referenced documents are intended to provide a common basis to facilitate comparison between technology choices—different assumptions can drastically change the final results of a TEA. Hence, these assumptions are not intended to be used as a complete assessment for a specific power plant, which would require far greater detail and site-specific information.
Examples of TEA’s performed by NETL include those found in the baseline studies listed in Exhibit 1-1 lists the volumes in the Cost and Performance Baseline for Fossil Energy Plants reference documents. These studies include several configurations for integrated gasification combined cycle (IGCC), pulverized coal (PC), and natural gas combined cycle (NGCC) plants, both with and without carbon dioxide (CO2) capture.
Exhibit 1-1 NETL Baseline Studies including TEAs
Volume Title Description Notes
1
Bituminous Coal and Natural Gas to Electricity, aka Bituminous Baseline
Establishes performance and cost data for fossil energy power systems for IGCC, PC, and NGCC plants
All plants are modeled with and without carbon capture and storage
All plants are conducted at International Organization for Standardization (ISO) conditions
PC and IGCC plants fire Illinois No. 6 bituminous coal
3
Low-Rank Coal and Natural Gas to Electricity, aka Low-Rank Baseline
Establishes performance and cost data for fossil energy power systems for IGCC, PC, and NGCC plants at different elevations with different coal types
All plants are modeled with and without carbon capture and storage
All plants are conducted at Montana elevation (3,400 ft.) and North Dakota elevation (1,900 ft.)
PC and IGCC plants fire either Powder River Basin (PRB) sub-bituminous coal or North Dakota lignite coal
Conducting fair and rational comparisons to isolate the effects of specific phenomena can be enabled by using consistent design bases, modeling assumptions, and approaches. Adhering to the following guidelines will allow for better and more transparent analyses for comparing the effects of energy conversion systems.
National Energy Technology Laboratory Office of Program Performance and Benefits
11
Techno-economic Analysis Reports Quality Guidelines for Energy System Studies
July 2015
A TEA report is required to include—
• General block flow diagrams identifying all major process equipment and/or steps (for example, CO2 capture and compression systems, separation process equipment, heat exchangers, pumps, and compressors).
• Material and energy balances around the complete plant and all major pieces of equipment or process areas, including all heating and cooling duties and electric power requirements. A level of reporting similar to that found in the baseline studies referenced above is expected.
• Complete stream tables showing operating pressures, temperatures, compositions, and enthalpies for all streams entering or leaving major process equipment.
• Economic analysis providing a detailed code of accounts for the capital cost estimate. Operating and maintenance (O&M) costs should be itemized to a similar level of detail as shown in the baseline studies referenced above. Greater costing detail is expected for equipment related to the research topic.
• Estimates prepared by the technology developer for equipment and consumables unique to the process being developed.
o If possible, capital cost estimates for unique equipment should be made based on similar equipment that may exist for other type processes.
o If equipment analogs do not exist for unique equipment, the developer should do a bottom-up estimate of the unique equipment.
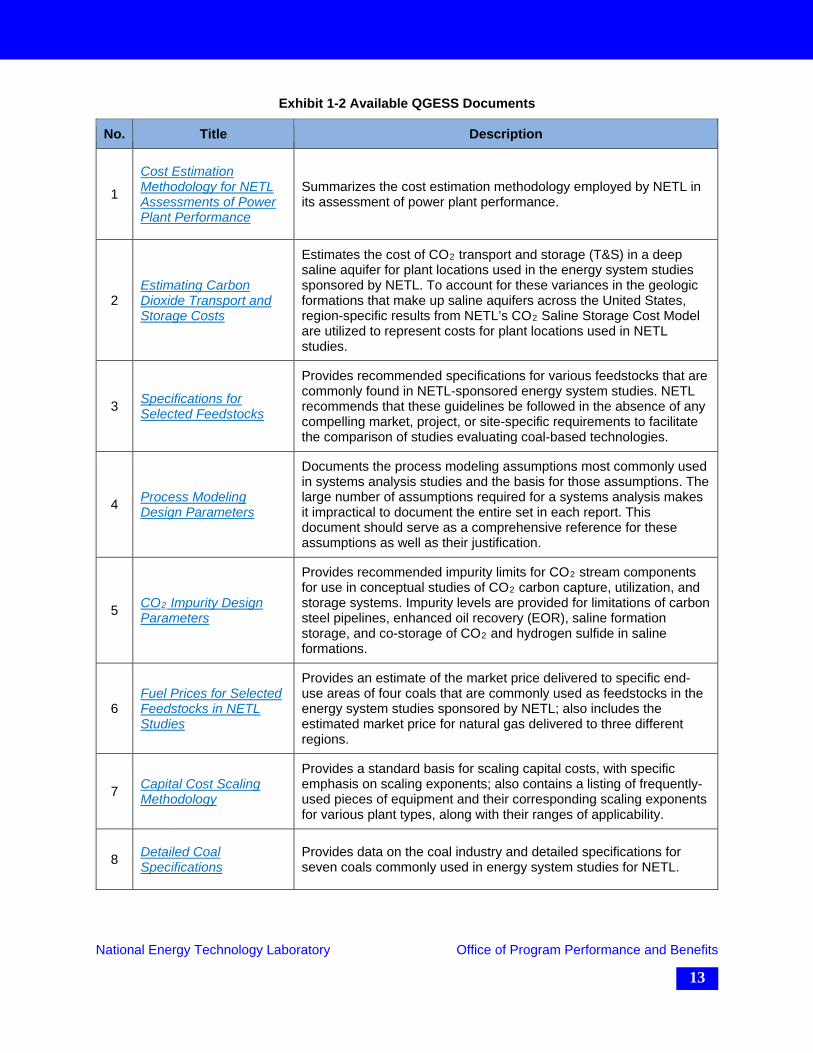
This Quality Guideline for Energy System Studies (QGESS) document defines the suggested minimum analysis requirements and describes NETL’s process for performing TEAs, including typical suggestions and optional analyses that help demonstrate understanding and guide R&D efforts. The TEA QGESS is one in a series of QGESS documents that outlines the assumptions utilized in the baseline studies and can provide guidance for developing the reference plant. These documents are organized and available on NETL’s Quality Guideline website1. A listing of the available QGESS documents is provided in Exhibit 1-2 with a brief description of each.
The balance of this document details information that should be considered while—
• Developing the analysis plan
• Performing the technical analysis
• Performing the economic analysis
• Reporting the results
1 NETL’s Quality Guideline website can be found at http://www.netl.doe.gov/research/energy-analysis/quality-guidelines-qgess
National Energy Technology Laboratory Office of Program Performance and Benefits
12
Techno-economic Analysis Reports Quality Guidelines for Energy System Studies
July 2015
Exhibit 1-2 Available QGESS Documents
No. Title Description
1
Cost Estimation Methodology for NETL Assessments of Power Plant Performance
Summarizes the cost estimation methodology employed by NETL in its assessment of power plant performance.
2 Estimating Carbon Dioxide Transport and Storage Costs
Estimates the cost of CO2 transport and storage (T&S) in a deep saline aquifer for plant locations used in the energy system studies sponsored by NETL. To account for these variances in the geologic formations that make up saline aquifers across the United States, region-specific results from NETL’s CO2 Saline Storage Cost Model are utilized to represent costs for plant locations used in NETL studies.
3 Specifications for Selected Feedstocks
Provides recommended specifications for various feedstocks that are commonly found in NETL-sponsored energy system studies. NETL recommends that these guidelines be followed in the absence of any compelling market, project, or site-specific requirements to facilitate the comparison of studies evaluating coal-based technologies.
4 Process Modeling Design Parameters
Documents the process modeling assumptions most commonly used in systems analysis studies and the basis for those assumptions. The large number of assumptions required for a systems analysis makes it impractical to document the entire set in each report. This document should serve as a comprehensive reference for these assumptions as well as their justification.
5 CO2 Impurity Design Parameters
Provides recommended impurity limits for CO2 stream components for use in conceptual studies of CO2 carbon capture, utilization, and storage systems. Impurity levels are provided for limitations of carbon steel pipelines, enhanced oil recovery (EOR), saline formation storage, and co-storage of CO2 and hydrogen sulfide in saline formations.
6 Fuel Prices for Selected Feedstocks in NETL Studies
Provides an estimate of the market price delivered to specific end-use areas of four coals that are commonly used as feedstocks in the energy system studies sponsored by NETL; also includes the estimated market price for natural gas delivered to three different regions.
7 Capital Cost Scaling Methodology
Provides a standard basis for scaling capital costs, with specific emphasis on scaling exponents; also contains a listing of frequently-used pieces of equipment and their corresponding scaling exponents for various plant types, along with their ranges of applicability.
8 Detailed Coal Specifications
Provides data on the coal industry and detailed specifications for seven coals commonly used in energy system studies for NETL.
National Energy Technology Laboratory Office of Program Performance and Benefits
13
Techno-economic Analysis Reports Quality Guidelines for Energy System Studies
July 2015
2 Technology Analysis Plan The Technology Analysis Plan (TAP) is a roadmap for executing a TEA. It is prepared prior to conducting the TEA and includes the overall process design basis as outlined in Appendix B, a concise description of the cost and performance basis for the novel technology, and the interfaces with the base plant. The path from technology concept to commercial embodiment involves many R&D stages, and the design data that are available can vary significantly at each stage. The TAP includes clearly defined process design and operating parameters and presents the available experimental data and theoretical analyses used to support design choices. A key feature of conducting a TEA is identification of data gaps, which can guide R&D efforts; if data gaps are known or identified while conducting the preliminary TAP, discussion of these data gaps with the stakeholders and how they will be addressed with regards to completing the TEA should be done prior to proceeding with the full TEA analysis.
Typically, a TEA is conducted first by modeling a reference plant, and then by inserting a novel technology into the reference plant. The TAP must clearly define the reference plant, which should replicate one of the plants found in NETL’s baseline studies, as shown in Exhibit 1-1. The design basis elements in Appendix B represent the key technology and process parameter choices that are needed to maintain consistency with the chosen baseline plant reference. Deviations from the reference plant design basis must be described and justified.
In instances where the novel technology enables and/or requires application of other advanced technologies, the TAP defines the cases to be evaluated in the TEA step by step.
The elements of the TAP are discussed in more detail in the following sections.
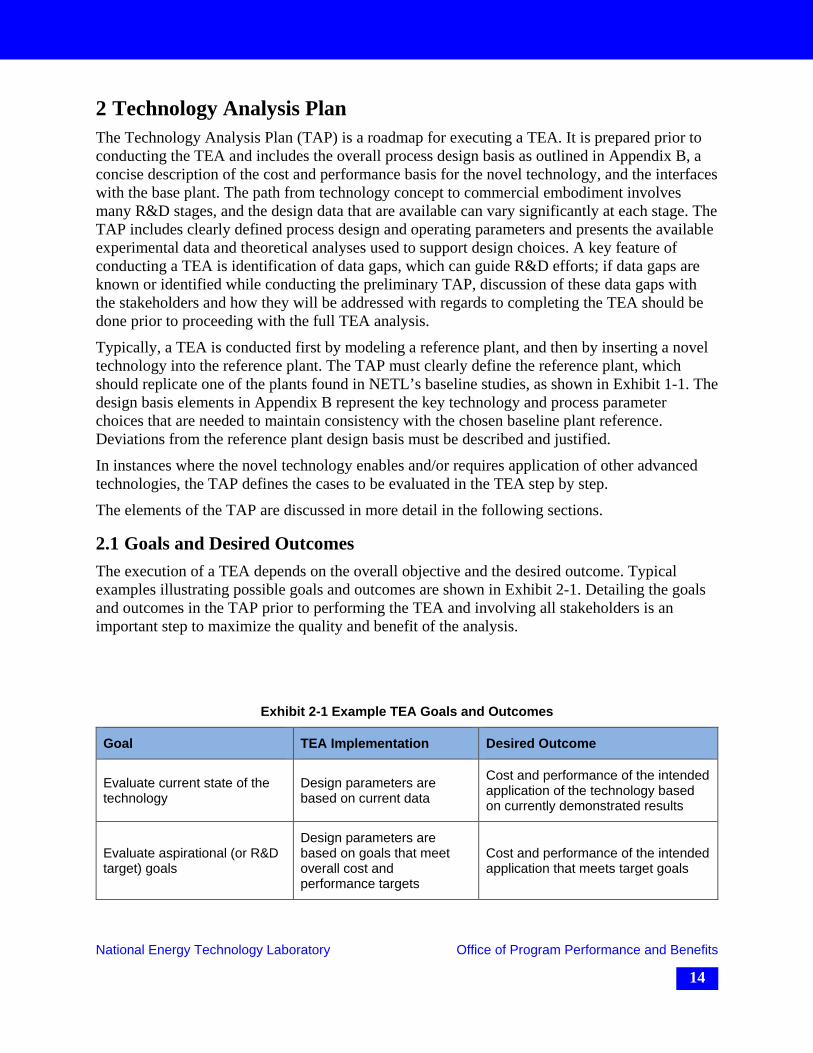
2.1 Goals and Desired Outcomes The execution of a TEA depends on the overall objective and the desired outcome. Typical examples illustrating possible goals and outcomes are shown in Exhibit 2-1. Detailing the goals and outcomes in the TAP prior to performing the TEA and involving all stakeholders is an important step to maximize the quality and benefit of the analysis.
Exhibit 2-1 Example TEA Goals and Outcomes
Goal TEA Implementation Desired Outcome
Evaluate current state of the technology
Design parameters are based on current data
Cost and performance of the intended application of the technology based on currently demonstrated results
Evaluate aspirational (or R&D target) goals
Design parameters are based on goals that meet overall cost and performance targets
Cost and performance of the intended application that meets target goals
National Energy Technology Laboratory Office of Program Performance and Benefits
14
Techno-economic Analysis Reports Quality Guidelines for Energy System Studies
July 2015
2.2 Cases to be Evaluated A complete TEA includes a non-capture reference case selected from either the Bituminous Baseline or Low-Rank Baseline (Exhibit 1-1) and a second case implementing the novel technology. The primary intent of specifying the reference plant is to provide a common starting point for evaluating different technologies. However, if the advanced technology is not applicable to any of the baseline reference cases, a new reference case can be created. The new reference case, at a minimum, is reported at the same level of detail shown in the baseline studies.
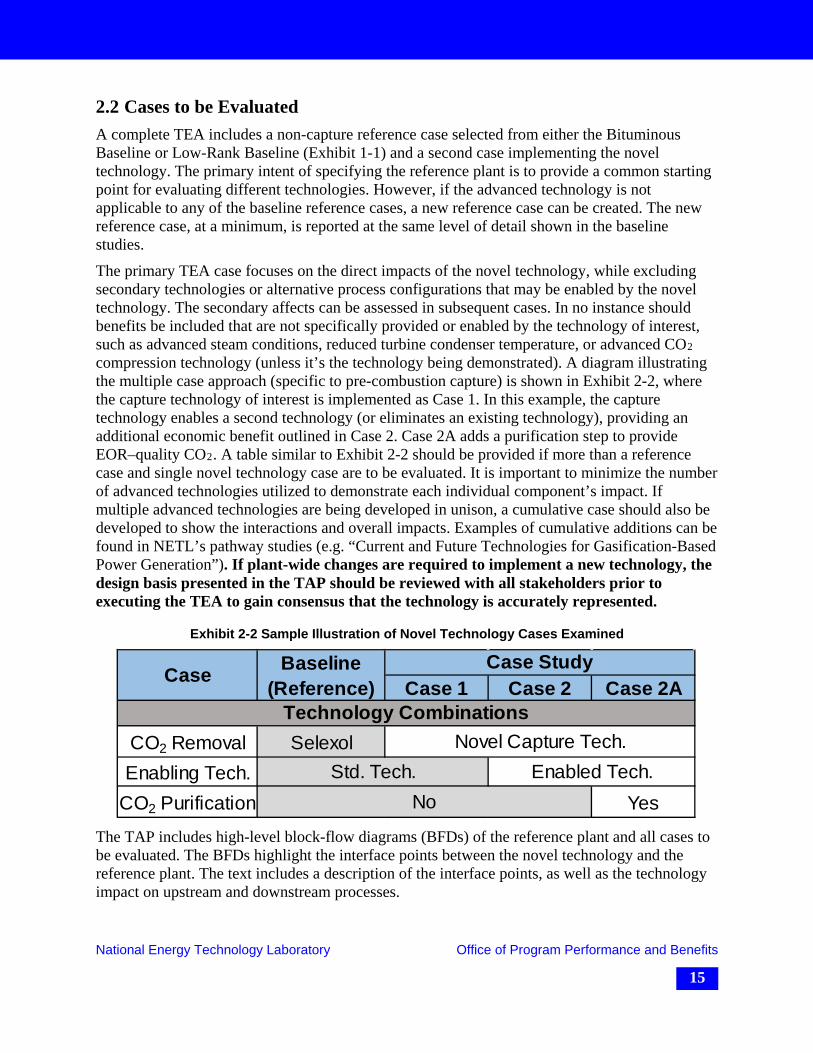
The primary TEA case focuses on the direct impacts of the novel technology, while excluding secondary technologies or alternative process configurations that may be enabled by the novel technology. The secondary affects can be assessed in subsequent cases. In no instance should benefits be included that are not specifically provided or enabled by the technology of interest, such as advanced steam conditions, reduced turbine condenser temperature, or advanced CO2 compression technology (unless it’s the technology being demonstrated). A diagram illustrating the multiple case approach (specific to pre-combustion capture) is shown in Exhibit 2-2, where the capture technology of interest is implemented as Case 1. In this example, the capture technology enables a second technology (or eliminates an existing technology), providing an additional economic benefit outlined in Case 2. Case 2A adds a purification step to provide EOR–quality CO2. A table similar to Exhibit 2-2 should be provided if more than a reference case and single novel technology case are to be evaluated. It is important to minimize the number of advanced technologies utilized to demonstrate each individual component’s impact. If multiple advanced technologies are being developed in unison, a cumulative case should also be developed to show the interactions and overall impacts. Examples of cumulative additions can be found in NETL’s pathway studies (e.g. “Current and Future Technologies for Gasification-Based Power Generation”). If plant-wide changes are required to implement a new technology, the design basis presented in the TAP should be reviewed with all stakeholders prior to executing the TEA to gain consensus that the technology is accurately represented.
Exhibit 2-2 Sample Illustration of Novel Technology Cases Examined
The TAP includes high-level block-flow diagrams (BFDs) of the reference plant and all cases to be evaluated. The BFDs highlight the interface points between the novel technology and the reference plant. The text includes a description of the interface points, as well as the technology impact on upstream and downstream processes.
Case 1 Case 2 Case 2A
CO2 Removal SelexolEnabling Tech.
CO2 Purification YesNo
Novel Capture Tech.Enabled Tech.
Case Baseline (Reference)
Case Study
Technology Combinations
Std. Tech.
National Energy Technology Laboratory Office of Program Performance and Benefits
15
Techno-economic Analysis Reports Quality Guidelines for Energy System Studies
July 2015
2.3 Novel Technology Basis Innovative technologies frequently require novel equipment items, advanced materials of construction, unique chemicals, and/or new process configurations. Accurate cost and performance of these items are frequently unknown at the outset of the development program. Execution of a TEA requires that some assumptions be made to predict cost and performance parameters. The TAP documents key assumptions and the approach for novel equipment size, performance basis, and costing as detailed in the following sections.
2.3.1 Novel Equipment Size and Performance Basis As a technology is developed and tested, the quantity, quality, and scale of components change. The TAP provides the basis for relevant process phenomena, which includes items such as reaction chemistry, equipment sizing and costing, materials selection, mitigation of trace element impacts, particle attrition, or material degradation. In cases where data are not yet available, the assumptions used to model the equipment design and performance are to be clearly stated and justified. Typical assumptions when data are lacking may include—
• Size and/or performance is based on a similar piece of equipment in a different commercial application
• Size and/or performance is based on aspirational R&D goals not yet achieved
• Size and/or performance is based on engineering calculations not yet verified experimentally
In the instance where data do not yet exist, the TAP documents data gaps for future R&D.
2.3.2 Novel Equipment Costing Once sized, a cost for the novel equipment must be estimated to complete the TEA. Several possible cost methods are listed here—
• Obtain a vendor quote.
• Scale from an analogous equipment item that is similar in size and function.
• Scale from a vendor quote for similar equipment scaled to the appropriate size.
• Estimate the amount and cost of required raw materials, and apply a manufacturing cost multiplier.
• Calculate an allowable cost based on meeting a cost of electricity (COE) target.
If a vendor quote can be obtained, it is the most direct and accurate means of cost estimating. Frequently, vendor quotes are not practical at an early stage of technology development. In that case, the preferred method for costing is to use an analogous piece of equipment from the reference plant and scale it using an appropriate process parameter and scaling exponent. Scaling a vendor quote for a similar equipment item used in a commercial-scale process or performing a bottom-up cost estimate where the amount of raw material is estimated and a manufacturing fee is applied are also acceptable methods. While less desirable, a bottom-up cost estimate is acceptable for novel equipment that does not have an analogous equivalent. The final, though
National Energy Technology Laboratory Office of Program Performance and Benefits
16
Techno-economic Analysis Reports Quality Guidelines for Energy System Studies
July 2015
least favored, method is a cost based on research goals. In this method, the COE is assumed (and justified) and the allowable cost for the novel equipment is calculated. If this method is applied, a detailed justification as to why the other methods are not applicable should be provided.
The balance of plant equipment that is changed in size only should be scaled according to QGESS #7 “Capital Cost Scaling Methodology.”
2.3.3 Sensitivities Sensitivity analyses are important to identify salient design and operating parameters and to gain understanding that is important for guiding the technology development. Sensitivity analyses change a single variable while holding the balance of the plant constant. The efficiency and COE can be calculated for select values of the sensitivity variables to quantify the importance of that variable. The TAP identifies planned sensitivity analyses, taking into account the key assumptions and any data limitations regarding the novel technology performance and cost. Frequently used variables include capital cost, reaction rates, and general performance characteristics. In early development stages, sensitivity studies should be broad and bound by fundamental understanding of the technology. As the technology matures, the sensitivities should become more focused on the expected performance verified through experimental data.
National Energy Technology Laboratory Office of Program Performance and Benefits
17
Techno-economic Analysis Reports Quality Guidelines for Energy System Studies
July 2015
3 Technical Analysis
3.1 Overview of TEA Requirements This section details the required elements for the technical analysis. The TEA must include results in such a form and level of detail sufficient to facilitate a meaningful technical analysis of the advanced technology. The TEA should include—
• Block flow diagram and accompanying stream tables
• Performance summary
• Air emissions tables
• Carbon, sulfur, and water balances
• Itemized equipment list
The block flow diagram identifies all major process areas for the power plant, including, but not limited to, CO2 capture and compression systems, separation equipment, heat exchangers, pumps, and compressors. Examples of these can be found in the baseline studies and can be referenced to simplify the development of the TEA. Once the reference plant has been selected, the block flow diagram for the TEA should start with the reference case and substitute the advanced technology for the reference technology with additional streams routed as appropriate. It should be discussed if the advanced technology requires, or may benefit from, integration that is different from the original reference technology’s integration in the base case, giving justification for the change and identifying performance implications for other sub-systems.
Material and energy balances around the complete power plant and all major pieces of equipment are required to be shown (proprietary data can be marked or removed in a supplementary redacted version, in accordance with the provisions of the cooperative agreement, if applicable). These should include all heating and cooling duties, as well as electric power requirements. Material and energy balance calculations must be accurate; equilibria and physical and thermodynamic properties must be calculated using rigorous models. A convenient way to perform the material and energy balance calculations is by using a process simulator, such as Aspen Plus® or other process model simulation software. For simple systems, a spreadsheet analysis may be possible. The methods and models used must be documented in the final TEA report. For cases where the advanced technology employs novel approaches to mass and heat transfer, sufficient detail surrounding the process and calculations should be given.
Complete stream tables should also be included and should contain operating pressures, temperatures, compositions, and enthalpies for all streams entering or leaving major process equipment. The property methods used for determining thermo-physical properties should follow those given in the QGESS #4 document “Process Modeling Design Parameters.” The property methods to be used are determined by the location of the process in the overall model.
3.2 Technical Evaluation of Advanced Technology Plant Impacts The performance of the advanced technology integrated into the power plant and how it compares to the reference case technology is a key result of the TEA. The elements discussed in
National Energy Technology Laboratory Office of Program Performance and Benefits
18
Techno-economic Analysis Reports Quality Guidelines for Energy System Studies
July 2015
Section 3.1 allow for this comparison of performance, emissions, and equipment requirements. In addition, it is important to identify how design choices affect the base plant and how these effects carry through to the advanced technology. The reverse is also important because operating parameters of the advanced technology may impact other sub-systems in the power plant. A comparison table for the performance summaries, with line item auxiliary loads, can show the intended benefit of the advanced technology, especially if the pertinent scaling parameters are displayed. This section presents several specific examples of these types of design choices and impacts, but the technical evaluation is not limited to these scenarios.
3.2.1 Design Basis Decision’s Effect on Base Plant Ambient Condition’s Effect on Condenser Performance—The choice of plant location and ambient conditions combined with cooling system type (wet, dry, or parallel cooling) and temperature approaches determine the cooling water temperature and steam turbine condenser pressure, which can drastically affect the performance of the plant. Any major deviations should be noted and justified based on the requirements of the advanced technologies, and the standard analysis should use similar assumptions to eliminate any unnecessary bias.
Cooling Water Temperature—The selection of cooling water temperature can have large impacts on performance estimates, especially for compressor intercooling and the steam turbine condenser pressure. If the cooling water temperature selected deviates from NETL baseline case assumptions selected, models should be developed to predict the performance impacts. If the cooling water temperature selected matches the baseline case, simple scaling based on mass flow may be used.
Temperature Approach and Pressure Drop—The QGESS #4 document “Process Modeling Design Parameters” gives recommended temperature approaches and pressure drops to be used in TEAs. These parameters are suggested, and advanced technology may come with the benefit of decreased pressure drop or the ability to reduce temperature approach. These parameters, such as the ones used for advanced heat recovery from a rich/lean solvent cross exchanger, should be highlighted in the TEA.
3.2.2 Advanced Technology Operating Parameter’s Effect on Base Plant CO2 Capture System Operating Pressure—The operating pressure of a CO2 capture system impacts both the auxiliary power requirement of the plant and the capital cost of the CO2 compressors. Consequently, this downstream impact should be clearly identified and included in the evaluation of the capture technology on the overall plant performance.
For example, advanced solvents may have the ability to operate at increased pressure with equivalent or improved performance compared to their conventional counterparts. One of the downstream effects is the elevated pressure of the regenerated CO2 stream that is compressed to the pipeline specification. CO2 compression auxiliaries can account for as much as 40 percent of a PC power plants’ auxiliary load; a reduction in compression ratio stemming from increased regeneration pressure should have a beneficial impact in reducing this large parasitic load, as well as the capital cost component of the compression train.
Adjustments to Systems that Perform Secondary Functions—Several sub-systems serve multiple areas or perform multiple functions for the plant. In instances where the advanced
National Energy Technology Laboratory Office of Program Performance and Benefits
19
Techno-economic Analysis Reports Quality Guidelines for Energy System Studies
July 2015
technology attempts to improve the performance of a primary function of a sub-system, any impact on secondary functions should be discussed and quantified, if possible.
For example, the primary function of the wet flue gas desulfurization (FGD) is to remove sulfur from the flue gas. However, a secondary effect of the wet FGD is to capture water-soluble oxidized mercury. The mercury mitigation systems of PC plants can use co-benefit capture via selective catalytic reduction, fabric filters, and wet FGD, aided with chemical injection. All of these systems have other primary functions but cumulatively support a secondary function of mercury capture. These types of considerations require a complete understanding of the overall power plant and should be acknowledged when the advanced technology targets these systems.
Sub-system Integration—Common utilities that are shared throughout the plant, such as cooling water, process water, and steam, need to be considered to fully characterize the effect of an advanced technology. In addition, heat integration is essential to maximizing plant efficiency, particularly in IGCC and NGCC plants. The quality and amount of heat available at any one point in the system are important when determining how and where to integrate that heat with other sub-systems. Any assumptions on the availability of heat sinks or sources should be discussed to help justify the associated costs and benefits.
For example, in IGCC cases, heat is recovered from the exothermic reaction taking place in the water-gas shift (WGS) reactors. This heat and other waste heat are used to generate steam that is sent back to the inlet of the WGS reactors. If the advanced technology targets a WGS catalyst that operates at significantly lower temperature, the quantity of waste heat to be recovered may be reduced, and the plant’s heat integration may need to be adjusted.
This type of analysis requires a strong understanding of the selected reference base case configuration and operating principles. However, development and analysis of an emerging technology is incomplete if the overall effects of the system on the base plant are not well characterized.
3.3 Advanced Technology Details Each advanced technology will have performance parameters that are essential to understanding the system and the TEA results. An example of this type of parameter is the steam required to regenerate a CO2 capture solvent, normally reported in Btu/lb CO2. For an advanced solvent CO2 capture technology, comparison of this steam requirement between the advanced technology and reference technology shows the benefit of the new solvent. For TEAs, these performance parameter values used for the critical components should be highlighted. Additionally, the experimental data from where the performance parameters derive and the projections of performance parameters due to scale-up or other factors should also be discussed. Itemized equipment lists for equipment unique to the advanced technology and other equipment required for integration to the power plant should also be reported.
National Energy Technology Laboratory Office of Program Performance and Benefits
20
Techno-economic Analysis Reports Quality Guidelines for Energy System Studies
July 2015
4 Economic Analysis
4.1 Overview The following economic analysis requirements help demonstrate the viability of a given technology, within the established ranges of research and development, based on a set of market conditions for the utility power generation market. The economic analysis should follow the QGESS #1 document “Cost Estimation Methodology for NETL Assessments of Power Plant Performance,” which is the same methodology used in the NETL baseline studies. The detailed code of accounts for the capital cost estimate used in the baseline studies should be implemented for the TEA. These accounts are given in the QGESS #7 document “Capital Cost Scaling Methodology.” Within the given code of accounts are sub-accounts that give more detailed categorization of sub-systems, and they should be used and adjusted to fit the advanced technology, as appropriate. For example, account 5B “CO2 Removal and Compression” contains sub-accounts 5B.1 “CO2 Removal System” and 5B.2 “CO2 Compression and Drying System.” For a capture technology being evaluated, the system may be comprised of elements of both sub-accounts 5B.1 and 5B.2. Alternatively, the level of detail may be sufficient to separate sub-account 5B.1 further to provide increased transparency for the TEA reviewer. The greater detail in the cost accounts demonstrates greater depth of understanding and thought provided to a given area; therefore, providing detailed cost accounts is important. O&M costs should be itemized as shown in the baseline studies. The developer should prepare estimates for equipment and consumables unique to the process being developed. If possible, capital cost estimates for unique equipment should be made based on similar equipment that may exist for other types of processes. For equipment estimates that must be based on analogs, breaking sub-accounts down, as suggested above, to show the results of these estimates allows for better understanding of how estimates were completed. It is recommended that the pertinent scaling parameters are presented next to the costs to provide context and easy validation of the cost estimates. If equipment analogs do not exist for unique equipment, the developer should explain how the costs are represented, ranging from a full bottom-up estimate of the unique equipment to an R&D goal based on reasonable assumptions.
4.2 Capital Cost Estimating The code of accounts for the capital cost estimate should follow those used in the NETL baseline studies (referenced in Exhibit 1-1). Engineering fees, contingencies (discussed further below), and owner’s costs should follow the QGESS #1 document “Cost Estimation Methodology for NETL Assessments of Power Plant Performance.” For equipment and sub-system items that can be identified in an NETL baseline study, use the baseline study cost and scale from the QGESS #7 document “Capital Cost Scaling Methodology” to estimate the bare erected cost (BEC).
For equipment that is not included in an NETL baseline study, attempt to identify an analog from an NETL study or from a literature source and scale it using the QGESS #7 document “Capital Cost Scaling Methodology.” Discuss the rationale for this decision in the TEA costing section.
National Energy Technology Laboratory Office of Program Performance and Benefits
21
Techno-economic Analysis Reports Quality Guidelines for Energy System Studies
July 2015
If no other sources are available, prepare a list of the major pieces of equipment in the sub-system, including process parameters, physical size, and materials of construction, and perform a bottom-up estimate of the sub-system.
The best cost presentations show the cause and effect of changing design parameters and the resulting cost adjustments. Sensitivity of Cost Metrics (Section 4.4) to the capital cost of technologies being developed is a very useful analysis tool (Section 5.5).
Contingencies Process and project contingencies are included in estimates to account for unknown costs that are omitted or unforeseen due to a lack of complete project definition and engineering. Contingencies are added because experience has shown that such costs are likely and expected to be incurred even though they cannot be explicitly determined at the time the estimate is prepared.
Capital cost contingencies do not cover uncertainties or risks associated with—
• Changes in scope
• Changes in labor availability or productivity
• Delays in equipment deliveries
• Changes in regulatory requirements
• Unexpected cost escalation
• Unexpected performance impacts after startup (e.g., availability, efficiency)
Process contingency is intended to compensate for uncertainty in cost estimates caused by performance uncertainties associated with the development status of a technology. Process contingencies are applied to each plant section based on its current technology status. AACE International Recommended Practice No. 116R-90, Conducting Technical and Economic Evaluations as applied for the Process and Utility Industries (AACE 16R-90) states that process contingency can range from zero to 70 percent of BEC based on the technology status level at the time of the estimate. QGESS #7 provides guidance on implementing a process contingency, which does require some interpretation and judgment. Depending on the status of the technology being developed, different process contingencies should be applied. Discussing the current status (i.e. laboratory scale, bench scale, demonstration scale) of the technology helps justify the contingencies utilized. As an example, the amine capture system employed for PC plant cases has a process contingency of 20 percent; this is considered appropriate based on the current deployment of the technology in other fields and the application of the technology, as guided by the QGESS. It is suggested that when selecting a process contingency to apply to the technology being evaluated, the percentage be identified and the reason for selection be discussed in the TEA. An overall capital cost sensitivity analysis can also help provide insight into the uncertainty of the process and equipment or R&D goals, as viewed by the developer.
Project contingencies are applied to each plant section. AACE 16R-90 states that project contingency for a “budget-type” estimate (AACE Class 4 or 5) should be 15 to 30 percent of the sum of BEC; engineering, procurement, and construction fees; and process contingency.
National Energy Technology Laboratory Office of Program Performance and Benefits
22

Techno-economic Analysis Reports Quality Guidelines for Energy System Studies
July 2015
4.3 Operating and Maintenance O&M cost should be itemized and use the same dollar basis found in an appropriate reference case. In most cases, the advanced technology will not have the ability to reduce the operating labor category by reducing the reference base case number of operators. However, changes to the number of operators due to known operational complexity of the advanced technology is encouraged and allows for a more transparent understanding of the advanced technology’s operational challenges or advantages by TEA reviewers.
Maintenance material costs should be adjusted as appropriate, depending on the nature of the advanced technology. For example, maintenance material costs for a membrane-based CO2 capture system will be higher than that for a solvent-based system. These differences should be discussed and quantified. If the plant size changes as a result of the advanced technology, the balance of the maintenance material costs not attributed to the advanced technology should be based on the ratio of the selected reference case maintenance material costs to total plant cost (TPC).
If the advanced technology uses consumables already present in the O&M sheets, the additional consumption should be added. If the advanced technology requires new or unique consumables (such as sorbent or solvent replacement), then they should be added to the appropriate section of the O&M sheet. If saleable byproducts or disposable wastes are to be added to the O&M costs, the reasoning should be given for the selected unit cost.
Coal and natural gas costs should follow the costs in the QGESS #6 document “Fuel Prices for Selected Feedstocks in NETL Studies.” Coal costs include a fixed amount of transportation costs, and sensitivities to this cost can be included if well-reasoned.
National Energy Technology Laboratory Office of Program Performance and Benefits
23
Techno-economic Analysis Reports Quality Guidelines for Energy System Studies
July 2015
4.4 Cost Metrics
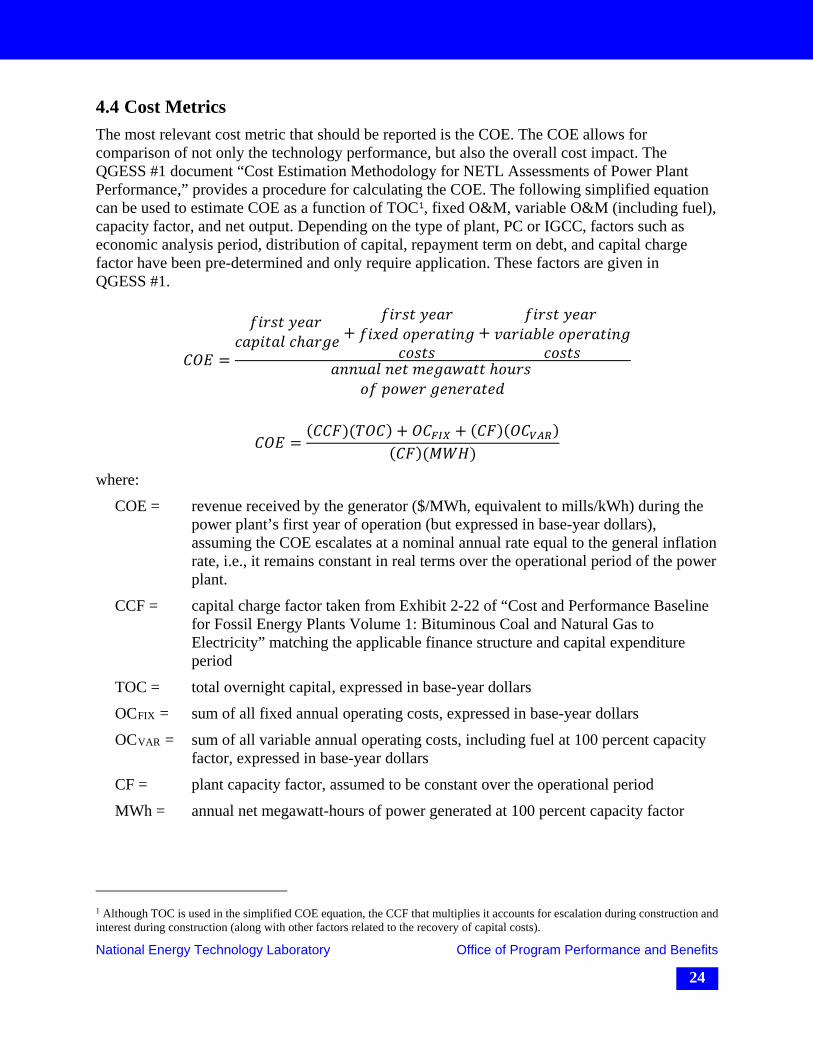
The most relevant cost metric that should be reported is the COE. The COE allows for comparison of not only the technology performance, but also the overall cost impact. The QGESS #1 document “Cost Estimation Methodology for NETL Assessments of Power Plant Performance,” provides a procedure for calculating the COE. The following simplified equation can be used to estimate COE as a function of TOC1, fixed O&M, variable O&M (including fuel), capacity factor, and net output. Depending on the type of plant, PC or IGCC, factors such as economic analysis period, distribution of capital, repayment term on debt, and capital charge factor have been pre-determined and only require application. These factors are given in QGESS #1.
𝐶𝐶𝐶𝐶𝐶𝐶 =
𝑓𝑓𝑓𝑓𝑓𝑓𝑓𝑓𝑓𝑓 𝑦𝑦𝑦𝑦𝑦𝑦𝑓𝑓 𝑐𝑐𝑦𝑦𝑐𝑐𝑓𝑓𝑓𝑓𝑦𝑦𝑐𝑐 𝑐𝑐ℎ𝑦𝑦𝑓𝑓𝑎𝑎𝑦𝑦 +
𝑓𝑓𝑓𝑓𝑓𝑓𝑓𝑓𝑓𝑓 𝑦𝑦𝑦𝑦𝑦𝑦𝑓𝑓𝑓𝑓𝑓𝑓𝑓𝑓𝑦𝑦𝑓𝑓 𝑜𝑜𝑐𝑐𝑦𝑦𝑓𝑓𝑦𝑦𝑓𝑓𝑓𝑓𝑜𝑜𝑎𝑎
𝑐𝑐𝑜𝑜𝑓𝑓𝑓𝑓𝑓𝑓+
𝑓𝑓𝑓𝑓𝑓𝑓𝑓𝑓𝑓𝑓 𝑦𝑦𝑦𝑦𝑦𝑦𝑓𝑓 𝑣𝑣𝑦𝑦𝑓𝑓𝑓𝑓𝑦𝑦𝑣𝑣𝑐𝑐𝑦𝑦 𝑜𝑜𝑐𝑐𝑦𝑦𝑓𝑓𝑦𝑦𝑓𝑓𝑓𝑓𝑜𝑜𝑎𝑎
𝑐𝑐𝑜𝑜𝑓𝑓𝑓𝑓𝑓𝑓𝑦𝑦𝑜𝑜𝑜𝑜𝑎𝑎𝑦𝑦𝑐𝑐 𝑜𝑜𝑦𝑦𝑓𝑓 𝑚𝑚𝑦𝑦𝑎𝑎𝑦𝑦𝑚𝑚𝑦𝑦𝑓𝑓𝑓𝑓 ℎ𝑜𝑜𝑎𝑎𝑓𝑓𝑓𝑓
𝑜𝑜𝑓𝑓 𝑐𝑐𝑜𝑜𝑚𝑚𝑦𝑦𝑓𝑓 𝑎𝑎𝑦𝑦𝑜𝑜𝑦𝑦𝑓𝑓𝑦𝑦𝑓𝑓𝑦𝑦𝑓𝑓
𝐶𝐶𝐶𝐶𝐶𝐶 =(𝐶𝐶𝐶𝐶𝐶𝐶)(𝑇𝑇𝐶𝐶𝐶𝐶) + 𝐶𝐶𝐶𝐶𝐹𝐹𝐹𝐹𝐹𝐹 + (𝐶𝐶𝐶𝐶)(𝐶𝐶𝐶𝐶𝑉𝑉𝑉𝑉𝑉𝑉)
(𝐶𝐶𝐶𝐶)(𝑀𝑀𝑀𝑀𝑀𝑀)
where:
COE = revenue received by the generator ($/MWh, equivalent to mills/kWh) during the power plant’s first year of operation (but expressed in base-year dollars), assuming the COE escalates at a nominal annual rate equal to the general inflation rate, i.e., it remains constant in real terms over the operational period of the power plant.
CCF = capital charge factor taken from Exhibit 2-22 of “Cost and Performance Baseline for Fossil Energy Plants Volume 1: Bituminous Coal and Natural Gas to Electricity” matching the applicable finance structure and capital expenditure period
TOC = total overnight capital, expressed in base-year dollars
OCFIX = sum of all fixed annual operating costs, expressed in base-year dollars
OCVAR = sum of all variable annual operating costs, including fuel at 100 percent capacity factor, expressed in base-year dollars
CF = plant capacity factor, assumed to be constant over the operational period
MWh = annual net megawatt-hours of power generated at 100 percent capacity factor
1 Although TOC is used in the simplified COE equation, the CCF that multiplies it accounts for escalation during construction and interest during construction (along with other factors related to the recovery of capital costs).
National Energy Technology Laboratory Office of Program Performance and Benefits
24
Techno-economic Analysis Reports Quality Guidelines for Energy System Studies
July 2015
5 Reporting Requirements/Required Deliverables Generally, at a minimum, reporting should be consistent with the level of detail found in the chosen baseline study reference plant. Novel technologies should be reported, in both performance and cost, at a level sufficient to replicate the calculated values, which may be in greater detail than found in the baseline study. Required deliverable items listed below are discussed in more detail in the previous technical analysis (Section 3) and economic analysis (Section 4) sections of this document.
5.1 Executive Summary An executive summary should be a clear, concise, brief, and well thought out narrative of the effort and the results of that effort, generally 2–3 pages long not including any tables or images. The summary should expedite communication with the stakeholders who may not have the availability to read the entire document. As such, the executive summary should be a standalone piece of the report addressing the following criteria—
• The goals and objectives of the effort—a clear, concise, and brief paragraph about the effort’s objectives outlined in the technical direction.
• Salient results—the results in terms of process efficiency, COE, and only metrics contributing substantially to the change in performance or COE. Each technology should have a separate paragraph outlining the key factors that influenced the results for that technology. The paragraph should also address the results, which should include sensitivity studies. If multiple technologies or pathways are assessed, a paragraph summarizing the results may also be included.
• The limitations of the results—often this will be the result of the performance and cost basis for the technology.
• Impacts and consequences of the investigated technology regarding the balance of the plant.
• Tabular results and graphics—The data should be presented and further described in the body of the report, but it can be truncated and combined with other tables/graphics for brevity. An example from the executive summary from the Bituminous Baseline is located in Appendix C (although the rows and columns may be added and/or subtracted to highlight the particular effort).
5.2 Performance Appendix C provides an example table of high-level reporting generally utilized to encourage communication with stakeholders. These tables are typically used to allow side-by-side comparisons; however, greater detail about the technology must be provided in a full TEA report, although that can be located in an appendix of the TEA. Truncated versions of these tables are often used in an executive summary to quickly convey the results. Using the NETL baseline studies as a template, the final report should include the following—
• Plant and component descriptions—including design specifications and assumptions • Block flow diagrams and associated stream tables—including operating pressures,
temperatures, compositions, and enthalpies for all streams entering or leaving major process equipment (separation vessels, heat exchangers, pumps, compressors, etc.)
National Energy Technology Laboratory Office of Program Performance and Benefits
25
Techno-economic Analysis Reports Quality Guidelines for Energy System Studies
July 2015
• Performance summary—including breakdown of gross power generation, auxiliary power requirements, and net plant efficiency at the same level of detail as the NETL studies
• Itemized equipment list—including detailed sizing parameters for all critical equipment that is added or changed
• Air emissions tables for the plant • Carbon, sulfur, and water balances for the plant • Material and energy balances around major equipment/plant systems—including all
heating and cooling duties and electric power requirements • Performance sensitivities with discussion on why these performance parameters have
been identified as key parameters
Performance sensitivities should target important process parameters over a relevant range of values, and performance impacts should be discussed.
5.3 Cost Appendix C provides a table that should be used for high-level reporting of the economics; however, greater detail should be reported throughout the document. Cost results should follow the format given in the baseline studies.
• Capital costs should use the code of accounts used in the NETL studies. For each account, costs should be broken down into bare erected costs, engineering fees, process contingency, and project contingency, adding up to an account-level total plant cost. The total plant cost, owner’s cost, and total overnight cost for the entire plant should also be reported.
• O&M costs (variable and fixed) should be itemized according to those used in the baseline studies, including all consumables unique to the process being developed.
• Cost metrics that should be reported include COE as defined in the QGESS #1 document “Cost Estimation Methodology for NETL Assessments of Power Plant Performance.”
5.4 Advanced Technology Details Additional details are required to be reported regarding the advanced technology, including—
• Performance parameters with a range of experimental data and reasonable projections, as well as actual values used for the TEA
• Itemized equipment list for equipment unique to the advanced technology and other equipment required for the integration of the advanced technology into the power plant
• Estimates for equipment and consumables unique to the process, based on analogous technology if possible or using a bottom-up approach
5.5 Sensitivity Analysis Sensitivity of COE to the following parameters can help demonstrate an understanding of the potential markets, uncertainty of test data, or state of technology development—
National Energy Technology Laboratory Office of Program Performance and Benefits
26

Techno-economic Analysis Reports Quality Guidelines for Energy System Studies
July 2015
• Critical advanced technology performance parameters • Capital cost of advanced technology • Consumable prices that are specific to the investigated technology
5.6 Additional Deliverables Process models with brief documentation and economic spreadsheet tools or models can be submitted as accompanying materials. All methods and models used should be documented in the TEA.
National Energy Technology Laboratory Office of Program Performance and Benefits
27
Techno-economic Analysis Reports Quality Guidelines for Energy System Studies
July 2015
6 Common Missteps and Omissions Below is a list of common mistakes and/or omissions seen in TEAs that have been submitted to NETL. Many of these issues are discussed in the previous sections and highlighted here. Care should be taken to address these issues in all TEAs.
1. Underestimating or neglecting to include pressure drops across process components or equipment
Estimating appropriate pressure drops for equipment can reduce errors in accidently overestimating performance or omitting additional auxiliary equipment needs (blowers, pumps, etc.).
2. Modifying design specifications for equipment and processes unrelated to actual technology-based requirements
Using design specifications identical to the reference cases can reduce errors in accidently overestimating the performance impact of technologies. Examples of such modifications include reducing cooling water temperatures, modifying steam turbine exhaust pressures, modifying steam extraction rates or conditions for processes uninvolved in the technology under analysis, modifying required combustion turbine air feed and inlet conditions, and reducing heat exchanger temperature approaches.
3. Ignoring design limitations of downstream equipment
Exploring the impact of technologies on downstream equipment designs, such as increasing the chloride scrubber efficiency requirements or increasing the need for drying in a CO2 compression train, can present a more accurate view of the technologies’ impact on the total plant.
4. Overestimating heat recovery possibilities
Assuming uses are available for all low-quality heat (less than 150 °F) can overstate heat recovery possibilities. Not all low-quality heat can be utilized efficiently in every process design. Some may have to be rejected to the cooling water system or other non-recoverable sinks.
5. Omitting the initial fill quantities or costs and/or minimizing makeup rates or costs
Estimating appropriate initial fill quantities and makeup rates for consumables reduces errors in accidently underestimating operating and startup costs.
6. Ignoring the potential impact of novel technologies on plant availability or capacity factor
Using capacity factors identical to the reference cases enables more direct comparisons between cases. However, if a technology could impact the availability of the plant, the analysis should include an estimate of the impact and a discussion of the reasoning behind it.
7. Using overly simplified scaling methods or assumptions for equipment costs
Estimating appropriate capital costs for all equipment or sub-system items is crucial to any TEA. Utilizing information provided in the QGESS #7 document “Capital
National Energy Technology Laboratory Office of Program Performance and Benefits
28
Techno-economic Analysis Reports Quality Guidelines for Energy System Studies
July 2015
Cost Scaling Methodology” and other design engineering standard practices can reduce accidentally underestimating capital costs.
8. Omitting the basis of design, performance, and/or costs for process components
Projecting designs and operating parameters is expected, but relevant test data (kinetic data, reaction rates, selectivity, degradation, attrition) or future test plans should be explained to enable tracking of progress toward proposed designs.
A discussion of the risks associated with planned research can help guide future work and demonstrate an understanding of the necessary development steps toward a commercially viable technology offering.
9. Neglecting or minimizing details of novel materials and consumables
Technologies that use novel or proprietary materials or consumables should include a discussion of the current production methods and costs. Expected scale-up or manufacturing improvements can be proposed, and a sensitivity to the range of expected costs will show the economic attractiveness of these advancements.
10. Omitting discussions of system integration, including expected complexity, startup and turndown concerns, etc.
Integration of novel technologies into reference plant designs should describe expected complexity and plant interfaces ranging from adding a simple bolt-on attachment before the stack to requiring recycle to the boiler, enriching feed streams, steam extractions, cooling water requirements, or additional electrical auxiliaries. Major startup or turndown concerns should be identified to demonstrate understanding of the novel phenomena and the expected market. These concerns can be mitigated by comparing them to existing technologies or by performing more detailed engineering and costing to help bound the effects.
11. Omitting sensitivities to key assumptions for performance or costs
Idealized performance can help clarify the potential of a novel technology; sensitivities to the important operating parameters help demonstrate the benefits of continuing research and development.
Each examined sensitivity represents an opportunity to improve the attractiveness of a new technology. The resulting effect on the relevant metrics shows the possible benefit; the range of the varied parameters shows the possibility of continued research, which needs to be connected to expected tests of relevant phenomena.
National Energy Technology Laboratory Office of Program Performance and Benefits
29
Techno-economic Analysis Reports Quality Guidelines for Energy System Studies
July 2015
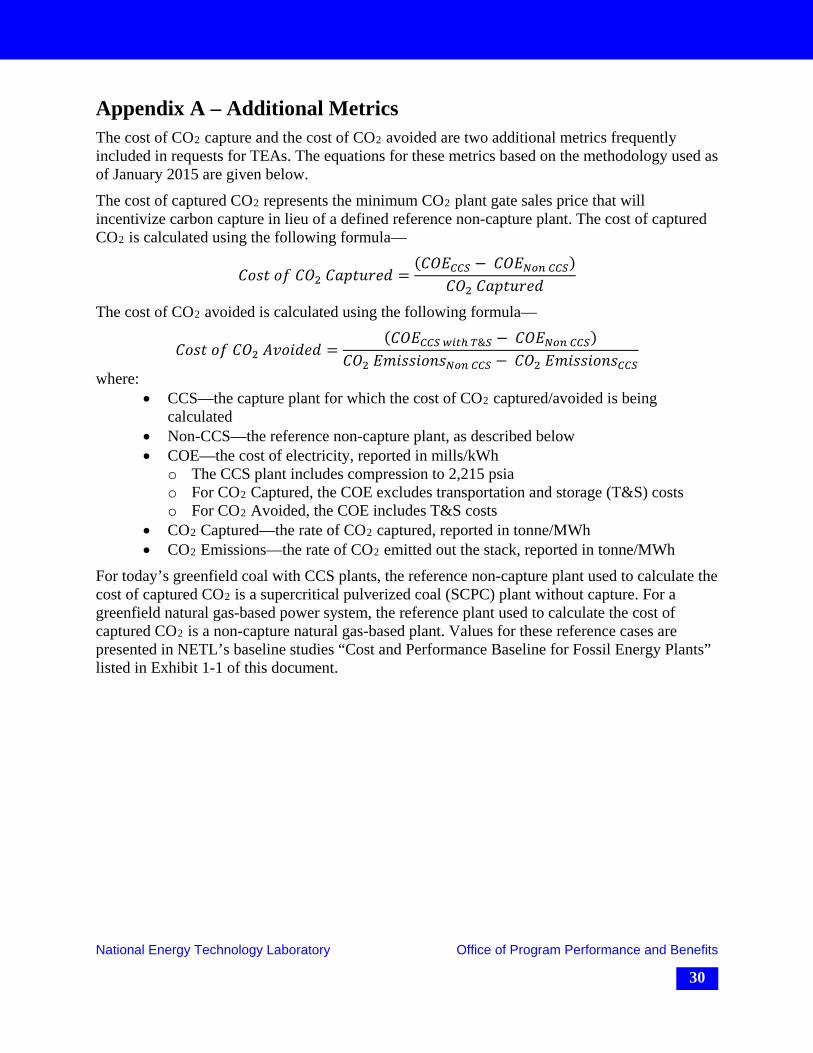
Appendix A – Additional Metrics The cost of CO2 capture and the cost of CO2 avoided are two additional metrics frequently included in requests for TEAs. The equations for these metrics based on the methodology used as of January 2015 are given below.
The cost of captured CO2 represents the minimum CO2 plant gate sales price that will incentivize carbon capture in lieu of a defined reference non-capture plant. The cost of captured CO2 is calculated using the following formula—
𝐶𝐶𝑜𝑜𝑓𝑓𝑓𝑓 𝑜𝑜𝑓𝑓 𝐶𝐶𝐶𝐶2 𝐶𝐶𝑦𝑦𝑐𝑐𝑓𝑓𝑎𝑎𝑓𝑓𝑦𝑦𝑓𝑓 =(𝐶𝐶𝐶𝐶𝐶𝐶𝐶𝐶𝐶𝐶𝐶𝐶 − 𝐶𝐶𝐶𝐶𝐶𝐶𝑁𝑁𝑁𝑁𝑁𝑁 𝐶𝐶𝐶𝐶𝐶𝐶)
𝐶𝐶𝐶𝐶2 𝐶𝐶𝑦𝑦𝑐𝑐𝑓𝑓𝑎𝑎𝑓𝑓𝑦𝑦𝑓𝑓
The cost of CO2 avoided is calculated using the following formula—
𝐶𝐶𝑜𝑜𝑓𝑓𝑓𝑓 𝑜𝑜𝑓𝑓 𝐶𝐶𝐶𝐶2 𝐴𝐴𝑣𝑣𝑜𝑜𝑓𝑓𝑓𝑓𝑦𝑦𝑓𝑓 =(𝐶𝐶𝐶𝐶𝐶𝐶𝐶𝐶𝐶𝐶𝐶𝐶 𝑤𝑤𝑤𝑤𝑤𝑤ℎ 𝑇𝑇&𝐶𝐶 − 𝐶𝐶𝐶𝐶𝐶𝐶𝑁𝑁𝑁𝑁𝑁𝑁 𝐶𝐶𝐶𝐶𝐶𝐶)
𝐶𝐶𝐶𝐶2 𝐶𝐶𝑚𝑚𝑓𝑓𝑓𝑓𝑓𝑓𝑓𝑓𝑜𝑜𝑜𝑜𝑓𝑓𝑁𝑁𝑁𝑁𝑁𝑁 𝐶𝐶𝐶𝐶𝐶𝐶 − 𝐶𝐶𝐶𝐶2 𝐶𝐶𝑚𝑚𝑓𝑓𝑓𝑓𝑓𝑓𝑓𝑓𝑜𝑜𝑜𝑜𝑓𝑓𝐶𝐶𝐶𝐶𝐶𝐶
where: • CCS—the capture plant for which the cost of CO2 captured/avoided is being
calculated • Non-CCS—the reference non-capture plant, as described below • COE—the cost of electricity, reported in mills/kWh
o The CCS plant includes compression to 2,215 psia o For CO2 Captured, the COE excludes transportation and storage (T&S) costs o For CO2 Avoided, the COE includes T&S costs
• CO2 Captured—the rate of CO2 captured, reported in tonne/MWh • CO2 Emissions—the rate of CO2 emitted out the stack, reported in tonne/MWh
For today’s greenfield coal with CCS plants, the reference non-capture plant used to calculate the cost of captured CO2 is a supercritical pulverized coal (SCPC) plant without capture. For a greenfield natural gas-based power system, the reference plant used to calculate the cost of captured CO2 is a non-capture natural gas-based plant. Values for these reference cases are presented in NETL’s baseline studies “Cost and Performance Baseline for Fossil Energy Plants” listed in Exhibit 1-1 of this document.
National Energy Technology Laboratory Office of Program Performance and Benefits
30
Techno-economic Analysis Reports Quality Guidelines for Energy System Studies
July 2015
Appendix B – Reference Plant Design Basis Parameters Below is a brief description of design basis items found in the NETL baseline studies.
System Boundaries The plant boundary limit is typically defined as the total plant facility within the “fence line” and may include—
• Delivered feedstock (e.g., coal, biofuel, and natural gas) [QGESS #3, 6, and 8]
• Miscellaneous delivered materials (e.g., limestone, CO2 absorbent, and catalyst) [QGESS #3]
• Raw water makeup [QGESS #4]
• Intake air [QGESS #4]
• Stack gas or vent gases
• Waste streams (e.g., process water, ash, slag, and spent carbon)
• Products (e.g., high-pressure CO2 [QGESS #5] and high-voltage electricity)
While the CO2 transportation occurs beyond the plant fence line, the COE is frequently reported both with and without the T&S costs. The choice of including or excluding T&S costs in COE should be clearly indicated.
The treatment of the waste streams generated by the power plant is typically considered within the fence line and included in the capital and O&M costs of the plant. The treatment of the waste streams must be adequate for preparation of disposal either in a landfill or other commercial disposal option.
The treatment of stack and vent gases, as well as wastewater, must be sufficient to satisfy applicable environmental regulations.
Process Design Assumptions Examples of process design assumptions are provided in this section. It is important to maintain consistent conditions across all designs that are intended to be compared. This is to ensure that the comparisons accurately highlight the performance and cost impacts of the intended systems. Well justified sensitivities are the best way to capture deviations from NETL baseline case assumptions for technologies with specific niches or advantages.
Feedstock Analysis—If the purpose of the TEA is to compare the advantages and benefits of an advanced technology, the feedstocks, including the fuel, should be the same for both the reference (refer to Section 2.1) and advanced cases. If multiple fuels are used (e.g., co-feeding of coal and biomass or coal and natural gas), the fractions of each fuel should be the same for the reference and advanced cases.
The QGESS documents #3 “Specification for Selected Feedstocks” and #8 “Detailed Coal Specifications” provide the specifications for natural gas, multiple coal types, and a number of other feedstocks (e.g., limestone).
National Energy Technology Laboratory Office of Program Performance and Benefits
31
Techno-economic Analysis Reports Quality Guidelines for Energy System Studies
July 2015
Site Characteristics and Ambient Conditions—The site characteristics and ambient conditions can vary significantly based on location and should be taken into consideration when designing the power generation facility. The ambient conditions can have a significant impact on the performance of many systems in a power generation facility; the site characteristics can limit the layout design options, as well as fuel choices that are available. For instance, PRB coal can be delivered to a Midwest location at ISO conditions; however, lignite would not be economical to deliver and must be used at or near “mine mouth” locations (e.g., Texas or North Dakota). If choosing a location that differs from the site of the fuel source and those outlined in the baseline reference plant, the cost of the fuel must be adjusted for delivery. Additionally, the reason for location selection must be justified and documented in the design basis section of the TEA.
The QGESS #4 “Process Modeling Design Parameters” and #6 “Fuel Prices for Selected Feedstocks in NETL Studies” provide information on the cost of transportation of fuel, as well as the methodology for selecting ambient conditions based on location.
Steam and Gas Turbine Cycle Conditions—The conditions assumed for both the steam and gas turbine cycle have a significant impact on the overall performance of the plant. The ambient conditions, cooling water assumptions, and site characteristics will impact the final pressure ratios of these power cycles. In the event any of these change significantly, the changes should be documented in the TEA design basis section.
Environmental Controls and Performance—As mentioned in the previous section, the water and gas emissions from the facility must comply with any applicable regulations. Descriptions of the technologies utilized to control each environmental concern should be provided with as detailed performance and cost specifications as reasonable.
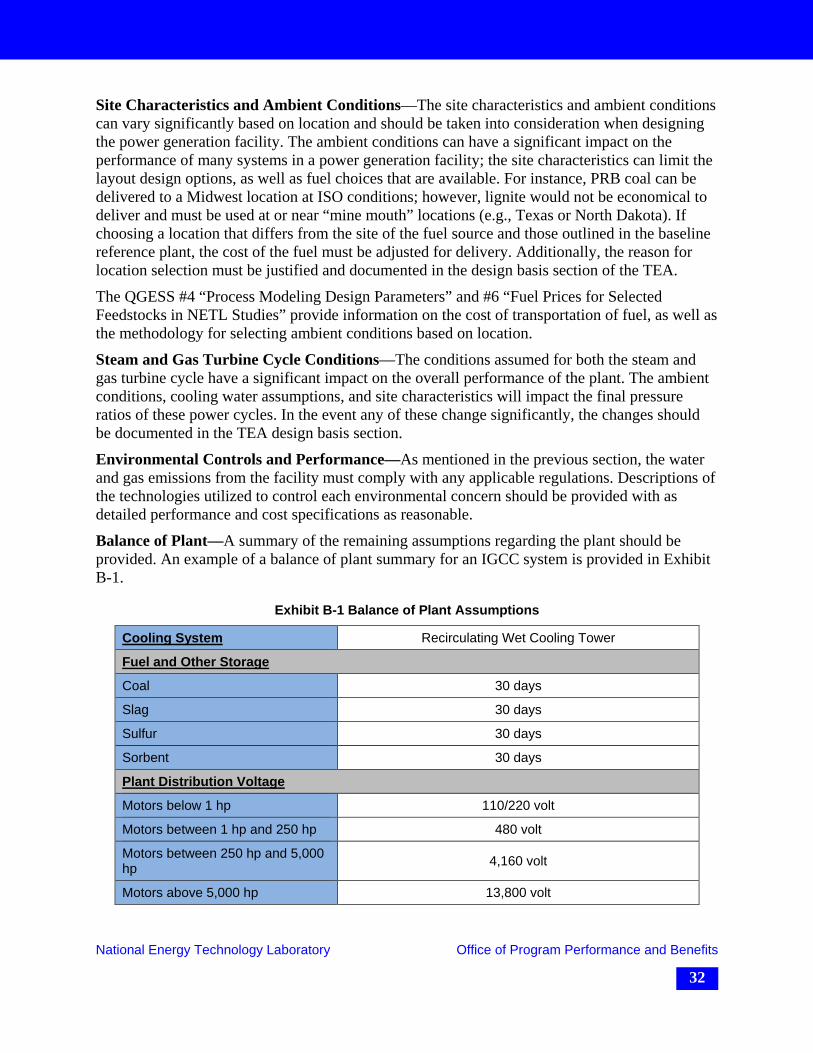
Balance of Plant—A summary of the remaining assumptions regarding the plant should be provided. An example of a balance of plant summary for an IGCC system is provided in Exhibit B-1.
Exhibit B-1 Balance of Plant Assumptions
Cooling System Recirculating Wet Cooling Tower
Fuel and Other Storage
Coal 30 days
Slag 30 days
Sulfur 30 days
Sorbent 30 days
Plant Distribution Voltage
Motors below 1 hp 110/220 volt
Motors between 1 hp and 250 hp 480 volt
Motors between 250 hp and 5,000 hp 4,160 volt
Motors above 5,000 hp 13,800 volt
National Energy Technology Laboratory Office of Program Performance and Benefits
32
Techno-economic Analysis Reports Quality Guidelines for Energy System Studies
July 2015
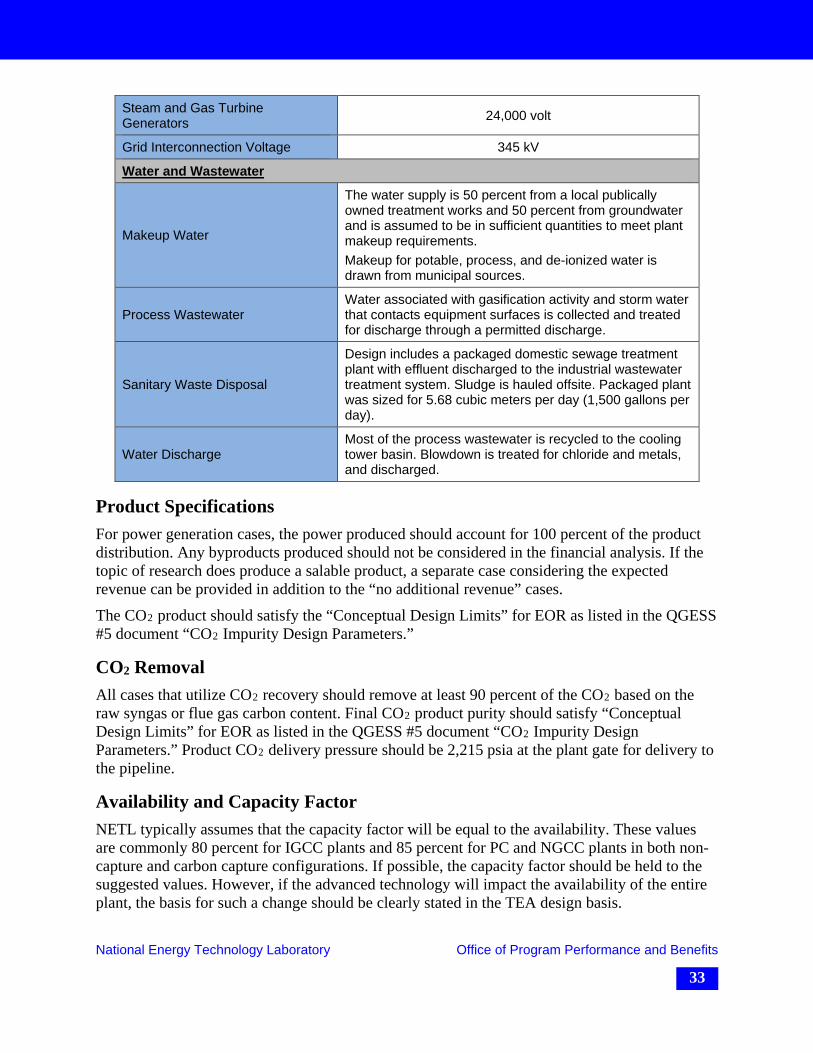
Steam and Gas Turbine Generators 24,000 volt
Grid Interconnection Voltage 345 kV
Water and Wastewater
Makeup Water
The water supply is 50 percent from a local publically owned treatment works and 50 percent from groundwater and is assumed to be in sufficient quantities to meet plant makeup requirements. Makeup for potable, process, and de-ionized water is drawn from municipal sources.
Process Wastewater Water associated with gasification activity and storm water that contacts equipment surfaces is collected and treated for discharge through a permitted discharge.
Sanitary Waste Disposal
Design includes a packaged domestic sewage treatment plant with effluent discharged to the industrial wastewater treatment system. Sludge is hauled offsite. Packaged plant was sized for 5.68 cubic meters per day (1,500 gallons per day).
Water Discharge Most of the process wastewater is recycled to the cooling tower basin. Blowdown is treated for chloride and metals, and discharged.
Product Specifications For power generation cases, the power produced should account for 100 percent of the product distribution. Any byproducts produced should not be considered in the financial analysis. If the topic of research does produce a salable product, a separate case considering the expected revenue can be provided in addition to the “no additional revenue” cases.
The CO2 product should satisfy the “Conceptual Design Limits” for EOR as listed in the QGESS #5 document “CO2 Impurity Design Parameters.”
CO2 Removal All cases that utilize CO2 recovery should remove at least 90 percent of the CO2 based on the raw syngas or flue gas carbon content. Final CO2 product purity should satisfy “Conceptual Design Limits” for EOR as listed in the QGESS #5 document “CO2 Impurity Design Parameters.” Product CO2 delivery pressure should be 2,215 psia at the plant gate for delivery to the pipeline.
Availability and Capacity Factor NETL typically assumes that the capacity factor will be equal to the availability. These values are commonly 80 percent for IGCC plants and 85 percent for PC and NGCC plants in both non-capture and carbon capture configurations. If possible, the capacity factor should be held to the suggested values. However, if the advanced technology will impact the availability of the entire plant, the basis for such a change should be clearly stated in the TEA design basis.
National Energy Technology Laboratory Office of Program Performance and Benefits
33
Techno-economic Analysis Reports Quality Guidelines for Energy System Studies
July 2015
Plant Size The PC cases should be sized to maintain 550 MW net power output with a single boiler and steam turbine, unless otherwise required and discussed for the advanced technology. This generally requires an adjustment to the reference plant coal feed rate to compensate for the auxiliary load and extraction steam (if any) required by the novel technology.
The size of a combined cycle plant, IGCC or NGCC, is typically determined by fully loading the combustion turbine (constant maximum power output) and then scaling the balance of plant accordingly. After adding the steam turbine power and subtracting the auxiliary loads, the net capacity is typically in the range of 500–700 MW for a 2-train combustion turbine and heat recovery steam generator (HRSG) tandem (2 x 50 percent) system that feeds into a single steam turbine (1 x 100 percent).
CO2 Transportation and Storage The cost of transportation and storage of CO2 is location specific. Suggested values along with the methodology for their calculations are provided in QGESS #5 “Estimating Carbon Dioxide Transport and Storage Costs.” Available sites include Midwest, Texas, North Dakota, and Montana.
Finance Structure The financial structure utilized for power generation facilities with advanced technologies should be a high-risk investor-owned utility, and the methodology should be the same methodology used in QGESS #1 “Cost Estimation Methodology for NETL Assessments of Power Plant Performance.”
An alternate discounted cash flow analysis approach and reporting of required selling price may be utilized in addition to the suggested approach but should not be substituted for the suggested approach.
The year dollar basis should be identical for the advanced and reference facilities, and should match the year suggested in the previously mentioned QGESS #1 document.
National Energy Technology Laboratory Office of Program Performance and Benefits
34
Techno-economic Analysis Reports Quality Guidelines for Energy System Studies
July 2015
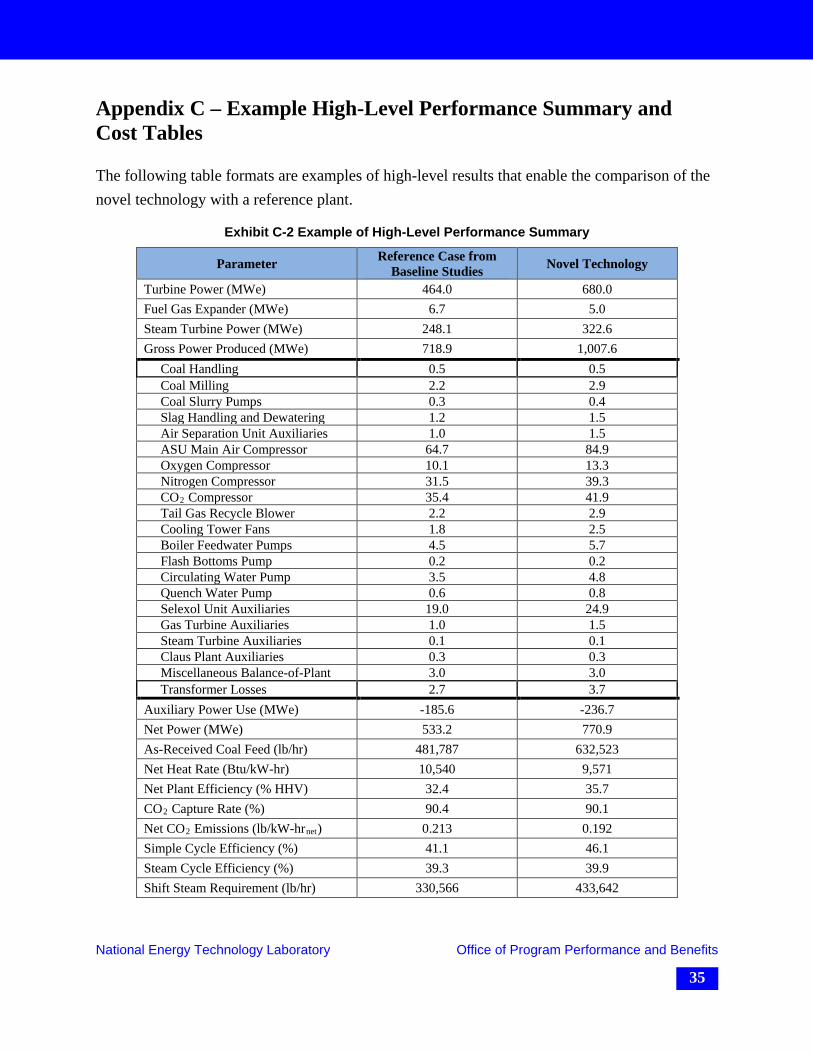
Appendix C – Example High-Level Performance Summary and Cost Tables
The following table formats are examples of high-level results that enable the comparison of the novel technology with a reference plant.
Exhibit C-2 Example of High-Level Performance Summary
Parameter Reference Case from Baseline Studies Novel Technology
Turbine Power (MWe) 464.0 680.0 Fuel Gas Expander (MWe) 6.7 5.0 Steam Turbine Power (MWe) 248.1 322.6 Gross Power Produced (MWe) 718.9 1,007.6 Coal Handling 0.5 0.5 Coal Milling 2.2 2.9 Coal Slurry Pumps 0.3 0.4 Slag Handling and Dewatering 1.2 1.5 Air Separation Unit Auxiliaries 1.0 1.5 ASU Main Air Compressor 64.7 84.9 Oxygen Compressor 10.1 13.3 Nitrogen Compressor 31.5 39.3 CO2 Compressor 35.4 41.9 Tail Gas Recycle Blower 2.2 2.9 Cooling Tower Fans 1.8 2.5 Boiler Feedwater Pumps 4.5 5.7 Flash Bottoms Pump 0.2 0.2 Circulating Water Pump 3.5 4.8 Quench Water Pump 0.6 0.8 Selexol Unit Auxiliaries 19.0 24.9 Gas Turbine Auxiliaries 1.0 1.5 Steam Turbine Auxiliaries 0.1 0.1 Claus Plant Auxiliaries 0.3 0.3 Miscellaneous Balance-of-Plant 3.0 3.0 Transformer Losses 2.7 3.7 Auxiliary Power Use (MWe) -185.6 -236.7 Net Power (MWe) 533.2 770.9 As-Received Coal Feed (lb/hr) 481,787 632,523 Net Heat Rate (Btu/kW-hr) 10,540 9,571 Net Plant Efficiency (% HHV) 32.4 35.7 CO2 Capture Rate (%) 90.4 90.1 Net CO2 Emissions (lb/kW-hrnet) 0.213 0.192 Simple Cycle Efficiency (%) 41.1 46.1 Steam Cycle Efficiency (%) 39.3 39.9 Shift Steam Requirement (lb/hr) 330,566 433,642
National Energy Technology Laboratory Office of Program Performance and Benefits
35
Techno-economic Analysis Reports Quality Guidelines for Energy System Studies
July 2015
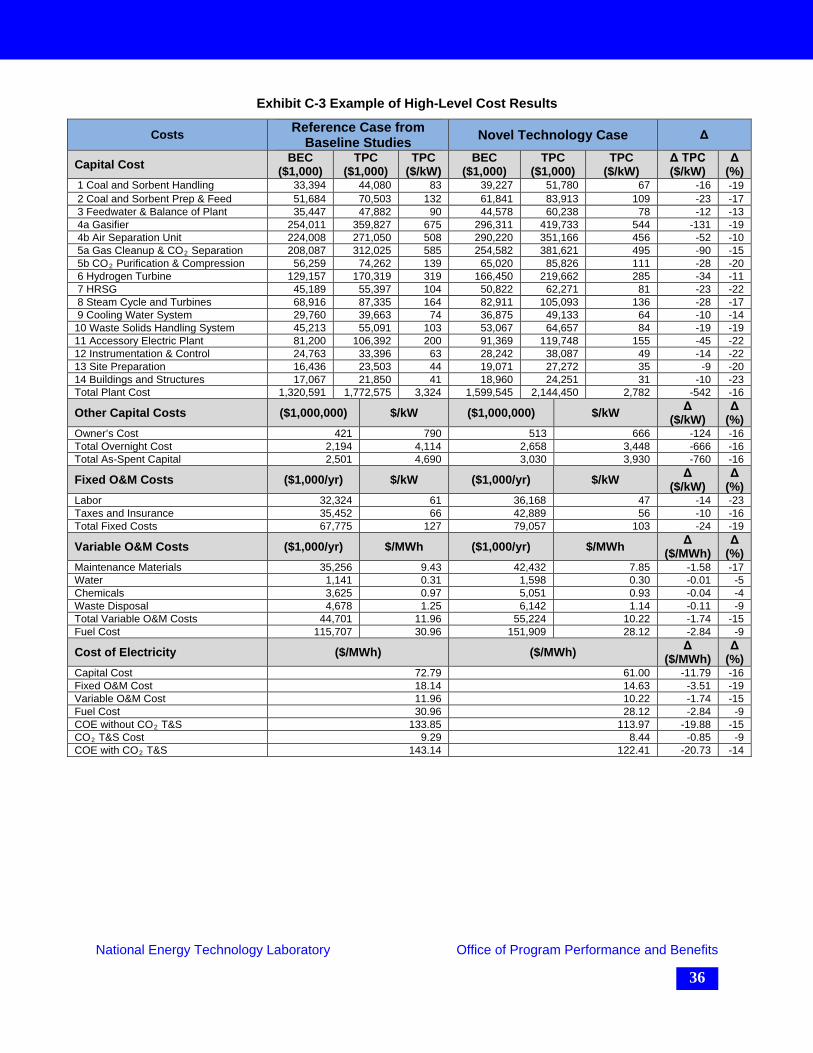
Exhibit C-3 Example of High-Level Cost Results
Costs Reference Case from Baseline Studies Novel Technology Case Δ
Capital Cost BEC ($1,000)
TPC ($1,000)
TPC ($/kW)
BEC ($1,000)
TPC ($1,000)
TPC ($/kW)
Δ TPC ($/kW)
Δ (%)
1 Coal and Sorbent Handling 33,394 44,080 83 39,227 51,780 67 -16 -19 2 Coal and Sorbent Prep & Feed 51,684 70,503 132 61,841 83,913 109 -23 -17 3 Feedwater & Balance of Plant 35,447 47,882 90 44,578 60,238 78 -12 -13 4a Gasifier 254,011 359,827 675 296,311 419,733 544 -131 -19 4b Air Separation Unit 224,008 271,050 508 290,220 351,166 456 -52 -10 5a Gas Cleanup & CO2 Separation 208,087 312,025 585 254,582 381,621 495 -90 -15 5b CO2 Purification & Compression 56,259 74,262 139 65,020 85,826 111 -28 -20 6 Hydrogen Turbine 129,157 170,319 319 166,450 219,662 285 -34 -11 7 HRSG 45,189 55,397 104 50,822 62,271 81 -23 -22 8 Steam Cycle and Turbines 68,916 87,335 164 82,911 105,093 136 -28 -17 9 Cooling Water System 29,760 39,663 74 36,875 49,133 64 -10 -14 10 Waste Solids Handling System 45,213 55,091 103 53,067 64,657 84 -19 -19 11 Accessory Electric Plant 81,200 106,392 200 91,369 119,748 155 -45 -22 12 Instrumentation & Control 24,763 33,396 63 28,242 38,087 49 -14 -22 13 Site Preparation 16,436 23,503 44 19,071 27,272 35 -9 -20 14 Buildings and Structures 17,067 21,850 41 18,960 24,251 31 -10 -23 Total Plant Cost 1,320,591 1,772,575 3,324 1,599,545 2,144,450 2,782 -542 -16
Other Capital Costs ($1,000,000) $/kW ($1,000,000) $/kW Δ ($/kW)
Δ (%)
Owner’s Cost 421 790 513 666 -124 -16 Total Overnight Cost 2,194 4,114 2,658 3,448 -666 -16 Total As-Spent Capital 2,501 4,690 3,030 3,930 -760 -16
Fixed O&M Costs ($1,000/yr) $/kW ($1,000/yr) $/kW Δ ($/kW)
Δ (%)
Labor 32,324 61 36,168 47 -14 -23 Taxes and Insurance 35,452 66 42,889 56 -10 -16 Total Fixed Costs 67,775 127 79,057 103 -24 -19
Variable O&M Costs ($1,000/yr) $/MWh ($1,000/yr) $/MWh Δ ($/MWh)
Δ (%)
Maintenance Materials 35,256 9.43 42,432 7.85 -1.58 -17 Water 1,141 0.31 1,598 0.30 -0.01 -5 Chemicals 3,625 0.97 5,051 0.93 -0.04 -4 Waste Disposal 4,678 1.25 6,142 1.14 -0.11 -9 Total Variable O&M Costs 44,701 11.96 55,224 10.22 -1.74 -15 Fuel Cost 115,707 30.96 151,909 28.12 -2.84 -9
Cost of Electricity ($/MWh) ($/MWh) Δ ($/MWh)
Δ (%)
Capital Cost 72.79 61.00 -11.79 -16 Fixed O&M Cost 18.14 14.63 -3.51 -19 Variable O&M Cost 11.96 10.22 -1.74 -15 Fuel Cost 30.96 28.12 -2.84 -9 COE without CO2 T&S 133.85 113.97 -19.88 -15 CO2 T&S Cost 9.29 8.44 -0.85 -9 COE with CO2 T&S 143.14 122.41 -20.73 -14
National Energy Technology Laboratory Office of Program Performance and Benefits
36