Embed Size (px)
Citation preview
THE JOURNAL OF BIOLOGICAL CHEMISTRY Vol. 241, No. 9, Issue of May 10, 1966
Printed in U.S. A.
Peroxidase Isozymes from Horseradish Roots
I. ISOLATION AND PHYSICAL PROPERTIES*
(Received for publication, October 11, 1965)
LELAND XI. SHANNON, ERNEST KAY, AND Jow Y. LEW
From the Depadment of Agricultural Sciences (Plant Biochemistry), University of California, Los Angeles, California 90024
SUMMARY
Seven peroxidase isozymes were isolated from horseradish roots and purified to homogeneity as ascertained by chro- matography, ultracentrifugation, and polyacrylamide disk electrophoresis. Purification procedures included ammon- ium sulfate precipitation and column chromatography on carboxymethyl and diethylaminoethyl cellulose. Peroxidase activity in the seven isozymes accounted for 86% of the activity in the crude homogenate. No interconversions among the isozymes were detected. The two most abundant isozymes were crystallized.
The seven isozymes may be segregated into two groups on the basis of their chromatographic behavior, electrophoretic migration, spectrophotometric properties, and amino acid and carbohydrate composition. Each isozyme was shown to con- tain protohemin IX as the prosthetic group.
Peroxidase isozymes were first detected by Theorell (1) in horseradish roots. It is now recognized that peroxidase isozymes are present throughout the plant kingdom (2-7). The presence of peroxidase isozymes suggests a likely explanation for the many reported discrepancies in peroxidase literature. While all peroxi- dase isozymes appear to catalyze the same reaction, the individ- ual isozymes may differ markedly in physicochemical and kinetic properties (6, 8). This paper describes procedures to isolate and purify seven peroxidase isozymes from horseradish roots. Investigations on certain physical properties, including their absorption spectra and amino acid and carbohydrate composi- tions, are included. Enzymatic properties of the isozymes will be reported in succeeding papers.
EXPERIMENTAL PROCEDURE
Purijkation of Enzyme-Horseradish (Armoracia rusticana) roots were purchased at local markets. All purification proce- dures were carried out at 4”. The roots were cut into cubes and homogenized with a minimal volume of 0.1 M K2HPOd in a Waring Blendor. The homogenate was filtered through cheese- cloth, and ammonium sulfate was added to 35 (j& saturation. The
* This investigation was supported in part by Research Grant 2182 from National Science Foundation.
supernatant solution was collected and brought to 90% ammo- nium sulfate saturation. After standing overnight, the residue was collected by centrifugation, redissolved in a minimal volume of 0.05 M Tris, pH 7.0, and dialyzed against 0.05 M Tris, pH 8.0, containing 0.1 M KCI. The dialysate was centrifuged, and the supernatant solution was collected and designated (NH&S04 fraction. Virtually 100% of the peroxidase activity detected in the crude extract was recovered in this fraction.
The (NH&SO4 fraction was dialyzed against 0.005 M acetate, pH 4.4, and transferred to a CM-cellulose’ chromatographic column previously equilibrated with the same buffer. The frac- tion that was not adsorbed by the column was designated as Fraction A, as shown in Fig. 1 (top). The CM-cellulose column was then eluted with a linear gradient consisting of 500 ml of 0.005 M acetate, pH 4.4, and 500 ml of 0.1 M acetate, pH 4.4. Just before the elution system was exhausted, a second elution system consisting of 300 ml of 0.1 M acetate, pH 4.4, and 300 ml of 0.25 M acetate, pH 4.9, was introduced into the column. Efflu- ent fractions containing enzyme activity were pooled as illus- trated in Fig. 1 (top) and were designated as Fractions B, C, D, and E. The emerging effluent was monitored at 280 rnp for the estimation of protein content and at 401 rnp for the estimation of heme content. Peroxidase activity coincided with heme content.
Fraction A (which did not adsorb to the CM-cellulose column) was dialyzed against 0.005 M Tris, pH 8.4, and was transferred to a DEAE-cellulose column previously equilibrated with the same buffer. All enzyme activity of Fraction A was retained. The DEAE-cellulose column was eluted with a linear gradient con- sisting of 500 ml of 0.005 M Tris, pH 8.4, and 500 ml of 0.005 M Tris, pH 8.4, containing 0.1 M NaCI. Effluent fractions contain- ing enzyme activity were pooled as illustrated in Fig. 2 (top) and were designated as Fractions A-l, A-2, and A-3. Fractions A-l, A-2, and A-3 were purified by repeated chromatography on DEAE-cellulose until elution patterns indicated that each frac- tion was free from other peroxidase fractions (Fig. 2).
Although peroxidase in Fractions B, C, D, and E did not ad- sorb to DEAE-cellulose, each fraction was passed through a DEAE-cellulose column in order to remove negatively charged contaminating proteins. Fractions B, C, D, and E were then purified by repeated chromatography on CM-cellulose until elution patterns indicated that each fraction was free from other peroxidase fractions (Fig. 1).
1 The abbreviation used is : CM, carboxymethyl.
2166
by guest on January 2, 2019http://w
ww
.jbc.org/D
ownloaded from
Issue of May 10, 1966 L. M. Shannon, E. Kay, and J. Y. Lew 2167
The above purification procedure yielded seven peroxidase isosymes. In view of the similarity of procedures, it is assumed that Fractions A, 13, C, D, and E in this study correspond to horseradish peroxidase A, B, C, D, and E obtained by Paul (9). Further chromatographic separation of our Fraction A showed it to consist of three fractions which we designate as Fractions A-l, A-2, and A-3.
Enzyme &say-Perosidase activity was measured by following spectrophotometrically the change in absorbance at 460 rnp due to o-dianisidine oxidation in the presence of Hz02 and enzyme (10). Reaction mixtures were incubated at 30” and contained 0.05 ml of 0.5% o-dianisidine, 0.1 ml of 0.1 M HzOz, 0.1 ml of enzyme, and 2.75 ml of 0.05 M acetate, pH 5.4.
Blectrophoresis-Fractions A-l, A-2, and A-3 were resolved on
30 50 70 110 120
Fraction Number
”
J
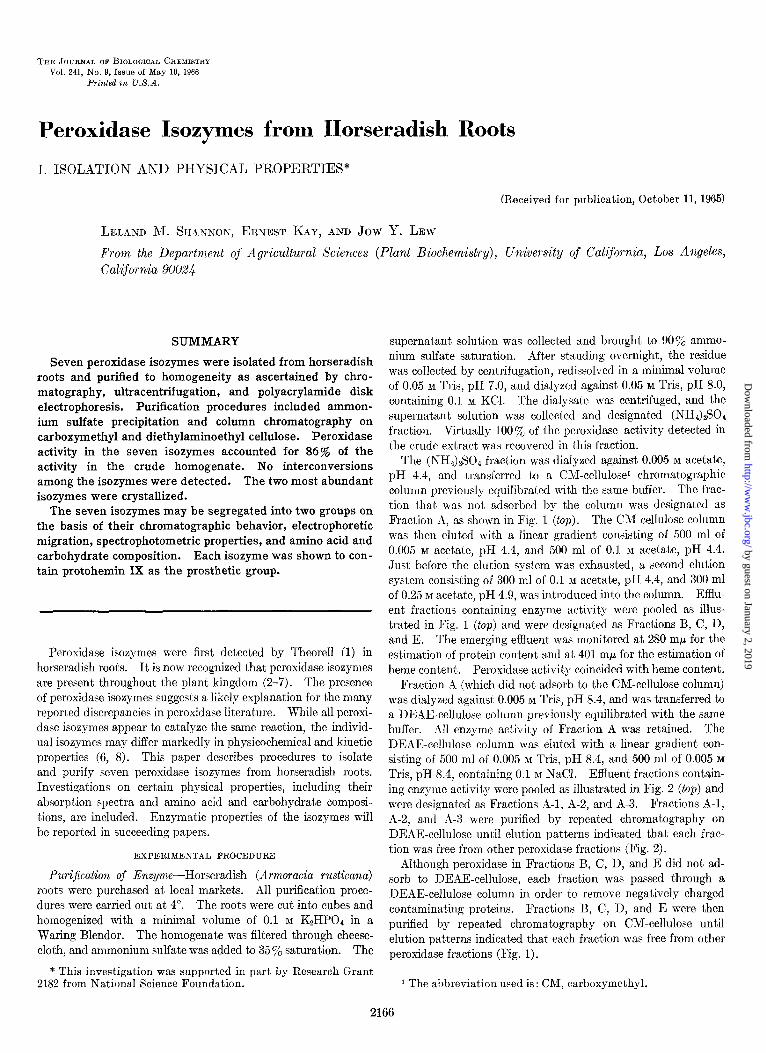
FIG. 1. Elution profiles from ClM-cellulose chromatographic columns. Top, elution profile of (NH,)&O, fraction. Column size: two columns, 25 X 200 mm each. First elution system, 0.005 M acetate, pH 4.4-0.1 M acetate, pH 4.4,500 ml each; second elution system, 0.1 M acetate, pH 4.4-0.25 M acetate, pH 4.9, 300 ml each; fraction volume, 10.0 ml. UppeT middle, elution profile from fourth chromatographic separation of Fraction B. Column size, 19 X 200 mm; elution system, 0.005 M acetate, pH 4.4-0.1 M acetate, pH 4.4, 500 ml each; fraction volume, 5.0 ml. Middle, elution profile from fourth chromatographic separation of Fraction C. Column size, 25 X 120 mm; elution system, 0.005 M acetate, pH 4.4-0.1 M acetate, pH 4.4, 500 ml each; fraction volume, 10.0 ml. Lower middle, elution profile from fourth chromatographic separa- tion of Fractions D and E. Column size, 19 X 120 mm; elution system, 0.1 M a.cetate, pH 4.4-0.2 M acetate, pH 4.9, 500 ml each; fraction volume, 5.0 ml. Bottom, elution profile from cochromato- graphic separation of Fractions B, C, D, and E. Column size, 25 X 200 mm; first buffer system, 0.02 M acetate, pH 4.4-0.1 M
acetate, pH 4.4, 500 ml each; second buffer system, 0.1 M acetate, pH 4.4-0.2 M acetate, pH 4.9, 500 ml each; fraction volume, 9.0 ml.
0 , 30 40 50 60
Fraction Number
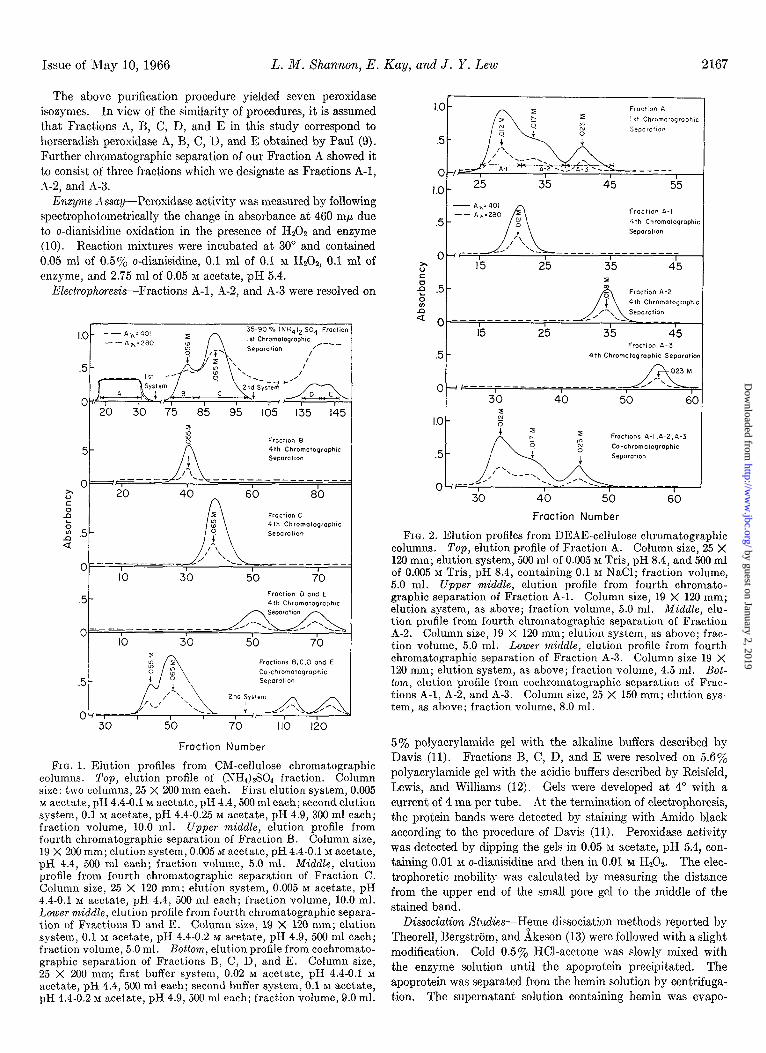
FIG. 2. Elution profiles from DEAE-cellulose chromatographic columns. Top, elution profile of Fraction A. Column size, 25 X 120 mm; elution system, 500 ml of 0.005 M Tris, pH 8.4, and 500 ml of 0.005 M Tris, pH 8.4, containing 0.1 M NaCl; fraction volume, 5.0 ml. Upper middle, elution profile from fourth chromato- graphic separation of Fraction A-l. Column size, 19 X 120 mm; elution system, as above; fra.ction volume, 5.0 ml. Middle, elu- tion profile from fourth chromatographic separation of Fraction A-2. Column size, 19 X 120 mm; elution system, as above; frac- tion volume, 5.0 ml. Lower middle, elution profile from fourth chromatographic separation of Fraction A-3. Column size 19 X 120 mm; elution system, as above; fraction volume, 4.5 ml. Bot- tom, elution profile from cochromatographic separation of Frac- tions A-l, A-2, and -4-3. Column size, 25 X 150 mm; elution sys- tem, as above; fraction volume, 8.0 ml.
5% polyacrylamide gel with the alkaline buffers described by Davis (11). Fractions B, C, D, and E were resolved on 5.6% polyacrylamide gel with the acidic buffers described by Reisfeld, Lewis, and Williams (12). Gels were developed at 4” with a current of 4 ma per tube. -4t the termination of electrophoresis, the protein bands were detected by staining with Amido black according to the procedure of Davis (11). Peroxidase activity was detected by dipping the gels in 0.05 M acetate, pH 5.4, con- taining 0.01 M o-dianisidine and then in 0.01 M H,Ot. The elec- trophoretic mobility was calculated by measuring the distance from the upper end of the small pore gel to the middle of the stained band.
Dissociation Studies-H:me dissociation methods reported by Theorell, Bergstrijm, and Akeson (13) were followed with a slight modification. Cold 0.5% HCl-acetone was slowly mixed with the enzyme solution until the apoprotein precipitated. The apoprotein was separated from the hemin solution by centrifuga- tion. The supernatant solution containing hemin was evapo-
by guest on January 2, 2019http://w
ww
.jbc.org/D
ownloaded from
2168 Peroxidase Isoxymes. I Vol. 241, No. 9
Ph y&c
Fraction
A-l A-2 A-3 B C D E
Enzyme activity”
% mm/hr
13 -13.6 2 -21.3 5 -25.4
20 +2.8 36 +3.3 4 +5.0 6 +5.3
TABLE I properties of peroxidase isozymes
Electro- Sedimen- phoretic mobility*
tation coefficient0
s 3.50 3.36 3.50 3.58 3.58
Absorbance ratiod
4.19 4.12 3.71 3.37 3.42 2.57 2.50
Molar absorbance
index’
x 106s 1.02 1.02 0.97 0.94 0.95
a Enzyme activity of crude homogenate equals 100%. B Acidic group developed according to Davis (11) in 5% gel with
4 ma per tube for 55 min; basic group developed according to Reisfeld, Lewis, and Williams (12) in 5.6yo gel with 4 ma per tube for 280 min.
c Determined at 50,740 rpm in 0.05 M Tris, pH 7.0; Fraction A-l, 0.72 mg per ml; Fraction A-2, 1.01 mg per ml; Fraction A-3, 1.05 mg per ml; Fraction B, 0.78 mg per ml; Fraction C, 0.84 mg per ml.
d Ratio of absorption of the Soret band to that at 275 rnp; values determined in 0.05 M acetate, pH 5.8.
B Values determined in 0.05 M acetate, pH 5.8, at 401 rnp; molar absorption coefficient of a-band of reduced pyridine hemochromo- gen (20) used as basis for calculation.
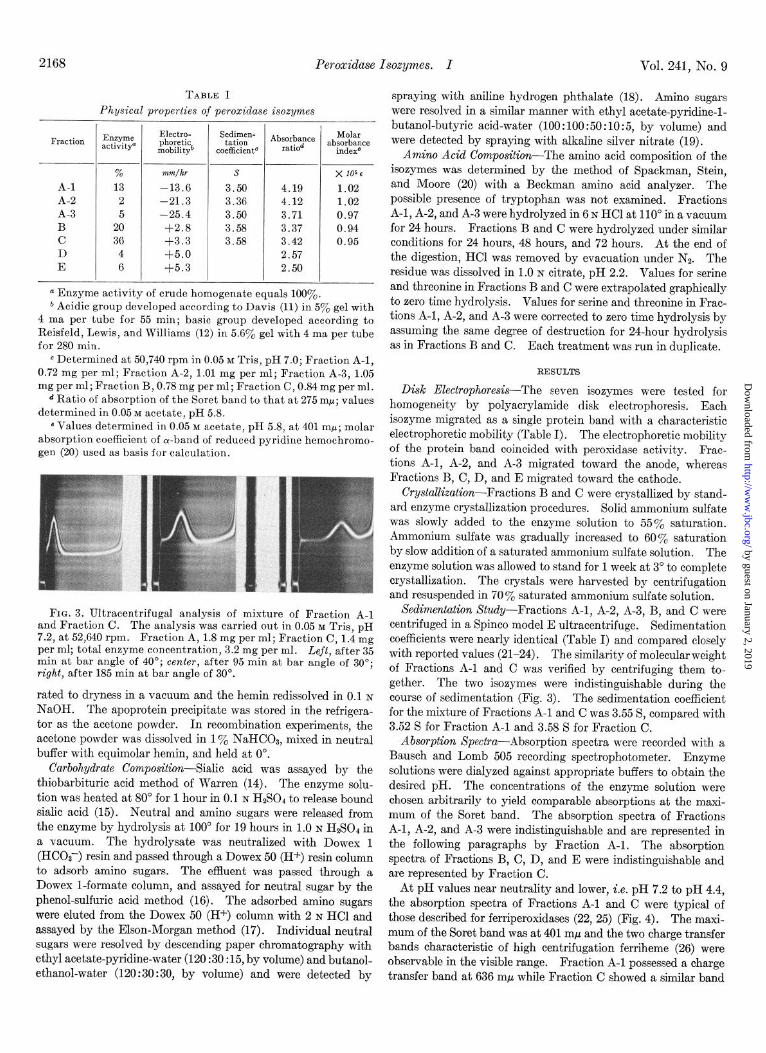
FIG. 3. Ultracentrifugal analysis of mixture of Fraction A-l and Fraction C. 7.2, at 52,640 rpm.
The analysis was carried out in 0.05 M Tris, pH Fraction A, 1.8 mg per ml; Fraction C, 1.4 mg
per ml; total enzyme concentration, 3.2 mg per ml. Left, after 35 min at bar angle of 40’; center, after 95 min at bar angle of 30”; right, after 185 min at bar angle of 30”.
rated to dryness in a vacuum and the hemin redissolved in 0.1 N NaOH. The apoprotein precipitate was stored in the refrigera- tor as the acetone powder. In recombination experiments, the acetone powder was dissolved in 1 To NaHCO$, mixed in neutral buffer with equimolar hemin, and held at 0”.
Carbohydrate Composition-Sialic acid was assayed by the thiobarbituric acid method of Warren (14). The enzyme solu- tion was heated at 80” for 1 hour in 0.1 N H$Oa to release bound sialic acid (15). Neutral and amino sugars were released from the enzyme by hydrolysis at 100” for 19 hours in 1.0 N H&SO4 in a vacuum. The hydrolysate was neutralized with Dowex 1 (HC03-) resin and passed through a Dowex 50 (H+) resin column to adsorb amino sugars. The effluent was passed through a Dowex I-formate column, and assayed for neutral sugar by the phenol-sulfuric acid method (16). The adsorbed amino sugars were eluted from the Dowex 50 (Hf) column with 2 N HCI and assayed by the Elson-Morgan method (17). Individual neutral sugars were resolved by descending paper chromatography with ethyl acetate-pyridine-water (120 :30 :15, by volume) and butanol- ethanol-water (120:30 :30, by volume) and were detected by
spraying with aniline hydrogen phthalate (18). Amino sugars were resolved in a similar manner with ethyl acetate-pyridine-l- butanol-butyric acid-water (100 : 100 :50 : 10 : 5, by volume) and were detected by spraying with alkaline silver nitrate (19).
Amino Acid Composition-The amino acid composition of the isozymes was determined by the method of Spackman, Stein, and Moore (20) with a Beckman amino acid analyzer. The possible presence of tryptophan was not examined. Fractions A-l, A-2, and A-3 were hydrolyzed in 6 N HCl at 110” in a vacuum for 24 hours. Fractions B and C were hydrolyzed under similar conditions for 24 hours, 48 hours, and 72 hours. At the end of the digestion, HCl was removed by evacuation under Nz. The residue was dissolved in 1.0 N citrate, pH 2.2. Values for serine and threonine in Fractions B and C were extrapolated graphically to zero time hydrolysis. Values for serine and threonine in Frac- tions A-l, A-2, and A-3 were corrected to zero time hydrolysis by assuming the same degree of destruction for 24-hour hydrolysis as in Fractions B and C. Each treatment was run in duplicate.
RESULTS
Disk Electrophoresis-The seven isozymes were tested for homogeneity by polyacrylamide disk electrophoresis. Each isozyme migrated as a single protein band with a characteristic electrophoretic mobility (Table I). The electrophoretic mobility of the protein band coincided with peroxidase activity. Frac- tions A-l, A-2, and A-3 migrated toward the anode, whereas Fractions B, C, D, and E migrated toward the cathode.
Crystallization-Fractions B and C were crystallized by stand- ard enzyme crystallization procedures. Solid ammonium sulfate was slowly added to the enzyme solution to 55% saturation. Ammonium sulfate was gradually increased to 60% saturation by slow addition of a saturated ammonium sulfate solution. The enzyme solution was allowed to stand for 1 week at 3” to complete crystallization. The crystals were harvested by centrifugation and resuspended in 70 y. saturated ammonium sulfate solution.
Sedimentation Study-Fractions A-l, A-2, A-3, B, and C were centrifuged in a Spinco model E ultracentrifuge. Sedimentation coefficients were nearly identical (Table I) and compared closely with reported values (21-24). The similarity of molecular weight of Fractions A-l and C was verified by centrifuging them to- gether. The two isozymes were indistinguishable during the course of sedimentation (Fig. 3). The sedimentation coefficient for the mixture of Fractions A-l and C was 3.55 S, compared with 3.52 S for Fraction A-l and 3.58 S for Fraction C.
Absorption Spectra-Absorption spectra were recorded with a Bausch and Lomb 505 recording spectrophotometer. Enzyme solutions were dialyzed against appropriate buffers to obtain the desired pH. The concentrations of the enzyme solution were chosen arbitrarily to yield comparable absorptions at the maxi- mum of the Soret band. The absorption spectra of Fractions A-l, A-2, and A-3 were indistinguishable and are represented in the following paragraphs by Fraction A-l. The absorption spectra of Fractions B, C, D, and E were indistinguishable and are represented by Fraction C.
At pH values near neutrality and lower, i.e. pH 7.2 to pH 4.4, the absorption spectra of Fractions A-l and C were typical of those described for ferriperoxidases (22, 25) (Fig. 4). The maxi- mum of the Soret band was at 401 m,u and the two charge transfer bands characteristic of high centrifugation ferriheme (26) were observable in the visible range. Fraction A-l possessed a charge transfer band at 636 rnp while Fraction C showed a similar band
by guest on January 2, 2019http://w
ww
.jbc.org/D
ownloaded from
Issue of May 10, 1966 L. M. Xhannon, E. Kay, and J. Y. Lew 2169
at 642 mp. The second charge transfer band was at 499 mp in both isozymes. A discernible difference between the two iso- zymes is noted in the absorption properties of the Soret band. Fraction C possessed a very pronounced shoulder at 376 rnp which was not apparent in Fraction A-l.
At pH 9.6, the charge transfer bands of Fraction A-l disap- peared and the maximum of the Soret band shifted to 409 mp. In contrast the absorption spectrum of Fraction C did not change.
At pH 10.5, both fractions possessed the a-band at 551 rnp, the P-band at 526 rnp, and the Soret band at 418. Fraction A-l showed a higher absorbance of the a-band than the P-band, while this order was reversed in Fraction C. When the pH was lowered from 10.5 to 7.2, the spectra shifted toward that of ferriperoxi- dase, but the original spectra were not restored until the pH was lowered to 4.4 (Fig. 4).
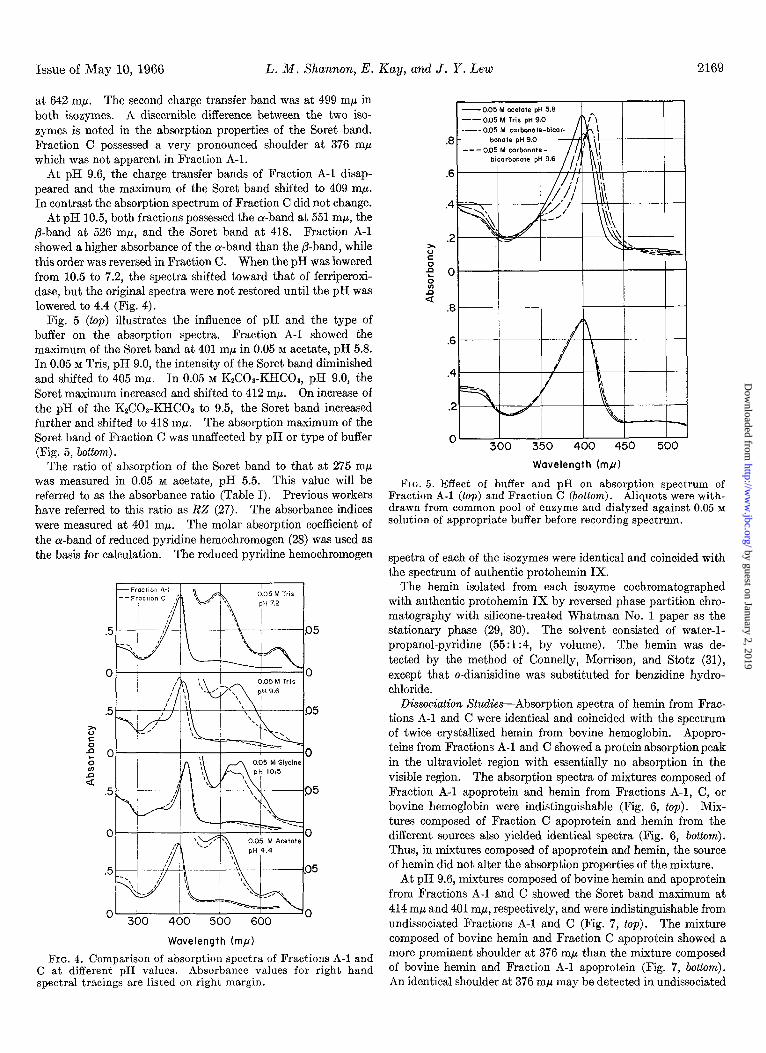
Fig. 5 (top) illustrates the influence of pH and the type of buffer on the absorption spectra. Fraction A-l showed the maximum of the Soret band at 401 rnp in 0.05 M acetate, pH 5.8. In 0.05 M Tris, pH 9.0, the intensity of the Soret band diminished and shifted to 405 rnp. In 0.05 M K&Oa-KHC08, pH 9.0, the Soret maximum increased and shifted to 412 rnp. On increase of the pH of the K2C08-KHCOa to 9.5, the Soret band increased further and shifted to 418 mp. The absorption maximum of the Soret band of Fraction C was unaffected by pH or type of buffer (Fig. 5, bottom).
The ratio of absorption of the Soret band to that at 275 ml* was measured in 0.05 M acetate, pH 5.5. This value will be referred to as the absorbance ratio (Table I). Previous workers have referred to this ratio as RZ (27). The absorbance indices were measured at 401 mp. The molar absorption coefficient of the a-band of reduced pyridine hemochromogen (28) was used as the basis for calculation. The reduced pyridine hemochromogen
” 300 400 500 600 ”
Wavelength (m,u)
FIG. 4. Comparison of absorption spectra of Fractions A-l and C at different pH values. Absorbance values for right hand spectral tracings are listed on right margin.
.6
.
Wavelength (m,u)
FIG. 5. Effect of buffer and pH on absorption spectrum of Fraction A-l (top) and Fraction C (bottom). Aliquots were with- drawn from common pool of enzyme and dialyzed against 0.05 M solution of appropriate buffer before recording spectrum.
spectra of each of the isozymes were identical and coincided with the spectrum of authentic protohemin IX.
The hemin isolated from each isozyme cochromatographed with authentic protohemin IX by reversed phase partition chro- matography with silicone-treated Whatman No. 1 paper as the stationary phase (29, 30). The solvent consisted of water-l- propanol-pyridine (55: 1:4, by volume). The hemin was de- tected by the method of Connelly, Morrison, and Stotz (31), except that o-dianisidine was substituted for benzidine hydro- chloride.
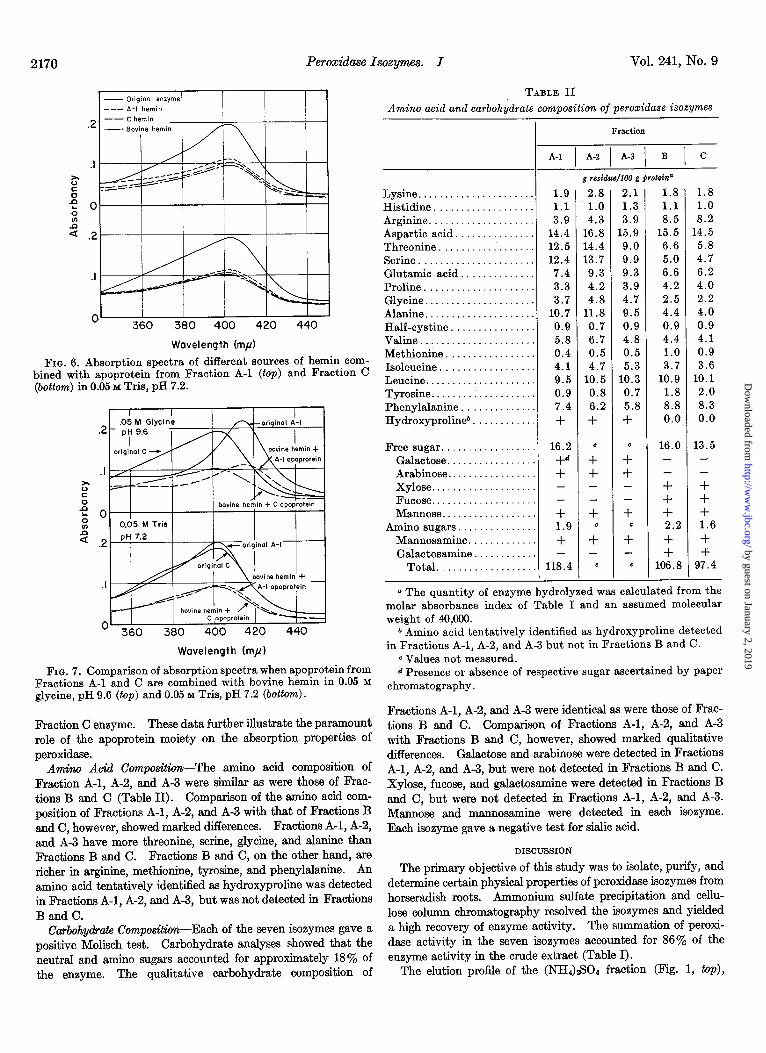
Dissociation Studies-Absorption spectra of hemin from Frac- tions A-l and C were identical and coincided with the spectrum of twice crystallized hemin from bovine hemoglobin. Apopro- teins from Fractions A-l and C showed a protein absorption peak in the ultraviolet region with essentially no absorption in the visible region. The absorption spectra of mixtures composed of Fraction A-l apoprotein and hemin from Fractions A-l, C, or bovine hemoglobin were indistinguishable (Fig. 6, top). Mix- tures composed of Fraction C apoprotein and hemin from the different sources also yielded identical spectra (Fig. 6, bottom). Thus, in mixtures composed of apoprotein and hemin, the source of hemin did not alter the absorption properties of the mixture.
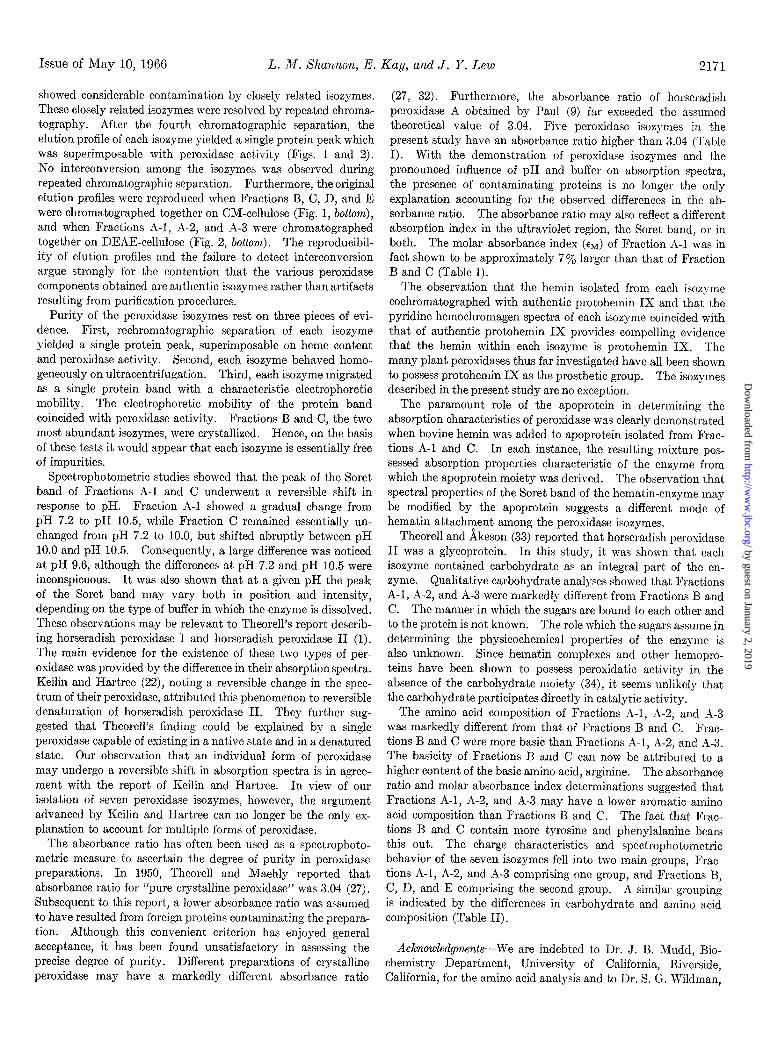
At pH 9.6, mixtures composed of bovine hemin and apoprotein from Fractions A-l and C showed the Soret band maximum at 414 rnF and 401 rnp, respectively, and were indistinguishable from undissociated Fractions A-l and C (Fig. 7, top). The mixture composed of bovine hemin and Fraction C apoprotein showed a more prominent shoulder at 376 ml than the mixture composed of bovine hemin and Fraction A-l apoprotein (Fig. 7, bottom). An identical shoulder at 376 rnp may be detected in undissociated
by guest on January 2, 2019http://w
ww
.jbc.org/D
ownloaded from
2170 Peroxidase Isozymes. I Vol. 241, No. 9
_ Original enzyme
--- A-l hemin , /
--C hemin
.-_ Swine hemin
360 380 400 420 440
Wavelength Imp)
FIG. 6. Absorption spectra of different sources of hemin com- bined with apoprotein from Fraction A-l (top) and Fraction C (bottom) in 0.05 M Tris, pH 7.2.
Wavelength (mpl
FIG. 7. Comparison of absorption spectra when apoprotein from Fractions A-l and C are combined with bovine hemin in 0.05 M glycine, pH 9.6 (top) and 0.05 M Tris, pH 7.2 (bottom).
Fraction C enzyme. These data further illustrate the paramount role of the apoprotein moiety on the absorption properties of peroxidase.
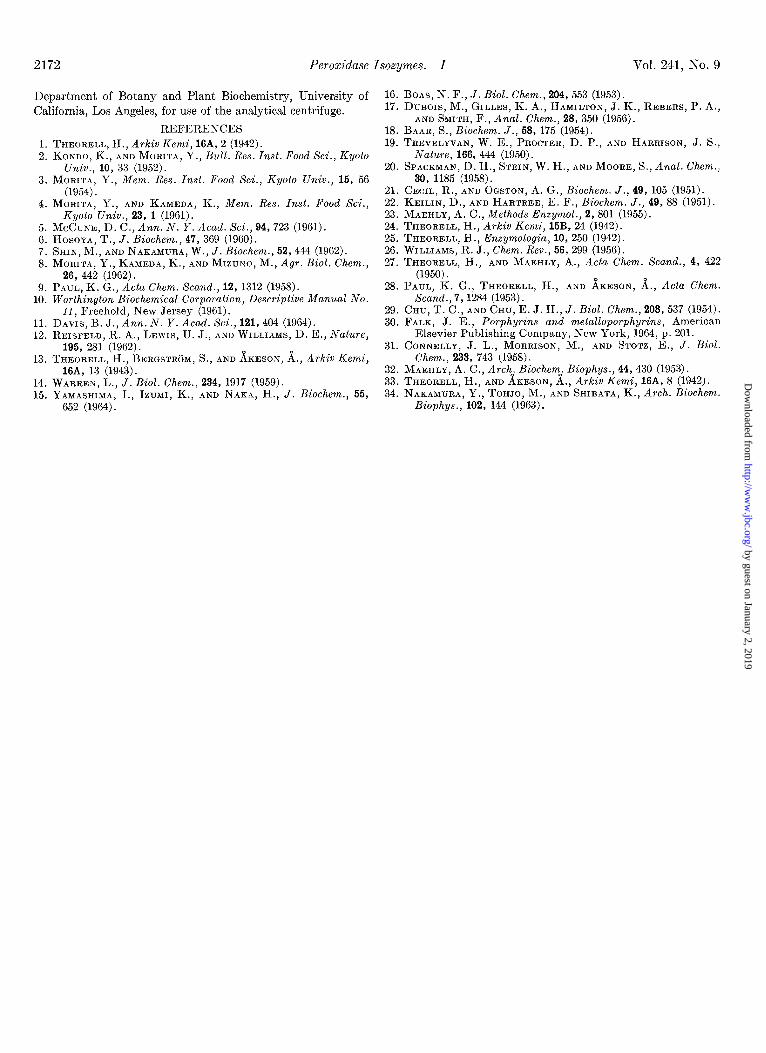
Amino Acid Cowzpositti-The amino acid composition of Fraction A-l, A-2, and A-3 were similar as were those of Frac- tions B and C (Table II). Comparison of the amino acid com- position of Fractions A-l, A-2, and A-3 with that of Fractions B and C, however, showed marked differences. Fractions A-l, A-2, and A-3 have more threonine, serine, glycine, and alanine than Fractions B and C. Fractions B and C, on the other hand, are richer in arginine, methionine, tyrosine, and phenylalanine. An amino acid tentatively identified as hydroxyproline was detected in Fractions A-l, A-2, and A-3, but was not detected in Fractions BandC.
Carbohydrati Composition-Each of the seven isozymes gave a positive Molisch test. Carbohydrate analyses showed that the neutral and amino sugars accounted for approximately 18% of the enzyme. The qualitative carbohydrate composition of
TABLE II Amino acid and carbohydrate composition of peroxidase isozumes
Lysine ...................... Histidine ................... Arginine. ................... Aspartic acid. .............. Threonine .................. Serine. ..................... Glutamic acid. ............. Proline ..................... Glycine ..................... Alanine ..................... Half -cystine ................ Valine ...................... Methionine ................. Isoleucine .................. Leucine .................... Tyrosine ................... Phenylalanine ............. Hydroxyprolineb ...........
-
.-
-
1.9 2.8 2.1 1.8 1.8 1.1 1.0 1.3 1.1 1.0 3.9 4.3 3.9 8.5 8.2
14.4 16.8 15.9 15.5 14.5 12.5 14.4 9.0 6.6 5.8 12.4 13.7 9.9 5.0 4.7
7.4 9.3 9.3 6.6 6.2 3.3 4.2 3.9 4.2 4.0 3.7 4.8 4.7 2.5 2.2
10.7 11.8 9.5 4.4 4.0 0.9 0.7 0.9 0.9 0.9 5.8 6.7 4.8 4.4 4.1 0.4 0.5 0.5 1.0 0.9 4.1 4.7 5.3 3.7 3.6 9.5 10.5 10.3 10.9 10.1 0.9 0.8 0.7 1.8 2.0 7.4 6.2 5.8 8.8 8.3 + + + 0.0 0.0
Free sugar. c ................ Galactose ................ + ;
16.0 13.5 - -
Arabinose - - ................ + + Xylose - - ................... + + Fucose - - ................... + + Mannose. ................ + + + +
Amino sugars. 1.6 ............. 2.2 Mannosamine ............ ; ; + + Galactosamine - - ........... + f
Total. c c ................. 106.8 97.4 - -
a The quantity of enzyme hydrolyzed was calculated from the molar absorbance index of Table I and an assumed molecular weight of 40,000.
b Amino acid tentatively identified as hydroxyproline detected in Fractions A-l, A-2, and A-3 but not in Fractions B and C.
16.2 +d + - -
+ 1.9 + -
118.4
c Values not measured. d Presence or absence of respective sugar ascertained by paper
chromatography.
-
A-l
- I -
Fraction
A-2 1 A-3 1 B 1 C
g residue/100 g protein’
Fractions A-l, A-2, and A-3 were identical as were those of Frac- tions B and C. Comparison of Fractions A-l, A-2, and A-3 with Fractions B and C, however, showed marked qualitative differences. Galactose and arabinose were detected in Fractions A-l, A-2, and A-3, but were not detected in Fractions B and C. Xylose, fucose, and galactosamine were detected in Fractions B and C, but were not detected in Fractions A-l, A-2, and A-3. Mannose and mannosamine were detected in each isozyme. Each isozyme gave a negative test for sialic acid.
DISCUSSION
The primary objective of this study was to isolate, purify, and determine certain physical properties of peroxidase isozymes from horseradish roots. Ammonium sulfate precipitation and cellu- lose column chromatography resolved the isozymes and yielded a high recovery of enzyme activity. The summation of peroxi- dase activity in the seven isozymes accounted for 86% of the enzyme activity in the crude extract (Table I).
The elution profile of the (NH&SO& fraction (Fig. 1, top),
by guest on January 2, 2019http://w
ww
.jbc.org/D
ownloaded from
Issue of May 10, 1966 L. M. Shannon, E. Kay, and J. Y. Lew 2171
showed considerable contamination by closely related isozymes. These closely related isozymes were resolved by repeated chroma- tography. After the fourth chromatographic separation, the elution profile of each isozyme yielded a single protein peak which was superimposable with peroxidase act.ivity (Figs. 1 and 2). No interconversion among the isozymes was observed during repeated chromatographic separation. Furthermore, the original elution profiles were reproduced when Fractions B, C, D, and E were chromatographed together on CM-cellulose (Fig. 1, bottom), and when Fractions A-l, A-2, and A-3 were chromatographed together on DEAE-cellulose (Fig. 2, bottom). The reproducibil- ity of elution profiles and the failure to detect interconversion argue strongly for the contention that the various peroxidase components obtained are authentic isozymes rather than artifacts resulting from purification procedures.
Purity of the peroxidase isozymes rest on three pieces of evi- dence. First, rechromatographic separation of each isozyme yielded a single protein peak, superimposable on heme content and peroxidase activity. Second, each isozyme behaved homo- geneously on ultracentrifugation. Third, each isozyme migrated as a single protein band with a characteristic electrophoretic mobility. The electrophoretic mobility of the protein band coincided with peroxidase activity. Fractions B and C, the two most abundant isozymes, were crystallized. Hence, on the basis of these tests it would appear that each isozyme is essentially free of impurities.
Spectrophotometric studies showed that the peak of the Soret band of Fractions A-l and C underwent a reversible shift in response to pH. Fraction A-l showed a gradual change from pH 7.2 to pH 10.5, while Fraction C remained essentially un- changed from pH 7.2 to 10.0, but shifted abruptly between pH 10.0 and pH 10.5. Consequently, a large difference was noticed at pH 9.6, although the differences at pH 7.2 and pH 10.5 were inconspicuous. It was also shown that at a given pH the peak of the Soret band may vary both in position and intensity, depending on the type of buffer in which the enzyme is dissolved. These observations may be relevant to Theorell’s report describ- ing horseradish peroxidase I and horseradish peroxidase II (1). The main evidence for the existence of these two types of per- osidase was provided by the difference in their absorptionspectra. Keilin and Hartree (22), noting a reversible change in the spec- trum of their peroxidase, attributed this phenomenon to reversible denaturation of horseradish peroxidase II. They further sug- gested that Theorell’s finding could be explained by a single peroxidase capable of existing in a native state and in a denatured state. Our observation that an individual form of peroxidase may undergo a reversible shift in absorption spectra is in agree- ment with the report of Keilin and Hartree. In view of our isolation of seven peroxidase isozymes, however, the argument advanced by Keilin and Hartree can no longer be the only ex- planation to account for multiple forms of peroxidase.
The absorbance ratio has often been used as a spectrophoto- metric measure to ascertain the degree of purity in peroxidase preparations. In 1950, Theorell and Maehly reported that absorbance ratio for “pure crystalline peroxidase” was 3.04 (27). Subsequent to this report, a lower absorbance ratio was assumed to have resulted from foreign proteins contaminating the prepara- tion. Although this convenient criterion has enjoyed general acceptance, it has been found unsatisfactory in assessing the precise degree of purity. Different preparations of crystalline peroxidase may have a markedly different absorbance ratio
(27, 32). Furthermore, the absorbance ratio of horseradish peroxidase A obtained by Paul (9) far exceeded the assumed theoretical value of 3.04. Five perosidase isozymes in the present study have an absorbance ratio higher than 3.04 (Table I). With the demonstration of peroxidase isozymes and the pronounced influence of pH and buffer on absorption spectra, the presence of contaminating proteins is no longer the only explanation accounting for the observed differences in the ab- sorbance ratio. The absorbance ratio may also reflect a different absorption index in the ultraviolet region, the Soret band, or in both. The molar absorbance index (E& of Fraction A-l was in fact shown to be approximately 7% larger than that of Fraction B and C (Table I).
The observation that the hemin isolated from each isozyme cochromatographed with authentic protohemin IX and that the pyridine hemochromagen spectra of each isozyme coincided with that of authentic protohemin IX provides compelling evidence that the hemin within each isozyme is protohemin IX. The many plant peroxidases thus far investigated have all been shown to possess protohemin IX as the prosthetic group. The isozymes described in the present study are no exception.
The paramount role of the apoprotein in determining the absorption characteristics of peroxidase was clearly demonstrated when bovine hemin was added to apoprotein isolated from Frac- tions A-l and C. In each instance, the resulting mixture pos- sessed absorption properties characteristic of the enzyme from which the apoprotein moiety was derived. The observation that spectral properties of the Soret band of the hematin-enzyme may be modified by the apoprotein suggests a different mode of hematin attachment among the peroxidase isozymes.
Theorell and Akeson (33) reported that horseradish peroxidase II was a glycoprotein. In this study, it was shown that each isozyme contained carbohydrate as an integral part of the en- zyme. Qualitative carbohydrate analyses showed that Fractions A-l, A-2, and A-3 were markedly different from Fractions B and C. The manner in which the sugars are bound to each other and to the protein is not known. The role which the sugars assume in determining the physicochemical properties of the enzyme is also unknown. Since hematin complexes and other hemopro- teins have been shown to possess perosidatic activity in the absence of the carbohydrate moiety (34), it seems unlikely that the carbohydrate participates directly in catalytic activity.
The amino acid composition of Fractions A-l, A-2, and A-3 was markedly different from that of Fractions B and C. Frac- tions B and C were more basic than Fractions A-l, A-2, and A-3. The basicity of Fractions B and C can now be attributed to a higher content of the basic amino acid, arginine. The absorbance ratio and molar absorbance index determinations suggested that Fractions A-l, A-2, and A-3 may have a lower aromatic amino acid composition than Fractions B and C. The fact that Frac- tions B and C contain more tyrosine and phenylalanine bears this out. The charge characteristics and spectrophotometric behavior of the seven isozymes fell into two main groups, Frac- tions A-l, A-2, and A-3 comprising one group, and Fract.ions B, C, D, and E comprising the second group. A similar grouping is indicated by the differences in carbohydrate and amino acid composition (Table II).
Acknowledgments-We are indebted to Dr. J. B. Mudd, Bio- chemistry Department, University of California, Riverside, California, for the amino acid analysis and to Dr. S. G. Wildman,
by guest on January 2, 2019http://w
ww
.jbc.org/D
ownloaded from
2172 Peroxidase Isozymes. I Vol. 241, No. 9
Department of Botany and Plant Biochemistry, University of California, Los Angeles, for use of the analytical centrifuge.
REFERENCES 1. THEORELL, H., Arkiv Kemi, 16A, 2 (1942). 2. KONDO, K., AND MORITA, Y., R~tll. Res. Inst. Food Sci., Kyoto
Univ., 10, 33 (1952). 3. MORI’I’A, Y., Mem. Res. Inst. Food Sci., Kyoto Univ., 16, 56
(1954). 4. MORITA, Y., AND KAMEDA, K., Mem. Res. Inst. Food Sci.,
Kyoto Univ., 23, 1 (1961). 5. MCCUNE, 1). C., Ann. N. Y. &xxZ. Sci., 94,723 (19Gl). 6. HOSOYA, T., J. Biochem., 47, 369 (1960). 7. SHIN, M., ANU NAKAMURA, W., J. Rio&em., 52,444 (1962). 8. MORITA, Y., KAMEUA, Ii., AND MIZURTO, M., Agr. Biol. Chem.,
26, 442 (1962). 9. PAUL, K. G., Acta Chem. Stand., 12, 1312 (1958).
10. Worthington Biochemical Corporation, Descriptive Manual No. 11. Freehold, New Jersey (1961).
11. DA&S, B. J., knn. N. Y. icad. Sci., 121, 404 (19G4). 12. REISFELD. R. A.. LEJVIS. U. J.. AND WILLIAMS. I>. E., Nature,
196, 281’(1962): ’ ’ 13. THEORELL, H., BERGSTRiiM, S., AND ;~KESON, d., Arkiv I‘emi,
16A, 13 (1943). 14. WARREN, I,., J. Biol. Chem., 234, 1917 (1959). 15. YAMASHIMA, I., IZUMI, K., A~VD NAKA, H., J. Biochem., 55,
652 (1964).
16. BOAS, N. F., J. Biol. Chem., 204, 553 (1953). 17. DUBOIS, M., GILLES, K. A., HAMILTON, J. K., REBERS, P. A.,
18. 19.
AND Ssw&, F., A&l. Chem., 28, 350 (1956). BAAR. S.. Biochem. J.. 68. 175 (1954). TREvEL~~AN, W. E., ‘PR&TER, D. ‘P., AND HARRISON, J. S.,
Nature, 166, 444 (1950). 20. SPACKMAN, D. H., STEIN, W. H., AND MOORE, S., Anal. Chem.,
30, 1185 (1958). 21. 22. 23. 24. 25. 26. 27.
CECIL, R., END OGSTON, A. G., Biochem. J., 49, 105 (1951). KEILIN. D.. AND HARTREE. E. F.. Biochem. J.. 49. 88 (1951). MAEHL;, A: C., Methods E&zymol:, 2, 801 (195g). THEORELL, H., Arkiv Kemi, 16B. 24 (1942). THEORELL, H., Enzymologia, 10, 250 (1942). WILLIAMS, It. J., Chem. Rev., 56, 299 (1956). THEORELL, H., AND MAEHLY, A., Acta Chem. Stand., 4, 422
(1950). 28. PAUL. K. G., THEORELL, H.. AND ~KESON, A.. Acta Chem.
29. 30.
Scahd., 7,li84 (1953). ’ ’ ,
CHU, T. C., AND CHU, E. J. H., J. Biol. Chem., 208, 537 (1954). FALK. J. E.. Porvhurins and metalloporphm-ins, American
31. Elskvier Publish& Company, New I!orG, 1964, p. 201.
CONNELLY, J. L., MORRISON, M., AND STOTZ, E., J. L3ioZ. Chem., 233, 743 (1958).
32. 33. 34.
MAEHLY, A. C., Arch; Biochem, Biophys., 44,430 (1953). THEORELL, H., AND AKESON, A., Arkiv Kemi, 16A, 8 (1942). NAKAMURA, Y., TOHJO, M., AND SHIBATA, K., Arch. Biochem.
Biophys., 102, 144 (1963).
by guest on January 2, 2019http://w
ww
.jbc.org/D
ownloaded from
Leland M. Shannon, Ernest Kay and Jow Y. LewPHYSICAL PROPERTIES
Peroxidase Isozymes from Horseradish Roots: I. ISOLATION AND
1966, 241:2166-2172.J. Biol. Chem.
http://www.jbc.org/content/241/9/2166Access the most updated version of this article at
Alerts:
When a correction for this article is posted•
When this article is cited•
to choose from all of JBC's e-mail alertsClick here
http://www.jbc.org/content/241/9/2166.full.html#ref-list-1
This article cites 0 references, 0 of which can be accessed free at
by guest on January 2, 2019http://w
ww
.jbc.org/D
ownloaded from


![A Glucose Biosensor based on Horseradish Peroxidase and ... · According to previous results [8-10], the horseradish peroxidase (HRP) can catalyze the oxidation of H 2 O 2 into O](https://img.pdfslide.net/doc/110x75/60bb4bc8eaf70c137a426ecc/a-glucose-biosensor-based-on-horseradish-peroxidase-and-according-to-previous.jpg)