Embed Size (px)
Citation preview
Persistence and developmental transition of wide seismic lines
in the western Boreal Plains of Canada
Philip Lee*,1, Stan Boutin2
Integrated Landscape Management Program, Department of Biological Sciences, University of Alberta, Edmonton, Alta., Canada T6G 2E9
Received 15 September 2004; revised 26 January 2005; accepted 21 March 2005
Available online 22 August 2005
Abstract
This study examined the fate of seismic lines utilized in oil and gas exploration in Canada’s western Boreal Plains. It retrospectively
followed the persistence, recovery and developmental transition of seismic lines established between the 1960s and the mid-1970s through to
2003. We examined lines that passed through three forest types; aspen, white spruce, and lowland black spruce. In general, the recovery rates
of seismic lines to woody vegetation were low. After 35 years, 8.2% of seismic lines across all forest types had recovered to greater than 50%
cover of woody vegetation. Only the upland forest types recovered; aspen and white spruce. Most seismic lines (w65% at 35 years) remained
in a cleared state with a cover of low forbs. The most common transition for seismic lines was to tracked access (w20% at 35 years).
Transition to other anthropogenic developments such as roads, pipelines, buildings, and timber harvest blocks was 5% after 35 years. The
pulse of industrial activity initiated in the mid-1990s greatly increased the transition rate of seismic to tracked access for a short period of
time. The discussion focused on natural and anthropogenic factors that hinder recovery and on the management directions that would
facilitate greater recovery rates.
q 2005 Elsevier Ltd. All rights reserved.
Keywords: Vehicular traffic; Oil exploration; Road development; Site remediation
1. Introduction
Seismic exploration is often the first step in the oil
extraction process. In brief, it consists of the linear
placement of sensitive receivers (geophones) on the ground,
i.e. seismic lines. Small explosive charges or mechanical
vibrations are created along the ground surface. Geophones
record the energy reflected back from subterranean rock and
hydrocarbon layers at varying depths. The intensity, wave
form, and times for reflection are used to profile the
underlying rock layers and potential hydrocarbon layers.
Solitary lines of geophones allow for a two-dimensional,
cross-sectional resolution while a network grid of geo-
phones with closer spacing produces a more detailed, three-
0301-4797/$ - see front matter q 2005 Elsevier Ltd. All rights reserved.
doi:10.1016/j.jenvman.2005.03.016
* Corresponding author. Address: Parks Canada, #300-300 W. Georgia
Street, Vancouver, BC, Canada V6B 6B4. Tel.: C1 604 666 3154.
E-mail addresses: [email protected] (P. Lee), stan.boutin@ualberta.
ca (S. Boutin).1 Tel.: C1 780 492 5766; fax: C1 780 492 9234.2 Tel.: C1 780 492 1297.
dimensional, topographic map of rock layers. The surface
footprint of this exploration can be long linear lines of trails
cut into the forest.
A number of different methods are used to create the
transmission and receiver lines in seismic exploration. In the
boreal forest of western Canada, the primary method from the
early 1950s to 2000 was to clear vegetation using bulldozers.
This linear grid of lines, some cut as early as the 1950s, is still
evident today. Lines intersect with other lines forming an
irregularly spaced grid over the landscape. The trend has been
a reduction of lines from 8 to 5 m. In ecologically sensitive
areas, there can be a further reduction in the footprint, i.e.
narrow width, such as hand-cut, or narrow width machinery, or
minimal footprint techniques such as heliportable. While the
application of these methods is expanding, many kilometres of
seismic lines in Canada and Russia were cut and are still being
cut to the 5 m width. This paper examined the recovery of
these wider seismic lines.
Conservative estimates of wide seismic lines in north-
eastern Alberta, a primary oil producing region within
Canada, indicate a mean density of 1.5 km per km2 present
in 98% of the townships (10!10 km) (based on 2001
Alberta Base Features Map, Alberta Data Resource
Journal of Environmental Management 78 (2006) 240–250
www.elsevier.com/locate/jenvman
P. Lee, S. Boutin / Journal of Environmental Management 78 (2006) 240–250 241
Division, Sustainable Resource Development, Government
of Alberta, Edmonton, Alberta). Densities in some town-
ships reach as a high as 10 km per km2. This estimate does
not include other linear features such as roads, electrical
transmission lines, pipelines, and railways. For comparison,
the road network in the developed agricultural zone of
Alberta is 1 km per km2 (2 km right angle spacing). Unlike
other forested systems in which timber harvest or clearing
for agriculture were the first steps to development, seismic
lines were often the first step in industrial development for
much of the boreal forests in western Canada and Russia. As
industrial development proceeds, the cumulative effects of
these different anthropogenic features are an environmental
concern (Schneider, 2002; Schneider et al., 2003). The
original intent was that seismic lines would eventually
recover their former vegetation communities. Casual
observations suggest that this has not occurred, however,
this type of information can be deceptive since observers are
naturally biased in detecting lines that have not recovered. A
current ‘snapshot’ of existing seismic lines underestimates
those that have recovered. Studies need to start with an
unbiased set of seismic lines and track their development
through time. Quantitative studies on the ability of seismic
lines to recover in tundra and steppe ecosystems are not
promising (Felix et al., 1992; Marcela and Martin, 2003).
Other systems such as coastal vegetation communities on
the Gulf of Mexico appear to suffer no long-term effects
(Drawe and Ortega, 1996).
In one of the few studies to examine tree regeneration
along seismic lines in Alberta, Revel et al. (1984) found that
23 out of 35 seismic lines in the foothills of the Rocky
Mountains had sapling densities of lodgepole pine (Pinus
contorta), white spruce (Picea glauca, black spruce (Picea
mariana), and occasionally balsam fir (Abies lasiocarpa) in
excess of Alberta’s timber regeneration standards. How-
ever, there was a significant time lag in achieving these
densities (10–30 years) and the height of trees was
significantly shorter than those in regenerating trees
typically found after harvest. MacFarlane (2003) found no
significant differences in the understory vegetation of
seismic lines aged from less than 14 years to greater than
23 years in trembling aspen (Populus tremuloides) forests of
the northeastern Alberta. However, all vegetation commu-
nities from all ages of seismic lines were different from
interior forest communities. Online communities were
unique because they included light tolerant, disturbance
associated species. Both studies were intensive, plot-based
examinations of relatively few sites. If recovery and
transition rates are relatively low, an intensive plot-based
technique will lack sufficient sample sizes to confidently
estimate rates. Furthermore, the widespread nature of oil
and gas exploration requires sampling over a broad area to
obtain a representative sample of the population of seismic
lines. The question of what the broad, long-term patterns of
recovery and potential transition to other forms of industrial
development for seismic lines remains unexplored.
This paper reports on the fate of the wider seismic lines
established during this early phase of oil and gas exploration
in western Canada. In order to examine this question, we
surveyed an extensive sample of seismic lines from the time
they were established to when they recovered to woody
vegetation or developed into another anthropogenic feature.
Specifically, we assessed the transition of a cohort of
seismic lines from 1960 and 1970s cut through three forest
types in northeastern Alberta. These included: trembling
aspen, white spruce, and lowland black spruce. By
examining a chronosequence of aerial photos, we backdated
the seismic lines to their establishment and followed them
forward to 2002–2003.
2. Materials and methods
2.1. Study area
The study area was bordered by 110 and 1148 west
longitude (3rd and 4th west meridians) and 55 and 588 north
latitude (Fig. 1). The area is classified as the Boreal Plains
ecozone (Environment Canada, 2001) or Boreal ecoregion
(Alberta Environmental Protection, 1994). The Alberta
classification further subdivides the ecoregion into Central
Mixedwood (O80%), Boreal Highlands (15%), and
Subarctic (!5%) subregions. Over these subregions,
median winter temperatures range from K7.7 to
K18.0 8C with median summer temperatures ranging
from 9.5 to 13.5 8C. The overall mean precipitation is 240
and 64 mm in the summer and winter, respectively. Our
study focused on the Central Mixedwood and Boreal
Highlands. No seismic lines were examined from the
Subarctic. Boreal Highlands have slightly more precipi-
tation and cooler temperatures than the Central Mixed-
woods. Typical tree species in these areas include;
trembling aspen, (P. tremuloides Michx.), jack pine (Pinus
banksiana Lamb.), black spruce (Picea mariana (Mill.)
B.S.P.), white spruce (P. glauca (Moench) Voss), and
tamarack (Larix laricina (Du Roi) K. Koch). Minor species
include: balsam poplar (Populus balsamifera L.), paper
birch (Betula papyrifera Marsh.), and balsam fir (Abies
balsamea (L.) Mill).
Aspen forests are the dominant upland forest type
regenerating after stand-replacing or large gap disturbances
such as wildfire or large wind events (reviewed in Peterson
and Peterson, 1992). Aspen primarily regenerates by
suckering to very high stem densities. Densities of
100,000–200,000 stems per ha are not uncommon after
disturbances. Self-thinning reduces densities to 800–1500
stems per ha by 80 years after disturbance. Some aspen
stands with nearby seed sources develop a white spruce
subcanopy that can eventually replace or supplement
the overstory layer and create a mixedwood canopy.
These stands can eventually give way to a full white spruce
overstory with the eventual loss of aspen. Despite this
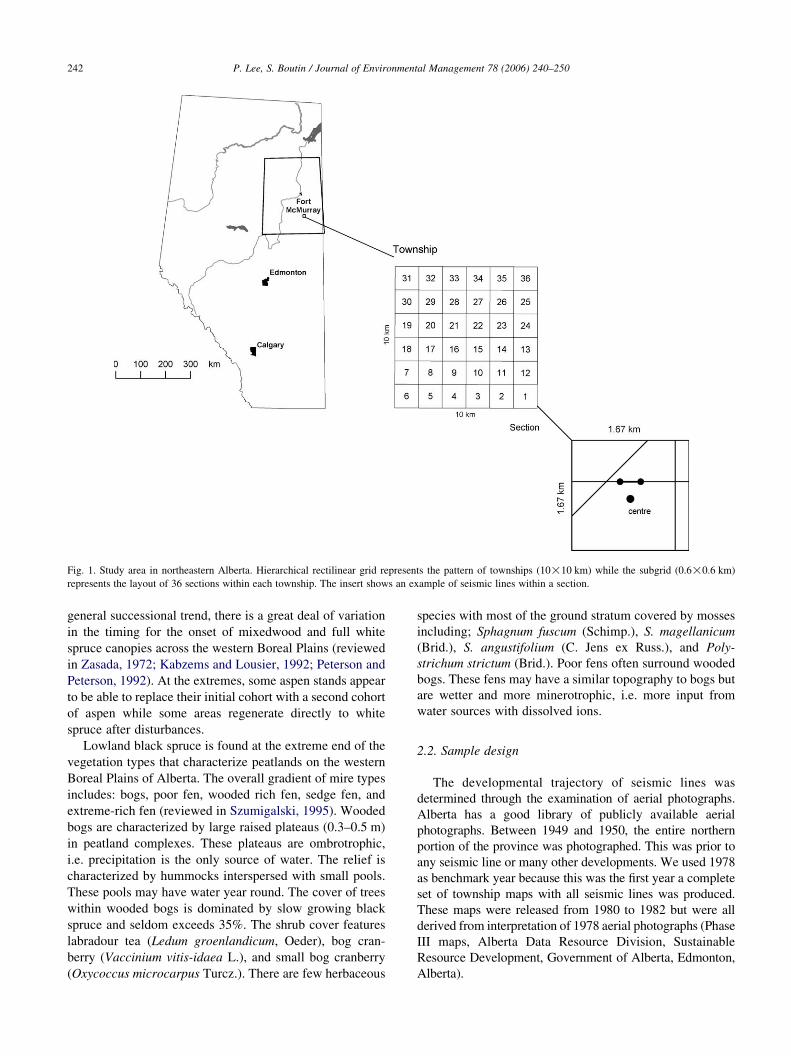
Fig. 1. Study area in northeastern Alberta. Hierarchical rectilinear grid represents the pattern of townships (10!10 km) while the subgrid (0.6!0.6 km)
represents the layout of 36 sections within each township. The insert shows an example of seismic lines within a section.
P. Lee, S. Boutin / Journal of Environmental Management 78 (2006) 240–250242
general successional trend, there is a great deal of variation
in the timing for the onset of mixedwood and full white
spruce canopies across the western Boreal Plains (reviewed
in Zasada, 1972; Kabzems and Lousier, 1992; Peterson and
Peterson, 1992). At the extremes, some aspen stands appear
to be able to replace their initial cohort with a second cohort
of aspen while some areas regenerate directly to white
spruce after disturbances.
Lowland black spruce is found at the extreme end of the
vegetation types that characterize peatlands on the western
Boreal Plains of Alberta. The overall gradient of mire types
includes: bogs, poor fen, wooded rich fen, sedge fen, and
extreme-rich fen (reviewed in Szumigalski, 1995). Wooded
bogs are characterized by large raised plateaus (0.3–0.5 m)
in peatland complexes. These plateaus are ombrotrophic,
i.e. precipitation is the only source of water. The relief is
characterized by hummocks interspersed with small pools.
These pools may have water year round. The cover of trees
within wooded bogs is dominated by slow growing black
spruce and seldom exceeds 35%. The shrub cover features
labradour tea (Ledum groenlandicum, Oeder), bog cran-
berry (Vaccinium vitis-idaea L.), and small bog cranberry
(Oxycoccus microcarpus Turcz.). There are few herbaceous
species with most of the ground stratum covered by mosses
including; Sphagnum fuscum (Schimp.), S. magellanicum
(Brid.), S. angustifolium (C. Jens ex Russ.), and Poly-
strichum strictum (Brid.). Poor fens often surround wooded
bogs. These fens may have a similar topography to bogs but
are wetter and more minerotrophic, i.e. more input from
water sources with dissolved ions.
2.2. Sample design
The developmental trajectory of seismic lines was
determined through the examination of aerial photographs.
Alberta has a good library of publicly available aerial
photographs. Between 1949 and 1950, the entire northern
portion of the province was photographed. This was prior to
any seismic line or many other developments. We used 1978
as benchmark year because this was the first year a complete
set of township maps with all seismic lines was produced.
These maps were released from 1980 to 1982 but were all
derived from interpretation of 1978 aerial photographs (Phase
III maps, Alberta Data Resource Division, Sustainable
Resource Development, Government of Alberta, Edmonton,
Alberta).
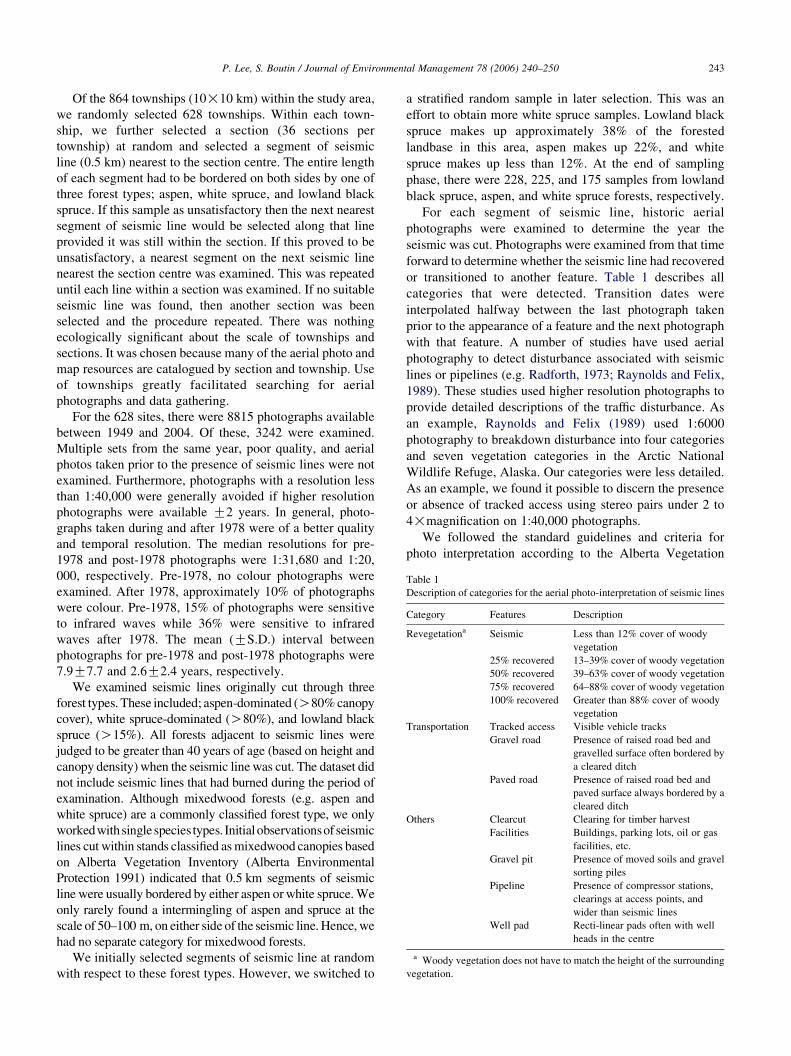
Table 1
Description of categories for the aerial photo-interpretation of seismic lines
Category Features Description
Revegetationa Seismic Less than 12% cover of woody
vegetation
25% recovered 13–39% cover of woody vegetation
50% recovered 39–63% cover of woody vegetation
75% recovered 64–88% cover of woody vegetation
100% recovered Greater than 88% cover of woody
vegetation
Transportation Tracked access Visible vehicle tracks
Gravel road Presence of raised road bed and
gravelled surface often bordered by
a cleared ditch
Paved road Presence of raised road bed and
paved surface always bordered by a
cleared ditch
Others Clearcut Clearing for timber harvest
Facilities Buildings, parking lots, oil or gas
facilities, etc.
Gravel pit Presence of moved soils and gravel
sorting piles
Pipeline Presence of compressor stations,
clearings at access points, and
wider than seismic lines
Well pad Recti-linear pads often with well
heads in the centre
a Woody vegetation does not have to match the height of the surrounding
vegetation.
P. Lee, S. Boutin / Journal of Environmental Management 78 (2006) 240–250 243
Of the 864 townships (10!10 km) within the study area,
we randomly selected 628 townships. Within each town-
ship, we further selected a section (36 sections per
township) at random and selected a segment of seismic
line (0.5 km) nearest to the section centre. The entire length
of each segment had to be bordered on both sides by one of
three forest types; aspen, white spruce, and lowland black
spruce. If this sample as unsatisfactory then the next nearest
segment of seismic line would be selected along that line
provided it was still within the section. If this proved to be
unsatisfactory, a nearest segment on the next seismic line
nearest the section centre was examined. This was repeated
until each line within a section was examined. If no suitable
seismic line was found, then another section was been
selected and the procedure repeated. There was nothing
ecologically significant about the scale of townships and
sections. It was chosen because many of the aerial photo and
map resources are catalogued by section and township. Use
of townships greatly facilitated searching for aerial
photographs and data gathering.
For the 628 sites, there were 8815 photographs available
between 1949 and 2004. Of these, 3242 were examined.
Multiple sets from the same year, poor quality, and aerial
photos taken prior to the presence of seismic lines were not
examined. Furthermore, photographs with a resolution less
than 1:40,000 were generally avoided if higher resolution
photographs were available G2 years. In general, photo-
graphs taken during and after 1978 were of a better quality
and temporal resolution. The median resolutions for pre-
1978 and post-1978 photographs were 1:31,680 and 1:20,
000, respectively. Pre-1978, no colour photographs were
examined. After 1978, approximately 10% of photographs
were colour. Pre-1978, 15% of photographs were sensitive
to infrared waves while 36% were sensitive to infrared
waves after 1978. The mean (GS.D.) interval between
photographs for pre-1978 and post-1978 photographs were
7.9G7.7 and 2.6G2.4 years, respectively.
We examined seismic lines originally cut through three
forest types. These included; aspen-dominated (O80% canopy
cover), white spruce-dominated (O80%), and lowland black
spruce (O15%). All forests adjacent to seismic lines were
judged to be greater than 40 years of age (based on height and
canopy density) when the seismic line was cut. The dataset did
not include seismic lines that had burned during the period of
examination. Although mixedwood forests (e.g. aspen and
white spruce) are a commonly classified forest type, we only
workedwithsinglespecies types. Initialobservationsofseismic
lines cut within stands classified as mixedwood canopies based
on Alberta Vegetation Inventory (Alberta Environmental
Protection 1991) indicated that 0.5 km segments of seismic
line were usually bordered by either aspen or white spruce. We
only rarely found a intermingling of aspen and spruce at the
scale of 50–100 m, on either side of the seismic line. Hence, we
had no separate category for mixedwood forests.
We initially selected segments of seismic line at random
with respect to these forest types. However, we switched to
a stratified random sample in later selection. This was an
effort to obtain more white spruce samples. Lowland black
spruce makes up approximately 38% of the forested
landbase in this area, aspen makes up 22%, and white
spruce makes up less than 12%. At the end of sampling
phase, there were 228, 225, and 175 samples from lowland
black spruce, aspen, and white spruce forests, respectively.
For each segment of seismic line, historic aerial
photographs were examined to determine the year the
seismic was cut. Photographs were examined from that time
forward to determine whether the seismic line had recovered
or transitioned to another feature. Table 1 describes all
categories that were detected. Transition dates were
interpolated halfway between the last photograph taken
prior to the appearance of a feature and the next photograph
with that feature. A number of studies have used aerial
photography to detect disturbance associated with seismic
lines or pipelines (e.g. Radforth, 1973; Raynolds and Felix,
1989). These studies used higher resolution photographs to
provide detailed descriptions of the traffic disturbance. As
an example, Raynolds and Felix (1989) used 1:6000
photography to breakdown disturbance into four categories
and seven vegetation categories in the Arctic National
Wildlife Refuge, Alaska. Our categories were less detailed.
As an example, we found it possible to discern the presence
or absence of tracked access using stereo pairs under 2 to
4!magnification on 1:40,000 photographs.
We followed the standard guidelines and criteria for
photo interpretation according to the Alberta Vegetation
P. Lee, S. Boutin / Journal of Environmental Management 78 (2006) 240–250244
Inventory (Alberta Environmental Protection, 1991). This
interpretation system is the standard method for the
inventory of forested lands in Alberta. Recovery was
based on the return of woody vegetation detectable on
aerial photography. Woody vegetation was readily dis-
tinguishable from grasses and herbs. It was not possible to
distinguish tall shrubs from trees (except conifers) within
the same canopy strata nor can we measure stem density or
stem height with accuracy. Hence, our measurement of
recovery is not to timber regeneration standards. However,
the return of a woody vegetation triggers a significant
ecological recovery of biotic communities after timber
removal (reviewed in Song, 2002). We categorized woody
vegetation in 5 cover classes (Table 1) based on relative
cover of the line to the surrounding forest.
Time (years)
0 5 10 15 20 25 30 35
Pro
port
ion
0.00
0.05
0.10
0.15
0.20
0.250.60
0.70
0.80
0.90
1.00
SeismicWoody vegetationRoadsTracked accessOther industrial
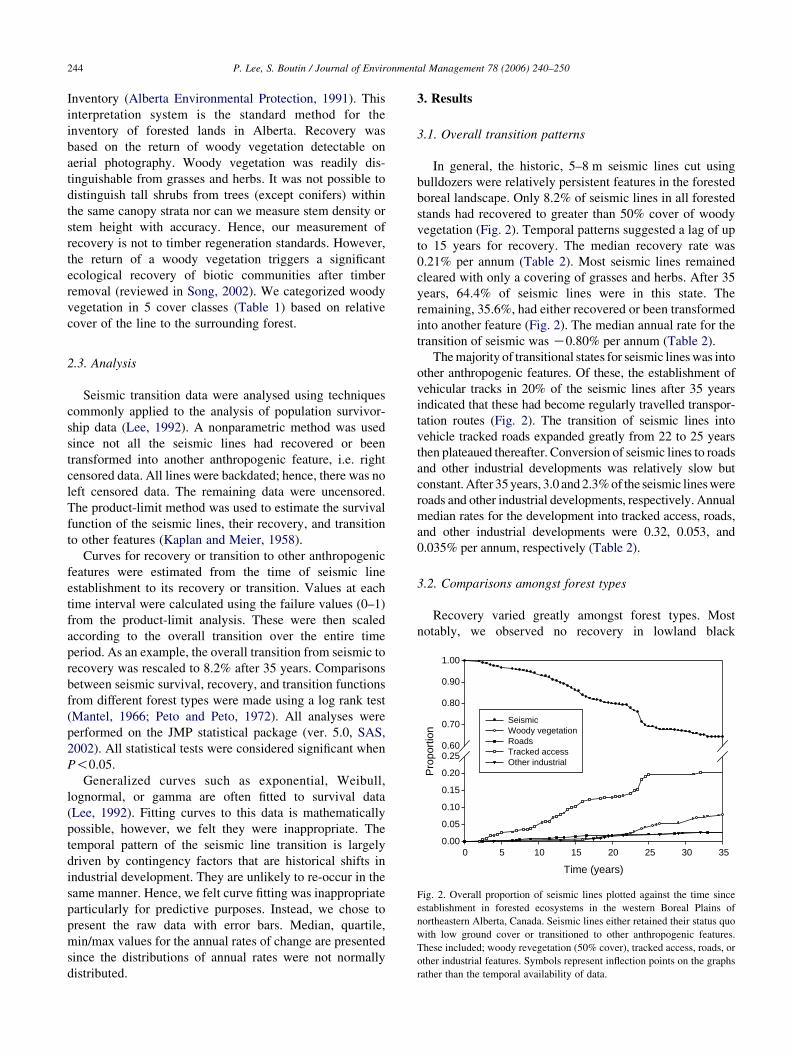
Fig. 2. Overall proportion of seismic lines plotted against the time since
establishment in forested ecosystems in the western Boreal Plains of
northeastern Alberta, Canada. Seismic lines either retained their status quo
with low ground cover or transitioned to other anthropogenic features.
These included; woody revegetation (50% cover), tracked access, roads, or
other industrial features. Symbols represent inflection points on the graphs
rather than the temporal availability of data.
2.3. Analysis
Seismic transition data were analysed using techniques
commonly applied to the analysis of population survivor-
ship data (Lee, 1992). A nonparametric method was used
since not all the seismic lines had recovered or been
transformed into another anthropogenic feature, i.e. right
censored data. All lines were backdated; hence, there was no
left censored data. The remaining data were uncensored.
The product-limit method was used to estimate the survival
function of the seismic lines, their recovery, and transition
to other features (Kaplan and Meier, 1958).
Curves for recovery or transition to other anthropogenic
features were estimated from the time of seismic line
establishment to its recovery or transition. Values at each
time interval were calculated using the failure values (0–1)
from the product-limit analysis. These were then scaled
according to the overall transition over the entire time
period. As an example, the overall transition from seismic to
recovery was rescaled to 8.2% after 35 years. Comparisons
between seismic survival, recovery, and transition functions
from different forest types were made using a log rank test
(Mantel, 1966; Peto and Peto, 1972). All analyses were
performed on the JMP statistical package (ver. 5.0, SAS,
2002). All statistical tests were considered significant when
P!0.05.
Generalized curves such as exponential, Weibull,
lognormal, or gamma are often fitted to survival data
(Lee, 1992). Fitting curves to this data is mathematically
possible, however, we felt they were inappropriate. The
temporal pattern of the seismic line transition is largely
driven by contingency factors that are historical shifts in
industrial development. They are unlikely to re-occur in the
same manner. Hence, we felt curve fitting was inappropriate
particularly for predictive purposes. Instead, we chose to
present the raw data with error bars. Median, quartile,
min/max values for the annual rates of change are presented
since the distributions of annual rates were not normally
distributed.
3. Results
3.1. Overall transition patterns
In general, the historic, 5–8 m seismic lines cut using
bulldozers were relatively persistent features in the forested
boreal landscape. Only 8.2% of seismic lines in all forested
stands had recovered to greater than 50% cover of woody
vegetation (Fig. 2). Temporal patterns suggested a lag of up
to 15 years for recovery. The median recovery rate was
0.21% per annum (Table 2). Most seismic lines remained
cleared with only a covering of grasses and herbs. After 35
years, 64.4% of seismic lines were in this state. The
remaining, 35.6%, had either recovered or been transformed
into another feature (Fig. 2). The median annual rate for the
transition of seismic was K0.80% per annum (Table 2).
The majority of transitional states for seismic lines was into
other anthropogenic features. Of these, the establishment of
vehicular tracks in 20% of the seismic lines after 35 years
indicated that these had become regularly travelled transpor-
tation routes (Fig. 2). The transition of seismic lines into
vehicle tracked roads expanded greatly from 22 to 25 years
then plateaued thereafter. Conversion of seismic lines to roads
and other industrial developments was relatively slow but
constant. After 35 years, 3.0 and 2.3% of the seismic lines were
roads and other industrial developments, respectively. Annual
median rates for the development into tracked access, roads,
and other industrial developments were 0.32, 0.053, and
0.035% per annum, respectively (Table 2).
3.2. Comparisons amongst forest types
Recovery varied greatly amongst forest types. Most
notably, we observed no recovery in lowland black
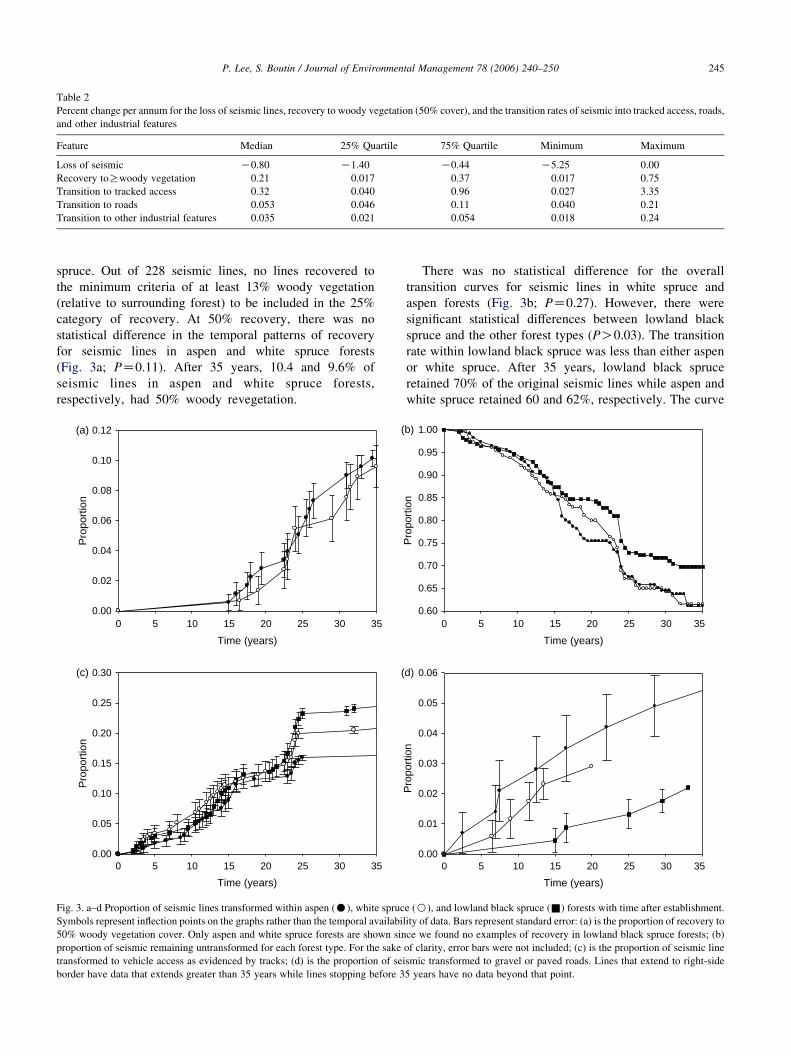
Table 2
Percent change per annum for the loss of seismic lines, recovery to woody vegetation (50% cover), and the transition rates of seismic into tracked access, roads,
and other industrial features
Feature Median 25% Quartile 75% Quartile Minimum Maximum
Loss of seismic K0.80 K1.40 K0.44 K5.25 0.00
Recovery toRwoody vegetation 0.21 0.017 0.37 0.017 0.75
Transition to tracked access 0.32 0.040 0.96 0.027 3.35
Transition to roads 0.053 0.046 0.11 0.040 0.21
Transition to other industrial features 0.035 0.021 0.054 0.018 0.24
P. Lee, S. Boutin / Journal of Environmental Management 78 (2006) 240–250 245
spruce. Out of 228 seismic lines, no lines recovered to
the minimum criteria of at least 13% woody vegetation
(relative to surrounding forest) to be included in the 25%
category of recovery. At 50% recovery, there was no
statistical difference in the temporal patterns of recovery
for seismic lines in aspen and white spruce forests
(Fig. 3a; PZ0.11). After 35 years, 10.4 and 9.6% of
seismic lines in aspen and white spruce forests,
respectively, had 50% woody revegetation.
Time (years)
0 5 10 15 20 25 30 35
Pro
port
ion
0.00
0.02
0.04
0.06
0.08
0.10
0.12(a)
(
Time (years)
0 5 10 15 20 25 30 35
Pro
port
ion
0.00
0.05
0.10
0.15
0.20
0.25
0.30(c)
(
Fig. 3. a–d Proportion of seismic lines transformed within aspen (C), white spruc
Symbols represent inflection points on the graphs rather than the temporal availabil
50% woody vegetation cover. Only aspen and white spruce forests are shown sin
proportion of seismic remaining untransformed for each forest type. For the sake
transformed to vehicle access as evidenced by tracks; (d) is the proportion of sei
border have data that extends greater than 35 years while lines stopping before 3
There was no statistical difference for the overall
transition curves for seismic lines in white spruce and
aspen forests (Fig. 3b; PZ0.27). However, there were
significant statistical differences between lowland black
spruce and the other forest types (PO0.03). The transition
rate within lowland black spruce was less than either aspen
or white spruce. After 35 years, lowland black spruce
retained 70% of the original seismic lines while aspen and
white spruce retained 60 and 62%, respectively. The curve
Time (years)
0 5 10 15 20 25 30 35
Pro
port
ion
0.00
0.01
0.02
0.03
0.04
0.05
0.06d)
Time (years)
0 5 10 15 20 25 30 35
Pro
port
ion
0.60
0.65
0.70
0.75
0.80
0.85
0.90
0.95
1.00b)
e (B), and lowland black spruce (&) forests with time after establishment.
ity of data. Bars represent standard error: (a) is the proportion of recovery to
ce we found no examples of recovery in lowland black spruce forests; (b)
of clarity, error bars were not included; (c) is the proportion of seismic line
smic transformed to gravel or paved roads. Lines that extend to right-side
5 years have no data beyond that point.
P. Lee, S. Boutin / Journal of Environmental Management 78 (2006) 240–250246
for lowland black spruce diverged from the other two forest
types after 15 years.
There were sufficient sample sizes to compare transition
to tracked access and roads amongst forest types. The
transition of seismic lines to tracked vehicular access did not
significantly differ amongst forest types for the entire 35
year period (PZ0.29; Fig. 3c). However, the amount of
tracked access at the end of 35 years was different. The
amount of tracked access was 24, 21, and 16% for lowland
black spruce, white spruce, and aspen, respectively.
Standard error bars indicated that these differences were
significant (Fig. 3c; P!0.05). Despite the relatively small
sample sizes (NZ20), the number of seismic lines that
developed into roads did exhibit some differences amongst
forest types (Fig. 3d). Overall temporal trends were not
significantly different between aspen and white spruce
forests (PZ0.25) while both were significantly greater than
lowland black spruce (P!0.03). There were insufficient
samples to compare the transition to other industrial features
amongst forest types.
3.3. Levels of recovery
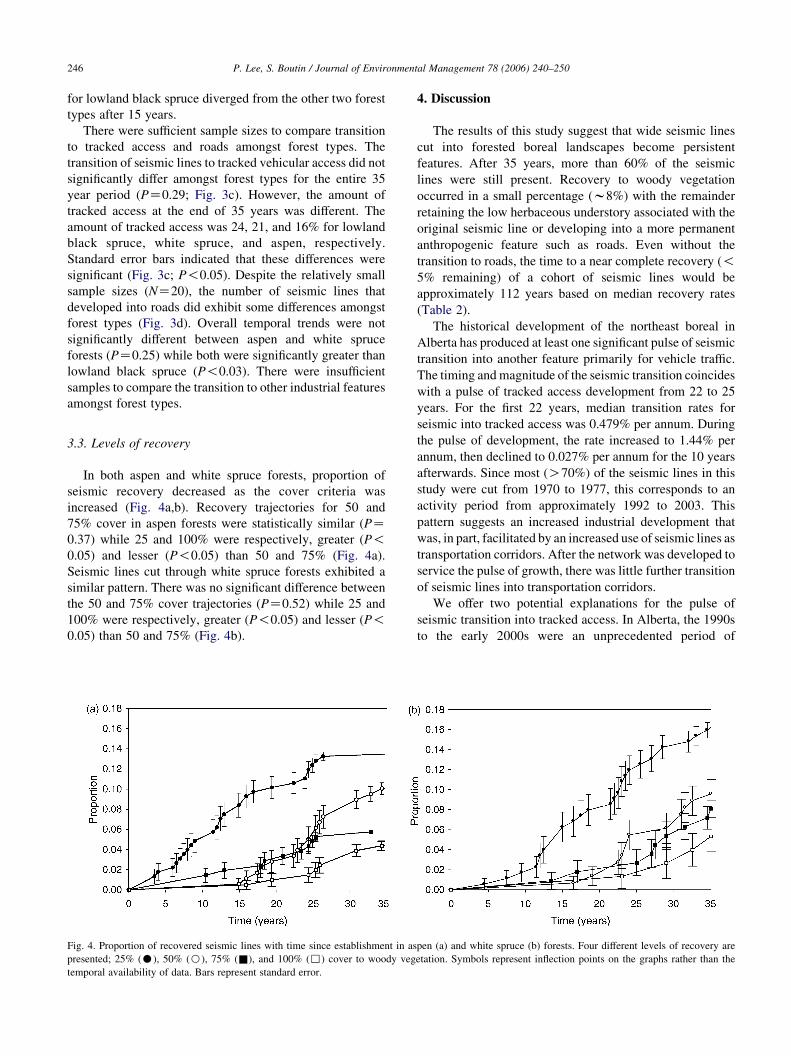
In both aspen and white spruce forests, proportion of
seismic recovery decreased as the cover criteria was
increased (Fig. 4a,b). Recovery trajectories for 50 and
75% cover in aspen forests were statistically similar (PZ0.37) while 25 and 100% were respectively, greater (P!0.05) and lesser (P!0.05) than 50 and 75% (Fig. 4a).
Seismic lines cut through white spruce forests exhibited a
similar pattern. There was no significant difference between
the 50 and 75% cover trajectories (PZ0.52) while 25 and
100% were respectively, greater (P!0.05) and lesser (P!0.05) than 50 and 75% (Fig. 4b).
Fig. 4. Proportion of recovered seismic lines with time since establishment in as
presented; 25% (C), 50% (B), 75% (&), and 100% (,) cover to woody veg
temporal availability of data. Bars represent standard error.
4. Discussion
The results of this study suggest that wide seismic lines
cut into forested boreal landscapes become persistent
features. After 35 years, more than 60% of the seismic
lines were still present. Recovery to woody vegetation
occurred in a small percentage (w8%) with the remainder
retaining the low herbaceous understory associated with the
original seismic line or developing into a more permanent
anthropogenic feature such as roads. Even without the
transition to roads, the time to a near complete recovery (!5% remaining) of a cohort of seismic lines would be
approximately 112 years based on median recovery rates
(Table 2).
The historical development of the northeast boreal in
Alberta has produced at least one significant pulse of seismic
transition into another feature primarily for vehicle traffic.
The timing and magnitude of the seismic transition coincides
with a pulse of tracked access development from 22 to 25
years. For the first 22 years, median transition rates for
seismic into tracked access was 0.479% per annum. During
the pulse of development, the rate increased to 1.44% per
annum, then declined to 0.027% per annum for the 10 years
afterwards. Since most (O70%) of the seismic lines in this
study were cut from 1970 to 1977, this corresponds to an
activity period from approximately 1992 to 2003. This
pattern suggests an increased industrial development that
was, in part, facilitated by an increased use of seismic lines as
transportation corridors. After the network was developed to
service the pulse of growth, there was little further transition
of seismic lines into transportation corridors.
We offer two potential explanations for the pulse of
seismic transition into tracked access. In Alberta, the 1990s
to the early 2000s were an unprecedented period of
pen (a) and white spruce (b) forests. Four different levels of recovery are
etation. Symbols represent inflection points on the graphs rather than the
P. Lee, S. Boutin / Journal of Environmental Management 78 (2006) 240–250 247
industrial development in northeastern Alberta. The total
volume of timber harvested in Alberta doubled from
approximately 9 million m3 in 1990 to 20 million m3 in
1999 as a consequence of new allocations of deciduous and
mixedwood forests (Stelfox and Wynes, 1999). Within our
study area, the world’s largest single line pulp mill was built
in 1992 and granted a tenure of 6 million ha (Alberta Pacific
Forest Industries, 2001). The land tenure for this single mill
represents 88% of the study area. The increased timber
activity required access into forested areas for activities
such as research, inventory, harvest, and extraction. Access
continued after harvest for the monitoring of regeneration
and silvicultural treatments.
Aside from forestry, the oil and gas sectors greatly
increased in the mid 1990s. This was largely spurred by the
recovery and increase in oil and natural gas prices. From
1990 to 2000, the cumulative number of oil and gas wells
has nearly doubled from approximately 88,000 to 160,000
wells (Canadian Association of Petroleum Producers,
2000). A similar increase in the price of oil and changes
to oil and gas exploration license structure gave rise to a
pulse of seismic activity in the 1970s.
Lastly, improvements to off-road vehicles has made
travel on seismic lines much easier. In particular, the
increased use and availability of four-wheel drive trucks,
sports utility vehicles, and all terrain vehicles has facilitated
the transition of seismic lines into a transportation network.
Like elsewhere in North America, the use of both four wheel
drive trucks and off-road vehicles by industry and
recreational users has greatly increased. From 1990 to
2001, purchases of new trucks in Alberta increased 84%
(estimates derived from Statistics Canada, 1990, 2003). In
contrast, the population increased by 17% over the same
period (Statistics Canada, 2004). Over a period of 1997–
2001, the sales of smaller, all terrain vehicles tripled
(reported in Lai, 2004).
The large proportion of recleared seismic lines reflects
their high re-use. Oil and gas exploration and extraction
agreements encourage the development of new lines and re-
use of existing lines. Since 1976, license (exploration) and
lease (extraction) agreements have specifically applied to
mineral rights at a particular depth and above. They do not
apply to layers below the explored or extraction layer. These
changes were originally brought in to spur drilling and
prevent ‘sterilization’ of the deeper deposits by licenses and
leases applied to shallower layers. These changes had their
desired effect in that much of the seismic lines used in this
study and mapped in Phase III maps were the result of
increased exploration activity. A point worth noting is that
when seismic lines are re-used they are generally cleared
back to the original width.
Currently, licenses require the establishment of explora-
tory drilling within four years or the tenure reverts back to
the government (Alberta Energy Utilities Board, 2002). A
combination of changes in market forces and prices,
strategic company positioning, bet-hedging strategies, and
unproductive wells cause many of the licenses to revert back
to the government. One estimate suggests that 75% of
licenses have reverted back to the government (Alberta
Energy Utilities Board, 2002). If a license reverts back to
the government, they can turnaround and resell the license.
Changes in markets and prices, differences in corporate
strategies, and financial resources may prompt other
companies to purchase the license and attempt to develop
it. Also, the licenses represent a commodity. Companies that
hold undeveloped licenses maintain an asset. The relatively
frequent transfer of licenses adds to the likelihood that
seismic lines will be recleared. Companies may attempt to
re-explore part or the whole seismic grid to more favourably
place well sites. They may also use seismic lines to access
other leases they hold. Furthermore, seismic data is
proprietary information and companies may not divulge
previous data to new license holders. This may necessitate
new, additional seismic programs. The overall result is that
the recovery of seismic lines is often determined by spatially
and temporally dynamic forces that are neither predictable
nor consistently applied.
This study was not designed to determine specific
mechanisms for the lack of recovery, these have been the
subject of a number of other studies. However, the results of
these studies can provide insights in the patterns exhibited in
ours. Recovery back to aspen forests is hampered by the
apical dominance from surrounding, taller, clones in the
adjacent forest. In order to overcome this dominance,
elevated light levels with the resultant increases in soil
temperature are required to stimulate suckering of aspen
roots within the seismic lines. Light levels are greater on the
edges of seismic lines resulting in greater aspen suckering
than in the adjacent, closed forest (MacFarlane, 2003).
However, sucker densities were less than in open clearcuts.
This maybe due to the shading created within 5–8 m wide
seismic lines for at least part of the day. Light intensities of
even half of full sunlight are sufficient to reduce the
suckering to 10% of full sunlight. Temperatures greater than
15 8C are required for the initiation of suckering (Maini,
1966; Maini and Horton, 1966). Groot et al. (1997) found
the % radiation on 9 m strip cuts similar to seismic lines
varied from 40% of open areas at 2 m from the southern
forested edge to 70% on the northern edge. The mean daily
maximum taken between July 20 and August 2, in strips cuts
was 14.6 and 13.8 8C respectively (northern Ontario,
Canada, 47843 0N, 83811 0W). As a result, aspen stem
densities within 9 m strip cuts was 66% less than in
clearcuts but the height of stems was similar to those in
clearcuts (Groot et al., 1997). Development of fine roots that
are critical for the uptake of water and soil nutrients was
reduced in temperatures lower than 6 8C resulting in the
impairment of growth and productivity (Landhausser and
Lieffers, 1998; Wan et al., 1999).
Unlike aspen, white spruce regenerates from seed. Revel
et al. (1984) found that establishment of saplings in 23 of 35
test plots exceeded forestry stocking standards but that
P. Lee, S. Boutin / Journal of Environmental Management 78 (2006) 240–250248
growth was slow with most saplings less than 2 m tall after
10 or more years. Densities of saplings were negatively
correlated to the presence of grasses and low herbaceous
understory. These were argued to be competitors. The
exception was at the intersection of seismic lines. They
suggested that the larger cleared area allowed a greater total
amount of sunlight throughout the day. This facilitated
higher growth rates in saplings. Other instances of poor
stocking and overall lower vegetation cover were attributed
to a combination of physical damage by the tires or tracks of
vehicles, soil compaction, water channelization and the
subsequent erosion of soils on and adjacent to the line.
For lowland black spruce, all seismic lines were clearly
visible after 35 years and longer in some of the older
samples. A greater number of samples may have yielded
some natural recovery but it would have been at a rate less
than 0.4% (!1/228) over 35 years. A review of the
literature yielded no studies on the mechanisms that prevent
regeneration of black spruce on seismic lines. We can only
draw on findings from other similar ecosystems and
speculate on the mechanisms from casual observations.
One possible mechanism is the loss of hummocks on cleared
seismic lines. The use of bulldozers and other clearing
equipment removes the vegetation but more importantly it
removes the hummocks and flattens the terrain. The loss of
the hummocks greatly reduces the number of sites for
seedling establishment of black spruce. Furthermore,
flattening of the terrain and the compaction created by
tracks alters the local hydrology and converts what had been
a bog to a wetter poor fen dominated by sedges. Vehicle
tracks often fill with water year round (personal obser-
vation). A similar transition from a shrub-dominated
community to a sedge community was found on seismic
lines subject to winter traffic in moist tundra and dryas
terraces in Arctic Wildlife Refuge in northeastern Alaska
(Felix et al., 1992). They found very little resistance to
vehicular traffic and that after 4–5 years there was very little
recovery of the vegetation. Like our study, they found a
conversion from a drier woody stem community to a wetter
sedge-dominated community.
4.1. Future management directions
Barring a wholesale decrease in the industrial develop-
ment of the western Boreal Plains, it seems the recovery of
seismic lines will be best facilitated by a multifaceted
approach involving some seismic line closure and natural or
recovery through silviculture, and replacement with no or
very narrow lines. The results of this study offer some
insights into these management directions. Furthermore, the
study points out the critical areas for research as we begin to
trade-off different elements such as the pre-emptive
development of a roaded transportation network versus its
ad hoc development through the use of existing seismic
lines.
1. Closure and recovery of seismic lines—After a period of
non-use, seismic lines should be actively closed to
further use. We can take advantage of the period of
inactivity to identify lines with a low probability of re-
use and target their closure to further access. Access
closure can be done through a number of methods such
as laying trees across access points, gates, and soil and
debris berms. If seismic lines become active as
transportation routes then those segments maybe further
developed into the road network. In order to facilitate all
these activities, there needs to be an active tracking and
reclamation goals for seismic lines.
2. Application of silvicultural treatments—Given the
large area of open seismic, ground preparation and
planting of trees is likely to be an expensive
proposition and may only be feasible in cases of
critical wildlife habitat for endangered species such as
woodland caribou or other areas where the control of
access is critical. One unexplored possibility is the
rescheduling of timber harvest into areas adjacent of
seismic lines. Silviculture can be done at the same time
as the harvest areas. For lines through aspen forests, it
would alleviate the problems with apical dominance
while producing more favourable physical conditions
for clonal regeneration. For lines through spruce
forests, seismic lines could be replanted along with
the rest of the cutblock.
3. Development of a road network—The utility of this
strategy depends upon whether a road network at
lower linear density than the existing seismic lines
has less ecological impact than the ad hoc use of
seismic lines. If seismic lines fall into a consistent
usage pattern then they may be further developed into
roads. However, it is unlikely that this pattern is very
efficient. Most seismic lines were cut along ordinal or
subordinal compass directions. Tracked access winds
its way along several linear segments usually
avoiding wet or steep terrain. Along with the road
network, there should be a harmonizing of all linear
corridors including pipelines, electrical transmission
lines, and railways. A planned road network would
have to efficiently replace the current ad hoc network
patterns while facilitating orderly development of a
region.
4. Re-use of seismic lines—The re-use of seismic lines
prevents the cutting of new lines, hence, should be
encouraged. Nonetheless, the switch to minimal or
very narrow seismic lines will mean that even re-used
wide seismic lines will eventually have to be closed.
A priority list should be established for their closing
and recovery. We suggest that the currently recovered
lines, i.e. those supporting woody vegetation, would
be the easiest to close. Then lines not being used in a
current license or lease would be next. As lines are
closed, they are not reopened with wide clearances. In
this manner, the current backlog of wide seismic is
P. Lee, S. Boutin / Journal of Environmental Management 78 (2006) 240–250 249
constantly ‘ratcheted’ to a recovered state or to
minimal or very narrow seismic.
5. Activity in lowland black spruce—Given that we
found no recovery in lowland black spruce, we would
question whether it is appropriate to continue a
practice of using seismic lines that leave any footprint
in lowland black spruce and perhaps all peatlands.
Minimal footprint methods such as heliportable should
be used in all peatlands. Furthermore, lowland black
spruce may require remediation to facilitate recovery.
The large backlog of seismic lines in peatlands would
suggest that remediation methods would have to be
cost effective and work in concert with natural
patterns of vegetation recovery. Lowland black spruce
and perhaps all peatlands should receive priority in the
phasing out of wide seismic lines. Even the
disturbance created by narrower but more frequently
spaced lines for three-dimensional seismic exploration
needs to be carefully evaluated.
5. Conclusions
The current backlog of wide (5–8 m) seismic lines is a
persistent feature on the boreal landscape of Alberta. Lines
cut into aspen and white spruce forests recover at relatively
slow rates to a cover of woody vegetation. Lines cut into
lowland black spruce have yet to significantly recover to
woody vegetation even after 35 years. In part, the high level
of re-use and conversion to tracked access prevents many
lines from recovering. To avoid compounding the impact of
the wide seismic lines with other new anthropogenic
developments, i.e. cumulative effects, a concerted effort
should be made to recover or transition the old seismic lines
to minimal or very narrow seismic. This is probably best
expedited through a mixed strategy utilizing: closing and
recovery of wide seismic no longer used for exploration,
remediation of seismic lines in critical habitats, and
development of an efficient road and linear corridor
network. Given the lack of recovery in lowland black
spruce, these areas should receive priority in the recovery of
seismic lines and application of minimal footprint seismic
lines.
Acknowledgements
We would like to thank C. Gray, A. Krowski, and M.
Lankau for technical support on this project. We acknowl-
edge a critical review of this paper by J. Doubt and the
comments from the editor and four anonymous reviewers.
All have greatly improved the manuscript. This research
was supported by Natural Sciences and Engineering and
Research Council-Alberta Chamber of Resources Integrated
Landscape Management Chair to S. Boutin.
References
Alberta Energy Utilities Board, 2002. Alberta’s Oil and Gas Tenure.
Energy Utilities Board Information Services, Calgary, Alberta 2002.
Alberta Environmental Protection, 1991. Alberta Vegetation Inventory
Standards Manual. Version 2.1. Data Acquisition Branch, Resource
Data Division, Alberta Environmental Protection. Edmonton, Alberta,
Canada.
Alberta Environmental Protection. 1994. Natural Regions and Subregions
of Alberta: Summary. Publ. No I/ 531. Alberta Environmental
Protection, Edmonton, Alberta.
Alberta Pacific Forest Industries, 2001. Detailed Forest Management Plan.
Alberta Pacific Forest Industries, Boyle, Alberta.
Canadian Association of Petroleum Producers, 2000. Statistical Handbook
for Canada’s Upstream Petroleum Industry. Canadian Association of
Petroleum Producers, Calgary, Alberta.
Drawe, D.L., Ortega, I.M., 1996. Impacts of geophysical seismic survey
vehicles on Padre Island National Seashore vegetation. Texas Journal of
Science 48, 107–118.
Environment Canada. 2001. Ecozones of Canada. Environment Canada,
Ottawa, Canada. http://www.ccea.org/ecozones/ accessed September;
2004.
Felix, N.A., Raynolds, M.K., Jorgenson, J.C., Dubois, K.E., 1992.
Resistence and resilience of tundra plant communities to disturbance
by winter seismic vehicles. Arctic and Alpine Research 24, 9–77.
Groot, A., Carlson, D.W., Fleming, R.L., Wood, J.E. 1997. Small Openings
in Trembling Aspen Forest: Microclimate and Regeneration of White
Spruce and Trembling Aspen. Tech. Rep. TR-47. Publication Services,
Great Lakes Forestry Centre, Canadian Forest Service, Natural
Resources Canada. Sault Ste. Marie, Ontario.
Kabzems, R.D., Lousier, J.D. 1992. Regeneration, Growth, and Develop-
ment of Picea glauca under Populus spp. canopy in the boreal white and
black spruce zone. Joint publication of Forestry Canada, Victoria,
British Columbia and British Columbia Ministry of Forests, Victoria,
British Columbia.
Kaplan, E.L., Meier, P., 1958. Nonparametric estimation from incomplete
observations. Journal of the American Statistical Association 53, 457–481.
Lai, T. 2004. ATV injuries rise 50% as other types decline. Canadian
Medical Association Journal. vol. 171. http://www.cmaj.ca/news/
18_02_03.shtml. accessed August 2004.
Landhausser, S.M., Lieffers, V.J., 1998. Growth of Populus tremuloides in
association with Calamagrostis canadensis. Canadian Journal of Forest
Research 28, 396–401.
Lee, E.T., 1992. Statistical Methods for Survival Data Analysis. Wiley,
Toronto, Ontario.
MacFarlane, A.K., 2003. Vegetation Response to Seismic Lines: Edge
Effects and On-line Succession. MSc Thesis, Department of Biological
Sciences, University of Alberta, Edmonton, Alberta.
Maini, J.S., 1966. Apical growth of Populus spp. II. Relative growth
potential of apical and lateral buds. Canadian Journal of Botany 44,
1581–1590.
Maini, J.S., Horton, K.W., 1966. Vegetative propagation of Populus spp. I.
Influence of temperature on formation and initial growth of aspen
suckers. Canadian Journal of Botany 44, 1183–1189.
Mantel, N., 1966. Evaluation of survival data and two new rank order
statistics arising in its consideration. Cancer Chemotherapy Reports 50,
166–170.
Marcela, F.S., Martin, Z.S., 2003. Potential impacts of petroleum
exploration and exploitation on biodiversity in a Patagonian Nature
Reserve, Argentina. Biodiversity and Conservation 12, 1261–1270.
Peterson, E.B. and Peterson, N.N. 1992. Ecology, Management, and Use of
Aspen and Balsam Poplar in the Prairie Provinces. Forestry Canada,
Northwest Region, Northern Forestry Centre, Edmonton, Alberta.
Special Report 1.
Peto, R., Peto, J., 1972. Asymptotically efficient rank invariant procedures.
Journal of the Royal Statistical Society Series A 135, 185–207.
P. Lee, S. Boutin / Journal of Environmental Management 78 (2006) 240–250250
Radforth, J.R., 1973. Long Term Effects of Summer Traffic By Tracked
Vehicles on Tundra. Report No. 73-22., Task Force on Northern Oil
Development, Environmental-Social Committee, Northern Pipelines,
Ottawa, Ontario.
Raynolds, M.K., Felix, N.A., 1989. Air photo analysis of winter seismic
disturbance in northeastern Alaska, USA. Arctic 42, 362–367.
Revel, R.D., Dougherty, T.D., Downing, D.J., 1984. Forest Growth and
Revegetation along Seismic Lines. The University of Calgary Press,
Calgary, Alberta.
SAS. 2002, JMP: The Statistical Discovery Software. SAS Institute Inc.,
Cary, North Carolina.
Schneider, R., 2002. Alternative Futures: Alberta’s Boreal Forest at the
Crossroads. The Federation of Alberta Naturalists and The Alberta
Centre for Boreal Research, Edmonton, Alberta.
Schneider, R., Stelfox, J.B., Boutin, S., Wasel, S., 2003. Managing the
cumulative impacts of land uses in the western Canadian Sedimentary
Basin: a modeling approach. Conservation Ecology 7, 8.
Song, S.J., 2002. Ecological basis of stand management: A synthesis of
ecological Responses to Wildfire and Harvesting. Alberta Research
Council, Vegreville, Alberta, Canada.
Statistics Canada, 1990. New Vehicle Sales. Minister of Industry, Science,
and Statistics, Ottawa, Ontario.
Statistics Canada, 2003. New Vehicle Sales. Statistics Canada, Ottawa,
Ontario.
Statistics Canada, 2004. Population by sex and age group, by provinces and
territories. Statistics Canada, Ottawa, Ontario.
Stelfox, J.B., Wynes, B., 1999. A Physical, Biological, and Land-use
Synopsis of the Boreal Forest’s Natural Regions of Northwest Alberta.
Daishowa-Marubeni International Ltd, Peace River, Alberta.
Szumigalski, A.R., 1995. Production and Decomposition of Vegetation
Along a Wetland Gradient in Central Alberta. MSc Thesis, Department
of Botany, University of Alberta, Edmonton, Alberta.
Wan, X., Landhausser, S.M., Zwiazek, J.J., Lieffers, V.J., 1999. Root water
flow and growth of aspen (Populus tremuloides) at low root
temperatures. Tree Physiology 19, 879–884.
Zasada, J.C., 1972. Guidelines for Obtaining Natural Regeneration of
White Spruce in Alaska. United States Department of Agriculture,
Forest Service, Pacific Northwest Forestry and Range Experimental
Station, Portland, Oregon.