Embed Size (px)
Citation preview

PERSISTENCE AND SIGNIFICANCE OF E. COLI IN HOUSE FLIES (MUSCA DOMESTICA) AND STABLE FLIES (STOMOXYS
CALCITRANS)
KATERYN ROCHON B. Sc., Universite de Sherbrooke, 1998
A Thesis Submitted to the School of Graduate Studies
Of the University of Lethbridge In Partial Fulfilment of the
Requirements for the Degree
MASTER OF SCIENCE
Department of Biological Sciences University of Lethbridge
LETHBRIDGE. ALBERTA, CANADA
© Kateryn Rochon, 2003
ABSTRACT
The persistence of Escherichia coli in the larval, pupal and adult stages of both house
flies, Musca domestica (L.). and stable flies, Stomoxys calcitrans (L.) was examined.
Abundance of E. coli declined over time in immature house flies, but remained constant
in immature stable flies, suggesting house fly larvae digest E. coli but stable fly larvae do
not. Survival of house fly and stable fly larvae averaged 62% and 25% respectively when
reared on pure E. coli cultures. E. coli load in pupae decreased significantly one day
before emergence of adult house flies, but remained constant until stable fly emergence.
Nevertheless, E. coli was detected in 78% of emerging house flies and in 28% of
emerging stable flies. House flies are more important E. coli vectors as adults, whereas
stable flies may be overlooked vectors of E. coli during immature development.
iii
ACKNOWLEDGEMENTS
I would like to thank my supervisors, Dr. Timothy J. Lysyk and Dr. L. Brent
Selinger for their remarkable support and patience. I appreciate you made me part of a
team where I felt I was more than "just a student". Your encouragements were rewarding
and your guidance, invaluable. Members of my supervisory committee. Dr. Cameron P.
Goater and Dr. Christopher Armstrong-Esther also provided helpful advice and
discussion.
I am grateful for the technical assistance of Miranda Selinger, Paul Coghlin and
Richard Lancaster. Your sense of humour greatly contributed to the stimulating working
environment.
Finally, I would like to thank my parents and my boyfriend for their constant
encouragement. Merci de m'avoir tant inspiree. Vous avez ete. chacun a voire maniere, le
phare qui m'a permis de garder le cap dans les temps de brume.
iv

TABLE OF CONTENTS
APPROVAL ii
ABSTRACT iii
ACKNOWLEDGEMENTS iv
TABLE OF CONTENTS v
LIST OF FIGURES viii
LIST OF TABLES ix
CHAPTER 1. INTRODUCTION 1
CHAPTER 2. REVIEW OF LITERATURE 4
2.1. Life history 4
2.1.1. Eggs and larvae 4
2.1.2. Pupae 6
2.1.3. Adults 7
2.2. Importance of house flies and stable flies as pests 8
2.3. Disease transmission 9
2.4. Acquisition and dissemination of pathogenic organisms by flies 10
2.4.1. Morphology 11
2.4.2. Regurgitation 13
2.4.3. Digestion and excretion 16
v
2.4.4. Gonotrophic cycle 17
vi
2.5. Alternate routes of acquisition 18
CHAPTER 3. MATERIALS AND METHODS 20
3.1. Stock insect colonies 20
3.2. Bacteria preparation 20
3.3. Gnotobiotic larval rearing procedures 21
3.4. Persistence of E. coli in larval guts of house flies and stable flies 22
3.4.1. Short term persistence 22
3.4.2. Long term pers istence 24
3.5. Dose-dependent persistence of E. coli in house fly and stable fly larval guts ... 25
3.6. Survival and development of house fly and stable fly larvae reared on three
different bacterial cultures 27
3.7. Persistence of E. coli during the development of house fly and stable fly
pupae 28
3.8. E. coli contamination of teneral adult house flies and stable flies 29
CHAPTER 4. RESULTS 31
4.1. Persistence of E. coli in larval guts of house flies and stable flies 31
4.1.1. Short term pers istence 31
4.1.2. Long term persistence 34
4.2. Dose-dependent persistence of E. coli in house fly and stable fly larval guts ... 43
4.3. Survival and development of house fly and stable fly larvae reared on three
different bacterial cultures 49
4.3.1. Larval survival 49
4.3.2. Larval and pupal development 51
4.3.3. Pupal weight 54
4.3.4. Pupal survival 54
4.4. Persistence of E. coli during the development of house fly and stable fly
pupae 56
4.5. E. coli contamination of teneral adult house flies and stable flies 59
CHAPTER 5. DISCUSSION 65
CHAPTER 6. CONCLUSION 77
REFERENCES CITED 79
vii
LIST OF FIGURES
Page
Figure 4.1.1. Proportion of house fly and stable fly larvae infected with E. coli over
a period from zero to five hours 32
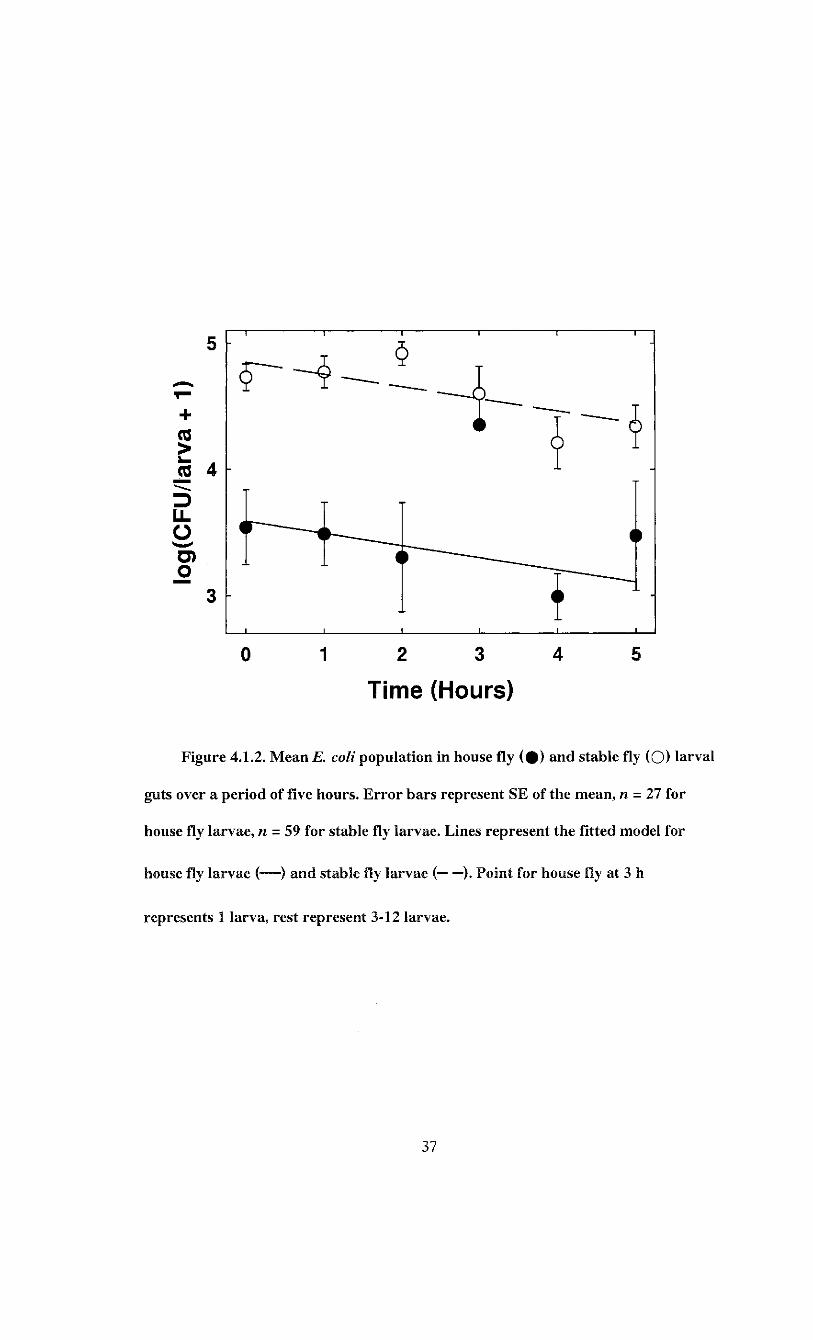
Figure 4.1.2. Mean E. coli population in house fly and stable fly larval guts over a
period of five hours 37
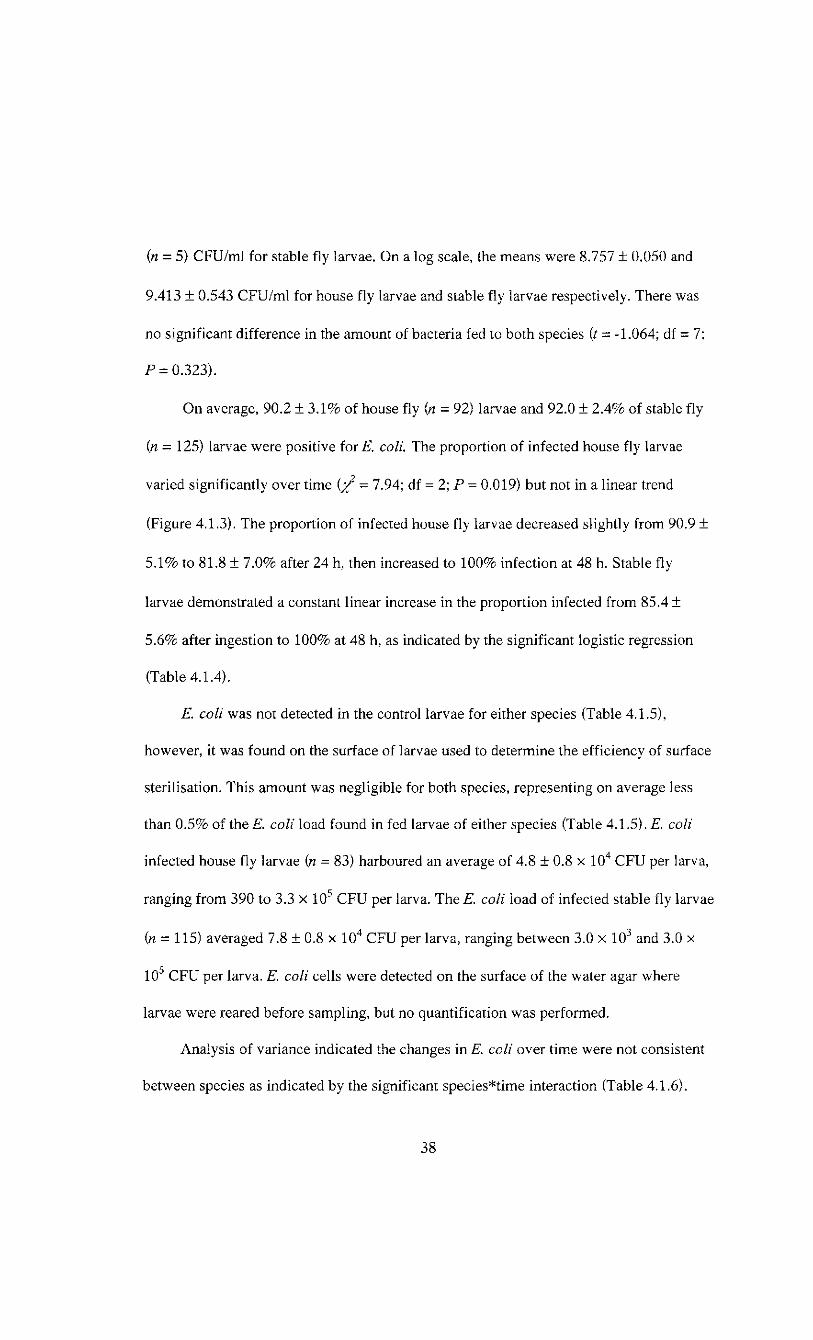
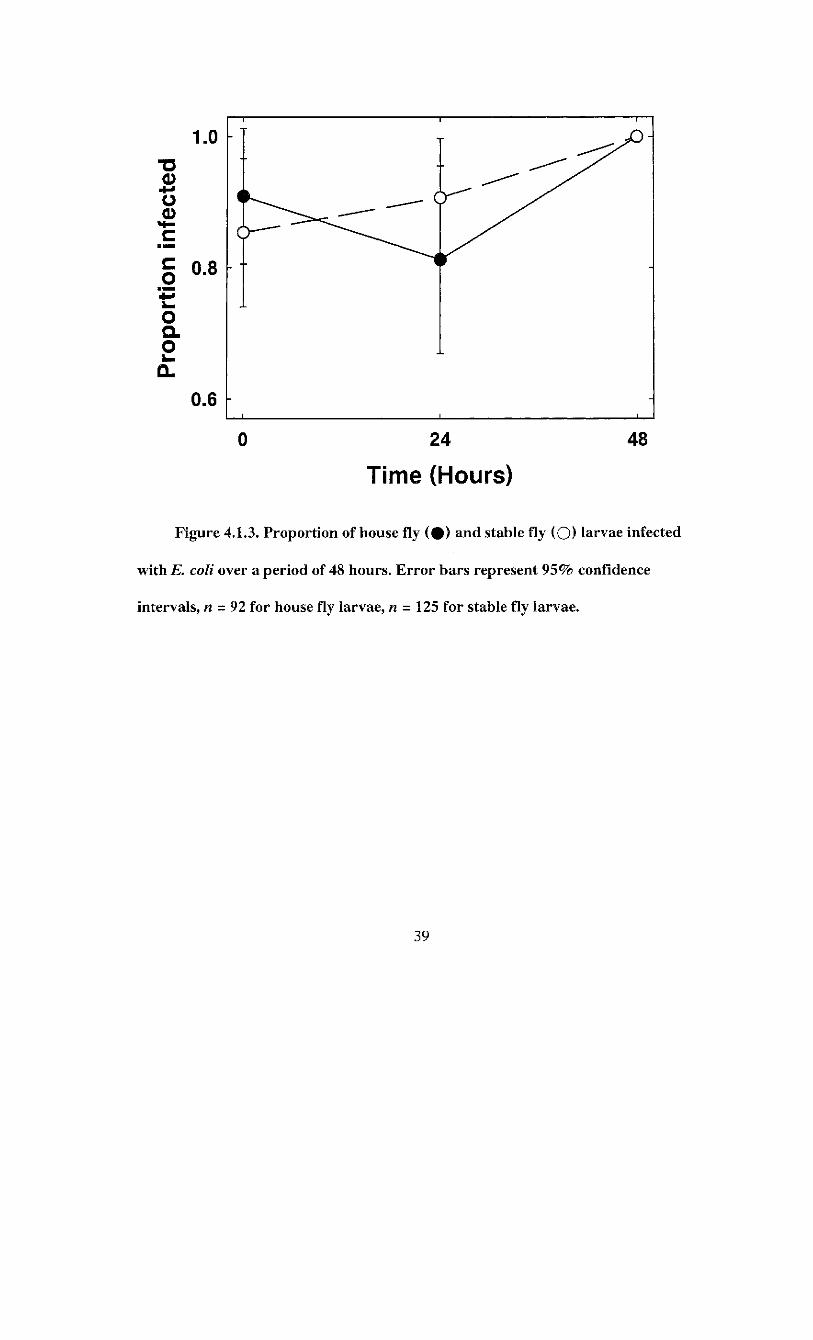
Figure 4.1.3. Proportion of house fly and stable fly larvae infected with E. coli over
a period of 48 hours 39
Figure 4.1.4. Mean E. coli population in house fly and stable fly larval guts over a
period of 48 hours 44
Figure 4.2.1. Mean E. coli population in house fly and stable fly larvae over a
period of 48 hours after ingestion of a low or a high dose suspension
of bacteria 48
Figure 4.3.1. Survival to pupation of house fly and stable fly larvae reared on three
different bacterial cultures 50
Figure 4.3.2. Time (in days) required by house fly and stable fly larvae to reach
pupation when reared on three different bacterial cultures 52
Figure 4.3.3. Time (in days) required by house fly and stable fly pupae reared on
three different bacterial cultures to reach the adult stage 53
Figure 4.3.4. Weight (in mg) of house fly and stable fly pupae reared on three
different bacterial cultures 55
Figure 4.3.5. Survival to adult emergence of house fly and stable fly pupae reared
on three different bacterial cultures 57
Figure 4.4.1. E. coli populations in house fly and stable fly pupae since pupation 60
viii
LIST OF TABLES
Page
Table 4.1.1. Relationship between the proportion of house fly and stable fly larvae
infected with E. coli and time from zero to five hours 33
Table 4.1.2. E. coli population (mean ± SE) in the guts of house fly and stable fly
larvae over a period of five hours 35
Table 4.1.3. Variation in E. coli load between the larval guts of house flies and
stable flies over a period of five hours 36
Table 4.1.4. Relationship between the proportion of house fly and stable fly larvae
infected withii. coli and time from zero to 48 hours 40
Table 4.1.5. E. coli population (mean ± SE) in the guts of house fly and stable fly
larvae over a period 48 hours 41
Table 4.1.6. Variation of E. coli population between house fly and stable fly larvae
over a period of 48 hours 42
Table 4.2.1. E. coli population (mean ± SE) in the guts of house fly and stable fly
larvae over a period of 48 hours after ingestion of a low or a high dose
suspension of bacteria 46
Table 4.2.2. Variation of E. coli population in the gut of house fly and stable fly
larvae over time after ingestion of a low or a high dose suspension of
bacteria 47
Table 4.4.1. Relationship between the proportion of house fly and stable fly pupae
infected with E. coli and time since pupation 58
Table 4.5.1. Spearman's rank correlation between house fly and stable fly E. coli
contamination and pupal case E. coli contamination 64
ix

CHAPTER 1. INTRODUCTION
Concern for food safety is increasing as food production becomes more intensive in
industrialised countries. The emergence of new pathogens and the growing number of
immune-compromised individuals intensify the need for safer food supplies.
Nevertheless, outbreaks of food borne and waterborne pathogens are increasingly
reported and communicated in North America. The bacterium, Escherichia coli serotype
0157:H7, is of particular concern to the public in relation to such outbreaks. Infections
with E. coli 0157:H7 have mostly been associated with consumption of undercooked
ground beef (Doyle 1991), but also with other products such as fresh vegetables (Abdul-
Raouf et al. 1993, Ackers et al. 1998), unpasteurised apple cider (Besser et al. 1993,
Miller and Kaspar 1994), and sausages (Duffy et al. 2000).
Beef and dairy cattle are asymptomatic carriers of E. coli 0157:H7 (Zhao et al.
1995), which makes detection of the bacterium difficult for producers. Animals are
mostly infected during the summer months, and shed bacteria in their faeces sporadically
(Besser et al. 1997). This species can reach populations of 10 5 colony-forming units
(CFU)/g of faeces and survive for weeks under natural conditions (Wang et al. 1996).
The association between flies and enteric bacteria and the importance of flies as
vectors of pathogenic bacterial strains have been studied extensively. Studies continue to
link morbidity and mortality from diarrhoeal diseases to the abundance of synanthropic
flies (Cohen et al. 1991, Levine and Levine 1991, Chavasse et al. 1994). House flies and
stable flies are important pests of dairy and beef cattle in Alberta, and they are also
associated with faeces at several points in their life cycle. Adult house flies feed on
1
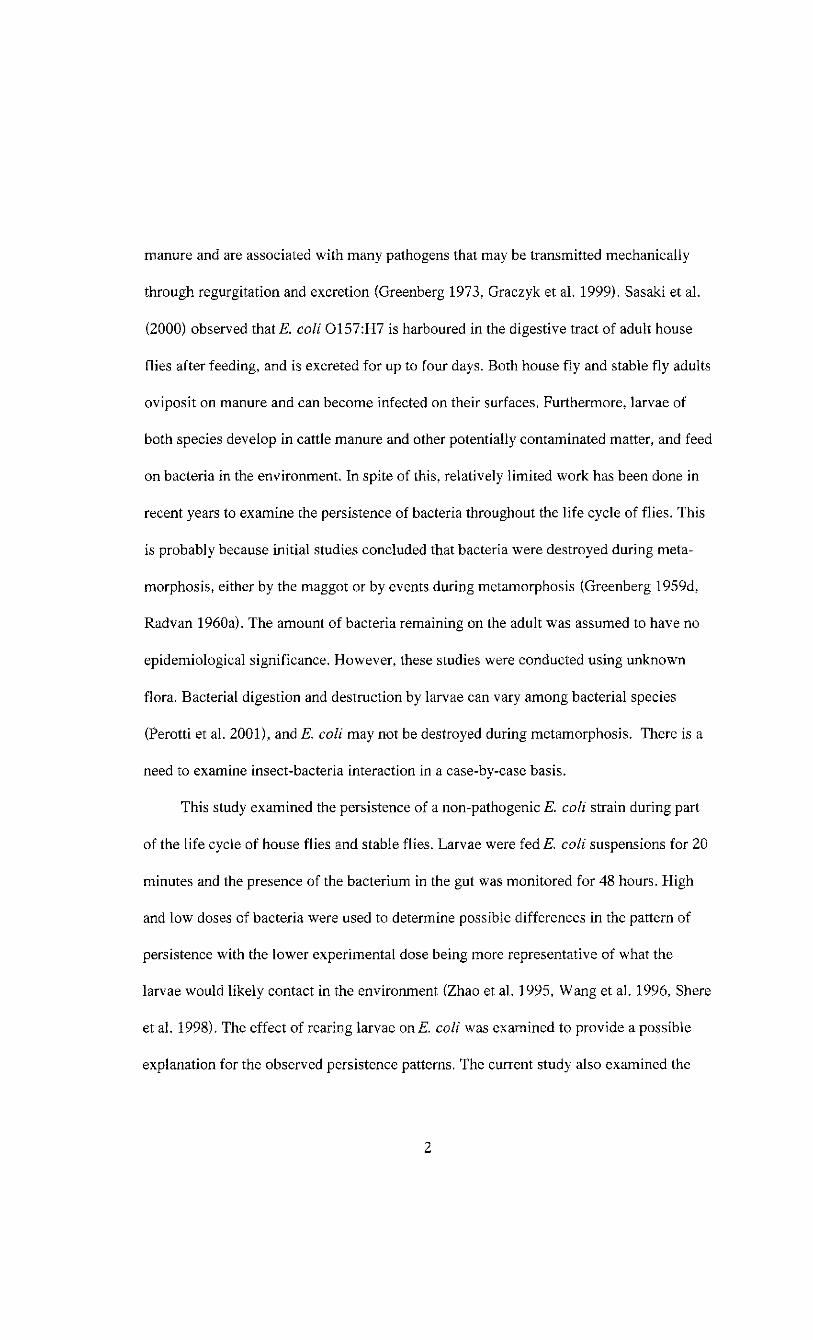
manure and are associated with many pathogens that may be transmitted mechanically-
through regurgitation and excretion (Greenberg 1973, Graczyk et al. 1999). Sasaki et al.
(2000) observed that E. coli 0157:H7 is harboured in the digestive tract of adult house
flies after feeding, and is excreted for up to four days. Both house fly and stable fly adults
oviposit on manure and can become infected on their surfaces. Furthermore, larvae of
both species develop in cattle manure and other potentially contaminated matter, and feed
on bacteria in the environment. In spite of this, relatively limited work has been done in
recent years to examine the persistence of bacteria throughout the life cycle of flies. This
is probably because initial studies concluded that bacteria were destroyed during meta
morphosis, either by the maggot or by events during metamorphosis (Greenberg 1959d,
Radvan 1960a). The amount of bacteria remaining on the adult was assumed to have no
epidemiological significance. However, these studies were conducted using unknown
flora. Bacterial digestion and destruction by larvae can vary among bacterial species
(Perotti et al. 2001), and E. coli may not be destroyed during metamorphosis. There is a
need to examine insect-bacteria interaction in a case-by-case basis.
This study examined the persistence of a non-pathogenic E. coli strain during part
of the life cycle of house flies and stable flies. Larvae were fed E. coli suspensions for 20
minutes and the presence of the bacterium in the gut was monitored for 48 hours. High
and low doses of bacteria were used to determine possible differences in the pattern of
persistence with the lower experimental dose being more representative of what the
larvae would likely contact in the environment (Zhao et al. 1995, Wang et al. 1996, Shere
et al. 1998). The effect of rearing larvae on Is. coli was examined to provide a possible
explanation for the observed persistence patterns. The current study also examined the
2

fate of E. coli through metamorphosis of house flies and stable flies. Third instar larvae
of both species reared on E. coli plates were left to pupate and were processed at different
intervals throughout the pupal stage to determine E. coli infection. Finally, the presence
of the bacterium in and on emerging adults was assessed.
3

CHAPTER 2. REVIEW OF LITERATURE
2.1. Life history
2.1.1. Eggs and larvae
Both house fly and stable fly females lay eggs periodically, following a cycle of
egg maturation and oviposition. For both species, eggs are laid on moist organic matter
which also serves as growth medium for the larvae. Development sites for larval house
flies in confined cattle systems include silage mounds and indoor bedding material
(Meyer and Shultz 1990, Lysyk 1993b). Stable fly larvae occur close to fence lines and in
manure mounds (Lysyk 1993b), as well as close to feed aprons (Skoda et al. 1991).
Manure can support development of both house fly and stable fly larvae (Meyer and
Shultz 1990) largely because this is rich in bacteria that larvae use as a food source.
Numerous studies have demonstrated the importance of bacteria to larval growth and
development. House fly larvae failed to develop on an artificial growth medium sterilised
immediately after preparation, but reached the adult stage on the same medium incubated
for two days prior to sterilisation (Greenberg 1954). This indicates larvae need bacterial
growth to develop properly but can develop on lysed bacteria. House fly and stable fly
larvae reared on agar-based diets did not grow on sterile media, but completed
development when selected bacterial strains were present (Schmidtmann and Martin
1992, Watson et al. 1993, Lysyk et al. 1999).
Bacterial diversity varies between larval guts and the environment the larvae
inhabit (Zurek et al. 2000, Perotti et al. 2001). Bacteria vary in their suitability to support
4
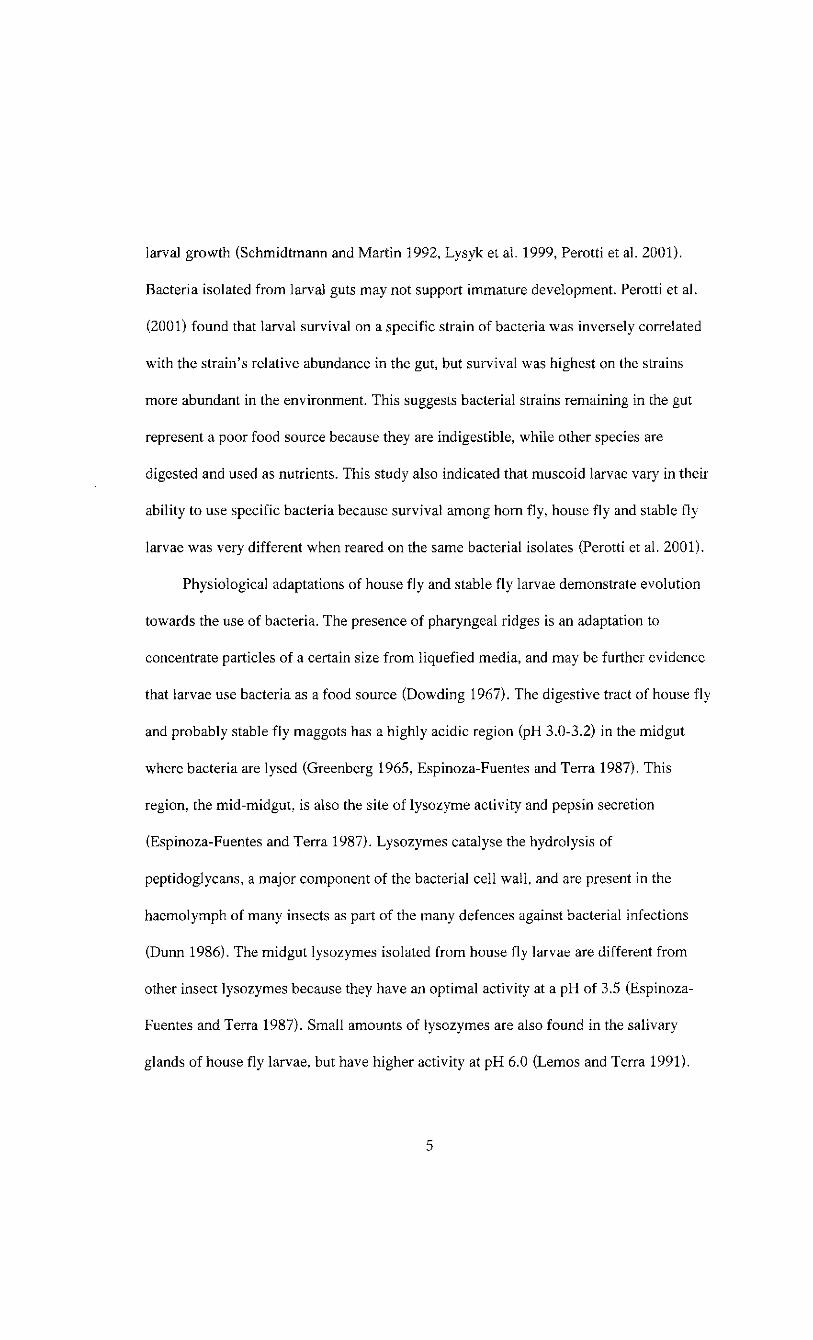
larval growth (Schmidtmann and Martin 1992, Lysyk et al. 1999, Perotti et al. 2001).
Bacteria isolated from larval guts may not support immature development. Perotti et al.
(2001) found that larval survival on a specific strain of bacteria was inversely correlated
with the strain's relative abundance in the gut, but survival was highest on the strains
more abundant in the environment. This suggests bacterial strains remaining in the gut
represent a poor food source because they are indigestible, while other species are
digested and used as nutrients. This study also indicated that muscoid larvae vary in their
ability to use specific bacteria because survival among hom fly, house fly and stable fly
larvae was very different when reared on the same bacterial isolates (Perotti et al. 2001).
Physiological adaptations of house fly and stable fly larvae demonstrate evolution
towards the use of bacteria. The presence of pharyngeal ridges is an adaptation to
concentrate particles of a certain size from liquefied media, and may be further evidence
that larvae use bacteria as a food source (Dowding 1967). The digestive tract of house fly
and probably stable fly maggots has a highly acidic region (pH 3.0-3.2) in the midgut
where bacteria are lysed (Greenberg 1965, Espinoza-Fuentes and Terra 1987). This
region, the mid-midgut, is also the site of lysozyme activity and pepsin secretion
(Espinoza-Fuentes and Terra 1987). Lysozymes catalyse the hydrolysis of
peptidoglycans, a major component of the bacterial cell wall, and are present in the
haemolymph of many insects as part of the many defences against bacterial infections
(Dunn 1986). The midgut lysozymes isolated from house fly larvae are different from
other insect lysozymes because they have an optimal activity at a pH of 3.5 (Espinoza-
Fuentes and Terra 1987). Small amounts of lysozymes are also found in the salivary
glands of house fly larvae, but have higher activity at pH 6.0 (Lemos and Terra 1991).
5
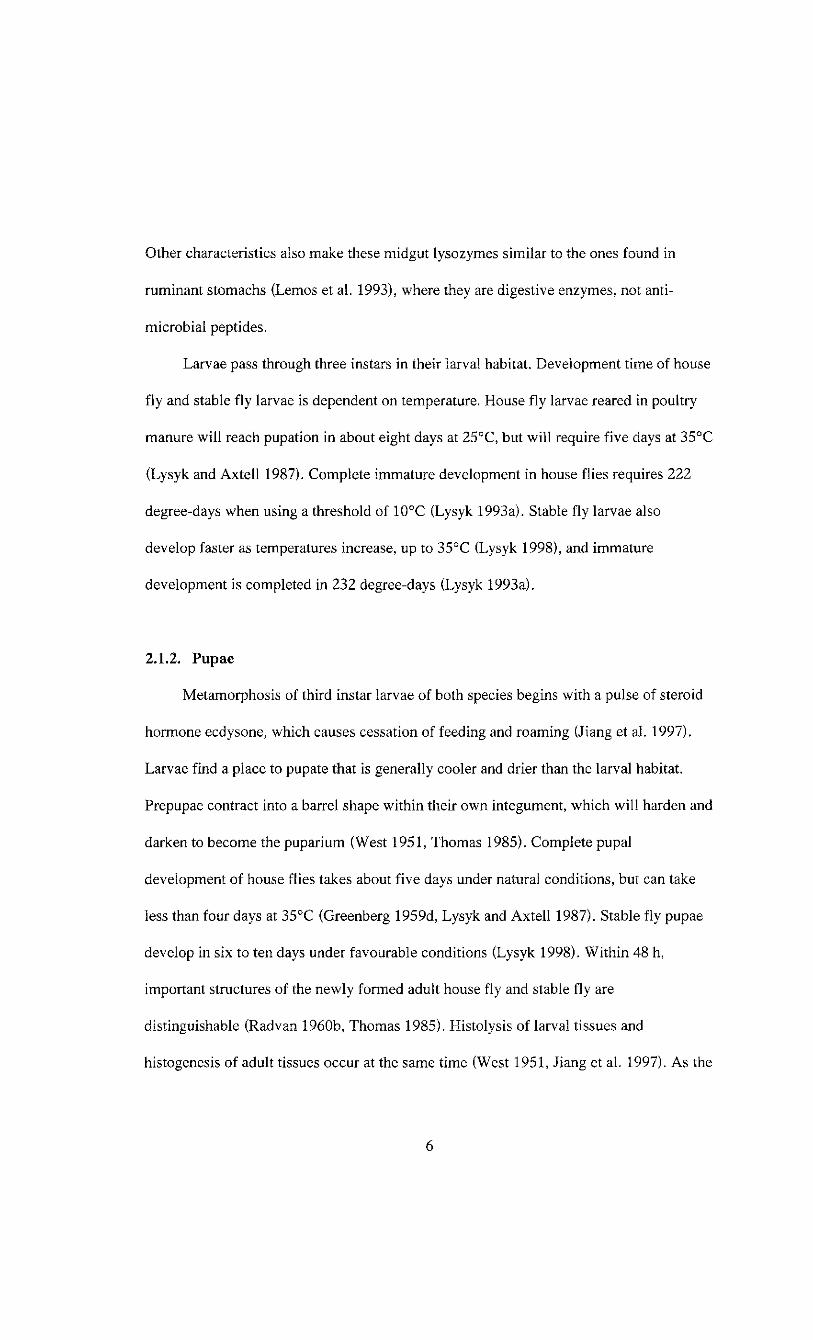
Other characteristics also make these midgut lysozymes similar to the ones found in
ruminant stomachs (Lemos et al. 1993), where they are digestive enzymes, not anti
microbial peptides.
Larvae pass through three instars in their larval habitat. Development time of house
fly and stable fly larvae is dependent on temperature. House fly larvae reared in poultry
manure will reach pupation in about eight days at 25°C, but will require five days at 35°C
(Lysyk and Axtell 1987). Complete immature development in house flies requires 222
degree-days when using a threshold of 10°C (Lysyk 1993a). Stable fly larvae also
develop faster as temperatures increase, up to 35°C (Lysyk 1998), and immature
development is completed in 232 degree-days (Lysyk 1993a).
2.1.2. Pupae
Metamorphosis of third instar larvae of both species begins with a pulse of steroid
hormone ecdysone, which causes cessation of feeding and roaming (Jiang et al. 1997).
Larvae find a place to pupate that is generally cooler and drier than the larval habitat.
Prepupae contract into a barrel shape within their own integument, which will harden and
darken to become the puparium (West 1951, Thomas 1985). Complete pupal
development of house flies takes about five days under natural conditions, but can take
less than four days at 35°C (Greenberg 1959d, Lysyk and Axtell 1987). Stable fly pupae
develop in six to ten days under favourable conditions (Lysyk 1998). Within 48 h,
important structures of the newly formed adult house fly and stable fly are
distinguishable (Radvan 1960b, Thomas 1985). Histolysis of larval tissues and
histogenesis of adult tissues occur at the same time (West 1951, Jiang et al. 1997). As the
6
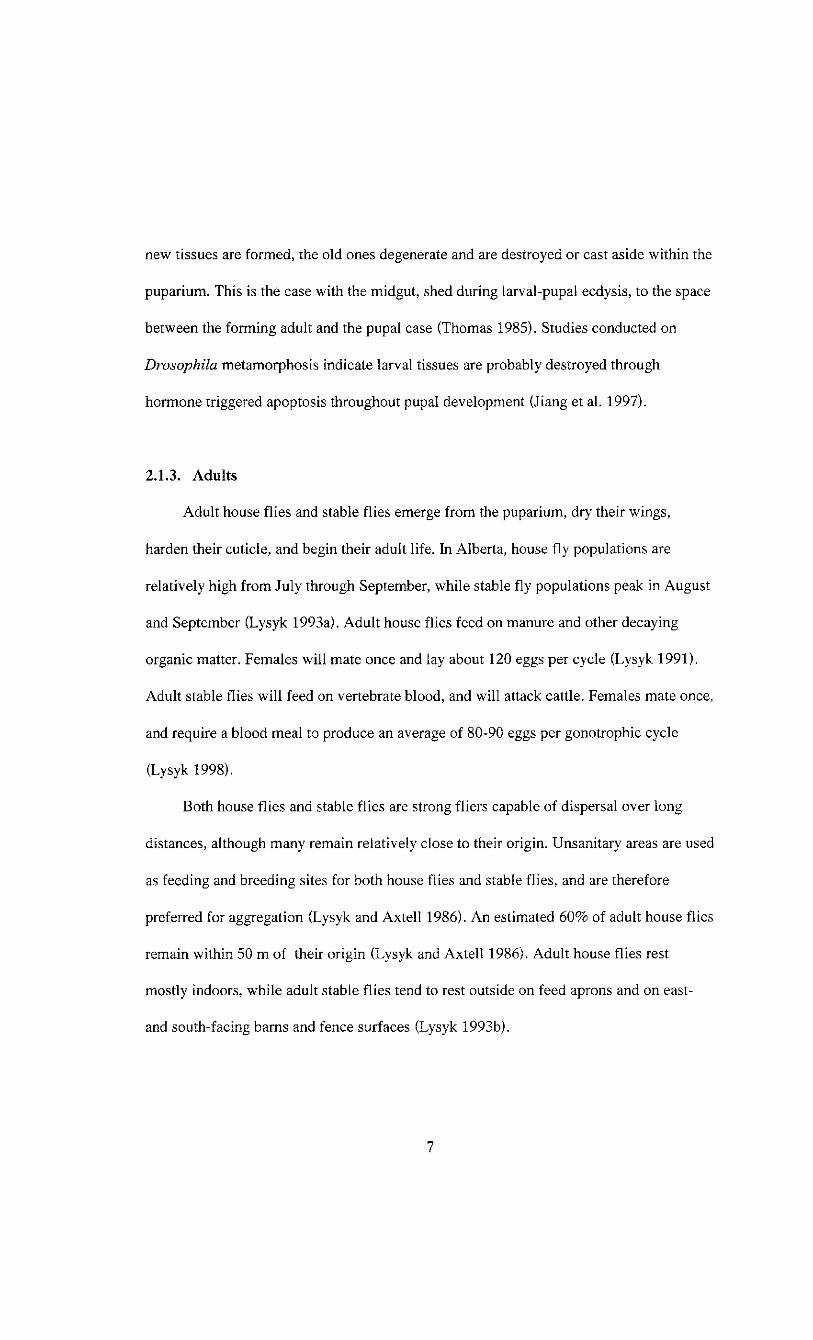
new tissues are formed, the old ones degenerate and are destroyed or cast aside within the
puparium. This is the case with the midgut, shed during larval-pupal ecdysis, to the space
between the forming adult and the pupal case (Thomas 1985). Studies conducted on
Drosophila metamorphosis indicate larval tissues are probably destroyed through
hormone triggered apoptosis throughout pupal development (Jiang et al. 1997).
2.1.3. Adults
Adult house flies and stable flies emerge from the puparium, dry their wings,
harden their cuticle, and begin their adult life. In Alberta, house fly populations are
relatively high from July through September, while stable fly populations peak in August
and September (Lysyk 1993a). Adult house flies feed on manure and other decaying
organic matter. Females will mate once and lay about 120 eggs per cycle (Lysyk 1991).
Adult stable flies will feed on vertebrate blood, and will attack cattle. Females mate once,
and require a blood meal to produce an average of 80-90 eggs per gonotrophic cycle
(Lysyk 1998).
Both house flies and stable flies are strong fliers capable of dispersal over long
distances, although many remain relatively close to their origin. Unsanitary areas are used
as feeding and breeding sites for both house flies and stable flies, and are therefore
preferred for aggregation (Lysyk and Axtell 1986). An estimated 60% of adult house flies
remain within 50 m of their origin (Lysyk and Axtell 1986). Adult house flies rest
mostly indoors, while adult stable flies tend to rest outside on feed aprons and on east-
and south-facing barns and fence surfaces (Lysyk 1993b).
7
2.2. Importance of house flies and stable flies as pests
House flies and stable flies have biological properties that make them potential
mechanical vectors. They live in close association with bacteria, they enter farm
buildings and homes and adults disperse from one area to another. House flies and stable
flies are termed synanthropic because they live in close proximity to humans and
domestic animals, and they use the human environment for shelter and food. Adult flies
and larvae are associated with the human environment and feed on excreta of humans or
domestic animals, decaying organic matter, and possibly on vertebrate blood. They share
the human environment because of its buildings or farmyards, which satisfy their
requirements for shelter better than natural environments. These trophic and ecological
requirements are also used to evaluate the epidemiological significance of flies
(Greenberg 1971).
Flies can be an annoyance to people and animals, as well as pose a health threat.
They are often in contact with highly contaminated substrates and are known vectors of
numerous pathogens (Greenberg 1973, Schmidtmann 1985). Large fly populations at the
feed bunks can also make animals reluctant to feed (Wieman et al. 1992). Stable flies
have painful bites that cause irritation and can damage tissues and hide. Large fly
numbers can also cause behaviour changes in cattle attempting to avoid bites, and lead to
reductions in weight gain and milk production (Campbell et al. 1987). Stable flies are
also persistent biters, and can transmit pathogens by interrupted feeding (Straif et al.
1990).
8

2.3. Disease transmission
The transmission of pathogens by flies and other arthropods may be biological or
mechanical. For biological transmission to occur, the pathogen must undergo
developmental changes within the vector. Biologically transmitted pathogens have
evolved in close association with their arthropod vector and infection of the arthropod is a
necessary step in the completion of the pathogen lifecycle. The pathogen develops to its
infective state and multiplies in the vector, which then serves to infect a new host.
Parasites such as Plasmodium spp. are transmitted biologically because without its
mosquito vector, the protozoan would not be able to develop to it infective form, and
could not be transmitted from one host to another. Arthropod borne viruses are
considered biologically vectored because they require propagation within the arthropod
host, where they attack the tissues and multiply (Gray and Banerjee 1999). Arthropods
that are not susceptible to infection by a virus cannot act as its biological vector, but non
specific transmission is possible through contamination of mouthparts.
In mechanical transmission, the vector essentially transports the pathogen. The
pathogen may be carried externally on the body surface or the mouthparts of the fly and
then transmitted through simple body contact, or carried internally in the gut. and
transmitted through regurgitation or defecation (Dipeolu 1982, Glass et al. 1982, Sasaki
et al. 2000). Many types of pathogens are known to be spread this way, from viruses
(Greenberg 1973, Tan et al. 1997) and bacteria (Bidawid et al. 1978, Cohen et al. 1991.
Levine and Levine 1991, Sasaki et al. 2000), to protozoa (Straif et al. 1990, Fotedar et al.
1992, Graczyk et al. 1999) and even helminth eggs and larvae (Dipeolu 1982. Sulaiman
9
et al. 1988).
Flies are good indicators of the micro organisms present in the environment. House
flies trapped within a hospital had higher bacterial counts and carried more pathogens
than flies captured in a residential area (Fotedar et al. 1992). Attenuated polioviruses used
for vaccination were isolated from house flies, demonstrating humans may actually be
responsible for contaminating flies (Greenberg 1973). House flies placed in contact with
chicks infected with Campylobacter jejuni were contaminated with the pathogen five
days later. These flies subsequently infected pathogen-free chicks with C. jejuni within
eight days (Shane et al. 1985).
The association between the house flies and faeces is an important issue in disease
transmission. The house fly was implicated in the transmission of numerous enteric
pathogens such as Shigella spp. (Lindsay and Scudder 1956, Levine and Levine 1991),
Salmonella spp. (Greenberg 1964), and E. coli (Moriya et al. 1999). House flies may also
be important carriers of Vibrio cholerae during outbreaks (Fotedar 2001). Cohen et al.
(1991) demonstrated that the implementation of control measures to reduce the fly
population significantly decreased the number of diarrhoeal cases reported.
2.4. Acquisition and dissemination of pathogenic organisms by flies
The ability of house flies and stable flies to mechanically transmit pathogenic
agents is influenced by their nutritional requirements and feeding habits. These
characteristics are related to the morphology of the fly's mouthparts, the kinds of
pathogens that can be transmitted, as well as the infection route taken by these pathogens.
10
Other structures such as the legs and body can also transport pathogens. Since adult
house flies and stable flies have different methods of feeding, their methods for acquiring
pathogens differ.
2.4.1. Morphology
Adult house flies have sponging mouthparts that trap dissolved food particles. The
labella are well developed and act as a sponge that filters and absorbs liquids. The part of
the labella in contact with the substrate bears rows of small parallel channels called
pseudotracheae. When the labella fill with liquid, these pseudotracheae act like gutters
and drain the liquid to the mouth opening and up to the food canal (Greenberg 1973). The
space between these channels is approximately five microns (Greenberg 1973). The
labella also serve to scrape the substrate with the prestomal teeth located before the
opening of the food canal. The teeth are delicate blade-like structures, and their number
and shape vary among species (Greenberg 1973, Broce and Elzinga 1984). Although
house fly prestomal teeth are smaller than those of other species, they can still cause
some tissue damage during feeding (Kovacs et al. 1990). The flies can also feed directly
from the opening of the food canal, which enables them to ingest small particles like
helminth eggs (Greenberg 1973). Since house flies are found in many different
environments and feed off a variety of substances, they are exposed to a wide range of
pathogens. Particles can adhere to the minute spaces of the sponging mouthparts and be
transferred to the next surface the fly feeds on. House flies fed E. coli 0157:H7 had
bacterial cells attached to the inner and outer surfaces of the labella 24 h after feeding
(Kobayashi et al. 1999).
11
Other structures of the fly's morphology facilitate pathogen transport. The body is
hairy, and so are the legs. Hairs on the exoskeleton can easily trap droplets of liquids or
small solid particles as adult flies walk on a substrate during feeding or oviposition (Tan
et al. 1997). The feet also have sticky pads covered with tiny hair that enable them to
walk on walls and ceilings; these also can trap micro-organisms. These morphologic
factors are more important for coprophagous and saprophagous flies because more of
their body is in contact with the contaminated medium.
Recent work on mechanical transport of the rotavirus by the legs and wings of the
house fly indicates that flies picked up more viruses in a solution containing faeces than
in a clear suspending medium (Tan et al. 1997). This was attributed to the hairs' and
bristles' efficiency in catching suspended particles containing viruses. All tested flies
transferred the largest amount of virus particles to the first surface visited, regardless of
its type or of the time they were allowed to walk on that first surface. The proportion of
virus particles transferred was influenced by the nature of the surface, where a soft
surface was found to remove more particles from the flies' legs. When virus particles
adhered to the underside of the wings, more than 95 percent were removed within the
first 11 seconds of flight (Tan et al. 1997).
Blood feeding flies, such as the stable fly. pierce skin in order to feed. Adult stable
flies are called pool feeders, or telmophages, and have short and sturdy mouthparts
adapted for cutting the skin rather than penetrate it as in the case of vessel feeders. The
maxillae and mandibles are blade-like, and the labella are large and surround the flowing
blood to direct it to the food canal (Teskey 1990). The teeth inside the labella rasp the
skin surface while the maxillae, mandibles and hypopharynx stab the skin to make the
12
blood flow to the surface. Body contamination of blood feeding flies is less important in
disease transmission since only the proboscis is in contact with the potentially infected
blood or fluid during feeding (Glass and Gerhardt 1984).
This type of feeding is painful for the host, and defensive behaviours often dislodge
the fly before a full blood meal is ingested. Dislodged flies will keep biting until they get
the amount of blood they require. This repeated biting can occur on the same or a
different animal and lead to pathogen transmission. Pathogens can also stay in the spaces
between the different components of the mouthparts (Butler et al. 1977). Trypanosoma
brucei and T. vivax were relatively easily transmitted by African Stomoxinae after an
interrupted meal on infected blood: the success rate with T. brucei was of 11.5 percent,
and with T. vivax it was 3.4 percent (Mihok et al. 1995). This was compared to
transmission with a needle where the success rate with T. brucei was 80 percent, and 100
percent with T. vivax. However, the needle probably penetrates deeper than the slashing
mouthparts of the Stomoxinae, placing the pathogens directly into the blood stream, and
this may increase the chances of a successful infection.
2.4.2. Regurgitation
Regurgitation during feeding can occur in both species and can also be an important
contribution to pathogen transmission. House flies regurgitate on the substrate during
feeding and reabsorb the liquid in which some of the substrate has dissolved. Studies
performed on face flies (Musca autumnalis) indicate the nature of the substances ingested
by flies has an effect on regurgitation frequency. Face flies offered only water did not
regurgitate after feeding, but face flies fed various concentrations of trypticase soy broth
13
(TSB) regurgitated for over three hours after ingestion of the solution (Coleman and
Gerhardt 1988a). Furthermore, regurgitation increased proportionally with the volume
ingested and the concentration of the TSB solution (Coleman and Gerhardt 1988a).
Environmental factors such as temperature and relative humidity may also play a role in
regurgitation frequency (Coleman and Gerhardt 1988b). Interactions between flies can
also affect regurgitation. In a group of flies, the amount of regurgitation drops per fly
remains the same whether the group is large or small; however, the arrival of unfed flies
increases the number of regurgitation drops per fly (Coleman and Gerhardt 1987).
Regurgitation also occurs more often when face flies are fed on or near a host compared
with when they are fed in a lab (Coleman and Gerhardt 1987).
The how's and why's of regurgitation are not well understood, but it is clear the
process has a significant role to play in mechanical transmission. Enteric pathogens are
often isolated from the faeces of infected humans or animals. In low sanitation areas or
close to animal production facilities, coprophagous flies have relatively free access to
contaminated stools where they readily ingest these pathogens. If fresh food is to be
found nearby, these same flies may feed from it, and regurgitate part of their previous
meal onto it. Selective regurgitation may occur. Protozoan cyst and helminth eggs are
retained in the alimentary canal and may not be regurgitated as easily as are smaller
organisms such as trypanosomes and bacteria (Greenberg 1973). House flies were fed
eggs of hookworm and Ascaris lumbricoides in human faeces and the development of the
regurgitated eggs was assessed. No difference was observed in the developmental time of
regurgitated and control eggs (Dipeolu 1982). When the flies were fed larvae of both
helminth species, regurgitation of infective larvae was observed up to 4-5 hours after
14
intake for hookworm larvae, and longer in the case of A. lumbricoides. The digestive
process in the fly gut seemed to affect the larvae of hookworm, whereas the ascarid
larvae were protected by their characteristic shell (Dipeolu 1982). Regurgitation was also
held responsible for the persistent contamination of house fly mouthparts with bacteria
days after the initial contact (Kobayashi et al. 1999).
Blood feeding flies also regurgitate during feeding (Butler et al. 1977). Straif et al.
(1990) demonstrated regurgitation of both red blood cells and pathogens from
S. calcitrans after a meal of infected blood. Pathogens studied included Trypanosoma
brucei brucei, Borrelia burgdorferi, and Plasmodium yoelii nigeriensis. Simple
contamination of the mouthparts occurred almost regularly with Trypanosoma, and
occasionally with Plasmodium. Regurgitation of all pathogens was observed. These
results were confirmed by interrupted feeding experiments on mice where the proboscis
of the flies was cleaned before the transfer on the healthy mouse. Only infection trials
with Trypanosoma were conclusive. This could explain the transmission of T. brucei in
regions of the world where tsetse are absent, but where Stomoxinae are present (Straif et
al. 1990). The authors believe infection with Plasmodium failed because infected
erythrocytes could not reach the general circulation and travel to the liver, whereas
Trypanosoma is motile and could migrate from the surface of the wound where it was
regurgitated to the general blood circulation. In the case of Borrelia, they suspect the
number of cells transmitted was too low to cause an infection. The experiment by Mihok
et al. (1995) also confirms the Trypanosoma transmission results, although no
differentiation was made between mouthparts contamination and regurgitation. The
15
interrupted feeding of stable flies can also transmit cutaneous leishmaniasis (Faust et al.
1968).
16
2.4.3. Digestion and excretion
The ingested pathogens that are not regurgitated proceed through the gut where
they are either destroyed or excreted. House flies and stable flies secrete a peritrophic
matrix that surrounds the food bolus. The peritrophic matrix is a membranous sac made
of chitin, proteins and proteoglycans secreted by the gut, and acts as a substantial
physical barrier for pathogens (Tellam 1996). The matrix is permeable to certain
enzymes, ions, and small molecules, but normally retains larger particles such as bacteria
and viruses. There are two types of peritrophic membranes: type I is formed during
feeding and is synthesised by the midgut epithelium; type II is continually produced by
specialised anterior gut cells and is usually present before food is ingested (Tellam 1996).
House flies and stable flies produce a type II peritrophic matrix both as larvae and as
adults (Tellam 1996, Lehane 1997). In adult house flies, digestion begins in the crop
where starches are broken down to reduce the starch content in the anterior gut. This
makes bacteria more vulnerable to the action of the low pH level of the midgut
(approximately 3.1-3.3) and the lysozymes (Terra et al. 1996).
Large amounts of bacteria must be ingested to permit bacterial persistence in adult
house fly guts. House flies fed 10 9 CFU/ml ofE. coli 0157:H7 excreted 10 4 CFU/ml up
to three hours after feeding (Sasaki et al. 2000). Pathogenic bacteria are not always
available in such high concentration in the environment. The prevalence of E. coli
0157:H7 in cattle rarely reaches more than 40% (Zhao et al. 1995, Bach et al. 2002) and
the bacterium is shed intermittently in bovine faeces at levels ranging from 10 to 10
CFU/g (Zhao et al. 1995, Shere et al. 1998). Flies may need to acquire large amounts of
bacteria in order to transmit an infectious dose, even if the infectious dose of a bacterium
is low (DuPont et al. 1989, Kobayashi et al. 1999).
Interspecific competition among bacteria in the fly gut may also inhibit pathogen
transmission. Flies fed on a bacterial suspension of Yersinia pseudotuberculosis
contaminated agar plates up to 18 hours after the initial feeding; further detection of
Y. pseudotuberculosis was made impossible by the growth of other enteric bacteria
(Zurek et al. 2001). The elimination of the bacterium as a result of competition is one
possibility, but it is also possible Y. pseudotuberculosis was more digestible than the
other bacterial species.
Most particles, pathogen or other, pass through the gut within a few hours after
ingestion, both for larvae and adults (Espinoza-Fuentes and Terra 1987, Sasaki et al.
2000, Mumcuoglu et al. 2001). However, adult house flies fed£. coli 0157:H7 excreted
viable bacterial cells for at least three days (Kobayashi et al. 1999). House flies fed on
bovine faeces containing 2 x 10 s oocysts/ml of Cryptosporidium parvum excreted an
average of seven oocysts per faecal spot over a period of 8 days (Graczyk et al. 1999).
Infection with this protozoan can be caused by as few as 30 oocysts in healthy human
beings.
2.4.4. Gonotrophic cycle
From an epidemiological point of view, the gonotrophic cycle of the females is also
important in pathogen transmission. Non-gravid females need more blood to develop
17
eggs and are more persistent feeders than gravid females. Saprophagous female flies also
have increased nutritional requirements during early gonotrophic development. House
flies with developing eggs feed and excrete more often than males and more than females
with fully developed eggs (Sasaki et al. 2000). Females with mature eggs feed and
excrete less than males.
2.5. Alternate routes of acquisition
In the early 20 t h century, the United States government was involved in a large
campaign to expose flies as a health threat, and even today, extension services try to
educate the population about the health hazard flies represent for people and their family.
House flies and stable flies undoubtedly acquire pathogens throughout their adult life, but
so do larvae developing in manure and decomposing matter. Since flies undergo a
complete metamorphosis, the fate of the pathogens may be of epidemiological
importance if they are passed on to the adult fly. House fly and stable fly larvae harbour
total bacterial populations of about 10 7 CFU per larva (Greenberg 1959d, 1962), but
emerging adults usually harbour few bacteria or none at all (Radvan 1960b), regardless of
the rearing medium of the larvae (Greenberg 1959a). Contamination of the adult was
reported to be mostly detected on the surface of the fly and was therefore considered of
low epidemiological significance (Radvan 1960b). Surface contamination of adult flies at
emergence is probably greater in a natural environment than in a laboratory (Greenberg
1959c). There are two major declines in the bacterial population during fly
metamorphosis (Greenberg 1959a). The first decline occurs at the prepupal stage and
18
averages a hundred-fold decrease. The second decline may be related to the shedding of
the old digestive tract during pupal metamorphosis. A large number of bacteria can be
recovered from the empty pupal case (Radvan 1960a. Greenberg 1962. 1964), and while
some species of bacteria survive more successfully through the metamorphosis, there is
no evidence the "normal flora" of saprophagous bacteria tolerate the changes better than
pathogens (Greenberg 1959a, Radvan 1960a).
However, these data are incomplete as they do not consider specific host-pathogen
relationships. Not all bacteria from the development habitat are digested and used by the
larvae, and some remain in the digestive system until pupation. There may be a
relationship between pathogen retention to the adult stage and digestion, or lack of
digestion, of these pathogens in the larval gut. The association of E. coli and synanthropic
flies is a good model to investigate this potential for pathogen transfer. E. coli is a
common bacterium, and is known to be associated with cattle and other vertebrates. It can
easily be sampled in feedlots and dairies where both species of flies are present. House
flies and stable flies are pests of confined animals, and therefore also occur in feedlots
and dairies. The importance of adult flies in disease transmission has been established,
but the role of immature flies has been overlooked in the whole pathogen transmission
cycle. It is important to determine if larvae can acquire specific pathogens such as E. coli
and retain them into the adult stage.
19
CHAPTER 3. MATERIALS AND METHODS
3.1. Stock insect colonies
House flies and stable flies were obtained from stock colonies maintained using
procedures outlined in Lysyk (1998, 2001). The adults were maintained at 25°C with a
photoperiod of 16:8 (L:D) h. House flies were fed a diet of granulated sugar and dilute
evaporated milk (1:1) in small specimen dishes with crushed absorbent paper to prevent
flies from drowning. Eggs were laid on the milk-soaked paper. Stable flies were fed
defibrinated bovine blood and 10% sucrose in water in small dishes with a gauze pad that
also served as ovipositional substrate. Larvae were reared in a mixture of wheat bran,
dried brewer's grain, alfalfa meal, water, and brewer's yeast Stable fly larval rearing
medium also included sawdust. House fly pupae were removed from the rearing medium
by forced air circulation and stable fly pupae were scooped from the rearing medium.
Pupae were placed in small salad dishes and held in clean cages for eclosion.
3.2. Bacteria preparation
Bacterial strains used in the experiments were reconstituted from glycerol stock
cultures of bacteria. Empedobacter brevis (Holmes & Owen) and Flavobacterium
odoratum Stutzer were previously isolated from stable fly eggs obtained from a
laboratory colony (Lysyk et al. 1999). Bacteria were grown overnight at room
temperature on nutrient agar (Difco, Becton Dickinson, MD). The E. coli strain used was
20

previously isolated from horn fly larval gut (Perotti et al. 2001). The bacterium was
grown overnight at 37°C on Luria-Bertani (LB) plates and broth. Bacteria collected from
the plates were re-suspended in sterile distilled water unless otherwise stated and
bacterial density was adjusted by optical density at 600 nm. E. coli populations from
larvae, pupae and adults were enumerated by spreading serial dilutions onto MacConkey
agar and counting red colonies (Clark 1971).
3.3. Gnotobiotic larval rearing procedure
Larvae used in all experiments were reared on agar medium. House fly and stable
fly eggs obtained from the stock colonies were rinsed in distilled water, washed in three
changes of freshly made 0.26% sodium hypochlorite solution for a total of 15 minutes
(Perotti et al. 2001) and rinsed in three changes of sterile distilled water. Plates containing
egg yolk medium four (Watson et al. 1993) were inoculated with 100 ul of a mixed
bacterial suspension of E. brevis and F. odoratum as these were found to be most
favourable for the development of stable flies (Lysyk et al. 1999). Two pieces of
sterile #1 Whatman filter paper (Whatman Ltd. UK) were also placed on the plates. The
surface-sterilised eggs were aseptically transferred onto the filter paper with a sterile
brush at a density of about 40 eggs per plate. Plates were incubated at 25°C throughout
the life cycle.
21
3.4. Persistence of E. coli in larval guts of house flies and stable flies
3.4.1. Short term persistence
This experiment was conducted to evaluate the persistence of E. coli in the larval
gut of house flies and stable flies over a period of five hours. The general procedure was
to feed larvae of both species an E. coli suspension, rear larvae on water agar, and sample
larvae hourly to determine temporal changes in E. coli load.
E. coli cultures were grown overnight in LB broth at 37°C with constant agitation
(200 rpm). Cultures were transferred to cuvettes and diluted to an optical density of 0.800
(± 0.005) at 600 nm with sterile LB broth. Viable counts of the bacterial suspensions
were performed to determine the concentration of bacteria fed to the larvae. Larvae were
reared from egg to third instar on agar medium using the gnotobiotic procedure. Third
instar larvae were aseptically removed from rearing plates and starved on water agar for a
day before each trial. Larvae were assigned to one of three treatment groups: E. coli-fed,
broth-fed or unfed. The E. coli-fed larvae were used to determine E. coli persistence in
the larval guts. Six larvae were placed in each of two sterile 1.5 ml microfuge tubes with
35 (al of coloured E. coli suspension and allowed to feed for 20 minutes. One drop of
green food colouring (Club House, McCormick Canada Inc.) was added to the solutions
to ensure the larvae had ingested the solution. The coloured solution was visible in the
guts of feeding larvae. Broth-fed larvae were used as controls to ensure that
contamination did not result from rearing. Six larvae were placed in a sterile 1.5 ml
microfuge tube with 35 ul of coloured sterile LB broth and allowed to feed for 20
minutes. After feeding, larvae were removed from the tubes with sterile insect handling
22
forceps, surface-sterilised in three changes of 0.26% sodium hypochlorite for a total of 15
minutes and rinsed in three changes of sterile distilled water. Unfed larvae were used to
determine the efficiency of surface-sterilisation. Six larvae were dipped in a coloured E.
coli solution for less than two seconds each and surface-sterilised following the same
method. Larvae in all treatments were handled similarly following treatment. Larvae
were placed on sterile water agar and incubated at 25°C for 0, 1, 2, 3, 4 and 5 h after
surface-sterilisation. Incubation was completed on water agar to reduce contamination
from excreted bacteria. Each hour, two E. coli-fed larvae, one broth-fed larva and one
unfed larva were collected, individually homogenised in 1 ml phosphate buffered saline
(PBS) (pH 7.2: N a H 2 P 0 4 0.2M, 14.0 ml/1; N a 2 H P 0 4 0.2M, 36.0 ml/1; NaCl, 8.0 g/1) with
a sterile plastic pestle and centrifuged at 800 x g for two minutes to produce a clear
supernatant. Serial dilutions of the supernatant were plated in duplicate. A total of 50
E. coli-fed larvae, 25 broth-fed larvae and 25 unfed larvae were examined for each time
point and species. For each larva, the amount of E. coli in the larval gut was recorded as
the average count from the two plates. Logistic regression was used to determine if
change in the proportion of infected larvae over time was consistent among species
(SPSS Inc. 1989-1999). The number of bacteria per larva was transformed to log(y + 1).
A two-way analysis of variance (ANOVA) was used to determine if the change in E. coli
populations in the larval guts varied over time and between species. A linear regression
model was used to estimate temporal changes in the E. coli load in larval guts for each
species.
23
3.4.2. Long term persistence
24
The same general procedure was used to examine the persistence of E. coli in the
larval gut of house flies and stable flies over a period of 48 h. Larvae of both species
were fed, reared on water agar and sampled daily to determine temporal changes in
E. coli.
E. coli suspensions and larvae of both species were prepared as previously
described. Larvae were reared from egg to third instar on agar medium using the
gnotobiotic procedure. Larvae were assigned to the same three groups: E. coli-fed, broth-
fed and unfed. E. coli-fed larvae were produced by placing 40 larvae in four sterile 1.5 ml
microfuge tubes (10 per tube), each with 35 ul of coloured E. coli suspension. Broth-fed
larvae were placed in two sterile 1.5 ml microfuge tube (10 larvae per tube) with 35 ul of
coloured sterile LB broth. Larvae were allowed to feed for 20 minutes, removed from the
tubes with sterile insect handling forceps and surface-sterilised as previously described.
Unfed larvae were produced by placing 20 larvae in a coloured E. coli suspension for less
than two seconds each and surface-sterilised to serve as controls for sterilisation. After
treatment, larvae were placed on sterile water agar at 25°C. Larvae were initially sampled
within five minutes of surface-sterilisation (zero hour) and again at 24 and 48 h. At each
time point, 10 E. coli-fed larvae, five broth-fed larvae and five unfed larvae were
collected and individually homogenised as previously described. Larvae sacrificed at 24
and 48 h post-feeding were surface-sterilised again prior to homogenisation. Enumeration
of E. coli populations was done as previously described and the experiment was
replicated five times. A total of 50 E. coli-fed larvae, 25 broth-fed larvae and 25 unfed
larvae were examined for each time interval and species. The number of bacteria per
larva was transformed to log(y + 1). Logistic regression with time as a categorical
variable was used to determine the change in the proportion of infected larvae over time
for each species separately. Two-way ANOVA and linear regression were used to
estimate temporal changes in E. coli load in larval gut for each species.
3.5. Dose-dependent persistence of E. coli in house fly and stable fly
larval guts
Changes in the E. coli gut population of house fly and stable fly larvae fed a low or
a high concentration of bacteria was examined. Larvae of both species were fed on either
a low or a high dose of E. coli in suspension and sampled immediately after ingestion and
again after 48 h to determine the temporal changes in E. coli gut population.
E. coli cultures were grown overnight in LB broth at 37°C with constant agitation
(200 rpm). Cultures were transferred to cuvettes and adjusted to an optical density of
0.800 (± 0.005) at 600 nm with sterile LB broth. This high dose E. coli suspension was
serially diluted to 1:10 000 to produce the low dose E. coli suspension. The concentration
of bacteria fed to the larvae was determined by viable counts of the high dose bacterial
suspension. Larvae were reared from egg to third instar on agar medium using the
gnotobiotic procedure. Third instar larvae of both species were removed from the rearing
plates and starved on water agar for 24 h prior to the experiment. Larvae were assigned to
one of four groups: E. coli-fed with a high dose suspension, E. coli-fed with a low dose
suspension, broth-fed or unfed. E. coli-fed larvae were produced by placing 40 larvae in
four sterile 1.5 ml microfuge tubes (10 per tube) with either 35 |il of a coloured high dose
25
E. coli suspension or 35 ul of a coloured low dose E. coli suspension. Larvae were
allowed to feed for 20 minutes. Broth-fed larvae were produced by placing 40 larvae in
four sterile 1.5 ml microfuge tube (10 per tube) with 35 ul of coloured sterile LB broth
and were used as controls to ensure E. coli did not come from contamination of the
rearing medium. Broth-fed larvae were left to feed for 20 minutes and were then surface-
sterilised as previously described. Unfed larvae were dipped in a coloured E. coli solution
for less than two seconds each and served as controls for sterilisation. Once treated,
larvae were placed on water agar at 25°C. Larvae were initially sampled within 5 minutes
of surface-sterilisation (zero hour) and again at 48 h after surface-sterilisation. At each
time point, 10 E. coli-fed larvae fed a high dose, 10 E. coli-fed larvae fed a low dose, five
broth-fed larvae and five unfed larvae were individually homogenised in 1 ml PBS with a
sterile pestle. Homogenates were centrifuged at 800 x g for two minutes and dilutions of
the supernatant were plated in duplicate. Because of low bacterial density, larvae fed a
low dose E. coli suspension and sacrificed immediately after ingestion were homogenised
in 100 ul of PBS and the whole volume was plated on a single MacConkey plate as it
represented the total E. coli in the gut. The experiment was replicated five times and a
total of 50 E. coli-fed larvae, 25 broth-fed and 25 unfed larvae were treated for each time,
dose and species. The number of E. coli in each larva was transformed to log(y + 1) and
data were analysed using a three-way analysis of variance (SPSS Inc. 1989-1999) with
species, dose and time as main effects. All two-way interactions were examined.
26
3.6. Survival and development of house fly and stable fly larvae reared
on three different bacterial cultures
This experiment was designed to evaluate the survival of house fly and stable fly
larvae reared on E. coli and other bacterial cultures. Rearing plates were inoculated with
bacterial mixtures and surface-sterilised fly eggs, and survival to pupation and to adult
emergence were assessed.
E, coli was grown on LB agar plates incubated at 37°C while E. brevis and
F. odoratum were grown on nutrient agar plates incubated at 25°C. Bacterial cells of all
species were suspended in sterile distilled water and diluted to an optical density of 0.25
(± 0.02) at 600 nm (Lysyk et al. 1999). Egg yolk medium plates were inoculated with the
following bacterial suspensions: (1) 50 ul of E. brevis and 50 ul of F. odoratum, (2) 100
ul of E. coli, and (3) 33 ul of E. brevis, 33 ul of F. odoratum and 33 ul of E. coli. Three
plates were inoculated for each bacterial combination and for each fly species, for a total
of 18 plates. Initial cell densities were determined by viable counts of the bacterial
suspensions. For each species, 20 surface-sterilised eggs were placed on a moist sterile
filter paper and added to each plate. Egg hatch was determined using an aliquot of 100
surface-sterilised eggs placed on water agar for 72 h. All plates were incubated at 25°C
and a photoperiod of 16:8 (L:D) h. Plates were examined daily and pupae removed with
sterile forceps, rinsed, weighed, and placed on water agar until adult emergence. The
entire experiment was replicated four times. The number of pupae per plate per day was
used to determine the larval development time and survival. The number of flies emerged
per plate per day was used to calculate pupal development time and survival. Pupal
27
weight was also recorded. Data were analysed using analysis of variance to determine if
survival, developmental time of larvae and pupae, and pupal weight varied among
treatments. Means were compared using least significant difference (LSD) (SPSS Inc.
1989-1999).
3.7. Persistence of E. coli during the development of house fly and
stable fly pupae
This experiment was undertaken to determine if E. coli cells acquired during larval
feeding survive through pupation. Larvae were left to feed on E. coli lawns until
pupation. Reared pupae were sampled every two days to determine temporal changes in
E. coli load.
E. coli cells were collected from LB plates and suspended in sterile distilled water.
Egg yolk medium plates were inoculated with 100 ul of this E. coli suspension and
incubated at 37°C overnight. Larvae were reared from egg to third instar on agar medium
using the gnotobiotic procedure. Third instar larvae were aseptically transferred from the
rearing plates to the E. coli lawns at a density of about 40 maggots per plate. Plates were
incubated at 25°C with a photoperiod of 16:8 (L:D) h until pupation. Pupae were
removed daily with sterile forceps, rinsed in distilled water, washed in 3 changes of
0.26% sodium hypochlorite for a total of 15 minutes and rinsed in 3 changes of sterile
distilled water. The surface-sterilised pupae were placed on water agar and incubated at
25°C for 1, 3, 5 or 6 days for house flies and 7 days for stable flies. Individual pupae
were homogenised with a sterile plastic pestle in 1 ml PBS and centrifuged at 800 x g for
28
two minutes. E. coli populations were quantified as previously described. A total of 200
pupae were processed for each species. 50 per time interval. The number of E. coli CFU
per pupa was transformed to log(y + 1). Logistic regression was used to estimate the
change in proportion of infected pupae. Relationship between E. coli load and time was
described using quadratic regressions for each species.
3.8. E. coli contamination of teneral adult house flies and stable flies
This experiment was conducted to determine if E. coli cells present in the pupa
contaminated the emerging adult, and if the contamination was internal, external or both.
Pupae were reared and prepared as described earlier, and incubated on water agar at 25°C
until the day of emergence. Adult flies less than 15 minutes old were assigned to one of
two groups: newly emerged flies and rinsed flies. Newly emerged flies were
homogenised without further treatment and were used to determine the total
contamination of the fly, both internal and external. Rinsed flies were treated prior to
homogenisation to remove external bacteria and were used to differentiate between
external and internal contamination. Newly emerged flies were transferred with sterile
insect handling forceps to a sterile 1.5 ml microfuge tube and homogenised in 100 ul of
PBS with a sterile plastic pestle, centrifuged at 800 x g for two minutes, and the
supernatant plated onto MacConkey agar. Flies rinsed before homogenisation were
transferred to a sterile 1.5 ml microfuge tube with 100 ul PBS, vortexed for 30 seconds,
aseptically transferred to another tube containing 100 ul PBS and homogenised as
previously described. The rinse solution and the homogenised rinsed flies were plated on
29
separate MacConkey agar plates. The empty pupal case of each fly was homogenised in
1 ml of PBS and serial dilutions were plated onto MacConkey agar. A total of 50 newly
emerged flies and 50 rinsed flies were processed for each species. Plates labelled "too
numerous to count" were assigned the maximum number of colonies counted on plates of
the same group: 2 000 CFU per newly emerged fly, 500 CFU/100 ul of rinse solution,
and 700 CFU per rinsed fly. Student's t-tests were used to determine differences between
minimal mean E. coli populations between species. The correlation between the
contamination of flies and pupal cases was determined using Spearman's rank
correlation.
30
CHAPTER 4. RESULTS
4.1. Persistence of E. coli in larval guts of house flies and stable flies
House fly and stable fly larvae were homogenised following ingestion of an E. coli
suspension to assess the persistence of the bacterium in the larval gut. The experiment
was conducted over a short term period (zero to five hours post-ingestion) and a long
term period (zero to 48 h post-ingestion).
4.1.1. Short term persistence
Larvae of both species were fed an E. coli suspension, but not all larval guts were
infected with the bacterium after 20 minutes of feeding. House fly and stable fly larvae
were fed bacterial suspensions containing an average of 3.2 ± 2.7 x 10 1 0 (n = 5) and 2.6 ±
1.8 x 10 1 0 (n = 5) E. coli CFU/ml, respectively. The amount of bacteria fed to the larvae
did not vary significantly between species (t - 0.18; df = 8; P = 0.863).
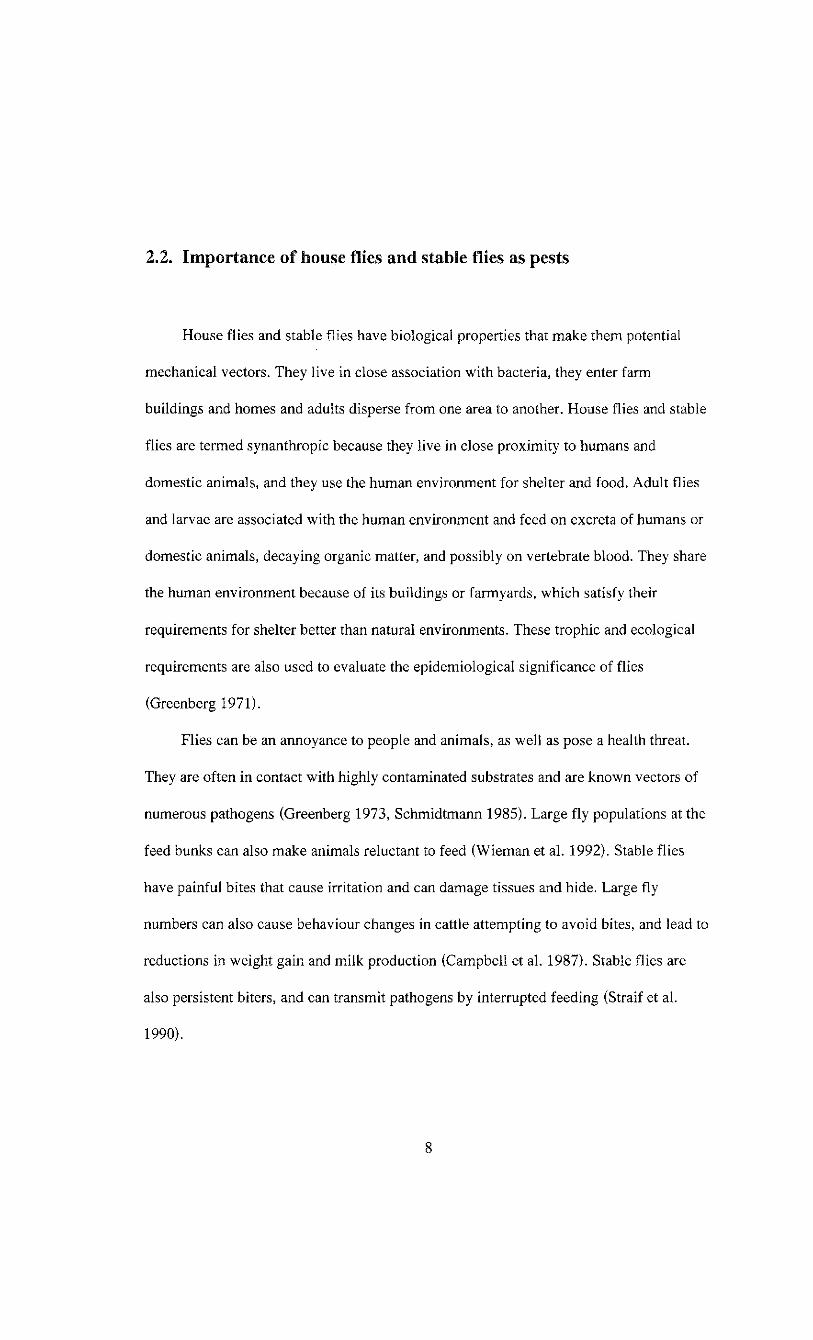
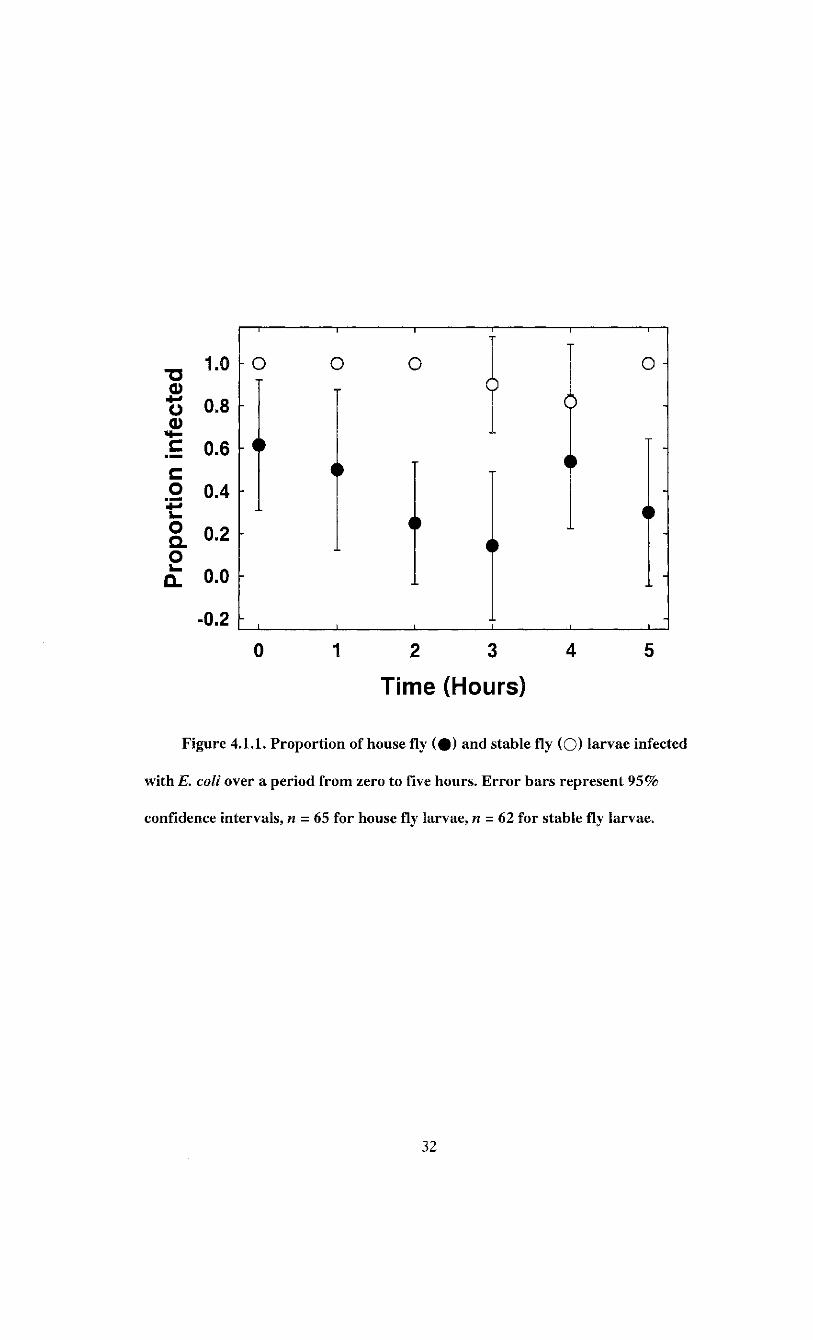
E. coli was detected in 41.5 ± 6.2% of house fly (n = 65) larvae and 95.2 ± 2.8% of
stable fly (n = 62) larvae fed bacteria. The incidence of infected house fly larvae over five
hours ranged from 14.3% to 61.5%, and that of stable fly larvae ranged from 81.8% to
100% (Figure 4.1.1). Logistic regression indicated the proportion of infected larvae was
relatively constant over time, but varied between species and the change across time was
consistent between species (Table 4.1.1).
The E. coli load of infected house fly (n = 27) larvae was 6.3 ± 1.3 x 10 4 CFU
31
1 2 3 4
Time (Hours)
Figure 4.1.1. Proportion of house fly ( # ) and stable fly (O) larvae infected
with E. coli over a period from zero to five hours. Error bars represent 95%
confidence intervals, n - 65 for house fly larvae, n = 62 for stable fly larvae.
32
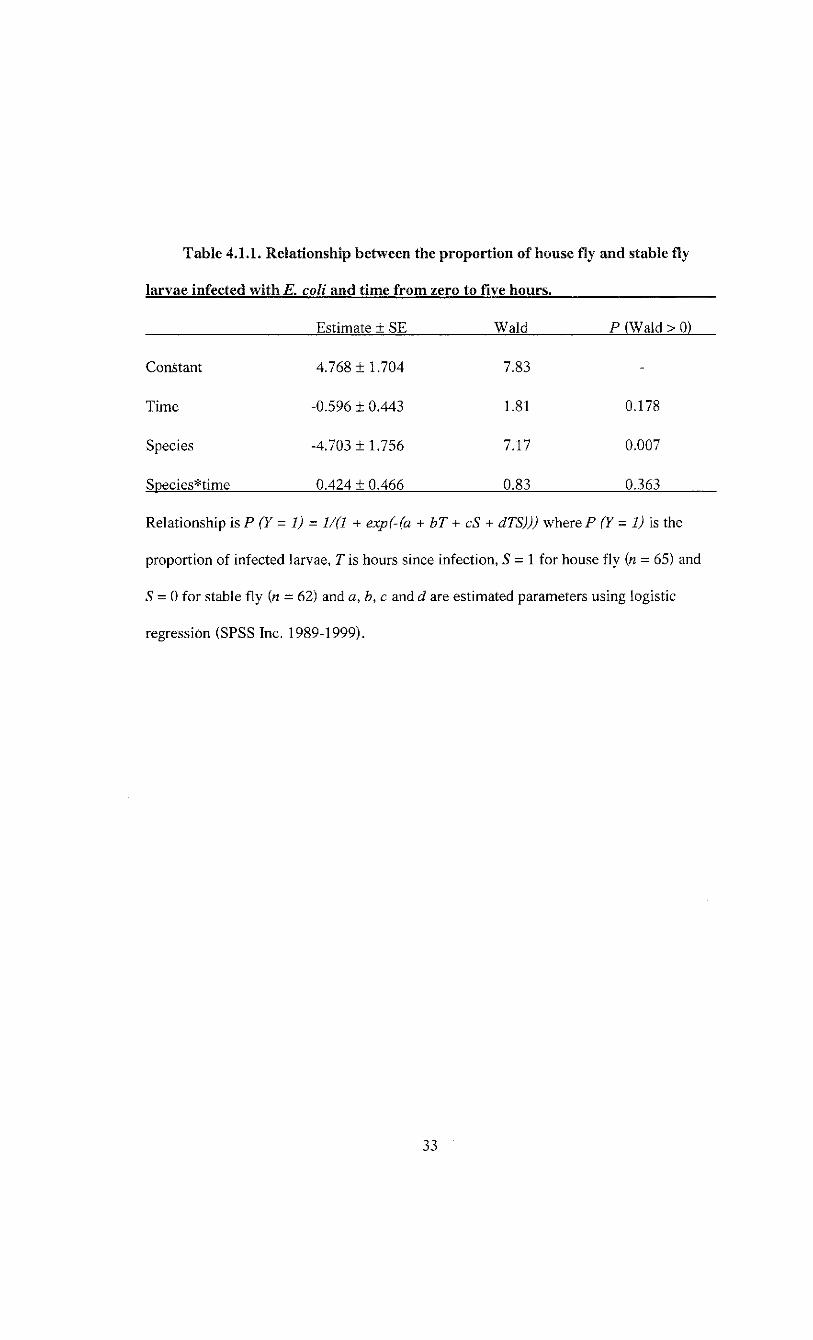
Table 4.1.1. Relationship between the proportion of house fly and stable fly
larvae infected with E. coli and time from zero to five hours.
Estimate ± SE Wald P (Wald > 0)
Constant 4.768 ± 1.704 7.83
Time -0.596 ± 0.443 1.81 0.178
Species -4.703 ± 1.756 7.17 0.007
Species*time 0.424 ± 0.466 0.83 0.363
Relationship isP (Y= 1) = 1/(1 + exp(-(a + bT + cS + dTS))) where P (Y= 1) is the
proportion of infected larvae, T is hours since infection, S = 1 for house fly (n = 65) and
S = 0 for stable fly (n = 62) and a, b, c and d are estimated parameters using logistic
regression (SPSS Inc. 1989-1999).
33

per larva lower than infected stable fly (n = 59) larvae. Larvae randomly selected from
the rearing plates and used as negative controls never tested positive for E. coli (Table
4.1.2). The surface sterilisation of house fly larvae was efficient, as indicated by the
absence of E. coli CFU in the sterilisation controls (Table 4.1.2). However, a small
number of E. coli CFU were detected on the sterilisation controls of the stable fly larvae
(Table 4.1.2). This surface contamination of the larvae was negligible, representing 0.3%
or less of the E. coli population of tested larvae.
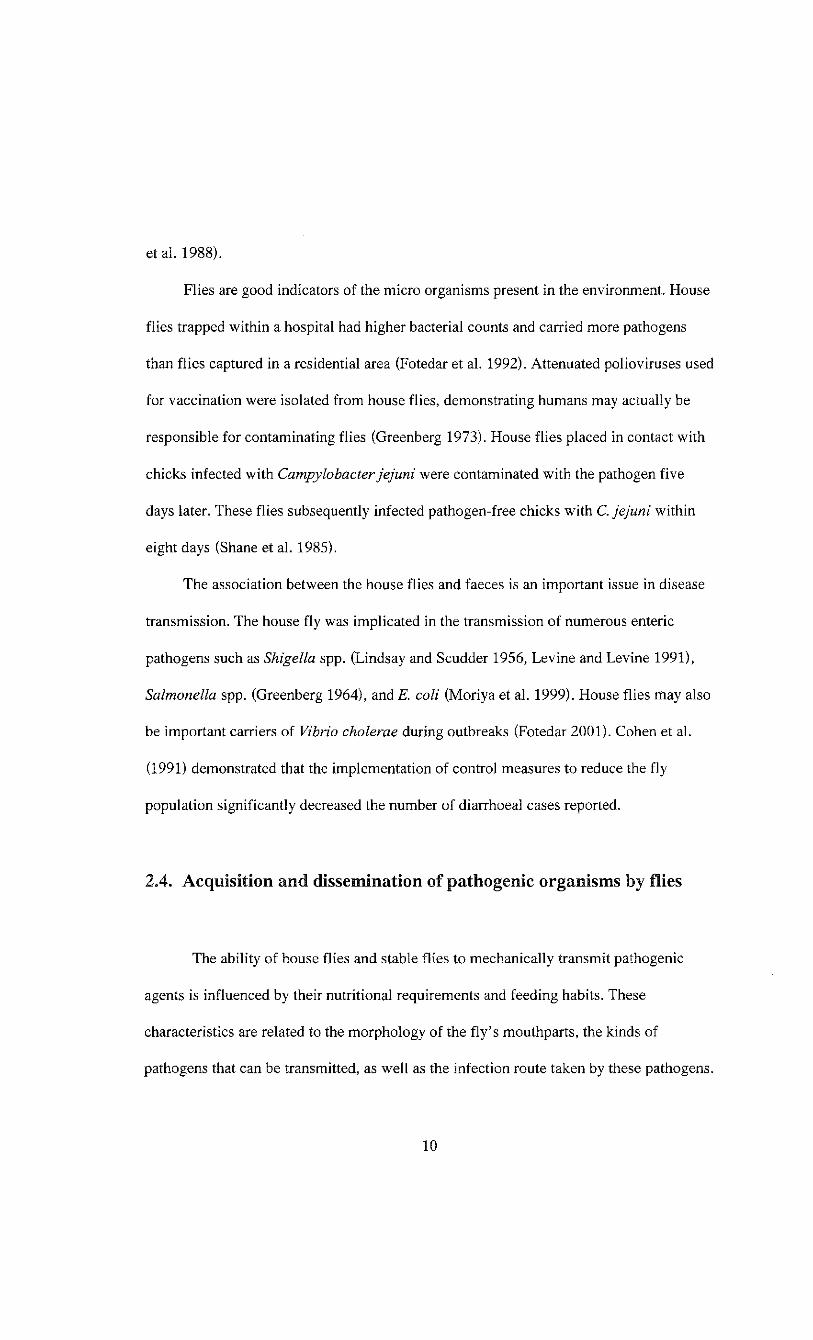
Analysis of variance indicated that E. coli load varied between species and time as
evidenced by the significant species and time effects (Table 4.1.3). The rate of change in
bacterial load over time was similar between species as evidenced by the non-significant
species*time effect (Table 4.1.3). The regression model was therefore established as
log(CFU/larva + 1) = 4.852 - 0.097*r- 1.260*5
where T is hours post infection. S = 1 for house fly and S = 0 for stable fly (F = 51.63;
df = 2, 83; P < 0.0001). The final model indicated that E. coli load was 1.260 ±0.128
log(CFU/larva + 1) lower in house fly larvae, but that it declined by 0.097 + 0.035
log(CFU/larva + 1) per hour for both species (Figure 4.1.2). The model accounted for
55.4% of the variation in bacterial load.
4.1.2. Long term persistence
House fly and stable fly larvae were fed an E. coli solution but not all larval guts
were infected with the bacterium after ingestion. The concentration of E. coli fed to
larvae averaged 5.8 ± 0.7 x 10⁸ (n = 4) CFU/ml for house fly larvae and 5.5 ± 5.4 x 10 1 0
34
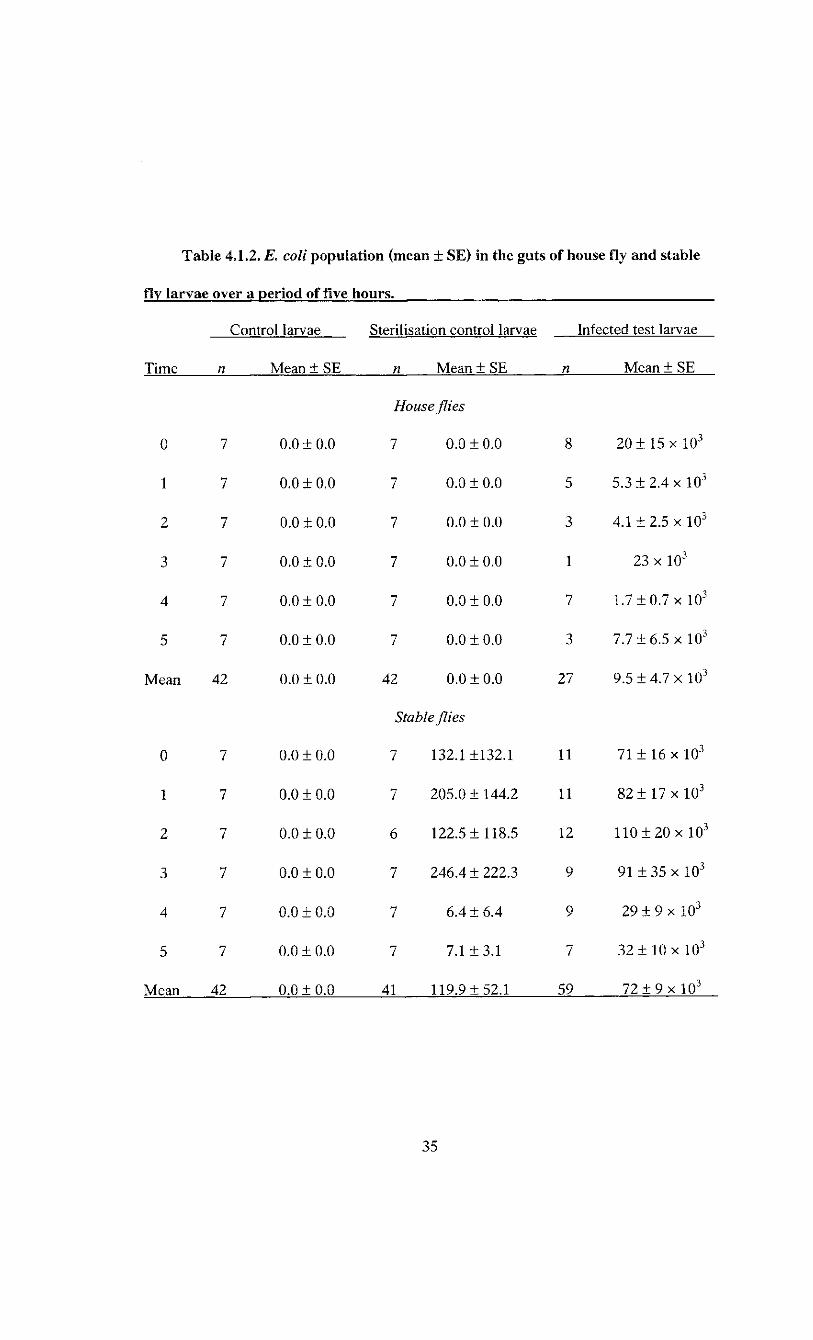
Table 4.1.2. E. coli population (mean ± SE) in the guts of house fly and stable
fly larvae over a period of five hours.
Control larvae Sterilisation control larvae Infected test larvae
Time n Mean ± SE n Mean ± SE n Mean ± SE
0 7 0.0 ±0.0
House flies
7 0.0 ±0.0 8 2 0 ± 15 x 10 3
1 7 0.0 ±0.0 7 0.0 ±0.0 5 5.3 ± 2.4 x 10 3
2 7 0.0 ±0.0 7 0.0 ±0.0 3 4.1 ±2.5 x 10 3
3 7 0.0 ±0.0 7 0.0 + 0.0 1 23 x 10 3
4 7 0.0 ±0.0 7 0.0 ±0.0 7 1.7 ± 0.7 x 10 3
5 7 0.0 ±0.0 7 0.0 ±0.0 3 7.7 ±6.5 x 10 3
Mean 42 0.0 ±0.0 42 0.0 ±0.0 27 9.5 ± 4.7 x 10 3
0 7 0.0 ±0.0
Stable flies
7 132.1 ±132.1 11 71 ± 16 x 10 3
1 7 0.0 ±0.0 7 205.0 ±144.2 11 8 2 ± 1 7 x 10 3
2 7 0.0 ±0.0 6 122.5 ±118.5 12 110 ± 2 0 x 10 3
3 7 0.0 ±0.0 7 246.4 ± 222.3 9 91 ± 35 x 10 3
4 7 0.0 ±0.0 7 6.4 ±6.4 9 2 9 ± 9 x 10 3
5 7 0.0 ±0.0 7 7.1 ±3.1 7 3 2 ± 10 x 10 3
Mean 42 0.0 ± 0.0 41 119.9 ±52.1 59 7 2 ± 9 x 10 3
35

Table 4.1.3. Variation in E. coli load between the larval guts of house flies and
stable flies over a period of five hours.
Source df SS MS F P(F)
Time 5 3.532 0.706 2.42 0.043
Species 1 6.556 6.556 22.48 < 0.0001
Species*time 5 1.484 0.297 1.02 0.414
Error 74 21.585 0.292
36
J I I I I L
0 1 2 3 4 5
Time (Hours)
Figure 4.1.2. Mean E. coli population in house fly ( # ) and stable fly (O) larval
guts over a period of five hours. Error bars represent SE of the mean, n = 27 for
house fly larvae, n - 59 for stable fly larvae. Lines represent the fitted model for
house fly larvae (—) and stable fly larvae ( ). Point for house fly at 3 h
represents 1 larva, rest represent 3-12 larvae.
37
(n = 5) CFU/ml for stable fly larvae. On a log scale, the means were 8.757 + 0.050 and
9.413 ± 0.543 CFU/ml for house fly larvae and stable fly larvae respectively. There was
no significant difference in the amount of bacteria fed to both species (t = -1.064; df = 7;
P = 0.323).
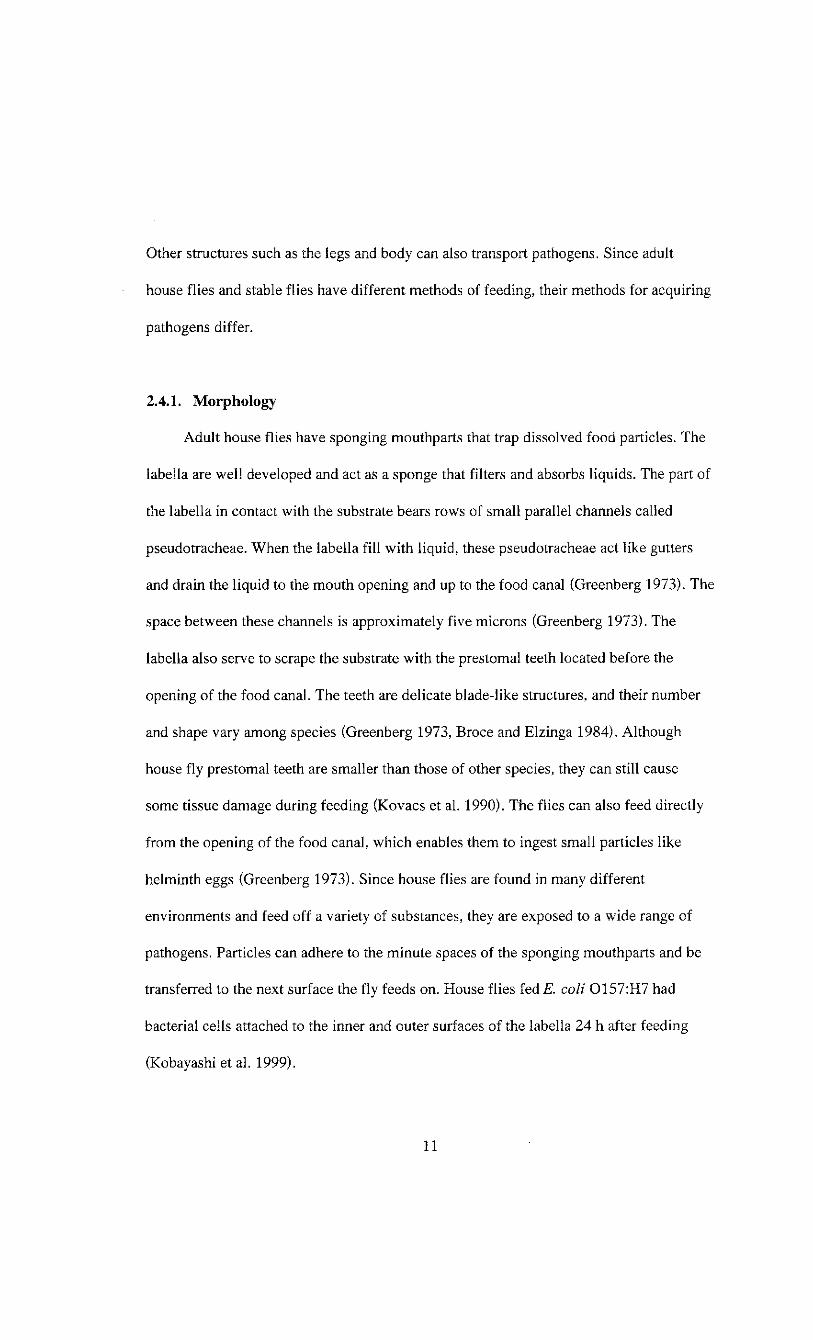
On average. 90.2 ± 3.1% of house fly (n = 92) larvae and 92.0 ± 2.4% of stable fly
(n = 125) larvae were positive for is. coli. The proportion of infected house fly larvae
varied significantly over time {tf = 7.94; df = 2; P - 0.019) but not in a linear trend
(Figure 4.1.3). The proportion of infected house fly larvae decreased slightly from 90.9 ±
5.1% to 81.8 ± 7.0% after 24 h, then increased to 100% infection at 48 h. Stable fly
larvae demonstrated a constant linear increase in the proportion infected from 85.4 ±
5.6% after ingestion to 100% at 48 h, as indicated by the significant logistic regression
(Table 4.1.4).
E. coli was not detected in the control larvae for either species (Table 4.1.5),
however, it was found on the surface of larvae used to determine the efficiency of surface
sterilisation. This amount was negligible for both species, representing on average less
than 0.5% of the E. coli load found in fed larvae of either species (Table 4.1.5). E. coli
infected house fly larvae (n - 83) harboured an average of 4.8 ± 0.8 x 10 4 CFU per larva,
ranging from 390 to 3.3 x 10 5 CFU per larva. The E. coli load of infected stable fly larvae
(n = 115) averaged 7.8 ± 0.8 x 10 4 CFU per larva, ranging between 3.0 x 10 3 and 3.0 x
10 5 CFU per larva. E. coli cells were detected on the surface of the water agar where
larvae were reared before sampling, but no quantification was performed.
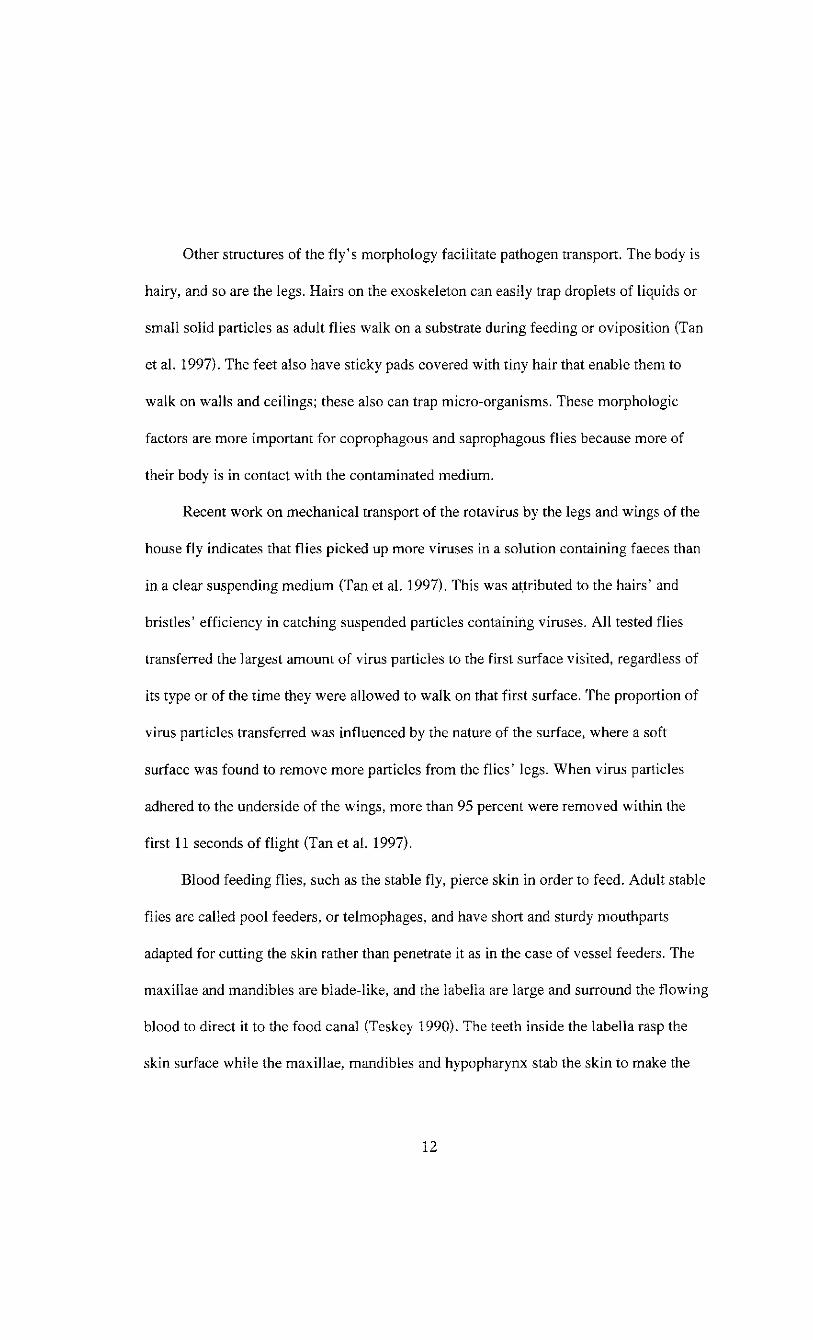
Analysis of variance indicated the changes in E. coli over time were not consistent
between species as indicated by the significant species*time interaction (Table 4.1.6).
38
0 24 48
Time (Hours)
Figure 4.1.3. Proportion of house fly ( # ) and stable fly (O) larvae infected
with E. coli over a period of 48 hours. Error bars represent 95% confidence
intervals, n = 92 for house fly larvae, n - 125 for stable fly larvae.
39
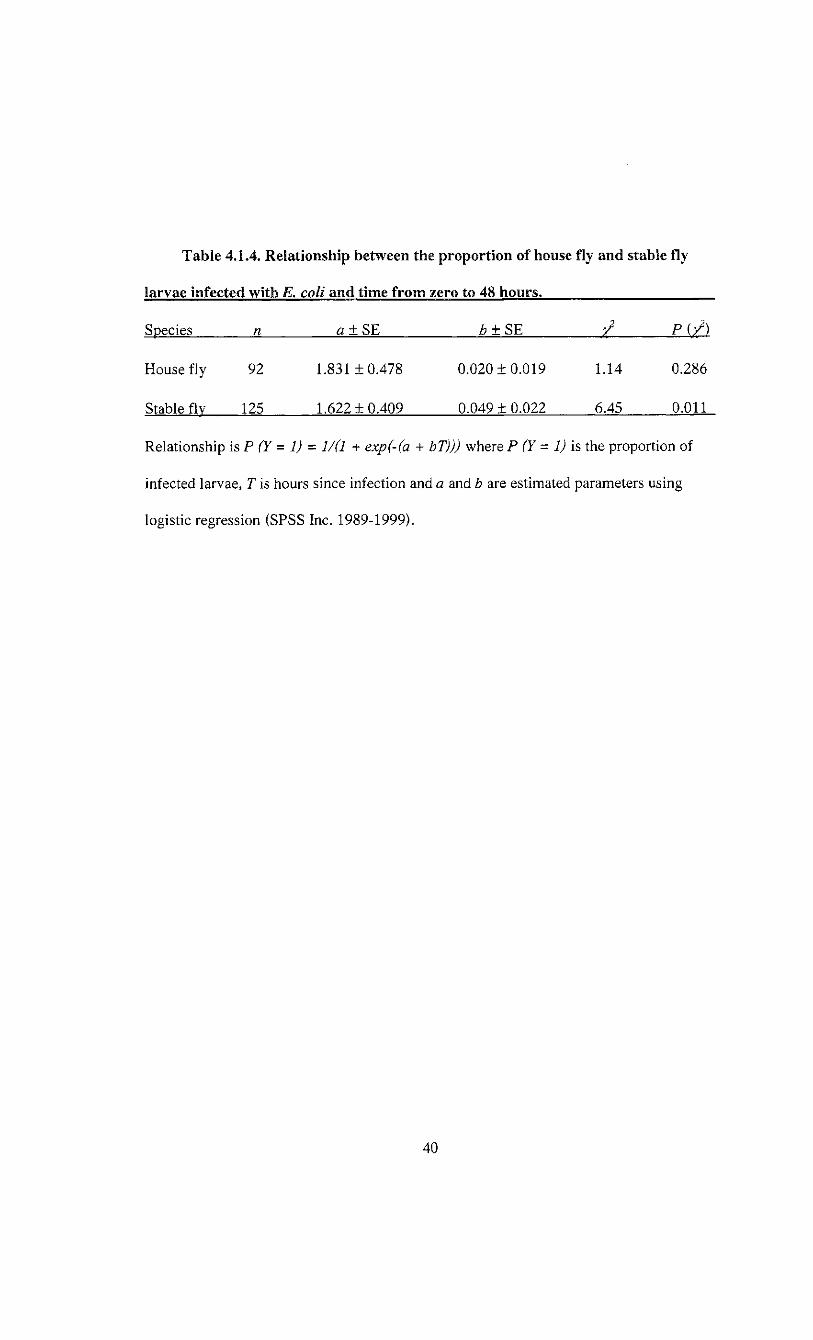
Table 4.1.4. Relationship between the proportion of house fly and stable fly
larvae infected with E. coli and time from zero to 48 hours.
Species n a±SE b±SE
House fly 92 1.831 ±0.478 0.020 ±0.019 1.14 0.286
Stable flv 125 1.622 ±0.409 0.049 ± 0.022 6.45 0.011
Relationship is P (Y = 1) = 1/(1 + exp(-(a + bT))j where P (Y= 1) is the proportion of
infected larvae, T is hours since infection and a and b are estimated parameters using
logistic regression (SPSS Inc. 1989-1999).
40
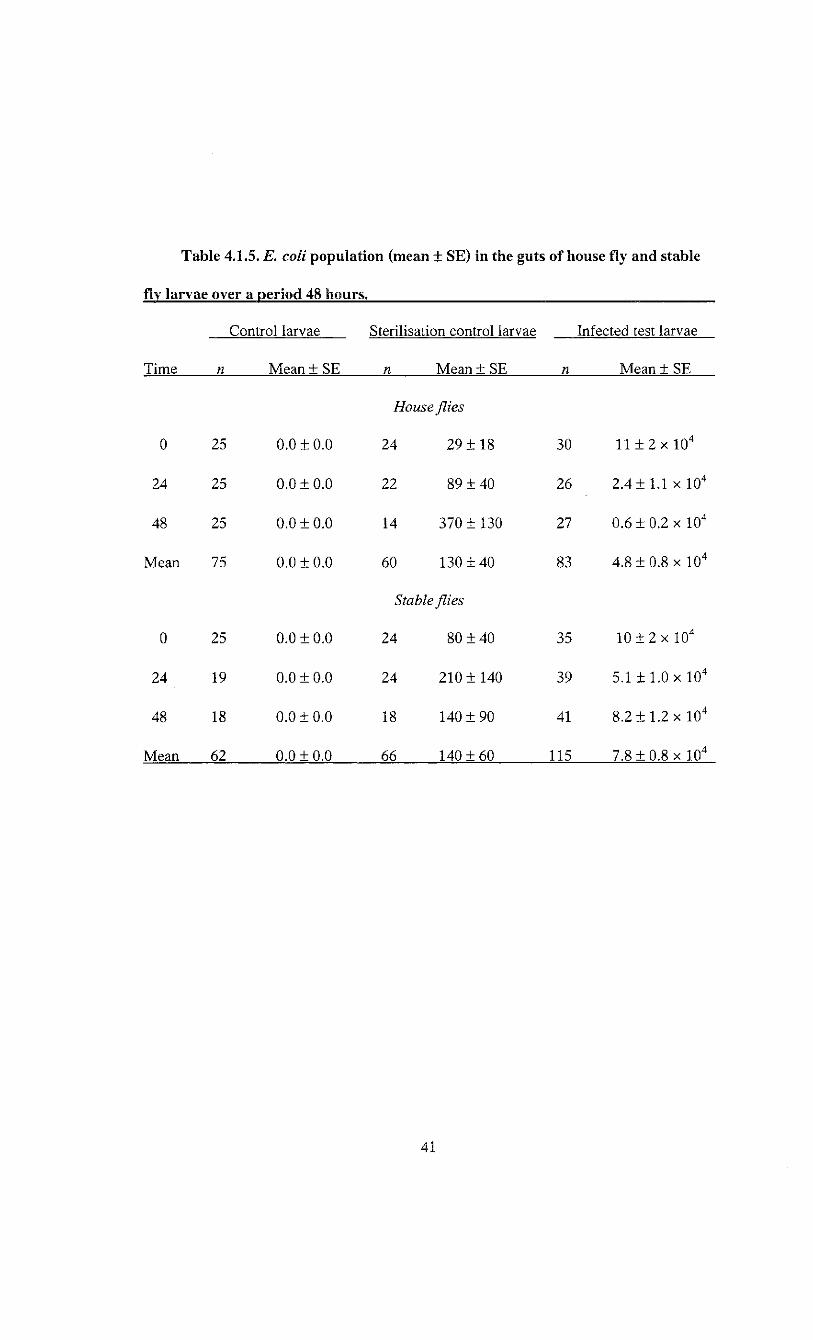
Table 4.1.5. E. coli population (mean ± SE) in the guts of house fly and stable
fly larvae over a period 48 hours.
Control larvae Sterilisation control larvae Infected test larvae
Time n Mean ± SE n Mean ± SE n Mean ± SE
House flies
0 25 0.0 ±0.0 24 29 ± 1 8 30 11 ± 2 x 10 4
24 25 0.0 ±0.0 22 89 ±40 26 2.4 ± 1.1 x 10 4
48 25 0.0 ±0.0 14 370 ± 130 27 0.6 ± 0.2 x 10 4
Mean 75 0.0 ±0.0 60 130 ±40 83 4.8 ± 0.8 x 10 4
Stable flies
0 25 0.0 ±0.0 24 80 ±40 35 1 0 ± 2 x 10 4
24 19 0.0 ±0.0 24 210± 140 39 5.1 ± 1.0 x 10 4
48 18 0.0 ±0.0 18 140 ± 90 41 8.2 ± 1.2 x 10 4
Mean 62 0.0 ±0.0 66 140 ± 60 115 7.8 ± 0.8 x 10 4
41
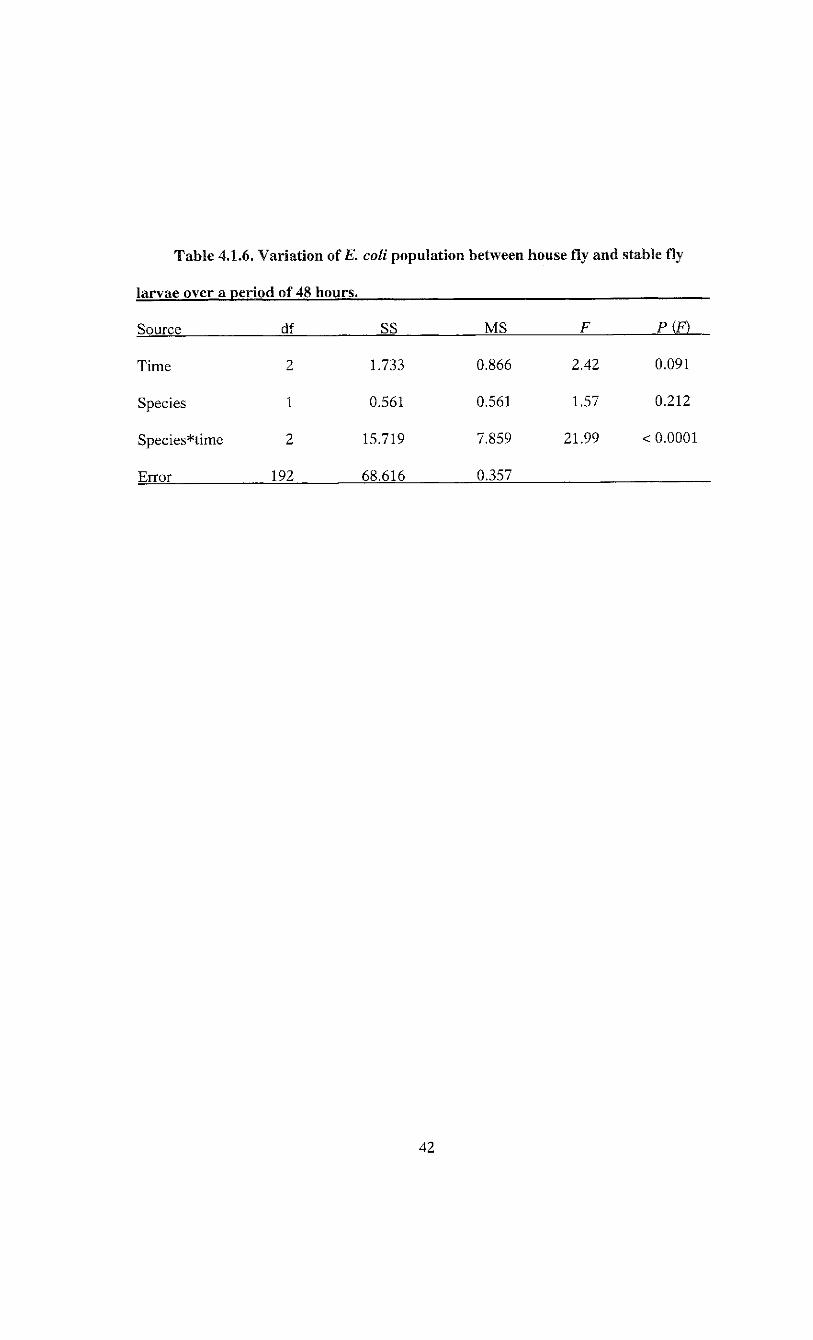
Table 4.1.6. Variation of E. coli population between house fly and stable fly
larvae over a period of 48 hours.
Source df SS MS F P(F)
Time 2 1.733 0.866 2.42 0.091
Species 1 0.561 0.561 1.57 0.212
Species*time 2 15.719 7.859 21.99 < 0.0001
Error 192 68.616 0.357
42
The regression model was
43
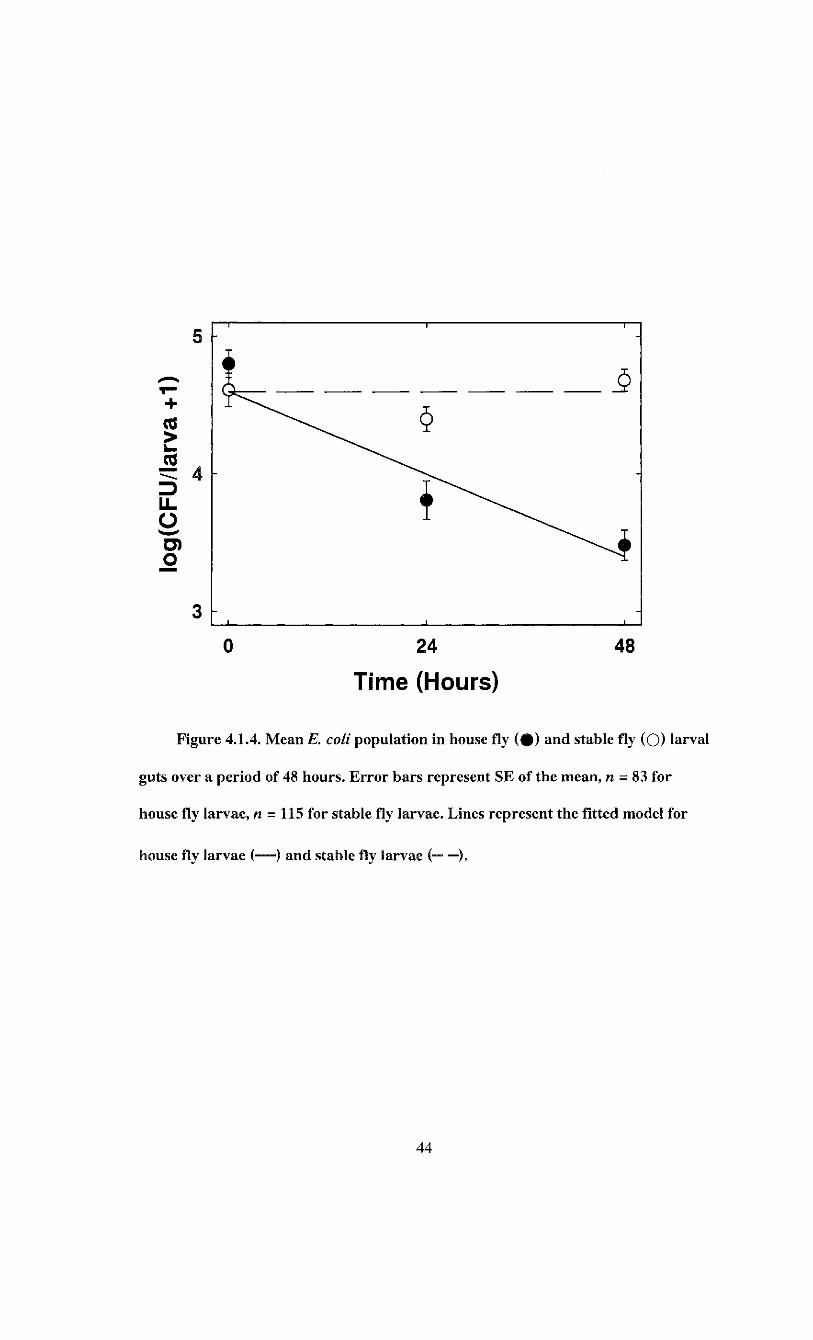
log(CFU/larva + 1) = 4.598 - 0.025*7*5
where T is hours post infection, S = 1 for house fly and S = 0 for stable fly (F = 99.73;
df = 1, 196; P < 0.0001). This indicates a reduction in£. coli population of 0.025 ± 0.003
log(CFU/larva + 1) per hour for house fly larvae and no reduction in E. coli population
for stable fly larvae (Figure 4.1.4). The model accounted for 33.7% of the variation in
bacterial load.
4.2. Dose-dependent persistence of E. coli in house fly and stable fly
larval guts
The effect of the amount of E. coli fed to larvae on the persistence of the bacterium
in the larval gut was evaluated. Larvae of both species were fed a low or a high dose
suspension of E. coli prior to homogenisation.
The high dose suspension fed to house fly and stable fly larvae averaged 5.4 ± 0.8 x
10 8 and 8.2 ± 0.7 x 10 8 E. coli CFU/ml, respectively. The low dose suspension was a
1:10 000 dilution of the high dose suspension. The amount of E. coli fed to house fly
larvae averaged 0.197 ± 0.077 log(CFU/larva + 1) lower than the amount fed to stable fly
larvae (t = -2.56; df = 8; P = 0.034).
On average, 71.9 ± 4.8% of house fly (n - 89) larvae fed a low dose suspension
were infected with E. coli, the proportion ranging from 57.1 ± 7.1% (n = 49) after
ingestion to 90.0 ± 4.8% (n = 40) after 48 h. All house fly (n = 72) larvae fed a high dose
suspension were infected at zero (n - 32) and 48 (n = 40) h. The proportion of infected
0 24 48
Time (Hours)
Figure 4.1.4. Mean E. coli population in house fly ( # ) and stable fly (O) larval
guts over a period of 48 hours. Error bars represent SE of the mean, n = 83 for
house fly larvae, n = 115 for stable fly larvae. Lines represent the fitted model for
house fly larvae (—) and stable fly larvae ( ).
44
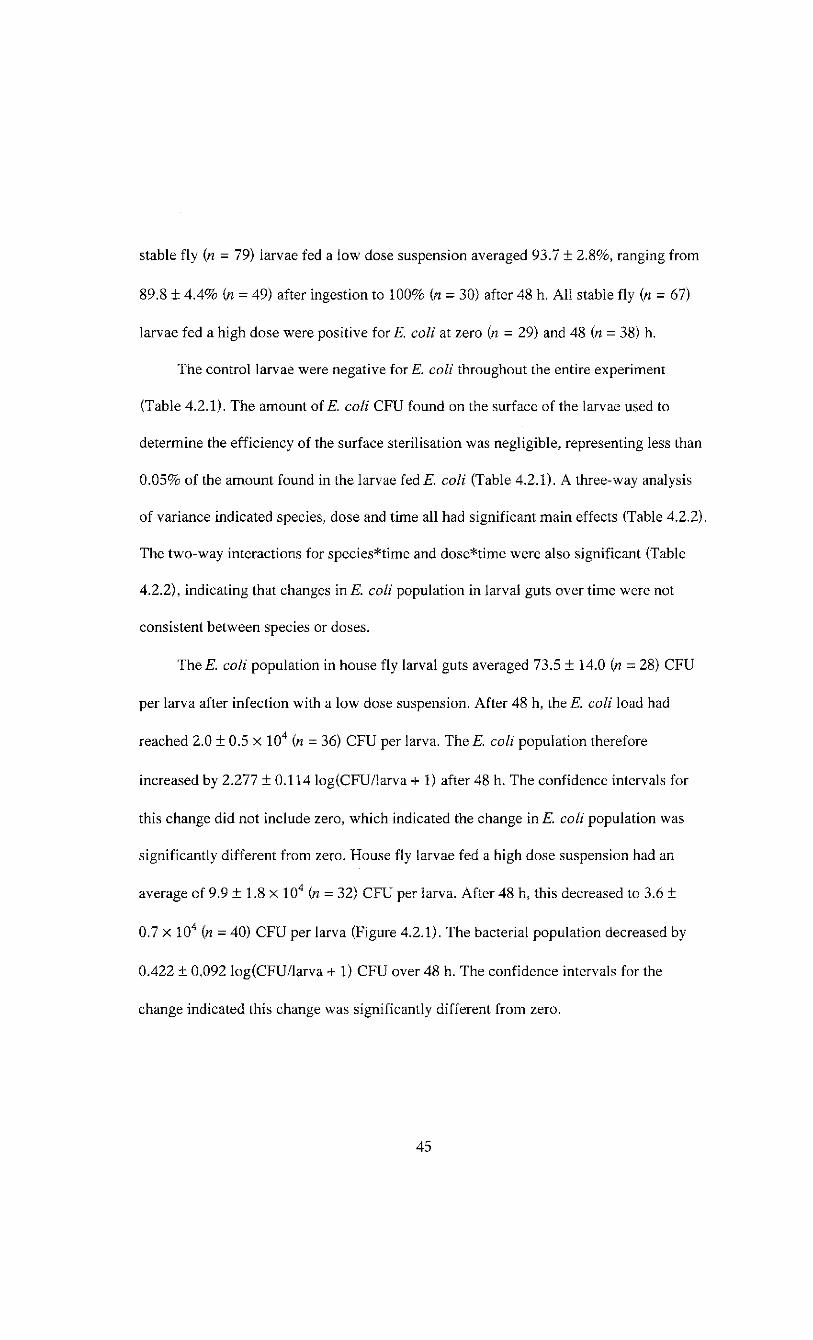
stable fly (n = 79) larvae fed a low dose suspension averaged 93.7 + 2.8%, ranging from
89.8 ± 4.4% (n = 49) after ingestion to 100% in = 30) after 48 h. All stable fly (n = 67)
larvae fed a high dose were positive for E. coli at zero (n = 29) and 48 (n = 38) h.
The control larvae were negative for E. coli throughout the entire experiment
(Table 4.2.1). The amount of E. coli CFU found on the surface of the larvae used to
determine the efficiency of the surface sterilisation was negligible, representing less than
0.05% of the amount found in the larvae fed E. coli (Table 4.2.1). A three-way analysis
of variance indicated species, dose and time all had significant main effects (Table 4.2.2).
The two-way interactions for species*time and dose*time were also significant (Table
4.2.2), indicating that changes in E. coli population in larval guts over time were not
consistent between species or doses.
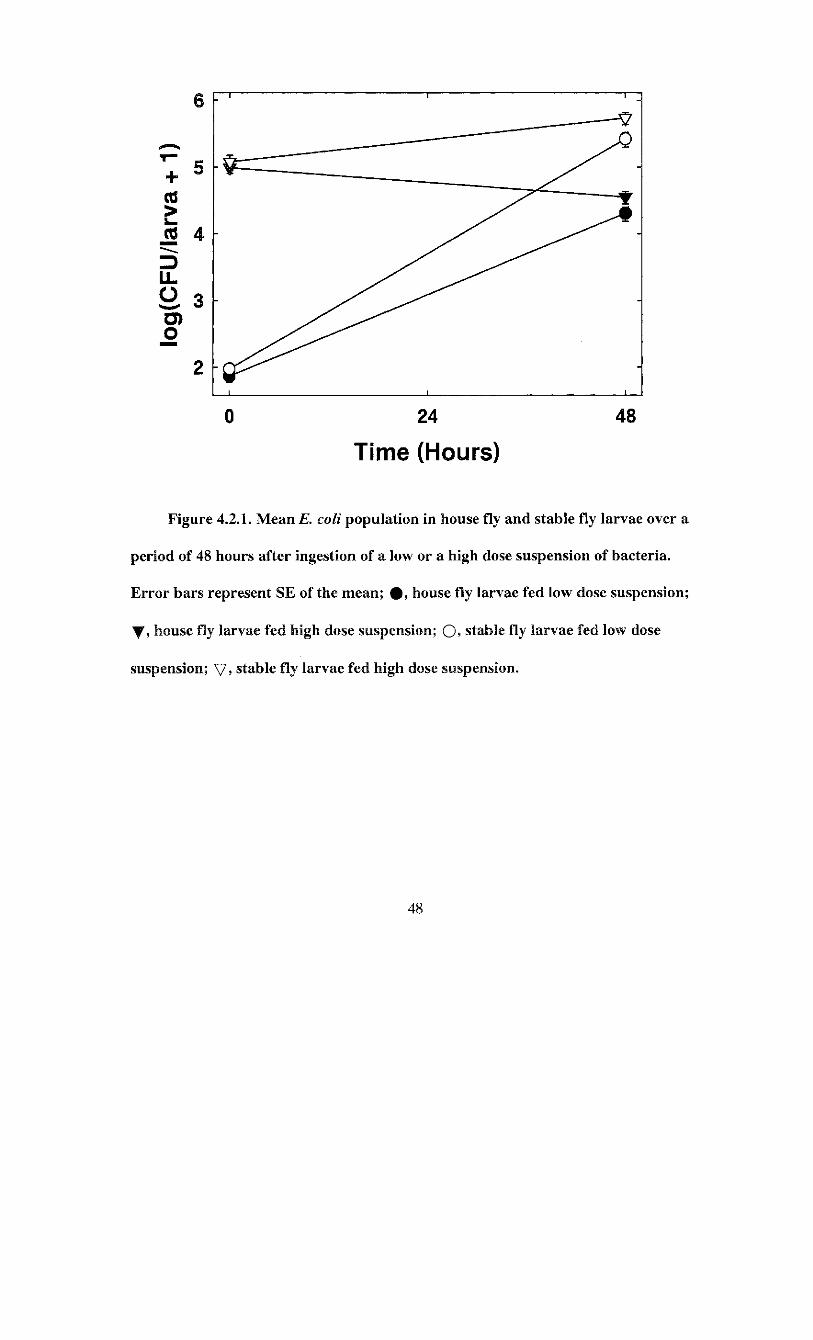
The Is. coli population in house fly larval guts averaged 73.5 ± 14.0 (n = 28) CFU
per larva after infection with a low dose suspension. After 48 h, the E. coli load had
reached 2.0 ± 0.5 x 10 4 (n = 36) CFU per larva. The E. coli population therefore
increased by 2.277 ± 0.114 log(CFU/larva + 1) after 48 h. The confidence intervals for
this change did not include zero, which indicated the change in E. coli population was
significantly different from zero. House fly larvae fed a high dose suspension had an
average of 9.9 ± 1.8 x 10 4 (n = 32) CFU per larva. After 48 h, this decreased to 3.6 ±
0.7 x 10 4 (n = 40) CFU per larva (Figure 4.2.1). The bacterial population decreased by
0.422 ± 0.092 log(CFU/larva + 1) CFU over 48 h. The confidence intervals for the
change indicated this change was significantly different from zero.
45
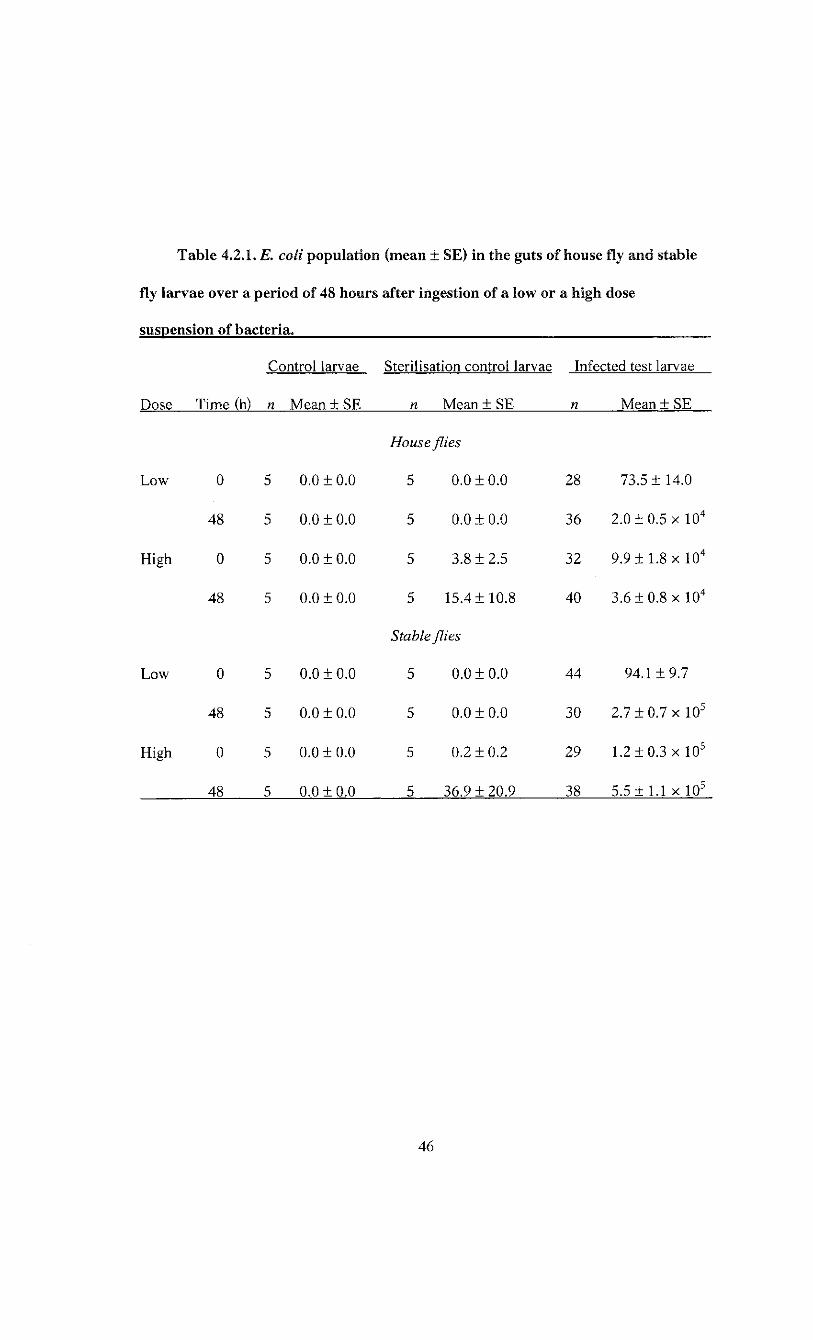
Table 4.2.1. E. coli population (mean ± SE) in the guts of house fly and stable
fly larvae over a period of 48 hours after ingestion of a low or a high dose
suspension of bacteria.
Control larvae Sterilisation control larvae Infected test larvae
Dose Time (h) n Mean ± SE n Mean ± SE n Mean ± SE
House flies
Low 0 5 0.0 ±0.0 5 0.0 ±0.0 28 73.5 ± 14.0
48 5 0.0 ±0.0 5 0.0 ±0.0 36 2.0 ±0.5 x 10 4
High 0 5 0.0 ± 0.0 5 3.8 ±2.5 32 9 . 9 ± 1 . 8 x l 0 4
48 5 0.0 ±0.0 5 15.4 ±10.8 40 3.6 ± 0.8 x 10 4
Stable flies
Low 0 5 0.0 ±0.0 5 0.0 ±0.0 44 94.1 ±9.7
48 5 0.0 ±0.0 5 0.0 ±0.0 30 2.7 ±0.7 x 10 5
High 0 5 0.0 ±0.0 5 0.2 ±0.2 29 1.2 ±0.3 x 10 5
48 5 0.0 ±0.0 5 36.9 ±20.9 38 5.5 ± 1.1 x 10 5
46
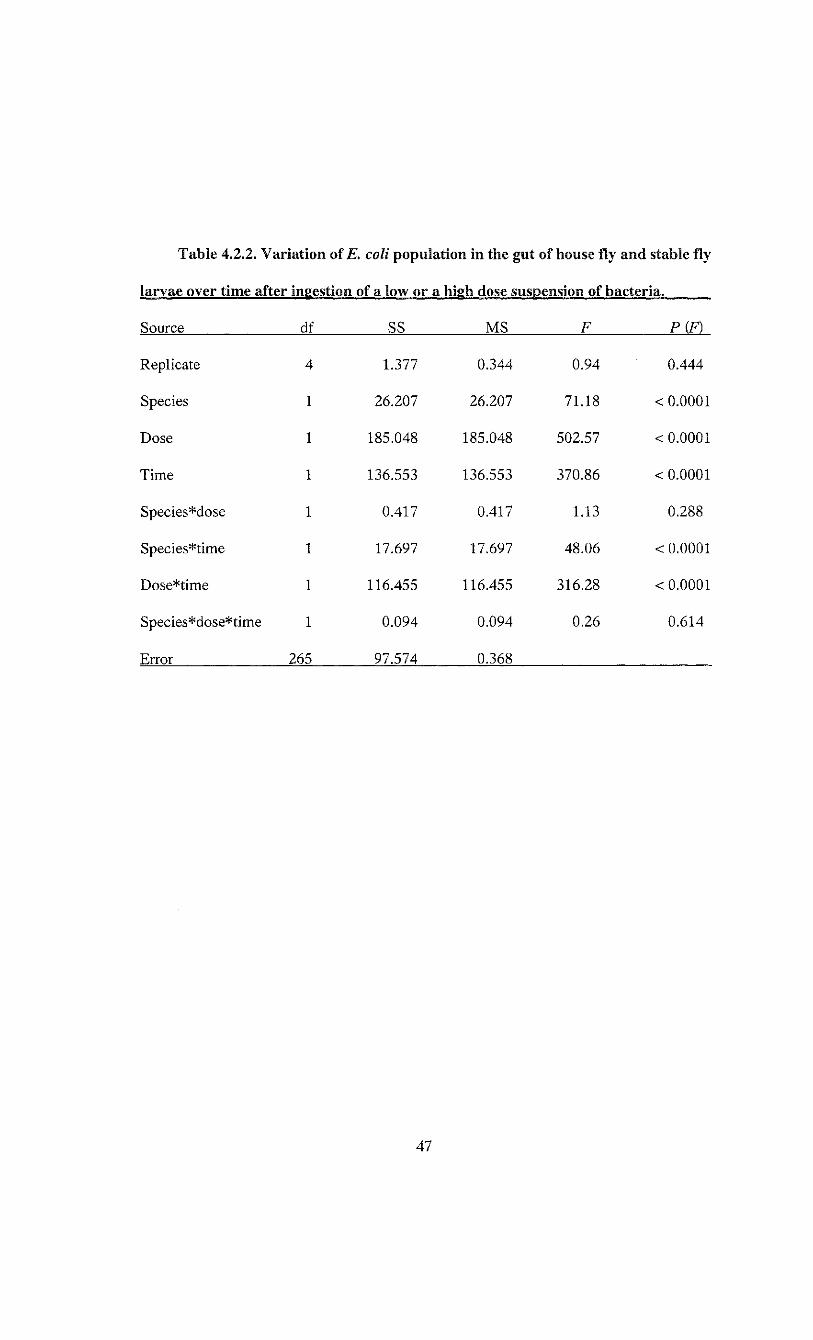
Table 4.2.2. Variation of E. coli population in the gut of house fly and stable fly
larvae over time after ingestion of a low or a high dose suspension of bacteria.
Source df SS MS F P(F)
Replicate 4 1.377 0.344 0.94 0.444
Species 1 26.207 26.207 71.18 < 0.0001
Dose 1 185.048 185.048 502.57 < 0.0001
Time 1 136.553 136.553 370.86 < 0.0001
Species*dose 1 0.417 0.417 1.13 0.288
Species*time 1 17.697 17.697 48.06 < 0.0001
Dose*time 1 116.455 116.455 316.28 < 0.0001
Species*dose*time 1 0.094 0.094 0.26 0.614
Error 265 97.574 0.368
47
0 24
Time (Hours) 48
Figure 4.2.1. Mean E. coli population in house fly and stable fly larvae over a
period of 48 hours after ingestion of a low or a high dose suspension of bacteria.
Error bars represent SE of the mean; # . house fly larvae fed low dose suspension;
y , house fly larvae fed high dose suspension; 0» stable fly larvae fed low dose
suspension; V , stable fly larvae fed high dose suspension.
48
Stable fly larvae E. coli load following infection with a low dose suspension
averaged 94.1 ± 9.7 (n = 44) CFU per larva, and increased to 2.7 ± 0.7 x 10 5 (n = 30) E.
coli CFU per larva after 48 h. This increase of 3.248 ± 0.095 log(CFU/larva + 1) CFU per
larva over 48 h was significantly different from zero as indicated by the confidence
intervals not overlapping zero. When a high dose suspension of E. coli was fed to stable
fly larvae, the gut population averag ed 1.2 ± 0.3 x 10 5 (n = 29) and 5.5 ± 1.1 x 10 5 (n =
38) E. coli CFU per larva immediately after infection and 48 h later, respectively (Figure
4.2.1). The increase was 0.659 ± 0.115 log(CFU/larva + 1). The confidence intervals did
not include zero, which indicates this change was significant.
4.3. Survival and development of house fly and stable fly larvae reared
on three different bacterial cultures
Rearing plates were inoculated with an initial average dose of 2.8 ± 0.4 x 10 , 8.0 ±
7 8
2.2 x 10 and 1.6 ± 1.2 x 10 CFU/ml for E. coli, E. brevis and F. odoratum. respectively.
Egg hatch for house fly eggs averaged 74.5 ± 4.2% and 62.8 ± 7.2% for stable fly eggs.
4.3.1. Larval survival
The proportion of larvae to reach pupation when reared on different cultures was
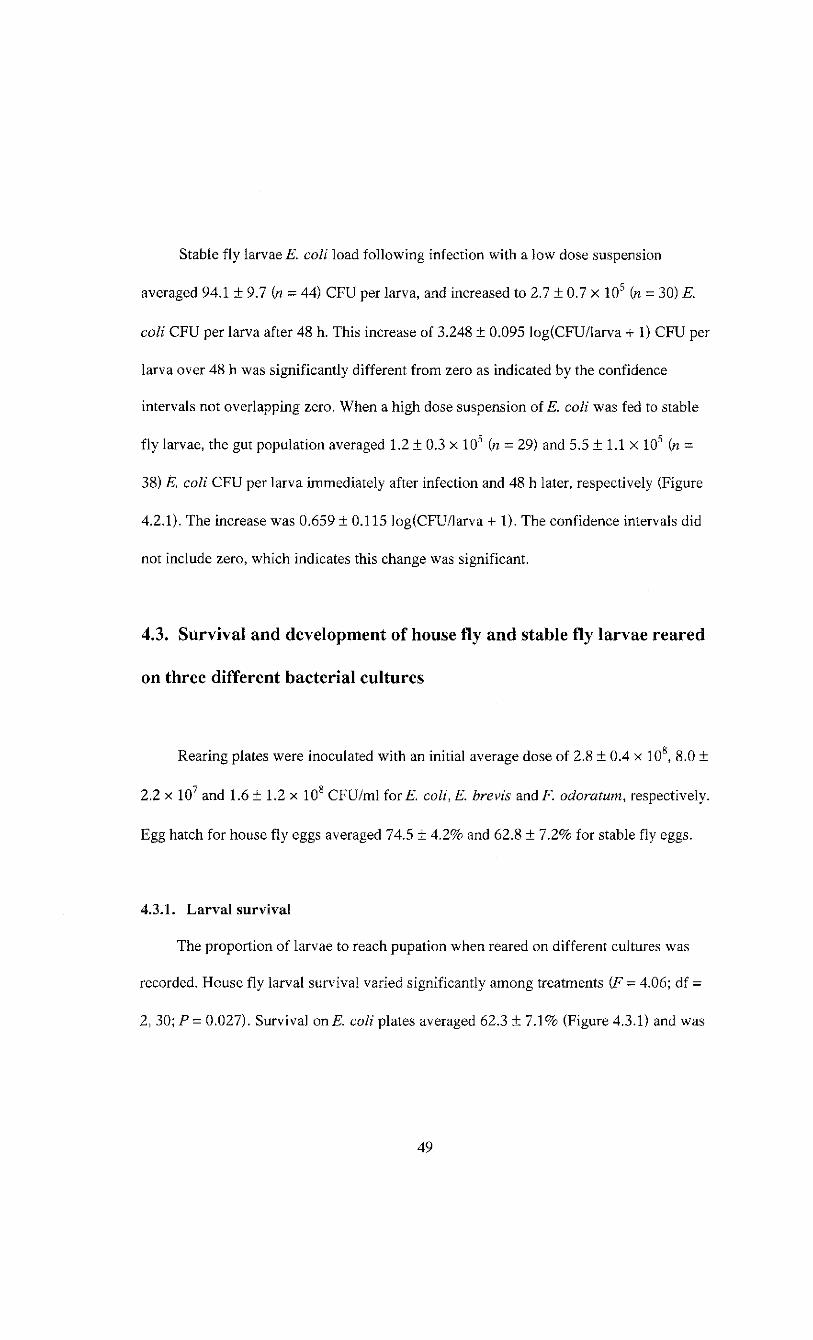
recorded. House fly larval survival varied significantly among treatments (F = 4.06; df =
2, 30; P = 0.027). Survival on E. coli plates averaged 62.3 ± 7.1% (Figure 4.3.1) and was
49
Treatment
Figure 4.3.1. Survival to pupation of house fly ( • ) and stable fly ( • ) larvae
reared on three different bacterial cultures. Bars represent percentage + SE.
50
lower than the other treatments. House fly larval survival was highest on the E. brevis +
F. odoratum combination with 87.8 ± 6.8% (Figure 4.3.1) and this was similar to the
83.2 ± 6.7% survival on the E. brevis + F. odoratum + E. coli plates.
The bacterial inocula also had a significant effect on stable fly survival (F = 20.81;
df = 2, 30; P < 0.0001). The survival of stable fly larvae was highest on plates containing
E. brevis +F. odoratum +E. coli, averaging 94.4 ± 7.0% (Figure 4.3.1). This was not
significantly different from survival on E. brevis + F. odoratum combination. Survival of
stable fly larvae was lowest on is. coli plates, averaging 25.4 ± 10.7% (Figure 4.3.1).
4.3.2. Larval and pupal development
The time required by larvae to reach pupation and the time required by pupae to
reach emergence was recorded. Analysis of variance indicated that development time of
house fly larvae varied among treatments (F = 59.41; df = 2, 407; P < 0.0001). House fly
larvae developed fastest on E. brevis + F. odoratum + E. coli plates, reaching pupation in
6.8 ± 0.1 days (Figure 4.3.2). Larvae reared on the is. brevis + F. odoratum bacterial
mixture had an average larval development time of 7.0 ±0 .1 days (Figure 4.3.2). Larval
development time was significantly greater on E. coli plates, requiring 7.9 ± 0.1 days to
reach pupation. There was no effect of treatment on the development time of house fly
pupae (Figure 4.3.3).
The bacterial food source had an effect on the development time of stable fly
larvae, as indicated by the significant term for treatment (F = 37.91; df = 2, 286; P <
0.0001). On average, stable fly larvae developed 1.8 ± 0.2 days faster on E. brevis +
F. odoratum + E. coli plates compared with the E. brevis + F. odoratum plates (Figure
51
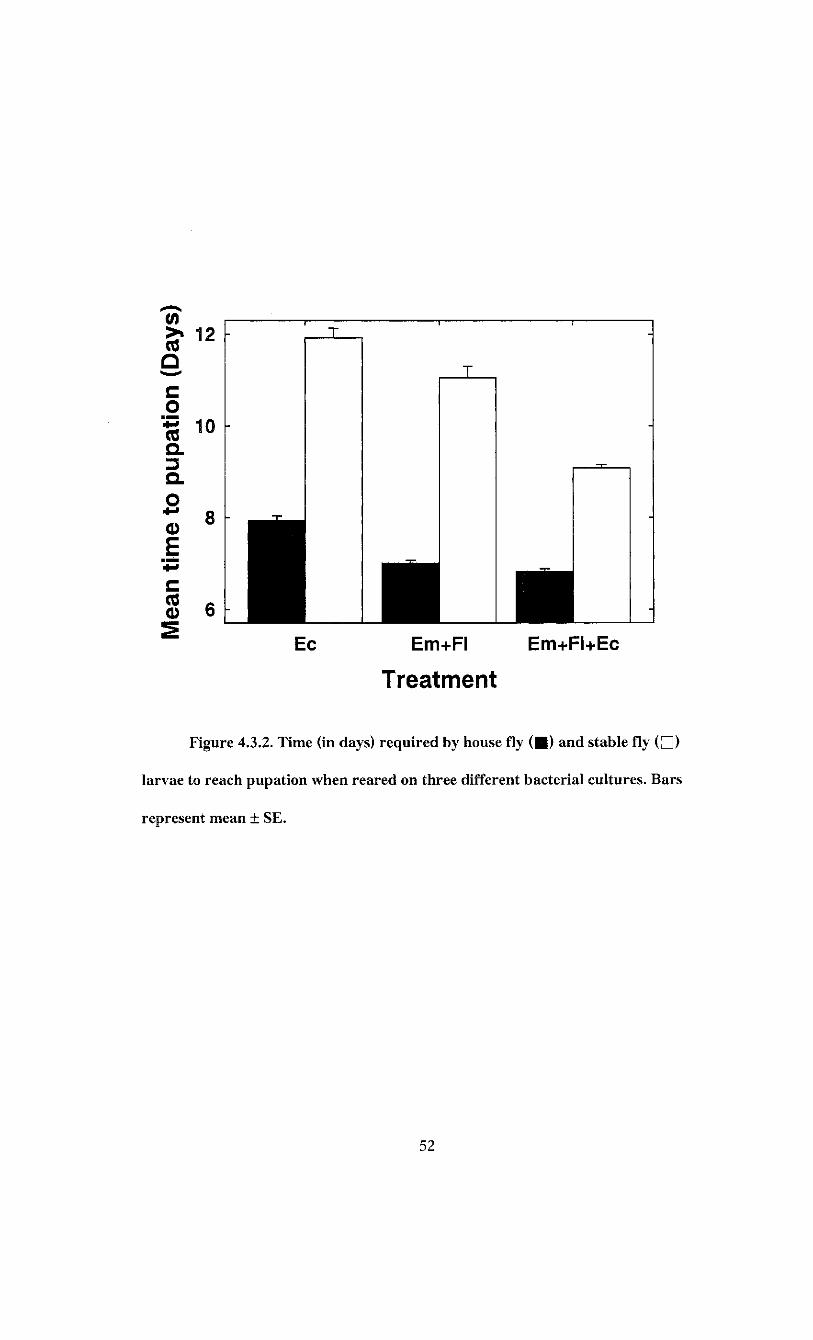
TO Q c o ••g 10 a a
E
c 0
8
T
T
- -
-
Ec Em+FI Em+FI+Ec
Treatment
Figure 4.3.2. Time (in days) required by house fly ( • ) and stable fly ( • )
larvae to reach pupation when reared on three different bacterial cultures. Bars
represent mean + SE.
52
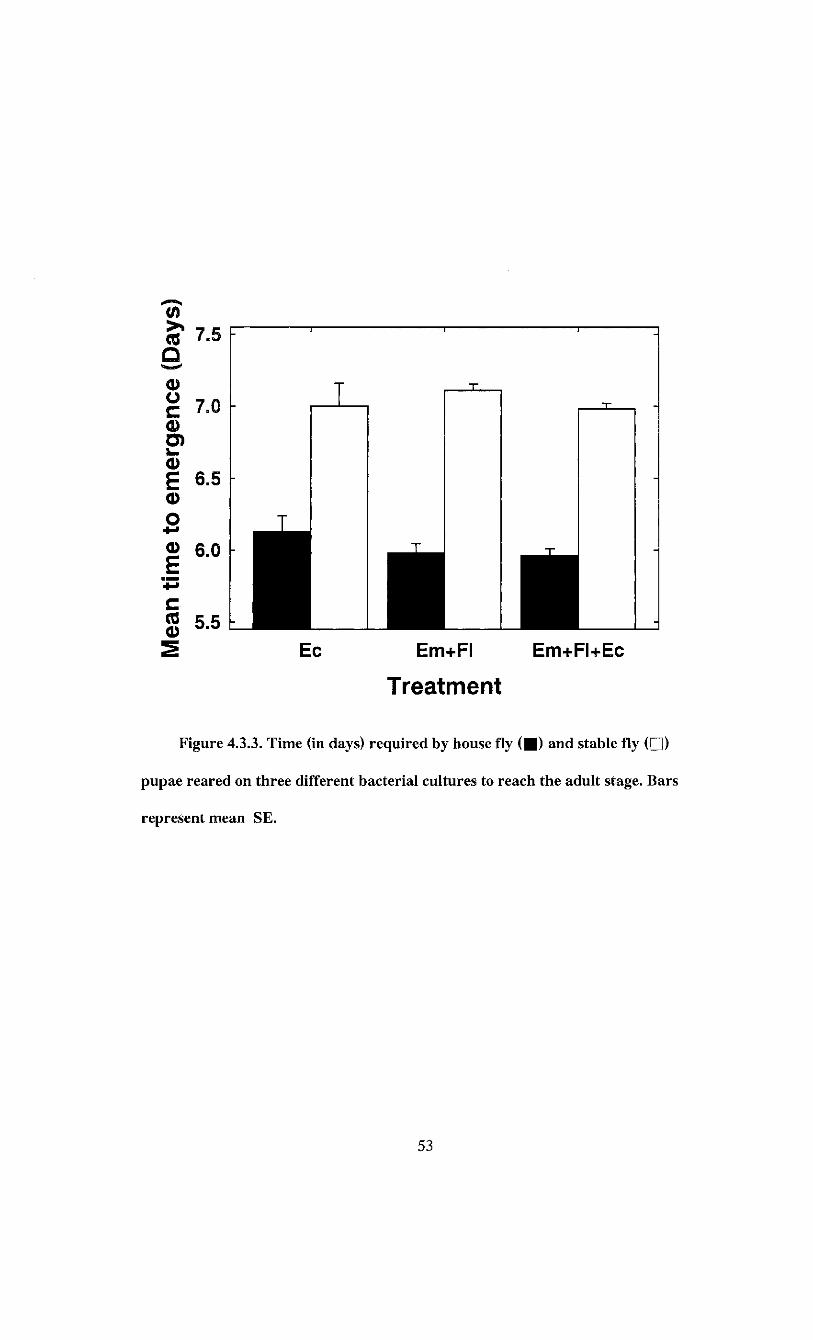
m
Q
S Ec Em+FI Em+FI+Ec
Treatment
Figure 4.3.3. Time (in days) required by house fly ( • ) and stable fly ( • )
pupae reared on three different bacterial cultures to reach the adult stage. Bars
represent mean SE.
53
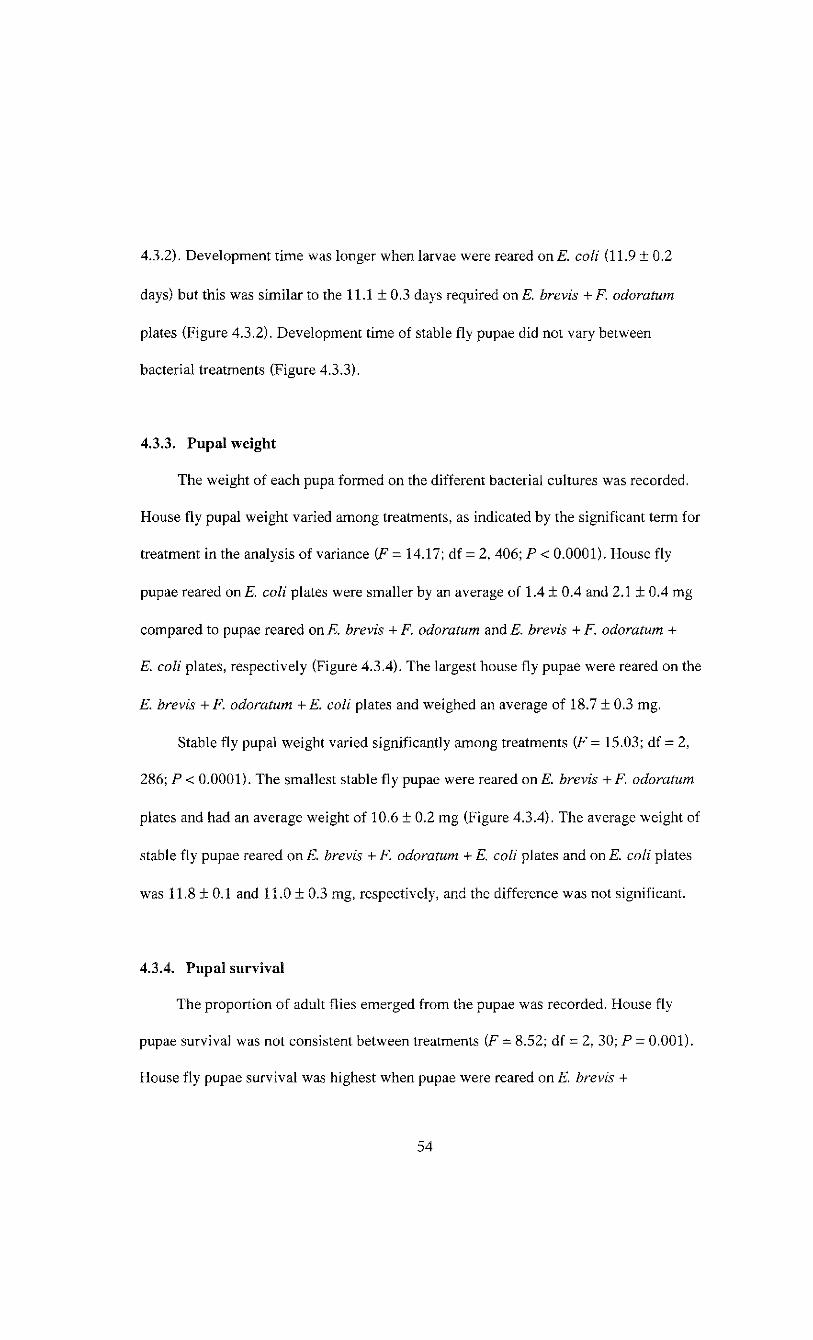
4.3.2). Development time was longer when larvae were reared on is. coli (11.9 ± 0.2
days) but this was similar to the 11.1 ± 0.3 days required on E. brevis + F. odoratum
plates (Figure 4.3.2). Development time of stable fly pupae did not vary between
bacterial treatments (Figure 4.3.3).
4.3.3. Pupal weight
The weight of each pupa formed on the different bacterial cultures was recorded.
House fly pupal weight varied among treatments, as indicated by the significant term for
treatment in the analysis of variance (F = 14.17; df = 2, 406; P < 0.0001). House fly
pupae reared on is. coli plates were smaller by an average of 1.4 ± 0.4 and 2.1 ± 0.4 mg
compared to pupae reared on E. brevis + F. odoratum and E. brevis + F. odoratum +
E. coli plates, respectively (Figure 4.3.4). The largest house fly pupae were reared on the
E. brevis + F. odoratum +E. coli plates and weighed an average of 18.7 ± 0.3 mg.
Stable fly pupal weight varied significantly among treatments (F = 15.03; df = 2,
286; P < 0.0001). The smallest stable fly pupae were reared on is. brevis +F. odoratum
plates and had an average weight of 10.6 ± 0.2 mg (Figure 4.3.4). The average weight of
stable fly pupae reared on E. brevis + F. odoratum + E. coli plates and on E. coli plates
was 11.8 ± 0.1 and 11.0 ± 0.3 mg, respectively, and the difference was not significant.
4.3.4. Pupal survival
The proportion of adult flies emerged from the pupae was recorded. House fly
pupae survival was not consistent between treatments (F - 8.52; df = 2, 30; P - 0.001).
House fly pupae survival was highest when pupae were reared on E. brevis +
54
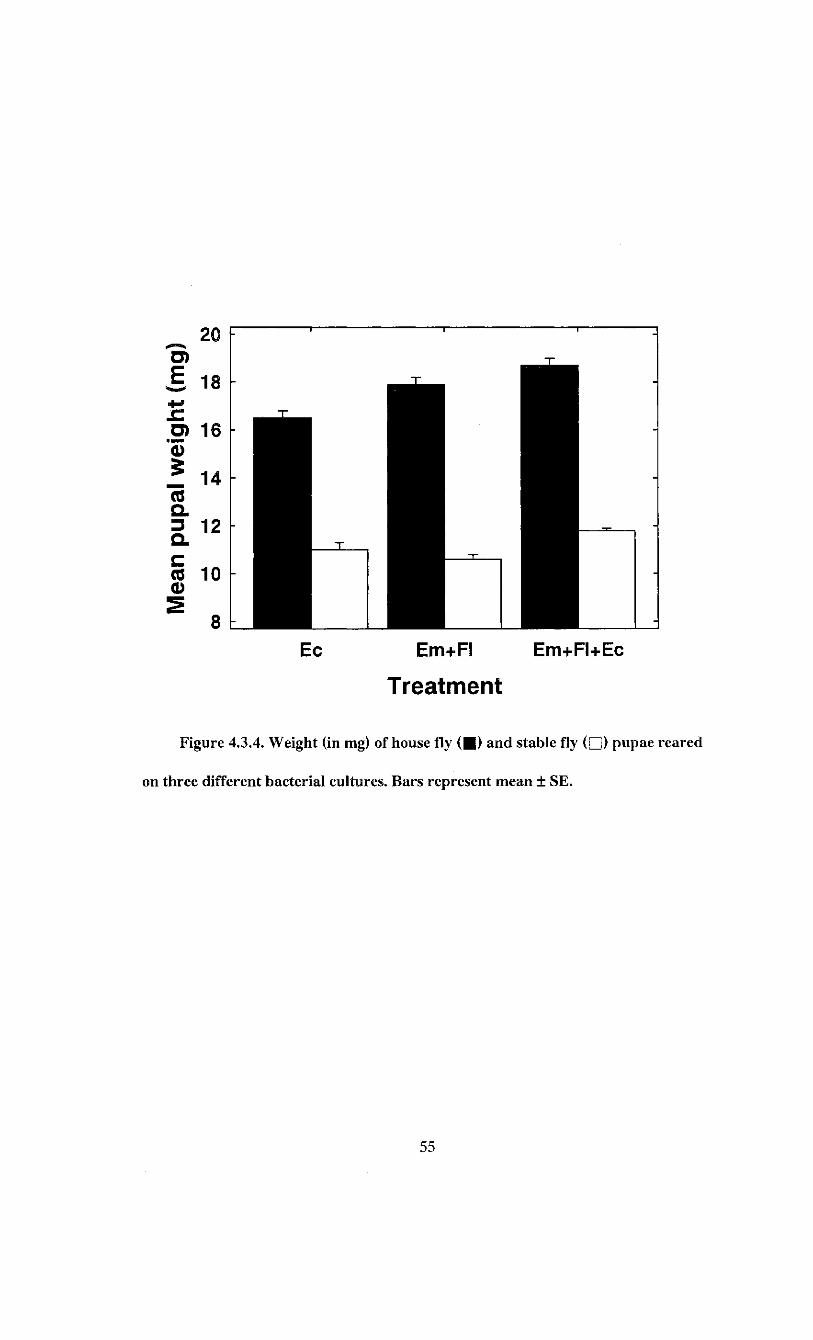
Ec Em+FI Em+FI+Ec
Treatment
Figure 4.3.4. Weight (in mg) of house fly ( • ) and stable fly ( • ) pupae reared
on three different bacterial cultures. Bars represent mean ± SE.
55
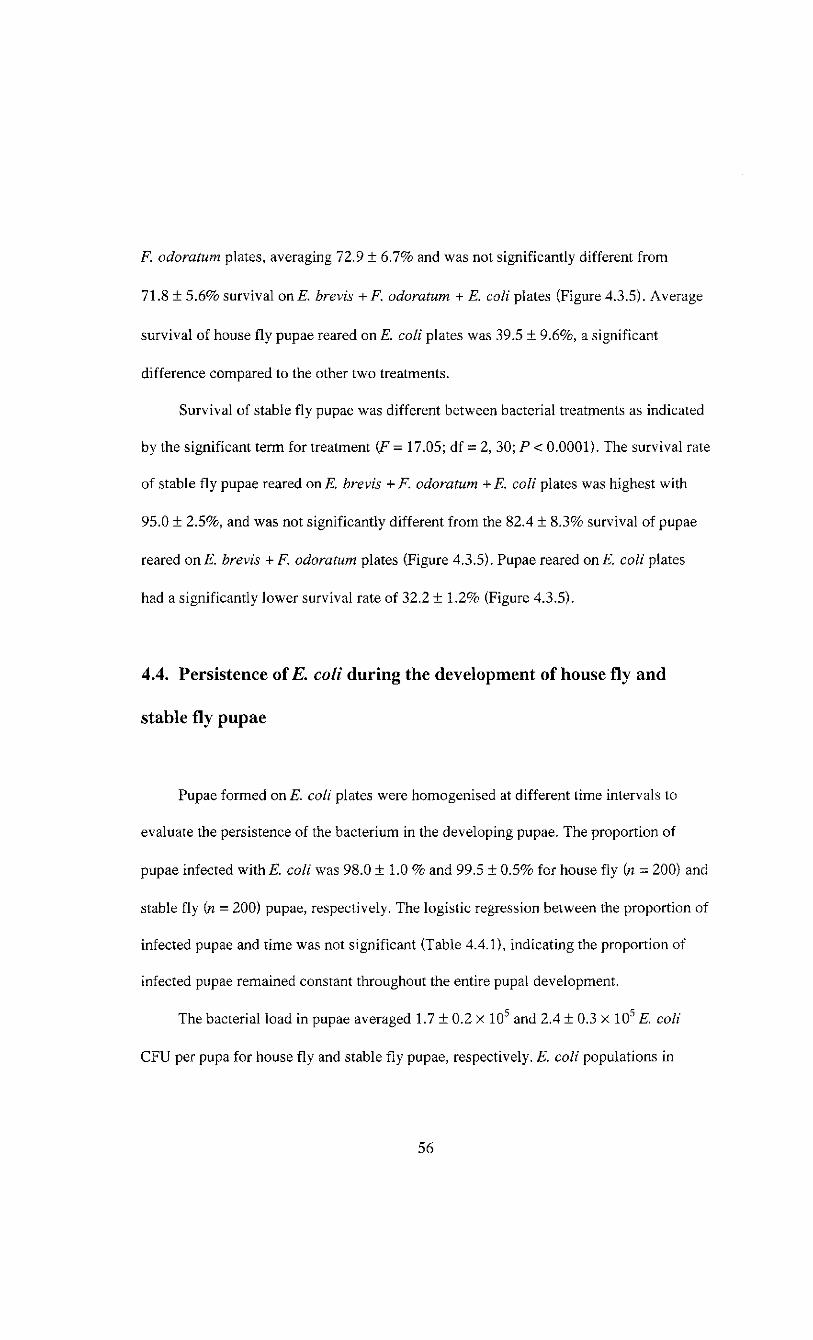
F. odoratum plates, averaging 72.9 ± 6.7% and was not significantly different from
71.8 ± 5.6% survival onE. brevis + F. odoratum + E. coli plates (Figure 4.3.5). Average
survival of house fly pupae reared on E. coli plates was 39.5 ± 9.6%, a significant
difference compared to the other two treatments.
Survival of stable fly pupae was different between bacterial treatments as indicated
by the significant term for treatment (F - 17.05; df = 2, 30; P < 0.0001). The survival rate
of stable fly pupae reared on E. brevis + F. odoratum + E. coli plates was highest with
95.0 + 2.5%, and was not significantly different from the 82.4 ± 8.3% survival of pupae
reared onE. brevis + F. odoratum plates (Figure 4.3.5). Pupae reared onE. coli plates
had a significantly lower survival rate of 32.2 ± 1.2% (Figure 4.3.5).
4.4. Persistence of E. coli during the development of house fly and
stable fly pupae
Pupae formed on E. coli plates were homogenised at different time intervals to
evaluate the persistence of the bacterium in the developing pupae. The proportion of
pupae infected with E. coli was 98.0 ± 1.0 % and 99.5 ± 0.5% for house fly (n = 200) and
stable fly (n = 200) pupae, respectively. The logistic regression between the proportion of
infected pupae and time was not significant (Table 4.4.1), indicating the proportion of
infected pupae remained constant throughout the entire pupal development.
The bacterial load in pupae averaged 1.7 ± 0.2 x 10 5 and 2.4 ± 0.3 x 10 5 E. coli
CFU per pupa for house fly and stable fly pupae, respectively. E. coli populations in
56
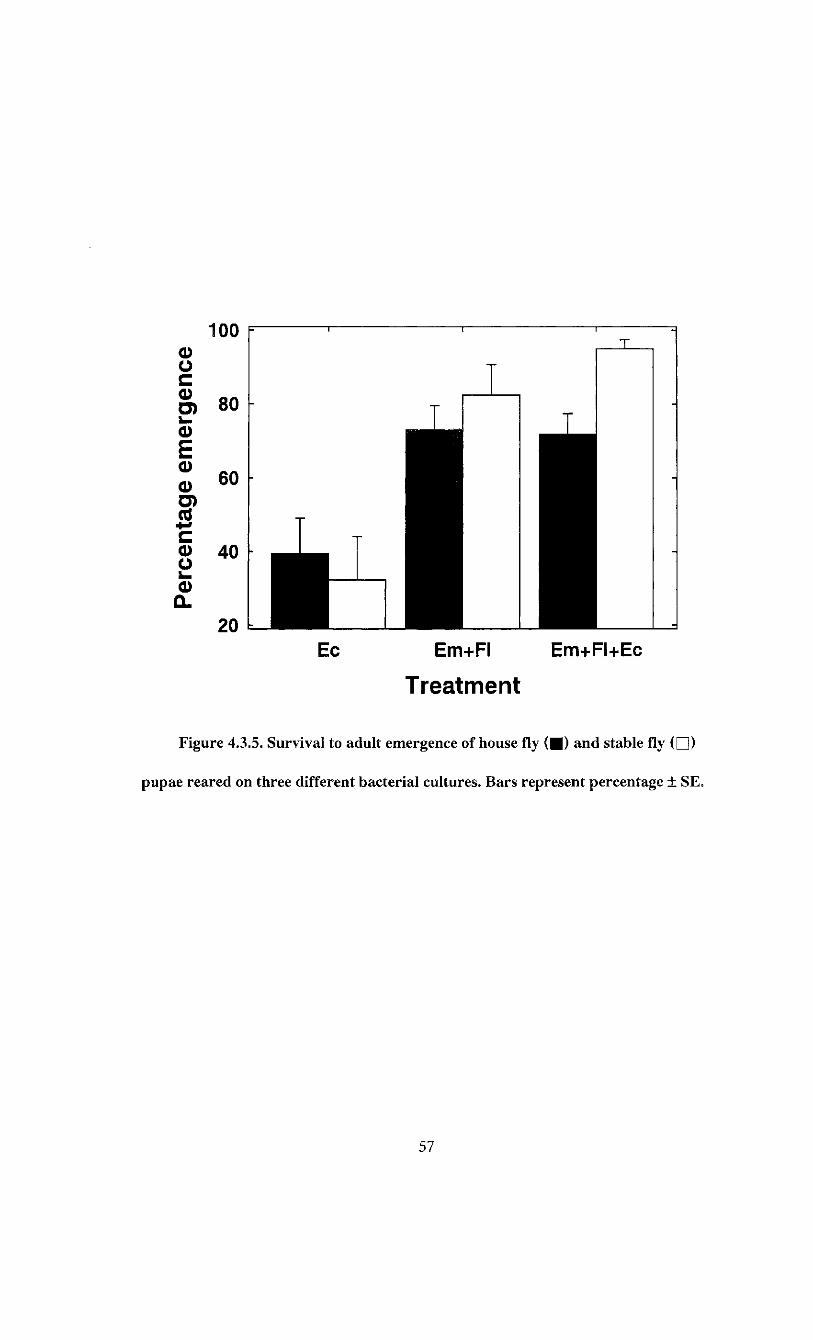
100 F
Ec Em+FI Em+FI+Ec
Treatment
Figure 4.3.5. Survival to adult emergence of house fly ( • ) and stable fly ( • )
pupae reared on three different bacterial cultures. Bars represent percentage ± SE.
57
Table 4.4.1. Relationship between the proportion of house fly and stable fly
pupae infected with E. coli and time since pupation.
Species n a ± S E &±SE
House fly 200 4.477 ± 1.293 -0.146 ±0.281 0.286 0.593
Stable flv 200 -0.665 ±47.158 4.556 ±47.136 2.787 0.095
Relationship is P (Y = 1) = 1/(1 + exp(a + bT)) where P (Y = 1) is the proportion of
infected pupae, T is days since pupation and a and b are estimated parameters using
logistic regression (SPSS Inc. 1989-1999).
58
pupae ranged from 600 to 2.0 x 10 6 CFU per pupa for house flies and from 2.9 x 10 3 to
2.8 x 10 6 £. coli CFU per stable fly pupa.
The relationship between bacterial population and time after pupation varied
significantly between fly species (F = 14.20; df = 3, 389; P < 0.0001). E. coli load in
house fly pupae increased between the first and the third day of development, and
decreased by average of 0.648 log(CFU/pupa + 1) between the fifth and sixth day of the
pupal stage (Figure 4.4.1). The relationship between bacterial load and time since
pupation for house fly larvae was described by the quadratic regression
log(CFU/pupa + 1) = 3.636 + 0.854*7/- 0.119*7^
where T is days since pupation (F = 20.47; df = 2, 193; P < 0.0001). The model
accounted for 17.5% of the variation of E. coli population in house fly pupae.
In stable fly pupae, there was also an increase in the E. coli population between
days one and three, but populations did not decrease before the emergence of the adult fly
from the pupa (Figure 4.4.1). The relationship between bacterial load and time since
pupation for stable flies was described by the quadratic regression
log(CFU/pupa + 1) = 4.265 + 0.310*7/- 0.028*7^
where T is days since pupation (F = 13.58; df = 2. 196; P < 0.0001). The model
accounted for 12.2% of the variation in bacterial load of stable fly pupae.
4.5. E. coli contamination of teneral adult house flies and stable flies
Teneral adult flies were tested to determine infection with E. coli of the adult
following emergence from the pupal case. The proportion of newly emerged house flies
59
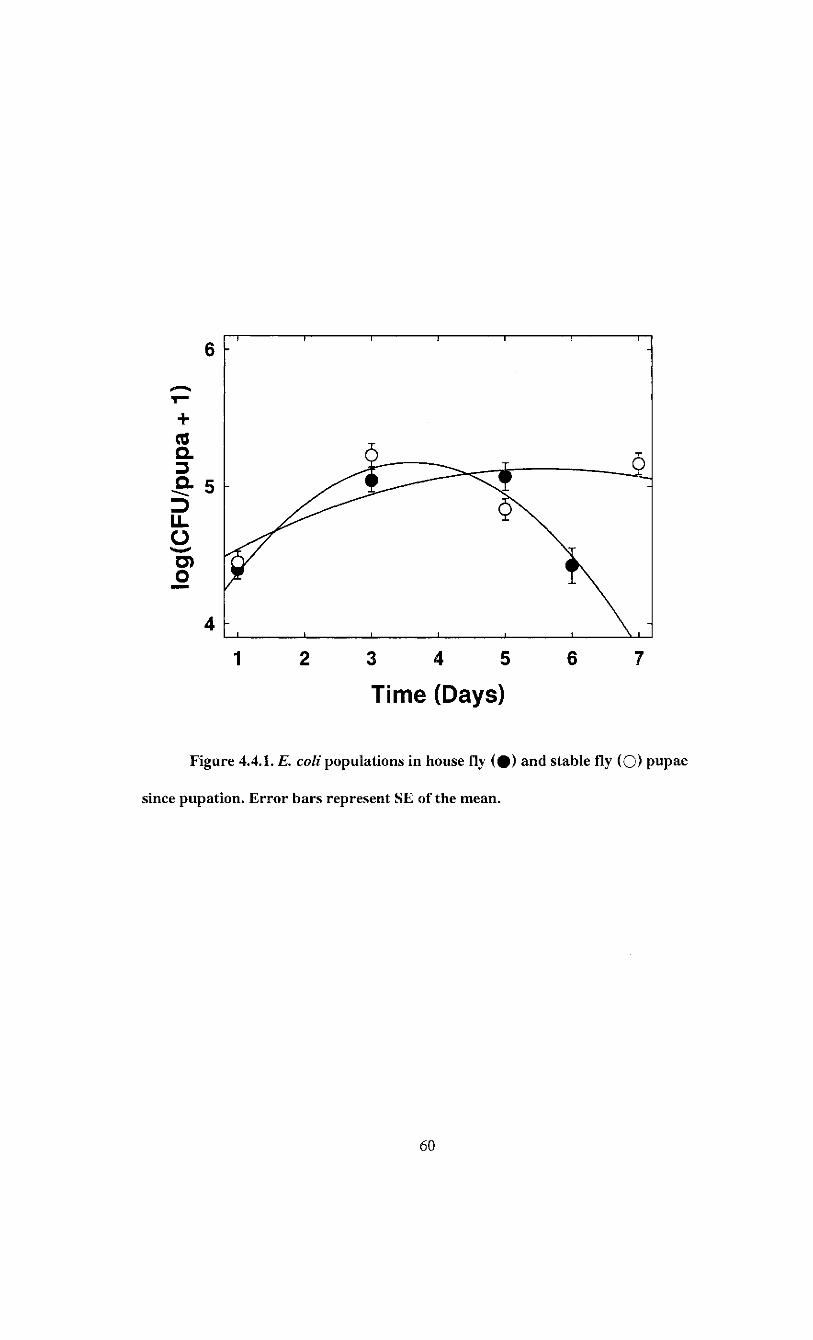
1 2 3 4 5 6 7
Time (Days)
Figure 4.4.1. E. coli populations in house fly ( # ) and stable fly (O) pupae
since pupation. Error bars represent SE of the mean.
60
(n = 50) and stable flies (n = 50) infected with E. coli was 78.0 ± 5.9% and 28.0 ± 6.4%,
respectively. The proportion of infected house flies and stable flies was significantly
different (z = 5.00; P < 0.0001). All pupal cases were infected with E. coli.
Some teneral adult house flies and stable flies were rinsed prior to homogenisation
to evaluate the surface contamination with E. coli. Flies rinsed prior to homogenisation
contaminated the rinse solution in 72.0 ± 6.4% of house flies (n = 50) and 28.0 ± 6.4% of
stable flies (n = 50). The difference in proportion of rinse solutions infected was
significant (z = 4.40; P < 0.0001). After rinsing, 66.0 ± 6.8% of house flies and 26.0 ±
6.3% of stable flies remained contaminated. The proportion of rinsed flies infected with
E. coli was different between species (z = 4.01; P < 0.0001). There was no significant
difference between the proportion of infected rinse solutions and the proportion of
infected flies for either house flies (z = 0.65; P = 0.258) or stable flies (z = 0.23; P =
0.411).
The minimal E. coli population of infected newly emerged flies averaged 900.3 ±
151.5 and 1.2 ± 0.3 x 10 3 CFU per fly for house flies (n = 39) and stable flies (n = 14),
respectively. There was no significant difference in the E. coli load of infected flies of
both species (t = 0.54; df = 51; P = 0.592). House fly and stable fly pupal cases harboured
an average of 2.9 ± 0.7 x 10 5 and 8.0 ± 1.4 x 10 5 £ . coli CFU per empty case,
respectively. House fly pupal cases contained, on average, 0.714 + 0.157 log(CFU/case +
1) less E. coli CFU than stable fly cases (t = -4.55; df = 91.286; P < 0.0001). Pupal cases
of infected house flies harboured an average of 0.884 ± 0.231 log(CFU/case + 1) more
CFU per case than pupal cases from uninfected house flies (t = 3.83; df = 22.24; P =
0.001). Pupal cases from infected and uninfected stable flies harboured an average of
61

5.9 ± 2.3 x 10 5 (n = 13) and 4.2 ± 0.9 x 10 5 (n = 36) CFU per case, respectively, and the
E. coli contamination of the cases was not significantly different (t = 0.85; df = 48; P =
0.398).
When the bacterial load from the empty pupal cases of newly emerged house flies
was compared to the E. coli population in house fly pupae before emergence, the cases
contained an average of 0.472 ± 0.199 log (CFU/case + 1) more E. coli CFU than the
pupae (t = 2.38; df = 98; P = 0.019). Empty stable fly cases contained an average of
0.357 ± 0.123 log (CFU/case + 1) more E. coli than stable fly pupae before emergence
(t =2.89; df = 98; P = 0.005).
Emerged flies were rinsed to determine if the adult contamination with E. coli was
mostly internal or external. The minimal contamination of the rinse solutions ranged from
1 to 500 E. coli CFU/ml for both species, and averaged 250.3 ± 37.2 and 367.0 ± 51.1
E. coli CFU/ml for house fly (n = 50) and stable fly (n = 50) rinse solutions, respectively.
There was no difference in the amount E. coli found in the rinse solutions between
species if = -1.57; df = 48; P = 0.122). Infected stable flies (n = 13) contaminated the
rinse solution by an average of 0.480 ± 0.176 log (CFU/ml +1) more CFU/ml than
infected house flies (n = 33).
The minimal E. coli population of infected rinsed flies averaged 208.3 ± 45.8 for
house flies (n = 33) and ranged from 1 to 700 CFU per fly. Rinsed infected stable flies
(n - 13) had a minimal average of 336.7 ± 80.9 CFU per fly, ranging from 7 to 700 CFU
per fly. There was no difference in the minimal E. coli load of infected rinsed flies of
both species (t = -1.83; df = 44; P = 0.075). The E. coli contamination of pupal cases
from rinsed house flies (n - 50) and stable flies (n = 49) averaged 3.1 ± 0.7 x 10 5 and
62
4.7 ± 0.9 x 10 5 E. coli CFU per case, respectively. Pupal cases from rinsed stable flies
contained an average of 0.431 ± 0.172 log (CFU/case + 1) more CFU per case than pupal
cases from rinsed house flies (t - -2.50: df = 94.34; P = 0.014). Infected house flies
emerged from cases containing an average of 1.151 ± 0.206 log (CFU/case + 1) more
E. coli CFU per case than uninfected house flies (t = 5.60; df = 42.37; P < 0.0001). Cases
from rinsed infected and uninfected stable flies had a similar E. coli load (/ = 1.31; df =
48; P = 0.196).
Empty cases from rinsed house flies contained, on average, 0.456 ± 0.203
log(CFU/case + 1) more E. coli CFU per case than six-day old pupae (t = 2.24; df = 98;
P - 0.027). There was no difference in the E. coli load of seven-day old stable fly pupae
and the empty cases from rinsed stable flies (t = -0.28; df = 74.09; P - 0.778).
Spearman's rank correlation was used to determine if the E. coli contamination of
the house fly and stable fly adults was related to the amount of bacteria found in the
pupal case. In house flies, the contamination of the newly emerged fly, the rinse solution
and the remaining contamination on the rinsed fly were all correlated with the amount of
E. coli in the case (Table 4.5.1). There was no correlation between the contamination of
the adult stable fly and the E. coli load in the pupal case (Table 4.5.1).
63
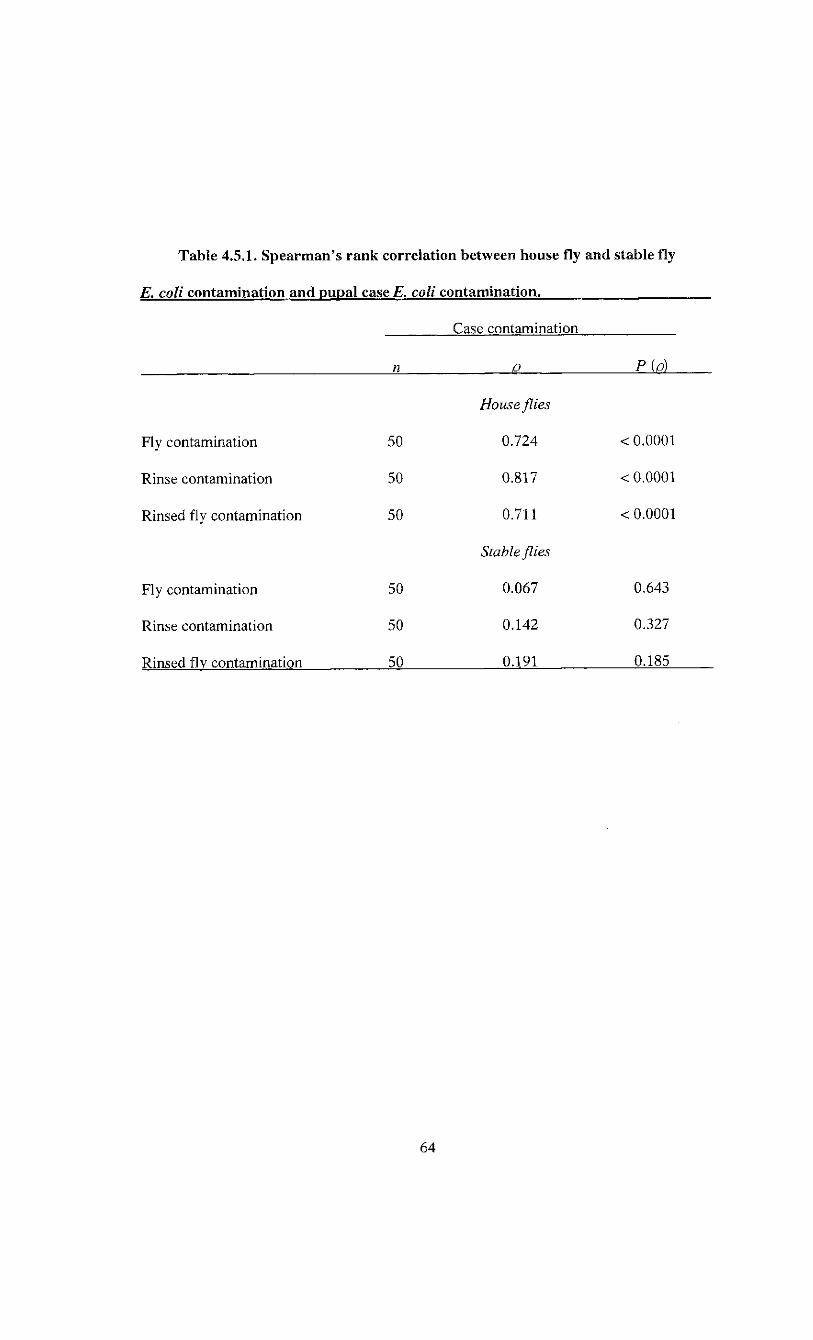
Table 4.5.1. Spearman's rank correlation between house fly and stable fly
E. coli contamination and pupal case E. coli contamination.
a P (o)
House flies
Fly contamination 50 0.724 < 0.0001
Rinse contamination 50 0.817 < 0.0001
Rinsed fly contamination 50 0.711 < 0.0001
Stable flies
Fly contamination 50 0.067 0.643
Rinse contamination 50 0.142 0.327
Rinsed flv contamination 50 0.191 0.185
64
Case contamination

CHAPTER 5. DISCUSSION
A non-pathogenic strain of E. coli was used during experimentation for safety
reasons, and likely had little effect on experimental outcome. This non-pathogenic strain
was less hazardous to work with and its detection was easier and less expensive than
detection of pathogenic strains such as E. coli 0157:H7. Survival of E. coli 0157:H7 in
the environment follows a similar pattern to that of non-pathogenic strains (Mubiru et al.
2000, Ogden et al. 2001). Also, the suspected acid tolerance of E. coli 0157:H7 varies
from strain to strain (Miller and Kaspar 1994, Arnold and Kaspar 1995) and is
comparable to acid tolerance of some non-pathogenic strains (Duffy et al. 2000). The
E. coli strain in this study served as an indicator bacterium, and was used as a model for
the survival of possible pathogenic strains.
The persistence of E. coli in house fly and stable fly immatures was assessed during
short and long time periods in the larval and pupal stages through to adult emergence. For
both fly species, the bacterium was present in larvae, pupae and adults, but the overall
pattern of contamination varied between house flies and stable flies. The E. coli
population in house fly larvae was generally lower compared with stable fly larvae. Also,
the E. coli population tended to decrease over time in house fly larvae, while it remained
unchanged in stable fly larvae. During the pupal stage, the amount of E. coli in the house
fly pupa dropped just before adult emergence. This reduction in E. coli was not observed
in stable fly pupae. Resulting contamination of the adults also varied between both fly
species. Although adult flies of both species were contaminated externally and internally,
65

contamination occurred in a large proportion of house flies and in a smaller proportion of
stable flies. These differences may be related to the use of E. coli by each species.
66
Greenberg (1959d) added strains of Salmonella or Shigella to the rearing medium
of house fly larvae and found that most larvae sampled were free of the bacterium,
indicating these bacterial species did not persist in maggots reared in their presence, and
were perhaps destroyed in the larval gut. In the present study, the proportion of larvae
free of the test bacterium ranged from about 5% to nearly 60%, depending on the
experiment and the fly species. Two reasons could account for failure to detect E. coli in
larvae. Either larvae did not ingest E. coli after the 20 minute feeding period, or E. coli
was digested quickly. It was unlikely due to rapid digestion since the food bolus of house
fly maggots has a passage time of about 10 and 25 minutes in the fore-midgut and the
mid-midgut, respectively (Espinoza-Fuentes and Terra 1987). The mid-midgut is the
region where bacteria are thought to be destroyed through the combined action of low
pH, gut-specific lysozymes and digestive enzymes (Greenberg 1965, Espinoza-Fuentes
and Terra 1987, Terra et al. 1988). Also, complete gut transit in third instar house flies is
slightly over 100 minutes (Espinoza-Fuentes and Terra 1987), so bacteria consumed
within the 20 minutes feeding period and not destroyed by digestion should not have been
excreted before the first sampling of the maggots following surface-sterilisation.
Furthermore, when larvae were fed different doses of bacteria, the ingestion of small
amounts of E. coli by the larvae resulted in an increase of the bacterial population over
time in both species, not a swift destruction through digestion.
The proportion of infected larvae did not change during the first five hours after
infection, but changed over 48 h. The proportion of infected house fly maggots decreased
during the first 24 h, probably from digestion and from excretion of live bacteria, and
then increased to reach 100% after 48 h of incubation. This was probably due to re
infection of the remaining larvae feeding on the excreted bacteria, and perhaps also
because of a reduced digestion rate caused by a decrease in the amount of food in the gut.
This trend was not seen in stable fly larvae, where there was a constant increase in the
proportion of larvae infected. Live E. coli was also excreted by immature stable flies, but
with apparently less effective E. coli digestion, maggots simply accumulated the bacteria,
and remaining larvae contaminated themselves by feeding on the excreted cells. The
survival of both species of larvae reared on E. coli may help provide an explanation for
the persistence of the bacterium through development and will be discussed later.
Bacterial populations average 10 7 bacteria (total gut flora) in actively feeding house
fly maggots and 10 5 - 10 6 bacteria in the prepupa (Greenberg 1959a). Radvan (1960a)
reported similar amounts of E. coli in house fly larvae prior to pupation. The normal flora
of stable flies is similar in abundance to that of immature house flies (Greenberg 1962).
The amount of E. coli detected in third instar larvae in this study was lower than those
reported earlier (Greenberg 1959a, Radvan 1960a, Greenberg 1962). Contrary to the fore-
mentioned experiments, the larvae used here were not reared on the detected bacteria, but
only put in contact with E. coli for a period of 20 minutes. In this short period, it appears
stable fly larvae were able to acquire equal or more bacterial cells than house fly larvae
from cultures of similar bacterial densities. Over five hours, the initial E. coli gut
population was different for both species, but the rate of change was comparable. This
being only a very short portion of the global pattern over 48 h, the reduction of E. coli
load could be linked to excretion of the bacteria.
67
The long term persistence probably represents a more accurate picture of E. coli
persistence in the larvae. For house fly larvae, there was a decrease in the amount of
E. coli in the larval gut over time. Some live bacteria were excreted onto the water agar
and then re-ingested, but a portion of E. coli was probably digested at each passage
through the gut, reducing the amount of bacteria excreted onto the water agar and
available for re-consumption over time. Stable fly larvae may be less efficient at
digesting E. coli, and the amount of bacteria in their gut remained fairly constant over
time because the amount of bacteria excreted and available for re-ingestion was
comparable.
This pattern of E. coli persistence appears when a high concentration of E. coli is
fed to the larvae. The change in the E. coli gut population of larvae varies between
species when fed a low concentration of bacteria. E. coli multiplies in both house fly and
stable fly larval guts when acquired at a low dose. Over 48 h, the E. coli population
increased by an average of 2.277 log(CFU/larva + 1) in immature house flies and 3.248
log(CFU/larva +1) in immature stable flies. This increase brought the Is. coli larval load
of both species to levels similar with the load of larvae 48 h after ingestion of a high dose
of E. coli cells. This could be indicative of a carrying capacity for E. coli in this
experimental system, where stable fly larvae can support a larger E. coli population in
their gut compared with house fly larvae. The rate of change over time in the bacterial
population is the difference between the rate of growth (multiplication and re-ingestion)
and the rate of death (digestion and excretion) of the population. When growth is greater
than death, the change is positive and the population increases: when death is greater than
growth, the change is negative and population decreases. At low density. E. coli in the
68
gut of immature house flies and stable flies grows faster than it is destroyed or evacuated,
probably because there are enough nutrients in the gut to sustain a certain bacterial
population. E. coli is generally not known as a fastidious organism, and can probably
grow on material found in the larval gut. As the larvae have been starved for a period of
about 24 h before feeding, it is also possible that digestive processes slowed. The
peritrophic matrix of starved dipterous larvae is secreted more slowly than the peritrophic
matrix of actively feeding larvae (Jacobs-Lorena and Oo 1996). When only a small
quantity of bacteria was ingested, digestion may not have been fully stimulated, giving an
opportunity for E. coli population growth. Also, third instar house fly larvae starved for
24 h lose over 90% of the bacteria in their gut (Greenberg 1959c). This reduction of the
competing flora may also have helped in the growth of the initially low E. coli
population. When a large quantity of E. coli was ingested, the resources for growth were
probably insufficient and the destruction of the bacteria through digestion more efficient,
leading to a slower increase of the E. coli population in stable fly guts and a decrease in
house fly guts.
Very high proportions of pupae of both species were infected with E. coli. Since
third instars were transferred to EYM plates with E. coli lawns and left to graze until
pupation, larvae were in constant contact with the bacterium for a long time period. The
average amount of E. coli detected in house fly pupae was similar to the pupal bacterial
population of 10 4-10 5 stated in literature (Greenberg 1959a, Radvan 1960a). In the case
of stable fly pupae, the average amount detected in this study was lower than the 10 5-10 6
previously reported (Greenberg 1962). The overall pattern of bacterial survival through
metamorphosis was comparable between species with the bacterial load remaining
69

unchanged through pupation (Greenberg 1962). However, in this study, the pattern of
change in the E. coli population of pupae varied between fly species. Although the E. coli
population increased until day 3 in both species, there was a sudden decrease of the
bacterial load in house fly pupae between day 5 and 6, the last day before adult
emergence. This decrease was not observed in stable fly pupae where the E. coli
population stabilised after day 3. This pattern differs from the increase in bacterial load
(Radvan 1960a) or the lack of change in the bacterial population (Greenberg 1959a)
reported in other studies.
The destruction of E. coli in the house fly pupa cannot be directly related to
digestion, as there is no active feeding taking place during this stage. The process of
metamorphosis involves the destruction and synthesis of tissues, and these histolytic
processes may affect the E. coli population. However, these drastic changes occur within
the first 48 h of pupation, where the puparium content is liquefied as the old larval tissue
is being destroyed and new adult tissue is being synthesised (Greenberg 1959c, Radvan
1960b, Thomas 1985). Since the is. coli population grows in both species during this 48 h
period, it is possible the bacteria present in the larval digestive system use some of the
nutrients in the liquefied puparium content to grow. As the pupa takes form, the midgut
lining of the old larva is shed to the internal surface of the puparium, while a new midgut
is synthesized (West 1951, Greenberg 1959c, Radvan 1960b). It appears these major
changes do not affect the size of the pupal E. coli population. Studies involving the
dissection of pupae indicate the new pupal midgut to be largely free of bacteria while the
exuvial membrane is highly contaminated (Greenberg 1959c, Radvan 1960b). The pupa
then becomes more solid and the nutrients may be less accessible for the bacteria and the
70
E. coli population enters the stationary phase. Because of the localisation of the bacteria
outside of the forming adult, the contamination of the emerging fly was assumed to be
mostly external (Radvan 1960a, b).
The contamination of newly emerged house flies and stable flies with E. coli also
varied between species. While house fly pupae harboured less E. coli than stable fly
pupae, the bacterium was detected on a significantly higher proportion of house fly
adults. The proportion of infected house flies in this study is similar to what has been
stated in the literature (Greenberg 1959a, Radvan 1960a). The proportion of infected
stable flies (46%) reported by Greenberg (1962) is larger than what was found in this
study, where E. coli was detected on only 28% of adult stable flies.
Detection of bacteria on the newly emerged fly indicated 2 to 10% of the total
bacterial load of the pupa could be recovered from the adult (Radvan 1960a), which
supported the hypothesis that most of the contamination was external to the fly. In
experiments similar to the ones conducted in this study, the amount of bacteria on the
surface of house flies was reported to be generally less than 100 CFU (Greenberg 1959b).
Although most adult midguts were sterile, external contamination accounted for only part
of the total bacterial load of teneral flies (Greenberg 1959b). The results of the present
study indicate contamination with E. coli is both internal and external for house fly and
stable fly adults. There was a high correlation between the amount of bacteria in the rinse
solution and the amount of bacteria in rinsed flies for both species, which would indicate
that flies externally contaminated are usually internally contaminated as well. Since the
rinsed flies were not surface sterilised prior to homogenisation, it is possible some
bacterial cells adhered to the cuticle. Therefore, the minimal E. coli load recorded for
71
rinsed flies may not represent only internal contamination. The goal of the experiment
was not to quantify E. coli contamination precisely, but to determine the relative
importance of external and internal contamination with bacteria carried from the larval
stage. The amount of bacteria in infected stable flies was reported to be higher than in
house flies (Greenberg 1962). Similarly, this study indicated infected stable flies
contaminated the rinse solutions more than did infected house flies. However, because
only minimal E. coli loads were recorded, it can only be said that there was no significant
difference in the minimal amount of bacteria between contaminated adult house flies and
stable flies. The average minimal amounts of E. coli reported in this study are higher than
amounts reported for both house flies (Greenberg 1959b) and stable flies (Greenberg
1962). The pupal cases of emerged stable flies were also significantly more contaminated
with E. coli than cases from emerged house flies. Yet, the proportion of contaminated
stable flies was much lower than the proportion of contaminated house flies. Greenberg
(Greenberg 1959c) reported there was no correlation between the amount of bacteria on
emerged adult house flies and the amount in their puparium. While this is true for stable
flies in this study, it is not for house flies. A strong correlation was found between the
contamination of house flies and the contamination of their respective puparia.
Ultimately, the amount of E. coli in the immature house fly has an influence on the
bacterial load of the adult, while the contamination of immature stable flies does not
influence adult contamination.
Results of the survival experiment indicate differences in the suitability of E. coli
for sustaining growth and development of house fly and stable fly larvae, and may help
explain some patterns of persistence. Both fly species completed development on all
72

treatments, and had higher survival rates when reared on other treatments compared to
E. coli alone. House fly larvae developed reasonably well on E. coli with a mean
pupation rate of 62.3%. This was lower than the 72% survival to pupation obtained by
Watson et al (1993) on the same agar-based medium. Watson et al (1993) also recorded
greater pupal weights and pupal survival. This variation in survival may be attributable to
differences in the bacterial strain used to sustain house fly development. Schmidtmann
and Martin (1992) demonstrated that house fly larvae reared on blood agar plates
supplemented with E. coli had a survival rate of 40% on one E. coli strain, but reached
almost 60% on a second E. coli strain. Survival differences may also be due to
differences between house fly strains. Developmental time of house fly larvae was 7.9
days when reared on E. coli alone, significantly longer than the 7 days required on
E. brevis + F. odoratum. Watson et al (1993) and Schmidtmann and Martin (1992) using
agar medium did not report developmental time. However, house fly development in
poultry manure requires an average of 8.1 days at 25°C (Lysyk and Axtell 1987),
comparable to the 7.9 days required by house fly larvae reared on E. coli alone. Overall,
the performance of house fly larvae and pupae was reduced on E. coli alone compared to
the other treatments, and addition of E. coli to the E. brevis + F. odoratum inoculum did
not have any significant impact, positive or negative, on survival compared with the other
treatments.
Stable fly larvae and pupae had low survival when reared on E. coli alone. The
mean survival rate of 25.4% was lower than reported by Lysyk et al (1999) under similar
conditions, where the larval survival rate on E. coli varied between 36.8% and 49.2%.
Larvae reared onE. coli reached pupation in an average of 11.9 days. Survival of stable
73
fly larvae in traditional rearing medium at 25°C is ~ 80% and requires about 8 days
(Lysyk 1998). Larval survival of stable flies on a mixture E. brevis + F. odoratum +
E. coli was 94.4%, indicating a positive interaction among the three bacterial species for
the development of immature stable flies, or the production of a favourable by-product.
Development time on the mixture of all three bacteria was also significantly shorter than
on the other treatments, averaging 9.1 days, a value comparable to development in
traditional rearing medium. Although pupal weight of stable flies reared on E. coli was
greater than pupae reared on E. brevis + F. odoratum, adult emergence on E. coli was
very low (32%) compared to other treatments (>80%). Lysyk et al (1999) reported stable
fly emergence ranging from 7.4 to 95.1% when reared on E. coli, while emergence from
stable fly pupae in traditional rearing medium at 25°C is ~ 86% (Lysyk 1998). Although
pupal weight was high, pupal survival was low, indicating growth factors provided by
E. coli alone do not guarantee survival. The addition of E. coli to the control treatment
E. brevis + F. odoratum increased pupal survival to 95%, again suggesting a possible
bacterial interaction favourable to stable fly development.
Reduced survival of stable fly larvae on E. coli plates suggests E. coli may not be
effectively digested by immature stable flies, but may produce some by-products that are
favourable to the larvae, as the addition of E. coli to other bacteria had a noticeable
positive effect on immature stable fly growth and survival. In the case of house fly larvae,
E. coli was an adequate food source, but not an optimal one.
Persistence of bacteria in the gut can be indicative that the bacterial species are a
poor food source for larvae, as was the case with stable fly larvae. Larval survival of horn
flies on different bacterial isolates is inversely proportional to the prevalence of the
74
isolate in the gut (Perotti et al. 2001). Bacteria remaining in large amounts in the gut of
larvae are not digested, are not used as a source of nutrients by the maggots, and
consequently survival of the immature fly is reduced on this isolate. Also, survival on a
particular bacterial isolate was positively correlated to its relative abundance in the
rearing environment versus its abundance in the gut. Similarly, Zurek (2000) reared
immature house flies on gut isolates of house fly larvae and found that some were
unsuitable for house fly development, although all were isolated from the guts of growing
larvae. There was no indication of the relative abundance of these bacterial isolates in the
gut or in the original breeding environment.
Dairy and beef cattle are asymptomatic carriers of E. coli 0157:H7. They are also
the primary reservoir of the bacterium, and shed it in their faeces with higher prevalence
in the summer months (Bach et al. 2002). E. coli 0157:H7 can survive for extended
periods of time in manure (Wang et al. 1996) and can also replicate in poorly ensiled
forage (Bach et al. 2002). House flies and stable flies are also present in Alberta in the
summer months. House fly populations show peaks in late June, July and August, while
stable flies peak in August and September (Lysyk 1993a). Both house flies and stable
flies are associated with cattle and can breed in manure. In Alberta dairy farms, house fly
larvae can be found mostly in silage mounds and in residual manure and bedding inside
farm buildings (Lysyk 1993b). Stable fly larvae can be found mostly in manure mounds,
near fence lines and in silage mounds (Lysyk 1993b)]. In the United States, stable fly
larvae were also observed in feed aprons (Meyer and Shultz 1990, Skoda et al. 1991).
House fly larvae will use E. coli as a food source. Since the house fly gut is
moderately favourable for bacterial development, E. coli populations may increase within
75
the larval gut, interspecific bacteria competition permitting. If E. coli remains in the
larval gut until pupation, there is a high probability the adult will harbour it, albeit in
relatively low numbers. Although the teneral house fly adult is infective at emergence
and has a preference for resting indoors, the contaminants acquired later in adult life are
probably of equal epidemiological importance.
Stable flies, on the other hand, are more likely vectors of E. coli during the larval
stage. By sequestering E. coli from the environment in their gut, stable fly larvae may
actually concentrate the E. coli population in particular locations such as fly pupation
sites. As the larvae seek a dryer area to pupate, they may contaminate feed by leaving
behind highly infected pupal cases. This would lead to a higher incidence of infection in
animals, and a greater quantity of infected faeces in the environment, increasing the odds
of eventual human contact.
76
CHAPTER 6. CONCLUSION
E. coli can be acquired by house flies and stable flies in the larval stage and be
carried through metamorphosis to the emerging adult. House fly and stable fly larvae feed
on bacteria in their habitats. E. coli cells fed to house fly and stable fly larvae persists in
the gut for over 48 h in both species. Theis. coli population in the larval guts increased
over time when house fly and stable fly larvae ingested a low dose of bacterial cells.
However, growth of E. coli varied between species when larvae ingested a high
concentration suspension. The E. coli population decreased over time in house fly larvae
and increased in immature stable flies. Changes in the E. coli population over 48 h
suggest each fly species has a different carrying capacity for the bacterium, where stable
fly larval guts can sustain larger E. coli populations compared with house fly larval guts.
The capacity to digest E. coli varied among fly species and affected the persistence of the
bacteria in the larval gut. House fly larvae reared on E. coli alone survived well,
suggesting they were able to digest and utilise the bacterium. Larval stable flies did not
survive well on E. coli alone, suggesting they did not digest and utilise the bacterium.
The undigested E. coli cells were unaffected by the digestive processes, could not be used
as a food source, and remained in the digestive tract of third instars until pupation.
During metamorphosis, E. coli populations increased until day 3 of the pupal stage in
both species, but there was a decrease in bacterial populations in the last day of house fly
metamorphosis while populations remained constant in stable fly pupae. At emergence, a
large proportion of house flies were contaminated with E. coli, while only a small
77
proportion of stable flies were contaminated. In both species, E. coli was found internally
and externally. All empty pupal cases retained large amounts of E. coli.
78
The persistence of E. coli from the larva to the adult house fly is significant.
Undigested bacteria from the larval gut can be found on most teneral adults, making
house flies infective at emergence. The amount of bacteria and how long they persist in
and on the adult are key factors to determining the epidemiological importance of the
contaminants acquired as immatures. Contamination with E. coli from the larva to the
adult is not very significant in stable flies. However, the interaction between this fly
species and E. coli is still epidemiological^ important. Because they cannot digest
E. coli, stable fly larvae actually sequester and accumulate the bacteria in their gut.
Although most teneral adults are free of E. coli, the pupal cases harbour large amounts of
bacteria. Third instars and pupae in feed may contribute to the dissemination of the
bacteria in animals.
The experiments conducted in this study determined the pattern of persistence of
E. coli in house fly and stable fly larvae, and throughout most of the life cycle of these
insects. It would be interesting to see if the patterns of persistence are similar when
E. coli is fed in a mixture of digestible and indigestible bacterial species. This would take
bacterial competition in the larval gut into account and give a more accurate portrait of
the fate of E. coli in flies.
REFERENCES CITED
Abdul-Raouf, U. M., L. R. Beuchat, and M. S. Ammar. 1993. Survival and growth of
Escherichia coli 0157:H7 on salad vegetables. Appl. Environ. Microbiol. 59: 1999-
2006.
Ackers, M. L., B. E. Mahon, E. Leahy, B. Goode, T. Damrow, P. S. Hayes, W. F.
Bibb, D. H. Rice, T. J. Barrett, L. Hutwagner, P. M. Griffin, and L. Slutsker.
1998. An outbreak of Escherichia coli 0157:H7 infections associated with leaf
lettuce consumption. J. Infect. Dis. 177: 1588-93.
Arnold, K. W., and C. W. Kaspar. 1995. Starvation- and stationary-phase-induced acid
tolerance in Escherichia coli 0157:H7. Appl. Environ. Microbiol. 61: 2037-2039.
Bach, S. J., T. A. McAllister, D. M. Veira, V. P. J. Gannon, and R. A. Holley. 2002.
Transmission and control of Escherichia coli 0157:H7 - A review. Can. J. Anim.
Sci. 82: 475-490.
Besser, R. E., S. M. Lett, J. T. Weber, M. P. Doyle, T. J. Barrett, J. G. Wells, and P.
M. Griffin. 1993. An outbreak of diarrhea and hemolytic uremic syndrome from
Escherichia coli 0157:H7 in fresh-pressed apple cider. JAMA 269: 2217-20.
Besser, T. E., D. D. Hancock, L. C. Pritchett, E. M. McRae, D. H. Rice, and P. I.
Tarr. 1997. Duration of detection of fecal excretion of Escherichia coli 0157:H7
in cattle. J Infect Dis 175: 726-9.
Bidawid, S. P., J. F. Edeson, J. Ibrahim, and R. M. Matossian. 1978. The role of non-
biting flies in the transmission of enteric pathogens {Salmonella species and
Shigella species) in Beirut, Lebanon. Ann. Trap. Med. Parasitol. 72: 117-21.
79
Broce, A. B., and R. J. Elzinga. 1984. Comparison of prestomal teeth in the face fly
(Musca autumnalis) and the house fly (Musca domestica) (Diptera: Muscidae). J.
Med. Entomol. 21: 82-5.
Butler, J. F., W. J. Kloft, L. A. DuBose, and E. S. Kloft. 1977. Recontamination of
32
food after feeding a P food source to biting muscidae. J. Med. Entomol. 13: 567-
71.
Campbell, J. B., I. L. Berry, D. J. Boxler, R. L. Davis, D. C. Clanton, and G. H.
Deutscher. 1987. Effects of stable flies (Diptera: Muscidae) on weight gain and
feed efficiency of feedlot cattle. J. Econ. Entomol. 80: 117-119.
Chavasse, D. C , U. Blumenthal, and P. Kolsky. 1994. Fly control in prevention of
diarrhoeal disease. Lancet 344: 1231.
Clark, D. S. 1971. Studies on the surface plate method of counting bacteria. Can. J.
Microbiol. 17: 943-946.
Cohen, D., M. Green, C. Block, R. Slepon, R. Ambar, S. S. Wasserman, and M. M.
Levine. 1991. Reduction of transmission of shigellosis by control of houseflies
(Musca domestica). Lancet 337: 993-7.
Coleman, R. E., and R. R. Gerhardt. 1987. Factors affecting the deposition of
regurgitated materials onto a substrate by Musca autumnalis. J. Agric. Entomol. 4:
185-188.
Coleman, R. E., and R. R. Gerhardt. 1988a. Frequency of regurgitation by laboratory-
reared face flies fed trypticase-soy broth. J. Agric. Entomol. 5: 185-187.
80
Coleman, R. E., and R. R. Gerhardt. 1988b. Effect of temperature, relative humidity,
and amount and concentration of trypticase soy broth on regurgitation by female
face flies (Diptera: Muscidae). Environ. Entomol. 17: 448-451.
Dipeolu, O. O. 1982. Laboratory investigations into the role of Musca vicina and Musca
domestica in the transmission of parasitic helminth eggs and larvae. Int. J. Zoon. 9:
57-61.
Dowding, V. M. 1967. The function and ecological sinificance of the pharyngeal ridges
occuring in the larvae of some cyclorrhaphous Diptera. Parasitology 57: 371-388.
Doyle, M. P. 1991. Escherichia coli 0157:H7 and its significance in foods. Int. J. Food
Microbiol. 12: 289-301.
Duffy, L. L., F. H. Grau, and P. B. Vanderlinde. 2000. Acid resistance of
enterohaemorrhagic and generic Escherichia coli associated with foodborne disease
and meat. J. Food Microbiol. 60: 83-89.
Dunn, P. E. 1986. Biochemical aspects of insect immunology. Ann. Rev. Entomol. 31:
321-339.
DuPont, H. L., M. M. Levine, R. B. Hornick, and S. B. Formal. 1989. Inoculum size
in shigellosis and implications for expected mode of transmission. J Infect Dis 159:
1126-8.
Espinoza-Fuentes, F. P., and W. R. Terra. 1987. Physiological adaptations for
digesting bacteria. Water fluxes and distribution of digestive enzymes in Musca
domestica larval midgut. Insect Biochem. 17: 809-817.
Faust, E. C , P. C. Beaver, and R. C. Jung. 1968. Animal agents and vectors of human
disease, 3rd ed. Lea & Febiger, Philadelphia, Pennsylvania.
81
Fotedar, R. 2001. Vector potential of houseflies {Musca domestica) in the transmission
82
of Vibrio cholerae in India. Acta Trop 78: 31-4.
Fotedar, R., U. Banerjee, S. Singh, Shriniwas, and A. K. Verma. 1992. The housefly
{Musca domestica) as a carrier of pathogenic microorganisms in a hospital
environment. J. Hosp. Infect. 20: 209-15.
Glass, H. W., Jr., and R. R. Gerhardt. 1984. Transmission of Moraxella bovis by
regurgitation from the crop of the face fly (Diptera: Muscidae). J. Econ. Entomol.
77: 399-401.
Glass, H. W., Jr., R. R. Gerhardt, and W. H. Greene. 1982. Survival of Moraxella
bovis in the alimentary tract of the face fly. J. Econ. Entomol. 75: 545-6.
Graczyk, T. K., M. R. Cranfield, R. Fayer, and H. Bixler. 1999. House flies {Musca
domestica) as transport hosts of Cryptosporidiumparvum. Am. J. Trop. Med. Hyg.
61: 500-4.
Gray, S. M., and N. Banerjee. 1999. Mechanisms of arthropod transmission of plant and
animal viruses. Microbiol. Mol. Biol. Rev. 63: 128-148.
Greenberg, B. 1954. A method for the sterile culture of housefly larvae, Musca
domestica L. Can. Ent. 86: 527-528.
Greenberg, B. 1959a. Persistence of bacteria in the developmental stages of the
housefly. II. Quantitative study of the host-contaminant relationship in flies
breeding under natural conditions. Am. J. Trop. Med. Hyg. 8: 412-416.
Greenberg, B. 1959b. Persistence of bacteria in the developmental stages of the
housefly. IV. Infectivity of the newly emerged adult. Am. J. Trop. Med. Hyg. 8:
618-622.
Greenberg, B. 1959c. Persistence of bacteria in the developmental stages of the
83
housefly. III. Quantitative distribution in prepupae and pupae. Am. J. Trop. Med.
Hyg. 8: 613-617.
Greenberg, B. 1959d. Persistence of bacteria in the developmental stages of the
housefly. I. Survival of enteric pathogens in the normal and aseptically reared host.
Am. J. Trop. Med. Hyg. 8: 405-411.
Greenberg, B. 1962. Host-contaminant biology of muscoid flies: II. Bacterial survival in
the stable fly, false stable fly. and the little house fly. J. Insect Pathol. 4: 216-223.
Greenberg, B. 1964. Experimental transmission of Salmonella typhimurium by
houseflies to man. Am. J. Hyg. 80: 149-156.
Greenberg, B. 1965. Flies and disease. Scientific American 213: 92-99.
Greenberg, B. 1971. Flies and disease: ecology, classification and biotic associations,
vol. I. Princeton University Press, Princeton, NJ.
Greenberg, B. 1973. Flies and disease: biology and disease transmission, vol. II.
Princeton University Press, Princeton. NJ.
Jacobs-Lorena, M., and M. M. Oo. 1996. The peritrophic matrix of insects, pp. 318-
331. In B. J. Beaty and W. C. Marquarlt (eds.), Biology of Disease Vectors.
University Press, Colorado State University. Ft. Collins.
Jiang, C , E. H. Baehrecke, and C. S. Thummel. 1997. Steroid regulated programmed
cell death during Drosophila metamorphosis. Development 124: 4673-83.
Kobayashi, M., T. Sasaki, N. Saito, K. Tamura, K. Suzuki, H. Watanabe, and N.
Agui. 1999. Houseflies: not simple mechanical vectors of enterohemorrhagic
Escherichia coli 0157:H7. Am. J. Trop. Med. Hyg. 61: 625-9.
Kovacs, F., I. Medveczky, L. Papp, and E. Gondar. 1990. Role of prestomal teeth in
feeding of the house fly, Musca domestica (Diptera; Muscidae). Med. Vet.
Entomol. 4: 331-5.
Lehane, M. J. 1997. Peritrophic matrix structure and function. Ann. Rev. Entomol. 42:
525-550.
Lemos, F. J. A., and W. R. Terra. 1991. Digestion of bacteria and the role of midgut
lysozyme in some insect larvae. Comparative Biochemistry and Physiology Part B:
Biochemistry and Molecular Biology 100: 265-268.
Lemos, F. J. A., A. F. Ribeiro, and W. R. Terra. 1993. A bacteria-digesting midgut-
lysozyme from Musca domestica (Diptera) larvae. Purification, properties and
secretory mechanism. Insect Biochem. Molec. Biol. 23: 533-541.
Levine, O. S., and M. M. Levine. 1991. Houseflies (Musca domestica) as mechanical
vectors of shigellosis. Rev. Infect. Dis. 13: 688-96.
Lindsay, D. R., and H. I. Scudder. 1956. Nonbiting flies and disease. Ann. Rev.
Entomol. 1: 323-346.
Lysyk, T. J. 1991. Modeling oviposition of the house fly (Diptera: Muscidae). Can. Ent.
123:345-352.
Lysyk, T. J. 1993a. Seasonal abundance of stable flies and house flies (Diptera:
Muscidae) in dairies in Alberta, Canada. J. Med. Entomol. 30: 888-95.
Lysyk, T. J. 1993b. Adult resting and larval developmental sites of stable flies and house
flies (Diptera: Muscidae) on dairies in Alberta. J. Econ. Entomol. 86: 1746-1753.
Lysyk, T. J. 1998. Relationships between temperature and life-history parameters of
Stomoxys calcitrans (Diptera: Muscidae). J. Med. Entomol. 35: 107-19.
84
Lysyk, T. J. 2001. Relationships between temperature and life history parameters of
Muscidifuraxzaraptor (Hymenoptera: Pteromalidae). Environ. Entomol. 30: 147-
156.
Lysyk, T. J., and R. C. Axtell. 1986. Movement and distribution of house flies (Diptera:
Muscidae) between habitats in two livestock farms. J. Econ. Entomol. 79: 993-998.
Lysyk, T. J., and R. C. Axtell. 1987. A simulation model of house fly (Diptera:
Muscidae) development in poultry manure. Can. Ent. 119: 427-437.
Lysyk, T. J., L. Kalischuk-Tymensen, L. B. Selinger, R. C. Lancaster, L. Wever, and
K. J. Cheng. 1999. Rearing stable fly larvae (Diptera: Muscidae) on an egg yolk
medium. J. Med. Entomol. 36: 382-8.
Meyer, J. A., and T. A. Shultz. 1990. Stable fly and house fly breeding sites on dairies.
California Agriculture 44: 28-29.
Mihok, S., O. Maramba, E. Munyoki, and J. Kagoiya. 1995. Mechanical transmission
of Trypanosoma spp. by African Stomoxyinae (Diptera: Muscidae). Trop. Med.
Parasitol. 46: 103-5.
Miller, L. G., and C. W. Kaspar. 1994. Escherichia coli 0157:H7 acid tolerance and
survival in apple cider. J. Food Prot. 57: 460-464.
Moriya, K., T. Fujibayashi, T. Yoshihara, A. Matsuda, N. Sumi, N. Umezaki, H.
Kurahashi, N. Agui, A. Wada, and H. Watanabe. 1999. Verotoxin-producing
Escherichia coli 0157:H7 carried by the housefly in Japan. Med. Vet. Entomol. 13:
214-6.
85

Mubiru, D. N., M. S. Coyne, and J. H. Grove. 2000. Mortality of Escherichia coli
86
0157:H7 in two soils with different physical and chemical properties. J. Environ.
Qual. 29: 1821-1825.
Mumcuoglu, K. Y., J. Miller, M. Mumcuoglu, M. Friger, and M. Tarshis. 2001.
Destruction of bacteria in the digestive tract of the maggot of Lucillia sericata
(Diptera: Calliphoridae). J. Med. Entomol. 38: 161-6.
Ogden, L. D., D. R. Fenlon, A. J. Vinten, and D. Lewis. 2001. The fate of Escherichia
coli 0157 in soil and its potential to contaminate drinking water. Int. J. Food
Microbiol. 66: 111-7.
Perotti, M. A., T. J. Lysyk, L. D. Kalischuk-Tymensen, L. J. Yanke, and L. B.
Selinger. 2001. Growth and survival of immature Heamatobia irritans (Diptera;
Muscidae) is influenced by bacterial isolated from cattle manure and conspecific
larvae. J. Med. Entomol. 38: 180-7.
Radvan, R. 1960a. Persistence of bacteria during development in flies. II. The number of
surviving bacteria. Folia Microbiol. 5: 85-91.
Radvan, R. 1960b. Persistence of bacteria during development in flies. III. localization
of the bacteria and transmission after emergence of the fly. Folia Microbiol. 5: 149-
155.
Sasaki, T., M. Kobayashi, and N. Agui. 2000. Epidemiological potential of excretion
and regurgitation by Musca domestica (Diptera: Muscidae) in the dissemination of
Escherichia coli 0157:H7 to food. J. Med. Entomol. 37: 945-9.
Schmidtmann, E. T. 1985. Arthropod pests of dairy cattle, pp. 223-238. In R. E.
87
Williams, R. D. Hall, A. B. Broce and P. J. Scholl (eds.), Livestock entomology.
John Wiley & Sons, New York.
Schmidtmann, E. T., and P. A. Martin. 1992. Relationship between selected bacteria
and the growth of immature house flies, Musca domestica, in an axenic test system.
J. Med. Entomol. 29: 232-5.
Shane, S. M., M. S. Montrose, and K. S. Harringtion. 1985. Transmission of
Campylobacter jejuni by the housefly (Musca domestica). Avian Dis. 29: 384-391.
Shere, J. A., K. J. Bartlett, and C. W. Kaspar. 1998. Longitudinal study of Escherichia
coli 0157:H7 dissemination on four dairy farms in Wisconsin. Appl. Environ.
Microbiol. 64: 1390-9.
Skoda, S. R., G. D. Thomas, and J. B. Campbell. 1991. Developmental sites and
relative abundance of immature stages of the stable fly (Diptera: Muscidae) in beef
cattle feedlot pens in eastern Nebraska. J. Econ. Entomol. 84: 191-7.
SPSS Inc. 1989-1999. SPSS for Windows, version 10.0.5. SPSS, Chicago, IL.
Straif, S., W. Maier, and H. M. Seitz. 1990. Regurgitation as a potential mechanism of
pathogen transmission in the biting fly Stomoxys calcitrans. Z. Angew. Zoo!. 77:
357-366.
Sulaiman, S., A. R. Sohadi, H. Yunus, and R. Iberahim. 1988. The role of some
cyclorrhaphan flies as carriers of human helminths in Malaysia. Med. Vet.
Entomol. 2: 1-6.
Tan, S. W., K. L. Yap, and H. L. Lee. 1997. Mechanical transport of rotavirus by the
legs and wings of Musca domestica (Diptera: Muscidae). J. Med. Entomol. 34: 527-
31.
Tellam, R. L. 1996. The peritrophic matrix, pp. 86-114. In M. J. Lehane and P. F.
Billingsley (eds.), Biology of the Insect Midgut. Chapman & Hall, London.
Terra, W. R., C. Ferreira, and J. E. Baker. 1996. Compartmentalization of digestion,
pp. 207-235. In M. J. Lehane and P. F. Billingsley (eds.), Biology of the Insect
Midgut. Chapman & Hall, London.
Terra, W. R., F. P. Espinoza-Fuentes, A. F. Ribeiro, and C. Ferreira. 1988. The
larval midgut of the housefly {Musca domestica): ultrastructure, fluid fluxes and
ion secretion in relation to the organization of digestion. J. Insect Physiol. 34: 463-
472.
Teskey, H. J. 1990. The insects and arachnids of Canada. Part 16: the horse flies and
deer flies of Canada and Alaska (Diptera: Tabanidae). Canadian Government
Publishing Centre, Supply and Services Canada, Ottawa, Canada.
Thomas, D. B. 1985. Phenology of intra-puparial metamorphosis in horn fly and stable
fly. A note on the diapause stage of the horn fly. Southwest. Entomol. 10: 139-149.
Wang, G., T. Zhao, and M. P. Doyle. 1996. Fate of enterohemorrhagic Escherichia coli
0157:H7 in bovine feces. Appl. Environ. Microbiol. 62: 2567-70.
Watson, D. W„ P. A. Martin, and E. T. Schmidtmann. 1993. Egg yolk and bacteria
growth medium for Musca domestica (Diptera: Muscidae). J. Med. Entomol. 30:
820-3.
88
West, L. S. 1951. The housefly: its natural history, medical importance, and control.
89
Comstock Pub. Co., Ithaca, NY.
Wieman, G. A., J. B. Campbell, J. A. Deshazer, and I. L. Berry. 1992. Effects of
stable flies (Diptera: Muscidae) and heat stress on weight gain and feed efficiency
of feeder cattle. J. Econ. Entomol. 85: 1835-42.
Zhao, T., M. P. Doyle, J. Shere, and L. Garber. 1995. Prevalence of
enterohemorrhagic Escherichia coli 0157:H7 in a survey of dairy herds. Appl.
Environ. Microbiol. 61: 1290-3.
Zurek, L., C. Schal, and D. W. Watson. 2000. Diversity and contribution of the
intestinal bacterial community to the development of Musca domestica (Diptera:
Muscidae) larvae. J. Med. Entomol. 37: 924-8.
Zurek, L., S. S. Denning, C. Schal, and D. W. Watson. 2001. Vector competence of
Musca domestica (Diptera: Muscidae) for Yersinia pseudotuberculosis. J. Med.
Entomol. 38: 333-5.