Embed Size (px)
Citation preview
i
Person Identification Based on Palm
and Hand Geometry
Qaisar Naveed Ashraf
(Thesis submitted in partial fulfillment of requirements for BS Degree in
Computer and Information Sciences)
Pakistan Institute of Engineering and Applied Sciences,
Nilore-45650, Islamabad
March, 2009

ii

iii
Declaration of Originality
I hereby declare that work contained in this thesis is the product of my own work.
This thesis has not been previously published in any form nor does it contain any
material which could be treated as contravention of the international copyright law.
The material in this thesis which is not my own work has been identified.
I also declare that I do understand the terms ‗copyright‘ and ‗plagiarism,‘ and
that in case of any copyright violation or plagiarism found in this work, I will be held
fully responsible of the consequences of any such violation.
Signature:_________________
Author‘s Name: Qaisar Naveed Ashraf
(March, 2009)

iv
Certificate of Approval
It is certified that the work contained in this thesis entitled
―Person Identification Based on Palm and Hand Geometry”
was carried out by Mr. Qaisar Naveed Ashraf under my supervision and that, in my
opinion it is fully adequate, in scope and quality for the degree of BS in Computer and
Information Sciences.
Approved by:
Signature: ____________________
Supervisor‘s Name: Fayyaz A. Afsar
(March, 2009)

v
Dedication
Dedicated to my God, Beloved Family and Teachers

vi
Acknowledgement
During my four-year study at PIEAS, I received an incredible amount of support and
encouragement, both technical and moral, from Faculty and Colleagues.
First and foremost praises and thanks to ALLMIGHTY ALLAH who bestowed upon us
all blessings, intelligence and faculty of searching and learning.
I would like to express my gratitude to my project supervisor, Fayyaz Ul Amir
Afsar Minhas (DCIS, PIEAS). I learned a lot from our discussion and his encouraging
approach. I would also like to thank my examiners Dr. Muhammad, Arif (DCIS,
PIEAS), Dr. Abdul Jalil (DCIS, PIEAS), Dr. Abdul Majid (DCIS, PIEAS) and Dr.
Javed Khurshid (DCIS, PIEAS). They opened useful discussion on my research. In
course of my Final year project, they have provided me with obliging guidance,
comments and criticism, which has driven me to the success of my research.
I would like to thank my all colleagues especially Numan Ali, Ali Imran, Obaid
Ullah, and Bushra Sadia for their support in making a database for this research.
I would like to express my sincere gratitude to my family members for their
love and support from the day I came to the world.
vii
Table of Contents
LIST OF FIGURES ................................................................................................................................... IX
LIST OF TABLES ..................................................................................................................................... XI
ABSTRACT ............................................................................................................................................... XII
CHAPTER 1- INTRODUCTION ............................................................................................................ 1
1.1 BIOMETRICS ........................................................................................................................... 2
1.1.1 Evaluation of Biometrics and Biometric System ............................................................... 2
1.1.2 Biometric Technologies .................................................................................................... 3
1.1.3 Applications of Biometric Systems ................................................................................. 10
1.2 SYSTEM ARCHITECTURE AND OPERATIONS ......................................................................... 10
1.3 HAND GEOMETRY AND PALM PRINT ANATOMY ................................................................... 11
1.4 LITERATURE SURVEY ........................................................................................................... 13
1.5 ORGANIZATION OF THIS THESIS ........................................................................................... 13
SUMMARY .......................................................................................................................................... 14
CHAPTER 2- DATA ACQUISITION ................................................................................................... 15
CHAPTER 3- SYSTEM ARCHITECTURE ........................................................................................ 18
3.1 IMAGE PRE-PROCESSING ...................................................................................................... 18
3.1.1 Image Cropping .............................................................................................................. 19
3.1.2 Grayscale conversion ..................................................................................................... 19
3.1.3 Binary Thresholding ....................................................................................................... 19
3.1.4 Noise removal ................................................................................................................. 19
3.1.5 Peg Removal ................................................................................................................... 20
3.1.6 Edge Detection ............................................................................................................... 21
3.2 FEATURE EXTRACTION ........................................................................................................ 22
3.3 CLASSIFICATION .................................................................................................................. 23
CHAPTER 4- FEATURE EXTRACTION APPROACHES ............................................................... 24
4.1 HAND SHAPE RECOGNITION USING PRINCIPAL COMPONENT ANALYSIS .............................. 24
4.1.1 Original Method of Eigenspace Projection .................................................................... 24
4.1.2 Snapshot Method ............................................................................................................ 26
4.1.3 Experimental Results ...................................................................................................... 28
4.2 EXTRACTION OF HAND GEOMETRY FEATURES USING IMAGE PROCESSING TECHNIQUES .... 30
4.2.1 Image pre-processing ..................................................................................................... 30
4.2.2 Feature Extraction .......................................................................................................... 30
viii
4.2.3 Experimental Results ...................................................................................................... 33
4.3 TEXTURE ANALYSIS OF PALMPRINT USING WAVELETS ........................................................ 35
4.3.1 Wavelet Transform (WT) ................................................... Error! Bookmark not defined.
4.3.2 Image Pre-processing ..................................................................................................... 39
4.3.3 Feature Extraction .......................................................................................................... 39
4.3.4 Feature Normalization ................................................................................................... 39
4.3.5 Experimental Results ...................................................................................................... 40
CHAPTER 5- FEATURE INTEGRATION AND REDUCTION ....................................................... 41
5.1 FEATURE INTEGRATION ....................................................................................................... 41
5.2 FEATURE REDUCTION .......................................................................................................... 42
5.2.1 Principle Component Analysis as a feature reduction technique ................................... 42
CHAPTER 6- EXPERIMENTAL RESULTS BY COMBINING THE THREE TECHNIQUES
AND AFTER FEATURE REDUCTION .................................................................................................. 44
6.1 EXPERIMENTAL RESULTS BY INTEGRATING HAND GEOMETRY AND PCA FEATURES .......... 44
6.2 EXPERIMENTAL RESULTS BY INTEGRATING HAND GEOMETRY AND PALM TEXTURE
FEATURES .......................................................................................................................................... 45
6.3 EXPERIMENTAL RESULTS BY INTEGRATING PALM TEXTURE AND PCA FEATURES .............. 46
6.4 EXPERIMENTAL RESULTS BY INTEGRATING ALL THE THREE TECHNIQUES .......................... 47
CHAPTER 7- CONCLUSION AND FUTURE DIRECTIONS .......................................................... 49
ix
List of Figures
Figure 1-1 Different Biometrics ..................................................................................... 4
Figure 1-2 Different Biometric Technologies ................................................................ 8
Figure 1-3 The Modules of Biometric-Based Verification Systems ........................... 11
Figure 1-4 Hand Geometry Features............................................................................ 12
Figure 1-5 Sample Palm Print and Principal Lines of Palm Print ............................... 13
Figure 2-1 Input Device for Data Acquisition ............................................................. 16
Figure 2-2 Sample Hand image of the database .......................................................... 16
Figure 3-1 Architecture a Conceptual Biometric System ............................................ 18
Figure 3-2 Image Processing Block Diagram .............................................................. 18
Figure 3-3 Image Processing Steps .............................................................................. 22
Figure 4-1 The Experimental Results Generated by Using PCA and DB1 ................. 29
Figure 4-2 Results of DB2 Applying PCA .................................................................. 29
Figure 4-3 Finger Tips and Valley Point Detection ..................................................... 31
Figure 4-4 Image Cropping for Fingertip Identification and Valley Identification ..... 32
Figure 4-5 Features of Hand geometry ........................................................................ 33
Figure 4-6 Experimental Results Using Hand Geometry Features and DB1 .............. 34
Figure 4-7 Experimental Results Using Hand Geometry Features and DB2 .............. 34
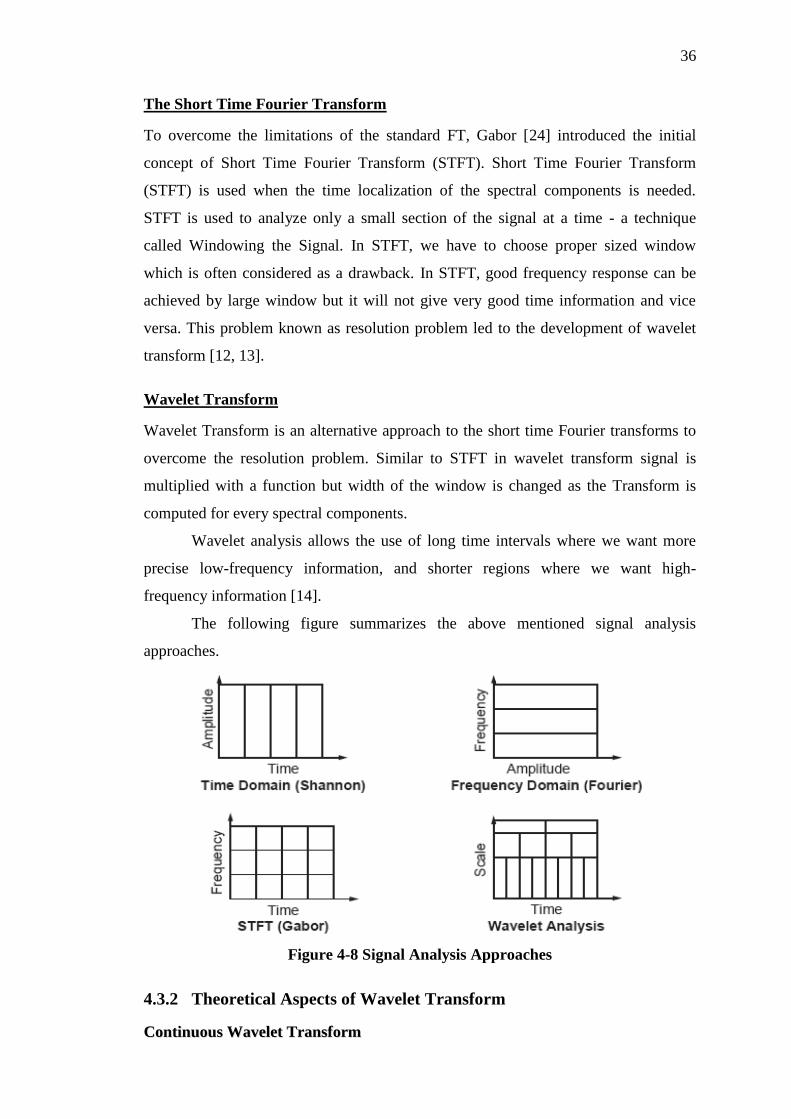
Figure 4-8 Signal Analysis Approaches ...................................................................... 36
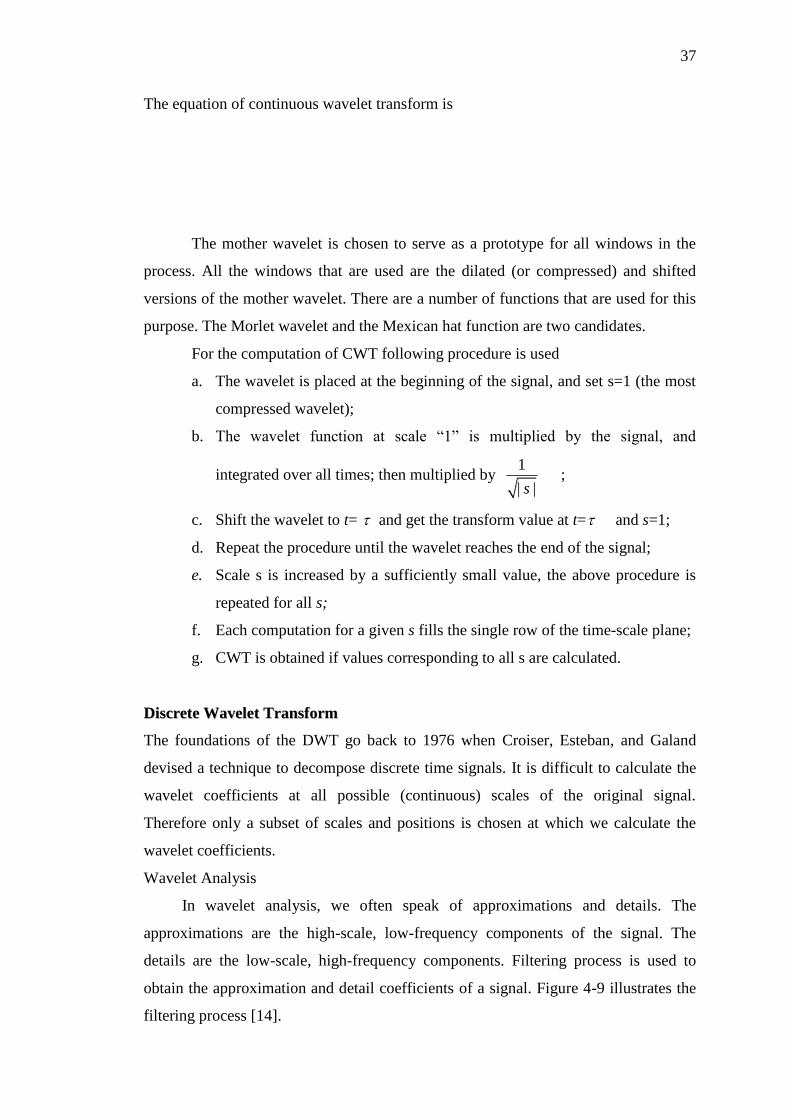
Figure 4-9 Filtering Process ......................................................................................... 38
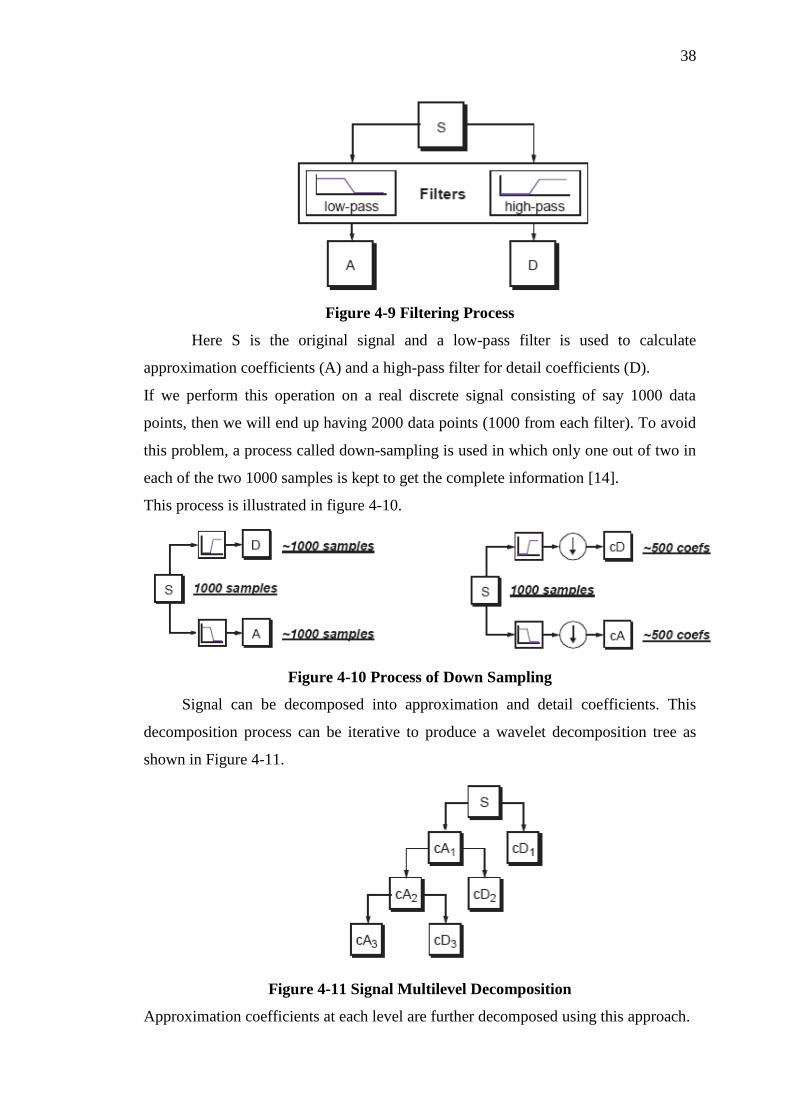
Figure 4-10 Process of Down Sampling ...................................................................... 38
Figure 4-11 Signal Multilevel Decomposition ............................................................ 38
Figure 4-12 Experimental Results by Using Texture Features and DB1..................... 40
Figure 4-13 Experimental Results by Using Texture Features and DB2..................... 40
Figure 7-1 Experimental Results Using PCA and Hand Geometry and DB1 ............. 44
Figure 7-2 Experimental Results Rsing PCA and Hand Geometry Features and DB2
...................................................................................................................................... 45
Figure 7-3 Experimental Results Using Wavelets and Hand Features and DB1 ......... 45
Figure 7-4 Experimental Results Using Wavelets and Hand Features and DB2 ......... 46
Figure 7-5 Experimental Results Using PCA and Wavelets ....................................... 46
Figure 7-6 Experimental Results of DB2 using PCA and Wavelets ........................... 47
Figure 7-7 Experimental Results Using Combine Features of Hand Geometry, PCA
and Wavelets ................................................................................................................ 47

x
Figure 7-8 Experimental Results of DB2 Using PCA, Hand Geometry and Wavelets
...................................................................................................................................... 48

xi
List of Tables
Table 1-1 Comparisons of Biometric Technologies: High, Medium, and Low are
Denoted by H, M, and L, Respectively .......................................................................... 9
Table 1-2 Comparison with Different Biometrics and Algorithms ............................... 9
Table 3-1 M-by-N Neighborhood having Exact Centre .............................................. 20
Table 3-2 M-by-N Neighborhood having no Exact Centre ......................................... 20
Table 5-1 Performance Analysis of the Techniques (Individual vs. Integrated) ......... 41
Table 5-2 Experimental Results of Wavelets Selecting Diff. No. of Features ............ 42
xii
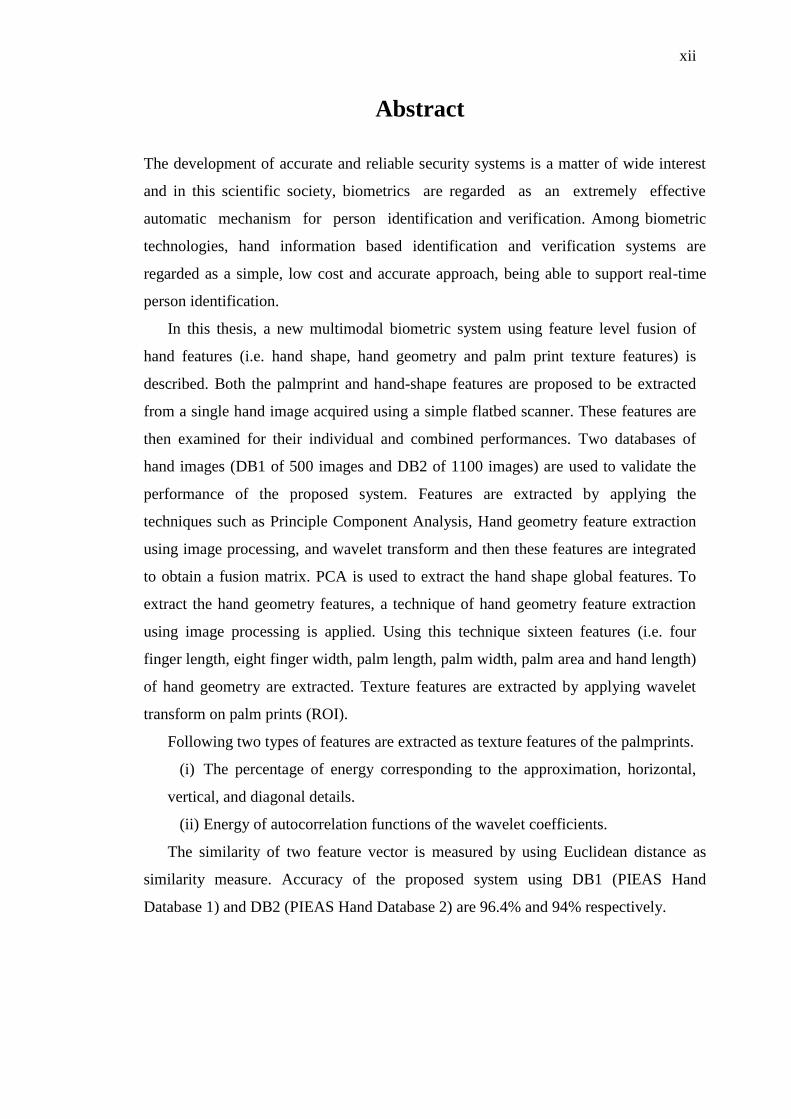
Abstract
The development of accurate and reliable security systems is a matter of wide interest
and in this scientific society, biometrics are regarded as an extremely effective
automatic mechanism for person identification and verification. Among biometric
technologies, hand information based identification and verification systems are
regarded as a simple, low cost and accurate approach, being able to support real-time
person identification.
In this thesis, a new multimodal biometric system using feature level fusion of
hand features (i.e. hand shape, hand geometry and palm print texture features) is
described. Both the palmprint and hand-shape features are proposed to be extracted
from a single hand image acquired using a simple flatbed scanner. These features are
then examined for their individual and combined performances. Two databases of
hand images (DB1 of 500 images and DB2 of 1100 images) are used to validate the
performance of the proposed system. Features are extracted by applying the
techniques such as Principle Component Analysis, Hand geometry feature extraction
using image processing, and wavelet transform and then these features are integrated
to obtain a fusion matrix. PCA is used to extract the hand shape global features. To
extract the hand geometry features, a technique of hand geometry feature extraction
using image processing is applied. Using this technique sixteen features (i.e. four
finger length, eight finger width, palm length, palm width, palm area and hand length)
of hand geometry are extracted. Texture features are extracted by applying wavelet
transform on palm prints (ROI).
Following two types of features are extracted as texture features of the palmprints.
(i) The percentage of energy corresponding to the approximation, horizontal,
vertical, and diagonal details.
(ii) Energy of autocorrelation functions of the wavelet coefficients.
The similarity of two feature vector is measured by using Euclidean distance as
similarity measure. Accuracy of the proposed system using DB1 (PIEAS Hand
Database 1) and DB2 (PIEAS Hand Database 2) are 96.4% and 94% respectively.
1
Chapter 1- Introduction
In recent years, biometric technology is one of the newest research topics in the
Information Technology field. It finds its applications for accurate person
identification or verification in security systems such as electronic fund transfer,
online shopping, e-commence, e-banking, access control, immigration, attendance
control, and law enforcement etc. Although conventional tackles including password,
physical key and smart card in security systems are widely applied but high level
security standard and requirements in our sophisticated society still cannot be satisfied
because these tools are subject to easy loss, duplication and low accuracy. In current
Internet-based applications, the password is the most common tool to identify a
person however its reliability is very limited.
Traditionally, two major approaches for person identification have been in use
[1]:
(i) Token Based- approaches establish the identity of a person on the basis
of possession of a token, such as an ID card or a driver‘s license.
(ii) Knowledge based- approaches rely on the possession of certain
information e.g. a password by the subject in making an identification
decision.
Advantages of these approaches are simplicity, ease if use, and low system
integration cost. The important draw backs of these approaches are as follows:
(i) Possessions (e.g. ID card) can be lost, stolen or easily duplicated.
(ii) Knowledge (e.g. password) can be forgotten.
(iii) Both possessions and knowledge can be shared or stolen.
Using physiological or behavioral characteristics, or biometric, provides a
solution to the conventional problems and presents more secure and more reliable
authentication systems.
The human hands are used to grasp, throw, and make tools but today it has another use,
a media to verify identity. The physical dimensions of a human hand contain
information that is capable of authenticating the identity of an individual. This
information has been popularly known as palm contents or hand geometry.
2
1.1 Biometrics
Biometrics is the science and technology of measuring and analyzing biological data.
In information technology, biometrics refers to technologies that measure and analyze
human body characteristics, such as fingerprints, eye retinas and irises, voice patterns,
facial patterns and hand measurements, for authentication purposes.
Currently, almost all systems involve an identity authentication process before
a user can access the requested services; such as, online transactions, entrance to a
secured vault, logging into a computer system, accessing laptops, secure access to
buildings, etc. Therefore, authentication has become the core of any secure system.
Biometric technologies increasingly are being used by government agencies and
private industry to verify a person‘s identity, secure the nation‘s borders (as possible),
and to restrict access to secure sites including buildings and computer networks.
Biometric systems provide the solution to ensure that the rendered services are
accessed only by a legitimate user and no one else. Biometric Systems identify users
based on behavioral or physiological characteristics.
Enterprise-wide network security infrastructures, secure electronic banking,
investing and other financial transactions, retail sales, law enforcement, and health
and social services are already benefiting from these technologies. A range of new
applications can be found in such miscellaneous environments as hilarity parks,
banks, and other financial organizations, business enterprises and administration
networks, passport programs and driver licenses, universities and physical access to
multiple facilities (night clubs).
1.1.1 Evaluation of Biometrics and Biometric System
Any human physiological and/or behavioral characteristic can be used as a biometric
identifier for person identification as long as it satisfies the following requirements:
a. Universality
Universality points out the ratio of people possessing a particular biometric so
each person should have the Biometrics.
b. Distinctiveness
Which means that any two person should be ―sufficiently different‖ in terms
of their biometric identifiers.
c. Permanence
3
Permanence implies the stability of a biometric. Which means that the
characteristics should be invariant with time.
d. Collectability
Which means that the characteristics should be measured quantitatively. If the
data collection process is too complex or requires high cost input devices, the
collectability of that biometric is low.
Other issues to be considered in a practical biometric system include:
a. Performance
It refers to the achievable recognition accuracy and speed, the resources
required, as well as the operational and environmental conditions that may
affect the accuracy and speed. It is measured by two rates:
(i) False Acceptance Rate (FAR)
(ii) False Rejection Rate (FRR)
Reducing FAR (FRR) means increasing FRR (FAR). Equal Error Rate (EER)
or crossover rate also implies precision. A system with 1% EER or crossover
rate means that this system has 1% FRR and 1% FAR [14].
b. Acceptability
To what extend people are willing to accept and use the biometric system as
part of their daily lives.
c. Degree of intrusiveness
How much co-operation is required from the user to collect the biometric
sample.
d. Circumvention
Which means how easy it is to fool the system by fraudulent techniques i.e.
degree of vulnerability to fraud.
e. Long-term system support
DB management, re-enrollment, template updating, etc
A practical biometric system should have acceptable recognition accuracy and
speed with reasonable resource requirements, user friendly, accepted by the intended
population, reliable and sufficiently robust to various fraudulent methods.
1.1.2 Biometric Technologies
A large number of biometric features are available for use in person identification and
verification and it can be broadly categorized as:
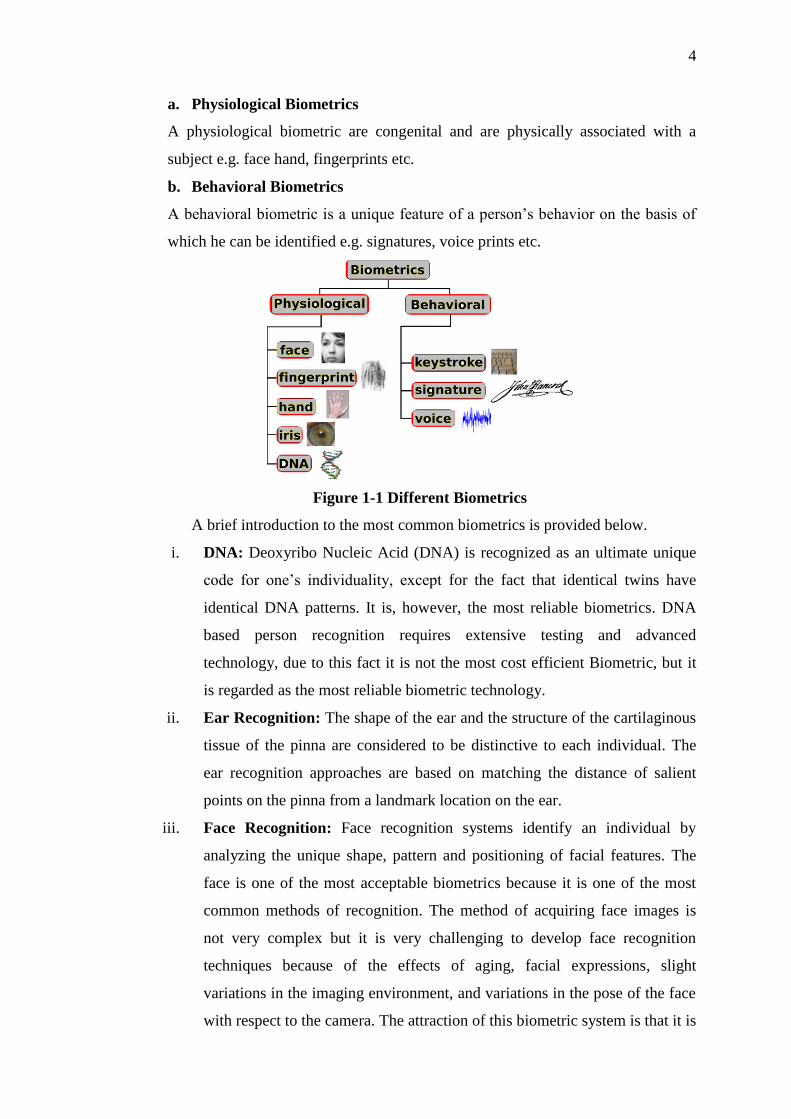
4
a. Physiological Biometrics
A physiological biometric are congenital and are physically associated with a
subject e.g. face hand, fingerprints etc.
b. Behavioral Biometrics
A behavioral biometric is a unique feature of a person‘s behavior on the basis of
which he can be identified e.g. signatures, voice prints etc.
Figure 1-1 Different Biometrics
A brief introduction to the most common biometrics is provided below.
i. DNA: Deoxyribo Nucleic Acid (DNA) is recognized as an ultimate unique
code for one‘s individuality, except for the fact that identical twins have
identical DNA patterns. It is, however, the most reliable biometrics. DNA
based person recognition requires extensive testing and advanced
technology, due to this fact it is not the most cost efficient Biometric, but it
is regarded as the most reliable biometric technology.
ii. Ear Recognition: The shape of the ear and the structure of the cartilaginous
tissue of the pinna are considered to be distinctive to each individual. The
ear recognition approaches are based on matching the distance of salient
points on the pinna from a landmark location on the ear.
iii. Face Recognition: Face recognition systems identify an individual by
analyzing the unique shape, pattern and positioning of facial features. The
face is one of the most acceptable biometrics because it is one of the most
common methods of recognition. The method of acquiring face images is
not very complex but it is very challenging to develop face recognition
techniques because of the effects of aging, facial expressions, slight
variations in the imaging environment, and variations in the pose of the face
with respect to the camera. The attraction of this biometric system is that it is
5
able to operate 'hands-free', limiting the amount of man-machine interaction.
However, this biometric system is highly unreliable and expensive. For
example, it may be not able distinguish twins or triplets, not recognize the
client after a haircut, and not recognize a individual who changes from
wearing and not wearing glasses.
iv. Facial, hand, and hand vein infrared thermograms: The pattern of heat
radiated by the human body is a feature of each individual body and can be
captured by an infrared camera in an unremarkable way much like a regular
photograph. The technology could be used for hidden recognition and could
distinguish between identical twins. A thermogram-based system is non-
contact and not disturbing but sensing challenges in uncontrolled
environments, such as, room heaters and vehicle exhaust pipes, may
drastically affect the image acquisition phase. A related technology using
near infrared imaging is used to scan the hand or hand vein structure.
Infrared sensors are expensive which inhibit the widespread use of
thermograms.
v. Gait: Gait is the peculiar way one walks and is a complex biometric. Gait is
not supposed to be very distinctive, but is sufficiently characteristic to allow
verification in some low-security applications. Gait is a behavioral biometric
and may not stay invariant, especially over a large period of time, due to
large fluctuations of body weight, major shift in the body weight, major
injuries involving joints or brain, or due to inebriety. Acquisition of gait is
similar to acquiring facial pictures and hence it may be an acceptable
biometric technology.
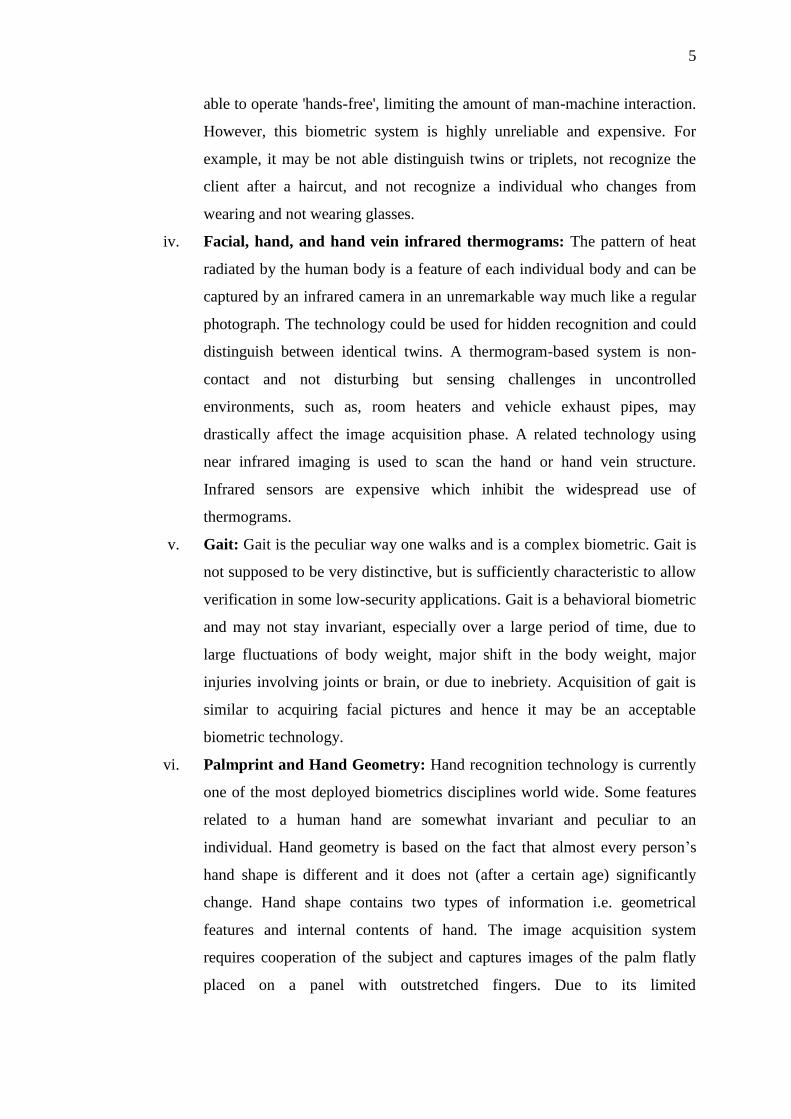
vi. Palmprint and Hand Geometry: Hand recognition technology is currently
one of the most deployed biometrics disciplines world wide. Some features
related to a human hand are somewhat invariant and peculiar to an
individual. Hand geometry is based on the fact that almost every person‘s
hand shape is different and it does not (after a certain age) significantly
change. Hand shape contains two types of information i.e. geometrical
features and internal contents of hand. The image acquisition system
requires cooperation of the subject and captures images of the palm flatly
placed on a panel with outstretched fingers. Due to its limited

6
distinctiveness, hand geometry-based systems are typically used for
verification and do not scale well for identification applications.
vii. Fingerprint Identification: Fingerprint identification is the most commonly
recognized and most widely applied form of Biometric technology.
Fingerprint identification is based upon the fact that a person's fingerprint is
completely unique to the individual. A fingerprint is made of a series of
ridges and creases on the surface of the finger. Current fingerprint systems
utilize minutiae and singular points as the features. Fingerprint has high
performance, uniqueness and user acceptance. However, some people‘s
fingerprints are not easy to be clearly captured. Fingerprint identification
systems are preferred because of their compact size.
viii. Iris: Biometrics which analyzes the complex and unique characteristics of
the eye can be divided into two different fields: iris biometrics and retina
biometrics. It is the colored ring of tissue that surrounds the pupil of the eye.
Iris recognition is based on visible features, i.e. rings, furrows, freckles and
the corona. Features and their location are used to form the Iris codes, which
is the digital template. It is widely regarded as the most safe, accurate
biometrics technology. An iris image is typically captured using a non-
contact imaging process. Capturing an iris image involves cooperation from
the user, both to register the image of iris in the central imaging area and to
ensure that the iris is at a predetermined distance from the focal plane of the
camera.
ix. Retinal scan: The retina is the layer of blood vessels at the back of the eye.
The blood vessel pattern in the retina is the feature for retinal recognition
technology. The retinal vasculature is rich in structure and is supposed to be
a characteristic of each individual and each eye. It is claimed to be the most
secure biometric since it is not easy to change or replicate the retinal
vasculature. The image capture requires a user‘s eye to be aligned with the
camera target. The image acquisition involves cooperation of the subject,
requires contact with the eyepiece, and a conscious effort on the part of the
user. All these factors adversely affect public acceptability of retinal
biometrics. The primary advantage of the time domain representation of the
retinal signature is computational efficiency.
7
x. Signature Recognition: The way a person signs his name is known to be a
characteristic of that individual. The user sings his signature on a digitized
graphics tablet. Signature aspects, such as speed, stroke order, stroke count
and pin pressure is analyzed. Although signatures require contact and effort
with the writing instrument, they seem to be acceptable in many
government, legal, and commercial transactions as a method of verification.
Signatures are a behavioral biometric that change over a period of time and
are influenced by physical and emotional conditions of the signatories.
Signatures of some people vary a lot even successive impressions of their
signature are significantly different. Furthermore, professional forgers can
reproduce signatures to fool the unskilled eye.
xi. Voice Verification: Voice verification is the science of verifying a person's
identity on the basis of their voice characteristics. Voice recognition is not
the same as speech recognition, it is speaker recognition. It is different from
speech recognition because the technology does not recognize the spoken
word itself. Rather, it recognizes the speaker of the words by analyzing
unique speech characteristics, such as the frequency between phonetics. It is
considered both physiological and behavioral characteristic. This biometric
is popular and low-cost, but less accurate and sometimes lengthy enrollment.
xii. Other Technologies: Other technologies such as keystrokes, body odor, lip
shape etc. are also under investigation for person identification.
8
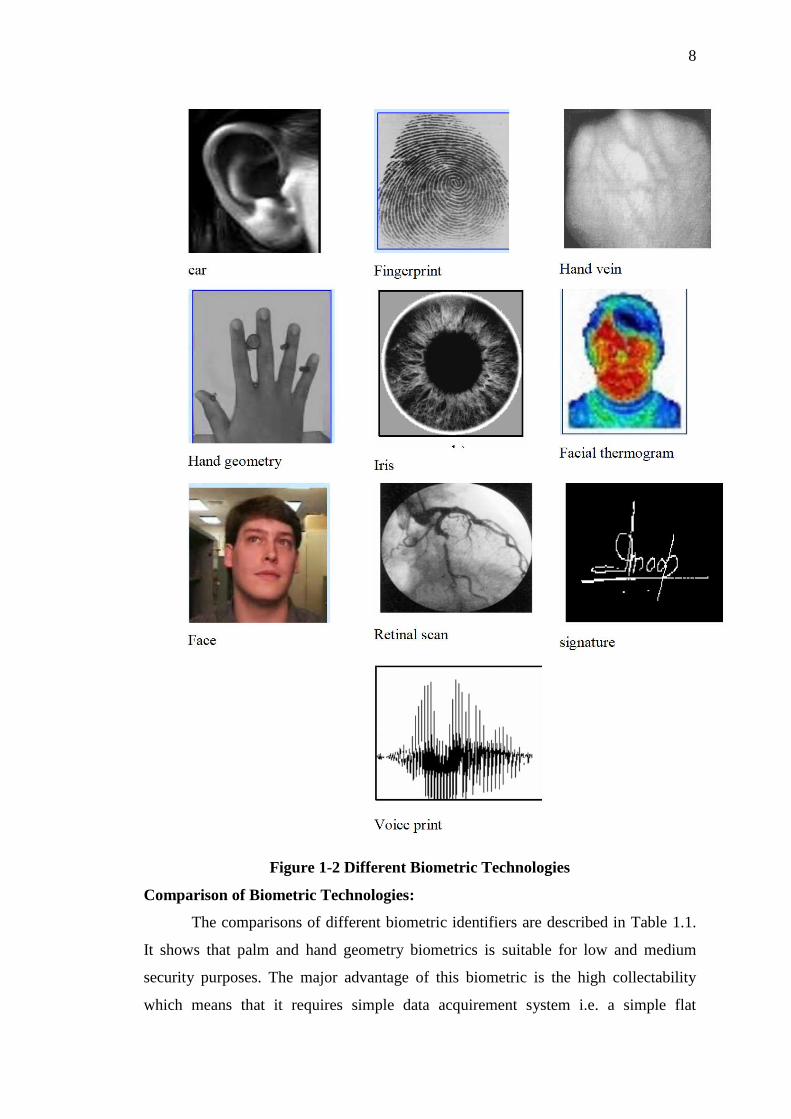
Figure 1-2 Different Biometric Technologies
Comparison of Biometric Technologies:
The comparisons of different biometric identifiers are described in Table 1.1.
It shows that palm and hand geometry biometrics is suitable for low and medium
security purposes. The major advantage of this biometric is the high collectability
which means that it requires simple data acquirement system i.e. a simple flat
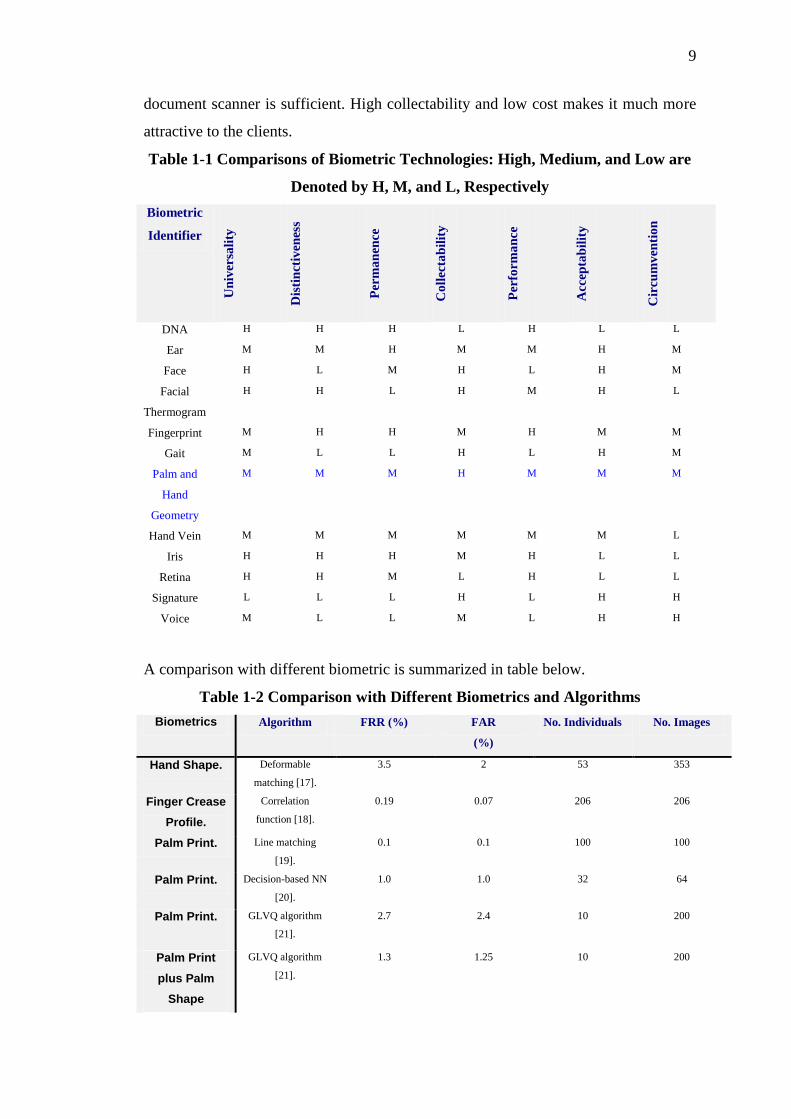
9
document scanner is sufficient. High collectability and low cost makes it much more
attractive to the clients.
Table 1-1 Comparisons of Biometric Technologies: High, Medium, and Low are
Denoted by H, M, and L, Respectively
Biometric
Identifier U
niv
ersa
lity
Dis
tin
ctiv
enes
s
Per
ma
nen
ce
Co
llec
tab
ilit
y
Per
form
an
ce
Acc
epta
bil
ity
Cir
cu
mv
enti
on
DNA H H H L H L L
Ear M M H M M H M
Face H L M H L H M
Facial
Thermogram
H H L H M H L
Fingerprint M H H M H M M
Gait M L L H L H M
Palm and
Hand
Geometry
M M M H M M M
Hand Vein M M M M M M L
Iris H H H M H L L
Retina H H M L H L L
Signature L L L H L H H
Voice M L L M L H H
A comparison with different biometric is summarized in table below.
Table 1-2 Comparison with Different Biometrics and Algorithms
Biometrics Algorithm FRR (%) FAR
(%)
No. Individuals No. Images
Hand Shape. Deformable
matching [17].
3.5 2 53 353
Finger Crease
Profile.
Correlation
function [18].
0.19 0.07 206 206
Palm Print. Line matching
[19].
0.1 0.1 100 100
Palm Print. Decision-based NN
[20].
1.0 1.0 32 64
Palm Print.
GLVQ algorithm
[21].
2.7 2.4 10 200
Palm Print
plus Palm
Shape
GLVQ algorithm
[21].
1.3 1.25 10 200
10
1.1.3 Applications of Biometric Systems
There are many applications of biometric systems and all of them can be categorized
into three main fields:
(i) Commercial: computer network login, access digital information, sensitive
facilities, ATM, credit card, cellular phone, PDA, medical records,
attendance applications, etc.
(ii) Government: national ID, passport, driver‘s license, welfare claims, border
control, social security, etc.
(iii) Forensic: terrorist identification, parenthood determination, missing
children, criminal investigation, dead body identification, etc.
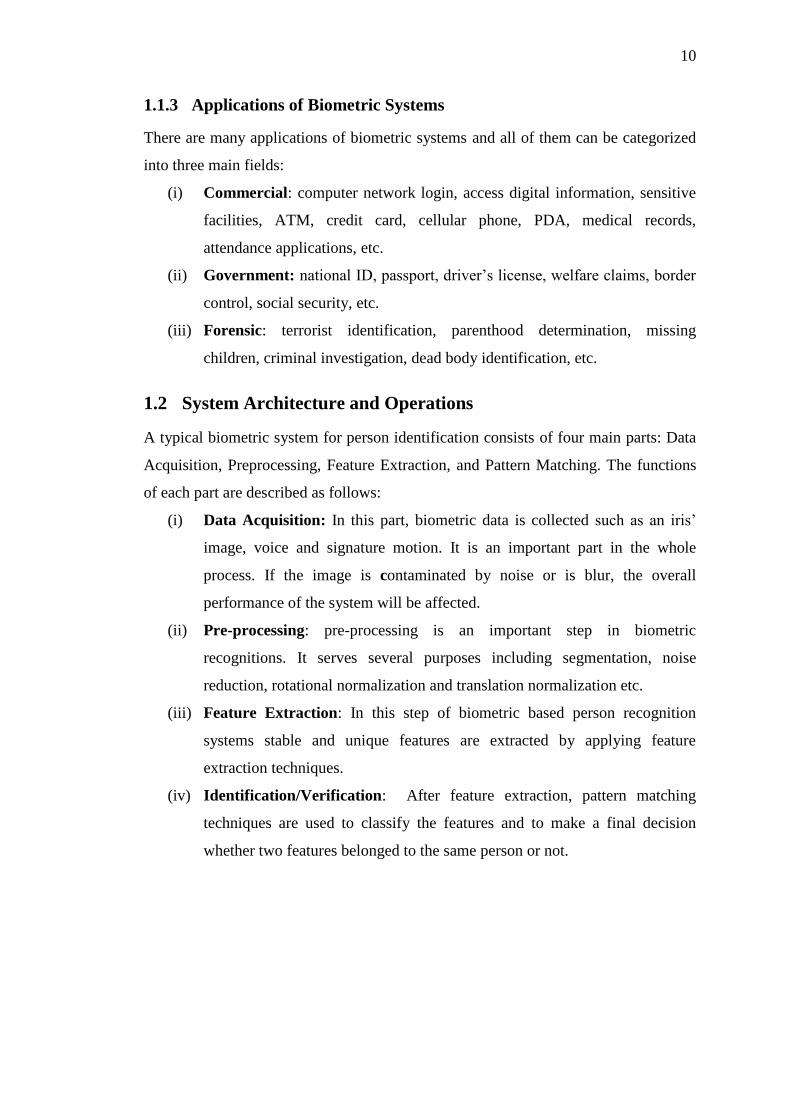
1.2 System Architecture and Operations
A typical biometric system for person identification consists of four main parts: Data
Acquisition, Preprocessing, Feature Extraction, and Pattern Matching. The functions
of each part are described as follows:
(i) Data Acquisition: In this part, biometric data is collected such as an iris‘
image, voice and signature motion. It is an important part in the whole
process. If the image is contaminated by noise or is blur, the overall
performance of the system will be affected.
(ii) Pre-processing: pre-processing is an important step in biometric
recognitions. It serves several purposes including segmentation, noise
reduction, rotational normalization and translation normalization etc.
(iii) Feature Extraction: In this step of biometric based person recognition
systems stable and unique features are extracted by applying feature
extraction techniques.
(iv) Identification/Verification: After feature extraction, pattern matching
techniques are used to classify the features and to make a final decision
whether two features belonged to the same person or not.
11
Template Database
Pre-processing Feature Extraction Modeling
Pre-processing Feature Extraction Verification
Training
Images
Testing
Image
Enrollment Phase
Identification/Verification Phase Matching
Decision
(Yes/No)
Figure 1-3 The Modules of Biometric-Based Verification Systems
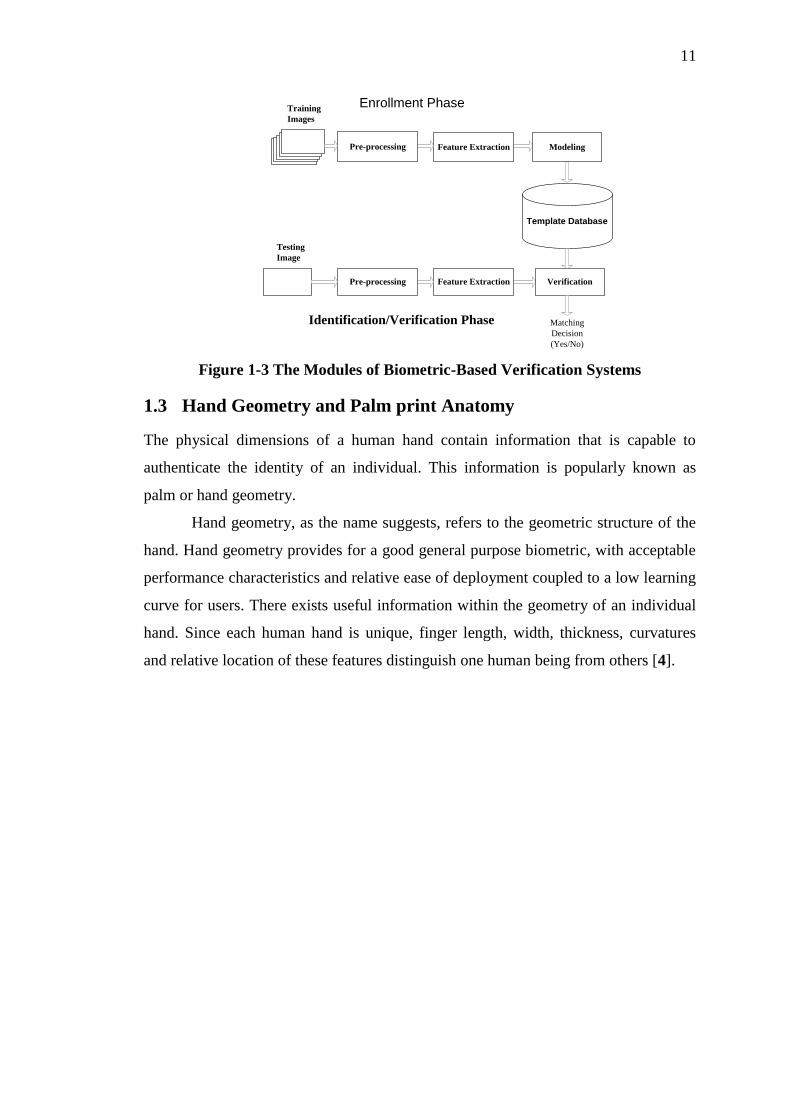
1.3 Hand Geometry and Palm print Anatomy
The physical dimensions of a human hand contain information that is capable to
authenticate the identity of an individual. This information is popularly known as
palm or hand geometry.
Hand geometry, as the name suggests, refers to the geometric structure of the
hand. Hand geometry provides for a good general purpose biometric, with acceptable
performance characteristics and relative ease of deployment coupled to a low learning
curve for users. There exists useful information within the geometry of an individual
hand. Since each human hand is unique, finger length, width, thickness, curvatures
and relative location of these features distinguish one human being from others [4].
12
Palm Length
Palm width
Hand Length
Finger widths:w1,w2,..w8 and Finger length:
L1,L2..L4
w6
L2
w5
L1
w1
w2
w3
w7
L3 w
8
L4
w4
Figure 1-4 Hand Geometry Features
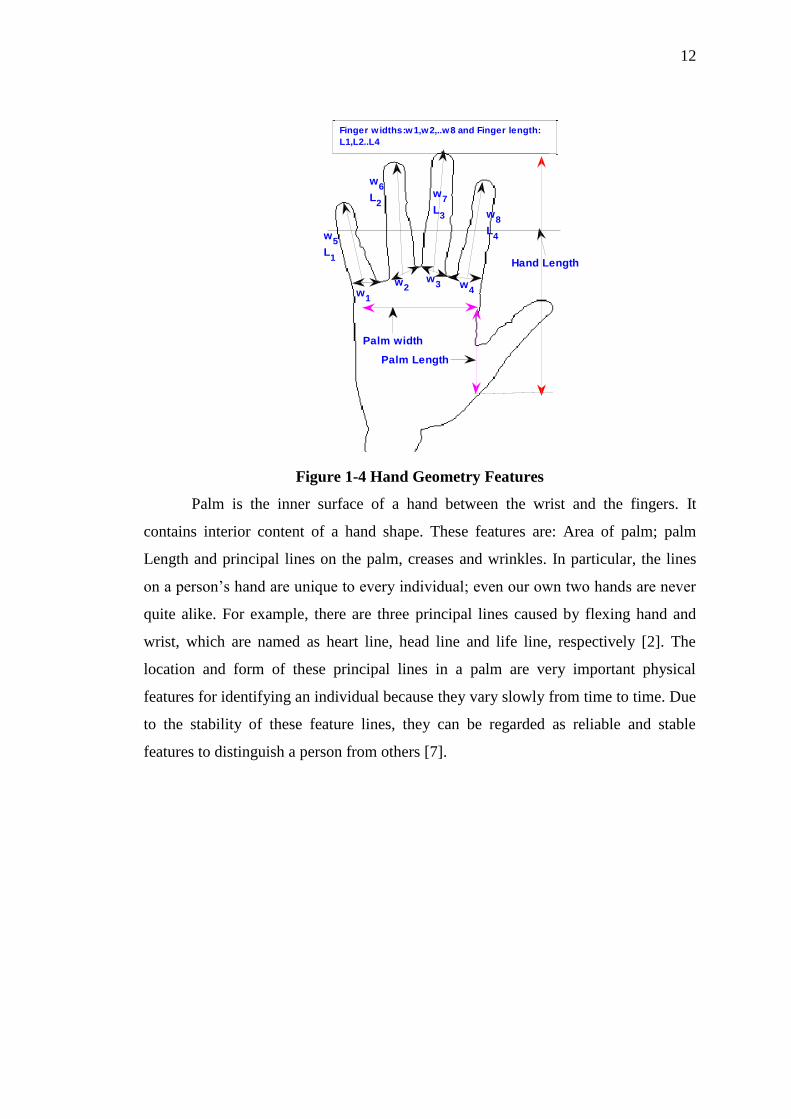
Palm is the inner surface of a hand between the wrist and the fingers. It
contains interior content of a hand shape. These features are: Area of palm; palm
Length and principal lines on the palm, creases and wrinkles. In particular, the lines
on a person‘s hand are unique to every individual; even our own two hands are never
quite alike. For example, there are three principal lines caused by flexing hand and
wrist, which are named as heart line, head line and life line, respectively [2]. The
location and form of these principal lines in a palm are very important physical
features for identifying an individual because they vary slowly from time to time. Due
to the stability of these feature lines, they can be regarded as reliable and stable
features to distinguish a person from others [7].
13
Figure 1-5 Sample Palm Print and Principal Lines of Palm Print
1.4 Literature Survey
In addition to hand geometry features, there are many other methodologies
that have been used in literature for hand based person identification and verification
i.e. shape analysis, palm print texture analysis etc. Shape analysis is a conventional
method for object identification, has been extensively employed in the field of object
recognition by various researchers on different shapes. So by considering human hand
as an object of definite rigid shape, extract its boundary and shape parameters as
recognition features, often normalized and invariant to various geometric changes
such as translation, rotation and scale. Shape analysis includes geometric moments,
invariant geometric moments, Zernike moments, Fourier descriptors, Principal
Component Analysis and wavelet analysis.
1.5 Organization of this Thesis
This thesis is organized as follows: Chapter 1 provides an introduction to biometric
technologies. Chapter 2 describes the data acquisition step of a biometric recognition
system. System Architecture is described in Chapter 3. Chapter 4 explains new hand
biometric feature extraction techniques for extracting hand shape, palm print texture
and hand geometry features. The feature integration and feature reduction processes is
explained in chapter 5 and Chapter 6 discusses the experimental results of
identification system. Finally, conclusions and suggestions for further research are
made in Chapter 7.
14
Summary
Reliability in the person authentication is key to the security in the networked society.
Many physiological characteristics of humans, i.e. biometrics, are typically time
invariant, easy to acquire, and unique for every individual. That is why Biometrics are
considered to be more reliable and robust and is becoming the global standard for
person identification especially for access control. Palm prints and hand geometry
biometric features that are widely used in the world because of their high
collectability and low cost. A Typical biometric identification system consists of a
data acquisition module, a pre-processing module, a feature extraction module and a
matching module. The performance of a biometric system is quantized in terms of
False Acceptance Rate and False Rejection Rates, which are described graphically in
the form of the ROC Curve. This project is aimed at exploring the techniques used for
palmprint and hand geometry based person identification.
15
Chapter 2- Data Acquisition
In order to assess the performance of the proposed system, two different databases
have been for experiments namely PIEAS Hand Database 1 (DB1) and PIEAS Hand
Database 2 (DB2). Details of these two datasets are given below.
DB1 that is used for experiments consists of 500 right hand images from 50
individuals, 10 images from each individual. All images of DB1 are captured using a
simple flatbed document scanner (Camera Model: Hp scanjet 5590). It has no pegs to
control the hand alignment. To ensure proper hand alignment a transparent sheet with
five pegs on it is placed on the scanner. These five pegs on the platform serve as
control points for the placement of hands. Using pegs makes sure that the fingers
don‘t touch each other and most of the part of the hand touches the imaging sheet
containing the pegs. These pegs also reduce the time requirement of image pre-
processing for hand alignment. The arrangement of pegs is:
(i) Peg No. 1 -It is the peg located between little finger and ring finger. It
controls the alignment of little finger.
(ii) Peg No.2 –It is the peg located between ring finger and middle finger. It
controls the alignment of the middle finger.
(iii) Peg No.3 –It is the peg located between index finger and middle finger and
it controls the alignment of both the fingers.
(iv) Peg No.4 –this peg is also between index finger and middle finger but it is
below and small in size as compared to peg No. 4. It controls the hand up and
down movement.
(v) Peg No. 5 –The peg No. 5 control the alignment of thumb.
The second database called DB2 consists of 1100 right hand images from 110
individuals, 10 images from each individual. It is used for experiments to see the
performance of the system on large datasets. All images of DB2 are captured using
the same flatbed document scanner (Camera Model: Hp scanjet 5590) as was used for
making PIEAS Hand Database 1 and same arrangements are done for controlling the
hand alignment.
16
Figure 2-1 Input Device for Data Acquisition
A sample hand image from DB1 is shown in figure below.
Peg No. 1
Peg No.2 Peg No.3
Peg 4
Peg 5
Figure 2-2 Sample Hand image of the database
All the images of PIEAS Hand database 1 (DB1) and PIEAS Hand database 2
(DB2) are of type JPEG and of size 1700 X 2340 and 1675 X 2307 respectively. The
format of the file name is ―(USER_ID). (SAMPLE).jpg‖. Where (USER_ID) is the ID
of the user, (SAMPLE) is the sample number for the user (USER_ID) and jpg is the
format of the image file. The disk size of each image is about 1Mb.
In DB1, 42 individuals are male and remaining 8 individuals are female. The
age distribution of the subjects is
Below 30 years = 90%
Older than 50 years=2%
Between 30 and 50 years= 08%

17
In DB2, 85 individuals are male and remaining 25 individuals are female. The
age distribution of the subjects is
Below 30 years = 81%
Older than 50 years=2%
Between 30 and 50 years= 17%
The images of Dataset 1 are collected in two weeks and it takes 10 seconds to
acquire a single hand image. Similarly it took three weeks to collect the images of
Dataset 2.
The PIEAS Hand database 1 is also updated after one year so that experiments
of time dependency analysis of the identification system can be performed.
18
Chapter 3- System Architecture
A typical biometric system for person identification consists of three main parts:
Image Processing, Feature Extraction and Classification. Conceptual biometric system
architecture is shown below.
Hand
Database
System Algorithm
System Core
DA
TA
BA
SE
INT
ER
FA
CE
HA
RD
WA
RE
INT
ER
FA
CE
Data Acquisition
USER INTERFACE
Figure 3-1 Architecture a Conceptual Biometric System
3.1 Image Pre-processing
Image pre-processing is an important step for many pattern recognition systems. In
our proposed palm and hand geometry based identification system, five pre-
processing steps are discussed in this chapter. These five image pre-processing steps
are common and are performed before all proposed feature extraction techniques.
These processes are image cropping, grayscale conversion, median filtering for noise
reduction in images, binirization and removal of pegs as shown in figure 3-3.
Peg RemovalBinarizationMedian FilterGrayscale
Conversion
Image
CroppingInput Image
Figure 3-2 Image Processing Block Diagram
19
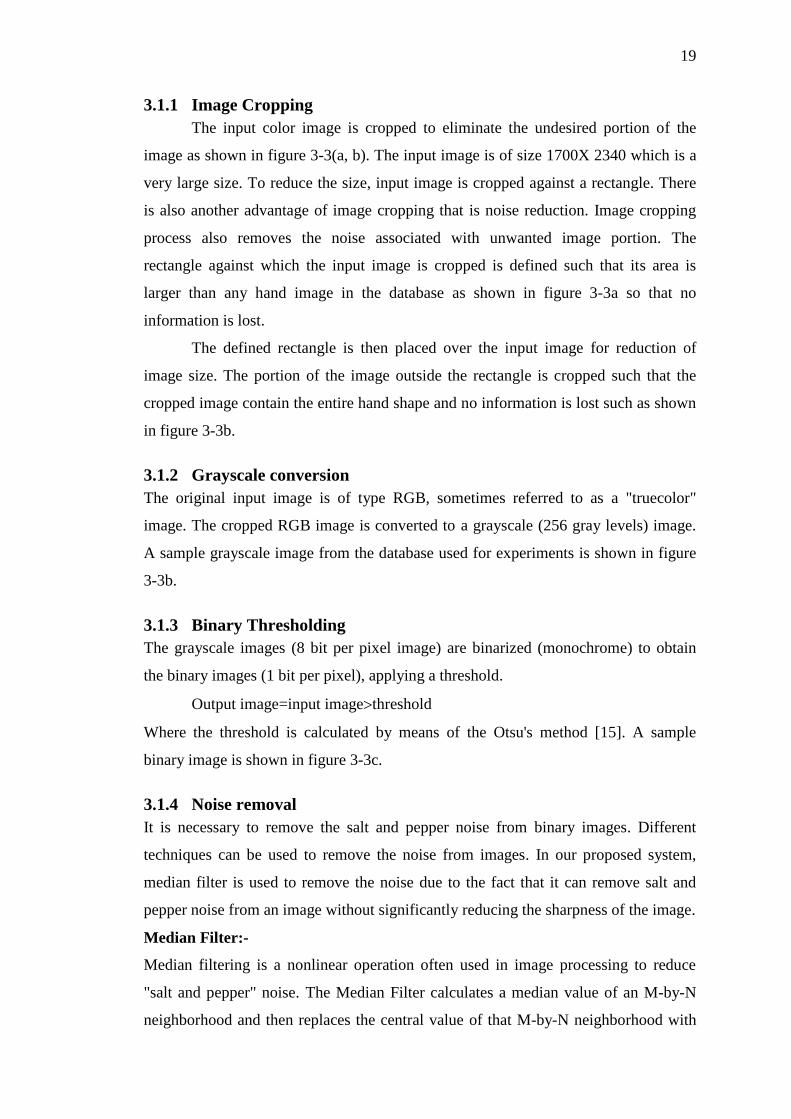
3.1.1 Image Cropping
The input color image is cropped to eliminate the undesired portion of the
image as shown in figure 3-3(a, b). The input image is of size 1700X 2340 which is a
very large size. To reduce the size, input image is cropped against a rectangle. There
is also another advantage of image cropping that is noise reduction. Image cropping
process also removes the noise associated with unwanted image portion. The
rectangle against which the input image is cropped is defined such that its area is
larger than any hand image in the database as shown in figure 3-3a so that no
information is lost.
The defined rectangle is then placed over the input image for reduction of
image size. The portion of the image outside the rectangle is cropped such that the
cropped image contain the entire hand shape and no information is lost such as shown
in figure 3-3b.
3.1.2 Grayscale conversion
The original input image is of type RGB, sometimes referred to as a "truecolor"
image. The cropped RGB image is converted to a grayscale (256 gray levels) image.
A sample grayscale image from the database used for experiments is shown in figure
3-3b.
3.1.3 Binary Thresholding
The grayscale images (8 bit per pixel image) are binarized (monochrome) to obtain
the binary images (1 bit per pixel), applying a threshold.
Output image=input imagethreshold
Where the threshold is calculated by means of the Otsu's method [15]. A sample
binary image is shown in figure 3-3c.
3.1.4 Noise removal
It is necessary to remove the salt and pepper noise from binary images. Different
techniques can be used to remove the noise from images. In our proposed system,
median filter is used to remove the noise due to the fact that it can remove salt and
pepper noise from an image without significantly reducing the sharpness of the image.
Median Filter:-
Median filtering is a nonlinear operation often used in image processing to reduce
"salt and pepper" noise. The Median Filter calculates a median value of an M-by-N
neighborhood and then replaces the central value of that M-by-N neighborhood with
20
calculated median value. If the neighborhood has a center element, then median filter
places the median value there, as illustrated in the following figure.
Table 3-1 M-by-N Neighborhood having Exact Centre
Median
value
If the neighborhood does not have an exact center, the block has a bias toward the
upper-left corner and places the median value there, as illustrated in the following
figure.
Table 3-2 M-by-N Neighborhood having no Exact Centre
Median
value
The median filter pads the edge of the input image so, pixels within [M/2 N/2] of the
edges may appear distorted. Because the median value is less sensitive than the mean
to extreme values, the Median Filter block can remove salt and pepper noise from an
image without significantly reducing the sharpness of the image.
3.1.5 Peg Removal
In order to obtain the pure hand image, pegs are removed. The image of the
transparent sheet, containing the five pegs and placed over the scanner, is captured.
This image is then pre-processed i.e. cropped and converted to grayscale such that its
size and type is same as the hand images. We called this image as ―Peg Template‖
and is used to remove the pegs from the hand images. The procedure of the peg
removal is such that peg template lets say, ( , )peg i j is first negated and then
multiplied with the binary hand image lets say, ( , )I i j as shown is equation 3.1.
'( , ) ( , ).* ( , ) (3.1)I i y I i y peg i y
The equation 3.1 removes the pegs from binary hand images by changing the peg
pixels from white to black and unchanged the hand shape pixels. The binary image
after the removal of pegs is shown in figure 3-3(d).
21
3.1.6 Edge Detection
After the removal of pegs, next step of image pre-processing is the edge detection. In
order to find the hand geometry features and palm print region of interest (ROI) edges
of hand shapes are detected. There are many ways to perform edge detection.
However, the most may be grouped into two categories, gradient (Roberts, Prewitt,
Sobel) and Laplacian (Marrs-Hildreth). The gradient method detects the edges by
looking for the maximum and minimum in the first derivative of the image. The
Laplacian method searches for zero crossings in the second derivative of the image to
find edges. In the proposed system, Sobel method is used for edge detection [15]. The
Sobel method finds edges using the Sobel approximation to the derivative. It returns
edges at those points where the gradient of the input image is maximum.
After image pre-processing, features of hand shape, hand geometry and palm prints
are extracted by applying feature extraction techniques.
22
Figure 3-3 Image Processing Steps
3.2 Feature Extraction
Feature extraction is considered to be the main and most imaportant module in a
biometric system. In this module different types of biometric feature are extracted for
classification. In our proposed system, three different techniques are implemented i.e.
23
Feature extraction using PCA, Hand geometry feature extraction using image
processing and palm print feature extraction using wavelet transform. All these
feature extraction techniques are explained in detail in next chapter.
3.3 Classification
In a typical biometric system classification is considered to be the last and decision
making step because after that step some decisions (match/ no match) are made. In
our proposed system the similarity of two feature vectors is measured by using
Euclidean distance as similarity measure.
The similarity measure between ƒ1 (feature vector from the user) and ƒ2 (stored
template) is used as the matching score and is computed as follows:
1 2
1 2
.(13)
| || |T
f f
f f
If ωT is less than threshold then the two images do not match otherwise a match is
considered.
Performance Analysis
The performance of the system is measured in terms of accuracy and speed. The
accuracy of the system is measured in terms of False Acceptance Rate (FAR) and
False Rejection Rate (FRR). FAR is defined as the probability that an imposter is
accepted as a genuine individual whereas FRR is the probability that a genuine
individual is rejected as an imposter. There is also another accuracy measure called
Equal Error Rate (EER) which is defined as the point at which the probability of false
acceptance equals the probability of false rejection. The range of threshold that is used
to measure the accuracy is from -1 to +1.
24
Chapter 4- Feature Extraction Approaches
Feature extraction is the most essential and main phase in pattern recognition.
Meaningful features are needed to be extracted after the image pre-processing phase.
In the proposed system three types of features have been extracted from a hand image
i.e. global hand shape features, hand geometry features and features of palm prints.
Principal Component Analysis is used to extract the global hand shape features, hand
geometry features have been extracted using image processing techniques and wavelet
transform is applied to extract the wavelet domain features of palm prints. The
extracted features of three techniques are merged to enhance the accuracy of the
verification and identification of system.
4.1 Hand Shape Recognition using Principal Component Analysis
Eigenspace projection examines images in a subspace. It is also known as Karhunen _
Loeve (KL) and Principal Component Analysis (PCA) [9]. PCA is a useful statistical
technique that has found application in fields such as face recognition, hand shape
recognition and image compression. In the proposed system PCA is used to extract
hand shape features [16]. It is a common technique for finding patterns in data of high
dimension. It projects images into a subspace such that the first orthogonal dimension
of this subspace captures the greatest amount of variance among the images and the
last dimension of this subspace captures the least amount of variance among the
images. Once image are projected into subspace, a similarity measure is used for
matching. Two methods of creating an eigenspace are examined, the original
method and a method designed for high-resolution images know as the snapshot
method.There are basically two methods for creating an eigenspace:
(i) Original method of eigenspace projection
(ii) Snapshot method
4.1.1 Original Method of Eigenspace Projection
There are basically three steps to identify images through eigenspace projection in
original method. The first step is to create an eigenspace using the training images.
The second step is to project the training images into the eigenspace created in the
first step. In final step, test images are identified by projecting them into the
25
eigenspace and then comparing them to the projected training images. The detail of
three basic steps of original method for identifying images is.
Create Eigenspace
Eigenspace creation is the first step to identify images through eigenspace projection.
In order to create an eigenspace each image is stored in a vector of size N.
1[ ............ ] (4.1)i i i
Nx x x
(i) Center data: First of all each of the training images must be centered. It
can be done by subtracting the mean image from each of the training images
as shown in equation 2.
1
1
1, (4.2)
pi i i
i
x x m where m xp
(ii) Create a data matrix: Data matrix is created by combining the centered
images. The size of data matrix is NxP. Where P is the number of training
images and each column is a single image.
2| | ....... | (4.3)i pX x x x
(iii) Create a covariance matrix: For the creation of covariance matrix, data
matrix is multiplied by its transpose.
(4.4)T
X X
(iv) Compute eigenvalues and eigenvectors: The eigenvalues and
eigenvectors are computed for using eigenvector decomposition.
(4.5)V
where V is the set of eigenvectors and is the set of eigenvalues.
(v) Normalization of eigenvectors: The eigenvectors are divided by their
norm for normalizaton.
(4.6)|| ||
ii
i
vv
v
(vi) Order eigenvectors: Eigenvectors νi are sorted according to their
corresponding eigenvalues. And those eigenvectors selected which are
associated with eigenvalues contain energy more than zero.
1 2| | ....... | (4.7)pV v v v

26
Project training Images
Once the eigenspace is created the entire centered training images are projected into
it. To project an image, calculate the dot product of that image with each ordered
eigenvector.
~ (4.8)i T ix V x
Identify test images
Each test image is centered as training images, and then these test images are
projected onto the created eigenspace.
~
1
1, (4.9)
pi T i i
i
y V y m where m yp
And
~ (4.10)i T iy V y
The projected test image is compared to every projected training image and the
training image that is found to be the closest to the test image is used to identify the
training image.
The original method leads to extremely large covariance matrices and the
calculation of the covariance matrix and the eigenvectors is computationally
demanding. Due to this drawback the second method (snapshot method) is used in our
proposed system.
4.1.2 Snapshot Method
Snapshot method is also comprised of three steps and identify images through
eigenspace projection. The first step is to create an eigenspace using the training
images. In second step the training images are projected onto the eigenspace created
in the first step. In the last step, the test images are identified by projecting them onto
the eigenspace and then comparing them to the results of the second step. The
description of these three basic steps is below.
Create Eigenspace
Eigenspace creation is the first step to identify images through eigenspace projection.
In order to create an eigenspace each image is stored in a vector of size N.
1[ ............ ] (4.1)i i i
Nx x x
(i) Center data: First of all each of the training images must be centered. It can
be done by subtracting the mean image from each of the training images as
shown in equation 2.
27
1
1
1, (4.2)
pi i i
i
x x m where m xp
(ii) Create a data matrix: Data matrix is created by combining the centered
images. The size of data matrix is NxP. Where P is the number of training
images and each column is a single image.
2| | ....... | (4.3)i pX x x x
(iii) Create a covariance matrix: For the creation of covariance matrix, data
matrix is multiplied by its transpose.
' (4.11)T
X X
(iv) Compute eigenvalues and eigenvectors: The eigenvalues and eigenvectors
are computed for ' using eigenvector decomposition.
' ' ' (4.12)V
where 'V is set of eigenvectors and ' is the set of eigenvalues.
(v) Compute eigenvectors of
T
X X
: Eigenvectors V of
T
X X
are computed by
multiplying data matrix with V‘.
' (4.13)V XV
(vi) Normalization of eigenvectors: The eigenvectors are divided by their norm
for normalizaton.
(4.6)|| ||
ii
i
vv
v
(vii) Order eigenvectors: Eigenvectors νi are sorted according to their
corresponding eigenvalues. And those eigenvectors selected which are
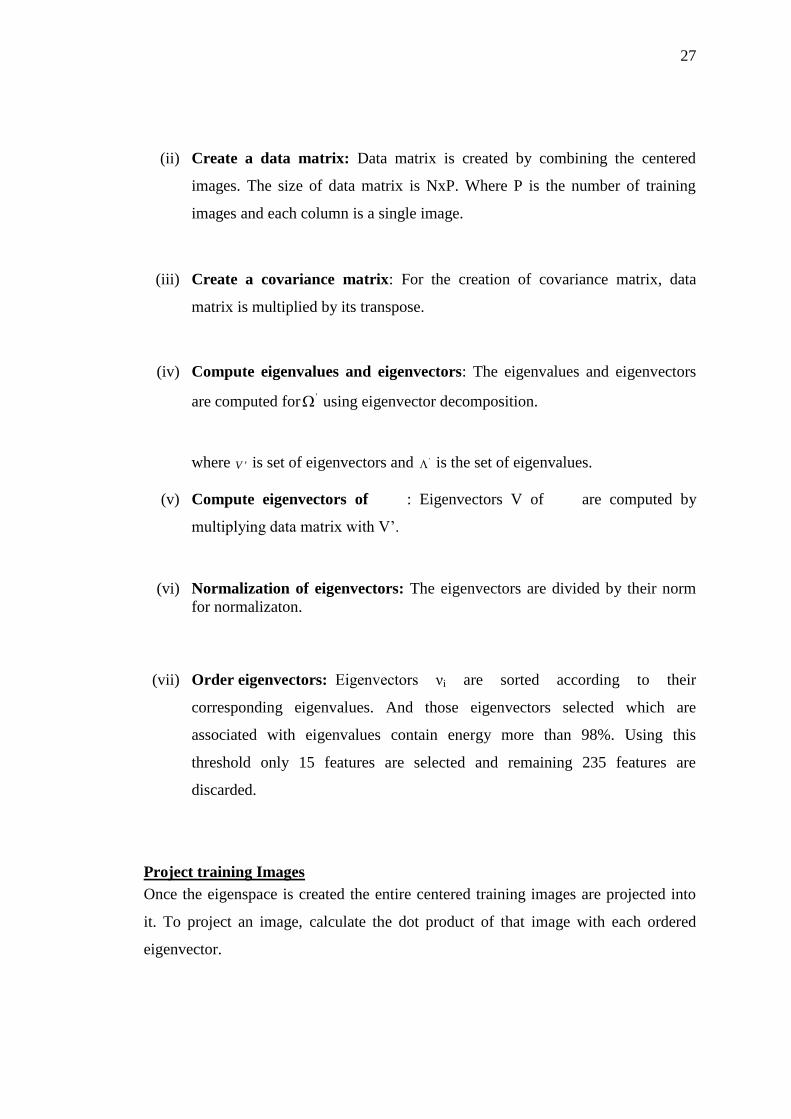
associated with eigenvalues contain energy more than 98%. Using this
threshold only 15 features are selected and remaining 235 features are
discarded.
1 2| | ....... | (4.7)pV v v v
Project training Images
Once the eigenspace is created the entire centered training images are projected into
it. To project an image, calculate the dot product of that image with each ordered
eigenvector.
~ (4.8)i T ix V x
28
Identify test images
Each test image is centered as training images, and then these test images are
projected onto the created eigenspace.
~
1
1, (4.9)
pi T i i
i
y V y m where m yp
And
~ (4.10)i T iy V y
The projected test image is compared to every projected training image and the
training image that is found to be the closest to the test image is used to identify the
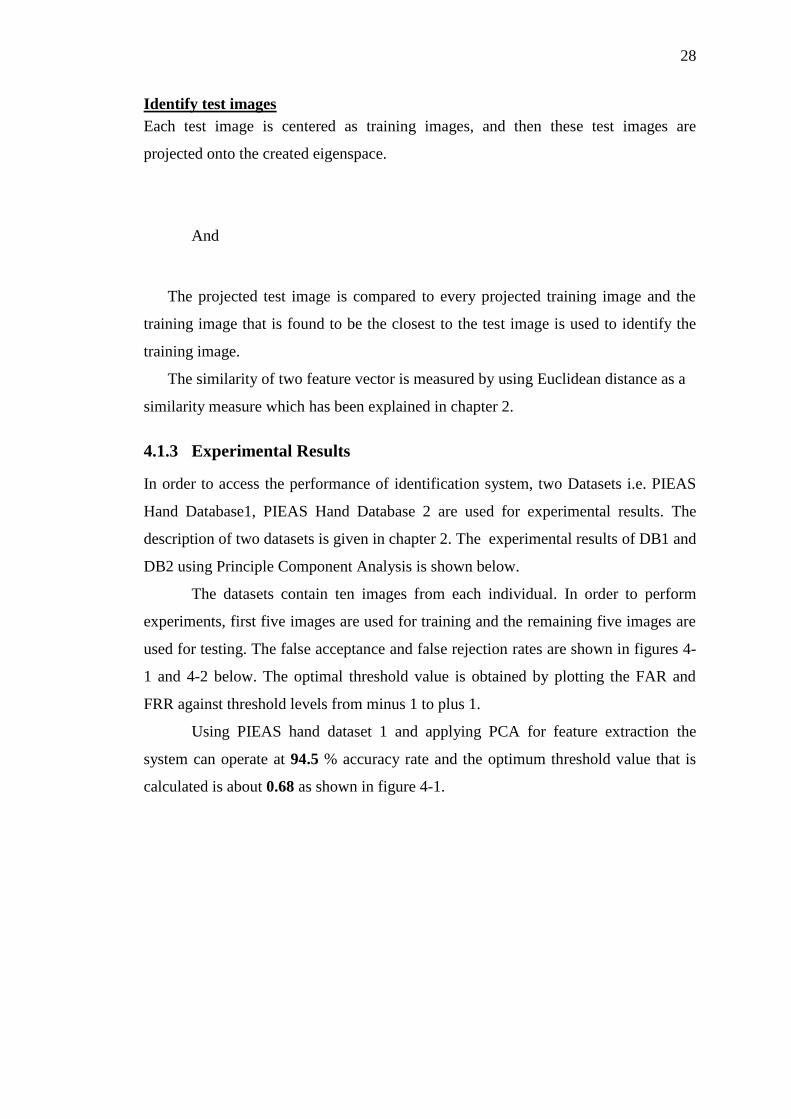
training image.
The similarity of two feature vector is measured by using Euclidean distance as a
similarity measure which has been explained in chapter 2.
4.1.3 Experimental Results
In order to access the performance of identification system, two Datasets i.e. PIEAS
Hand Database1, PIEAS Hand Database 2 are used for experimental results. The
description of two datasets is given in chapter 2. The experimental results of DB1 and
DB2 using Principle Component Analysis is shown below.
The datasets contain ten images from each individual. In order to perform
experiments, first five images are used for training and the remaining five images are
used for testing. The false acceptance and false rejection rates are shown in figures 4-
1 and 4-2 below. The optimal threshold value is obtained by plotting the FAR and
FRR against threshold levels from minus 1 to plus 1.
Using PIEAS hand dataset 1 and applying PCA for feature extraction the
system can operate at 94.5 % accuracy rate and the optimum threshold value that is
calculated is about 0.68 as shown in figure 4-1.
29
Figure 4-1 The Experimental Results Generated by Using PCA and DB1
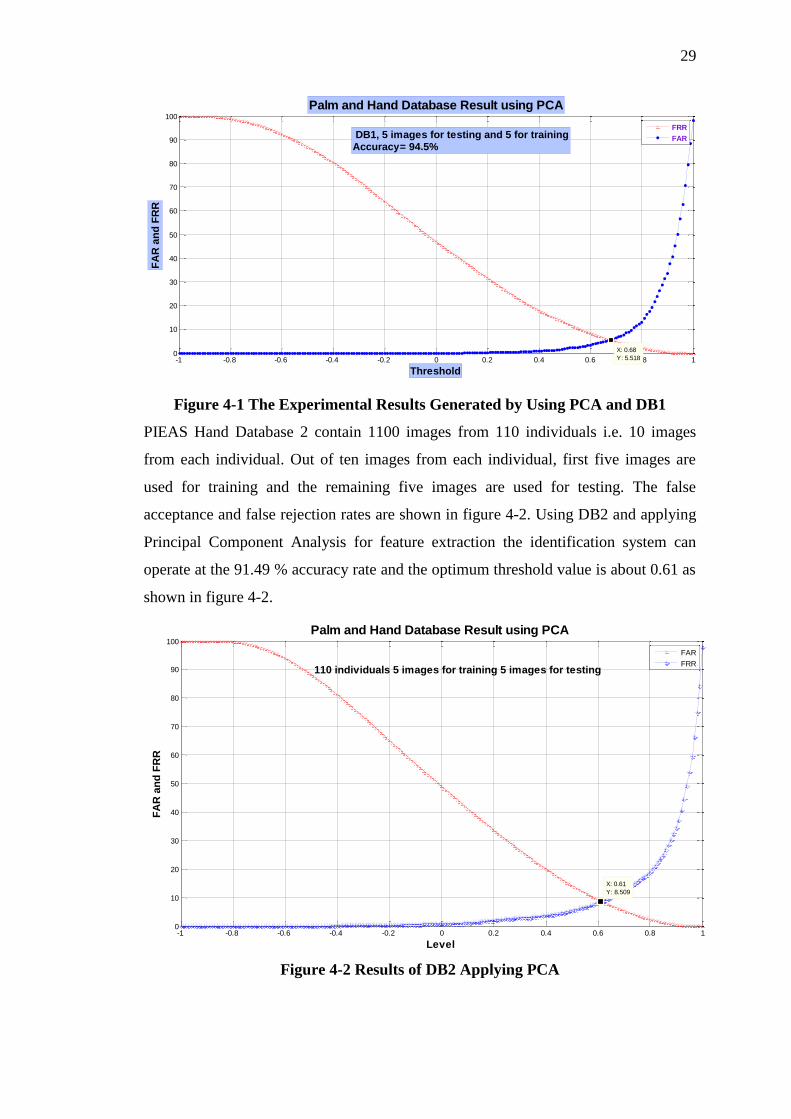
PIEAS Hand Database 2 contain 1100 images from 110 individuals i.e. 10 images
from each individual. Out of ten images from each individual, first five images are
used for training and the remaining five images are used for testing. The false
acceptance and false rejection rates are shown in figure 4-2. Using DB2 and applying
Principal Component Analysis for feature extraction the identification system can
operate at the 91.49 % accuracy rate and the optimum threshold value is about 0.61 as
shown in figure 4-2.
-1 -0.8 -0.6 -0.4 -0.2 0 0.2 0.4 0.6 0.8 10
10
20
30
40
50
60
70
80
90
100
110 individuals 5 images for training 5 images for testing
X: 0.61
Y: 8.509
Palm and Hand Database Result using PCA
Level
FA
R a
nd
FR
R
FAR
FRR
Figure 4-2 Results of DB2 Applying PCA
-1 -0.8 -0.6 -0.4 -0.2 0 0.2 0.4 0.6 0.8 10
10
20
30
40
50
60
70
80
90
100
X: 0.68
Y: 5.518
Palm and Hand Database Result using PCA
Threshold
FA
R a
nd
FR
R
DB1, 5 images for testing and 5 for trainingAccuracy= 94.5%
FRR
FAR
30
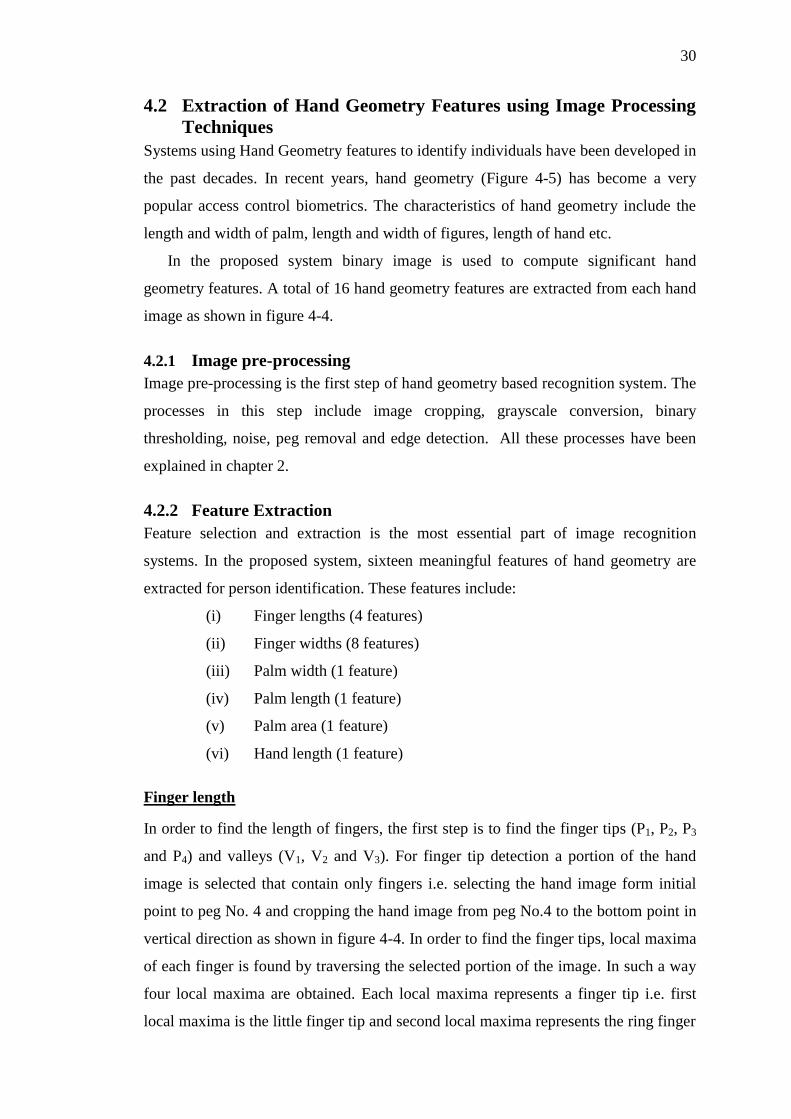
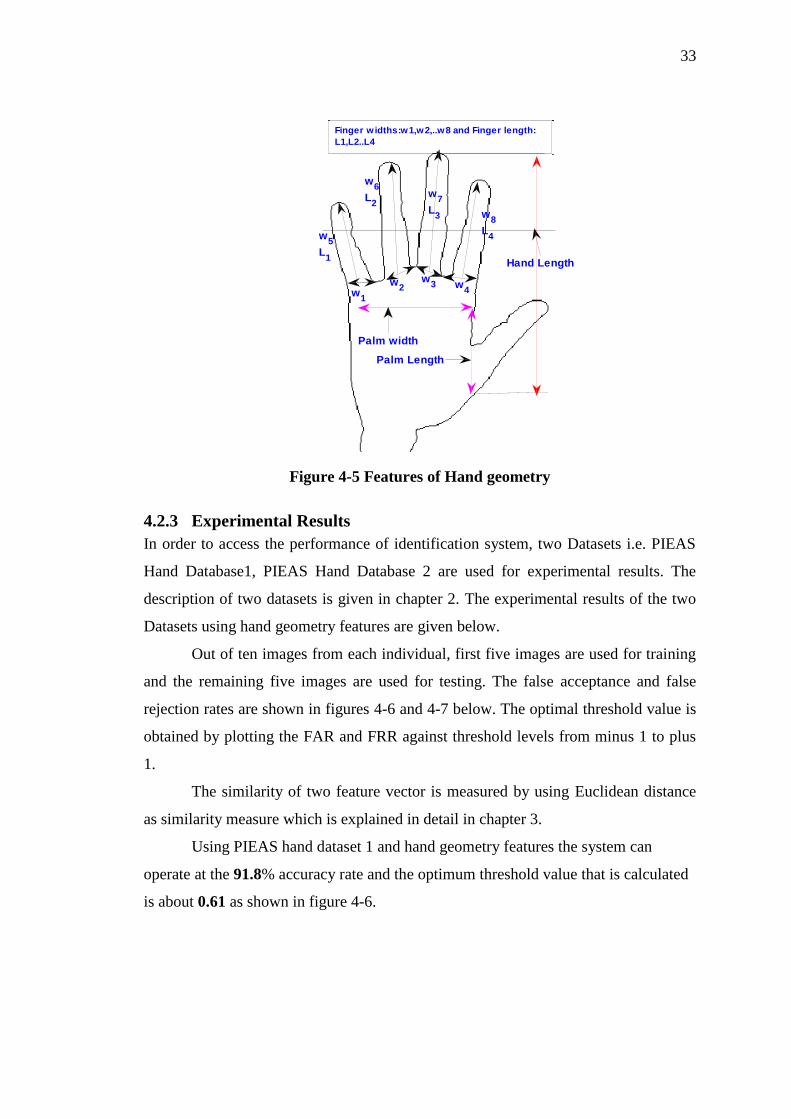
4.2 Extraction of Hand Geometry Features using Image Processing
Techniques
Systems using Hand Geometry features to identify individuals have been developed in
the past decades. In recent years, hand geometry (Figure 4-5) has become a very
popular access control biometrics. The characteristics of hand geometry include the
length and width of palm, length and width of figures, length of hand etc.
In the proposed system binary image is used to compute significant hand
geometry features. A total of 16 hand geometry features are extracted from each hand
image as shown in figure 4-4.
4.2.1 Image pre-processing
Image pre-processing is the first step of hand geometry based recognition system. The
processes in this step include image cropping, grayscale conversion, binary
thresholding, noise, peg removal and edge detection. All these processes have been
explained in chapter 2.
4.2.2 Feature Extraction
Feature selection and extraction is the most essential part of image recognition
systems. In the proposed system, sixteen meaningful features of hand geometry are
extracted for person identification. These features include:
(i) Finger lengths (4 features)
(ii) Finger widths (8 features)
(iii) Palm width (1 feature)
(iv) Palm length (1 feature)
(v) Palm area (1 feature)
(vi) Hand length (1 feature)
Finger length
In order to find the length of fingers, the first step is to find the finger tips (P1, P2, P3
and P4) and valleys (V1, V2 and V3). For finger tip detection a portion of the hand
image is selected that contain only fingers i.e. selecting the hand image form initial
point to peg No. 4 and cropping the hand image from peg No.4 to the bottom point in
vertical direction as shown in figure 4-4. In order to find the finger tips, local maxima
of each finger is found by traversing the selected portion of the image. In such a way
four local maxima are obtained. Each local maxima represents a finger tip i.e. first
local maxima is the little finger tip and second local maxima represents the ring finger
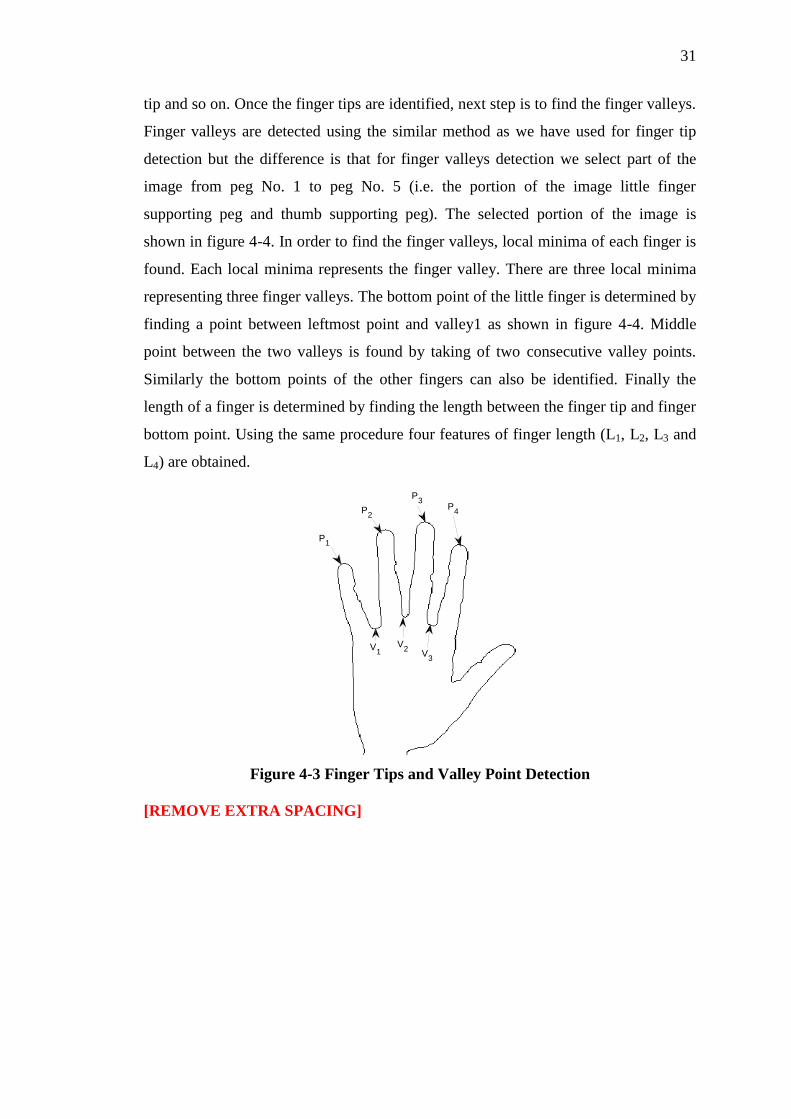
31
tip and so on. Once the finger tips are identified, next step is to find the finger valleys.
Finger valleys are detected using the similar method as we have used for finger tip
detection but the difference is that for finger valleys detection we select part of the
image from peg No. 1 to peg No. 5 (i.e. the portion of the image little finger
supporting peg and thumb supporting peg). The selected portion of the image is
shown in figure 4-4. In order to find the finger valleys, local minima of each finger is
found. Each local minima represents the finger valley. There are three local minima
representing three finger valleys. The bottom point of the little finger is determined by
finding a point between leftmost point and valley1 as shown in figure 4-4. Middle
point between the two valleys is found by taking of two consecutive valley points.
Similarly the bottom points of the other fingers can also be identified. Finally the
length of a finger is determined by finding the length between the finger tip and finger
bottom point. Using the same procedure four features of finger length (L1, L2, L3 and
L4) are obtained.
P1
P2
P3
P4
V1
V2
V3
Figure 4-3 Finger Tips and Valley Point Detection
[REMOVE EXTRA SPACING]
32
little fingertip
Ring fingertipMiddle fingertip
Index fingertip
Valley1Valley2
Valley3
Most Extreme Point
Left most Point
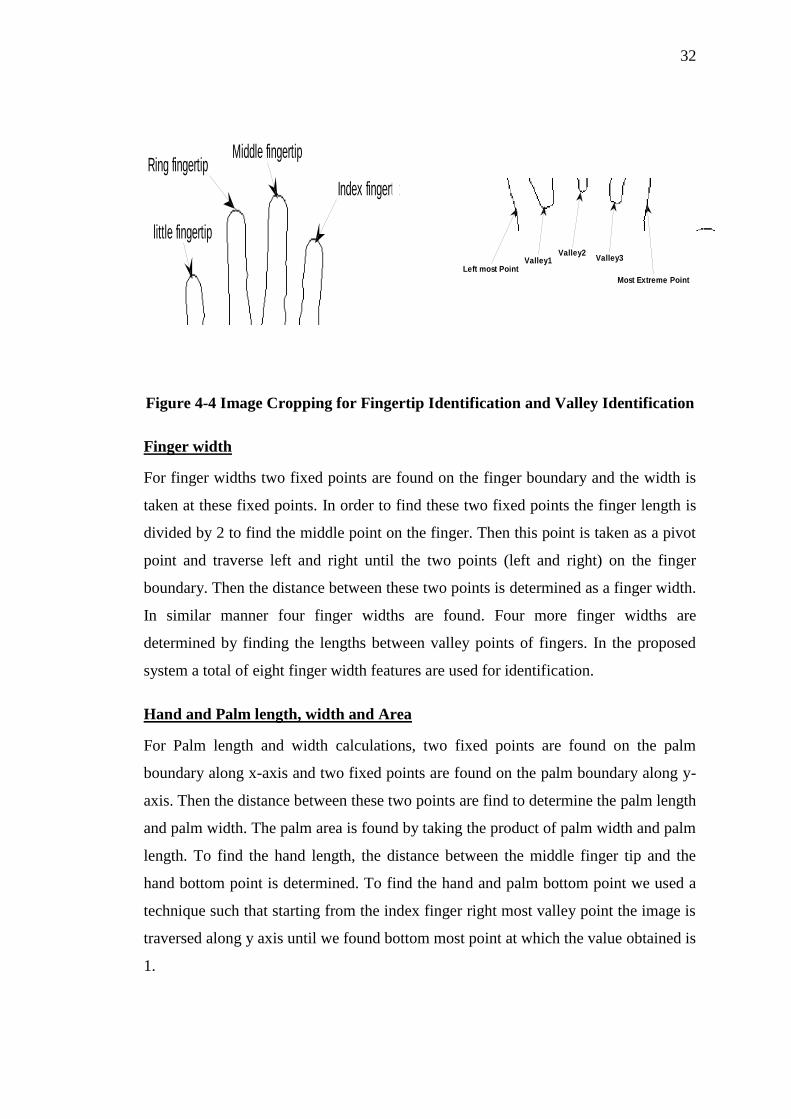
Figure 4-4 Image Cropping for Fingertip Identification and Valley Identification
Finger width
For finger widths two fixed points are found on the finger boundary and the width is
taken at these fixed points. In order to find these two fixed points the finger length is
divided by 2 to find the middle point on the finger. Then this point is taken as a pivot
point and traverse left and right until the two points (left and right) on the finger
boundary. Then the distance between these two points is determined as a finger width.
In similar manner four finger widths are found. Four more finger widths are
determined by finding the lengths between valley points of fingers. In the proposed
system a total of eight finger width features are used for identification.
Hand and Palm length, width and Area
For Palm length and width calculations, two fixed points are found on the palm
boundary along x-axis and two fixed points are found on the palm boundary along y-
axis. Then the distance between these two points are find to determine the palm length
and palm width. The palm area is found by taking the product of palm width and palm
length. To find the hand length, the distance between the middle finger tip and the
hand bottom point is determined. To find the hand and palm bottom point we used a
technique such that starting from the index finger right most valley point the image is
traversed along y axis until we found bottom most point at which the value obtained is
1.
33
Palm Length
Palm width
Hand Length
Finger widths:w1,w2,..w8 and Finger length:
L1,L2..L4
w6
L2
w5
L1
w1
w2
w3
w7
L3 w
8
L4
w4
Figure 4-5 Features of Hand geometry
4.2.3 Experimental Results
In order to access the performance of identification system, two Datasets i.e. PIEAS
Hand Database1, PIEAS Hand Database 2 are used for experimental results. The
description of two datasets is given in chapter 2. The experimental results of the two
Datasets using hand geometry features are given below.
Out of ten images from each individual, first five images are used for training
and the remaining five images are used for testing. The false acceptance and false
rejection rates are shown in figures 4-6 and 4-7 below. The optimal threshold value is
obtained by plotting the FAR and FRR against threshold levels from minus 1 to plus
1.
The similarity of two feature vector is measured by using Euclidean distance
as similarity measure which is explained in detail in chapter 3.
Using PIEAS hand dataset 1 and hand geometry features the system can
operate at the 91.8% accuracy rate and the optimum threshold value that is calculated
is about 0.61 as shown in figure 4-6.
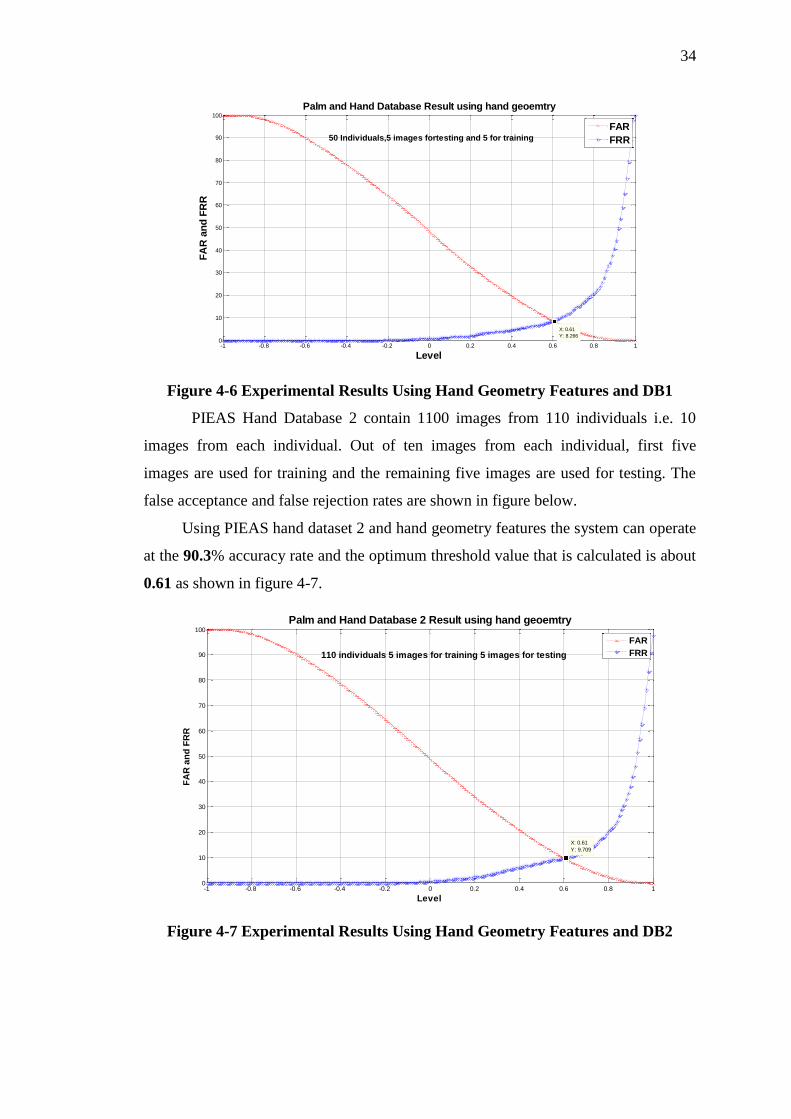
34
-1 -0.8 -0.6 -0.4 -0.2 0 0.2 0.4 0.6 0.8 10
10
20
30
40
50
60
70
80
90
100
50 Individuals,5 images fortesting and 5 for training
X: 0.61
Y: 8.266
Palm and Hand Database Result using hand geoemtry
Level
FA
R a
nd
FR
R
FAR
FRR
Figure 4-6 Experimental Results Using Hand Geometry Features and DB1
PIEAS Hand Database 2 contain 1100 images from 110 individuals i.e. 10
images from each individual. Out of ten images from each individual, first five
images are used for training and the remaining five images are used for testing. The
false acceptance and false rejection rates are shown in figure below.
Using PIEAS hand dataset 2 and hand geometry features the system can operate
at the 90.3% accuracy rate and the optimum threshold value that is calculated is about
0.61 as shown in figure 4-7.
-1 -0.8 -0.6 -0.4 -0.2 0 0.2 0.4 0.6 0.8 10
10
20
30
40
50
60
70
80
90
100
110 individuals 5 images for training 5 images for testing
X: 0.61
Y: 9.709
Palm and Hand Database 2 Result using hand geoemtry
Level
FA
R a
nd
FR
R
FAR
FRR
Figure 4-7 Experimental Results Using Hand Geometry Features and DB2
35
[SPACING – REMOVE]
4.3 Texture analysis of Palmprints using Wavelets
The wavelet transform is a tool for carving up functions, operators, or data into
components of different frequency, allowing one to study each component separately.
There are many other transforms that are used quite often for example Hilbert
transform, short-time Fourier transform, Wigner distributions, the Radon Transform,
and the wavelet transform etc.
The discussion is started from Fourier analysis to get some historical
background of Wavelet transformation.
4.3.1 Evolution of Wavelet Transform [WHY HEADINGS DOWN]
Fourier Transform (FT
Short Time Fourier Transform (STFT
Wavelet Transform (WT
Comparative Visualisation
Fourier Transform
Fourier analysis is a mathematical technique in which a signal is transformed from
time domain to frequency domain. FT (as well as WT) is a reversible transform.
However, only either of them is available at any given time. That is, no frequency
information is available in the time-domain signal, and no time information is
available in the Fourier transformed signal. Fourier analysis is often better to be used
when only frequency contents of a signal are needed. It has a serious drawback in
situations where we need time information as well i.e. where a particular frequency
exists. It means that it tells us how much of each frequency component exists in the
signal, but it does not tell us when in time these frequency components exist. When
the signal is stationary this information is not required because the frequency content
of stationary signals do not change in time. Due to this drawback FT is not a suitable
technique for non-stationary signal.
36
The Short Time Fourier Transform
To overcome the limitations of the standard FT, Gabor [24] introduced the initial
concept of Short Time Fourier Transform (STFT). Short Time Fourier Transform
(STFT) is used when the time localization of the spectral components is needed.
STFT is used to analyze only a small section of the signal at a time - a technique
called Windowing the Signal. In STFT, we have to choose proper sized window
which is often considered as a drawback. In STFT, good frequency response can be
achieved by large window but it will not give very good time information and vice
versa. This problem known as resolution problem led to the development of wavelet
transform [12, 13].
Wavelet Transform
Wavelet Transform is an alternative approach to the short time Fourier transforms to
overcome the resolution problem. Similar to STFT in wavelet transform signal is
multiplied with a function but width of the window is changed as the Transform is
computed for every spectral components.
Wavelet analysis allows the use of long time intervals where we want more
precise low-frequency information, and shorter regions where we want high-
frequency information [14].
The following figure summarizes the above mentioned signal analysis
approaches.
Figure 4-8 Signal Analysis Approaches
4.3.2 Theoretical Aspects of Wavelet Transform
CCoonnttiinnuuoouuss WWaavveelleett TTrraannssffoorrmm
37
The equation of continuous wavelet transform is
1( , ) ( , ) ( ) (4.14)
| |x x
tCWT s s x t dt
ss
The mother wavelet is chosen to serve as a prototype for all windows in the
process. All the windows that are used are the dilated (or compressed) and shifted
versions of the mother wavelet. There are a number of functions that are used for this
purpose. The Morlet wavelet and the Mexican hat function are two candidates.
For the computation of CWT following procedure is used
a. The wavelet is placed at the beginning of the signal, and set s=1 (the most
compressed wavelet);
b. The wavelet function at scale ―1‖ is multiplied by the signal, and
integrated over all times; then multiplied by 1
| |s ;
c. Shift the wavelet to t= and get the transform value at t= and s=1;
d. Repeat the procedure until the wavelet reaches the end of the signal;
e. Scale s is increased by a sufficiently small value, the above procedure is
repeated for all s;
f. Each computation for a given s fills the single row of the time-scale plane;
g. CWT is obtained if values corresponding to all s are calculated.
DDiissccrreettee WWaavveelleett TTrraannssffoorrmm
The foundations of the DWT go back to 1976 when Croiser, Esteban, and Galand
devised a technique to decompose discrete time signals. It is difficult to calculate the
wavelet coefficients at all possible (continuous) scales of the original signal.
Therefore only a subset of scales and positions is chosen at which we calculate the
wavelet coefficients.
Wavelet Analysis
In wavelet analysis, we often speak of approximations and details. The
approximations are the high-scale, low-frequency components of the signal. The
details are the low-scale, high-frequency components. Filtering process is used to
obtain the approximation and detail coefficients of a signal. Figure 4-9 illustrates the
filtering process [14].
38
Figure 4-9 Filtering Process
Here S is the original signal and a low-pass filter is used to calculate
approximation coefficients (A) and a high-pass filter for detail coefficients (D).
If we perform this operation on a real discrete signal consisting of say 1000 data
points, then we will end up having 2000 data points (1000 from each filter). To avoid
this problem, a process called down-sampling is used in which only one out of two in
each of the two 1000 samples is kept to get the complete information [14].
This process is illustrated in figure 4-10.
Figure 4-10 Process of Down Sampling
Signal can be decomposed into approximation and detail coefficients. This
decomposition process can be iterative to produce a wavelet decomposition tree as
shown in Figure 4-11.
Figure 4-11 Signal Multilevel Decomposition
Approximation coefficients at each level are further decomposed using this approach.
39
4.3.3 Image Pre-processing
Image pre-processing is the first step for texture analysis of palmprint using wavelets.
The processes in this step include image cropping, grayscale conversion, binary
thresholding, noise and peg removal and edge detection. All these processes have
been explained in chapter 2.
4.3.4 Feature Extraction
In proposed system texture features are extracted by applying wavelet transform on
palm prints (ROI).
Image segmentation is applied to extract the palmprint images such that a square
palm image of variable side length depending on the distance between the two
extreme fingers is extracted. Palm print image is further segmented into four equal
segments and then 2-D wavelet decomposition is applied on each segment.
Different level of decomposition is applied on palm segments but optimal
decomposition level that is found was three. Similarly different wavelets are tested
and best results are obtained by using dmey wavelet. Following two types of features
are extracted as texture features of the palmprint.
(iii)The percentage of energy corresponding to the approximation, horizontal,
vertical, and diagonal details.
(iv) Energy of autocorrelation functions of the wavelet coefficients.
In this way we get eighty features of a palm. Feature reduction is done by
applying the PCA such that those features are retained containing 98% energy. Using
threshold 0.98, 40 features retained and remaining 40 features are discarded.
The similarity of two feature vector is measured by using Euclidean distance as
similarity measure which is explained in chapter 3.
4.3.5 Feature Normalization
Each feature is normalized before matching score to have range [0, 1]. The
normalization procedure is to transform the feature component x to a random variable
with zero mean and unit variance as
~
(4.15)i ii
i
x ux
where µi and σi are the sample mean and the sample standard deviation of that
feature respectively.
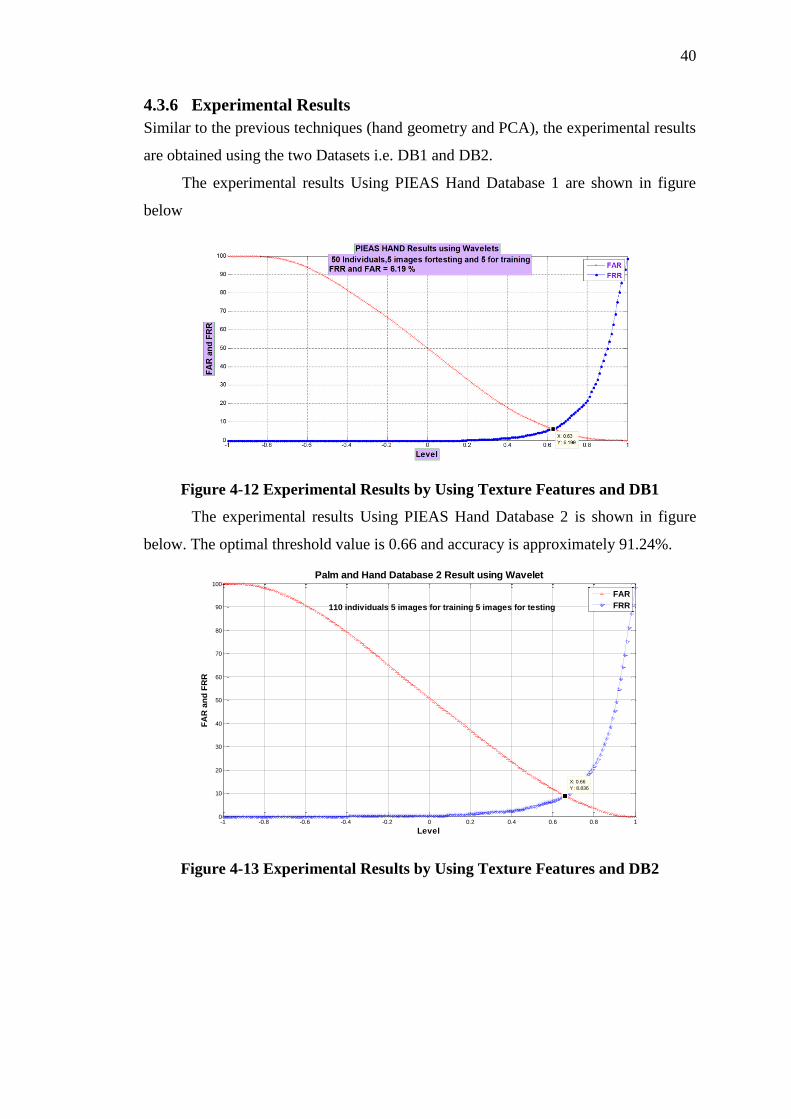
40
4.3.6 Experimental Results
Similar to the previous techniques (hand geometry and PCA), the experimental results
are obtained using the two Datasets i.e. DB1 and DB2.
The experimental results Using PIEAS Hand Database 1 are shown in figure
below
Figure 4-12 Experimental Results by Using Texture Features and DB1
The experimental results Using PIEAS Hand Database 2 is shown in figure
below. The optimal threshold value is 0.66 and accuracy is approximately 91.24%.
-1 -0.8 -0.6 -0.4 -0.2 0 0.2 0.4 0.6 0.8 10
10
20
30
40
50
60
70
80
90
100
110 individuals 5 images for training 5 images for testing
X: 0.66
Y: 8.836
Palm and Hand Database 2 Result using Wavelet
Level
FA
R a
nd
FR
R
FAR
FRR
Figure 4-13 Experimental Results by Using Texture Features and DB2
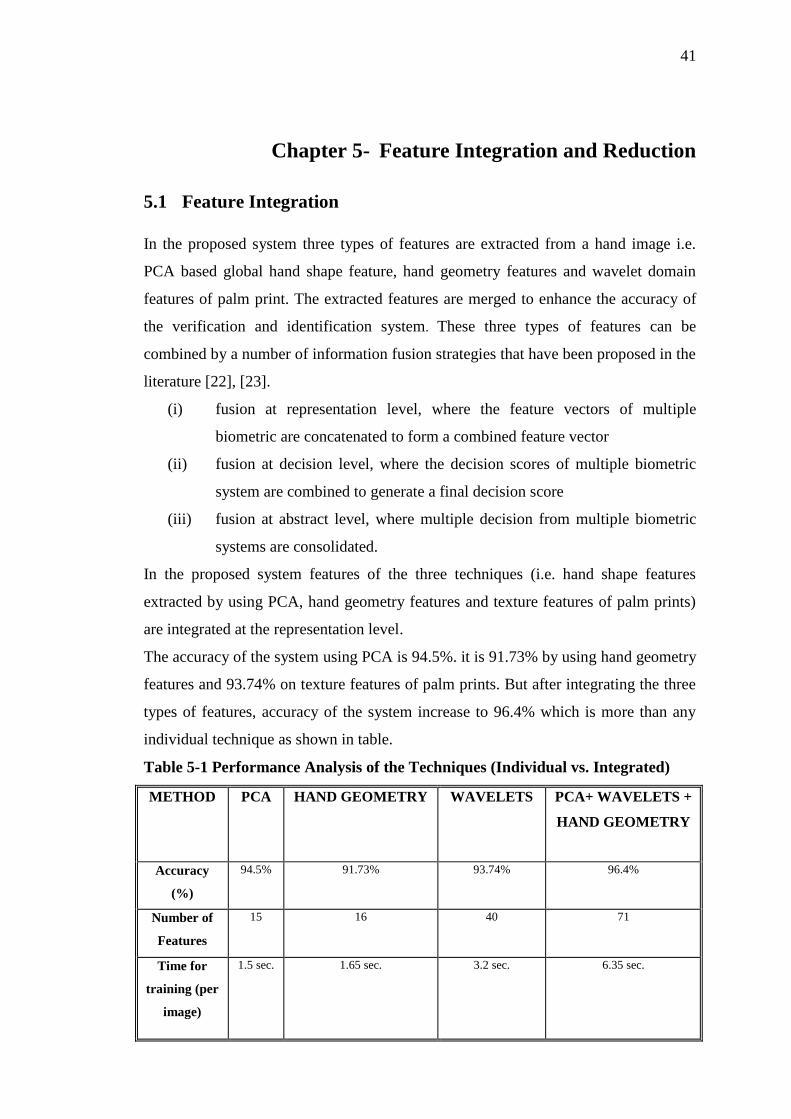
41
Chapter 5- Feature Integration and Reduction
5.1 Feature Integration
In the proposed system three types of features are extracted from a hand image i.e.
PCA based global hand shape feature, hand geometry features and wavelet domain
features of palm print. The extracted features are merged to enhance the accuracy of
the verification and identification system. These three types of features can be
combined by a number of information fusion strategies that have been proposed in the
literature [22], [23].
(i) fusion at representation level, where the feature vectors of multiple
biometric are concatenated to form a combined feature vector
(ii) fusion at decision level, where the decision scores of multiple biometric
system are combined to generate a final decision score
(iii) fusion at abstract level, where multiple decision from multiple biometric
systems are consolidated.
In the proposed system features of the three techniques (i.e. hand shape features
extracted by using PCA, hand geometry features and texture features of palm prints)
are integrated at the representation level.
The accuracy of the system using PCA is 94.5%. it is 91.73% by using hand geometry
features and 93.74% on texture features of palm prints. But after integrating the three
types of features, accuracy of the system increase to 96.4% which is more than any
individual technique as shown in table.
Table 5-1 Performance Analysis of the Techniques (Individual vs. Integrated)
METHOD PCA HAND GEOMETRY WAVELETS PCA+ WAVELETS +
HAND GEOMETRY
Accuracy
(%)
94.5% 91.73% 93.74% 96.4%
Number of
Features
15 16 40 71
Time for
training (per
image)
1.5 sec. 1.65 sec. 3.2 sec. 6.35 sec.
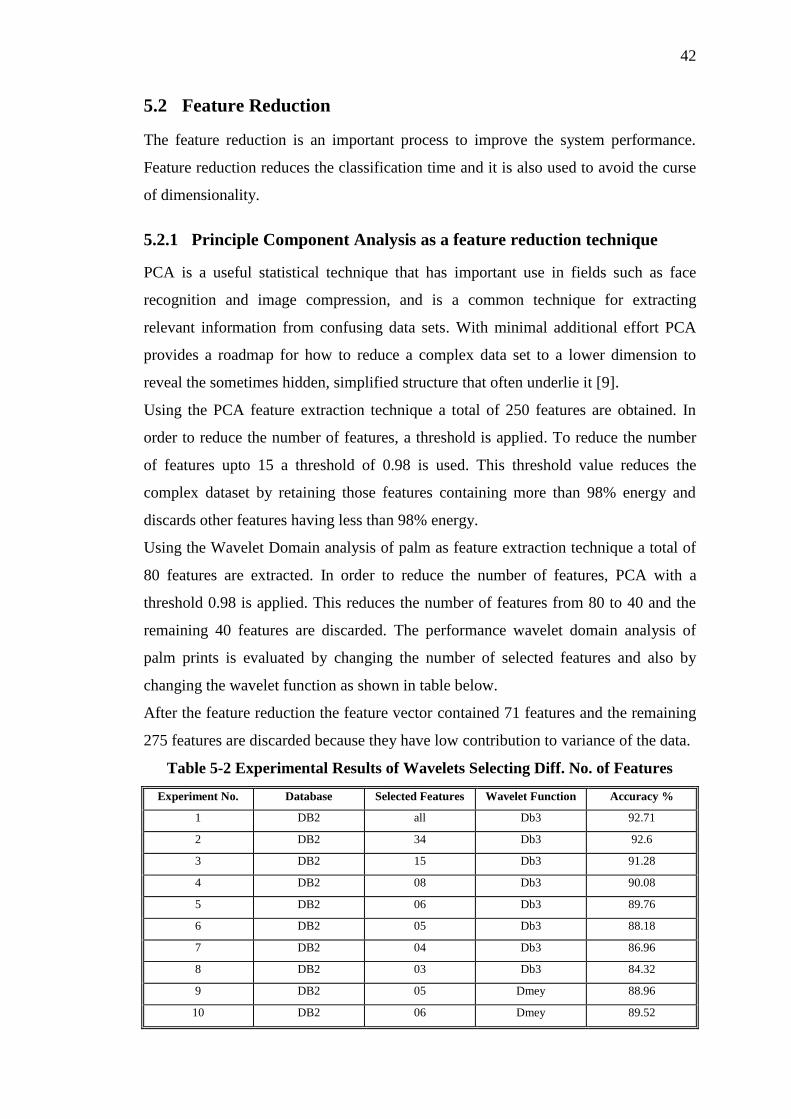
42
5.2 Feature Reduction
The feature reduction is an important process to improve the system performance.
Feature reduction reduces the classification time and it is also used to avoid the curse
of dimensionality.
5.2.1 Principle Component Analysis as a feature reduction technique
PCA is a useful statistical technique that has important use in fields such as face
recognition and image compression, and is a common technique for extracting
relevant information from confusing data sets. With minimal additional effort PCA
provides a roadmap for how to reduce a complex data set to a lower dimension to
reveal the sometimes hidden, simplified structure that often underlie it [9].
Using the PCA feature extraction technique a total of 250 features are obtained. In
order to reduce the number of features, a threshold is applied. To reduce the number
of features upto 15 a threshold of 0.98 is used. This threshold value reduces the
complex dataset by retaining those features containing more than 98% energy and
discards other features having less than 98% energy.
Using the Wavelet Domain analysis of palm as feature extraction technique a total of
80 features are extracted. In order to reduce the number of features, PCA with a
threshold 0.98 is applied. This reduces the number of features from 80 to 40 and the
remaining 40 features are discarded. The performance wavelet domain analysis of
palm prints is evaluated by changing the number of selected features and also by
changing the wavelet function as shown in table below.
After the feature reduction the feature vector contained 71 features and the remaining
275 features are discarded because they have low contribution to variance of the data.
Table 5-2 Experimental Results of Wavelets Selecting Diff. No. of Features
Experiment No. Database Selected Features Wavelet Function Accuracy %
1 DB2 all Db3 92.71
2 DB2 34 Db3 92.6
3 DB2 15 Db3 91.28
4 DB2 08 Db3 90.08
5 DB2 06 Db3 89.76
6 DB2 05 Db3 88.18
7 DB2 04 Db3 86.96
8 DB2 03 Db3 84.32
9 DB2 05 Dmey 88.96
10 DB2 06 Dmey 89.52

43
11 DB2 08 Dmey 91.32
12 DB2 16 Dmey 93.26
13 DB2 24 Dmey 93.52
14 DB2 38 Dmey 93.74
15 DB2 all Sym3 91.6
16 DB2 all Coif3 91.84
17 DB2 all Haar 89.8
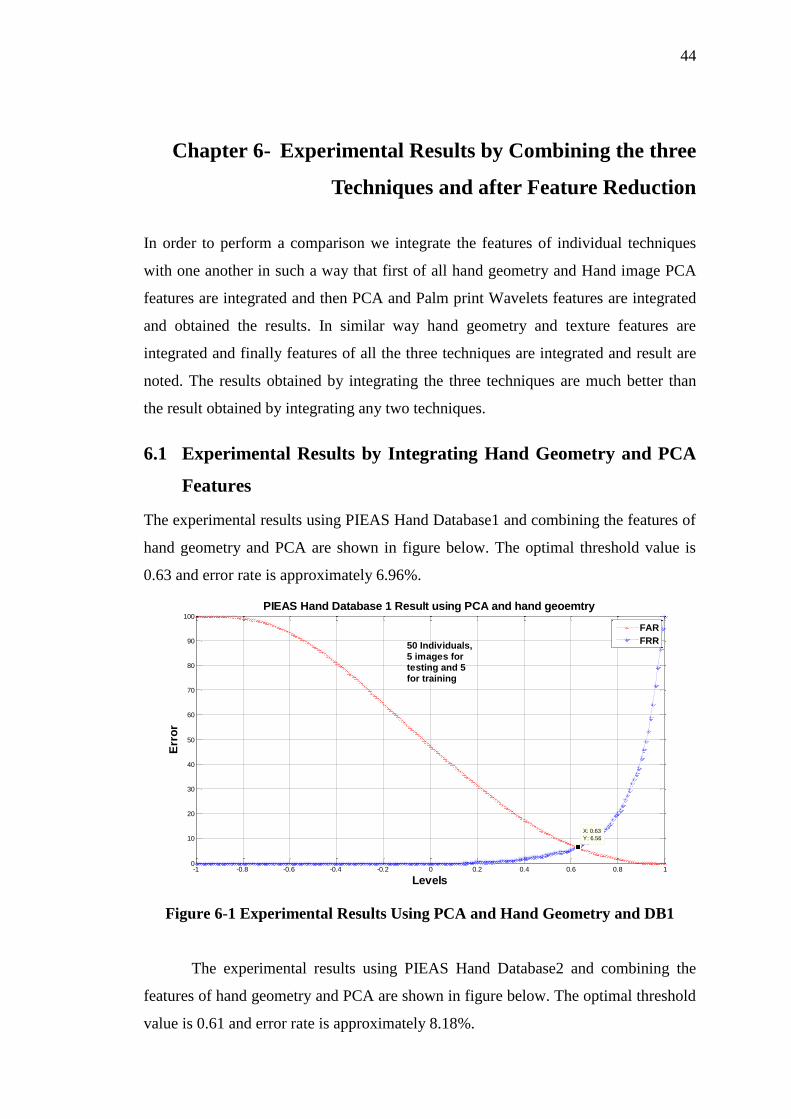
44
Chapter 6- Experimental Results by Combining the three
Techniques and after Feature Reduction
In order to perform a comparison we integrate the features of individual techniques
with one another in such a way that first of all hand geometry and Hand image PCA
features are integrated and then PCA and Palm print Wavelets features are integrated
and obtained the results. In similar way hand geometry and texture features are
integrated and finally features of all the three techniques are integrated and result are
noted. The results obtained by integrating the three techniques are much better than
the result obtained by integrating any two techniques.
6.1 Experimental Results by Integrating Hand Geometry and PCA
Features
The experimental results using PIEAS Hand Database1 and combining the features of
hand geometry and PCA are shown in figure below. The optimal threshold value is
0.63 and error rate is approximately 6.96%.
-1 -0.8 -0.6 -0.4 -0.2 0 0.2 0.4 0.6 0.8 10
10
20
30
40
50
60
70
80
90
100
X: 0.63
Y: 6.56
PIEAS Hand Database 1 Result using PCA and hand geoemtry
Levels
Err
or
FAR
FRR50 Individuals,5 images fortesting and 5for training
Figure 6-1 Experimental Results Using PCA and Hand Geometry and DB1
The experimental results using PIEAS Hand Database2 and combining the
features of hand geometry and PCA are shown in figure below. The optimal threshold
value is 0.61 and error rate is approximately 8.18%.
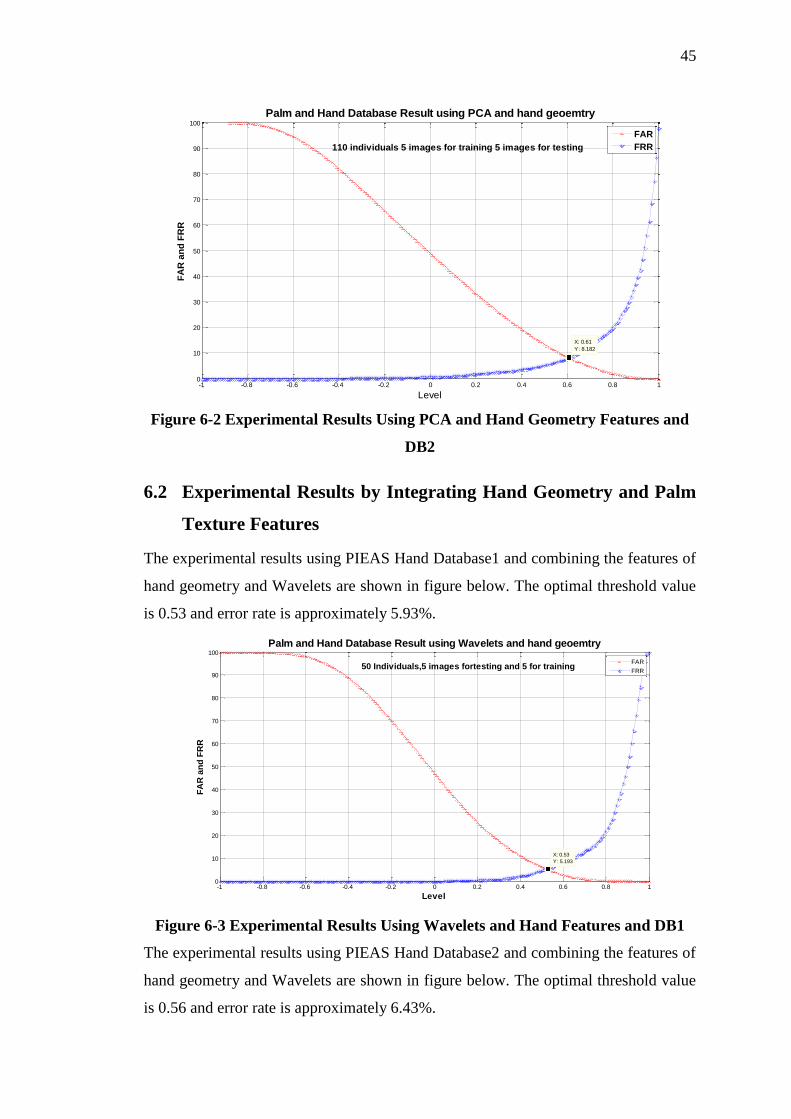
45
-1 -0.8 -0.6 -0.4 -0.2 0 0.2 0.4 0.6 0.8 10
10
20
30
40
50
60
70
80
90
100
X: 0.61
Y: 8.182
Palm and Hand Database Result using PCA and hand geoemtry
Level
FA
R a
nd
FR
R
110 individuals 5 images for training 5 images for testing
FAR
FRR
Figure 6-2 Experimental Results Using PCA and Hand Geometry Features and
DB2
6.2 Experimental Results by Integrating Hand Geometry and Palm
Texture Features
The experimental results using PIEAS Hand Database1 and combining the features of
hand geometry and Wavelets are shown in figure below. The optimal threshold value
is 0.53 and error rate is approximately 5.93%.
-1 -0.8 -0.6 -0.4 -0.2 0 0.2 0.4 0.6 0.8 10
10
20
30
40
50
60
70
80
90
100
X: 0.53
Y: 5.193
Palm and Hand Database Result using Wavelets and hand geoemtry
Level
FA
R a
nd
FR
R
50 Individuals,5 images fortesting and 5 for trainingFAR
FRR
Figure 6-3 Experimental Results Using Wavelets and Hand Features and DB1
The experimental results using PIEAS Hand Database2 and combining the features of
hand geometry and Wavelets are shown in figure below. The optimal threshold value
is 0.56 and error rate is approximately 6.43%.
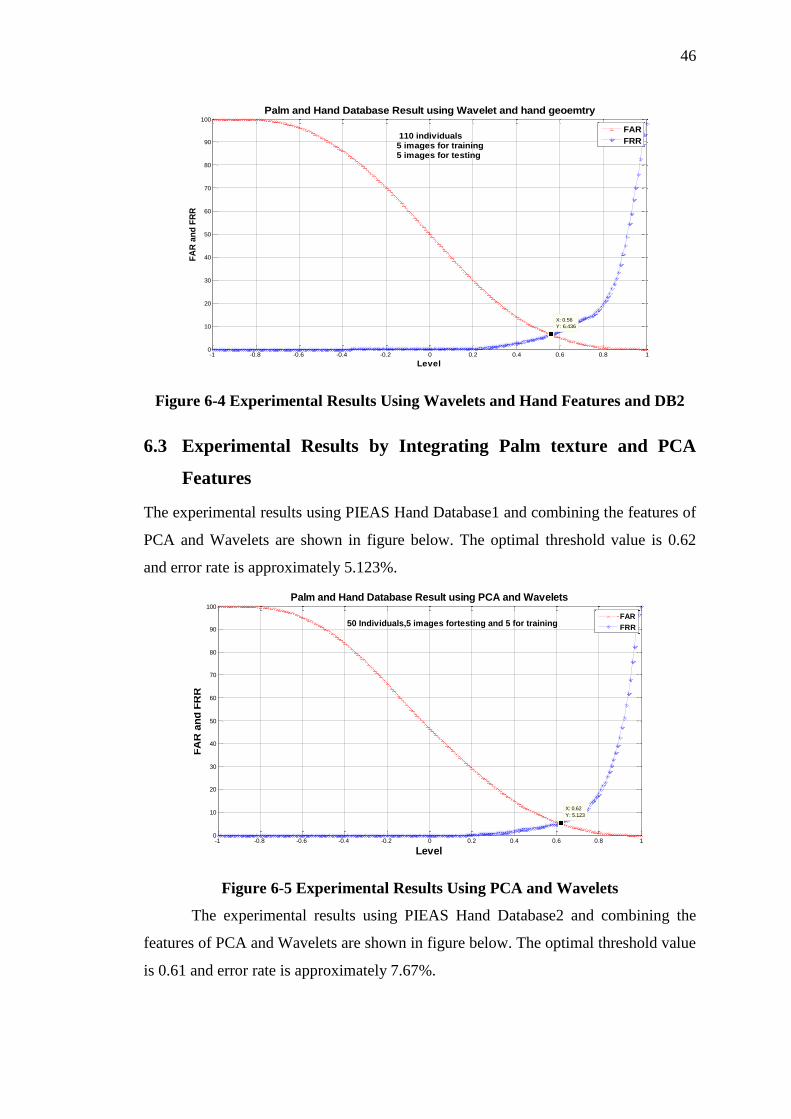
46
-1 -0.8 -0.6 -0.4 -0.2 0 0.2 0.4 0.6 0.8 10
10
20
30
40
50
60
70
80
90
100
X: 0.56
Y: 6.436
Palm and Hand Database Result using Wavelet and hand geoemtry
Level
FA
R a
nd
FR
R
110 individuals 5 images for training 5 images for testing
FAR
FRR
Figure 6-4 Experimental Results Using Wavelets and Hand Features and DB2
6.3 Experimental Results by Integrating Palm texture and PCA
Features
The experimental results using PIEAS Hand Database1 and combining the features of
PCA and Wavelets are shown in figure below. The optimal threshold value is 0.62
and error rate is approximately 5.123%.
-1 -0.8 -0.6 -0.4 -0.2 0 0.2 0.4 0.6 0.8 10
10
20
30
40
50
60
70
80
90
100
X: 0.62
Y: 5.123
Palm and Hand Database Result using PCA and Wavelets
Level
FA
R a
nd
FR
R
50 Individuals,5 images fortesting and 5 for trainingFAR
FRR
Figure 6-5 Experimental Results Using PCA and Wavelets
The experimental results using PIEAS Hand Database2 and combining the
features of PCA and Wavelets are shown in figure below. The optimal threshold value
is 0.61 and error rate is approximately 7.67%.
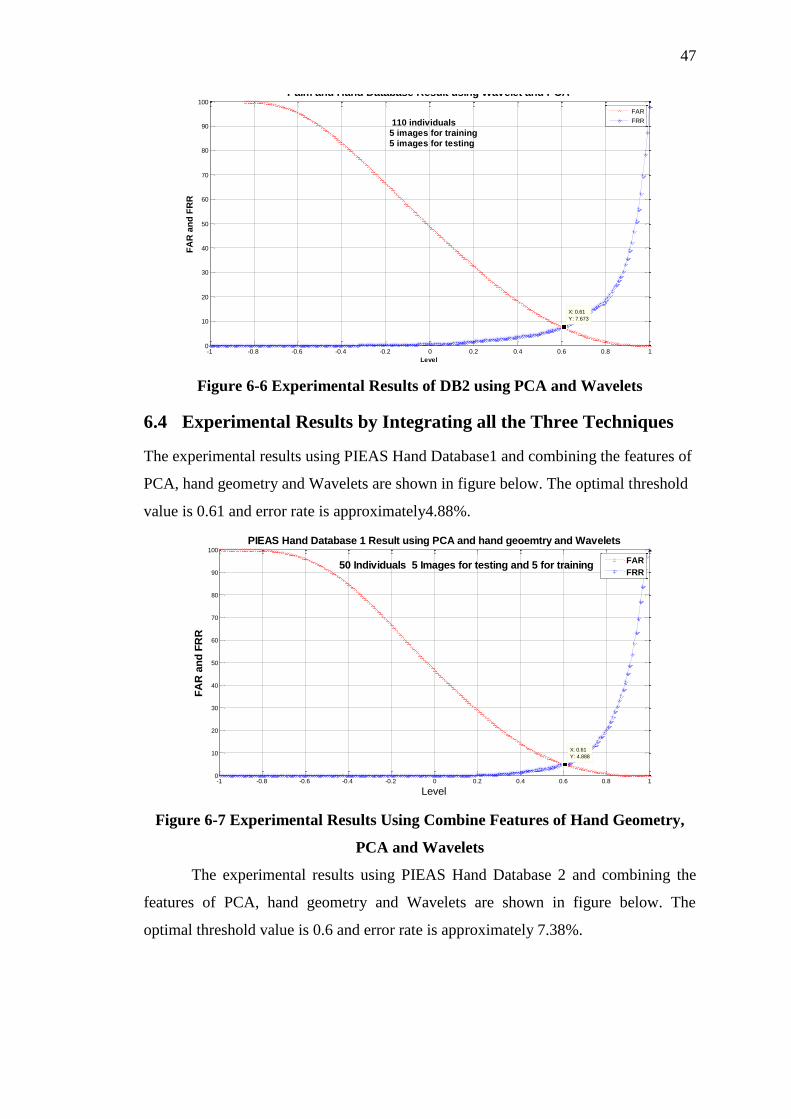
47
-1 -0.8 -0.6 -0.4 -0.2 0 0.2 0.4 0.6 0.8 10
10
20
30
40
50
60
70
80
90
100
X: 0.61
Y: 7.673
Palm and Hand Database Result using Wavelet and PCA
Level
FA
R a
nd
FR
R
110 individuals 5 images for training 5 images for testing
FAR
FRR
Figure 6-6 Experimental Results of DB2 using PCA and Wavelets
6.4 Experimental Results by Integrating all the Three Techniques
The experimental results using PIEAS Hand Database1 and combining the features of
PCA, hand geometry and Wavelets are shown in figure below. The optimal threshold
value is 0.61 and error rate is approximately4.88%.
-1 -0.8 -0.6 -0.4 -0.2 0 0.2 0.4 0.6 0.8 10
10
20
30
40
50
60
70
80
90
100
X: 0.61
Y: 4.888
PIEAS Hand Database 1 Result using PCA and hand geoemtry and Wavelets
Level
FA
R a
nd
FR
R
50 Individuals 5 Images for testing and 5 for trainingFAR
FRR
Figure 6-7 Experimental Results Using Combine Features of Hand Geometry,
PCA and Wavelets
The experimental results using PIEAS Hand Database 2 and combining the
features of PCA, hand geometry and Wavelets are shown in figure below. The
optimal threshold value is 0.6 and error rate is approximately 7.38%.
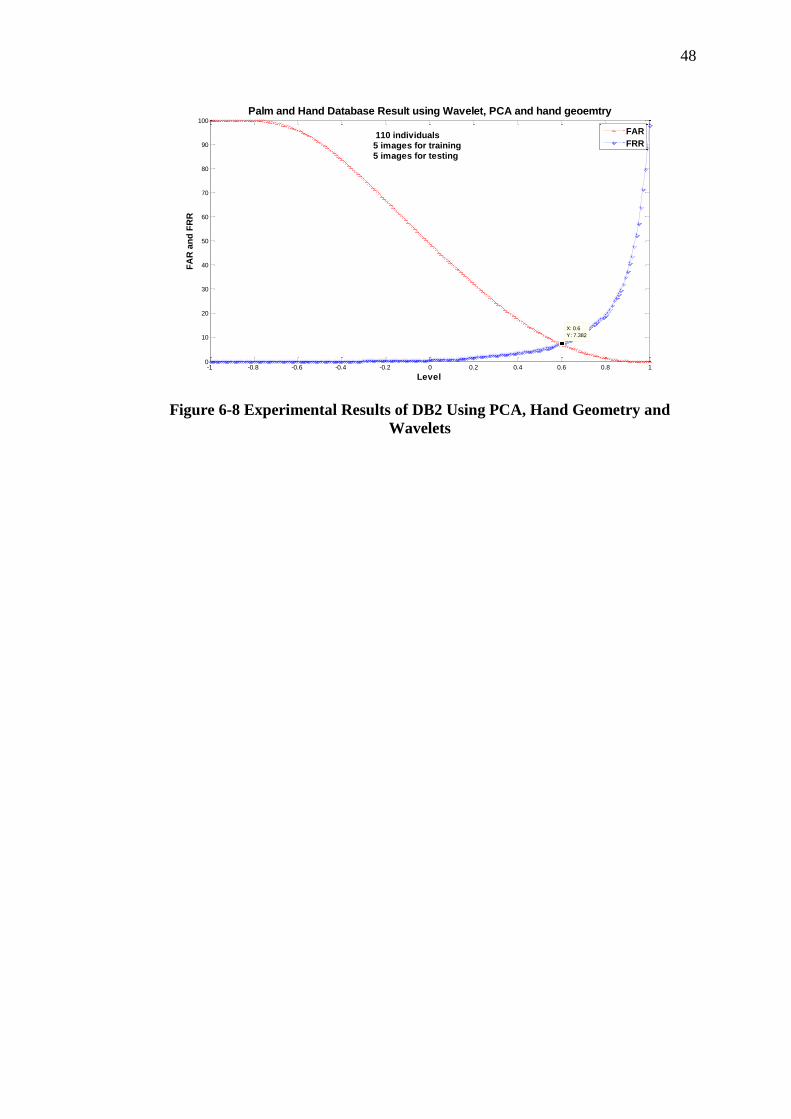
48
-1 -0.8 -0.6 -0.4 -0.2 0 0.2 0.4 0.6 0.8 10
10
20
30
40
50
60
70
80
90
100
X: 0.6
Y: 7.382
Palm and Hand Database Result using Wavelet, PCA and hand geoemtry
Level
FA
R a
nd
FR
R
110 individuals 5 images for training5 images for testing
FAR
FRR
Figure 6-8 Experimental Results of DB2 Using PCA, Hand Geometry and
Wavelets
49
Chapter 7- Conclusion and Future Directions
In this thesis, a novel approach is presented to identify person using their hand shape,
hand geometry and palm texture features. These features are proposed to be extracted
from a single hand image acquired using a simple flatbed scanner. A palm print image
contains the texture information and wavelet transform is applied to extract the texture
information. PCA is applied to extract the hand shape features and image processing
techniques are applied to extract the hand geometry features. The hand shape includes
the hand geometry features and the interior contents of hand. The hand geometry
features that are used for identification includes finger lengths, finger widths, palm
length, palm width and hand length. By the integration of features extracted by
proposed techniques i.e. PCA, Hand geometry, and wavelet domain analysis of palm,
a higher accuracy to identify an individual is achieved. Experimental results suggest
that majority features of hand are useful for person recognition. Using DB1 and DB2,
accuracy of the proposed system is about 96.4% and 94% respectively.
Currently, we had directed our efforts to improve the accuracy of the identification
system. Therefore the optimization of the code in terms of execution time has not
been performed. The performance of the system can be improved by optimizing the
code.
In the future, there are two fold improvements: In pre-processing phase, image
alignment step can be added to align all the images which will defiantly improve the
accuracy of the system. In the feature extraction phase, a gabor filter can be used to
extract the palm texture features and 2D-PCA can be applied to extract the hand shape
features to improve the accuracy of identification system. In future work, a technique
of complex wavelet structural similarity index matrix to minimize the effect of
rotation of images and the effect of luminance.
Another interesting area of research is the study upon the classification
techniques. We have used Euclidian distance as a similarity measure. Other
classification techniques can be used for the classification of features such as Support
Vector Machine (SVM), LYQ and multilayer perceptron, etc.
The software development and deployment of this project is also the future
objective.
50
References
[1]. K. Jain, A. Ross, S. Prabhakar, ―Fingerprint matching using minutiae and
texture feature‖, in: Proc. International Conference on Image Processing
(ICIP), Thessaloniki, Greece, 2001, pp. 282—285.
[2]. Jane You, Wenxin Li and David Zhang, ―Hierarchical palmprint identification
via multiple feature extraction‖, Pattern Recognition 35 (2002) 847-859.
[3]. Wendy S. Yambor, ―Analysis of PCA based and Fisher Discriminent based
Image Recognition Algorithms‖, Coloradestate Technical report CS-00-103,
jully 200, pp. 1-14.
[4]. A. Kumar, D. Wong, H. Shen, A. Jain, ―Personal identification using
palmprint and hand geometry biometrics‖, In: Proc. of 4th International
Conference on audio- and video-based biometric personal authentication
(AVPBA), 2003.
[5]. W. Shu and D. Zhang, ―Automated personal identification by palmprint,‖ Opt.
Eng., vol. 37, no. 8, pp. 2359-2362, Aug. 1998.
[6]. Slobodan Ribari, Damir Ribari, Nikola Pavesi, ―A biometric Identification
System based on the Fusion of Hand and Palm Geometry‖, Faculty of
Electrical Engineering and Computing, University of Zagreb, Croatia, 2001.
[7]. R. Sanchez-Reillo, C. Sanchez-Avila, and A. Gonzales-Marcos, "Biometric
identification through hand geometry measurements,‖ IEEE Trans. Patt. Anal.
Machine Intell, vol. 22, no. 10, pp. 1168-1171, 2000.
[8]. A. K. Jain, A. Ross, and S. Pankarti, ―A prototype hand geometry based
verification system‖, Proc. 2nd
Intl. Conf. Audio Video based Biometric
Personal Authentication, Washington D. C., pp. 166-171, Mar. 1999.
[9]. Jonathon Shlens, ―A Tutorial on Principal Component Analysis‖, Systems
Neurobiology Laboratory, Salk Institute for Biological Studies La Jolla, CA
92037 and Institute for Nonlinear Science, University of California, San Diego
La Jolla, CA 92093-0402, Version 2, December 10, 2005.
[10]. W. Shu, G. Rong, Z. Bian and D. Zhang, ―Automatic palmprint
verification,‖ International Journal of Image and Graphics, Vol. 1, No.1,
(2001) 135-151.
[11]. L. Shu-tao, W. Yao-nan, G. Li-zhuan, ―Selection of Optimal Decomposition
Level of Wavelet for Multi-focus Image Fusion‖, Systems Engineering and
Elecronics, Vol 24, 2002.
51
[12]. K.M. Rajpoot, N.M. Rajpoot, ―Wavelets and Support Vector Machines for
Texture Classification‖, INMIC 2004.
[13]. M. Misity, Y. Misiti, G. Oppenheim, J.M. Poggi, ―Wavelet Toolbox 4
User‘s Guide‖, Mathworks, 2007.
[14]. D. Zhang, ―Biometrics technologies and applications‖ in Proceedings of
First International Conference on Image and Graphics, Tiangin, China,
pp.42-49, August 16-18, 2000.
[15]. Gonzalez and Woods, Digital Image Processing, 3rd Edition, Prentice Hall,
2008.
[16]. X. Lu, D. Zhang, and K. Wang, ―Fisher palms based palmprint recognition,‖
Pattern Recognit. Lett. , vol. 24, Nov. 2003, pp. 2829–2838.
[17]. A. K. Jain and N. Duta, ‖Deformable matching of hand shapes for
verification‖, http://www.cse.msu.edu/~dutanico/
[18]. D. G. Joshi, Y. V. Rao, S. Kar, V. Kumar and R. Kumar, ―Computer vision-
based approach to personal identification using finger crease pattern‖,
Pattern Recognition, Vol. 31, pp. 15-22, 1998.
[19]. D. Zhang and W. Shu, ―Two novel characteristics in palm print verification:
datum point invariance and line feature matching‖, Pattern Recognition,
Vol. 32, pp. 691-702, 1999.
[20]. S. Y. Kung, S. H. Lin and M. Fang, ―A neural network approach to
face/palm recognition‖, in Proc. of 1995 International Conference on Neural
Network, pp. 323-332, 1995.
[21]. C. C. Han, P. C. Chang and C. C. Hsu, ―Personal identification using hand
geometry and palm-print‖, in Proc. of Fourth Asian Conference on
Computer Vision (ACCV), pp. 747-752, 2000.
[22]. J. Kittler, M. Hatef, R. P. W. Duin, and J. Matas, ―On combining
classifiers," IEEE Trans. Patt. Anal. Machine Intell., vol. 20, pp. 226-239,
Mar. 1998.
[23]. A. Ross, A. K. Jain, and J.-Zhang Qian, ―Information fusion in biometrics,‖
Proc. AVBPA’01, Halmstad, Sweden, pp. 354-359, Jun. 2001.
[24]. L Cohen, ‗Time-Frequency Distributions- A Review‘, Proc. of IEEE, 77(7),
pp. 941-981, 1989


![Stage- 1 [ ] 3mutucertification.com/wp-content/uploads/2018/07/Assessment-Report... · Roundtable on Sustainable Palm Oil Certification ... Hazard Identification and Risk Assessment](https://img.pdfslide.net/doc/110x75/5cb233a188c99342708bb5c2/stage-1-roundtable-on-sustainable-palm-oil-certification-hazard-identification.jpg)