Embed Size (px)
Citation preview

21st IMEKO TC4 International Symposium and
19th International Workshop on ADC Modelling and Testing
Understanding the World through Electrical and Electronic Measurement
Budapest, Hungary, September 7-9, 2016
Personal computer-based electrical power quality
signal generator
Milan Simić1, Zivko Kokolanski2, Dragan Denić1, Vladimir Dimcev2, Dragan Živanović1, Dimitar
Taskovski2
1Faculty of Electronic Engineering, Niš, Serbia, [email protected] of Electrical Engineering and Information Technologies, Skopje, Macedonia
Abstract – Electrical power quality signal generator,
capable of reproducing power quality disturbances in
accordance with European quality standard EN50160,
is presented in this paper. Signal generator is divided
in two parts: LabVIEW based virtual instrumentation
software for defining the disturbance parameters and
hardware electronics for signal generation (data
acquisition card and power amplifier). The paper
focus is on the design of power amplifier for scaling
the data acquisition card output voltage level to the
nominal power line voltage (230 V). Developed signal
generator can be used for generation of reference
signals useful for testing of power quality measuring
instruments and various algorithms for power quality
disturbance detection. In such manner, this PC based
signal generator can be used as very good and cost
effective alternative to very expensive instruments for
testing of power qulity meters and analyzers.
Keywords – Electrical power quality, Signal generator,
Power amplifier, LabVIEW software.
I. INTRODUCTION
Degradation of the optimal power quality (PQ) can be
caused by various problems and disturbances in electrical
power distribution networks. Signal disturbances, present
in form of RMS voltage variations or high-order signal
harmonics, directly affect on the energy efficiency
decreasing in electrical power production, distribution
and consumption. Increased concern for PQ problems,
indicated in the recent years, primarily is caused by the
limitations of natural resources necessary for power
production, followed by widespread using of alternative
energy resources [1,2]. Considering these facts, PQ
problems are became very important and significant
topic. For purpose of customer protection, optimal quality
level is defined according to the relevant international
standards and regulations [3]. European quality standard
EN 50160 defines voltage characteristics of electricity
supplied using the public distribution systems, for normal
operating conditions. Required quality level is determined
by reference nominal values and acceptable limits of
standard quality parameters and network disturbances.
Relevant information, necessary for quality assessment,
can be provided by measurement and processing of PQ
parameters at specific locations in distribution network.
Having in mind the challenges of the modern smart
grids and great importance of PQ topic, special attention
is paid to development of sophisticated and reliable
microprocessor-based measurement systems for PQ
monitoring. In the last decade especially attractive are so
called “virtual instruments”, which are well suited for
development of flexible computer-based measurement
and control systems. Generally, virtual instruments can be
successfully used in research and scientific purposes.
Many scientific papers on virtual instrumentation for PQ
analysis (both for measurement or signal generation) have
being published [4-9]. However, usually less attention is
paid to signal amplification, which is very important for
practical implementation of virtual PQ signal generators.
In order to satisfy the specified level of measurement
accuracy and characteristics, devices for PQ measurement
must be followed by appropriate metrological traceability
chain. Reference instruments, such as voltage and current
calibrators, are available in the various functional and
constructive solutions. Such calibration instruments are
relatively expensive and therefore unavailable to many
scientific researchers. Significant limitation of these
instruments is closed functional architecture, developed
according to the relevant quality standards. Due to this
limitation, such instruments are not flexible and hardly
adaptable to some specific problems. Virtual instrument,
presented in this paper, is capable of reproducing the PQ
disturbances in accordance with the European quality
standard EN50160. This solution is easily adaptable to
various practical researcher requirements, for example
logging of measurement results, generation of PQ
disturbance random sequence and upgrading of some
recently defined standard network disturbances [10].
170

II. VIRTUAL INSTRUMENT FOR GENERATION
OF STANDARD PQ DISTURBANCES
Generator of sinusoidal voltage signals with standard
PQ disturbances is based on virtual instrumentation
concept, including LabVIEW software platform and data
acquisition board NI PCIe 6343. Virtual instrument (VI)
is divided in two segments: a graphical user interface
(front panel) and program code (block diagram), both
strongly interlinked between each other. Basic purpose is
generation of reference waveforms with special functions
for simulation of the standard network disturbances [11].
Generally, this virtual instrument enables generation of
three-phase voltage signals. Currently, signal amplifier is
developed for amplification of one-phase voltage signal,
but this solution can be simply multiplied in simetrical
manner for other two channels of voltage waveforms.
Some basic functions provided by developed virtual
instrument for PQ signal generation are:
- definition of nominal amplitude and frequency values,
- definition of signal sample rate and duration of final
test sequence,
- generation of noise (Gaussian distributed amplitude),
- variation of nominal signal frequency value and slow
amplitude fluctuations,
- slow variation of signal amplitude value with defined
frequency of variation,
- definition of DC offset, voltage swell and voltage sag,
- definition of high-order signal harmonic components
with up to 50 individual defined harmonics,
- generation of some special types of disturbances
(flicker, burst transients, short voltage oscillation).
LabVIEW front panel of signal generator for graphic
presentation of reference voltage waveform, with four
different examples, is presented in Fig. 1. Definition and
simulation of voltage waveforms, with specified levels of
standard PQ disturbances, can be performed directly in
control front panel and block diagram of LabVIEW
virtual instrument. Each type of signal disturbances, for
example voltage swell, voltage sag and high-order signal
harmonics, can be defined and generated using separate
functional segments. Individual signal disturbances can
be combined and unified in the form of final complex
sequence, according to the requirements of European PQ
standard EN 50160 [3]. Presented front panel of signal
generator includes primary control buttons for selection
of individual PQ disturbances, such as: voltage swells,
voltage sags,signal DC offset,frequency variations, slow
amplitude fluctuations and percentage noise level.
Separated segment of control functions on LabVIEW
virtual instrument is used for selection and variation of
specific amplitude levels related to individual high-order
harmonic components. Content of specific high-order
signal harmonics can be precisely determined by number
of control knobs for regulation of harmonic amplitude
levels. Specifically, in Fig. 1. are presented four examples
of sinusoidal voltage waveform, generated with various
levels of high-order harmonic components. Presented
voltage waveforms are generated with nominal signal
frequency value of 50Hz and normalized RMS voltage
value of 5.5 V. In order to be more realistic in generation
of voltage waveforms, for specific quality disturbances is
enabled separate definition of start time, stop time, rising
time and falling time of generated signal disturbances.
Some additional classes of network disturbances can be
Fig. 1. Front panel of LabVIEW signal generator (voltage waveforms with various levels of high-order signal harmonics)
171

Fig. 2. Block diagram in LabVIEW environment (executive software code) – virtual instrument for generation of PQ disturbances
also generated by the described signal generator. These
characteristic disturbances are: flicker generated as slow
variation of signal amplitude level, voltage interruption
that can be defined as one special type of voltage sag,
burst transients and short voltage oscillation caused by
the presence and influence of higher signal harmonics.
Block diagram in LabVIEW environment (software
code), corresponding to virtual instrument for generation
of standard PQ disturbances, is presented in Fig. 2.
III. POWER AMPLIFIER DESIGN
The signal generated (simulated) by the virtual
instrument is usually physically reproduced by using a
PC-based data acquisition (DAQ) card, containing a
digital to analog (D/A) converter. The D/A converter
output signal is usually standardized to a given voltage
level, typically up to ±10V. Such voltage levels are not
directly applicable to test power quality meters and have
to be amplified to the nominal power line voltage of
230V (or 110V) prior the measurements.A dedicated data
acquisition cards with the “high voltage”outputs are also
available, but they are usually too expensive. The aim of
this paper is to address the key parameters in the design
phase in order to implement a low-cost and full-
performance PQ signal generator.
The block diagram of the realized PQ signal power
amplifier is given in Fig. 3.
The simulated signal with the LabVIEW software can
be reproduced by any standard DAQ card with analog
output channels. However, the DAQ card should meet
Fig. 3. Block diagram of the PQ signal power amplifier
some implementation related requirements. Namely, it
must have good-enough resolution (which is defined by
the required output signal uncertainty), and support high-
enough sampling frequency. Theoretically, the sampling
frequency has to be at least twice higher than the
maximal harmonic that needs to be generated. According
to the PQ standard EN50160 [3] (up to 50th harmonic),
the minimum sampling frequency is 5 kHz. However, in
practice the sampling frequency should be higher to
maintain the accuracy of the higher harmonics.
The generated signal with the DAQ card is amplified
by an amplifier (given in Fig. 3.), which amplifies the
signal to the nominal power line level of 230 V. To do so,
several analog signal processing modules are used:
preamplifier (to amplify the input signal to a given
reference level and limit the input voltage level), low pass
filter (to restrict the input signal bandwidth and eliminate
noise), power amplifier (to amplify the signal to nominal
power line level and increase the load current capability).
172
A. Preamplifier
In the proposed solution, preamplifier has a double
role: to amplify the input signal (comming from the PC-
DAQ card) to a standardized refference level, and to limit
the input voltage level. Usually, commercial DAQ cards
have a standardized analog output voltage, e.g: ± 2.5 V,
± 5 V, or ± 10 V. The idea is to design an amplifier
capable of reproducing the power line voltage with any
standard DAQ card with the voltage levels such as
mentioned above. To do so, the refference output voltage
of the preamplifier was taken as ± 10 V. This means that
preamplifier must have variable amplification (4, 2, and 1
times), regarding the input voltage level (± 2.5 V, ± 5 V,
and ± 10 V), respectively. Such solution can be easilly
implemented with a clasical operational amplifier-based
preamplifiers in inverting or non-inverting configuration
and with an amplification selector switch. In practice, the
preamplifier was realized by using a low-noise and low-
offset precision operational amplifiers OP07 [12], in
inverting configuration.
The voltage limiter is also an important part of the
preamplifier stage because it prevents generation of a
high voltage spikes and saturation of the PQ amplifier.
While there are a lot of possible implementations of a
voltage limiters, the simplest realization is by using a
Zener diodes. On the other hand, when using a Zener
diode limiters, a low-pass filter at the output of the diodes
must be used. The voltage limiter was realized with two
Zener diodes with breakdown voltages of 10 V, wired in
an oposite direction. While this is a very simple solution,
the Zener diodes can generate a significant amount of
noise. Therefore, a passive low-pass RC filter was
designed at the output of the diodes. The cut-off
frequency of the filter has to be well above the PQ
generator pass-band (which is up to 50th harmonic of the
power line frequency). Therefore, a first order passive RC
filter, with a cut-off frequency of 22.5 kHz, was realized
B. Lowpass antialiasing filter
The filters are characterized by several parameters:
width of the pass band, attenuation in the stop band, cut-
off frequency and filter order. Every filter type has its
own unique properties. The Bessel filter has the most
linear phase-frequency characteristics, Butterworth filter
have maximally flat pass band and Chebyshev filter have
the highest attenuation in the stop band but also ripples in
the pass band. When designing an anti-aliasing filter it is
necessary to consider the -3dB attenuation at the cut-off
frequency. If this is not taken into account, the higher
harmonics of the signal will be attenuated and the error
caused by the filter at the cut-off frequency will be
around 30%. Therefore, to control the errors caused by
non-ideal shape of amplitude-frequency characteristics in
[13], a CFM (Cutt-off Frequency Multiplier) parameter is
defined. The CFM parameter defines a segment of the
pass band where the errors caused by the difference
between the real and ideal filter transfer characteristics
are controlled on certain defined level (e.g 0,1%). It is
important to note that the CFM value decreases with the
filter order. However, the value of CFM stabilizes for a
filter order higher that four and further increase carry
benefit only in the attenuation in the stop band. Hence, if
a Butterworth fourth order filter is designed, the value of
the CFM parameter will be 2.18. This means that the
filter cut-off frequency should be 2.18 times higher than
frequency of the highest harmonic in the signal spectrum.
Therefore, a fourth order Butterworth low-pass filter in a
Sallen-key configuration (realized as a cascade of two
two-pole filters) [14] was designed. Considering that 50th
voltage harmonic (f50 = 2.5 kHz) has to be analyzed, the
cut-off frequency of the filter is 5.45 kHz.
C. Power amplifier
The power amplifier has to amplify the input signal
(standardized to a ±10 V) to the power line voltage levels.
However, in order to be able to generate voltage swells,
the power line voltage level should be placed near the
middle of the DAQ card analog output voltage range. The
power amplifier was designed by using APEX PA97 [15]
high voltage operation amplifier. The amplifier is capable
of delivering 10 mA at 500 V (or power of 5 W), which is
sufficent to test PQ meters. The amplifier was designed in
an inverting configuration with amplification of 40 times.
A special attention has to be paid to the power supply of
the power amplifier. In the current realization, a classical
zener-diode based power supply of ±430 V was designed.
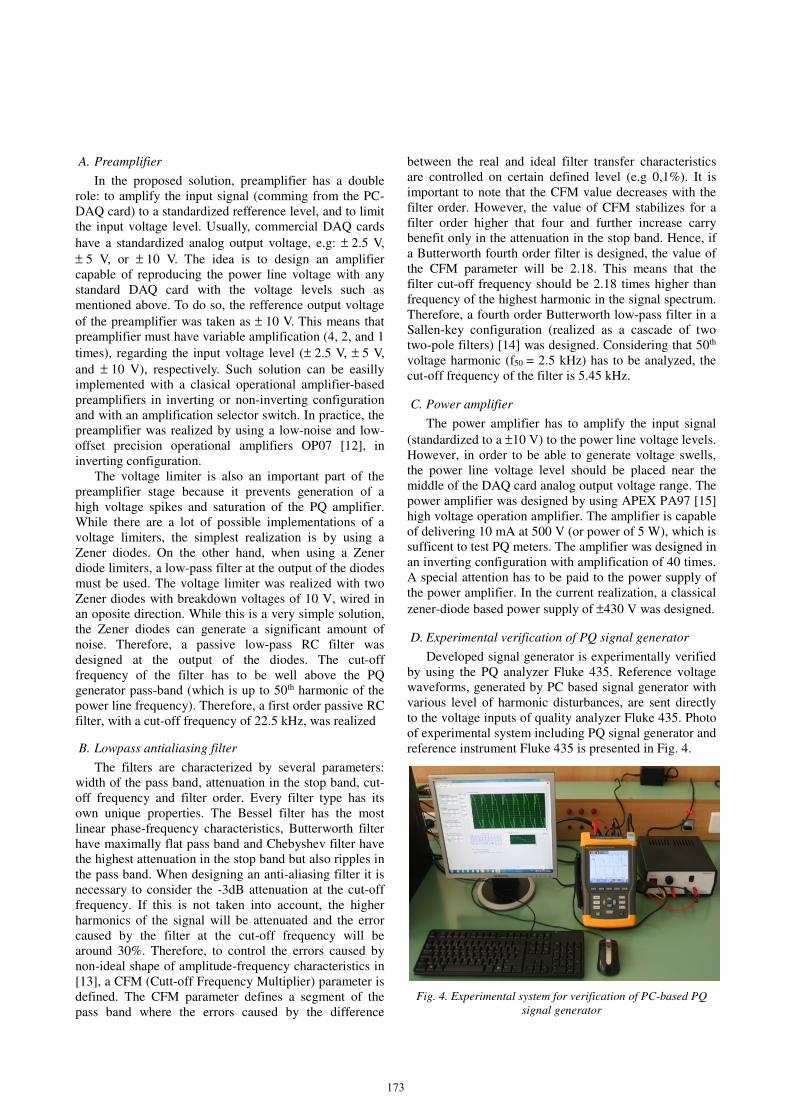
D. Experimental verification of PQ signal generator
Developed signal generator is experimentally verified
by using the PQ analyzer Fluke 435. Reference voltage
waveforms, generated by PC based signal generator with
various level of harmonic disturbances, are sent directly
to the voltage inputs of quality analyzer Fluke 435. Photo
of experimental system including PQ signal generator and
reference instrument Fluke 435 is presented in Fig. 4.
Fig. 4. Experimental system for verification of PC-based PQ signal generator
173
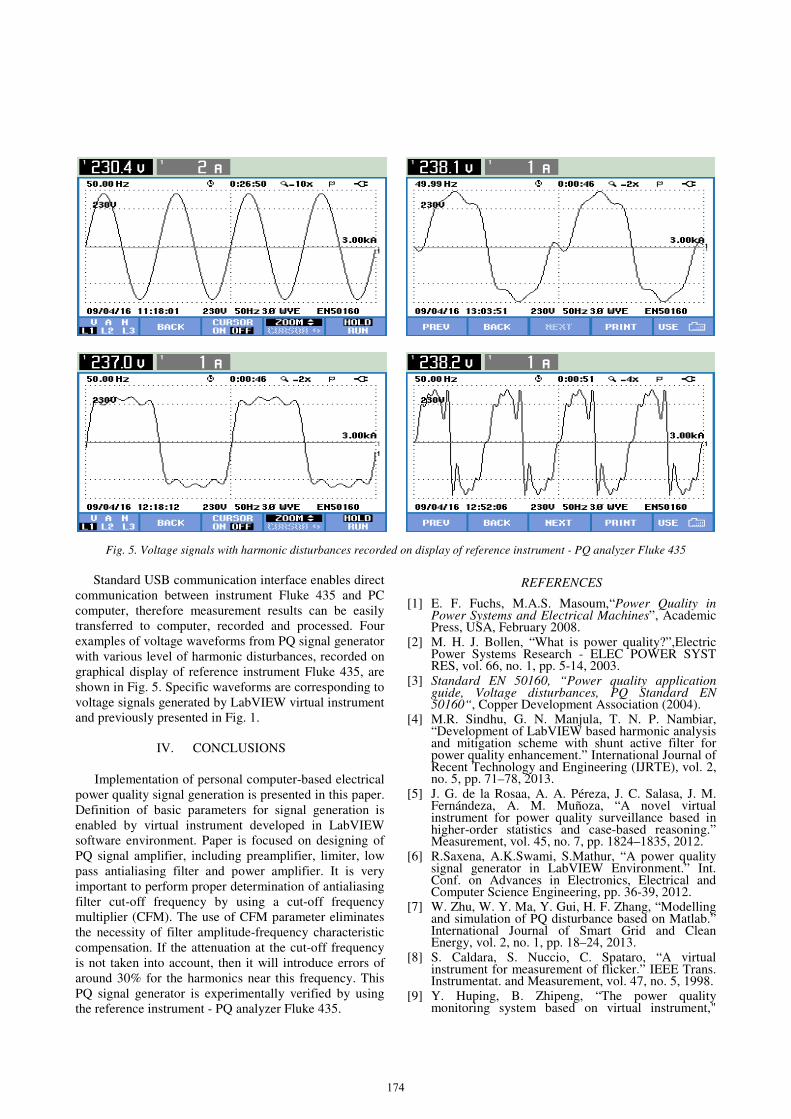
Fig. 5. Voltage signals with harmonic disturbances recorded on display of reference instrument - PQ analyzer Fluke 435
Standard USB communication interface enables direct
communication between instrument Fluke 435 and PC
computer, therefore measurement results can be easily
transferred to computer, recorded and processed. Four
examples of voltage waveforms from PQ signal generator
with various level of harmonic disturbances, recorded on
graphical display of reference instrument Fluke 435, are
shown in Fig. 5. Specific waveforms are corresponding to
voltage signals generated by LabVIEW virtual instrument
and previously presented in Fig. 1.
IV. CONCLUSIONS
Implementation of personal computer-based electrical
power quality signal generation is presented in this paper.
Definition of basic parameters for signal generation is
enabled by virtual instrument developed in LabVIEW
software environment. Paper is focused on designing of
PQ signal amplifier, including preamplifier, limiter, low
pass antialiasing filter and power amplifier. It is very
important to perform proper determination of antialiasing
filter cut-off frequency by using a cut-off frequency
multiplier (CFM). The use of CFM parameter eliminates
the necessity of filter amplitude-frequency characteristic
compensation. If the attenuation at the cut-off frequency
is not taken into account, then it will introduce errors of
around 30% for the harmonics near this frequency. This
PQ signal generator is experimentally verified by using
the reference instrument - PQ analyzer Fluke 435.
REFERENCES
[1] E. F. Fuchs, M.A.S. Masoum,“Power Quality inPower Systems and Electrical Machines”, AcademicPress, USA, February 2008.
[2] M. H. J. Bollen, “What is power quality?”,ElectricPower Systems Research - ELEC POWER SYSTRES, vol. 66, no. 1, pp. 5-14, 2003.
[3] Standard EN 50160, “Power quality applicationguide, Voltage disturbances, PQ Standard EN50160“, Copper Development Association (2004).
[4] M.R. Sindhu, G. N. Manjula, T. N. P. Nambiar,“Development of LabVIEW based harmonic analysisand mitigation scheme with shunt active filter forpower quality enhancement.” International Journal ofRecent Technology and Engineering (IJRTE), vol. 2,no. 5, pp. 71–78, 2013.
[5] J. G. de la Rosaa, A. A. Péreza, J. C. Salasa, J. M.Fernándeza, A. M. Muñoza, “A novel virtualinstrument for power quality surveillance based inhigher-order statistics and case-based reasoning.”Measurement, vol. 45, no. 7, pp. 1824–1835, 2012.
[6] R.Saxena, A.K.Swami, S.Mathur, “A power qualitysignal generator in LabVIEW Environment.” Int.Conf. on Advances in Electronics, Electrical andComputer Science Engineering, pp. 36-39, 2012.
[7] W. Zhu, W. Y. Ma, Y. Gui, H. F. Zhang, “Modellingand simulation of PQ disturbance based on Matlab.”International Journal of Smart Grid and CleanEnergy, vol. 2, no. 1, pp. 18–24, 2013.
[8] S. Caldara, S. Nuccio, C. Spataro, “A virtualinstrument for measurement of flicker.” IEEE Trans.Instrumentat. and Measurement, vol. 47, no. 5, 1998.
[9] Y. Huping, B. Zhipeng, “The power qualitymonitoring system based on virtual instrument,"
174
WCSE, Fourth World Congress on Software Engineering, pp. 243-245, 2009.
[10] F. Zavoda, S. Rönnberg, M.Bollen, J. Meyer, J.Desmet, “CIGRE/CIRED/IEEE Working GroupC4.24 – New measurement techniques in the futuregrid: status report.”23rd International Conference onElectricity Distribution, pp. 1-5, Lyon, France, 2015.
[11] M. Simić, D. Denić, D. Živanović, D. Taskovski, V.Dimcev, “Development of a data acquisition systemfor the testing and verification of electrical powerquality meters.” JPE – Journal of Power Electronics,vol. 12, no. 5,pp. 813-820, September 2012.
[12] “Ultralow offset voltage operational amplifierdatasheet”, Analog Devices, Rev. G, 2011.
[13] M. Szmajda, K. Gorecki, J. Mroczka, J. Borkowski,“Antialiasing filters in power quality digitalmeasurement systems”, Polish Academy of Science,vol. 12, no. 4, 2005.
[14] “Active low-pass filter design”, Texas Instruments,Application Report SLOA049B, 2002.
[15] “Power operational amplifiers, PA97DR datasheet”,Apex Microtechnology, Rev. 1, 2012.
175