Embed Size (px)
Citation preview
Fway to eventually go broke. That old maxim proved itself again the last four years, as the US stock market countered one of its most catastrophic declines ever with its most explosive bull run in history.
Not every company and stock bounced back from the credit crunch and the market crash that followed. The Great Recession of 2007-2009 claimed more than a few of the over-leveraged and the over-extended. Many stocks, however, have far outperformed the big cap averages, including our master limited partnerships (MLP).
Many investors are still shell-shocked from the past recessionary de-bacle. As such, they aren’t fully appreciative of the fact that the period since March 6, 2009 has been one of the best ever to own stocks.
Less certain is what kind of returns we can expect ahead.Investors are as ebullient as they’ve been at any time since the 2008
Long dormant cash piles are being deployed at last, triggering steep rises in the more popular stocks. And news that the
-erating has only increased overall optimism.
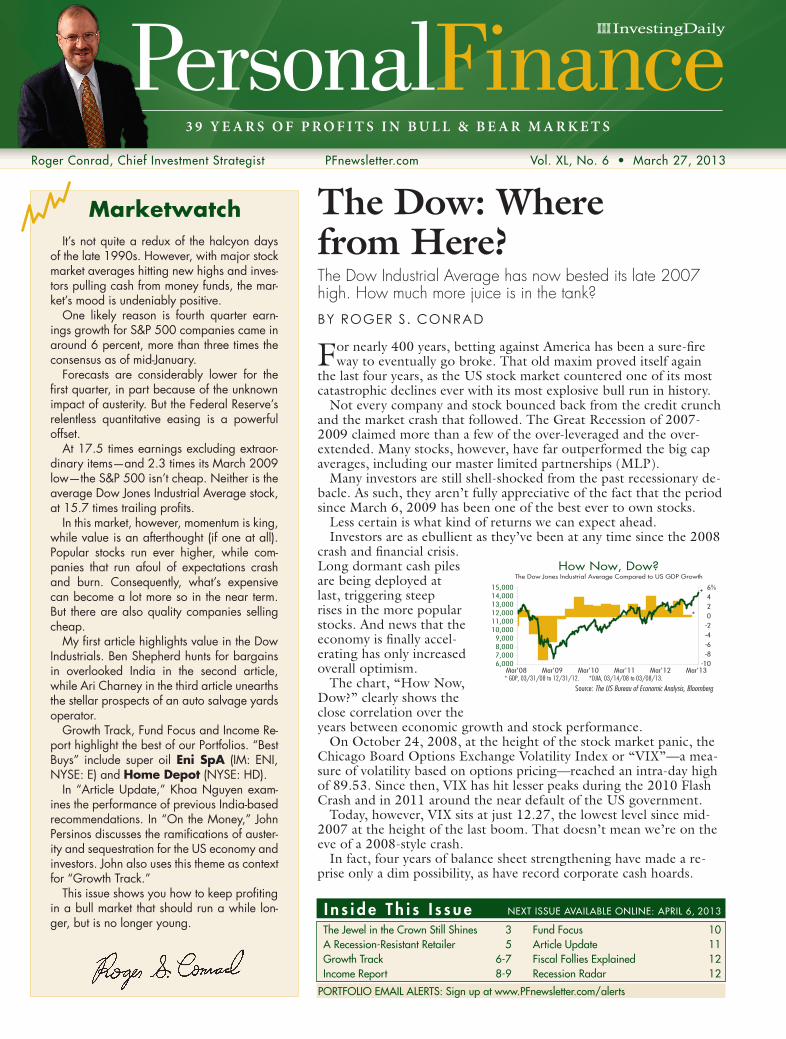
The chart, “How Now, Dow?” clearly shows the close correlation over the years between economic growth and stock performance.
On October 24, 2008, at the height of the stock market panic, the Chicago Board Options Exchange Volatility Index or “VIX”—a mea-sure of volatility based on options pricing—reached an intra-day high of 89.53. Since then, VIX has hit lesser peaks during the 2010 Flash Crash and in 2011 around the near default of the US government.
Today, however, VIX sits at just 12.27, the lowest level since mid-2007 at the height of the last boom. That doesn’t mean we’re on the eve of a 2008-style crash.
In fact, four years of balance sheet strengthening have made a re-prise only a dim possibility, as have record corporate cash hoards.
The Dow: Where from Here?The Dow Industrial Average has now bested its late 2007 high. How much more juice is in the tank?
BY ROGER S. CONRAD
It’s not quite a redux of the halcyon days of the late 1990s. However, with major stock market averages hitting new highs and inves-tors pulling cash from money funds, the mar-ket’s mood is undeniably positive.
One likely reason is fourth quarter earn-ings growth for S&P 500 companies came in around 6 percent, more than three times the consensus as of mid-January.
Forecasts are considerably lower for the
impact of austerity. But the Federal Reserve’s relentless quantitative easing is a powerful offset.
At 17.5 times earnings excluding extraor-dinary items—and 2.3 times its March 2009 low—the S&P 500 isn’t cheap. Neither is the average Dow Jones Industrial Average stock,
In this market, however, momentum is king, while value is an afterthought (if one at all). Popular stocks run ever higher, while com-panies that run afoul of expectations crash and burn. Consequently, what’s expensive can become a lot more so in the near term. But there are also quality companies selling cheap.
Industrials. Ben Shepherd hunts for bargains in overlooked India in the second article, while Ari Charney in the third article unearths the stellar prospects of an auto salvage yards operator.
Growth Track, Fund Focus and Income Re-port highlight the best of our Portfolios. “Best Buys” include super oil Eni SpA (IM: ENI, NYSE: E) and Home Depot (NYSE: HD).
In “Article Update,” Khoa Nguyen exam-ines the performance of previous India-based recommendations. In “On the Money,” John
-ity and sequestration for the US economy and investors. John also uses this theme as context for “Growth Track.”
in a bull market that should run a while lon-ger, but is no longer young.
Marketwatch
I n s i d e T h i s I s s u eThe Jewel in the Crown Still Shines 3A Recession-Resistant Retailer 5Growth Track 6-7Income Report 8-9
Fund Focus 10Article Update 11Fiscal Follies Explained 12Recession Radar 12
PORTFOLIO EMAIL ALERTS: Sign up at www.PFnewsletter.com/alerts
PersonalFinance3 9 Y E A R S O F P R O F I T S I N B U L L & B E A R M A R K E T S
Vol. XL, No. 6 • March 27, 2013Roger Conrad, Chief Investment Strategist PFnewsletter.com
NEXT ISSUE AVAILABLE ONLINE: APRIL 6, 2013
Source: The US Bureau of Economic Analysis, Bloomberg
How Now, Dow?The Dow Jones Industrial Average Compared to US GDP Growth
-10 -8 -6 -4 -2 0 2 4 6%
6,000 7,000 8,000 9,000
10,000 11,000 12,000 13,000 14,000 15,000
Mar'08 Mar'09 Mar'10 Mar'11 Mar'12 Mar'13
+
* GDP, 03/31/08 to 12/31/12. DJIA, 03/14/08 to 03/08/13.+
*
pf_774.indd 1 3/18/2013 2:20:07 PM
PERSONAL FINANCE2 March 27, 2013
But clearly, investors aren’t worried about much these days, at least when it comes to the broad stock market.
Bull markets begin in moments of maximum fear. It will be tough for investors to remember this truism at the next market bottom, when so many are running for the exits. But that’s the best possible time to invest.
Conversely, the worst time to invest is when everyone “knows” stocks are the place to be. This certitude is one of the most reliable contrarian indicators around. And while we’re not there yet, the Dow’s new all time highs represent a time to reflect, not throw caution to the winds.
The key to performing best in any stock market is the wise selec-tion of companies and buying at the right price. That’s the mission of our portfolios, and it applies to stocks we recommend elsewhere that never make it to the portfolios.
Below, I scour America’s storied and most-cited stock barometer—the Dow Jones Industrial Index—for bargains and booby traps. As is always the case with such a broad index, I found plenty of both.
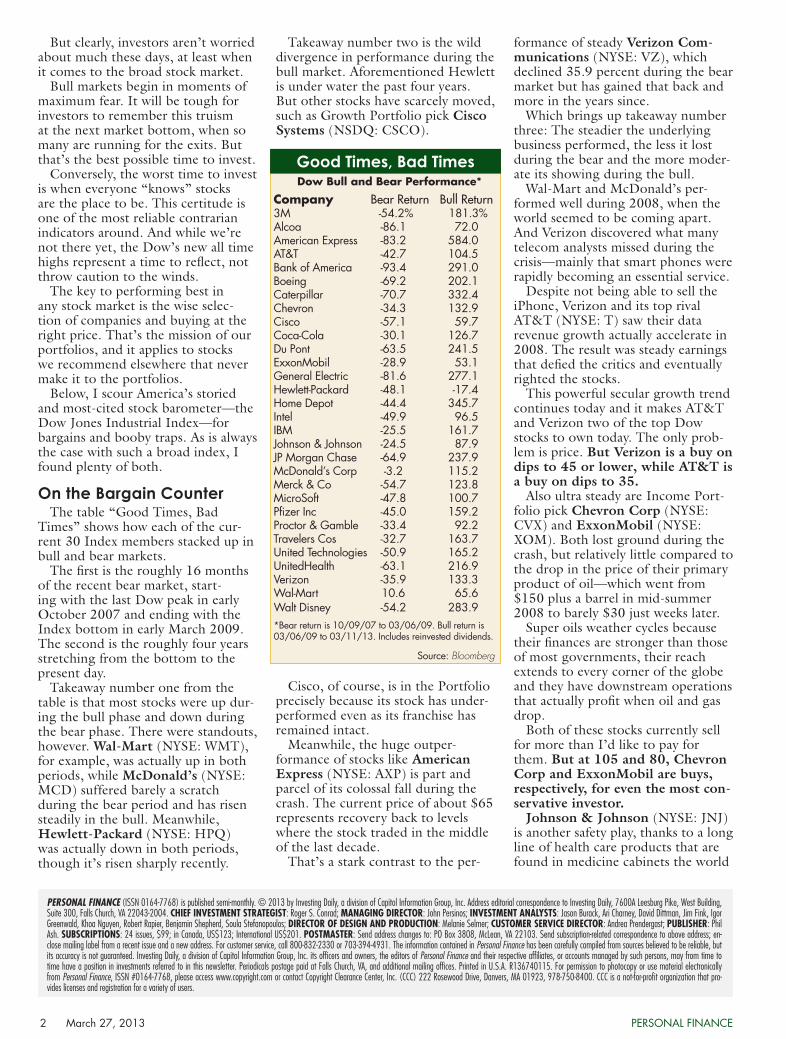
On the Bargain CounterThe table “Good Times, Bad
Times” shows how each of the cur-rent 30 Index members stacked up in bull and bear markets.
The first is the roughly 16 months of the recent bear market, start-ing with the last Dow peak in early October 2007 and ending with the Index bottom in early March 2009. The second is the roughly four years stretching from the bottom to the present day.
Takeaway number one from the table is that most stocks were up dur-ing the bull phase and down during the bear phase. There were standouts, however. Wal-Mart (NYSE: WMT), for example, was actually up in both periods, while McDonald’s (NYSE: MCD) suffered barely a scratch during the bear period and has risen steadily in the bull. Meanwhile, Hewlett-Packard (NYSE: HPQ) was actually down in both periods, though it’s risen sharply recently.
Takeaway number two is the wild divergence in performance during the bull market. Aforementioned Hewlett is under water the past four years. But other stocks have scarcely moved, such as Growth Portfolio pick Cisco Systems (NSDQ: CSCO).
Cisco, of course, is in the Portfolio precisely because its stock has under-performed even as its franchise has remained intact.
Meanwhile, the huge outper-formance of stocks like American Express (NYSE: AXP) is part and parcel of its colossal fall during the crash. The current price of about $65 represents recovery back to levels where the stock traded in the middle of the last decade.
That’s a stark contrast to the per-
formance of steady Verizon Com-munications (NYSE: VZ), which declined 35.9 percent during the bear market but has gained that back and more in the years since.
Which brings up takeaway number three: The steadier the underlying business performed, the less it lost during the bear and the more moder-ate its showing during the bull.
Wal-Mart and McDonald’s per-formed well during 2008, when the world seemed to be coming apart. And Verizon discovered what many telecom analysts missed during the crisis—mainly that smart phones were rapidly becoming an essential service.
Despite not being able to sell the iPhone, Verizon and its top rival AT&T (NYSE: T) saw their data revenue growth actually accelerate in 2008. The result was steady earnings that defied the critics and eventually righted the stocks.
This powerful secular growth trend continues today and it makes AT&T and Verizon two of the top Dow stocks to own today. The only prob-lem is price. But Verizon is a buy on dips to 45 or lower, while AT&T is a buy on dips to 35.
Also ultra steady are Income Port-folio pick Chevron Corp (NYSE: CVX) and ExxonMobil (NYSE: XOM). Both lost ground during the crash, but relatively little compared to the drop in the price of their primary product of oil—which went from $150 plus a barrel in mid-summer 2008 to barely $30 just weeks later.
Super oils weather cycles because their finances are stronger than those of most governments, their reach extends to every corner of the globe and they have downstream operations that actually profit when oil and gas drop.
Both of these stocks currently sell for more than I’d like to pay for them. But at 105 and 80, Chevron Corp and ExxonMobil are buys, respectively, for even the most con-servative investor.
Johnson & Johnson (NYSE: JNJ) is another safety play, thanks to a long line of health care products that are found in medicine cabinets the world
PERSONAL FINANCE (ISSN 0164-7768) is published semi-monthly. © 2013 by Investing Daily, a division of Capitol Information Group, Inc. Address editorial correspondence to Investing Daily, 7600A Leesburg Pike, West Building, Suite 300, Falls Church, VA 22043-2004. CHIEF INVESTMENT STRATEGIST: Roger S. Conrad; MANAGING DIRECTOR: John Persinos; INVESTMENT ANALYSTS: Jason Burack, Ari Charney, David Dittman, Jim Fink, Igor Greenwald, Khoa Nguyen, Robert Rapier, Benjamin Shepherd, Soula Stefanopoulos; DIRECTOR OF DESIGN AND PRODUCTION: Melanie Selmer; CUSTOMER SERVICE DIRECTOR: Andrea Prendergast; PUBLISHER: Phil Ash. SUBSCRIPTIONS: 24 issues, $99; in Canada, US$123; International US$201. POSTMASTER: Send address changes to: PO Box 3808, McLean, VA 22103. Send subscription-related correspondence to above address; en-close mailing label from a recent issue and a new address. For customer service, call 800-832-2330 or 703-394-4931. The information contained in Personal Finance has been carefully compiled from sources believed to be reliable, but its accuracy is not guaranteed. Investing Daily, a division of Capitol Information Group, Inc. its officers and owners, the editors of Personal Finance and their respective affiliates, or accounts managed by such persons, may from time to time have a position in investments referred to in this newsletter. Periodicals postage paid at Falls Church, VA, and additional mailing offices. Printed in U.S.A. R136740115. For permission to photocopy or use material electronically from Personal Finance, ISSN #0164-7768, please access www.copyright.com or contact Copyright Clearance Center, Inc. (CCC) 222 Rosewood Drive, Danvers, MA 01923, 978-750-8400. CCC is a not-for-profit organization that pro-vides licenses and registration for a variety of users.
Good Times, Bad Times
Company Bear Return Bull Return3M -54.2% 181.3%Alcoa -86.1 72.0American Express -83.2 584.0AT&T -42.7 104.5Bank of America -93.4 291.0Boeing -69.2 202.1Caterpillar -70.7 332.4Chevron -34.3 132.9Cisco -57.1 59.7Coca-Cola -30.1 126.7Du Pont -63.5 241.5ExxonMobil -28.9 53.1General Electric -81.6 277.1Hewlett-Packard -48.1 -17.4Home Depot -44.4 345.7Intel -49.9 96.5IBM -25.5 161.7Johnson & Johnson -24.5 87.9JP Morgan Chase -64.9 237.9McDonald’s Corp -3.2 115.2Merck & Co -54.7 123.8MicroSoft -47.8 100.7Pfizer Inc -45.0 159.2Proctor & Gamble -33.4 92.2Travelers Cos -32.7 163.7United Technologies -50.9 165.2UnitedHealth -63.1 216.9Verizon -35.9 133.3Wal-Mart 10.6 65.6Walt Disney -54.2 283.9*Bear return is 10/09/07 to 03/06/09. Bull return is 03/06/09 to 03/11/13. Includes reinvested dividends.
Source: Bloomberg
Dow Bull and Bear Performance*
pf_774.indd 2 3/18/2013 2:20:08 PM
www.PFnewsle t ter.com 703-394-4931 March 27, 2013 3
over. The stock traded below our target of 75 before its recent sharp rise. Now that this run-up appears over, it may earn a boost depending on the April dividend increase. Mean-time, Johnson & Johnson is a solid Growth Portfolio holding and a buy on dips to 75.
We like Cisco and Intel (NSDQ: INTC) for a far different reason. These stocks hardly participated in the rally of the past four years, despite continuing to dominate their areas of information technology.
Cisco and Intel’s shares have re-cently shown signs of life and both companies have begun to pay divi-dends. Cisco Systems and Intel are buys up to 23 and 29.50, respec-tively, but only for patient inves-tors.
Last but not least, Home Depot (NYSE: HD) is this issue’s Best Buy in the Growth Portfolio. The stock hasn’t exactly been a wallflower in the four-year stock market rally, largely because it’s taken advantage of floundering rivals who were unable to weather the Great American Housing Crash.
However, today the company is well positioned in a surging market for building materials and home products. See page 7 for details.
Booby Trapped BanksSo much for the stocks we’d buy.
At the top of the list of sells are the big financials in the Dow. Led by American Express, these have some of the gaudiest gains in the index.
The inverse, of course, is that they also had by far the biggest losses dur-ing the crash. The big question is, did they learn anything? Are their busi-nesses any more protection against fu-ture market catastrophes than before?
Or more to the point, are American financial institutions just inevitably building toward another crisis, a boom-to-bust cycle they’ve followed consistently in the post-World War II period?
That’s a question only future market crises will answer. What’s unmistakable, however, is investors are largely deaf to any such caution-ary talk, so long as Federal Reserve Chairman Ben Bernanke is basically handing out money.
The Fed’s loose monetary policy continues to provide a lift to the financial sector and that won’t change soon, until the unemployment situ-ation dramatically improves and the economic recovery shows stronger signs of life.
Few will debate that bailing out the banks forestalled a complete catastro-phe for the economy that would make the so-called “Great Recession” look like boom times.
However, with most of these stocks now trading at several times their bear market lows—and major questions about their stewardship still un-settled—they’re not smart investment choices now.
If you want banks, stick to Canada’s finest, or community banks such as Income Portfolio pick Arrow Finan-cial Corp (NSDQ: AROW). These banks haven’t needed government as-sistance to stay afloat in past crises—and it’s a good bet that they won’t need handouts in any future ones.
Roger S. Conrad is chief investment strat-egist of Personal Finance. Read his week-ly comments in Mind Over Markets.
The Jewel in the Crown Still ShinesInvestors who give short shrift to India are missing opportunities for outsized gains.
BY BENJAMIN SHEPHERD
With 1.2 billion people, India ac-counts for nearly 18 percent of
the world’s population. By the mid-dle of the next decade it will overtake China as the world’s most populous country. Largely thanks to that huge and growing population, India is now the fourth largest economy in the world.
But the Indian equity market hasn’t been drawing much attention lately, with the Bombay Stock Exchange’s SENSEX Index flat for the year. It’s also trading at a price-to-earnings multiple of just 15.5, cheaper than most other emerging markets with the notable exception of China and at a discount to its own long-term historical average of 17.6.
That lack of enthusiasm has a lot to do with the Indian government’s newly acquired taste for austerity, as well as its own ineptitude.
The government has cut spend-ing by about 9 percent this year and plans to cut a deeper 10 percent in 2014. Aiming for a reduction of its
fiscal deficit to below 5 percent of gross domestic product (GDP) by next year, the government has slashed or eliminated subsidies on everything from cooking oil and sugar to kero-sene and fertilizer.
That’s raised growth concerns, because the curtailment of subsidies is likely to eat into broader consumer spending, prompting a number of investment banks to cut their GDP growth outlooks for India down to a consensus of 6 percent in 2013.
But the Indian picture really isn’t all that bleak.
Even after the cutbacks, India is still on track to be one of the fastest growing of the G-20 nations, with a growth rate that developed nations should envy. In addition, the Reserve Bank of India has asserted its will-ingness to provide additional policy support in the event of a further slowdown in growth.
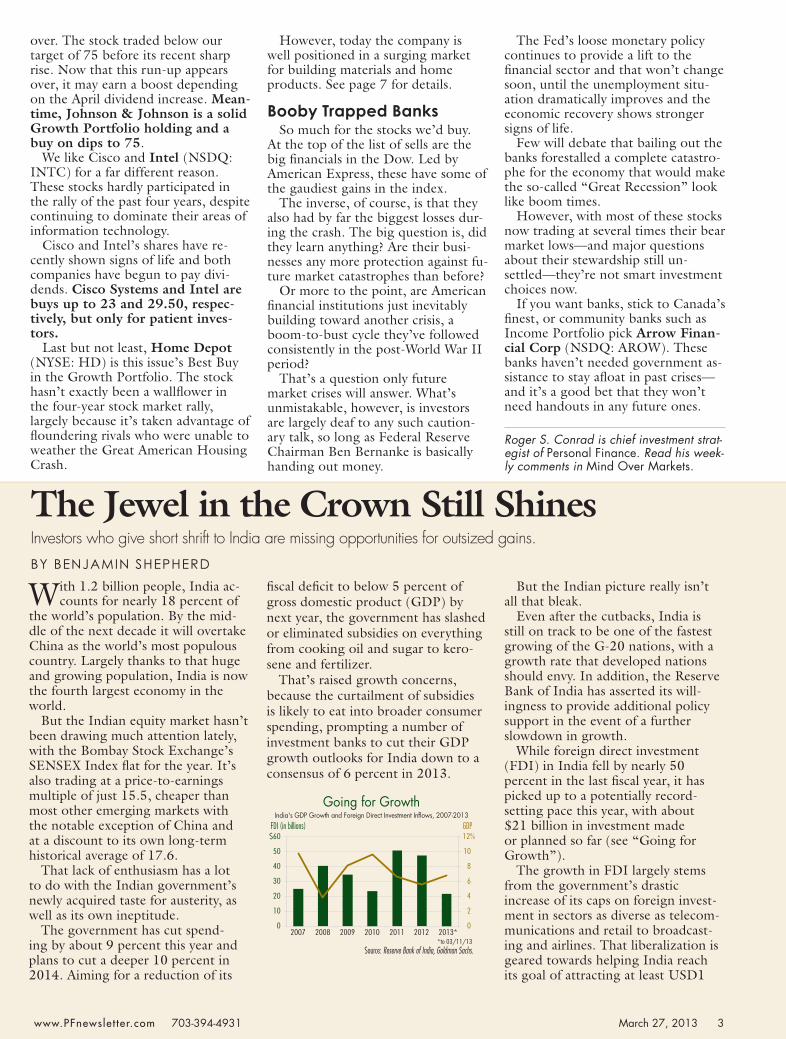
While foreign direct investment (FDI) in India fell by nearly 50 percent in the last fiscal year, it has picked up to a potentially record-setting pace this year, with about $21 billion in investment made or planned so far (see “Going for Growth”).
The growth in FDI largely stems from the government’s drastic increase of its caps on foreign invest-ment in sectors as diverse as telecom-munications and retail to broadcast-ing and airlines. That liberalization is geared towards helping India reach its goal of attracting at least USD1
Source: Reserve Bank of India, Goldman Sachs.
FDI (in billions) GDP
Going for GrowthIndia's GDP Growth and Foreign Direct Investment In�ows, 2007-2013
0
2
4
6
8
10
12%
0
10
20
30
40
50
$60
2007 2008 2009 2010 2011 2012 2013* *to 03/11/13
pf_774.indd 3 3/18/2013 2:20:09 PM
PERSONAL FINANCE4 March 27, 2013
trillion in infrastructure investment over the next five years.
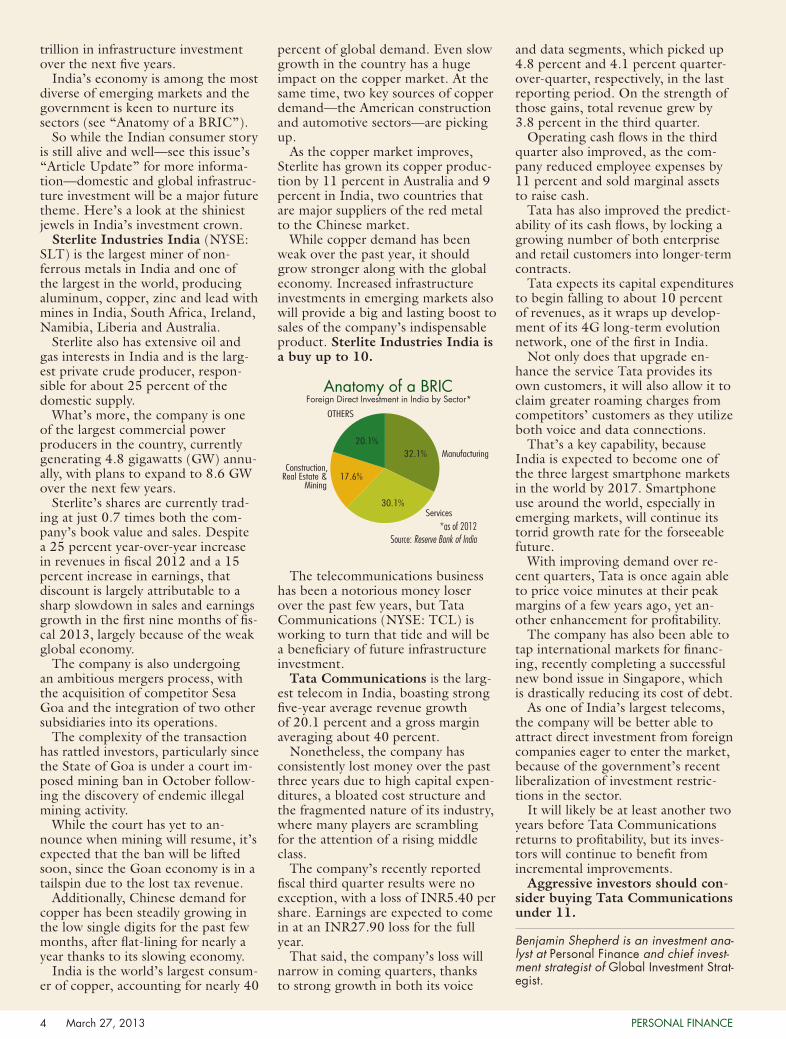
India’s economy is among the most diverse of emerging markets and the government is keen to nurture its sectors (see “Anatomy of a BRIC”).
So while the Indian consumer story is still alive and well—see this issue’s “Article Update” for more informa-tion—domestic and global infrastruc-ture investment will be a major future theme. Here’s a look at the shiniest jewels in India’s investment crown.
Sterlite Industries India (NYSE: SLT) is the largest miner of non-ferrous metals in India and one of the largest in the world, producing aluminum, copper, zinc and lead with mines in India, South Africa, Ireland, Namibia, Liberia and Australia.
Sterlite also has extensive oil and gas interests in India and is the larg-est private crude producer, respon-sible for about 25 percent of the domestic supply.
What’s more, the company is one of the largest commercial power producers in the country, currently generating 4.8 gigawatts (GW) annu-ally, with plans to expand to 8.6 GW over the next few years.
Sterlite’s shares are currently trad-ing at just 0.7 times both the com-pany’s book value and sales. Despite a 25 percent year-over-year increase in revenues in fiscal 2012 and a 15 percent increase in earnings, that discount is largely attributable to a sharp slowdown in sales and earnings growth in the first nine months of fis-cal 2013, largely because of the weak global economy.
The company is also undergoing an ambitious mergers process, with the acquisition of competitor Sesa Goa and the integration of two other subsidiaries into its operations.
The complexity of the transaction has rattled investors, particularly since the State of Goa is under a court im-posed mining ban in October follow-ing the discovery of endemic illegal mining activity.
While the court has yet to an-nounce when mining will resume, it’s expected that the ban will be lifted soon, since the Goan economy is in a tailspin due to the lost tax revenue.
Additionally, Chinese demand for copper has been steadily growing in the low single digits for the past few months, after flat-lining for nearly a year thanks to its slowing economy.
India is the world’s largest consum-er of copper, accounting for nearly 40
percent of global demand. Even slow growth in the country has a huge impact on the copper market. At the same time, two key sources of copper demand—the American construction and automotive sectors—are picking up.
As the copper market improves, Sterlite has grown its copper produc-tion by 11 percent in Australia and 9 percent in India, two countries that are major suppliers of the red metal to the Chinese market.
While copper demand has been weak over the past year, it should grow stronger along with the global economy. Increased infrastructure investments in emerging markets also will provide a big and lasting boost to sales of the company’s indispensable product. Sterlite Industries India is a buy up to 10.
The telecommunications business has been a notorious money loser over the past few years, but Tata Communications (NYSE: TCL) is working to turn that tide and will be a beneficiary of future infrastructure investment.
Tata Communications is the larg-est telecom in India, boasting strong five-year average revenue growth of 20.1 percent and a gross margin averaging about 40 percent.
Nonetheless, the company has consistently lost money over the past three years due to high capital expen-ditures, a bloated cost structure and the fragmented nature of its industry, where many players are scrambling for the attention of a rising middle class.
The company’s recently reported fiscal third quarter results were no exception, with a loss of INR5.40 per share. Earnings are expected to come in at an INR27.90 loss for the full year.
That said, the company’s loss will narrow in coming quarters, thanks to strong growth in both its voice
and data segments, which picked up 4.8 percent and 4.1 percent quarter-over-quarter, respectively, in the last reporting period. On the strength of those gains, total revenue grew by 3.8 percent in the third quarter.
Operating cash flows in the third quarter also improved, as the com-pany reduced employee expenses by 11 percent and sold marginal assets to raise cash.
Tata has also improved the predict-ability of its cash flows, by locking a growing number of both enterprise and retail customers into longer-term contracts.
Tata expects its capital expenditures to begin falling to about 10 percent of revenues, as it wraps up develop-ment of its 4G long-term evolution network, one of the first in India.
Not only does that upgrade en-hance the service Tata provides its own customers, it will also allow it to claim greater roaming charges from competitors’ customers as they utilize both voice and data connections.
That’s a key capability, because India is expected to become one of the three largest smartphone markets in the world by 2017. Smartphone use around the world, especially in emerging markets, will continue its torrid growth rate for the forseeable future.
With improving demand over re-cent quarters, Tata is once again able to price voice minutes at their peak margins of a few years ago, yet an-other enhancement for profitability.
The company has also been able to tap international markets for financ-ing, recently completing a successful new bond issue in Singapore, which is drastically reducing its cost of debt.
As one of India’s largest telecoms, the company will be better able to attract direct investment from foreign companies eager to enter the market, because of the government’s recent liberalization of investment restric-tions in the sector.
It will likely be at least another two years before Tata Communications returns to profitability, but its inves-tors will continue to benefit from incremental improvements.
Aggressive investors should con-sider buying Tata Communications under 11.
Benjamin Shepherd is an investment ana-lyst at Personal Finance and chief invest-ment strategist of Global Investment Strat-egist.
Anatomy of a BRIC Foreign Direct Investment in India by Sector*
Source: Reserve Bank of India*as of 2012
Manufacturing32.1%
Services30.1%
Construction, Real Estate &
Mining
20.1%
OTHERS
17.6%
pf_774.indd 4 3/18/2013 2:20:09 PM
www.PFnewsle t ter.com 703-394-4931 March 27, 2013 5
Sometimes it takes an outsider to revo-lutionize a seemingly dull and highly
fragmented industry. So in 1998, when former Waste Management (NYSE: WM) CFO Donald Flynn was seeking new investment horizons, he turned his sights on the auto salvage industry and founded LKQ Corp (NSDQ: LKQ).
The letters in the company name stand for “like, kind and quality,” an industry term denoting the preferred standard for replacement parts of dam-aged vehicles.
Flynn saw an industry that largely consisted of localized “mom and pop” businesses that could be rolled up with a consolidation strategy similar to the one he pursued during his tenure at Waste Management.
Since then, LKQ has acquired over 150 companies, and in the nearly 10 years since the company’s initial public offering, it’s grown from a tiny micro-cap into a $6.5 billion company.
Though Flynn died in late 2011, last serving as chairman of the board, LKQ continues to grow via acquisition, clos-ing 30 deals in 2012. This acquisition-fueled growth has enabled the company to increase earnings per share (EPS) by an average of almost 26 percent annually over the past 5 years, results that have made the company a darling among growth stock investors.
But such status comes with high expectations, and that means inves-tors will overreact when a company’s performance inevitably falters. That day finally came on Feb. 28, when the company reported fourth-quarter earnings and revenue that fell slightly short of analyst expectations.
Management’s guidance for 2013 diluted EPS also missed the mark, with the mid-point of its forecast range of $1.00 to $1.09, below analyst estimates of $1.08. How-ever, even if LKQ only hits the low end of that range, it would still mean EPS growth of 15 percent year over year—hard-ly a disaster.
Nevertheless, in the days that fol-lowed, LKQ’s stock fell as much as 12.4 percent from where it traded prior to the announcement, though its share price has since moderately recovered. Even so, at a recent price of $21.64, the stock still trades almost 10 percent below its 52-week high, which gives investors the opportunity to build a position at an at-tractive entry point.
Over the years, LKQ has evolved from a recycler of automotive parts scavenged from totaled vehicles into a one-stop shop for collision centers and indepen-dent mechanics. In addition to recycled products from salvaged cars, the com-pany also distributes aftermarket parts, refurbished parts, such as wheels and bumpers, and remanufactured engines.
Aftermarket and refurbished parts accounted for almost 56 percent of the company’s $4.1 billion in revenue last year, while recycled and remanufactured products comprised nearly 31 percent of sales.
Thanks to its steady stream of acquisi-tions, LKQ has built an impressive moat and now faces no meaningful competi-tion in its used and aftermarket niche. And with a 30 percent share of the after-market and refurbished parts market and a 20 percent share of the recycled parts market, the company still has ample room to grow.
In fact, LKQ has already begun to expand overseas, with its late-2011 acquisition of Euro Car Parts Hold-ings making it the leading provider of alternative mechanical replacement parts in the UK.
LKQ’s only real competition in the North American market comes from original equipment manufac-turers (OEM), which are usually the
automakers themselves. But use of al-ternative parts for collision repairs has been rising, and they now account for 37 percent of the replacement parts market.
Critics of LKQ contend that its rollup strategy has yet to demon-strate that its sheer scale will translate into higher margins. In 2012, for instance, organic growth was just 4.1 percent year over year, even though headline growth was 26.1 percent. But the company is working toward expanding margins, with the aim of becoming more than just a “growth via acquisition” story.
For one, LKQ has developed rela-tionships with several auto insurers, where it provides them with pricing data to highlight potential cost sav-ings. This promotes the use of LKQ products.
On the technology front, LKQ’s buyers now utilize a proprietary database that helps determine which cars should be bought at auction, as well as the appropriate bid. And its new heavy-duty truck recycling busi-ness produced double-digit organic growth last year.
In the meantime, LKQ has sub-stantial liquidity to continue acquir-ing companies. At year-end, it had $60 million in cash on its balance sheet and $356 million in financing available from its revolving credit. It also generates solid free cash flows, which have averaged almost $114 million over the past three years.
Aggressive investors should buy LKQ Corp below 21.50.
Ari Charney is an investment analyst at Personal Finance.
A Stock That Will Take You FarThis auto salvage company is greater than the sum of its parts.
BY ARI CHARNEY
Vital Statistics for LKQ Corp (NSDQ: LKQ)
North American distribution network: 320 wholesale plants and warehouses (of which 52 are hubs)UK distribution network: 130 branch locations, with nine regional hubsAftermarket and refurbished product lines: 107,000 SKUs in North America, 112,000 SKUs in the UKCost savings of LKQ’s parts vs. OEM parts: 20 percent to 50 percentNon-OEM parts’ share of collision replacement market: 37 percent (up from 32 percent in 2008)Number of salvage vehicles acquired in 2012: 254,000Number of “crush only” vehicles acquired in 2012: 416,000Acquisitions since 1998: Over 150 companiesAcquisitions in 2012: 30 (22 wholesale businesses, eight self-service retail operations) Source: Company filings
C A S H F R O M C L U N K E R S
pf_774.indd 5 3/18/2013 2:20:10 PM
PERSONAL FINANCE6 March 27, 2013
Despite consistently dour devel-opments from Washington, the
markets lately have soared on cheer-ful economic news. Federal austerity appears to be in a tug-of-war with private sector strengthening.
Investors feel optimistic, but whip-sawed. We examine these contradic-tory currents in greater detail in “On the Money” (see page 12).
Against this economic and fiscal backdrop, the most prudent course of action is to focus on large-cap con-sumer, information technology and health stocks that are less vulnerable to unexpected political shocks and the market’s ups-and-downs.
Because of the inability of Con-gress and President Obama to strike a compromise deal before the March 1 deadline, automatic federal budget cuts totaling $85 billion are slated to take effect between now and Sept. 30.
However, investors worried about the contractionary effects of “se-questration” don’t have to sit on the sidelines. They can take a defensive stance and still enjoy growth.
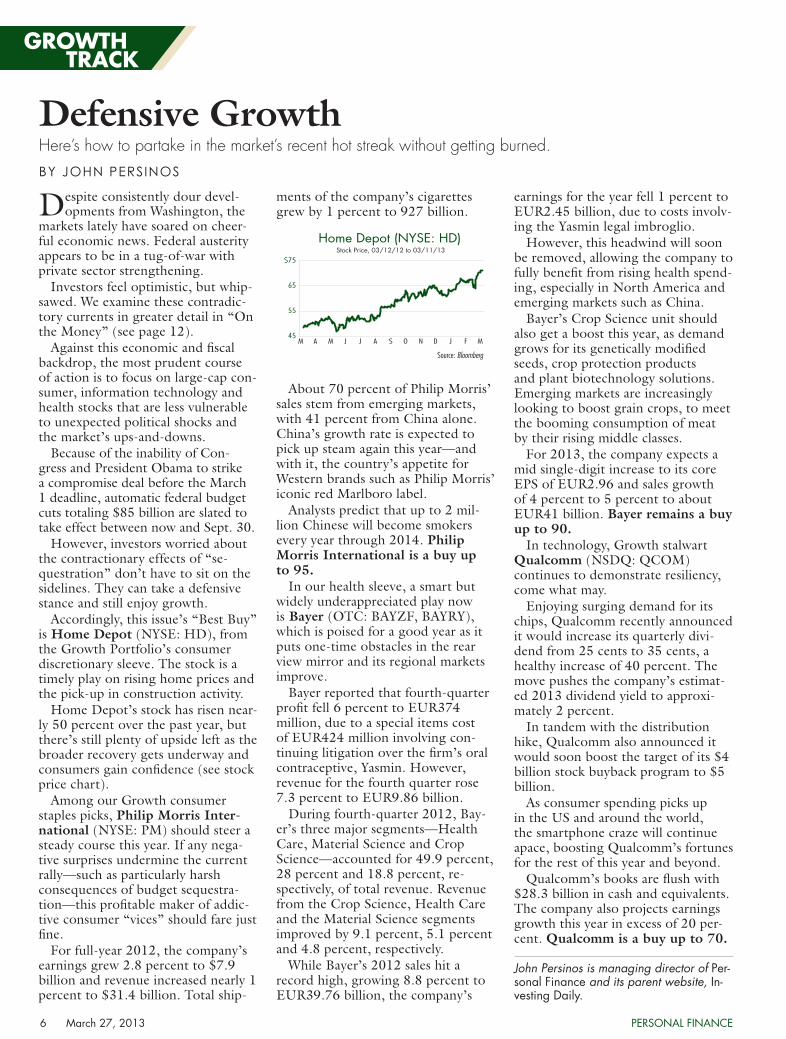
Accordingly, this issue’s “Best Buy” is Home Depot (NYSE: HD), from the Growth Portfolio’s consumer discretionary sleeve. The stock is a timely play on rising home prices and the pick-up in construction activity.
Home Depot’s stock has risen near-ly 50 percent over the past year, but there’s still plenty of upside left as the broader recovery gets underway and consumers gain confidence (see stock price chart).
Among our Growth consumer staples picks, Philip Morris Inter-national (NYSE: PM) should steer a steady course this year. If any nega-tive surprises undermine the current rally—such as particularly harsh consequences of budget sequestra-tion—this profitable maker of addic-tive consumer “vices” should fare just fine.
For full-year 2012, the company’s earnings grew 2.8 percent to $7.9 billion and revenue increased nearly 1 percent to $31.4 billion. Total ship-
ments of the company’s cigarettes grew by 1 percent to 927 billion.
About 70 percent of Philip Morris’ sales stem from emerging markets, with 41 percent from China alone. China’s growth rate is expected to pick up steam again this year—and with it, the country’s appetite for Western brands such as Philip Morris’ iconic red Marlboro label.
Analysts predict that up to 2 mil-lion Chinese will become smokers every year through 2014. Philip Morris International is a buy up to 95.
In our health sleeve, a smart but widely underappreciated play now is Bayer (OTC: BAYZF, BAYRY), which is poised for a good year as it puts one-time obstacles in the rear view mirror and its regional markets improve.
Bayer reported that fourth-quarter profit fell 6 percent to EUR374 million, due to a special items cost of EUR424 million involving con-tinuing litigation over the firm’s oral contraceptive, Yasmin. However, revenue for the fourth quarter rose 7.3 percent to EUR9.86 billion.
During fourth-quarter 2012, Bay-er’s three major segments—Health Care, Material Science and Crop Science—accounted for 49.9 percent, 28 percent and 18.8 percent, re-spectively, of total revenue. Revenue from the Crop Science, Health Care and the Material Science segments improved by 9.1 percent, 5.1 percent and 4.8 percent, respectively.
While Bayer’s 2012 sales hit a record high, growing 8.8 percent to EUR39.76 billion, the company’s
earnings for the year fell 1 percent to EUR2.45 billion, due to costs involv-ing the Yasmin legal imbroglio.
However, this headwind will soon be removed, allowing the company to fully benefit from rising health spend-ing, especially in North America and emerging markets such as China.
Bayer’s Crop Science unit should also get a boost this year, as demand grows for its genetically modified seeds, crop protection products and plant biotechnology solutions. Emerging markets are increasingly looking to boost grain crops, to meet the booming consumption of meat by their rising middle classes.
For 2013, the company expects a mid single-digit increase to its core EPS of EUR2.96 and sales growth of 4 percent to 5 percent to about EUR41 billion. Bayer remains a buy up to 90.
In technology, Growth stalwart Qualcomm (NSDQ: QCOM) continues to demonstrate resiliency, come what may.
Enjoying surging demand for its chips, Qualcomm recently announced it would increase its quarterly divi-dend from 25 cents to 35 cents, a healthy increase of 40 percent. The move pushes the company’s estimat-ed 2013 dividend yield to approxi-mately 2 percent.
In tandem with the distribution hike, Qualcomm also announced it would soon boost the target of its $4 billion stock buyback program to $5 billion.
As consumer spending picks up in the US and around the world, the smartphone craze will continue apace, boosting Qualcomm’s fortunes for the rest of this year and beyond.
Qualcomm’s books are flush with $28.3 billion in cash and equivalents. The company also projects earnings growth this year in excess of 20 per-cent. Qualcomm is a buy up to 70.
John Persinos is managing director of Per-sonal Finance and its parent website, In-vesting Daily.
Defensive GrowthHere’s how to partake in the market’s recent hot streak without getting burned.
BY JOHN PERSINOS
GROWTH TRACK
Source: Bloomberg
Home Depot (NYSE: HD) Stock Price, 03/12/12 to 03/11/13
45
55
65
$75
M A M J J A S O N D J F M
pf_774.indd 6 3/18/2013 2:20:11 PM
www.PFnewsle t ter.com 703-394-4931
Best Buy: Home DepotDo-it-yourself behemoth and Growth
Portfolio pick Home Depot (NYSE: HD) continues to prosper as construction ac-tivity rebounds around the globe. This trend should remain strong, regardless of the budgetary belt-tightening that emanates from Capitol Hill.
Whatever “multiplier effect” auster-ity eventually exerts throughout the economy, it won’t hit all companies and it shouldn’t significantly dampen American consumers’ growing mood to spend. That puts retailers such as Home Depot in a sweet spot.
For the fourth quarter of 2012, Home Depot reported sales of $18.2 billion, an increase of 14 percent from the same quarter a year ago. The figure blew past analysts’ estimates of $17.6 billion in sales. Earnings soared to $1 billion, an in-crease of 29 percent from the same year-ago quarter.
Home Depot’s full-year 2012 sales reached $74.8 billion, an increase of 6 percent year over year, while earn-ings hit $4.6 billion for a YoY increase of 21 percent. Management expects the top line to advance between 2 percent and 3 percent in 2013.
The world’s largest home improve-ment retailer, Home Depot continues to benefit from reconstruction in the wake of Super Storm Sandy, as well as the pick up in new home construction in the US.
Home Depot raised its quarterly dividend by 10 cents to 39 cents, an increase of more than one third. The company also approved a $17 billion stock repurchase plan that’s slated for completion by the end of fiscal 2015.
New home sales are showing renewed strength, but Home Depot is well positioned even if federal budget cutbacks take a ding out of the US recovery.
Consumers have shown a consis-tent willingness for the past several months to spruce up their existing properties, propelling demand for the company’s myriad offerings.
With home sales and prices finally on the rebound, the company should benefit all the more. US real estate remains in recovery mode, with home prices soaring 9.7 percent in January from a year ago. Mean-while, the Federal Reserve continues its policy of keeping interests rates at ultralow levels, a tonic for the hous-ing market and Home Depot.
Home Depot’s stock has enjoyed a good run lately, but we think it has plenty of steam left (see stock price chart, page 6).
Home Depot is a buy up to 60; aggressive investors can consider chasing the stock as high as 70.
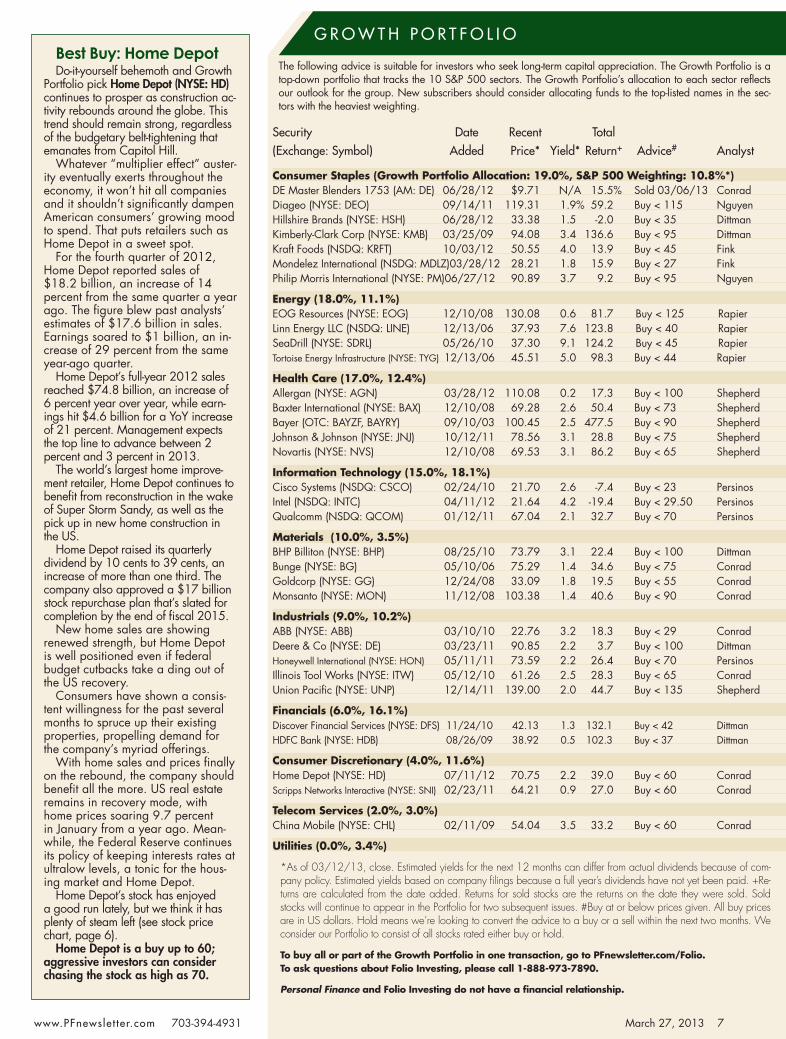
The following advice is suitable for investors who seek long-term capital appreciation. The Growth Portfolio is a top-down portfolio that tracks the 10 S&P 500 sectors. The Growth Portfolio’s allocation to each sector reflects our outlook for the group. New subscribers should consider allocating funds to the top-listed names in the sec-tors with the heaviest weighting.
Security Date Recent Total(Exchange: Symbol) Added Price* Yield* Return+ Advice# Analyst
Consumer Staples (Growth Portfolio Allocation: 19.0%, S&P 500 Weighting: 10.8%*) DE Master Blenders 1753 (AM: DE) 06/28/12 $9.71 N/A 15.5% Sold 03/06/13 ConradDiageo (NYSE: DEO) 09/14/11 119.31 1.9% 59.2 Buy < 115 NguyenHillshire Brands (NYSE: HSH) 06/28/12 33.38 1.5 -2.0 Buy < 35 DittmanKimberly-Clark Corp (NYSE: KMB) 03/25/09 94.08 3.4 136.6 Buy < 95 DittmanKraft Foods (NSDQ: KRFT) 10/03/12 50.55 4.0 13.9 Buy < 45 FinkMondelez International (NSDQ: MDLZ) 03/28/12 28.21 1.8 15.9 Buy < 27 FinkPhilip Morris International (NYSE: PM) 06/27/12 90.89 3.7 9.2 Buy < 95 Nguyen
Energy (18.0%, 11.1%) EOG Resources (NYSE: EOG) 12/10/08 130.08 0.6 81.7 Buy < 125 RapierLinn Energy LLC (NSDQ: LINE) 12/13/06 37.93 7.6 123.8 Buy < 40 RapierSeaDrill (NYSE: SDRL) 05/26/10 37.30 9.1 124.2 Buy < 45 RapierTortoise Energy Infrastructure (NYSE: TYG) 12/13/06 45.51 5.0 98.3 Buy < 44 Rapier
Health Care (17.0%, 12.4%) Allergan (NYSE: AGN) 03/28/12 110.08 0.2 17.3 Buy < 100 ShepherdBaxter International (NYSE: BAX) 12/10/08 69.28 2.6 50.4 Buy < 73 ShepherdBayer (OTC: BAYZF, BAYRY) 09/10/03 100.45 2.5 477.5 Buy < 90 ShepherdJohnson & Johnson (NYSE: JNJ) 10/12/11 78.56 3.1 28.8 Buy < 75 ShepherdNovartis (NYSE: NVS) 12/10/08 69.53 3.1 86.2 Buy < 65 Shepherd
Information Technology (15.0%, 18.1%) Cisco Systems (NSDQ: CSCO) 02/24/10 21.70 2.6 -7.4 Buy < 23 PersinosIntel (NSDQ: INTC) 04/11/12 21.64 4.2 -19.4 Buy < 29.50 PersinosQualcomm (NSDQ: QCOM) 01/12/11 67.04 2.1 32.7 Buy < 70 Persinos
Materials (10.0%, 3.5%) BHP Billiton (NYSE: BHP) 08/25/10 73.79 3.1 22.4 Buy < 100 DittmanBunge (NYSE: BG) 05/10/06 75.29 1.4 34.6 Buy < 75 ConradGoldcorp (NYSE: GG) 12/24/08 33.09 1.8 19.5 Buy < 55 ConradMonsanto (NYSE: MON) 11/12/08 103.38 1.4 40.6 Buy < 90 Conrad
Industrials (9.0%, 10.2%) ABB (NYSE: ABB) 03/10/10 22.76 3.2 18.3 Buy < 29 ConradDeere & Co (NYSE: DE) 03/23/11 90.85 2.2 3.7 Buy < 100 DittmanHoneywell International (NYSE: HON) 05/11/11 73.59 2.2 26.4 Buy < 70 PersinosIllinois Tool Works (NYSE: ITW) 05/12/10 61.26 2.5 28.3 Buy < 65 ConradUnion Pacific (NYSE: UNP) 12/14/11 139.00 2.0 44.7 Buy < 135 Shepherd
Financials (6.0%, 16.1%) Discover Financial Services (NYSE: DFS) 11/24/10 42.13 1.3 132.1 Buy < 42 DittmanHDFC Bank (NYSE: HDB) 08/26/09 38.92 0.5 102.3 Buy < 37 Dittman
Consumer Discretionary (4.0%, 11.6%) Home Depot (NYSE: HD) 07/11/12 70.75 2.2 39.0 Buy < 60 ConradScripps Networks Interactive (NYSE: SNI) 02/23/11 64.21 0.9 27.0 Buy < 60 Conrad
Telecom Services (2.0%, 3.0%) China Mobile (NYSE: CHL) 02/11/09 54.04 3.5 33.2 Buy < 60 Conrad
Utilities (0.0%, 3.4%)
*As of 03/12/13, close. Estimated yields for the next 12 months can differ from actual dividends because of com-pany policy. Estimated yields based on company filings because a full year’s dividends have not yet been paid. +Re-turns are calculated from the date added. Returns for sold stocks are the returns on the date they were sold. Sold stocks will continue to appear in the Portfolio for two subsequent issues. #Buy at or below prices given. All buy prices are in US dollars. Hold means we’re looking to convert the advice to a buy or a sell within the next two months. We consider our Portfolio to consist of all stocks rated either buy or hold.
To buy all or part of the Growth Portfolio in one transaction, go to PFnewsletter.com/Folio. To ask questions about Folio Investing, please call 1-888-973-7890.
Personal Finance and Folio Investing do not have a financial relationship.
G R O W T H P O R T F O L I O
March 27, 2013 7
pf_774.indd 7 3/18/2013 2:20:11 PM
PERSONAL FINANCE8 March 27, 2013
If there’s one number that sums up dividend safety it’s the payout ratio,
or dividends as a percentage of profits. The trick is to know the best measure of a company’s profitability—and this is one case where one size definitely does not fit all.
Earnings per share (EPS) as mea-sured under Generally Accepted Ac-counting Principles or GAAP is com-monly recognized as the best measure of profits. Yet from quarter to quarter, it can be subject to wild distortions from one-time accounting items that have a lot more to do with comply-ing with government regulations than reporting anything of real import.
Master limited partnerships (MLP) and real estate investment trusts use accounting methods that minimize taxable EPS. Rather, companies pay dividend distributions from a measure of cash flow, typically called “funds from operations” (FFO) or “distribut-able cash flow” (DCF). Other cor-porations pay from “free cash flow” (FCF), or cash flow less any capital expenditures needed to keep the busi-ness going.
Happily, as with the Income Port-folio holdings that reported before them, the following companies stacked up well in their fourth quarter and full-year 2012 earnings reports.
Alliance Resource Partners LP (NSDQ: ARLP) management doesn’t expect “challenging” coal market con-ditions to improve until the second half of 2013. A 12th consecutive year of record volumes, revenue and cash flow, however, demonstrates the coal mining MLP is thriving anyway.
Fourth-quarter revenue increased 15.8 percent, acceleration over the full-year rate of 10.3 percent. Cash flow rose 28.9 percent, versus a 1.8 percent full-year boost.
Most importantly, distributable cash flow—Alliance’s most crucial measure of profit—was up 24.3 percent, cover-ing the distribution by a 2.62-to-1 margin, and enabling the MLP to raise its payout for the 19th con-secutive quarter, representing an 11.9
percent year-over-year increase.Alliance’s unit price is up solidly
from our November 28, 2012 rec-ommendation, but it’s yielding more than 7 percent. Alliance Resource Partners LP is still a buy up to 62.
Canadian Apartment Proper-ties REIT’s (TSX: CAR-U, OTC: CDPYF) primary measure of profit is “normalized FFO.” Fourth quarter NFFO rose 14.1 percent, producing a payout ratio of 81.3 percent. That was down from 91.7 percent last year, and brought the full-year payout ratio to just 76.4 percent.
The company added a record num-ber of new high-quality residences to its portfolio, posted a superior occu-pancy rate of 98.2 percent and raised rents a steady 2.8 percent.
Growth with conservative financial and operating principles has allowed the REIT to boost distributions twice over the past 12 months, with a third increase apparently in the offing later this year. Canadian Apartment REIT is a buy on dips to USD24 or lower.
CLP Holdings (HK: 2, OTC: CLPHY) raised its dividend 2 percent last month, after reporting a lower 2012 profit that was nonetheless in line with expectations and guidance.
The core Hong Kong regulated utility continued to prosper from system investment. But the company’s India operations suffered from a dis-ruption in coal supplies, while Aus-tralian profit was hit by mild weather, slower growth and retail competition.
The good news is these should
prove to be one-off events and the company’s overall health remains steady. The dividend boost is another reason for confidence. Buy CLP’s American Depositary Receipts (ADRs)—worth one ordinary Hong Kong share—up to USD9.
Total SA (FP: FP, NYSE: TOT) has global projects in place to spur output as much as 3 percent in 2013, and plans an additional $9 billion in asset sales to fund a range of projects in Europe, Africa, Asia and the Americas.
Fourth quarter adjusted net income per share—which factors out non-cash items at the bottom line—rose 8 per-cent to USD1.76, and 13 percent in euro terms. The Refining and Chemi-cals business was the star, posting a 67 percent boost in full-year profit, while upstream (production) rose 6 percent largely on robust pricing.
The payout ratio for the quarter was a modest 45.8 percent of adjusted profit per share. Total SA’s ADRs—which are equal to one ordinary share traded in Paris—are a buy up to our target of USD55.
W.P. Carey’s (NYSE: WPC) fourth-quarter adjusted funds from operations (AFFO) of $1.13 per unit covered the distribution comfortably, with a 58.4 percent payout ratio, ensuring a 48th consecutive quarterly boost later this spring.
AFFO was 28.4 percent higher than year ago levels, a near tripling of revenue as the company combined certain operations to form the REIT. The average lease term of the portfo-lio of 8.9 years and occupancy rate of 98.7 percent are both superior among US REITs.
The company’s managed but not owned portfolio has similarly powerful metrics, including an occupancy rate of 98.2 percent.
The only concern with W.P. Carey now is the unit price, which is above my target of 55. That rise has handed us a substantial profit from entry last November. But with a yield of barely 4 percent, new investors should be pa-tient. W.P. Carey is a buy up to 55.
The Numbers Add UpOur Income picks continue to bestow solid operating results.BY ROGER S. CONRAD
INCOME REPORT
400
Source: Bloomberg
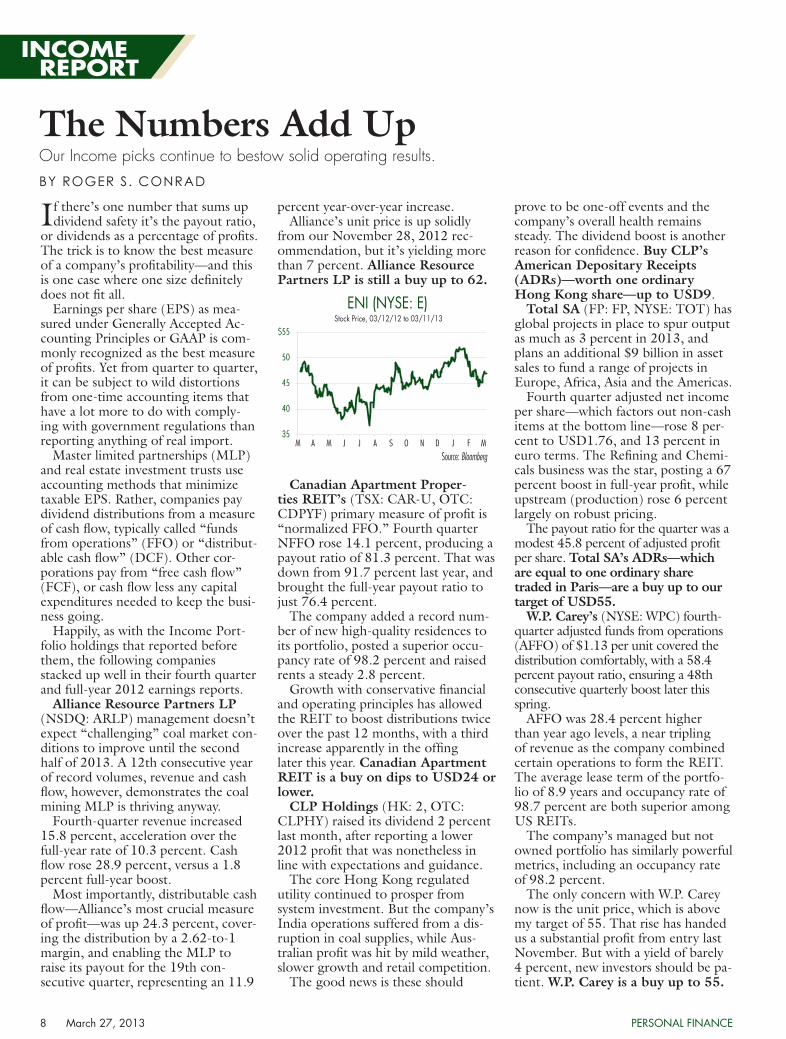
ENI (NYSE: E) Stock Price, 03/12/12 to 03/11/13
35
40
45
50
$55
M A M J J A S O N D J F M
pf_774.indd 8 3/18/2013 2:20:12 PM
www.PFnewsle t ter.com 703-394-4931
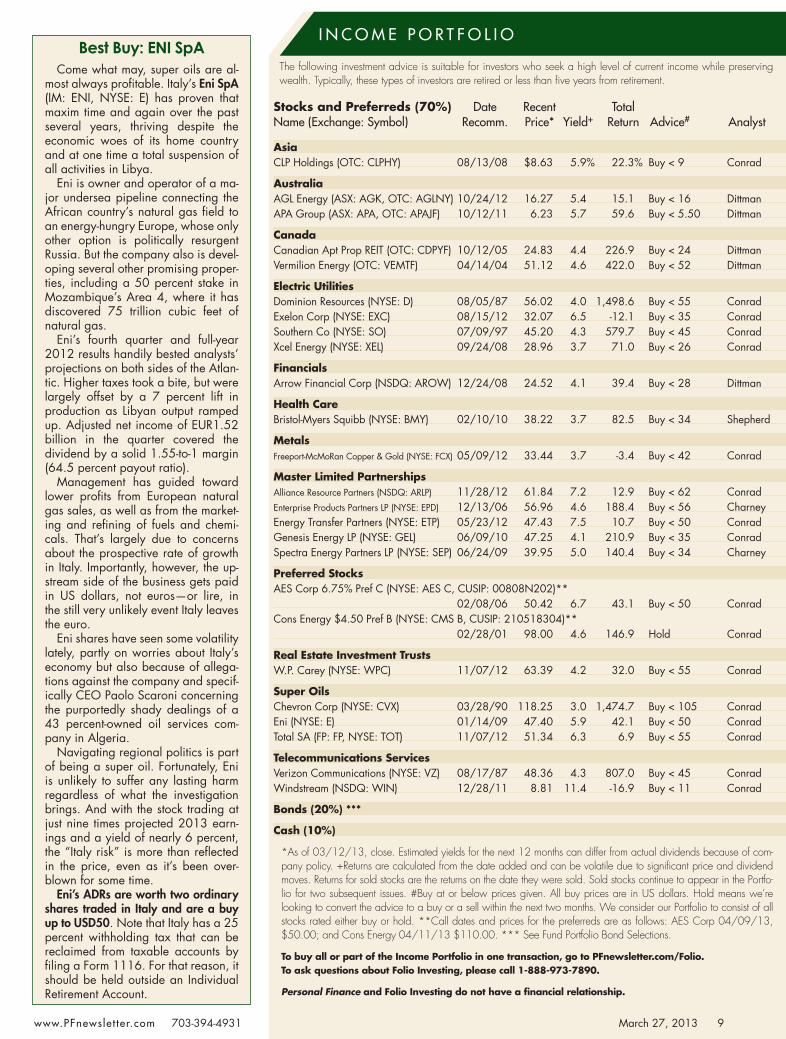
The following investment advice is suitable for investors who seek a high level of current income while preserving wealth. Typically, these types of investors are retired or less than five years from retirement.
Stocks and Preferreds (70%) Date Recent Total Name (Exchange: Symbol) Recomm. Price* Yield+ Return Advice# Analyst
Asia CLP Holdings (OTC: CLPHY) 08/13/08 $8.63 5.9% 22.3% Buy < 9 Conrad
Australia AGL Energy (ASX: AGK, OTC: AGLNY) 10/24/12 16.27 5.4 15.1 Buy < 16 DittmanAPA Group (ASX: APA, OTC: APAJF) 10/12/11 6.23 5.7 59.6 Buy < 5.50 Dittman
Canada Canadian Apt Prop REIT (OTC: CDPYF) 10/12/05 24.83 4.4 226.9 Buy < 24 DittmanVermilion Energy (OTC: VEMTF) 04/14/04 51.12 4.6 422.0 Buy < 52 Dittman
Electric Utilities Dominion Resources (NYSE: D) 08/05/87 56.02 4.0 1,498.6 Buy < 55 ConradExelon Corp (NYSE: EXC) 08/15/12 32.07 6.5 -12.1 Buy < 35 ConradSouthern Co (NYSE: SO) 07/09/97 45.20 4.3 579.7 Buy < 45 ConradXcel Energy (NYSE: XEL) 09/24/08 28.96 3.7 71.0 Buy < 26 Conrad
Financials Arrow Financial Corp (NSDQ: AROW) 12/24/08 24.52 4.1 39.4 Buy < 28 Dittman
Health Care Bristol-Myers Squibb (NYSE: BMY) 02/10/10 38.22 3.7 82.5 Buy < 34 Shepherd
Metals Freeport-McMoRan Copper & Gold (NYSE: FCX) 05/09/12 33.44 3.7 -3.4 Buy < 42 Conrad
Master Limited Partnerships Alliance Resource Partners (NSDQ: ARLP) 11/28/12 61.84 7.2 12.9 Buy < 62 ConradEnterprise Products Partners LP (NYSE: EPD) 12/13/06 56.96 4.6 188.4 Buy < 56 CharneyEnergy Transfer Partners (NYSE: ETP) 05/23/12 47.43 7.5 10.7 Buy < 50 ConradGenesis Energy LP (NYSE: GEL) 06/09/10 47.25 4.1 210.9 Buy < 35 ConradSpectra Energy Partners LP (NYSE: SEP) 06/24/09 39.95 5.0 140.4 Buy < 34 Charney
Preferred Stocks AES Corp 6.75% Pref C (NYSE: AES C, CUSIP: 00808N202)** 02/08/06 50.42 6.7 43.1 Buy < 50 ConradCons Energy $4.50 Pref B (NYSE: CMS B, CUSIP: 210518304)** 02/28/01 98.00 4.6 146.9 Hold Conrad
Real Estate Investment Trusts W.P. Carey (NYSE: WPC) 11/07/12 63.39 4.2 32.0 Buy < 55 Conrad
Super Oils Chevron Corp (NYSE: CVX) 03/28/90 118.25 3.0 1,474.7 Buy < 105 ConradEni (NYSE: E) 01/14/09 47.40 5.9 42.1 Buy < 50 ConradTotal SA (FP: FP, NYSE: TOT) 11/07/12 51.34 6.3 6.9 Buy < 55 Conrad
Telecommunications Services Verizon Communications (NYSE: VZ) 08/17/87 48.36 4.3 807.0 Buy < 45 ConradWindstream (NSDQ: WIN) 12/28/11 8.81 11.4 -16.9 Buy < 11 Conrad
Bonds (20%) ***
Cash (10%)
*As of 03/12/13, close. Estimated yields for the next 12 months can differ from actual dividends because of com-pany policy. +Returns are calculated from the date added and can be volatile due to significant price and dividend moves. Returns for sold stocks are the returns on the date they were sold. Sold stocks continue to appear in the Portfo-lio for two subsequent issues. #Buy at or below prices given. All buy prices are in US dollars. Hold means we’re looking to convert the advice to a buy or a sell within the next two months. We consider our Portfolio to consist of all stocks rated either buy or hold. **Call dates and prices for the preferreds are as follows: AES Corp 04/09/13, $50.00; and Cons Energy 04/11/13 $110.00. *** See Fund Portfolio Bond Selections.
To buy all or part of the Income Portfolio in one transaction, go to PFnewsletter.com/Folio. To ask questions about Folio Investing, please call 1-888-973-7890.
Personal Finance and Folio Investing do not have a financial relationship.
Best Buy: ENI SpACome what may, super oils are al-
most always profitable. Italy’s Eni SpA (IM: ENI, NYSE: E) has proven that maxim time and again over the past several years, thriving despite the economic woes of its home country and at one time a total suspension of all activities in Libya.
Eni is owner and operator of a ma-jor undersea pipeline connecting the African country’s natural gas field to an energy-hungry Europe, whose only other option is politically resurgent Russia. But the company also is devel-oping several other promising proper-ties, including a 50 percent stake in Mozambique’s Area 4, where it has discovered 75 trillion cubic feet of natural gas.
Eni’s fourth quarter and full-year 2012 results handily bested analysts’ projections on both sides of the Atlan-tic. Higher taxes took a bite, but were largely offset by a 7 percent lift in production as Libyan output ramped up. Adjusted net income of EUR1.52 billion in the quarter covered the dividend by a solid 1.55-to-1 margin (64.5 percent payout ratio).
Management has guided toward lower profits from European natural gas sales, as well as from the market-ing and refining of fuels and chemi-cals. That’s largely due to concerns about the prospective rate of growth in Italy. Importantly, however, the up-stream side of the business gets paid in US dollars, not euros—or lire, in the still very unlikely event Italy leaves the euro.
Eni shares have seen some volatility lately, partly on worries about Italy’s economy but also because of allega-tions against the company and specif-ically CEO Paolo Scaroni concerning the purportedly shady dealings of a 43 percent-owned oil services com-pany in Algeria.
Navigating regional politics is part of being a super oil. Fortunately, Eni is unlikely to suffer any lasting harm regardless of what the investigation brings. And with the stock trading at just nine times projected 2013 earn-ings and a yield of nearly 6 percent, the “Italy risk” is more than reflected in the price, even as it’s been over-blown for some time.
Eni’s ADRs are worth two ordinary shares traded in Italy and are a buy up to USD50. Note that Italy has a 25 percent withholding tax that can be reclaimed from taxable accounts by filing a Form 1116. For that reason, it should be held outside an Individual Retirement Account.
I N C O M E P O R T F O L I O
March 27, 2013 9
Best Buy2 WC: 376pf_774.indd 9 3/18/2013 2:20:13 PM
PERSONAL FINANCE10 March 27, 2013
With the Dow Jones Industrial Aver-age breezing past new highs and
the S&P 500 not far off, all eyes have been on growth stocks and higher beta plays.
However, even as they’ve struggled against a generally weak consumer spending environment both here and abroad, consumer staple stocks as mea-sured by Fund Portfolio recommenda-tion Consumer Staples Select Sector SPDR (NYSE: XLP) have quietly out-performed both the benchmark indexes so far this year.
With elevated gasoline prices, a payroll tax hike and high unemployment levels, most consumer staple companies have forecasted flat to slightly higher spending levels over the next several quarters.
Many consumer companies are rely-ing on innovation to adapt to that en-vironment, as reflected by the tobacco industry’s new focus on products such as nicotine replacement therapies and electronic cigarettes.
Beverage giant PepsiCo (NYSE: PEP)
introduced products such as low-calorie sodas and soda/fruit juice combinations to create a new line of breakfast bever-ages. Consumer firms are also taking cost reduction measures to improve margins, by streamlining manufacturing lines and supply chains and trimming headcounts.
The consumer sector is undergoing a spate of mergers and acquisitions, most recently with the purchase of H.J. Heinz (NYSE: HNZ) by Berkshire Hathaway (NYSE: BRK-A) and a Brazilian private equity firm.
Starbucks Corp (NSDQ: SBUX) has also been a player in the M&A market, gobbling up La Boulange Bakery to di-versify further into the food industry and Teavana to expand its beverage offerings.
Many are also proving adept at em-bracing the lower spending environment, developing smaller package sizes which can be sold at lower price points through discount retail chains. These moves take advantage of current opportunities, but they also build brand recognition and loyalty with what will hopefully be
better-off consumers down the road.What’s more, several consumer staples
firms are relying on old-fashioned dividend increases to create value. Share buybacks are becoming increasingly common with several companies held by Consumer Staples Select Sector SPDR.
For that overlap to occur, a company must have repurchased at least 5 percent of its outstanding shares over the trailing 12 months, which means they’ve been buying back with gusto.
While cost savings, financial transac-tions and product innovations will be a key to continued success, organic growth is also a must.
To that end, most consumer staples companies are also focusing beyond the saturated developed world to build their brand presence in emerg-ing market countries where consumer spending is on the rise, with Starbucks recently opening its first stores in India and Vietnam.
Consumer Staples Select Sector SPDR remains a buy.
Riding the HeadwindsHere’s how fund investors should play the Dow’s new heights.
BY BENJAMIN SHEPHERD
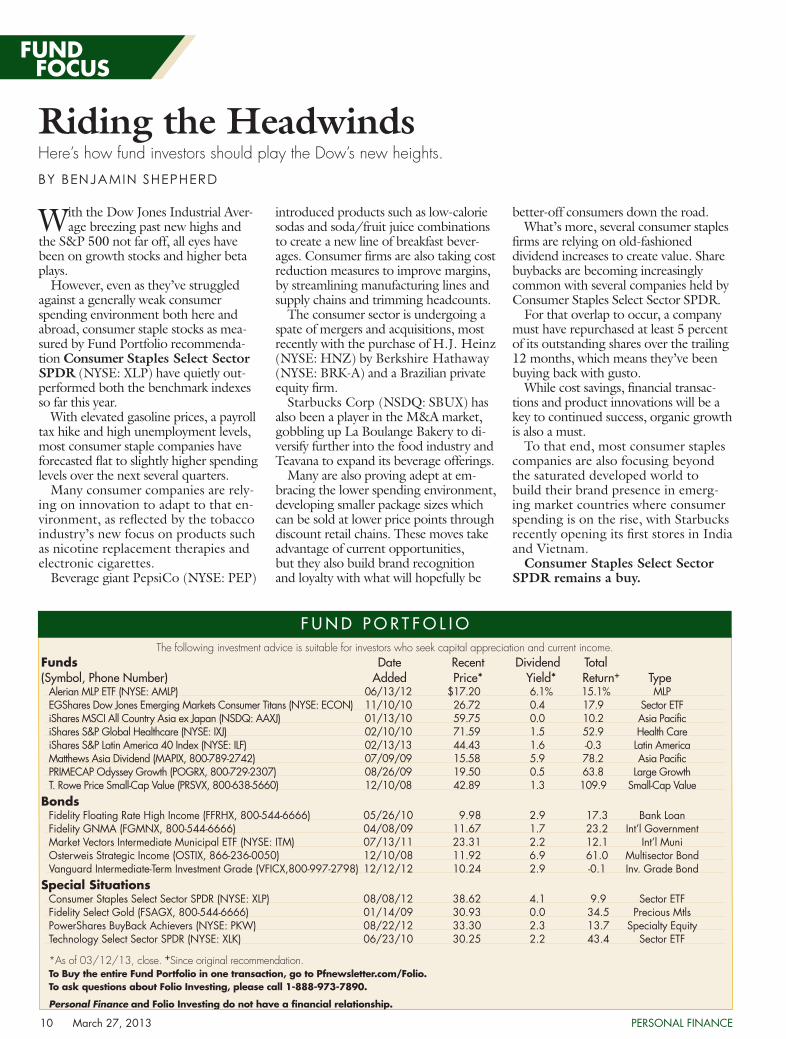
The following investment advice is suitable for investors who seek capital appreciation and current income.Funds Date Recent Dividend Total(Symbol, Phone Number) Added Price* Yield* Return+ Type
Alerian MLP ETF (NYSE: AMLP) 06/13/12 $17.20 6.1% 15.1% MLPEGShares Dow Jones Emerging Markets Consumer Titans (NYSE: ECON) 11/10/10 26.72 0.4 17.9 Sector ETFiShares MSCI All Country Asia ex Japan (NSDQ: AAXJ) 01/13/10 59.75 0.0 10.2 Asia PacificiShares S&P Global Healthcare (NYSE: IXJ) 02/10/10 71.59 1.5 52.9 Health CareiShares S&P Latin America 40 Index (NYSE: ILF) 02/13/13 44.43 1.6 -0.3 Latin AmericaMatthews Asia Dividend (MAPIX, 800-789-2742) 07/09/09 15.58 5.9 78.2 Asia PacificPRIMECAP Odyssey Growth (POGRX, 800-729-2307) 08/26/09 19.50 0.5 63.8 Large GrowthT. Rowe Price Small-Cap Value (PRSVX, 800-638-5660) 12/10/08 42.89 1.3 109.9 Small-Cap Value
BondsFidelity Floating Rate High Income (FFRHX, 800-544-6666) 05/26/10 9.98 2.9 17.3 Bank LoanFidelity GNMA (FGMNX, 800-544-6666) 04/08/09 11.67 1.7 23.2 Int’l GovernmentMarket Vectors Intermediate Municipal ETF (NYSE: ITM) 07/13/11 23.31 2.2 12.1 Int’l MuniOsterweis Strategic Income (OSTIX, 866-236-0050) 12/10/08 11.92 6.9 61.0 Multisector BondVanguard Intermediate-Term Investment Grade (VFICX,800-997-2798) 12/12/12 10.24 2.9 -0.1 Inv. Grade Bond
Special SituationsConsumer Staples Select Sector SPDR (NYSE: XLP) 08/08/12 38.62 4.1 9.9 Sector ETFFidelity Select Gold (FSAGX, 800-544-6666) 01/14/09 30.93 0.0 34.5 Precious MtlsPowerShares BuyBack Achievers (NYSE: PKW) 08/22/12 33.30 2.3 13.7 Specialty EquityTechnology Select Sector SPDR (NYSE: XLK) 06/23/10 30.25 2.2 43.4 Sector ETF
*As of 03/12/13, close. +Since original recommendation.To Buy the entire Fund Portfolio in one transaction, go to Pfnewsletter.com/Folio. To ask questions about Folio Investing, please call 1-888-973-7890.
Personal Finance and Folio Investing do not have a financial relationship.
F U N D P O R T F O L I O
FUND FOCUS
pf_774.indd 10 3/18/2013 2:20:13 PM
www.PFnewsle t ter.com 703-394-4931 March 27, 2013 11
Last year, former PF investment ana-lyst Yiannis Mostrous offered plays
on India’s economic slowdown. While these companies have not outper-formed, they have produced positive gains on average.
We still see potential in these picks, as India’s central bank implements new stimulative policies, which include lowering interest rates and opening some previously off-limits sectors to foreign direct investment (see second article, page 3).
Growth Portfolio holding HDFC Bank (Mumbai: HDFCB, NYSE: HDB) continues to realize strong earnings, posting another 30 percent gain to INR18.59 billion (USD340 million) in the third quarter of fiscal 2013. This brings the company’s streak of 30 percent profit growth to 53 consecutive quarters.
The bank’s retail sales rose 29 percent, driving much of its overall growth. Total sales rose 23.4 percent to INR55.9 billion (USD1 billion).
The company recently announced a partnership with Times Internet, the digital arm of The Times of India Group (India’s largest media com-pany) to launch a co-branded credit card, Times Card. The card promotes entertainment discounts popular with India’s younger demographic, which is a majority of the population.
To help fund additional projects, HDFC recently raised USD500 million by selling five-year bonds at 3 percent coupon, the lowest yield-to-maturity achieved for any domestic issuer. The fund-raising is part of its USD1 billion medium term note program. HDFC Bank is a buy up to 37.
Dr. Reddy’s Laboratories’ (Mum-bai: DRRD, NYSE: RDY) third-quarter profits more than tripled to INR3.47 billion (USD64 million) from INR1.08 billion (USD22 mil-lion) in the same quarter a year ago. Sales grew 28 percent to INR21.2 billion (USD392.6 million).
The diversified drug company’s strong sales in North America (up 38 percent) propelled most of this growth while European sales dragged the top line, falling by 20 percent.
In February, Dr. Reddy’s acquired Netherlands-based specialty pharma-ceutical company OctoPlus for about EUR27.4 million, to ramp up its tech-nological capabilities in drug delivery.
In early March, Dr. Reddy’s added to its portfolio Zoledronic Acid Injec-tion, a bio-equivalent generic version of Growth pick Novartis’ (NYSE: NVS) Zometa.
Zometa, a drug used to strengthen bones in cancer patients, recorded sales of USD1.2 billion in 2012. Dr. Reddy’s Laboratories’ American Depositary Receipt is a buy up to 37.
Infosys’ (Mumbai: INFO, NSDQ: INFY) third-quarter sales rose 6.3 percent to USD1.91 billion. Much of the growth was attributed to the acquisition of Swiss-based Lode-stone Management Consultancy for USD350 million in October 2012.
Infosys expects the deal to strength-en its EMEA and SAP presence and will eventually add more than USD1 billion to Infosys’ annual sales.
The company maintained its organic fiscal 2013 revenue growth guidance of 5 percent during the quarter, but
expects full-year revenues to grow 6.5 percent—including a USD104 million boost from Lodestone. Infosys is a buy up to 60.
On the ReboundTata Motors’ (Mumbai: TTMT,
NYSE: TTM) sales continue to struggle, as India’s automotive sector faces head-winds from higher interest rates. Total sales of Tata vehicles in February rose to 61,998 units, an increase of only 0.5 percent from the previous month.
Sedan sales took the sharpest hit, with the number of units sold during the month falling to 10,613—a decline of 70 pecent, the biggest drop in six years. For the first nine months of fiscal 2013, sales of Tata’s inexpensive Nano have fallen 7.3 percent to 50,836 units.
To combat declining sales, Tata is cutting production, increasing the price of some popular models to main-tain margins and slashing prices on other models.
The company will increase the price of its utility vehicles—which saw the strongest sales at the beginning of the year— by roughly INR35,000. The extra USD644 cost will include a higher excise duty tax, which the government recently raised.
Relief may come soon for this beleaguered automaker. The Reserve Bank of India is expected to cut inter-est rates to spur economic growth, in response to the country’s recent report of the weakest growth in a decade. Tata Motors remains a buy up to 30.
Khoa Nguyen is an investment analyst at Personal Finance.
Great ExpectationsArticle in Review: “India: How to Play the Pullback,” by Yiannis G. Mostrous, March 9, 2012.
BY KHOA NGUYEN
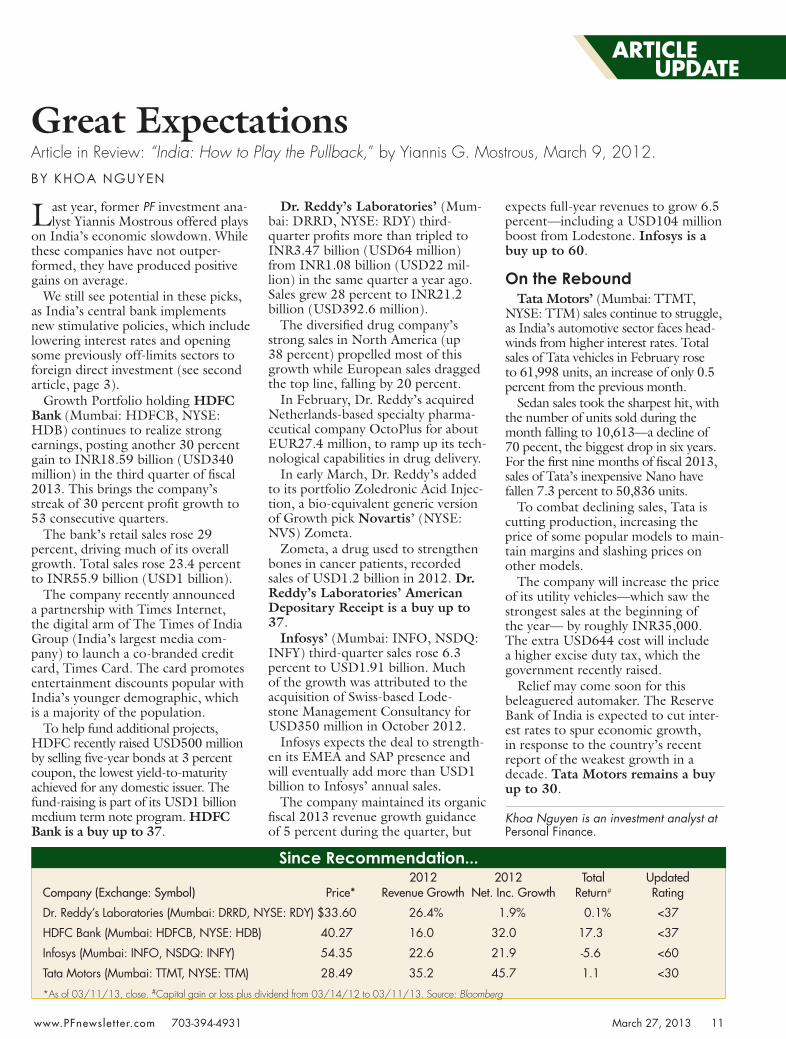
Since Recommendation... 2012 2012 Total UpdatedCompany (Exchange: Symbol) Price* Revenue Growth Net. Inc. Growth Return# Rating
Dr. Reddy’s Laboratories (Mumbai: DRRD, NYSE: RDY) $33.60 26.4% 1.9% 0.1% <37
HDFC Bank (Mumbai: HDFCB, NYSE: HDB) 40.27 16.0 32.0 17.3 <37
Infosys (Mumbai: INFO, NSDQ: INFY) 54.35 22.6 21.9 -5.6 <60
Tata Motors (Mumbai: TTMT, NYSE: TTM) 28.49 35.2 45.7 1.1 <30
*As of 03/11/13, close. #Capital gain or loss plus dividend from 03/14/12 to 03/11/13. Source: Bloomberg
ARTICLE UPDATE
ArticleUWC: 646WC w/Auth:6551 chart
pf_774.indd 11 3/18/2013 2:20:14 PM
Investors are in an ebullient mood, recently pushing the Dow Jones In-
dustrial Average to new nominal highs. A raft of positive economic indictors is lifting spirits, to the point where some contrarians are warning of frothy valua-tions.
But underlying Wall Street’s cheer is a case of the jitters, courtesy of Washing-ton’s perpetual budgetary squabbling. Political gridlock has spawned “seques-tration,” the automatic triggering of $85 billion in across-the-board federal spending reductions that will impede the US economic recovery.
As with the previous “fiscal cliff” crisis, sequestration’s deadline for compromise came and went—and the world didn’t immediately end. Now investors are waiting to exhale.
What should we make of good economic news that’s alloyed with alarmist headlines about austerity?
Stock investors are wise to remain cautiously optimistic, by choosing “defensive growth” stocks, such as those found in our Growth Portfolio’s health care, consumer discretionary, consumer staples, and information technology sleeves (see “Growth Track,” page 6).
These growth-oriented picks should prove adept at not only surviving austerity, but also thriving in spite of it. Likewise, our first article highlights picks that make the most sense in today’s market.
The budget cuts that officially took effect March 1 are real and they’re painful, but encouraging economic data at least partially offsets them. What remains uncertain is how badly
sequestration will dampen growth—and by extension, the markets.
The US Labor Department report-ed that the economy added 236,000 jobs in February, pushing the unem-ployment rate to 7.7 percent, down from 7.9 percent in January and the lowest level since December 2008.
This robust labor report beat Wall Street’s expectations of 165,000 additional jobs for the month. The pleasant surprise in job growth helped investors shrug off sequestration, but the fact is, if it weren’t for the budget cuts, the performance of the labor market and the economy would be even better this year.
Damage from austerity won’t be readily apparent until later this spring. In the meantime, the positive economic news is creating market momentum.
Most economists estimate that the economy will rack up a 1.5 percent growth rate in the first half of 2013, well below the historical growth rate of between 2 percent and 3 percent for post-recession recoveries since World War II.
If Washington’s wise solons hadn’t thrown in a monkey wrench, it’s estimated that growth this year would have reached 3 percent.
Federal spending cuts are on track to eliminate about 700,000 jobs this year, with the majority of the pink slips appearing in the second and third quarters. The economy is anticipated to continue adding enough jobs to prevent a rise in the jobless rate, but the economy probably would have added as many as 300,000 jobs a
month if it weren’t for sequestration, which will slash federal, state and local government payrolls and affect private ones as well.
And yet, home prices are rebound-ing; consumer sentiment and spend-ing are brightening; private sector job gains are strengthening in certain key sectors, notably manufacturing and construction; auto sales are picking up; and technology spending is on the rise.
What’s more, US corporations are enjoying low debt, soaring profits and huge cash reserves. Corporate profits are at a post-1945 high relative to US gross domestic product (GDP), largely from their operations in boom-ing overseas markets.
Indeed, the news from abroad is encouraging. China’s GDP growth rate this year is expected to hit about 8.5 percent, a reversal of last year’s flagging performance. Europe’s fractious political class has at least prevented the European Union from coming apart at the seams, while stimulative policies in Japan are fostering a nascent recovery there.
The Federal Reserve continues to do its part, by purchasing $85 billion of se-curities a month under quantitative eas-ing. The Fed has promised to stimulate the US economy until the unemploy-ment rate drops to 6.5 percent, the first time that the central bank has attached a specific numerical goal to its monetary policies.
In the coming months, we’ll witness a wrestling match in the US between private prosperity and public austerity, with the stock market benefiting (for now) from the paradox.
Fiscal Follies ExplainedHere’s a clear-eyed explanation of what federal budget “sequestration” will mean for investors.
BY JOHN PERSINOS
ON THE MONEY
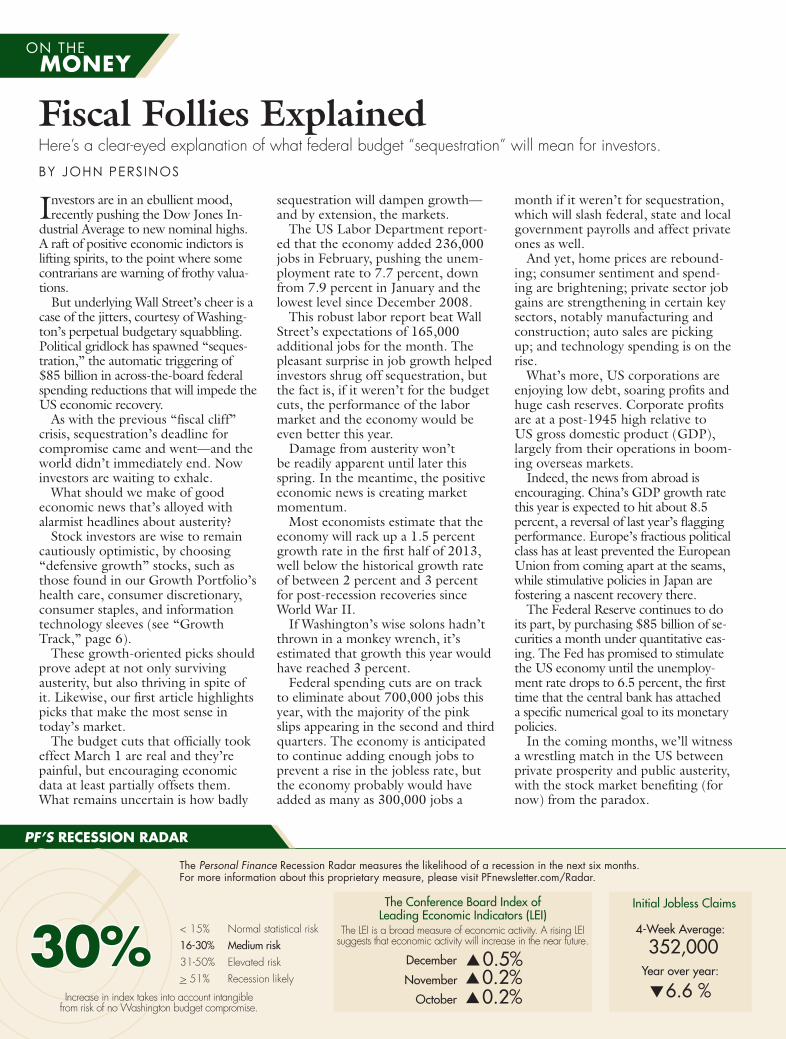
The Personal Finance Recession Radar measures the likelihood of a recession in the next six months. For more information about this proprietary measure, please visit PFnewsletter.com/Radar.
< 15% Normal statistical risk16-30% Medium risk31-50% Elevated risk> 51% Recession likely
30%
PF’S RECESSION RADAR
352,000
Initial Jobless Claims
6.6 %Year over year:
4-Week Average:
▲▲0.2%▲0.2%
November
October
▼0.5%December
The Conference Board Index of Leading Economic Indicators (LEI)
The LEI is a broad measure of economic activity. A rising LEI suggests that economic activity will increase in the near future.
Increase in index takes into account intangible from risk of no Washington budget compromise.
pf_774.indd 12 3/18/2013 2:20:15 PM