Embed Size (px)
Citation preview

8/7/2019 Personality and Environment {ONLINE VERSION}
http://slidepdf.com/reader/full/personality-and-environment-online-version 1/23
1Running Head: PERSONALITY AND ENVIRONMENT
DOES PERSONALITY INFLUENCE
PREFERENCES FOR ENVIRONMENT AND SURROUNDINGS?
{ Name Hidden }
AP Psychology
8/7/2019 Personality and Environment {ONLINE VERSION}
http://slidepdf.com/reader/full/personality-and-environment-online-version 2/23
2PERSONALITY AND ENVIRONMENT
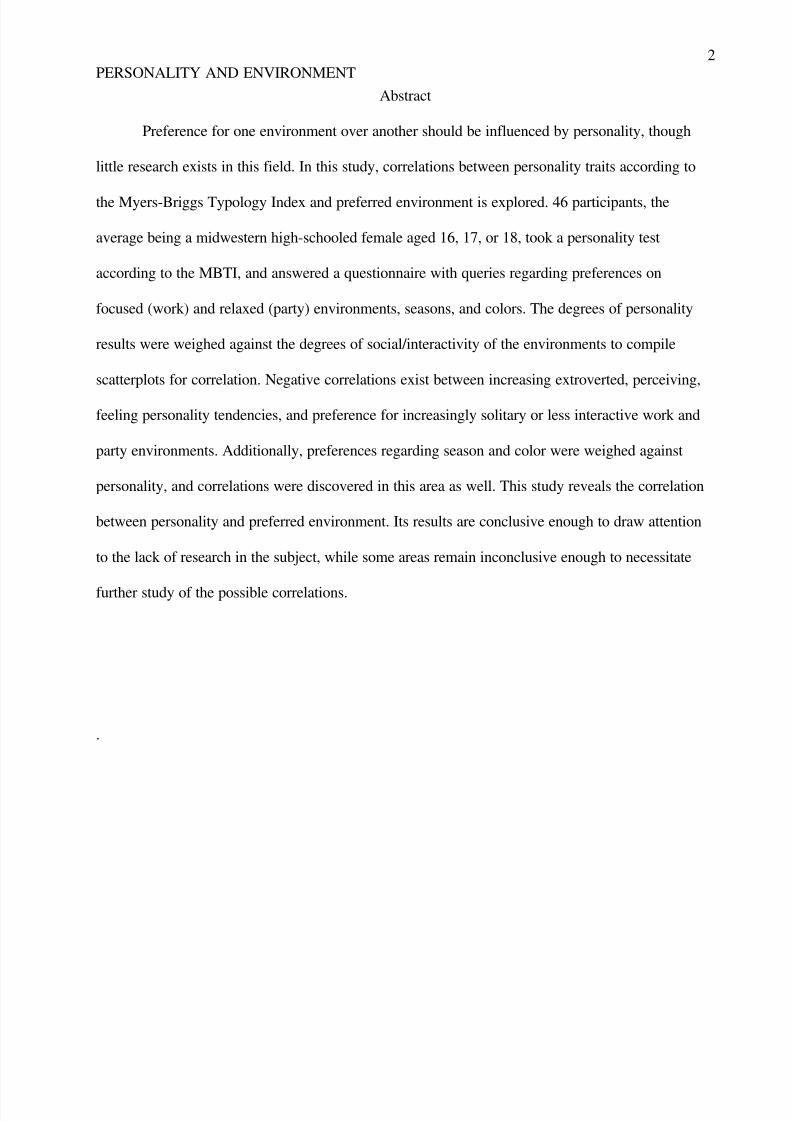
Abstract
Preference for one environment over another should be influenced by personality, though
little research exists in this field. In this study, correlations between personality traits according to
the Myers-Briggs Typology Index and preferred environment is explored. 46 participants, the
average being a midwestern high-schooled female aged 16, 17, or 18, took a personality test
according to the MBTI, and answered a questionnaire with queries regarding preferences on
focused (work) and relaxed (party) environments, seasons, and colors. The degrees of personality
results were weighed against the degrees of social/interactivity of the environments to compile
scatterplots for correlation. Negative correlations exist between increasing extroverted, perceiving,
feeling personality tendencies, and preference for increasingly solitary or less interactive work and
party environments. Additionally, preferences regarding season and color were weighed against
personality, and correlations were discovered in this area as well. This study reveals the correlation
between personality and preferred environment. Its results are conclusive enough to draw attention
to the lack of research in the subject, while some areas remain inconclusive enough to necessitate
further study of the possible correlations.
.

8/7/2019 Personality and Environment {ONLINE VERSION}
http://slidepdf.com/reader/full/personality-and-environment-online-version 3/23
3PERSONALITY AND ENVIRONMENT
Does Personality Influence Preferences for Environment and Surroundings?
Personality is by far one of the most-researched subjects in the field of psychology.
Personality-associated theories, studies, and disorders relate to most public "psychological" media
and discussion; from childhood we learn to categorize ourselves as introverted or extroverted,
overachievers, free thinkers, strong-willed, etc. Swiss psychologist Carl Gustav Jung, the founder of
analytical psychology, wrote his Psychological Types (1921) on his own theory, that all people can
be classified according to three criteria: Extroversion/Introversion defines a person's source and
direction of energy expression; Sensing/Intuition defines the method of information perception; and
Thinking/Feeling defines the way this information is processed.
In the 1940s and 50s, Katherine Cook Briggs and her daughter Isabel Briggs Myers built on
Jung's ideas to add a fourth criterion, Judging/Perceiving, which defines how a person implements
the processed information. (MBTI Basics, 2011). They designed a psychometric questionnaire to
measure a person's psychological preferences relating to these criteria--the Myers-Briggs Typology
Indicator, or MBTI. This typology test categorizes people as E or I, S or N, F or T, and P or J. The
possible resulting combinations offer sixteen personality types, e.g. ISTJ or ENTP.
Personality relates to how a person responds to stimuli, resulting in a branch of study known
as environmental psychology. According to V. George Matthew, Ph.D (2001), "Environment
influences behavior at different levels.... The personality make-up of people...is shaped by the
nature and type of environment in which they live." Traditionally, this field emphasizes how the
physical environment affects human thoughts, feelings, and behaviors. Environment and Behavior ,
a journal dedicated to the subject, houses articles on subjects such as links between courthouse
architecture and likelihood of conviction (Maass, 2000) and the success of various gambling
environments (Finlay, 2006). However, only a fraction of studies and research collections relate the
variances in the environment's effects to the variances in personality of those experiencing the
8/7/2019 Personality and Environment {ONLINE VERSION}
http://slidepdf.com/reader/full/personality-and-environment-online-version 4/23
4PERSONALITY AND ENVIRONMENT
environments. Even less information focuses on personality's influence on preference for an
environment, rather than the environment's effects on the personality. This study was designed to
explore this area of possibility.
For this study, it was predicted that correlations exist between personality and preference for
certain aspects of an environment or surroundings. Personality was measured by participants' results
according to the MBTI. Environment preferences were measured by participants' preferences
relating to office environment, background noise when studying or relaxing, size and intimacy of a
party, season of the year, and choice of color for decorating a personal space. Specific predictions
are difficult to make, considering the lack of research on the subject, especially in the areas of
season and color preference. However, it is supposed that the more extroverted of personalities (E,
S, F, and P results) will prefer more interaction and can handle more background noise. Likewise,
the more introverted of personalities (I, N, T, and J) will prefer more solitude and can handle less
background noise.
Method
Participants
Participants in this study volunteered after being presented with a summary of the
procedure. 49 people participated, and there was no specific population of interest. In order to
eliminate "bad" responses (those whose results were too off-base to be useful in correlations), any
participants who disagreed with or were unsure about the validity of their personality assessment,
and also rated the test's accuracy at 5 or lower out of 10, were disregarded in the study statistics.
This amounted to three questionnaires thrown out. Of the remaining 46 participants, 42 stated that
they agreed with the personality test's analysis, while only 4 were "somewhat" in agreement (Figure
5). 27 rated the test as an 8-10 on an accuracy scale of one to ten (ten being the most accurate); 15
rated it 6-7; 4 rated it 5 (Figure 6). The average participant agreed, rating the test an 8, 9, or 10.

8/7/2019 Personality and Environment {ONLINE VERSION}
http://slidepdf.com/reader/full/personality-and-environment-online-version 5/23
5PERSONALITY AND ENVIRONMENT
31 participants were female; 14 were male (Figure 1). Eight were ages 10-15; 26 were 16-
18; six were 19-29; five were 30-50 (Figure 2). Two lived in the northeastern US; 11 in the
southeast; 29 in the midwest; three in the west; one outside the US (Figure 3). Two had a middle
school education level; 29 high school level; 15 college or graduate school level. As such, the
average participant was a midwestern high-schooled female aged 16, 17, or 18.
Full demographic data can be found in Table 1, along with the complete results.
Materials/Measures
Materials used in this study consisted of one 4-page questionnaire, reproduced in Appendix
A, and an online typology test, reproduced in Appendix B. Page 1 of the questionnaire outlined the
details of the study, with a waiver for participants to sign. Page 2 asked for participants'
demographic information, as well as questions on current independence and satisfaction. All these
factors were intended for use as a control, since each can have an influence on preferred
environment, outside of personality's influences.
Page 3 directed participants to an online form of the MBTI (Jung Typology Test, 2011).
This test had 72 questions (reproduced in Appendix B) to which participants responded "yes" or
"no." The website then calculated a score based on these answers, explaining: "The scales of criteria
are dichotomic (bipolar) e.g. Extraversion-Introversion (E-I) criterion ranges from 100% on E to
100% on I" (2011). Thus, a score of 0% reflects a neutral personality, and various number scores
reflect how "bent" a person is toward that side of personality tendency. This page of the survey
provided spaces for participants to record their results (and percentage values), whether they agreed,
and how accurate they found the test.
Page 4 asked open-ended questions on preferred environment: optimum season, location,
and workplace; degree of comfort working in four scenarios of various interaction and distraction;

8/7/2019 Personality and Environment {ONLINE VERSION}
http://slidepdf.com/reader/full/personality-and-environment-online-version 6/23
6PERSONALITY AND ENVIRONMENT
preference for studying/relaxing with music or the television on; enjoyment of small or large
parties; and choice of color in a personal space.
Procedure
Requests were put out for volunteers, providing an overview of the study and its processes.
Those volunteering were then sent the questionnaire (reproduced in Appendix A). When a file was
returned by email, it was titled with a number according to order received, and saved on a
computer. When returned by hand, answers were transferred into blank electronic copies of the
questionnaire, and then saved according to the same method.
A spreadsheet was created with a column for each data field in the questionnaire and a row
for each numbered entry. When all answers had been received and transferred into this document, it
became apparent that the question regarding independence and satisfaction had been interpreted in a
wide range of ways, so those questions were thrown out. Additionally, all entries were thrown out
in which the participant both rated the MBTI as below a 5 in accuracy and disagreed with or were
unsure about its classification of their personalities. (These appear in italics in Appendix A).
In order to explore correlations, number values were assigned to some answers. For
questions using yes or no answers, "Yes" was assigned a value of 1, "No" was assigned a 3, and "in-
between" values were assigned a 2. For seasons, spring was assigned a 1, Summer 2, Autumn 3, and
Winter 4. Answers like "late spring/early summer" were assigned half-values between numbers,
such as 1.5. Those most comfortable at the front desk were assigned a value of 1; the center space,
2; the side office, 3; and the solitary back space, 4. Small parties were assigned a 3, large ones a 1,
and "either" or "it depends" a 2. Answers not easily quantifiable (i.e. location and work ideals and
color preferences) were left in their original phrasing. Additionally, personality percentages were
changed to reflect position on a number line, with introverted qualities at the -1 to -100 side and
extroverted qualities at the 1 to 100 side; a 56% Intuition equals a -56.

8/7/2019 Personality and Environment {ONLINE VERSION}
http://slidepdf.com/reader/full/personality-and-environment-online-version 7/23
7PERSONALITY AND ENVIRONMENT
Once data was collected and calibrated in this manner, various combinations of personality
traits and environment preferences were set against each other on the axes of a scatterplot, in order
to determine the existence of correlations between personality and environment. Necessary details
explaining particular methods are found with each figure under Tables and Figures.
Results
There were 46 participants in the final sample for this study. Their breakdown according to
personality type is found in Figure 7. ISFJ is the most popular personality type, with ESFJ, ENFJ,
INFJ, and INTJ coming after. The ratios can be found in Figure 8. The ratios of Extroverted to
Introverted and Sensing to Intuitive were both roughly 1 to 1. The ratio of Feelers to Thinkers was
nearly 2 to 1, however, and the ratio of Judgers to Perceivers was over 4 to 1.
Results regarding correlation between personality and preference for work environment are
found in Figure 9. Negative correlations exist on the Introversion/ Extroversion and
Judging/Perceiving graphs, though not on the Thinking/Feeling or Sensing/Intuitive graphs. To test
consistency over wider scenarios, the data regarding preference for background noise when
studying was added to the data for preference for work environment. The results are graphed in
Figure 10. Negative correlations again exist on the Introversion/Extroversion and
Judging/Perceiving graphs, though again not on the Thinking/Feeling or Sensing/Intuitive graphs.
Results regarding correlation between personality and preference for party environment are
found in Figure 11. Negative correlations exist on the Introvert/Extrovert graph, though not on the
Intuitive/Sensing, Thinking/Feeling, and Judging/Perceiving graphs. To test consistency, the data
regarding preference for background noise when relaxing was added to the data for preference for
party environment. The results are graphed in Figure 12. Negative correlations again exist on
Introvert/Extrovert graph, and again not on the Intuitive/Sensing and Judging/Perceiving graphs.
The Thinking/Feeling graph displayed an increase in negative correlation.

8/7/2019 Personality and Environment {ONLINE VERSION}
http://slidepdf.com/reader/full/personality-and-environment-online-version 8/23
8PERSONALITY AND ENVIRONMENT
Results regarding correlation between personality and preference for a particular season are
found in Figure 13. Only negative or very low positive y-values appear for x-value 1.5 on the E/I
graph; mostly positive y-values appear for x-value 1 and x-value 3 on the T/F graph; and mostly
negative y-values appear for x-value 1 and x-value 3 on the J/P graph.
Results regarding correlation between personality and color preference are found in Table 2.
Strong correlations exist between introversion and purple/lavender, "neutral" colors, and pastels;
between sensing and red, orange, pink, and "earthy" colors; between intuition and "neutral" colors;
between feeling and orange, yellow, purple/lavender, pink, pastels, and "earthy" colors; between
thinking and "neutral" colors; and between judging and all colors studied.
Discussion
Results reveal a negative correlation between increasing extroversion and preference for
increasingly "solitary" work environments. More extroverts prefer the "social" areas of the front
desk, meeting people constantly, and the center office space, working alongside people constantly;
the side space, solitary with occasional interruption, is preferred about evenly between extroverts
and introverts. More introverts prefer the "solitary" are of the back office space. When coupled with
preference for background noise while working, most preferring "extroverted" areas can also
perform work with more background noise; most preferring "introverted" areas cannot.
Additionally, a negative correlation exists between increasing perceiving personality and
preference for increasingly solitary work environments. Most "perceivers" prefer the social areas of
the front and side desk, while most "judgers" prefer the solitary areas of side and back spaces. Most
preferring "perceiving" areas can also perform work with more background noise; most preferring
"judging" areas cannot.

8/7/2019 Personality and Environment {ONLINE VERSION}
http://slidepdf.com/reader/full/personality-and-environment-online-version 9/23
9PERSONALITY AND ENVIRONMENT
Results also reveal a negative correlation between increasing extroversion and preference
for smaller, less "chaotic" parties. Larger parties were preferred only by extroverts, while smaller
parties were mostly preferred by introverts. When coupled with preference for background noise
while relaxing, those preferring larger parties (extroverts) also preferred not to relax with
background noise, while those preferring smaller parties (introverts) preferred the noise.
Additionally, when preference for background noise was factored in, personality became
increasingly introverted as smaller, quieter environments were more preferred.
Results revealed that introverts or very slightly expressed extroverts (i.e. 1% E) preferred
late spring and early summer. Spring and Fall were also preferred mostly by feelers and judgers.
Results revealed that introverts prefer shades of purple, neutral colors, and pastels, while
extroverts do not appear to focus on a single color. Sensing personalities prefer shades of red,
orange, and pink, as well as "earthy" colors, while intuitive personalities prefer more "neutral"
colors. Feelers prefer orange, yellow, shades of purple, pink, pastels, and "earthy" colors, while
thinkers prefer more "neutral" ones. Judgers prefer all colors, while Perceivers do not appear to
focus on one color.
The initial hypothesis was simply that correlations existed between personality and
preferred environment, with extroverted-type personalities (E, S, F, and P) preferring more social
ones, and introverted-type personalities preferring the more solitary; this has been demonstrated.
Extroversion versus introversion demonstrated the correlation most strongly in both focused (work)
and relaxed (party) environments. Judging versus perceiving demonstrated it in focused
environments, and thinking versus feeling demonstrated it in relaxed environments.
While the correlation was not evidenced by the other personality options in work/party
environments, the hypothesis was not disproven. The scatterplots in figures 9-12 simply showed
inconclusive results (i.e. no clear evidence of correlation).

8/7/2019 Personality and Environment {ONLINE VERSION}
http://slidepdf.com/reader/full/personality-and-environment-online-version 10/23
10PERSONALITY AND ENVIRONMENT
The initial hypothesis did not make any suppositions about color or season, because little
research offered basis for hypothesis. It did predict, however, that correlations existed, and this was
demonstrated.
Due to the skewed nature of variables, some results do not reflect a balanced sample; for
instance, the four-to-one ratio of judgers to perceivers resulted in judgers appearing to dominate
every category they were evaluated in. Additionally, three pages of questions do not exhaust all the
factors and possibilities for preferences regarding environment. Some confounding variables may
exist unaccounted for in the data, or some other measure of preference, if included, may add clarity
to the inconclusiveness of many of the correlations.
However, this study does conclude affirmatively its main point: personality does relate to
preferred environment; a person's personality type may affect his or her preferences for
surroundings. One article from Environment and Behavior discusses "Office Type in Relation to
Health, Well-Being, and Job Satisfaction Among Employees" (Bodin, 2008). But would the study
have been more accurate had it sorted employees according to extroverted and introverted
personalities? Could employers boost office morale simply by bending environment to complement
personality? Should people take into account wall color and seasonal attributes when choosing care
homes for loved ones? Environmental psychology has much to offer to the world, but perhaps its
focus needs to be broadened to answer these questions. Perhaps a new field should be created.
Either way, much more research is necessary to explore this correlation before we can fully begin to
understand and utilize it.

8/7/2019 Personality and Environment {ONLINE VERSION}
http://slidepdf.com/reader/full/personality-and-environment-online-version 11/23
11PERSONALITY AND ENVIRONMENT
References
Bodin Danielsson, C., & Bodin, L. (2008). Office Type in Relation to Health, Well-Being, and Job
Satisfaction Among Employees. Environment and Behavior, 40(5). Retrieved from
http://eab.sagepub.com/content/40/5/636.full.pdf+html.
Finlay, K., Kanetkar, V., Londerville, J., & Marmurek, H.H.C. (2006). The Physical and
Psychological Measurement of Gambling Environments. Environment and Behavior , 38(4).
Retrieved from http://eab.sagepub.com/content/38/4/570.full.pdf+html.
Jung, C. G. (1921). Psychological Types, Collected Works, Vol. 6, Princeton, NJ: Princeton
University Press.
Maass, A., Merici, I., Villafranca, E., Furlani, R., Gaburro, E., Getrevi, A., & Masserini, M. (2000).
Intimidating Buildings: Can Courthouse Architecture Affect Perceived Likelihood of
Conviction?. Environment and Behavior, 32(5). Retrieved from
http://eab.sagepub.com/content/32/5/674.full.pdf+html.
Matthew, V. G. (2001). Environmental Psychology. Psychology for All: Your Intimate Psychology
Portal. http://www.psychology4all.com/EnvironmentalPsychology.htm.
MBTI Basics. (2011). The Myers & Briggs Foundation. http://www.myersbriggs.org/my-mbti-
personality-type/mbti-basics.
Myers, I. (1990). Introduction to Type: A Description of the Theory and Applications of the Myers-
Briggs Type Indicator. Center for Applications of Psychological Type, Inc.
Jung Typology Test (2011). Human Metrics. http://www.humanmetrics.com/cgi-win/jungtype.htm

8/7/2019 Personality and Environment {ONLINE VERSION}
http://slidepdf.com/reader/full/personality-and-environment-online-version 12/23
12PERSONALITY AND ENVIRONMENT
Tables and Figures
FIGURE 1: FIGURE 2:
FIGURE 3: FIGURE 4:
FIGURE 5: FIGURE 6:

8/7/2019 Personality and Environment {ONLINE VERSION}
http://slidepdf.com/reader/full/personality-and-environment-online-version 13/23
13PERSONALITY AND ENVIRONMENT
FIGURE 7:
FIGURE 8:
In this figure, all four "categories" of
personality (E/I, S/N, F/T, and P/J) are
represented on one graph for ease of use, soeach quarter of the graph holds 100% of that
type of personality quality, and is divided
into percentage sections according to thevalues of one quality over another.
FIGURE 9:
Personality & Work Environment
Score for each personality trait is on y-axis, e.g. "50 I" = -50, "60 E" = 60. On x-axis, numbersdenote which office space/combination participants preferred, according to number values assigned.
FIGURE 10:

8/7/2019 Personality and Environment {ONLINE VERSION}
http://slidepdf.com/reader/full/personality-and-environment-online-version 14/23
14PERSONALITY AND ENVIRONMENT
Personality & Work Environment + Study EnvironmentScore for personality on y-axis. X-axis denotes combination of office space preferred, as in Fig.9,
and whether participants study with music or tv on, according to number values assigned.
FIGURE 11:
Personality & Party Environment
Score for personality on y-axis. X-axis denotes party environment participants preferred, accordingto number values assigned.
FIGURE 12:
Personality & Party Environment + Relaxation EnvironmentScore for personality on y-axis. X-axis denotes combination of party environment preferred, as in
Fig.11, and whether participants relax with music or tv on, according to number values assigned.
FIGURE 13:
Personality & Season

8/7/2019 Personality and Environment {ONLINE VERSION}
http://slidepdf.com/reader/full/personality-and-environment-online-version 15/23

8/7/2019 Personality and Environment {ONLINE VERSION}
http://slidepdf.com/reader/full/personality-and-environment-online-version 16/23
16PERSONALITY AND ENVIRONMENT
10
F 22 C OH M W ENFJ 33 25 25
-
78 1 8 Rural City Southern US Home 3 1 1 2 2
Yellow,
white,
lavender
11
M 16 H GA SE INTJ -67 12 -50 -1 1 8 Suburbs Suburbs
New
Hampshire
Quiet, light,
color, simple,
windows 4 3 1 3 1
Neutral
colors, light
wood, black
accents
12
F 18 H OH MW INFJ 33 39 50
-
11 1 7
Rural/
Suburbs Rural
Greece, Mid/
South
America
Differing, but
comfortable and
encouraging
2.
5 1 1 3 2
Light colors
pastel, whit
13
F 16 H NY NE INTJ -67 75 -50
-
78 1 10
Suburbs
/Urban/
Rural
Rural/
Suburbs
London,
Boston,
Vienna
Independent
but working
with like minds 4 1 1 3 3
Purple,
brown,
green, blue
cream
14
F 17 H OH MW INFJ -11 38 62
-
44 1 9 Suburbs Suburbs
Oregon-
beach and
mountains
Music, supplies,
not bright or
dark 1 1 1 2 3
Blue, green
black or dar
brown
accents
15
F 19 C OH MW ENTP 1 38 -38 11 1 10 Suburbs Suburbs
Central/West
ern Europe
Relaxed,
Comfortable,
not loud 2 1 1 3 2
Black, Whit
contrasting
colors
16
F 15 H OH MW ESFJ 89 -12 50 -1 1 6 City City
South
Carolina Big City 1 1 1 1 2
Hot pink,
Lime green,
Bright
Yellow,
Bright oran
17
F 17 H OH MW ISFJ -17 -50 44
-
67 2 6 Suburbs Suburbs
Country, not
too isolated
Friendly,
productive,
organized 3 1 1 3 2
Classic
pastel, bold
accents
18
M 16 H OH MW ENFJ 22 38 50 -1 1 8 Urban Urban
Columbus,
OH
Moderate light,
well-furnished,
organized, fast,
accepting 3 1 1 3 3
Brown, gray
silver, dark
blue
19
F 16 H PA NE ESFJ 1 -1 25
-
67 1 7 Rural Suburbs
Texas,
Colorado,
Virginia, or
England
Quiet, but
people 3 3 2 3 3
Red, white,
cream, blac
green
20
M 17 H PA NE ISTJ ## -1 -38
-
78 1 6 Suburbs Suburbs Midwest USA
Orderly, little
clutter 3 3 1 3 2
Blue, white
green
21
F 17 H KS MW INTJ -56 25 -12
-
44 2 7 Suburbs Suburbs England
Clean, quiet,
sometimes
music 4 3 1 3 1
Blue, dark
green
22
M 16 H NY NE ENFP 67 33 38 11 1 8 Rural Rural
New York
City
Friendly, fast-
paced, busy 1 1 1 1 2 Depends
23
F 25 C OH MW ISFJ -33 -12 88
-
50 1 9
Suburbs
/ Urban
Suburbs
/ Urban
Warm-
Northern
California Pretty 3 3 1 3 1
Deep, dusty
warm. Dark
purple, gray
blue, sage
green
24
M 18 H OH MW ISFP -17 -62 50 6 1 10 Suburbs Suburbs Florida Quiet, solitary 4 3 1 3 3 Blue
25
F 18 C OH MW ISFJ -11 -1 75 -1 1 8 Suburbs Suburbs
Central
Western
Australia
Small group of
friendly staff,
interaction with
the public 4 1 1 3 3
Lime green,
bright color
black accen
26
F 19 C OH M W ENFJ 67 12 88
-
44 1 8 Suburbs Suburbs South
Quiet, but
people around
to access 1 3 1 3 3
Blues and
greens
27
F 15 H OH MW INFJ -44 38 12
-
89 1 5 Rural Rural
Mild winters
but seasons.
Not the city.
Quiet, perhaps
music, no
clutter
3.
5 1 1 3 2
lavender,
forest green
light tan
28
M 18 H WA W ENFJ 11 25 25
-
22 1 9 Suburbs Suburbs
Tropical
Island
Discussing
issues in small
quiet room with
close group of
people 1 1 1 3 2
Dark blue,
earthy tone
29
F 47 C OH MW ESFJ 44 -38 50
-
17 1 8 Suburbs Suburbs NA Lots of activity
1.
5 3 1 2 3 Earthy colo
30
F 14 H OH MW ISFJ -67 -12 50
-
67 2 8 Suburbs Suburbs
Urban in
Thailand,
near refugee
camps for
visits
Physical
Therapy,
teaching
refugees 3 3 3 3 3
Sage green,
tan brown

8/7/2019 Personality and Environment {ONLINE VERSION}
http://slidepdf.com/reader/full/personality-and-environment-online-version 17/23
17PERSONALITY AND ENVIRONMENT
31
M 15 H PA NE INFJ -67 12 50
-
11 1 7 Suburbs Suburbs
Alone in
Alaska
Alone, with time
to think
2.
5 3 3 3 0
Colorful, su
dued/rustic
32
F 50 C OH MW INTJ -22 12 -1
-
44 1 9 Urban Suburbs Warm in US Organized 4 3 1 3 2
Neutral,
cream,
white, light
yellow
33
F 16 H OH MW ESFJ 22 -1 75
-
56 1 8 Suburbs Suburbs Ohio
Quiet, lots of
people 3 1 1 3 3
Pink, blue,
orange, bla
34*
F M OH MW ENTJ # # -11 # 2 5 City Suburbs Ohio Crazy 2, 1 1 3 2 Bright
35
F 27 C AL SE ISFJ -22 -1 50
-
22 1 8 Suburbs Suburbs
Pacific
Northwest-
Mountain
views
Relational,
organized 1 1 1 3 1,3
Earth tones
Browns,
blues, pops
of red and
orange
36
F 17 H NC SE INTJ -33 25 -1
-
56 1 8
Small
town
Small
town
old elegant
farmhouse in
country, roll-
ing pastures,
blue ridge
mountains
Warm, light,
clean,
organized, quiet
but background
noise 4 1 1 3 2
Light green
aqua blue,
brown, soft
coral
37
F 18 C WA W ISFJ -11 -12 25
-
44 2 6
Small
town/
Rural Urban
Small town,
with seasons,
near family Library 2 1 1 3 3 Red, yellow
38
F 17 H OH MW ISFJ -78 -12 38
-
33 1 7 Suburbs Suburbs
North
Carolina
Laid back,
people who arefun but get the
job done 3 3 1 3 3
Green, bluepurple,
bright
39
F 18 C OH MW ISFJ -56 -75 100 ## 1 9 Suburbs Suburbs Hawaii
Fast-paced,
changing,
stimulating 3 3 1 3 3
Earthy- ligh
browns, da
greens
40
F 17 H OH MW ESFJ 11 -38 12
-
33 1 5 Suburbs Suburbs
City- New
York,
Chicago, DC
Organized, fast-
paced, friendly 3 1 1 3 1,3 Blue, brown
41
F 46 C OH M W ENFJ 89 62 12
-
22 1 9 Suburbs Suburbs
Ohio near
family or
serving
overseas
Opportunity to
be around
people, buzzing 3 3 3 2 3
Warm
browns,
accents of
orange, red
yellow
42
F 20 C WA W ISFJ -56 -25 38
-
33 1 9
Small
town
Large
City
GA- warm,
friendly,
respectful,
relaxed
Working with
youth at church 1 3 1 3 2
Tan, pink,
brown, blac
43
F 15 H KS MW ISTJ -56 -1 -50
-
33 1 8 Suburbs Suburbs
DC- politics,
busy, exciting
Organized, high-
paced with
patient
coworkers 1 1 1 3 1
Red, brown
blue
44
M 17 H MD NE ESFP 67 -12 38 33 1 7 Suburbs Suburbs
TX/ New
Zealand-
interesting,
fun, pretty,
nice people, No preference 3 3 1 3 1
Green,
brown, blue
45
M 17 H OH M W ENFP 11 75 38 33 1 7 Urban Suburbs City
Relaxed, able to
help people 1 1 1 3 3 Neutral
46
F 14 M MO MW ISTP -22 -38 -26 22 1 5
Urban/
Rural Urban
Camp
Barnabas No preference 1 1 1 3 2 Blue, Orang
47
F 43 C OH MW ISTJ -33 -12 -12
-
22 1 7 Suburbs Suburbs
North
Carolina
Few distract-
ions,background
noise 3 1 1 3 0
Warm/neut
al, spots of
deeper
colors
48
F 46 C OH M W ENTJ 56 25 -1
-
67 1 10 Suburbs Urban
North
Carolina
beach (not
crowded)
Home, but out
to meet people 3 3 3 2 2
Bright, soft
spring and
summer
colors
49
F 14 M OH MW ESFP 89 -1 88 22 1 8 Urban Urban England
Fun, hectic with
different tasks
1.
5 1 1 1
1.5
3.5
Green, blac
white, blue

8/7/2019 Personality and Environment {ONLINE VERSION}
http://slidepdf.com/reader/full/personality-and-environment-online-version 18/23
18PERSONALITY AND ENVIRONMENT
TABLE 2:
Colors and PersonalityA graph would have proved too difficult to use for this data, given the number of color options and
the multiple colors chosen per participant. Instead, all were organized by color preferences. The
number of Es versus Is, Ss versus Ns, Fs versus Ts, and Ps versus Js were tallied in each group to
determine the "overall personality" of that color. If the color is exactly half-and-half, it is labeled50%; if it is three-quarters of one value, it is labeled 75% that value. Any percentage between 50%
and 70% is considered a weak correlation (signified by a W) and any percentage between 71% and
100% is considered a strong correlation (signified by an S).Brown is analyzed twice- once including all variances such as "earthy," "tan," or "wood," and once
without. Three common phrases used were "neutral," "earthy," and "pastels," so these are also
included and analyzed as color fields.
Color Total E I Correlation Total S N Correlation Total F T Correlation Total P J Correlation
RED 6 2 4
66.7%
Introverted - W 6 5 1
83.3% Sensing
- S 6 4 2
66.7%
Feeling - W 6 0 6
100% Judging -
S
ORANGE 5 3 260% Extroverted- W 5 4 1
80% Sensing -S 5 4 1
80% Feeling -S 5 1 4
80% Judging -S
YELLOW 5 3 2
60% Extroverted
- W 5 3 2
60% Intuitive -
W 5 4 1
80% Feeling -
S 5 5 0
100% Judging -
S
GREEN 19 7 12 63.2% Intro - W 19 9 10
52.6% Intuitive
- W 19 13 6
68.4%
Feeling - W 19 3 16
84.2% Judging
- S
BLUE 23 10 13 56.5% Intro - W 23 12 11
52.2% Sensing
- W 23 12 11
56.5%
Feeling - W 23 5 18
78.3% Judging
- S
PURPLE/
LAVENDER 5 1 4
80% Introverted
- S 5 2 3
60% Intuitive -
W 5 4 1
80% Feeling -
S 5 0 5
100% Judging -
S
PINK 4 2 2
50% Extroverted
- N 4 3 1
75% Sensing -
S 4 4 0
100% Feeling
- S 4 0 4
100% Judging -
S
BLACK 9 5 4
55.6%
Extroverted - W 9 5 4
55.6% Sensing
- W 9 6 3
66.7%
Feeling - W 9 2 7
77.8% Judging
- S
GRAY/
SILVER 1 1 0
100%
Extroverted - S 1 0 1
100% Intuitive
- S 1 1 0
100% Feeling
- S 1 0 1
100% Judging -
S
WHITE/
CREAM 7 4 3
57.1%
Extroverted - W 7 3 4
57.1% Intuitive
- W 7 4 3
57.1%
Feeling - W 7 2 5
71.4% Judging
- S
NEUTRAL 4 1 3
75% Introverted
- S 4 1 3
75% Intuitive -
S 4 3 1
75% Thinking
- S 4 1 3
75% Judging -
S
BROWN-
ALL 19 9 10
52.6%
Introverted - W 19 8 11
57.9% Intuitive
- W 19 12 7
63.2%
Feeling - W 19 1 18
94.7% Judging
- S
BROWN- no
Tan/ Wood/
Earthy 15 7 8 53.3% Intro - W 15 6 9
60% Intuitive -
W 15 9 6
60% Feeling -
W 15 14 1
93.3% Judging
- S
EARTHY 5 2 3
60% Introverted
- W 5 4 1
80% Sensing -
S 5 5 0
100% Feeling
- S 5 0 5
100% Judging -
S
PASTELS 2 0 2
100%
Introverted - S 2 1 1
50% Sensing -
N 2 2 0
100% Feeling
- S 2 0 2
100% Judging -
S

8/7/2019 Personality and Environment {ONLINE VERSION}
http://slidepdf.com/reader/full/personality-and-environment-online-version 19/23
19PERSONALITY AND ENVIRONMENT
Appendix AQuestionnaire
{ Name Hidden }
{ Email Address Hidden }
{ Email Address Hidden }

8/7/2019 Personality and Environment {ONLINE VERSION}
http://slidepdf.com/reader/full/personality-and-environment-online-version 20/23
20PERSONALITY AND ENVIRONMENT

8/7/2019 Personality and Environment {ONLINE VERSION}
http://slidepdf.com/reader/full/personality-and-environment-online-version 21/23
21PERSONALITY AND ENVIRONMENT

8/7/2019 Personality and Environment {ONLINE VERSION}
http://slidepdf.com/reader/full/personality-and-environment-online-version 22/23
22PERSONALITY AND ENVIRONMENT

8/7/2019 Personality and Environment {ONLINE VERSION}
http://slidepdf.com/reader/full/personality-and-environment-online-version 23/23
23PERSONALITY AND ENVIRONMENT
Appendix B(Jung Typology Test, 2011)
1. You are almost never late for your appointments2. You like to be engaged in an active and fast-paced job
3. You enjoy having a wide circle of acquaintances
4. You feel involved when watching TV soaps5. You are usually the first to react to a sudden event: the
telephone ringing or unexpected question
6. You are more interested in a general idea than in the
details of its realization
7. You tend to be unbiased even if this might endanger
your good relations with people
8. Strict observance of the established rules is likely to
prevent a good outcome9. It's difficult to get you excited
10. It is in your nature to assume responsibility
11. You often think about humankind and its destiny
12. You believe the best decision is one that can be easily
changed
13. Objective criticism is always useful in any activity14. You prefer to act immediately rather than speculate
about various options
15. You trust reason rather than feelings
16. You are inclined to rely more on improvisation than on
careful planning
17. You spend your leisure time actively socializing with a
group of people, attending parties, shopping, etc.
18. You usually plan your actions in advance
19. Your actions are frequently influenced by emotions
20. You are a person somewhat reserved and distant in
communication
21. You know how to put every minute of your time to good
purpose22. You readily help people while asking nothing in return
23. You often contemplate about the complexity of life
24. After prolonged socializing you feel you need to get
away and be alone
25. You often do jobs in a hurry
26. You easily see the general principle behind specific
occurrences
27. You frequently and easily express your feelings and
emotions28. You find it difficult to speak loudly
29. You get bored if you have to read theoretical books
30. You tend to sympathize with other people
31. You value justice higher than mercy
32. You rapidly get involved in social life at a newworkplace
33. The more people you speak with, the better you feel
34. You tend to rely on your experience rather than on
theoretical alternatives
35. You like to keep a check on how things are progressing
36. You easily empathize with the concerns of other people
37. Often you prefer to read a book than go to a party38. You enjoy being at the center of events in which other
people are directly involved
39. You are more inclined to experiment than to followfamiliar approaches
40. You avoid being bound by obligations
41. You are strongly touched by the stories about people's
troubles
42. Deadlines seem to you to be of relative, rather than
absolute, importance
43. You prefer to isolate yourself from outside noises
44. It's essential for you to try things with your own hands45. You think that almost everything can be analyzed
46. You do your best to complete a task on time
47. You take pleasure in putting things in order
48. You feel at ease in a crowd
49. You have good control over your desires and
temptations50. You easily understand new theoretical principles
51. The process of searching for solution is more important
to you than the solution itself
52. You usually place yourself nearer to the side than in the
center of the room
53. When solving a problem you would rather follow a
familiar approach than seek a new one
54. You try to stand firmly by your principles
55. A thirst for adventure is close to your heart
56. You prefer meeting in small groups to interaction with
lots of people
57. When considering a situation you pay more attention to
current situations, less to a possible sequence of events58. You consider the scientific approach to be the best
59. You find it difficult to talk about your feelings
60. You often spend time thinking of how things could be
improved
61. Your decisions are based more on the feelings of a
moment than on the careful planning
62. You prefer to spend your leisure time alone or relaxing
in a tranquil family atmosphere
63. You feel comfortable sticking to conventional ways64. You are easily affected by strong emotions
65. You are always looking for opportunities
66. Your desk, workbench etc. is usually neat and orderly
67. As a rule, current preoccupations worry you more than
your future plans68. You get pleasure from solitary walks
69. It is easy for you to communicate in social situations
70. You are consistent in your habits
71. You willingly involve yourself in matters which engage
your sympathies
72. You easily perceive various ways events could develop